seasonal influenza vaccine uptake in children of primary ... · resident in pilot areas were also...
TRANSCRIPT

Seasonal influenza vaccine uptake in children of primary school age Winter season 2018 to 2019 Final data for 1 September 2018 to 31 January 2019

Childhood Influenza vaccination programme – England 2018 to 2019 influenza season
2
About Public Health England
Public Health England exists to protect and improve the nation’s health and wellbeing,
and reduce health inequalities. We do this through world-leading science, research,
knowledge and intelligence, advocacy, partnerships and the delivery of specialist public
health services. We are an executive agency of the Department of Health and Social
Care, and a distinct delivery organisation with operational autonomy. We provide
government, local government, the NHS, Parliament, industry and the public with
evidence-based professional, scientific and delivery expertise and support.
Public Health England
Wellington House
133-155 Waterloo Road
London SE1 8UG
Tel: 020 7654 8000
www.gov.uk/phe
Twitter: @PHE_uk
Facebook: www.facebook.com/PublicHealthEngland
Prepared by: The Influenza Surveillance section, Immunisation and Countermeasures
Division, Public Health England
For queries relating to this document, please contact: [email protected]
© Crown copyright 2019
You may re-use this information (excluding logos) free of charge in any format or
medium, under the terms of the Open Government Licence v3.0. To view this licence,
visit OGL. Where we have identified any third party copyright information you will need
to obtain permission from the copyright holders concerned.
Published September 2019
PHE publications PHE supports the UN
gateway number: GW-760 Sustainable Development Goals

Childhood Influenza vaccination programme – England 2018 to 2019 influenza season
3
Contents
About Public Health England 2
Executive summary 4
Background 5
Methods 7
Uptake 7
Predictors of uptake 7
Consent, refusal, refused but previously vaccinated and non-responders 9
Data Limitations 11
Results 13
Uptake: school years reception to 5, 2018 to 2019, England 13
Uptake: school years reception to 6 in pilot areas in England 14
Analysis of inequalities in LAIV uptake, England 16
Predictors of uptake: school years reception to year 5, 2018 to 2019, England 23
Discussion 27
Acknowledgements 30
Annexes 32
Annex A. Year group cohorts 32
Annex B. End of season data collection variables 33
Annexe C: Table of Local Authorities not included in the study due to missing data or
having a GP delivery model 35
Annexe D: Number of schools that did not submit any data or had submitted data
where the numerator was greater than the denominator 35

Childhood Influenza vaccination programme – England 2018 to 2019 influenza season
4
Executive summary
This report describes key uptake statistics and ecological predictors for uptake of the
live attenuated influenza vaccine (LAIV), targeted at children of primary school age in
the 2018 to 2019 season in England.
School data providers returned school-level vaccine uptake data for a total of 148 Local
Authorities in England, covering all 14 Local NHS England Teams for vaccines
administered from 1 September 2018 to 31 January 2019.
Based on school-level data returned by 148 Local Authorities in England, the national
cumulative vaccine uptake from 1 September 2018 to 31 January 2019 was:
• 60.2% (2,345,950/3,893,908) in children in school year reception to year 5 across
England
• 62.7% (209,838/334,659) in children in school year reception to year 6 across pilot
areas in England
• all-age uptake increased for populations in the most deprived decile (from 44.4% in
the 2015 to 2016 season to 47% in the 2018 to 2019 season)
• populations having the highest black and ethnic minority composition also saw an
increase in uptake over the same period (from 60.4% to 66% respectively).
• populations with the highest Muslim faith composition also saw an increase in
uptake over the same period (from 42.4% in the 2015 to 2016 season to 46.9% in
the 2018 to 2019 season) – similarly for areas with the highest Jewish faith
populations (from 51.9% to 58.7% over the same period).
An analysis of population-level predictors of uptake in primary school children indicates:
• LAIV uptake remained significantly and independently associated with deprivation,
ethnicity and religious faith variables after risk adjustment.
• after adjusting for a range of risk factors, the largest effects were seen for
deprivation and ethnicity – uptake in areas in the most-deprived decile was
significantly lower than areas in the least deprived decile (18 percentage points
difference) and uptake in populations with the highest (>34%) BME composition was
also significantly lower (8.4 percentage points difference) than areas with the lowest
(<5%).BME composition
• areas with the highest percentage Muslim faith population (≥6%) had a significantly
lower uptake (5.5 percentage points difference) than areas with 0% Muslim
population, after risk-adjustment
• London PHE region had a significantly lower uptake (9 percentage points difference)
compared to the baseline North PHE region after risk adjustment
• Pilot areas had significantly higher uptake (2.6 percentage points difference) than
non-pilot areas, after risk adjustment.

Childhood Influenza vaccination programme – England 2018 to 2019 influenza season
5
Background
Seasonal influenza is a common viral infection mainly affecting the upper respiratory
tract. Although influenza can affect all age groups, children under 5 years and the
elderly (over 65 years) are disproportionately susceptible to complications from
influenza infection. Other groups that are also disproportionately vulnerable to
complications from influenza are individuals in defined clinical risk groups (which
includes asthma, heart disease and weakened immunity), those that are morbidly
obese (BMI ≥40) and pregnant women.
Influenza is easily spread in school settings due to children being in close proximity with
each other. Universal school vaccination provides not only direct protection by
preventing infection in school age children but provides indirect benefits by preventing
wider transmission in families and communities.
The United Kingdom, has had a long-standing vaccination programme targeting the
elderly (aged 65 years and over) and those in younger age groups in clinical risk
groups. Vaccination of young children was added to this programme in the 2013 to
2014 season, following recommendations form the Joint Committee on Vaccination and
Immunisation (JCVI) in 20121. Children have been included into the vaccination
programme through a phased rollout, with additional age group cohorts added each
year, with the aim to eventually cover all children aged 2 to 16 years in England.
In the 2013 to 2014 season, the newly licensed live attenuated influenza vaccine (LAIV)
was first offered to children aged 2 to 3 years across England – made available through
GP practices (primary care). Alongside this, Public Health England (PHE)
commissioned a pilot LAIV vaccination programme to provide vaccines to children of
primary school age from reception class to year 6 (4 rising to 11 years) in 11 Local
Authorities in England. Schools in these pilot areas offered the LAIV to healthy and at-
risk children in whom the vaccine was not contraindicated. At the end of this season,
the overall cumulative uptake in the pilot scheme was 52.5%, ranging from 35.8% to
71.5% between pilot areas2.
Since the 2013 to 2014 season, the national programme has been expanding annually
to include additional school year cohorts, alongside continuation of the pilot scheme.
During the 2018 to 2019 season, the LAIV programme was extended to cover children
in school years reception to year 5 (aged 4 rising to 10 years) through the school
delivery model as before. Children aged 2 to 3 years continued to be offered the
vaccine through GP practices. Cumulative school-level vaccine uptake data were
manually submitted through ImmForm for all children of school-age on a monthly basis.
Vaccine uptake was recorded locally at school level and then reported to ImmForm by

Childhood Influenza vaccination programme – England 2018 to 2019 influenza season
6
local authority (LA). At the end of the influenza season, final cumulative vaccination
data including data on refusals and contraindications was collected at school-level
across England and submitted to PHE. This school-level data was used to evaluate
predictors of vaccine uptake of LAIV.

Childhood Influenza vaccination programme – England 2018 to 2019 influenza season
7
Methods
End of season data for the 2018 to 2019 school-age influenza programme were
collected at the school-level and submitted to PHE between February and June of 2019.
This dataset comprised mandatory data items on LAIV vaccine uptake used for routine
reporting and additional data on refusals and contraindications, all collected through a
standardised data collection tool developed by PHE and disseminated to designated
school data providers. Most of the data providers used this tool. These tools allowed for
the entry of either child- or school-level data, which is then aggregated into school totals
per LA. For confidentiality reasons, PHE only collected school-level data. The end of
season data items requested for this study are outlined in Annex B. The PHE dataset
was enhanced by linkage to census-based population indicators collated by the Office
for National Statistics made accessible from web-based census data services.
Uptake
End of season uptake for the school-age influenza programme was calculated based
on the number of children in the target population eligible for LAIV who were reported to
have received one dose of influenza vaccine between 1 September 2018 to 31 January
2019. If children received multiple doses, only the first dose was counted.
The target population was defined as the number of primary school-age children (aged
4 to 9, rising to 10 years) born between 1 September 2007 and 31 August 2014, as
defined by the child’s age on 1 September 2018. This season all children in reception
(aged 4 rising to 5 years), year 1 (aged 5 rising to 6 years), year 2 (aged 6 rising to 7
years), year 3 (aged 7 rising to 8 years), year 4 (aged 8 rising to 9 years) and year 5
(aged 9 rising to 10 years) were offered the vaccine. All primary school-aged children
aged 4 rising to 11 years (born between 1 September 2007 and 31 August 2014)
resident in pilot areas were also offered the vaccine.
Predictors of uptake
Firstly, the latest postcode for each school was extracted from web-based data
available from the Gov.uk website3. This postcode was then used to find the Lower
Super Output Area Level (LSOA) code and the 2015 deprivation deciles for each
school using GeoConvert: UK Data Service Census Support tool4. The deprivation data
is based on the 2015 Index of Multiple Deprivation. The LSOA level data is based on
2011 census geographical boundaries.
Data on religion, ethnicity, age, sex and rural/urban setting by LSOA were downloaded
from Nomis (a web service commissioned by ONS)5. The data was merged with the

Childhood Influenza vaccination programme – England 2018 to 2019 influenza season
8
existing dataset by matching to LSOA. Age and sex were used to allow aggregation of
the ethnicity and religious faith data. Religion and ethnicity predictors were included in a
regression model to evaluate their association with influenza vaccine uptake for those
aged 0 to 15 years old.
Each LSOA is associated with a postcode and comprised a resident population range
of 1,000 to 3,0006. The Index of Multiple Deprivation (IMD) is an overall score assigned
to each LSOA summarising its relative level of deprivation based on 7 domains.
1. Income.
2. Employment.
3. Health.
4. Education.
5. Crime.
6. Service access.
7. Living environment.
The 2015 updated IMD scores were available by decile (from the GeoConvert data
services site).
Information on ethnic constitution of each LSOA is available according to the following
categories: White/Mixed/Asian/Black/Other7. The proportion of black or minority ethnic
residents (BME, defined as non-white British) in each LSOA was divided into quartiles.
Information on the religious constitution of each LSOA is available for Christian
/Buddhist/Hindu/Jewish/Muslim/Sikh/Other/None8. as reported in the original 2011
census. Populations that reported as belonging to the Jewish and Muslim faiths were
also of interest due to concerns over the use of porcine gelatine in the vaccine. As 95%
of schools were in an area where Jewish communities accounted for less than 1% of
the local population, LSOAs identifying as were grouped according to whether the
percentage of the local population of Jewish faith fell into one of 2 demographic groups:
0% or >0. Similarly, LSOAs were grouped according to whether the percentage of the
Muslim population fell into one of 3 demographic groups: 0%, 1-5% or 6%+.
Classification of the LSOA as rural (Town and fringe/Village or hamlet/Isolated dwelling)
or urban (Major conurbation/Minor conurbation/City and town) was available from the
ONS 2011 census5
Vaccine uptake was calculated by each of these population characteristics. A linear
regression analysis was undertaken to identify population factors associated with
influenza vaccine uptake. Uptake in primary schools was linearly regressed against the
same population-level variables (area, deprivation, ethnicity, religious constitution and
rurality) to determine if changes in uptake could be explained. All the variables were

Childhood Influenza vaccination programme – England 2018 to 2019 influenza season
9
included in a multiple linear regression model to provide adjusted estimates. The
methodology was previously published in a study examining predictors of LAIV uptake
and since then repeated for subsequent annual reports on this topic9.
Consent, refusal, refused but previously vaccinated and non-responders
For each eligible child, a parental consent form for the influenza vaccination was sent
out to parents through the child’s school. The return of these forms was recorded by the
school/local authorities and information on the number of consents, refusals and no
form returned was submitted to PHE within the data collection tool at the end of the
season. Not all areas provided this information and when it was provided, it was not
always done so consistently.
Consent
Calculated from the number of consent forms returned by all children in a year group,
divided by the final denominator for that year group. Consent is defined as direct
parental consent to vaccinate. In some cases, consent includes children who are
contraindicated for vaccination with LAIV.
Refusal
Calculated from the number of forms returned by all children in a year group, divided by
the final denominator for that year group. Refusal is defined as direct refusal to
vaccinate. In some cases, this includes children who are contraindicated for he
vaccination with LAIV.
Refused but previously vaccinated
Calculated from the number of forms returned which stated a refusal based on the fact
that the child had been previously vaccinated within the 2018 to 2019 flu season,
divided by the final denominator for that year group.
No consent form returned
Calculated from the number of forms not returned in each year group, divided by the
final denominator for that year group. When no consent form was returned for a child,
that child would not be vaccinated through the school programme. These non-
responder counts were either provided by the school level data submission or
calculated from the final denominator by subtracting the sum of consent and refusal
counts. No returns may also include children contraindicated for vaccination with LAIV.

Childhood Influenza vaccination programme – England 2018 to 2019 influenza season
10
Contraindications
Data was collected for contraindications based on the risk-groups outlined in the Green
Book10. The number of children contraindicated for vaccination were recorded and
aggregated by risk group. Contraindications were split into 2 groups.
1. Prior contraindications: pre-existing contraindications such as anaphylactic reaction
(other than olvabumin); immunosuppression or severe asthma (full list in the Green
book).
2. On-day contraindications such as severe asthma, active wheezing or acute illness.
Not all schools or LAs reported data for contraindications, and those who did not
always do so consistently. Where contraindications were reported, the affected children
were offered either an injectable quadrivalent inactivated influenza vaccine on site, or
were referred to their primary care physician for vaccination.
Other reasons for non-vaccination
Data was also collected for those who refused vaccination due to the porcine content of
the vaccine, those children who were absent on the day and for the children who
refused to be vaccinated on the day. As with the contraindication data, not all schools
or LAs reported this information and those who did often filled out this section
inconsistently.

Childhood Influenza vaccination programme – England 2018 to 2019 influenza season
11
Data Limitations
The analysis in this report (based on school-level data from manual returns of the data
collection tool), differed marginally from the final cumulative data published in the
annual report for the same 2018 to 2019 season11. Data for the latter was based on
Immform data returns uploaded by local authorities and subsequently validated via
automated and manual processes. However in this study the cumulative uptake for all
children in reception to year 5 decreased by <1 of a percentage point (0.6%) compared
to the corresponding figure in the annual report.
For children (reception to year 6) in pilot areas LAIV uptake increased by only one tenth
of a percentage point (0.1%) compared to the corresponding figure in the recent annual
report. These minor differences are likely to be due to the fact that the school-level
dataset can uncover errors not picked up by LAs when submitting the final cumulative
figures at the time of the influenza reporting season. For example, the duplication of
some schools’ uptake data or the need to exclude data due to missing URNs or the fact
that the denominator of the school was smaller than the reported number of children
vaccinated. However, these errors affected a small number of schools.
Other data exclusions were related to aspects of enhanced dataset such as non-match
of school postcodes or schools with missing information on one or more of the
enhanced variables required for the descriptive and regression analysis. Finally other
exclusions were LAs that did not use a school delivery model (n=1) and LAs that did
not return a completed data collection tool (n=3). Details on the excluded schools can
be found in (Annex D).
Regarding all school-level data
In this study, data was collected for Bassetlaw, so for the purpose of these analyses it
formed an LA separate from Nottinghamshire, resulting in 2 separate LAs. Furthermore,
LAs Leicestershire and Rutland were merged due to small numbers, as was City of
London with Hackney and Cornwall with the Isles of Scilly; this resulted in 3 LAs
contributing to the total of 151 LAs in the study. The Isles of Scilly, however, is the only
LA to still use the GP delivery model, and its data was therefore excluded from this
school-level analysis. The data from Cornwall was still included.
Predictors of LAIV uptake
For the linear regression analysis of children in school years reception to year 5, a total
of 84,466/103,564 records comprising school level data by age cohort were
successfully matched to their postcodes. Hence 19,098 of these records were unable to

Childhood Influenza vaccination programme – England 2018 to 2019 influenza season
12
be matched to the LSOA classification and could not be included in the regressions for
uptake predictors; they were, however, still included in the descriptive analyses.
The year group cohorts that could not be matched to their postcodes, in the dataset for
the regression analysis included cohorts that had listed their school URN as 111111,
777777, 888888 or 999999, which correspond to home educated, unknown school
URN and schools that have been excluded or refused to offer the school-based delivery
programme.

Childhood Influenza vaccination programme – England 2018 to 2019 influenza season
13
Results
Uptake: school years reception to 5, 2018 to 2019, England
In the 2018 to 2019 season, a total of 98% (148/151) of LAs included in this study
returned school-level data using the standardised data collection tool. This returned
data covered 2,345,950 children reported to have received at least one dose of
influenza vaccine, out of a total of 3,893,908 eligible children. This results in a
cumulative uptake of 60.2% for the period of 1 September 2018 to 31 January 2019,
with uptake ranging from 48.4% in London to 68.5% in Hampshire, Isles of Wight and
Thames Valley (Table 1). Uptake by year group was also calculated (not shown):
63.7%, 63.3%, 61.2%, 59.9%, 57.7% and 55.8% in years reception to 5, respectively.
The 3 LAs who did not submit school-level data for analyses also used the school-
delivery model, but as no school-level data was provided by them, they were excluded
from this report. From data previously submitted by these 3 LAs, it can be estimated
that uptake in these 3 regions was 58.1% (65,251/112,371) between 1 September 2018
to 31 January 2019.
Table 1. Estimated proportion of children in school years reception to year 5 in England who were vaccinated between 1 September 2018 to 31 January 2019.with at least one dose of influenza vaccine in schools, by NHS England Local Team
NHS England Local Teama,b
No. of children
eligible for vaccination
No. of children vaccinated with at
least 1 dose of influenza vaccine
Vaccine uptake (%)
London 595,473 288,440 48.4
London 595,473 288,440 48.4
Midlands and East 1,195,642 735,538 61.5
Central Midlands 298,047 177,970 59.7
East 307,363 190,534 62
North Midlands 257,156 169,474 65.9
West Midlands 333,076 197,560 59.3
North 1,070,059 670,004 62.6
Cheshire and Merseyside 172,465 112,790 65.4
Cumbria and North East 213,859 129,384 60.5
Greater Manchester 224,730 138,590 61.7
Lancashire 109,784 67,607 61.6
Yorkshire and Humber 349,221 221,633 63.5

Childhood Influenza vaccination programme – England 2018 to 2019 influenza season
14
South East 656,904 418,893 63.8
Hampshire, Isle of Wight and Thames Valley 288,417 197,454 68.5
Kent, Surrey and Sussex 368,487 221,439 60.1
South West 375,830 233,075 62
North 177,221 113,489 64
South 198,609 119,586 60.2
Total 3,893,908 2,345,950 60.2 aDenominators represent the number of children in school years reception to 5 who were eligible for vaccination.
Denominators are based on school-roll figures obtained directly from schools. If these figures were unavailable
then Department of Education January 2018 school census figures were used. bThe 3 LAs who did not provide school-level data were excluded, as was the Isle of Scilly, as here they used the
GP delivery model.
Uptake: school years reception to 6 in pilot areas in England
In pilot areas, an estimated 209,838 children of school years reception to year 6 were
vaccinated with the influenza vaccine, out of a total of 334,659 (Table 7). This resulted
in an overall uptake of 62.7%, ranging from 68.5% in Leicestershire and Rutland to
45% in Leicester, for between 1 September 2018 to 31 January 2019. With regards to
year group, vaccine uptake in pilot areas was highest for reception (ages 4 rising to 5)
at 69.1% and the lowest for year 6 (ages 10 rising to 11) at 57.5%. A trend of
decreasing uptake for increasing year group is observed (Figure 6).
Table 7. Cumulative vaccine uptake in pilot areas in England, for primary school children in years reception to year 6 vaccinated between 1 September 2018 and 31 January 2019
Pilot area No. of children
eligible for vaccination
No. of children vaccinated with at least 1 dose of
influenza vaccine Vaccine uptake (%)
Bury 17,380 11,539 66.4
Essex 123,810 82,984 67
Gateshead 16,050 9,741 60.7
Havering 19,632 11,352 57.8
Leicester 32,885 14,809 45
Leicestershire and Rutland
57,707 39,501 68.5
South Tyneside 11,910 7,064 59.3
Southend on Sea 16,028 10,221 63.8
Sunderland 22,053 12,497 56.7
Thurrock 17,204 10,130 58.9
Total 334,659 209,838 62.7

Childhood Influenza vaccination programme – England 2018 to 2019 influenza season
15
Figure 6. Estimated cumulative proportion of primary school children in school years reception to year 6 in pilot areas across England vaccinated with the influenza vaccine (LAIV) in England, between 1 September 2018 to 31 January 2019
Uptake by PHE region, 2018 to 2019, England
The PHE region level analysis showed that there was little variation between North,
South and Midlands and East regions, each having a median uptake of two-thirds of the
population. However in London the median uptake was <50% (Table 2 and Figure 1).
Figure 1 shows the distribution of uptake at school level. The distributions for the non-
London regions are left skewed with peaks in the 70-79% uptake range whereas
London has relatively flatter and broader distribution, with uptake peaking in the 40-
44% range. Extremities at both ends of the uptake spectrum (≥90% and ≤10%) reflect
schools with true high or low uptake respectively.
Table 2. Median vaccine uptake by PHE region, 2018 to 2019 season, England
PHE Region
Number of schools
Median Uptakea
IQRa
North 5,331 66.7 53.8 to 76.2
South 5,063 66.4 57.1 to 74.5
Midlands and East 5,911 65.5 54.3 to 73.9
London 2,053 48.6 36.1 to 63 aURNs listed as 111111, 777777, 888888, and 999999, which correspond to home educated, unknown school
URN and schools who refused to offer the school-based delivery programme were excluded.
69.165.7 64.0 62.2 61.0 59.6 57.5
0.0
10.0
20.0
30.0
40.0
50.0
60.0
70.0
80.0
Va
ccin
e u
pta
ke
(%
)
Year Group

Childhood Influenza vaccination programme – England 2018 to 2019 influenza season
16
Figure 1. Cumulative uptake of the school-delivery influenza vaccine by PHE region from 1 September 2018 to 31 January 2019, England
Analysis of inequalities in LAIV uptake, England
Analyses were conducted to compare vaccine uptake for different demographic groups
between the 2015 to 2016 season to the 2018 to 2019 season.
These analyses were conducted for the main vaccination programme, excluding the
additional cohorts vaccinated within the pilot programme in each year of analysis. Due
to this, it is important to note that the following cohorts were vaccinated under the main
programme over the previous years:
• 2015 to 2016 vaccinated year 1 and 2
• 2016 to 2017 vaccinated years 1, 2 and 3
• 2017 to 2018 vaccinated years reception, 1, 2, 3 and 4
• 2018 to 2019 vaccinated years reception, 1, 2, 3, 4, and 5
A comparison of uptake across PHE regions in 2015 to 2016 and separately 2018 to 2019
is shown in figure 2. It should be noted that caution is needed when making direct inter-
year comparisons due to differences in the underlying target population in these seasons
with the 2015 to 2016 season composed of school year cohorts 1 and 2 which expanded
0
100
200
300
400
500
600
700
800
900
<5
5-9
10-1
4
15-1
9
20-2
4
25-2
9
30-3
4
35-3
9
40-4
4
45-4
9
50-5
4
55-5
9
60-6
4
65-6
9
70-7
4
75-7
9
80-8
4
85-8
9
90-9
4
95-1
00
Num
ber
of
schools
Vaccine Uptake (%)
PHE North
0100200300400500600700800900
<5
5-9
10-1
4
15-1
9
20-2
4
25-2
9
30-3
4
35-3
9
40-4
4
45-4
9
50-5
4
55-5
9
60-6
4
65-6
9
70-7
4
75-7
9
80-8
4
85-8
9
90-9
4
95-1
00
Vaccine Uptake (%)
PHE South
0100200300400500600700800900
<5
5-9
10-1
4
15-1
9
20-2
4
25-2
9
30-3
4
35-3
9
40-4
4
45-4
9
50-5
4
55-5
9
60-6
4
65-6
9
70-7
4
75-7
9
80-8
4
85-8
9
90-9
4
95-1
00
Num
ber
of
schools
Vaccine Uptake (%)
PHE Midlands
0100200300400500600700800900
<5
5-9
10-1
4
15-1
9
20-2
4
25-2
9
30-3
4
35-3
9
40-4
4
45-4
9
50-5
4
55-5
9
60-6
4
65-6
9
70-7
4
75-7
9
80-8
4
85-8
9
90-9
4
95-1
00
Vaccine Uptake (%)
PHE London
Childhood Influenza vaccination programme – England 2018 to 2019 influenza season
17
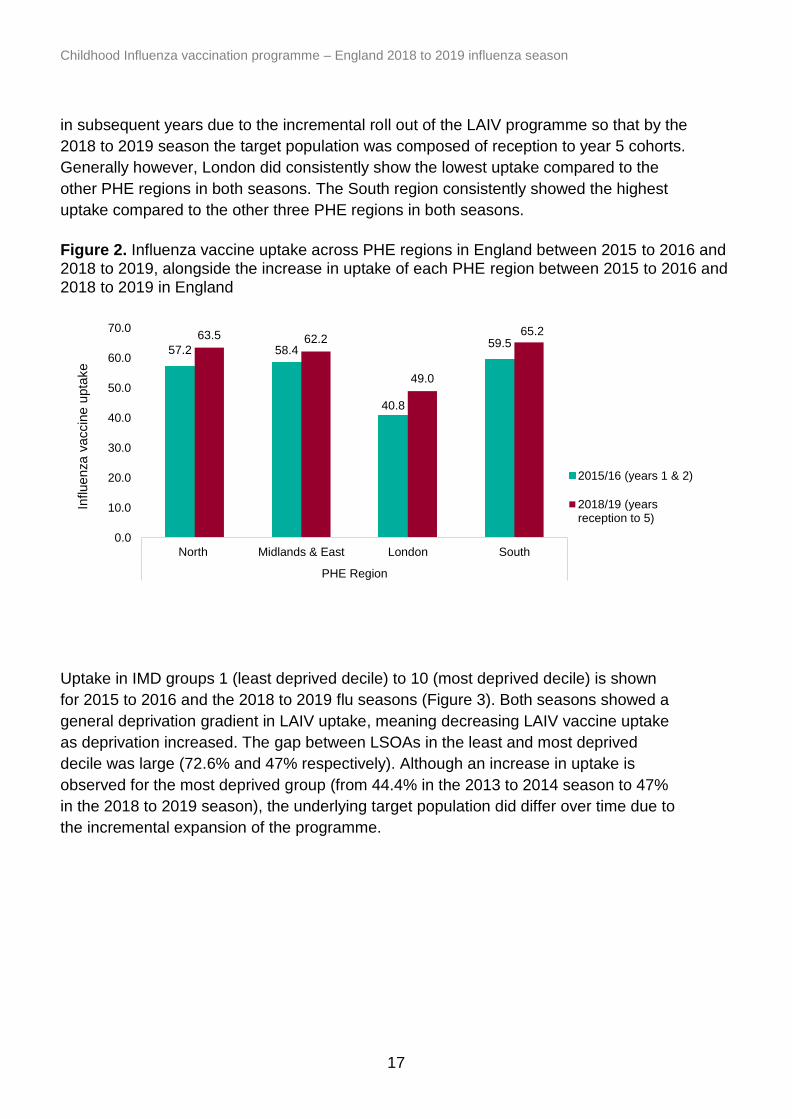
in subsequent years due to the incremental roll out of the LAIV programme so that by the
2018 to 2019 season the target population was composed of reception to year 5 cohorts.
Generally however, London did consistently show the lowest uptake compared to the
other PHE regions in both seasons. The South region consistently showed the highest
uptake compared to the other three PHE regions in both seasons.
Figure 2. Influenza vaccine uptake across PHE regions in England between 2015 to 2016 and 2018 to 2019, alongside the increase in uptake of each PHE region between 2015 to 2016 and 2018 to 2019 in England
Uptake in IMD groups 1 (least deprived decile) to 10 (most deprived decile) is shown
for 2015 to 2016 and the 2018 to 2019 flu seasons (Figure 3). Both seasons showed a
general deprivation gradient in LAIV uptake, meaning decreasing LAIV vaccine uptake
as deprivation increased. The gap between LSOAs in the least and most deprived
decile was large (72.6% and 47% respectively). Although an increase in uptake is
observed for the most deprived group (from 44.4% in the 2013 to 2014 season to 47%
in the 2018 to 2019 season), the underlying target population did differ over time due to
the incremental expansion of the programme.
57.2 58.4
40.8
59.563.5 62.2
49.0
65.2
0.0
10.0
20.0
30.0
40.0
50.0
60.0
70.0
North Midlands & East London South
PHE Region
Influenza v
accin
e u
pta
ke
2015/16 (years 1 & 2)
2018/19 (yearsreception to 5)

Childhood Influenza vaccination programme – England 2018 to 2019 influenza season
18
Figure 3. Change in LAIV vaccine uptake from the 2015 to 2016 to the 2018 to 2019 flu seasons across IMD deciles 1 (least deprived) to 10 (most deprived), England
Analysis was conducted to compare influenza vaccine uptake between populations with
>34% and ≤34% BME composition between 2015 to 2016 and 2018 to 2019 seasons
(Figure 4). It is important to note that the BME data is based on data collected in the
2011 census, for which the response rate was estimated at 94%. Furthermore, the
BME group is not a homogenous group and the percentage may mask differences in
uptake found between the different ethnicities included in the BME definition. It is likely
to also be confounded by deprivation.
The results of the BME analysis show that uptake was consistently lower among
populations with >34% BME than in populations with ≤34% BME composition despite the
differences in underlying target population (Figure 4). Although an increase in uptake for
the ≥34% BME group is observed over time (from 60.4% in the 2013 to 2014 season to
66% in the 2018 to 2019 season) the underlying target population did differ over time due
to the incremental expansion of the programme with added cohorts in each year.
65.8 63.6 62.959.8 57.6
55.652.6
50.047.2
44.4
72.670.4 68.6
66.564.0
61.758.2
54.250.5
47.0
0.0
10.0
20.0
30.0
40.0
50.0
60.0
70.0
80.0
1 2 3 4 5 6 7 8 9 10
Influenza v
accin
e u
pta
ke (
%)
IMD decile
2015/16 (years 1 & 2)
2018/19 (yearsreception - 5)

Childhood Influenza vaccination programme – England 2018 to 2019 influenza season
19
Figure 4. Comparison of LAIV uptake between populations with ≤34% and >34% black and minority ethnic composition between 2015 and 2016 and 2018 to 2019 in England. (The BME analysis based on a 94% response rate on BME in the 2011 census)
Uptake across Lower Layer Super Output Areas (LSOA) was compared between areas
that have no Jewish faith populations and those with a Jewish population of over 0%.
Similarly, uptake was compared between areas that had no Muslim faith population and
areas with 1-5% and 6+% Muslim population (Figure 5).
These analyses showed that since 2015 to 2016, a general pattern emerges where
uptake has consistently been lower in populations with >0% Jewish and Muslim faith
population (Figure 5). In the 2018 to 2019 season LSOAs with 0% Jewish population
had an uptake of 62.1% compared to 58.7% in LSOAs where the Jewish faith
population was >0%. However this difference was not as large as the one between
LSOAs with 0% and >6% Muslim populations (67.4% and 46.9% respectively). The
latter result may be confounded by deprivation which is explored and discussed later in
this report.
In terms tracking progress in uptake in these faith groups over time, an increase is
observed for the highest exposure group in both faiths. Uptake for LSOAs with >6%
Muslim faith population increased from 42.4% in the 2015 to16 season to 46.9% in the
2018 to 2019 season. Similarly uptake in the highest Jewish population (>0%)
increased from 51.9% to 58.7% over the same time period respectively. However,
caution is required in interpreting the trends in uptake due to differences in the school
cohort composition as a result of the incremental roll out of the programme over the
years, as indicated earlier.
39.2 39.043.4 43.7
60.4 59.463.3
66.0
0.0
10.0
20.0
30.0
40.0
50.0
60.0
70.0
2015/16 (years 1 - 2) 2016/17 (years 1-3) 2017/18 (yearsreception - 4)
2018/19 (yearsreception - 5)
Influ
en
za
va
ccin
e u
pta
ke
(%
)
Year
>34% BME
≤34% BME

Childhood Influenza vaccination programme – England 2018 to 2019 influenza season
20
Figure 5. Uptake across Jewish and non-Jewish alongside Muslim and non-Muslim faith LSOAs in the 2015 to 2016 and in the 2018 to 2019 seasons, England
Analyses were also conducted to compare the uptake between rural and urban areas
and pilot and non-pilot areas across England in the 2015 to 2016 flu season through to
the 2018 to 2019 flu season (Table 3). The results show that (regardless of the
differences in the underyling target population in each season), a general pattern
emerges where the overall uptake has been consistently higher in rural areas than in
urban areas in each of the seasons.
With regards to pilot and non-pilot areas, pilot areas tended to show a pattern of
consistently higher vaccine uptake than non-pilot areas over the 4 winter seasons (Table 3). Table 3. Recorded influenza vaccine uptake for the 1 September 2018 to 31 January 2019 for England, split by geographical location to be classified as either rural or urban. Comparison of influenza vaccine uptake is also compared between pilot and non-pilot areas for this time
Area Uptake (%)
2015 to 2016 2016 to 2017 2017 to 2018 2018 to 2019
Rural 63.7 63.2 66.3 63.7
Urban 54.1 53.4 57 55.1
Pilot 60 60 63.1 63.7
Non-Pilot 55.3 54.7 58.1 61.2
56.651.9
62.360.3
42.4
62.158.7
67.4 66.1
46.9
0.0
10.0
20.0
30.0
40.0
50.0
60.0
70.0
0 >0% 0 1-5% 6+%
LSOA % Jewish LSOA % Muslim
Influenza v
accin
e u
pta
ke
2015/16 (years 1 & 2) 2018/19 (years reception - 5)

Childhood Influenza vaccination programme – England 2018 to 2019 influenza season
21
Contraindications and other reasons for non-vaccination: School years reception to
year 5, 2018 to 2019 season, England
Information on reasons for not vaccinating were collected which covered known
contraindications, refusals/absences, refusals due to the vaccine’s porcine content and
all other reasons (Table 4.)
With regards to known contraindications, 9,806/18,358 (53.4%) school reported data on
refusals due to contraindications, this excludes schools with URNs 111111, 888888
and 999999 which covers home schooled children, children educated outside of school
and schools with unknown URNs, respectively. Regarding all other reasons for non-
vaccination, a total of 7,860/18,358 (42.8%) schools reported data (again, excluding
URNs 111111, 888888 and 999999).
A total of 103,947 primary school children eligible for LAIV in the 2018 to 2019 season
(from reception to year 5 inclusive) did not receive the vaccine due to a range of
reported reasons (Table 4). Overall, the most common reason for non-vaccination was
the child refusing on the day, or being absent on the day (n=58,144) which accounted
for 55.9% of total reported reasons for non-vaccination. The second most common
reason for a child not being vaccinated was represented by the ‘other/unknown reason’
and made up 30.5% of all reasons for non-vaccination (n=31,718). No further
information was available for reasons falling into this category.
Known contraindications reported prior to or on vaccine delivery day accounted for 6%
of total reasons for non-vaccination. Among the known contraindications reported prior
to vaccination delivery day, the most common was immunosuppression of a family
member (n=1,004) and immunosuppression of the child themselves (n=750), each
accounting for 1% and 0.7% of all reasons for non-vaccination, respectively. For
contraindications recorded on the vaccine delivery day, the most common was the child
being unwell (n=2,446) which accounted for 2.4% of all reported reasons for non-
vaccination.
Finally, 7.6% (n=7,856) of those reporting reasons for non-vaccination listed the reason
as due to the porcine content of the vaccine.

Childhood Influenza vaccination programme – England 2018 to 2019 influenza season
22
Table 4. Reasons for non-vaccination, including known contraindications, collected by immunisation staff during vaccination visits to schools in England between 1 September 2018 and 31 January 2019
Contraindication / Reason for non-vaccination Number
of children affected
% of total reasons for
contraindication / non-
vaccination
Known contraindications
Prior
3,597 3.5
Confirmed egg allergy 723 0.7
Immunosuppression (family) 1,004 1
Previous allergy to flu vaccine 545 0.5
Severe asthma 379 0.4
Immunosuppression (personal) 750 0.7
Another vaccine given/due 66 0.1
Cardiac disease/ Salicylate therapy 130 0.1
On day
2,632 2.5
Child unwell 2,446 2.4
Asthma/wheezing 186 0.2
Child refused/absent 58,144 55.9
Known reasons for refusal: vaccine contains porcine gelatine
7,856 7.6
Other and unknown 31,718 30.5
Total
103,947 100

Childhood Influenza vaccination programme – England 2018 to 2019 influenza season
23
Predictors of uptake: school years reception to year 5, 2018 to 2019, England
The results of the unadjusted univariate and risk adjusted multivariate regression
analyses are shown in table 5. Figure 6 shows a graphical representation of the risk
adjusted estimates.
Using available data for this analysis (n=3,017,113), the risk adjusted model showed
that deprivation, ethnicity and populations belonging to certain religious faiths, rurality,
region and pilot status all remained independently associated with uptake. The largest
effects were seen for those in the most deprived groups and for those in populations
with ≥34% black or minority ethnic (BME) when compared to their respective baseline
groups. Vaccine uptake was estimated to be 18 percentage points lower in schools
falling in the most deprived decile (IMD 10) compared to the baseline group (least
deprived decile). Schools falling in LSOAs with the highest ethnicity population (≥34%)
had vaccine uptake that was estimated to be 8.4 percentage points lower compared to
the baseline group (<5% ethnicity population).
Although the difference in vaccine uptake between highest and lowest exposure groups
‘attenuated’ or shrunk after risk adjustment, vaccine uptake effects remained
statistically significant. Attenuation of vaccine uptake was most marked for ethnicity and
Muslim population variables. In the unadjusted model LAIV vaccine uptake in schools
located in LSOAs with the highest ethnicity composition was 22.5 percentage points
lower than the baseline group but after risk adjustment, contracted to being 8.4
percentage points lower than the baseline group, although this difference was still high.
Similarly schools located in LSOAs with the highest population with Muslim faith (>6%)
had LAIV uptake was estimated to be 19.2% percentage lower compared to the
baseline (non-Muslim population 0%) before risk adjustment. After adjustment, uptake
contracted to being 5.5 percentage points lower than the baseline group (population
with non-Muslim faith). LSOAs with the highest population with Jewish faith also
experienced attenuated effects (shrinking of difference with the non-Jewish faith
baseline group) after risk adjustment. Although the risk adjusted uptake was marginally
lower than the baseline this was statistically significant at the 5% level.
IMD (in deciles) showed uptake decreased progressively as deprivation increased
compared to the baseline (table 5 and figure 6) and statistically significant at each
decile. However the difference between the most and least deprived deciles remained
very high even after risk adjustment (18% percentage points lower in most deprived
compared to the least deprived decile). The difference between the least and most
exposed groups for the ethnicity and IMD variables in particular remained high after
adjustment.

Childhood Influenza vaccination programme – England 2018 to 2019 influenza season
24
Pilot areas were shown to have a significantly higher uptake than non-pilot areas in the
adjusted and unadjusted models.
London uptake was 18% percentage points lower than the baseline group (North) in the
unadjusted model and although contracting after risk adjustment, the difference
remained high (9 percentage points lower than the baseline). The other 3 regions had
lower uptake than the North prior to risk adjustment but after risk adjustment the
magnitude increased.

Childhood Influenza vaccination programme – England 2018 to 2019 influenza season
25
Table 5. The adjust and unadjusted impact of various predictors on influenza vaccine uptake for children of primary school years reception to year 5, uptake data between 1 September 2018 and 31 January 2019, England
CovariateTotal Number
of children
Crude
uptake (%)
Estimated % uptake
change (95% CI)p-value
Estimated % uptake
change (95% CI)p-value
PHE Region of School North 0 0.0 Baseline - Baseline -
Midlands and East 0 0.0 -4.18 (-4.57 to -3.79) <0.001 -5.60 (-5.98 to -5.21) <0.001
London 0 0.0 -18.05 (-18.60 to -17.50) <0.001 -8.99 (-9.63 to -8.34) <0.001
South 0 0.0 -1.08 (-1.49 to -0.67) <0.001 -5.14 (-5.55 to -4.74) <0.001
1 (Least deprived) 0 0.0 Baseline - Baseline -
2 0 0.0 -1.61 (-2.29 to -0.93) <0.001 -1.78 (-2.43 to -1.13) <0.001
3 0 0.0 -3.46 (-4.13 to -2.78) <0.001 -3.71 (-4.36 to -3.06) <0.001
4 0 0.0 -4.33 (-4.99 to -3.67) <0.001 -4.38 (-5.02 to -3.74) <0.001
5 0 0.0 -6.37 (-7.03 to -5.71) <0.001 -6.03 (-6.67 to -5.39) <0.001
6 0 0.0 -8.56 (-9.23 to -7.89) <0.001 -7.35 (-8.01 to -6.70) <0.001
7 0 0.0 -12.29 (-12.98 to -11.59) <0.001 -10.14 (-10.81 to -9.46) <0.001
8 0 0.0 -15.64 (16.35 to -14.94) <0.001 -11.88 (-12.58 to -11.19) <0.001
9 0 0.0 -19.36 (-20.07 to -18.65) <0.001 -14.47 (-15.18 to -13.76) <0.001
10 (Most deprived) 0 0.0 -21.59 (-22.30 to -20.89) <0.001 -18.00 (-18.71 to -17.29) <0.001
<5% 0 0.0 Baseline - Baseline -
5 to <12% 0 0.0 -0.89 (-1.27 to -0.51) <0.001 -0.38 (-0.79 to 0.032) 0.071
12 to <34% 0 0.0 -5.97 (-6.38 to -5.56) <0.001 -1.40 (-1.93 to -0.88) <0.001
34+ % 0 0.0 -22.48 (-22.93 to -22.03) <0.001 -8.44 (-9.27 to -7.62) <0.001
School Isoa % Jewish 0% 0 0.0 Baseline - Baseline -
>0% 0 0.0 -3.42 (-3.83 to -3.01) <0.001 -0.79 (-1.19 to -0.39) <0.001
School Isoa % Muslim 0% 0 0.0 Baseline - Baseline -
1 to 5% 0 0.0 -1.50 (-1.84 to -1.16) <0.001 0.41 (0.03 to 0.78) 0.032
6+% 0 0.0 -19.17 (-19.60 to -18.74) <0.001 -5.49 (-6.21 to -4.77) <0.001
Rural/Urban school Rural 0 0.0 Baseline - Baseline -
Urban 0 0.0 -7.72 (-8.06 to -7.37) <0.001 -1.20 (-1.61 to -0.80) <0.001
Pilot/ Non-Pilot Non-pilot 0 0.0 Baseline - Baseline -
Pilot 0 0.0 2.97 (2.35 to 3.59) <0.001 2.63 (2.02 to 3.23) <0.001
Unadjusted Adjusteda
IMD 2010 Score of
school (decile)
School Isoa % black
or minority ethnicity
aPredictor variables used were, PHE region, IMD score, Isoa % black or minority ethnicity, Isoa% Jewish, Isoa% Muslim, Rural/Urban school, and pilot non-pilot status

Childhood Influenza vaccination programme – England 2018 to 2019 influenza season
26
Figure 6. Adjusted linear regression showing the change in percentage uptake of population-level predictors when compared to baseline values for children in school years reception to year 5 in England, 1 September 2018 to 31 January 2019. Corresponding 95% confidence intervals are also shown

Childhood Influenza vaccination programme – England 2018 to 2019 influenza season
27
Discussion
During the 2018 to 2019 influenza season, the school-age vaccination programme was
extended to include children in year 5, with those in years reception to year 4 being
already included in the programme across England. For the 2018 to 2019 season, an
overall influenza vaccine uptake of 60% was achieved for England for years reception
to year 5. In pilot areas, on overall uptake of 62.7% was achieved in England for
children aged reception to year 6.
However, as alluded to earlier, there are caveats with some interpretation of the results.
The aggregation of all black and ethnic minorities into one group has drawbacks.
Although this allows for rapid and easy interpretation, this is not a homogenous group.
The BME definition encompasses those from all ethnic minorities in England as based
on the % BME for each location from the 2011 Census. The overall LAIV uptake based
on a broad BME category may mask the hardest-to-reach subgroups. Furthermore
ethnicity is likely to also be confounded by deprivation hence the rationale for targeting
deprivation to improve uptake in future campaigns.
Another caveat, as mentioned is associated with evaluating the trends in the all-age
uptake over time. The cohort composition changed in successive seasons due to the
phased roll-out of the LAIV programme. For this reason, looking at general patterns of
uptake in certain groups over time are perhaps more useful than drawing firm
conclusions from inter-year comparisons.
Another potential weakness in the data is the lack of information regarding entire
schools that refused LAIV vaccination. Very few local authorities provided information
on the number of schools that refused on that basis, so it is likely that some schools
that had refused to take part in the vaccination programme were excluded from the
denominator or numerator calculations for uptake. Further work is needed in the future
to ensure that refusing schools are included in the data collection as they may
represent pockets of potentially susceptible populations.
With regards to the contraindication analyses, the results give a useful impression of
which contraindications were most common in those schools who provided information.
In non-pilot regions, only 53.4% of schools provided information on contraindications
and for those who did not provide this information, it was not clear if the absence of
response represented no contraindications reported by the children or their guardians,
or if this information was not recorded by the vaccination teams. Due to this, care
should be taken when extrapolating the results of this section of the analyses.
In both pilot and non-pilot areas, vaccine uptake decreases as year group increased.
Reception showed the highest uptake whilst children in school years 5 and 6 showed

Childhood Influenza vaccination programme – England 2018 to 2019 influenza season
28
the lowest uptake in non-pilot and pilot areas respectively. However vaccine uptake
increased in all corresponding cohorts since the 2017 to 2018 season12.
This report included a new analysis examining evidence of inequalities in uptake. In the
2018 to 2019 season, a large gap in uptake was observed between LSOAs in the most
and least deprived deciles (47% and 72.6% respectively). Similarly a large gap in LAIV
uptake was observed between LSOAs with lowest and highest black and ethnic
minority population (66% and 43.7% respectively). Populations with the highest Muslim
faith composition also saw lower uptake compared to the non-Muslim population
(67.4% and 46.9% respectively). Similarly populations with the highest Jewish faith
composition had lower LAIV uptake compared to non-Jewish population (58.7% and
62.1% respectively).
Although a gap in uptake occurred between the least and most exposed subgroups
within the latest season, over time however the uptake increased for the most exposed
groups. From the 2015 to 2016 to the 2018 to 2019 seasons, the all-age uptake
increased for populations in the most deprived decile (from 44.4% to 47% respectively).
Populations with highest black and ethnic minority composition also saw an increase in
uptake (from 60.4% to 66% respectively) and for populations with the highest Muslim
(from 42.4% to 46.9%) or Jewish faith composition (from 51.9% to 58.7% respectively).
However whilst the increasing trend is encouraging the caveat with this interpretation is
that the underlying eligible cohorts differed in the respective seasons due to the
expanding programme over time.
The ecological analyses looking at population level predictors of uptake indicate that
after risk-adjustment all predictors included in the model were strongly and significantly
associated with LAIV uptake including ethnicity, level of deprivation and populations
with highest proportion of certain religious faiths. The largest and most striking effects
were seen for IMD. After risk adjustment uptake in the most deprived decile was 18
percentage points lower than the least deprived decile. The adjusted model also
showed that schools falling in LSOAs with the highest ethnicity population (≥34%) had
vaccine uptake that was 8.4 percentage points lower compared to the baseline group
(<5% ethnicity population).
Attenuation of effects post risk adjustment were observed in general. However, for IMD
and ethnicity in particular, the difference in uptake between the baseline and the highest
exposure group in these variables remained high despite risk adjustment. The Muslim
faith variable also saw a contraction in the difference between the highest exposure and
the baseline groups – LSOAs with populations >6% Muslim composition had an uptake
that was significantly lower (5.5 percentage points difference) than LSOAs with 0%
Muslim faith (the baseline group). But this difference was still large and appears to have
increased slightly compared to 2017 to 2018 season (where uptake was 3.81
percentage points lower in LSOAs with ≥6% Muslim population compared to the non-

Childhood Influenza vaccination programme – England 2018 to 2019 influenza season
29
Muslim population in the modelled analysis). However, the caveat is that the underlying
target population differed between the 2 seasons due to the additional year 5 in the
2018 to 2019 season which recorded the lowest uptake of all school year groups.
Pilot areas experienced a significantly higher uptake (2.6 percentage points higher)
compared to non-pilot areas and rural areas had significantly higher uptake than urban
areas post risk adjustment.
Regarding PHE region, the lowest uptake has consistently been observed for London,
and the highest for the South. Despite adjusting for important confounders namely
deprivation and ethnicity, London still had an uptake estimated to be almost 9
percentage points lower than the reference group (North region). The difference in
uptake after risk adjustment was still remarkably high. Further study is needed to
explain this finding for London such as operational factors that impede vaccine
completion in schools.
Overall, the evidence from this analysis suggests that efforts could be directed to
reduce inequalities in vaccine uptake. The striking and consistent difference in uptake
between the lowest and highest deprivation deciles is an important area for future
prevention strategies. This will help to improve vaccine uptake in the groups with the
greatest need.
The school-age influenza vaccination programme has continued to increase each year,
in terms of coverage and uptake. From September 2019, all eligible children of school-
age reception to year 6 will be vaccinated in schools in England. This will result in
children aged 4 rising to 11 receiving the LAIV vaccine primarily through the school-
based programme.

Childhood Influenza vaccination programme – England 2018 to 2019 influenza season
30
Acknowledgements
The Influenza Surveillance section at PHE would like to thank everyone that contributed
to this report and specifically acknowledge:
• PHE and NHS staff responsible for planning and delivering the school-based
vaccination programme for primary school children and providing the end of season
data return to run this report
• ImmForm staff that provided and supported the online survey

Childhood Influenza vaccination programme – England 2018 to 2019 influenza season
31
References
1. Joint Committee on Vaccination and Immunisation. Minutes of the meeting 5 Oct
2011. London. Available online:
http://webarchive.nationalarchives.gov.uk/20120907090205/http://www.dh.gov.uk/pr
od_consum_dh/groups/dh_digitalassets/@dh/@ab/documents/digitalasset/dh_1335
98.pdf
2. Pebody RG, Green HK, Andrews N et al. Uptake and impact of a new live
attenuated influenza vaccine programme in England: early results of a pilot in
primary school-age children, 2013/14 influenza season. Euro Surveil 2014, 19(22).
pii:20823:
3. GOV.UK Get information about schools. Available online: https://get-information-
schools.service.gov.uk/
4. UK Data Service Census Support. GeoConvert
http://geoconvert.mimas.ac.uk/help/documentation.html
5. Office for National Statistics. Nomis official labour market statistics
https://www.nomisweb.co.uk/
6. Office for National Statistics. 2011 Super Output Areas
https://www.ons.gov.uk/methodology/geography/ukgeographies/censusgeography#
super-output-area-soa
7. Office for National Statistics. Ethnicity and national identity in England and Wales
2011. December 2012
https://webarchive.nationalarchives.gov.uk/20160107112033/http://www.ons.gov.uk/
ons/dcp171776_290558.pdf
8. Office for National Statistics. Religion in England and Wales 2011. December 2012
https://webarchive.nationalarchives.gov.uk/20160107112352/http://www.ons.gov.uk/
ons/dcp171776_290510.pdf
9. Green HK, Andrews N, Letley L et al. Phased introduction of a universal childhood
influenza vaccination programme in England: population-level factors predicting
variation in national uptake during the first year, 2013/14. Vaccine 2015;33:2620-8
10. GOV.UK Green Book of Immunisation Chapter 19: Influenza April 2019
https://assets.publishing.service.gov.uk/government/uploads/system/uploads/attach
ment_data/file/796886/GreenBook_Chapter_19_Influenza_April_2019.pdf
11. Seasonal influenza vaccine uptake in children of primary school age: winter season
2018 to 2019. May 2019. Available online
https://assets.publishing.service.gov.uk/government/uploads/system/uploads/attach
ment_data/file/806289/Childhood_flu_annual_report_2018_19_FINAL_.pdf
12. Seasonal influenza vaccine uptake in children of primary school age: winter season
2017 to 2018. September 2018. Available online:
https://assets.publishing.service.gov.uk/government/uploads/system/uploads/attach
ment_data/file/742678/Childhood_flu_vaccination_programme_England_2017_to_2
018.pdf

Childhood Influenza vaccination programme – England 2018 to 2019 influenza season
32
Annexes
Annex A. Year group cohorts
Academic group
Age range on 1
September 2018
Birth Date
Born from date Born to date
Reception Aged 4 to 5 years 1 September 2013 31 August 2014
1 Aged 5 to 6 years 1 September 2012 31 August 2013
2 Aged 6 to 7 years 1 September 2011 31 August 2012
3 Aged 7 to 8 years 1 September 2010 31 August 2011
4 Aged 8 to 9 years 1 September 2009 31 August 2010
5 Aged 9 to 10 years 1 September 2008 31 August 2009
6 Aged 10 to 11 years 1 September 2007 31 August 2008
Childhood Influenza vaccination programme – England 2018 to 2019 influenza season
33
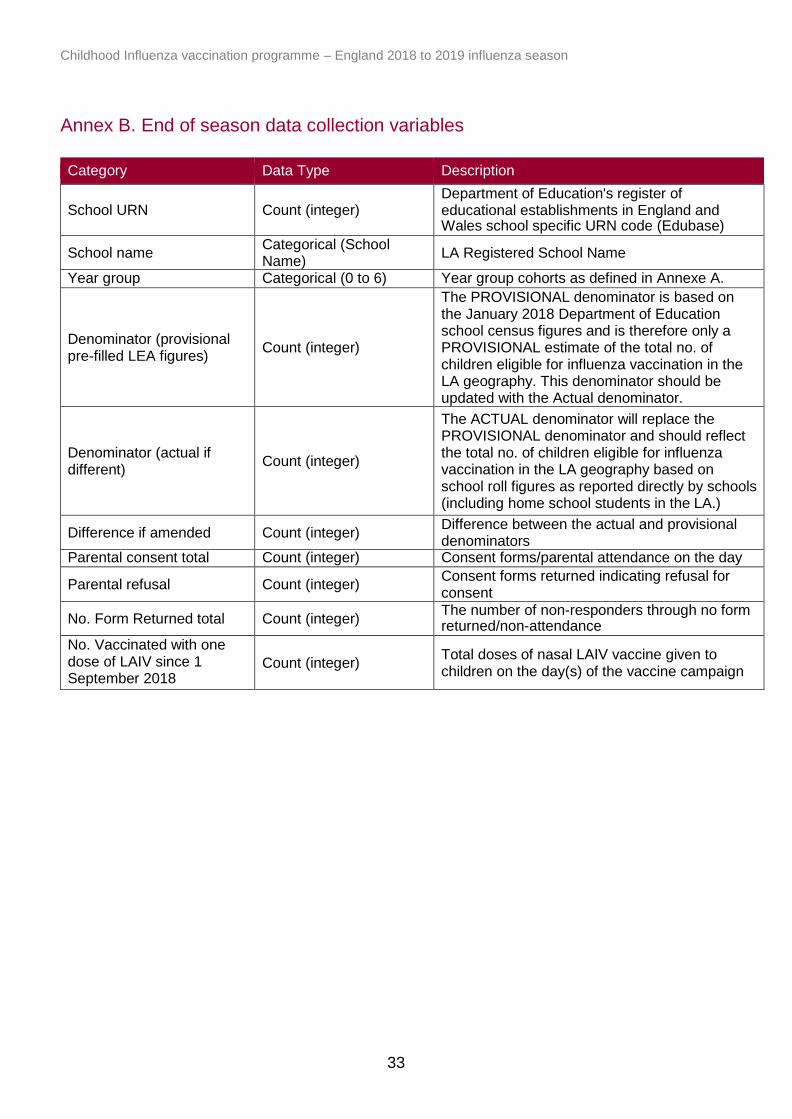
Annex B. End of season data collection variables
Category Data Type Description
School URN
Count (integer) Department of Education's register of educational establishments in England and Wales school specific URN code (Edubase)
School name Categorical (School Name)
LA Registered School Name
Year group Categorical (0 to 6) Year group cohorts as defined in Annexe A.
Denominator (provisional pre-filled LEA figures)
Count (integer)
The PROVISIONAL denominator is based on the January 2018 Department of Education school census figures and is therefore only a PROVISIONAL estimate of the total no. of children eligible for influenza vaccination in the LA geography. This denominator should be updated with the Actual denominator.
Denominator (actual if different)
Count (integer)
The ACTUAL denominator will replace the PROVISIONAL denominator and should reflect the total no. of children eligible for influenza vaccination in the LA geography based on school roll figures as reported directly by schools (including home school students in the LA.)
Difference if amended Count (integer) Difference between the actual and provisional denominators
Parental consent total Count (integer) Consent forms/parental attendance on the day
Parental refusal Count (integer) Consent forms returned indicating refusal for consent
No. Form Returned total Count (integer) The number of non-responders through no form returned/non-attendance
No. Vaccinated with one dose of LAIV since 1 September 2018
Count (integer) Total doses of nasal LAIV vaccine given to children on the day(s) of the vaccine campaign

Title goes here as running header
34
%
Calculated field =No. vaccinated with one dose LAIV since 1 September 2018/Denominator (actual if different)
Percentage uptake
No. vaccinated with one dose of TIV since 1 September 2018
Count (integer) Total doses of TIV vaccines given to children on the day(s) of the vaccine campaign
%
Calculated field =No. vaccinated with one dose TIV since 1 September 2018/Denominator (actual if different)
Percentage uptake
No. that have received flu vaccine since 1 September 2018
Count (integer) Total doses of all vaccines given to children on the day(s) of the vaccine campaign
%
Calculated field =No. that have received flu vaccine since 1 September 2018/ Denominator (actual if different)
Percentage uptake
Consented but not given Count (integer) Total number of children that consent but did not receive the vaccine
Total GP referrals Count (integer) Total number of children who were referred to the GP for vaccination
No. Yellow Cards Issued Count (integer) Total number of children who were issued a yellow card
Contraindications Data Type Description
Total No. of contraindications
Count (integer) Total number of children with contraindications
Previous allergy to flu vaccine
Count (integer) Total number of children who have an allergy to flu vaccine
Egg Allergy Count (integer) Total number of children who have an egg allergy
Severe asthma Count (integer) Total number of children who have severe asthma
Another live vaccine given/due
Count (integer) Total number of children who have/had another live vaccine due/given
Immunosuppression (personal)
Count (integer) Total number of children with an immunosuppression
Immunosuppression (family)
Count (integer) Total number of children who have a family member with an immunosuppression
Cardiac disease/salicylate therapy
Count (integer) Total number of children with a cardiac disease/ salicylate therapy
On day: child unwell Count (integer) Total number of children who were unwell on the day of the vaccination campaign
On day: child absent Count (integer) Total number of children who were absent on the day of the vaccination campaign
On day: child refused Count (integer) Total number of children who refused the vaccine on the day of the vaccination campaign
On day: allergies Count (integer) Total number of children who had allergies on the date of the vaccination campaign
Other Count (integer) Other contraindications not previously stated
Comments Text Comments

Childhood Influenza vaccination programme – England 2018 to 2019 influenza season
35
Annexe C: Table of Local Authorities not included in the study due to missing
data or having a GP delivery model
NHS England Team Local Authority
Non-responders
NHS England London Croydon
Lewisham
NHS England North (Yorkshire and Humber) Leeds
GP Uptake
NHS England South West (South West South) Kernow (Cornwall and Isles of Scilly)* *School-level data were submitted for Cornwall LA
Annexe D: Number of schools that did not submit any data or had submitted data
where the numerator was greater than the denominator
NHE England Local Team Local Authority
Total number of schools where number vaccinated
was greater than denominator
London Havering 1
Midlands and East (Central Midlands)
Leicester 1
Leicestershire and Rutland 2
Lincolnshire 38
Midlands and East (North Midlands)
Staffordshire 2
Midlands and East (West Midlands)
Birmingham 3
Coventry 2
Solihull 2
Worcestershire 10
North (Cheshire and Merseyside)
Cheshire East 3
North (Cumbria and North East)
Northumberland 1
North (Greater Manchester) Bolton 1
Oldham 1
Salford 4
Stockport 2
Tameside 1
Wigan 4
North (Yorkshire and Humber)
Sheffield 1
South East (Hampshire, Isle of Wight and Thames Valley)
Isle of Wight 1
Oxfordshire 1
South West (North) Gloucestershire 3