seasonal migration and genetic population structure in
TRANSCRIPT

The Condor 102:517-52X 0 The Cooper Omrthological Society 2000
SEASONAL MIGRATION AND GENETIC POPULATION STRUCTURE IN HOUSE WRENS’
NIDIA ARGUEDAS Department of Evolution, Ecology and Organismal Biology, The Ohio State University, Columbus, OH 43210,
e-mail:[email protected]
PATRICIA G. PARKER Department of Evolution, Ecology and Organismal Biology and Department of Anthropology, The Ohio State
University, Columbus, OH 43210
Abstract. Neotropical migrant birds have undergone significant changes in population size, due in part to alterations in the landscape in their breeding range. Some alterations have resulted in the isolation of areas containing optimal habitat for breeding. Isolation between habitat fragments could reduce gene flow between populations, which might result in loss of genetic variation due to genetic drift. To test whether isolation due to distance between populations may affect migratory birds as much as sedentary birds, we used four microsatellite loci as genetic markers to compare gene flow and population structure in migratory and sedentary House Wrens (Troglodytes aedon and T. musculus, respectively). If migratory behavior enhanced gene flow, we expected to find that populations of migratory birds were genetically more similar than populations of sedentary birds, and that gene flow declined more rapidly with distance in sedentary than in migratory populations. Blood sam- ples were collected from 18-25 migratory House Wrens at each of six sites in Ohio separated by distances from 25 to over 300 km, and from 16-20 sedentary House Wrens at each of six sites in Costa Rica, also at distances up to 350 km. We used heterologous microsatellite primers to obtain estimates for R,, (population subdivision) and Nm (number of immigrants per generation) in relation to distance between pairs of populations. In the migratory pop- ulations, Mantel permutational tests showed no effect of distance on R,, or Nm at distances between 25 and 300 km. In the sedentary birds, R,, increased and Nm decreased signifi- cantly as distance between populations increased from 25 to 300 km. F,, values were not different from those obtained using Slatkin’s (1995) R,, statistics. These results are consis- tent with our hypothesis that migratory behavior enhances gene flow.
Key words: gene flow, House Wrens, migratory birds, population structure, sedentary birds, Troglodytes aedon, Troglodytes musculus.
INTRODUCTION
Neotropical migrant birds have shown signifi- cant variation in numbers in the last few de- cades; some species have decreased enough to be considered threatened, others appear stable, whereas others have shown dramatic increases (Hagan and Johnston 1992, James et al. 1996). Populations may fluctuate in size as a result of changes in the physical environment (Flather and Sauer 1996, Boulinier et al. 1998) or other factors, such as increased competition and pre- dation from introduced species (Fritts and Rodda 1998, Russell et al. 1998), and the level of sta- bility typical of a particular environment (Tewksbury and Martin 1998). These factors
I Received 7 July 1999. Accepted 8 February 2000.
may affect birds in the breeding range, wintering range, or during their seasonal long-distance flights (Hagan et al. 1992, Sutherland 1998). One concern is that increasing fragmentation of habitat on the breeding grounds may result in increased isolation of breeding habitat patches, thereby inhibiting dispersal and limiting gene flow between sites. Reduced gene flow may pro- mote loss of genetic variation within breeding sites due to genetic drift, which may affect fit- ness and population persistence (Frankham 1996). The capacity to travel long distances does not necessarily make migratory birds better col- onists of new areas (Bohning-Gaese et al. 1998). Nonetheless, isolation of populations within an established range might not be expected of or- ganisms that are capable of crossing wide ex- panses of inhospitable habitat during their sea-
[5171

sonal movements. Because of the high mobility of migratory birds, high levels of gene flow have been assumed (Rockwell and Barrowclough 1987). Based on data using protein electropho- resis, Barrowclough (1980) considered that the entire range of a migratory species might form a single, panmictic population. In contrast, re- turn rates of some migratory bird species (Brawn and Robinson 1996) indicate that dis- persal to new breeding sites may not be as wide- spread as previously believed; these authors also point out that our present knowledge of the mag- nitude of dispersal in these birds is inadequate to respond to our current conservation needs. The difficulties involved in the study of dispersal in the field have stimulated its estimation through indirect methods that compare popula- tion structure and gene flow with the use of ge- netic markers. Bohonak (1999) has found that genetic statistics such as Wright’s (1951) F,, are generally robust for making inferences about the movements of individuals between sites.
Here, we test the hypothetical relationship be- tween migratory behavior and gene flow by comparing population structure of migratory and sedentary birds with the use of microsatellites as genetic markers. Microsatellites (Tautz 1989) are short, tandemly repeated sequences of nuclear DNA [such as (CA/GT), or (CAT/GTC),] which are characterized by high mutation rates (as high as 10m3 per generation) and simple Mendelian mode of inheritance. Their high polymorphism in the number of tandem repeats and their mode of inheritance make them ideal markers for pop- ulation studies (Ellegren 1992, Queller et al. 1993). This is particularly true for studies fo- cusing on vertebrates (e.g., Wenburg et al. 1998, Gladden et al. 1999, Van Treuren et al. 1999) for which a large number of microsatellite loci are accessible. The detection of size variation in microsatellite alleles among breeding individu- als permits the assessment of gene flow: distin- guishable patterns of allelic diversity can be ob- served, as size mutations occur independently in each population and are inherited in Mendelian fashion, and genetic drift changes allele frequen- cies in isolated populations. As in studies that use protein polymorphisms as markers (Wright 1951; see Rockwell and Barrowclough 1987 for references on avian species), population struc- ture is detected through the determination of the presence, absence, or differences in frequencies of particular alleles among populations. High
gene flow translates into shallow population sub- division (high genetic similarity between popu- lations); lower gene flow results in deeper pop- ulation substructuring (less similarity between populations).
We compare population structure in two closely related members of the passerine species group, the House Wren, Troglodytes spp., whose complete range includes most of the American continents (Fig. 1). As an edge/second-growth species, the House Wren is ubiquitous in human- altered landscapes (Skutch 1960, Bent 1964, Ridgely and Tudor 1989). The Northern House Wren (T. aedon) is a long-distance migrant; its breeding range covers most of North America, and its wintering range extends from the south- em states to southern Mexico (Bent 1964). The migratory Northern House Wren has experi- enced impressive population increases in its North American range (Hagan et al. 1992, Earnst and Andres 1995). These increases have been attributed to land conversion and agricul- turalization, the wrens’ aggressive behavior in obtaining nesting sites (White and Kennedy 1997, Hannon and Cotterill 1998) and defending them (Pribil and Picman 1997), and their ability to take advantage of conservation measures di- rected to other cavity nesters (Purcell et al. 1997). Its southern Central American counter- part (T. a. musculus, or T. musculus according to Brumfield and Capparella 1996) is a year- round resident in most habitats except the very dry or those above 270 m (Stiles and Skutch 1989). Southern House Wrens share with the North American form the behavioral traits that make them successful (Skutch 1960, Beissinger et al. 1998). Land conversion also has increased the size and the connectivity of the habitat of the Southern House Wren (Sanchez-Azofeifa et al. 1999).
Following the hypothesis that the migratory habit enhances gene flow, it is our expectation that population structure will be shallower (in- dicating more gene flow) in the migratory north- em House Wrens than in the sedentary southern House Wrens. We also expect that in both mi- gratory and sedentary birds, gene flow will de- cline as distance between populations increases, and that the decline in gene flow will be steeper in sedentary compared to migratory birds.
METHODS SAMPLING AREAS AND FIELD METHODS
Populations of the migratory Northern House Wren were sampled in Ohio during the 1994

breeding season. Between 18 and 25 individuals were mist-netted at each of six sites located over 300, 150, 80, 40, and 25 km apart (Fig. 1). Blood samples (20-40 pl each) were obtained by puncture of the brachial vein and mixed im- mediately with 500-700 yl of lysis buffer (100 mM Tris pH 8.0, 100 mM EDTA, 10 mM NaCl, 0.5% SDS; Longmire et al. 1988).
Populations of sedentary Southern House Wrens were sampled in Costa Rica during the breeding season of 1996. In order to obtain suf- ficient samples within a small geographical ra- dius, wren populations were sampled in the proximity of small towns (5,000-10,000 inhab- itants), in which the species tends to be abun- dant. Six populations were sampled at distances of approximately 300, 150, 80, 40, and 25 km from each other (Fig. 1). Sample sizes were be- tween 16 and 20 individuals per population. Blood samples were collected and preserved in the same manner as the Ohio samples.
LABORATORYPROCEDURES
Purification of total DNA was carried out l-2 months after blood collection by phenol/chloro- form-CIA extraction and dialysis in 1X TNE, (10 mM Tris-HCl, 10 mM NaCl, 2 mM EDTA). Purity, integrity, and concentration of each DNA sample was determined by spectrophotometry and electrophoresis in 0.8% agarose gels run in 1X TBE. Four polymorphic microsatellite loci (Table 1) were identified and selected by screen- ing House Wren DNA with 25 pairs of PCR (polymerase chain reaction) oligonucleotide primers developed for different passerine spe- cies. Three of the loci used in migratory birds (POCC 1, LTMR 6, and Dpmu 16) were the same as those used in the sedentary birds. The fourth locus was different between the migratory and the sedentary forms (FhU 2 and POCC 2, respectively), because no other single locus pro- vided a comparable level of polymorphism in both the migratory and the sedentary forms. Amplification reactions (4-10 p,l total volume) were performed in Biometra Uniblock and TrioBlock Automatic Cyclers. We used the touch-down approach, with the following pa- rameters: denaturing was accomplished at 94°C for 30 set, annealing temperatures were de- creased from 52°C to 50°C for 30 set, each re- peated twice, followed by 35 cycles at 49°C for 30 set each. Product extension was done at 72°C for 30 set each. PCR products were separated in
non-denaturing 7.5% acrylamide/bisacrylamide (29: 1) gels in BioRad sequencing rigs run at 25- 40 mA for 2-4 hr. The gels were stained with 0.05% ethidium bromide (EtBr) in 1X TBE and thoroughly washed with 1X TBE and distilled water to eliminate unspecifically bound EtBr. The gels were then photographed under ultra- violet light using the IS/1000 Digital Imaging System (Version 2.00, Alpha Innotech Corpo- ration, San Leandro, California) that allows di- rect estimation of PCR product size by compar- ison with DNA standards (Gibco-BRL). For the purposes of this study, each allele was identified according to the number of dinucleotides pre- sent.
DATA ANALYSES
After determining genotypes for all individuals at the four loci, we calculated heterozygosities per locus per population. The data were then an- alyzed for linkage using the Expectation-Maxi- mization algorithm (Slatkin and Excoffier 1996), and tested for their compliance with Hardy- Weinberg expectations (Excoffier and Slatkin 1995). Both tests were performed with the ge- netic analysis package Arlequin (Schneider et al. 1996). No two loci were linked; frequencies at all loci were in equilibrium. Population structure was analyzed based on Michalakis and Excoffier (1996) using the same Arlequin software. We assumed that mutations in microsatellites fol- lowed the step-wise mutation model (Ohta and Kimura 1973). We used Slatkin’s (1995) statis- tics R,, (degree of population subdivision) and its mathematically dependent Nm (number of immigrants per generation) for all pairwise com- parisons of populations. R,, and Nm between pairs of populations were examined as a func- tion of distance between sites by performing Mantel permutational tests (Mantel 1967, Schnell et al. 1985). Mann-Whitney U-tests were used to compare gene flow among migra- tory to that among sedentary populations. To evaluate the effect of the assumption of step- wise mutations implicit in Slatkin’s R,,, we cal- culated Wright’s (195 1) F,, equivalents (as de- veloped by Weir and Cockerham 1984) for all interpopulation comparisons
RESULTS
ALLELIC VARIATION AND HETEROZYGOSITY
Microsatellite genotypes were determined at four loci for 138 individuals from six sites for

COSTA RICA *sad Vito
Caesar Creek
v’
FIGURE 1. Sampling sites for migratory and sedentary House Wrens (Trogladytes spp.). The shaded area shows the breeding distribution of House Wrens on the American continents.
migratory birds, and at four loci for 116 indi- viduals from six sites for sedentary birds. Av- erage heterozygosities per population (Table 2) ranged between 0.545 and 0.758 in migratory birds, and between 0.240 and 0.609 in sedentary birds. Although recently separated as two dif- ferent species, at two of the three loci used in common (Table 3), the most common allele(s) per locus were the same or very close in size across sites in migratory and sedentary House Wrens; at the third locus there was a shift toward
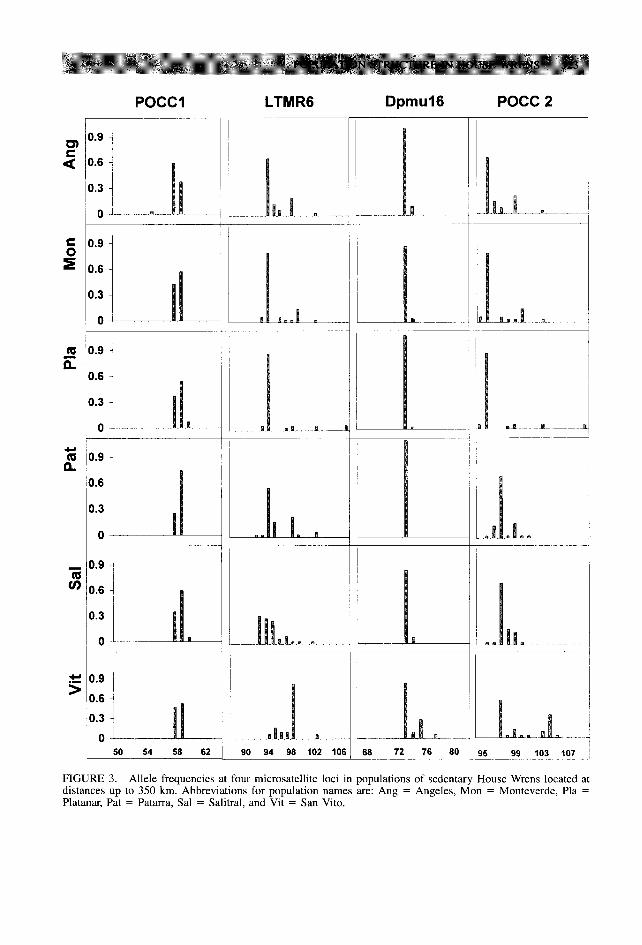
much shorter alleles in the sedentary birds. Poly- morphism was higher in the migratory birds (37 alleles compared to 29 in the sedentary birds, Fig. 2 and Fig. 3). Among the alleles that were found only in one of the forms, eight were pre- sent in the migratory birds and two in the sed- entary birds.
PRIVATE ALLELES
Among migratory birds, private alleles (those found in a single population) were present at
TABLE 1. Microsatellite loci used in this study. PCR primer sequences were generously provided by the developers.
Locus name Origin (species) Developers
POCC 1 POCC 2 LTMR 6
Dp mu 16
Fhu2
European Warbler (Phylloscopus occidentalis), family Sylvidae
Long-tailed Manakin (Chiroxiphia linearis), family Pipridae
Yellow Warbler (Dendroica petechia), family Emberizidae
Barn Swallow (Ficedula hypoleuca), family Hirundinidae
Bensch et al. (1997)
McDonald and Potts (1994)
Dawson et al. (1997)
Primmer et al. (1996)

TABLE 2. Average heterozygosities at four microsatellite loci in migratory and sedentary House Wrens. See Figure 1 for geographical location of populations.
Population POCC 1 LTMR6
LOCUS
Dpmu16 Fhu2 POCC2 Average/
population
Migratory
Mahoning Medina Ashland Delaware Alum Creek Caesar Creek Average/locus
Sedentary
Angeles Monteverde Platanar Patarra Salitral San Vito Average/locus
0.250 0.542 0.667 0.710 0.250 0.833 0.625 0.583 0.320 0.640 0.560 0.783 0.375 0.542 0.625 0.750 0.389 0.556 0.667 0.778 0.440 0.680 0.680 0.640 0.337 0.632 0.707 0.637
0.687 0.625 0.437 0.500 0.550 0.050 0.667 0.250 0.050 0.500 0.700 0.000 0.450 0.450 0.052 0.450 0.250 0.850 0.542 0.47 1 0.602
-
-
-
0.687 0.600 0.474 0.400 0.600 0.450 0.173
0.542 0.598 0.576 0.573 0.598 0.610
0.609 0.425 0.240 0.400 0.388 0.500
three of the six sampling sites, with frequencies ranging from 0.02 to 0.07 per population (four unique alleles). Three of the four private alleles were of intermediate size, whereas one was two repeats larger than all others at that locus; three of the four alleles were detected in the two pop- ulations at the geographic extremes of our sam- pling area: Mahoning and Caesar Creek.
In sedentary birds, most of the private alleles were of extreme sizes for each of the loci (Table 3), no matter their geographic location. Private alleles (a total of 11) were present at all six sites, with frequencies between 0.025 and 0.075 per population, except for allele “76” in locus Dpmu 16, which had a frequency of 0.225 in San Vito. At this southernmost site, 4 of the 11 unique alleles were detected, whereas at Ange- les, the northernmost site, 3 other alleles were found to be unique.
The presence of private alleles is an indication of limitations in gene flow between populations; their increasing number and frequency would in- dicate a sharper reduction in gene flow (Slatkin 1985a, 1985b). In a qualitative manner, the sed- entary populations of House Wrens appear much less similar to each other than the migratory populations, indicating more gene flow among the populations of migratory birds. This appears especially true for the sedentary House Wrens sampled in San Vito, where one of the private alleles occurs at a high frequency. In both the migratory and the sedentary House Wrens, pri- vate alleles were found more frequently at the extremes of our geographical sampling area.
POPULATION STRUCTURE
If migratory behavior enhances gene Ilow, we expect population subdivision to be stronger
TABLE 3. Allelic variation at four microsatellite loci. Allele sizes are given in number of dinucleotides; in the sedentary birds, private alleles are distributed among populations as follows: Angeles 3, Monteverde 0, Platanar 2, Patarra 1, Salitral 1, San Vito 4. In the migratory birds: Mahoning 1, Medina 1, and Caesar Creek 2.
Migratory birds Sedentary birds
Locus Number of
alleles Allele size
range Private alleles
Number of alleles
Allele size range
Private alleles
POCC 1 6 56-62 2 4 55-60 1 LTMR6 13 90-104 1 11 94-104 3 Dp mu 16 6 71-76 0 4 74-78 2 POCC 2 12 95-120 5 FhU2 11 61-71 1 -

POCCI LTMRG Dpmu16 FhU2
5 a
FIGURE 2. Allele frequencies at four microsatellite loci in populations of migratory House Wrens located at distances up to 350 km. Abbreviations for population names are: Mah = Mahoning, Med = Medina, Ash = Ashland, Del = Delaware, Alm = Alum, and Cae = Caesar Creek.
LTMRG Dpmul6 POCC 2 POCCI
g 0.9
= 0.6
~ 50 54 58 62 1 90 94 96 102 101 66 72 76 60 95 gg 103 107
FIGURE 3. Allele frequencies at four microsatellite loci in populations of sedentary House Wrens located at distances up to 350 km. Abbreviations for population names are: Ang = Angeles, Mon = Monteverde, Pla = Platanar, Pat = Patarra, Sal = Salitral, and Vit = San Vito.

TABLE 4. Comparison of R,, (bottom) and F,, statistics (top) in migratory House Wrens, and sedentary House Wrens. Pearson correlation coefficient between R,, and F,, in comparisons of migratory populations is 0.994 and among populations of sedentary birds is 0.984.
Ashland Delaware Mahoning Medina Alum Creek Caesar Creek
Migratory Ashland Delaware Mahoning Medina Alum Creek Caesar Creek
0.00092 0.00259 0.00625 0.00206 0.00173
0.00259 0.00227
0.00227 0.00587 0.00229 0.00091
0.00629 0.00591 0.00634
0.00631 -0.00120
0.00173
0.00206 0.00229 0.00000 0.0083 1
0.00824 0.00499 0.00385
Angeles Monteverde Platanar Patarra Salitral Sedentary
Angeles Monteverde Platanar Patarra Salitral San Vito
0.00635 0.00909 0.02082 0.02572 0.02734
0.00092
0.00639
0.01159 0.02374 0.02558 0.03004
0.00917 0.01173
-0.00027 0.01175 0.02957
0.02126 0.02640 0.02432 0.02625 0.00000 0.01189
0.00459 0.00456 0.02267 0.01461
0.00173 0.0009 1 0.00173 0.00501 0.00387
San Vito
0.028 11 0.03097 0.03047 0.02320 0.01482
(larger R,, or F,,) in sedentary compared to mi- gratory birds. We also expect a steeper positive relationship between R,, (or F,,) and distance between populations, and conversely, a steeper negative relationship between Nm and distance,
0.009
0.006
a (a)
Distance (km)
FIGURE 4. Relationship between distance and (a) population subdivision as R,,, and (b) number of im- migrants per generation as Nm in migratory House Wrens.
in sedentary compared to migratory birds. The more immigrants into a population (and the more numerous the sources of these immi- grants), the less different this population will be from the surrounding populations. We compared Nm values (which are more familiar than R,, or F,, values to present data on gene flow) between migratory and sedentary populations at less than and more than 150 km, which is the geographic midpoint of distances between our sampling ar- eas. Our expectation is that a significantly larger number of immigrants would be detected in the migratory birds, as would be expected if migra- tory behavior enhances gene flow. At less than 150 km, the difference in gene flow between mi- gratory (2 + SD: Nm = 234.27 k 190.42, n = 9) and sedentary (Nm = 70.77 ? 60.12, n = 8) populations was highly significant (Mamr-Whit- ney U = 63.0, P = 0.009). This difference also was highly significant among populations locat- ed between 150 and 300 km apart (migratory: Nm = 295.90 ? 262.89, n = 6, sedentary: Nm = 21.16 k 6.16, n = 7; Mann-Whitney U = 42.0, P = 0.003).
Migratory House Wrens. R,, values showed a positive direct correlation to F,, values (Table 4) for each of the comparisons between populations for migratory birds (Pearson r = 0.994; 15 pop- ulation pairs). We found no relationship between distance and degree of population subdivision (Mantel r = -0.334, P = 0.142) at distances as far as 350 km between sites (Fig. 4a). Notice that, contrary to our expectations, population
(a)
0
300 1 (W
0 100 200 300 400
Distance (km)
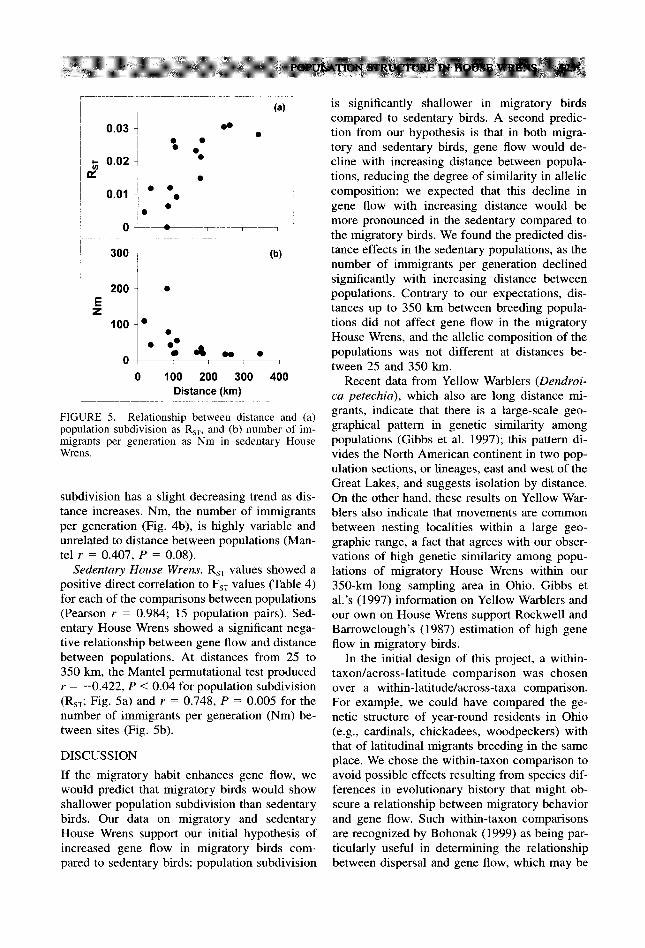
FIGURE 5. Relationship between distance and (a) population subdivision as R,,, and (b) number of im- migrants per generation as Nm in sedentary House Wrens.
subdivision has a slight decreasing trend as dis- tance increases. Nm, the number of immigrants per generation (Fig. 4b), is highly variable and unrelated to distance between populations (Man- tel r = 0.407, P = 0.08).
Sedentary House Wrens. R,, values showed a positive direct correlation to F,, values (Table 4) for each of the comparisons between populations (Pearson r = 0.984; 15 population pairs). Sed- entary House Wrens showed a significant nega- tive relationship between gene Ilow and distance between populations. At distances from 25 to 350 km, the Mantel permutational test produced r = -0.422, P < 0.04 for population subdivision (R,,; Fig. 5a) and r = 0.748, P = 0.005 for the number of immigrants per generation (Nm) be- tween sites (Fig. 5b).
DISCUSSION
If the migratory habit enhances gene flow, we would predict that migratory birds would show shallower population subdivision than sedentary birds. Our data on migratory and sedentary House Wrens support our initial hypothesis of increased gene flow in migratory birds com- pared to sedentary birds: population subdivision
is significantly shallower in migratory birds compared to sedentary birds. A second predic- tion from our hypothesis is that in both migra- tory and sedentary birds, gene flow would de- cline with increasing distance between popula- tions, reducing the degree of similarity in allelic composition; we expected that this decline in gene flow with increasing distance would be more pronounced in the sedentary compared to the migratory birds. We found the predicted dis- tance effects in the sedentary populations, as the number of immigrants per generation declined significantly with increasing distance between populations. Contrary to our expectations, dis- tances up to 350 km between breeding popula- tions did not affect gene flow in the migratory House Wrens, and the allelic composition of the populations was not different at distances be- tween 25 and 350 km.
Recent data from Yellow Warblers (Dendroi- ca petechia), which also are long distance mi- grants, indicate that there is a large-scale geo- graphical pattern in genetic similarity among populations (Gibbs et al. 1997); this pattern di- vides the North American continent in two pop- ulation sections, or lineages, east and west of the Great Lakes, and suggests isolation by distance. On the other hand, these results on Yellow War- blers also indicate that movements are common between nesting localities within a large geo- graphic range, a fact that agrees with our obser- vations of high genetic similarity among popu- lations of migratory House Wrens within our 350~km long sampling area in Ohio. Gibbs et al.‘s (1997) information on Yellow Warblers and our own on House Wrens support Rockwell and Barrowclough’s (1987) estimation of high gene flow in migratory birds.
In the initial design of this project, a within- taxon/across-latitude comparison was chosen over a within-latitude/across-taxa comparison. For example, we could have compared the ge- netic structure of year-round residents in Ohio (e.g., cardinals, chickadees, woodpeckers) with that of latitudinal migrants breeding in the same place. We chose the within-taxon comparison to avoid possible effects resulting from species dif- ferences in evolutionary history that might ob- scure a relationship between migratory behavior and gene how. Such within-taxon comparisons are recognized by Bohonak (1999) as being par- ticularly useful in determining the relationship between dispersal and gene flow, which may be

obscured by historical events (Boileau et al. 1992, Pogson et al. 1995). In comparisons be- tween species that are phylogenetically and eco- logically similar, those with life history or hab- itat characteristics that indicate reduced dispersal should show a higher value of F,, and a larger number of private alleles, which should be neg- atively correlated with dispersal and gene flow (Colgan and Ponder 1994). Our results for these measures of gene flow agree with the expecta- tions of reduced dispersal in sedentary House Wrens compared to migratory House Wrens. We do not know the significance of the skewed dis- tribution of private alleles toward peripheral populations among both migratory and seden- tary populations of House Wrens. We speculate that such a result could be due to undetected natural discontinuities in the birds’ distributions, or an artifact produced by our sampling scheme (following Colgan and Ponder 1994).
Our present approach allows us to consider other factors affecting the degree of gene flow and population subdivision in both migratory and sedentary birds. A separate data set in which we analyzed population structure in migratory and sedentary Grasshopper Sparrows Ammodra- mus savannarum (Arguedas et al., unpubl. data), suggests that the characteristics of the optimal breeding habitat may also affect the patterns of gene flow among populations. Temporally or spatially unstable habitats would be occupied by species with high dispersal tendencies, as this trait would facilitate the search for such ephem- eral, optimal habitat. This relationship between habitat stability and dispersal has been analyzed by McPeek and Holt (1992) and more recently by Paradis (1998). In their models, higher dis- persal ability should be maintained in organisms inhabiting spatially and temporally unstable en- vironments. The loss of dispersal ability should be more pronounced in organisms preferring spatially more continuous environments, or en- vironments that are temporally more stable. The habitat of the sedentary House Wren is not only relatively stable, but it also is common and widespread (Skutch 1960, Stiles and Skutch 1989). Sedentary House Wrens would not need to move long distances to find appropriate hab- itat. In the event of local disturbance to a patch of breeding habitat, adequate replacement habi- tat is usually found nearby. This results in re- duced dispersal as distance between populations increases. During the breeding season, the hab-
itat of migratory House Wrens is just as com- mon and widespread as that of the sedentary birds (Bent 1964). For this reason, habitat char- acteristics could not account for the high levels of gene flow observed in the migratory birds.
High levels of gene flow might also be char- acteristic of other migratory species. Most mi- gratory passerines start their southbound move- ment soon after fledging, often in a wandering, random path that allows the temporary occupa- tion of different sites throughout the season. If site fixation occurs, it might occur at any of those sites, compelling the birds to nest in areas different from their natal site. But even if fixa- tion does not occur, this post-fledging dispersal behavior may familiarize the birds with several sites, from which they might be able to choose for breeding as they return from their wintering grounds (Gauthreaux 1980). Such pre-migratory dispersal behavior, together with low levels of natal or breeding philopatry, would result in ex- tensive mixing of populations. As our observa- tions indicate, erosion of genetic diversity due to population isolation should not be a cause for concern in migratory House Wrens. This may also be the case for other migratory passerines that breed in temporally and spatially stable hab- itats.
ACKNOWLEDGMENTS
We thank all institutions and individuals in Ohio and Costa Rica who facilitated completion of the field work. We thank S. Bensch, H. Ellegren, L. Gibbs, D. McDonald, and W. Potts for sharing their microsatellite primers with us. A special thanks to the Parker Lab for all their encouragement and help. Our thanks also to J. Walters and three anonymous reviewers for their valuable suggestions. Financial support was provided by Sigma Xi Research Fund, Chapman Fund, Office of International Education at The Ohio State Univer- sity, Graduate School Alumni Association at The Ohio State University, and the Parker Lab.
LITERATURE CITED
BARROWCLOUGH, G. E 1980. Gene flow, effective pop- ulation sizes, and genetic variance components in birds. Evolution 34:789-798.
BEISSINGER, S. R., S. TYGIELSKI, AND B. ELDERD. 1998. Social constraints on the onset of incubation in a Neotropical parrot: a nestbox addition experiment. Anim. Behav. 55:21-32.
BENSCH, S., T. PRICE, AND J. KOHN. 1997. Isolation and characterization of microsatellite loci in a Phyl- Zoscopus warbler. Mol. Ecol. 6:91-92.
BENT, A. C. 1964. Life histories of North American birds. Nuthatches, wrens, thrashers, and their al- lies. Dover, New York.
BOHNING-GAESE, K., L. I. GONZALEZ-GUZMAN, AND J. H. BROWN. 1998. Constraints on dispersal and the evolution of the avifauna of the Northern Hemi- sphere. Evol. Ecol. 12:767-783.
BOHONAK, A. J. 1999. Dispersal, gene flow, and pop- ulation structure. Quart. Rev. Biol. 74:21-45.
BOILEAU, M. G., P. D. N. HEBERT, AND S. S. SCHWARTZ. 1992. Non-equilibrium gene frequency diver- gence: persistent founder effects in natural popu- lations. J. Evol. Biol. 5:25-39.
BOULINIER, T, J. D. NICHOLS, J. E. HINES, J. R. SAUER, C. H. FLATHER, AND K. H. POLLOCK. 1998. Higher temporal variability of forest breeding bird com- munities in fragmented landscapes. Proc. Natl. Acad. Sci. 95:7497-7501.
BRAWN, J. D., AND S. K. ROBINSON. 1996. Source-sink population dynamics may complicate the interpre- tation of long-term census data. Ecology 77:3-12.
BRUMFIELD, R. T., AND A. P CAPPARELLA. 1996. Ge- netic differentiation and taxonomy in the House Wren species group. Condor 98:547-556.
COLGAN, D. J., AND W. E PONDER. 1994. The evolu- tionary consequences of restrictions on gene flow--examples from hydrobiid snails. Nautilus 108:25-43.
EARNST, S. L., AND B. A. ANDRES. 1995. Population trends of breeding birds in Ohio. Ohio Biological Survey, Misc. Contrib. No. 3. Ohio Biological Survey, The Ohio State Univ., Columbus, OH.
ELLEGREN, H. 1991. Polymerase chain reaction (PCR) analysis of microsatellites-a new approach to studies of genetic relationships in birds. Auk 109: 886-895.
EXCOFFIER, L., AND M. SLATKIN. 1995. Maximum-like- lihood estimation of molecular haplotype frequen- cies in a diploid population. Mol. Biol. Evol. 12: 921-927.
FLATHER, C. H., AND J. R. SAUER. 1996. Using land- scape ecology to test hypotheses about large-scale abundance patterns in migratory birds. Ecology 77:28-35.
FRANKHAM, R. 1996. Relationship of genetic variation to population size in wildlife. Conserv. Biol. 10: 1.500-1508.
FRIES, T H., AND G. H. RODDA. 1998. The role of introduced species in the degradation of island ecosystems: a case history of Guam. Annu. Rev. Ecol. Syst. 29: 113-140.
GAUTHREAUX, S. A., JR. 1980. The ecology and evo- lution of avian migration systems. Avian Biol. 6: 126-146.
GIBBS, H. L., R. J. G. DAWSON, AND K. A. HOBSON. 1997. Population structure on a continental scale in a Neotropical migrant bird, the Yellow Warbler, based on microsatellite DNA markers. One Hun- dred and Fifteenth Stated Meeting of the Ameri- can Ornithologists’ Union, Minneapolis-St. Paul, MN.
GLADDEN, J. G. B., M. M. FERGUSON, M. K. FRIESEN, AND J. W. CLAYTON. 1999. Population structure of North American beluga whales (Delphinaptenrs leucas) based on nuclear DNA microsatellite var- iation and contrasted with the population structure
revealed by mitochondrial DNA variation. Mol. Ecol. 8:347-363.
HAGAN, J. M., III, AND D. W. JOHNSTON [EDS.]. 1992. Ecology and conservation of Neotropical migrant landbirds. Smithson. Inst. Press, Washington, DC.
HAGAN, J. M., III, T L. LLOYD-EVANS, J. L. ATWOOD, AND D. S. WOOD. 1992. Long-term changes in mi- gratory land birds in the northeastern United States: evidence from migration capture data, p. 115-130. In J. M. Hagan III and D. W. Johnston [EDS.], Ecology and conservation of Neotropical migrant landbirds. Smithson. Inst. Press, Washing- ton, DC.
HANNON, S. J., AND S. E. COTTERILL. 1998. Nest pre- dation in aspen woodlots in an agricultural area in Alberta: the enemy from within. Auk 115:16-25.
JAMES, E C., C. E. MCCULLOGH, AND D. A. WEIDEN- FELD. 1996. New approaches to the analysis of population trends in land birds. Ecology 77:13- 27.
LONGMIRE, J. L., A. K. LEWIS, N. C. BROWN, J. M. BUCKINGHAM, L. M. CLARK, M. D. JONES, L. J. MEINCKE, J. MEYNE, R. L. RATLIFF, E A. RAY, R. P. WAGNER, AND R. K. MOYZIS. 1988. Isolation and characterization of a highly polymorphic cen- tromeric tandem repeat in the Family Falconidae. Genomics 2: 14-24.
MANTEL, N. 1967. The detection of disease clustering and a generalized regression approach. Cancer Res. 27:209-220.
MCDONALD, D. B., AND W. K. POTTS. 1994. Coopera- tive display and relatedness among males in a lek- mating bird. Science 266:1030-1032.
MCPEEK, M. A., AND R. D. HOLT. 1992. The evolution of dispersal in spatially and temporally varying environments. Am. Nat. 140:1010-1027.
MICHALAKIS, Y., AND L. EXCOFFIER. 1996. A generic estimation of population subdivision using dis- tances between alleles with special reference for microsatellite loci. Genetics 142: 1061-1064.
OHTA, ‘I?, AND M. KIMURA. 1973. A model of mutation appropriate to estimate the number of electropho- retically detectable alleles in a finite population. Genet. Res. 22:201-204.
PARADIS, E. 1998. Interactions between spatial and temporal scales in the evolution of dispersal rate. Evol. Ecol. 12:235-244.
POGSON, G. H., K. A. MESA, AND R. G. BOUTILIER. 1995. Genetic population structure and gene flow in the Atlantic cod Gadus morhua: a comparison of allozyme and nuclear RFLP loci. Genetics 139: 375-385.
PRIBIL, S., AND J. PICMAN. 1997. Parasitism of House Wren nests by Brown-headed Cowbirds: why is it so rare? Can. J. Zool. 75:302-307.
PRIMMER, C. R., A. l? MOLLER, AND H. ELLEGREN. 1996. A wide-range survey of cross-species mi- crosatellite amplification in birds. Mol. Ecol. 5: 365-378.
PURCELL, K. L., J. VERNER, AND L. W. ORING. 1997. A comparison of the breeding ecology of birds nest- ing in boxes and tree cavities. Auk 114:64&656.
QUELLER, D., J. E. STRASSMANN, AND C. R. HUGHES.

1993. Microsatellites and kinship. Trends Ecol. Evol. 8: 1-8.
RIDGELY, R. S., AND G. TUDOR. 1989. The birds of South America. Vol. I-The oscine passerines. Univ. Texas Press, Austin, TX.
ROCKWELL. R. E. AND G. E BARROWCLOUGH. 1987. Gene ‘flow and the genetic structure of popula- tions, p. 223-255. In E Cooke and P A. Buckley [EDS.], Avian genetics, a population and ecological approach. Academic Press, San Diego, CA.
RUSSELL, G. J., T M. BROOKS, M. M. MCKINNEY, AND C. G. ANDERSON. Present and future taxonomic selectivity in bird and mammal extinctions. Con- serv. Biol. 12:1365-1376.
SANCHEZ-AZOFEIFA, G. A., C. QUESADA-MATEO, l? GONZALEZ-QUESADA, S. DAYANANDAN, AND K. S. BAWA. 1999. Protected areas and conservation of biodiversity in the tropics. Conserv. Biol. 13:407- 411.
SCHNEIDER, S., J.-M. KUEFFER, D. ROESSLI, AND L. Ex- COFFIER. 1996. Arlequin, a software package for population genetics. Genetics and Biometry Lab- oratory, Dept. Anthropology, Univ. Geneva, Ge- neva.
SCHNELL, G. D., D. J. WATT, AND M. E. DOUGLAS. 1985. Statistical comparison of proximity matri- ces: applications in animal behaviour. Anim. Be- hav. 33:239-253.
SKUTCH, A. 1960. Life histories of Central American birds. II. Families Vireonidae, Sylviidae, Turdidae, Troglodytidae, Paridae, Corvidae, Hirundinidae and Tyrannidae. Pacific Coast Avifauna 34:155- 158.
SLATKIN, M. 1985a. Gene flow in natural populations. Annu. Rev. Ecol. Syst. 16:393-430.
SLATKIN, M. 1985b. Rare alleles as indicators of gene flow. Evolution 39:53-65.
SLATKIN, M. 1995. A measure of population subdivi-
sion based on microsatellite allele frequencies. Genetics 139:457-462.
SLATKIN, M., AND N. H. BARTON. 1989. A comparison of three indirect methods for estimating average levels of gene flow. Evolution 43:1349-1368.
SLATKIN, M., AND L. EXCOFFIER. 1996. Testing for link- age disequilibrium in genotypic data using the Ex- nectation-Maximization algorithm. Hereditv 76: 377-383.
,
STILES, E G., AND A. SKUTCH. 1989. A guide to the birds of Costa Rica. Cornell Univ. Press, Ithaca, NY.
SUTHERLAND, W. J. 1998. The effect of local change in habitat quality on populations of migratory birds. J. Appl. Ecol. 35:418-421.
TAUTZ, D. 1989. Hypervariability of simple sequences as a general source for polymorphic DNA mark- ers. Nucleic Acids Res. 17:6463-6471.
TEWKSBURY, J. J., AND T. E. MARTIN. 1998. Breeding productivity does not decline with increasing frag- mentation in a western landscape. Ecology 79: 2890-2903.
VAN TREUREN, R., R. BIJLSMA, J. M. TINBERGEN, D. HEG, AND L. VAN DE ZANDE. 1999. Genetic anal- vsis of the oooulation structure of sociallv orga- hized oyste&aichers (Haematopus ostralegus) ;s- inp microsatellites. Mol. Ecol. 8: 181-187.
WEIR, 5. S., AND C. C. COCKERHAM. 1984. Estimating F-statistics for the analysis of population structure. Evol. 38:1358-1370.
WENBURG, J. K., P BENTZEN, AND C. J. FOOTE. 1998. Microsatellite analvsis of genetic population struc- ture in an endangered saimonid:- tLe coastal cut- throat trout (Oncorhvnchus clarki clarki). Mol. Ecol. 7:733-749. -
WHITE, D. W.. AND E. D. KENNEDY. 1997. Effect of egg covering and habitat on nest destruction by House Wrens. Condor 99:873-879.
WRIGHT, S. 195 1. The genetical structure of popula- tions. Ann. Eugenics 15:323-354.