seasonal variations in saturn's plasma between the...
TRANSCRIPT

Seasonal variations in Saturn’s plasma between the main ringsand Enceladus
M. K. Elrod,1 W.-L. Tseng,1 R. J. Wilson,2 and R. E. Johnson1
Received 4 November 2011; revised 3 January 2012; accepted 6 January 2012; published 8 March 2012.
[1] With the discovery by the Cassini spacecraft of an oxygen atmosphere over Saturn’smain rings, and a strong source of water products from the plumes of Saturn’s moonEnceladus, our picture of the physics of Saturn’s magnetosphere from the main rings toinside the orbit of Enceladus has changed dramatically. This region contains oxygen ionsfrom the ring atmosphere and water-group ions from the Enceladus torus. The purposeof this study is to examine ion densities, temperatures, and composition from severalequatorial periapsis passes from 2004 to 2010 for the region from 2.4 to 3.5 Saturn radii(�60,300 km) in addition to Voyager 2 in order to separate contributions from Saturn’s ringatmosphere from the water products in the Enceladus torus and to describe the temporalvariations in the plasma. Because of the high background due to so-called penetratingradiation in this region, only six orbits are used in this study. Our analysis indicates thatlarge variations in ion density, temperature, and composition occurred between the Voyager2 flyby, 2004, and 2010. Although the Enceladus plumes may be variable, we proposethat the large change in the ion density from 2004 to equinox near 2010 is due to theseasonal variation in the ring atmosphere. Our interpretation of the plasma data is supportedby a simple photochemical model, combining the water products from Enceladus and theseasonal variations in the ring atmosphere.
Citation: Elrod, M. K., W.-L. Tseng, R. J. Wilson, and R. E. Johnson (2012), Seasonal variations in Saturn’s plasma between themain rings and Enceladus, J. Geophys. Res., 117, A03207, doi:10.1029/2011JA017332.
1. Introduction
[2] Since Cassini’s arrival at Saturn, there have been twodiscoveries affecting the plasma properties between the edgeof the main rings at about 2.4 Rs (1 Rs = 1 Saturn Radius�60,300 km) to approximately 3.5 Rs, between the orbitsof the moons Mimas and Enceladus, that have not beenexplored. The first was a strong O+ and O2
+ ion signal dis-covered by the Cassini Plasma Spectrometer (CAPS) indi-cating the presence of an oxygen atmosphere over the mainrings [Tokar et al., 2005; Johnson et al., 2006a, 2006b]. Thisoxygen ‘ring atmosphere’ was shown to be one source forthe oxygen observed in the upper atmosphere of Saturn[Luhmann et al., 2006;Moses et al., 2000] and for the oxygenneutrals scattered into the inner magnetosphere where theycan be ionized and contribute to Saturn’s plasma [Tsenget al., 2010; Martens et al., 2008; Johnson et al., 2006a,2006b; Bouhram et al., 2006; Luhmann et al., 2006]. Thesecond discovery is the observation of the water plumesemanating from Enceladus’ southern polar region [e.g.,Porco et al., 2006]. These plumes are a significant sourcethroughout the magnetosphere for water-group neutrals (O,OH, and H2O) and ions (O+, OH+, H2O
+, and H3O+), which
we refer to as W and W+ in the following. Farmer andGoldrich [2007] and Cassidy and Johnson [2010] showedthat the neutrals from the plumes have a broad distributionof predominately O and OH throughout the magnetosphere(including the region of interest), and Smith et al. [2010]showed that these plume source rates could vary by at leasta factor of four although such variability has not beenobserved in the UV plume occultation data [Hansen et al.,2008].[3] The photo-produced ring atmosphere was predicted to
vary seasonally since the source rate of the neutrals dependson the incident angle of the solar radiation on the rings [Tsenget al., 2010] and on ring particle temperatures. Because theextended ring atmosphere is a source of ions for this region,examination of plasma data from 2004, when the Sun wasnear southern solstice, and later as the incident angledecreases toward equinox (August 2009), could reflect thechanging source rate (see Table 1). Although the Enceladussource rate might also be variable [Smith et al., 2010;Hansenet al., 2008], it has no known seasonal dependence. How-ever, water products from Enceladus deposited on the par-ticles in the A, F, and G rings are a secondary source of Wand oxygen neutrals. As the water-group neutrals impact withthe icy ring particles, they can then form new neutrals andions, creating a feedback process [Tseng et al., 2011; Tsengand Ip, 2011]. In this study we examine the plasma density,temperature, and composition detected by the CAPS andVoyager 2 plasma instruments (see Table 1). As a result wediscovered a significant drop in the density and temperatures
1Department of Material Science and Engineering, University ofVirginia, Charlottesville, Virginia, USA.
2LASP, University of Colorado at Boulder, Boulder, Colorado, USA.
Copyright 2012 by the American Geophysical Union.0148-0227/12/2011JA017332
JOURNAL OF GEOPHYSICAL RESEARCH, VOL. 117, A03207, doi:10.1029/2011JA017332, 2012
A03207 1 of 16

of the ions measured between the solstice and equinox data,confirming that the plasma has varied seasonally as we dis-cussed earlier [Elrod et al., 2010]. The composition variessuch that there is a dominant O2
+ peak at SOI but water-groupion peak tends to dominate on later passes. We first describethe instrument and our analysis techniques, then describe theresulting plasma properties, and finally discuss the resultsusing a simple chemical model of the plasma.
2. CAPS Data
2.1. Instrument and Orbits
[4] The CAPS instrument on Cassini is primarily respon-sible for the detection and measurement of thermal plasmaions and electrons trapped in Saturn’s magnetosphere. CAPSis equipped with an Electron Spectrometer (ELS) and an IonMass Spectrometer (IMS), which can utilize a Singles (SNG)mode of ion detection as well as a time-of-flight mode. Thisstudy uses the SNG capability of the IMS, which creates asingle count for each ion that enters the IMS sensor andgenerates a start signal (irrespective of whether it creates astop signal in the time-of-flight). The ion results are com-pared to the total electron densities and temperatures from theELS and from Radio and Plasma Wave Science (RPWS), aseparate Cassini instrument (G. R. Lewis, ELS moments,private communication, 2010; A. M. Persoon, RPWS densi-ties, private communication, 2010). The SNG function of theCAPS instrument can, in principle, be used to determine thetemperatures, densities, and plasma flow velocity of variousion species if the ion mass and charge are known.[5] Since Cassini first entered into orbit in 2004, there have
been few passes with a periapsis lower than 3.5 Rs. In thisregion, which is relatively close to Saturn, there is a very highenergy radiation flux producing a significant background inthe CAPS instrument [Young et al., 2004] as well as signifi-cant interference in other Cassini instruments. As a result, itis also important for CAPS to be pointing nearly into theplasma flow direction in order for the signal-to-noise ratio tobe sufficiently high for our analysis. This requirement redu-ces the number of passes in this study (up to 2010) that meetthese criteria to only six. The Saturn Orbit Insertion (SOI)pass had the closest periapsis, passing directly over the mainrings and crossing between the F and G rings. This pass wasunique among the six passes in that the CAPS instrument wasnot actuating, and, due to thrusters being fired just prior to theinstrument turning on, the instrument settings were slightly
different from normal (see section 4.1). The orbits for all thedata used for this study are shown in Figure 1. In addition,Table 1 gives the axial tilt of the ring plane to the solarecliptic plane for each of the orbital passes as this determinesthe seasonal variability in the ring atmosphere.
2.2. Penetrating Radiation
[6] Penetrating radiation is observed when Cassini is nearSaturn and is measured by CAPS as a broad backgroundacross all energy channels [Young et al., 2004]. It becomesa significant factor for the IMS and ELS detectors inside of4 Rs and extends as far as 6 Rs. Figure 2 shows several fullcolor spectra from this region both before and after correctionfor the background.[7] Due to limitations in bandwidth, an onboard 2-byte
to 1-byte compression scheme of measured counts occurs,resulting in the CAPS detector quantizing counts above acertain level (63 counts). The count level increases in ‘jumps’as the number of counts increases. Therefore, as the back-ground levels increase due to penetrating radiation, this effectmoves from a linear regime (0–63 counts) to higher jumpsand becomes more pronounced. When there is a strong signaland the spectrum is well above the background, these jumpsare small compared to the signal. However, for weaker sig-nals as CAPS actuates out of the plasma flow, these jumpshave a larger effect on the analysis. Inside of approximately5.5 Rs the background levels rise to a point where it becomescritical for the instrument to have sufficient pointing into theplasma flow direction in order to detect the plasma signal:only then is it possible to have a good signal-to-noise ratioabove the background.[8] Figure 3 shows some sample spectra from this region
with good signal above the background. Table 2 shows theaverage background levels from spectra for SOI, 2005, 2007,and 2010 from the data used for this region. For comparison,a test case from outside this region was also examined from12 October 2005. This data set was used by Wilson et al.[2008, 2009] to determine ion density, temperature, andvelocities in the magnetosphere. We refer to this data set as‘typical’ in terms of background, maximum counts, and peakwidth for regions outside of Enceladus. While the maximumcounts are still close to the same levels from the test case toall other sets, Table 2 shows that the data sets inside of 4 Rsall have backgrounds that are approximately an order ofmagnitude higher than the test case but within a factor offour of each other with SOI exhibiting the highest levels.
Table 1. Orbital Data, Times, Axial Tilt, Solar Activity Level, and Ring Temperaturesa
Date (DOY)Time (Spacecraft)
(A-Cycles)bSubsolarAngle
Solar ActivityLevel
Approximate RingTemperature
SOI—1 Jul 2004 (183)b 04:15–04:44 (479–532) �24°S (solstice) average �100 K5 Sep 2005 (284) 10:19–11:04 (963–1047) �14°S low �75 K11 Jun 2007 (162) 22:30–0:00 (2521–2686) �8°S low �65 K27 and 28 Jun 2007 (178/179) 22:22–02:09 (2511–2700, 1–235) �8°S low �60 K3 Mar 2010 (062) 07:19–08:30 (823–957) �5°S (equinox) low �60 K19 Mar 2010 (170) 04:08–5:44 (465–644) �5°S low �60 KVoyager 2 (1982) ring plane crossing data �6°N (equinox) high not measured
aSolar activity levels found from the web site of the Virtual Solar Observatory, UCAR, Boulder, Colorado. Approximate ring temperatures derived fromCIRS temperatures [Spilker et al., 2010]. Axial tilt angle determined based on determinations of equinox and Saturn’s orbital period. Solar activity isreturning back to normal during 2011. Voyager 2 data: Richardson [1986]. SOI settings on CAPS slightly different for this pass due to thrusters firing.
bAn A-cycle is the 32 s instrument collection cycle. Time is the start time of the A-cycle in seconds from J2000 (barycentric dynamic time) converted into areadable format of HH:MM:SS.
ELROD ET AL.: SEASONAL VARIATIONS IN SATURN’S PLASMA A03207A03207
2 of 16

[9] Figure 3 has examples of energy spectra from the datasets used in this study. We assume in analyzing the singlesdata that if the ions are moving at the same velocity, then thepositions of the peaks in the energy spectra in flowing plasmacan be related to the ion masses and the widths to the tem-perature through the ion energy. The SOI spectra are not onlywider but also have a higher maximum than the other spectra.Since the width and height of the peak are determined bytemperature, flow velocity, and density of the ions, havinga wider and higher peak implies higher temperature anddensity (assuming they have nearly the same flow velocity).Flow velocity is a function of position in the magnetosphere,so that the peak width variations seen here are more likelycaused by variations in the ion temperature and density.All of these spectra exhibit a broad single main peak andtypically a secondary peak suggesting a second species. Thelight ion peaks for H+ and H2
+ are, for the most part, lost tothe background noise and count quantization effects for thespectra inside of 4 Rs.
3. Spectral Analysis
[10] CAPS singles data are obtained each time an ionenters the IMS sensor and passes through the carbon foil atthe exit of the electrostatic analyzer, generating electrons that
then produce a single count. The potential of the electrostaticanalyzer is varied from�5.2 to 0 kV over 63 bins with bin 64as a fly back bin to reset the voltage to the top level [Younget al., 2004]. It takes 4 s to sweep through all 64 bins.An A-cycle is defined as 8 of these sweeps (totaling 32 s).The actuator, designed to rotate the device around the mainspacecraft axis, can cycle through�184° and back in�14 A-cycles (448 s). At different times, depending on the telemetrymodes and data relay rates, the sweeps are summed uponboard the spacecraft within the A-cycle differently. Forconsistency, in determining the plasma parameters, thesweeps will be summed to the A-cycle level. The spectrumobtained from the anode pointing closest to the plasmacorotation direction, i.e., the anode with the most countsof the 8 anodes per A-cycle, is selected for each A-cycle.[11] Once the raw data is set up in A-cycle resolution, the
next step in our process is to correct for instrumental cross-talk with all 8 anodes before selecting the prime pointinganode. In our fitting method, rather than subtracting thebackground from the data and then fitting the spectra, wehave treated the background as a fit parameter, i.e., a constantterm in the fit formula shown in equation (1) below.[12] The spectra are then fitted in a least squares nonlinear
regression algorithm to determine the ion plasma parameters:density, temperature, and plasma flow velocity. The counts
Figure 1. Projection onto the R-Z plane of the orbital paths for CAPS data considered here: R is theradial distance from Saturn in the equatorial pane and Z is perpendicular to the plane, both given in termsof Saturn radii, Rs.
ELROD ET AL.: SEASONAL VARIATIONS IN SATURN’S PLASMA A03207A03207
3 of 16

accumulated per A-cycle per anode in each spectrum arefitted to the phase space using:
Counts Eð Þ ¼ BKGDþ Siondt ∗ GE ∗ Eff ion;Eð Þ∗ VE ionð Þð Þ4 ∗ f ion;Eð Þ ð1Þ
The parameters in equation (1) are the time interval ofaccumulation [dt], the geometric factor of the instrument[GE], and the efficiency of the ion detection [Eff (ion)],the background [BKGD], and the speed of the ion enteringthe detector [VE]. We assume the distribution function[ f(ion, E)], is a Maxwellian energy distribution of the form:
f ion;Eð Þ ¼ ni ∗mi
2pkTi
� �3=2
∗ exp �mi VE � Uð Þ22kTi
" #: ð2Þ
[13] The parameters in equation (2) are ion density, ni,temperature, Ti, and plasma flow velocity U, which includesthe spacecraft velocity as part of the fit parameter U, alongwith the BKGD in equation (1) and the Boltzmann constant kall in cgs units. This leads to the six fit parameters (TO+, TO2+,nO+, nO2+, U, and BKGD). Generally, the ions that enterthe electrostatic analyzer are singly charged [Young et al.,2004], making the mass-per-charge ratio be the mass ofthe ion detected. The energy spectrum is a measure of theion masses, their temperatures, and the flow velocity. The
velocity of the ion entering the detector is determined by the
energy: VE =ffiffiffiffiffiffiffiffiffiffiffiffi2E=mi
q(assuming a spacecraft potential of
zero). The function used to fit the SNG data for the counts/accumulation versus energy bin in each sweep in Figure 2is a sum of the fit equations for each species versus energy,with the sum representing the fit to the data.[14] Because of the number of fit parameters, the fitting
program does not necessarily give a unique solution. There-fore, the fit parameters are given an initial set of values thatare reasonably close to the expected output values. Theplasma flow velocities are typically close to the corotationspeed Vco = Rwwhere R is the radial distance from the centerof Saturn and w is the rotational velocity of the magneticfield. Therefore, the initial guess for the plasma flow velocityis U0 � (Vco � Vphi_sc) in equation (2), where Vphi_sc is thecomponent of the spacecraft velocity in the phi or co-rotationdirection. The temperatures of fresh ions are also assumedto be close to the ‘pick-up’ energy, giving an initial guesskT0 � 1
2= mi(Vco � Vorb)2 where Vorb is the Keplerian orbital
velocity. The ion densities are given small initial values. Theinitial background values are equal to the minimum value ofcounts for each spectrum.[15] The fitting algorithm is run through successive
iterations to minimize the least squares difference betweenthe model and the data until it converges to a minimumsolution. The following conditions determine convergence
Figure 2. Spectra for, from left to right, SOI, 27 June 2007, and 11 June 2007 both with (top) backgroundand (bottom) corrected for background. The ‘jump’ in background level in the 27 Jun 2007 images is due toa change in the telemetry mode rather than a change in the plasma environment. It is clear from these imagesthat unless the spacecraft has good pointing with the plasma, the peaks get lost to this intense background.Color bars are log10 counts/s, x axis is position (Rs), and y axis is log10 energy (eV).
ELROD ET AL.: SEASONAL VARIATIONS IN SATURN’S PLASMA A03207A03207
4 of 16

or termination of the fitting algorithm for a given spectrum:(1) The least squares difference between the data and themodel falls below the preset tolerance of 1 � 10�7 betweeniterations. (2) The maximum number of iterations of 1000has been exceeded. (3) The change in the fit parameters
between each iteration is less than the preset tolerance of 1�10�7.[16] If any one of these criteria is met, the fitting routine is
terminated and the results are returned. If the maximumnumber of iterations is hit or the peak fits are not good, then
Figure 3. Individual slices of counts/accumulation versus energy from SOI, 2005, 2007, and 2010. Theseslices show the individual background of the each set where background is added to the curves as a constantfit parameter. The blue line is the actual data, the black show the model fit of the sum of the two ion speciesfit of O2
+ and W+ ions, the green line is the contribution of the W+ ion (16 amu) and the red line is the con-tribution of O2
+ ion (32 amu). x axis is in Log10 energy (eV) and y axis is counts/accumulation.
Table 2. Comparison of Maximum Counts, Backgrounds, and Signal-to-Noise Ratio of the Data Sets Used for This Studya
Data SetMaximumCounts
Background Level(Amplitude)
PeakWidth
Signal/Noise =(Maximum – Background)/Background
Step Size at Maximum(Counts)
Test case (Rs = 6.3) 3625 45 (linear) 543 80.5 �116Average SOI 19629 803 (+15/�20) 117 33.5 �620Average 2005 248 2856 381 (+1/�11) 82 7.61 �92Average 2007 162 4917 201 (+2/�5) 76 25.7 �155Average 2007 178 4253 503 (+6/�10) 81 13.5 �136Average 2007 179 1778 214 (+2/�5) 22 8.56 �56Average 2010 062 2265 207 (+2/�4) 57 11.2 �73Average 2010 170 3339 255 (+6/�2) 74 12.9 �106
aComparison of maximum counts, background, peak width and signal-to-noise ratio of the data sets used for this study. Test case is from 12 October 2005used byWilson et al. [2008, 2009] for production of plasma moments. Peak width determined by full width half maximum of the peak of the maximum anodeof the data analyzed. Signal to noise is the ratio of the maximum counts to background. Background is determined as a fit parameter as described in the datafitting section. Since the background is a fit parameter, the numbers in parentheses show the minimum step size for background around the calculated values.
ELROD ET AL.: SEASONAL VARIATIONS IN SATURN’S PLASMA A03207A03207
5 of 16

the spectral fits are re-run with adjusted initial parameters.In addition we test the energy difference between the W+ andO2+ peaks to ensure it is close to a factor of two consistent with
the mass difference between these two ions.[17] Figure 3 shows examples of selected peaks with the
Maxwellian model fits to the data assuming only W+ and O2+
ions are present. Appendix A includes additional tests doneto verify the validity of the ion identification and the fitresults. There we discuss comparing these results with similarfits done using just the major components of the water-groupas well as single species fits. We found that on the wholeusing the O2
+ and a single W+ species (either mass 16 or 17)resulted in fits in which the root mean square deviations werelower than when using W+ only (see Appendix A).
4. Ion Data Results
4.1. Ion Density
[18] Due to the uniqueness of the SOI orbit, this data set isimportant to examine. It had a very close periapsis but theinstrument settings differed from those in the subsequent setsused for this study as mentioned earlier. Because the thrusterswere fired to brake the spacecraft for orbit insertion, thedetectors were turned off until after the thrusters were off sothey could not be damaged by the fuel. When turned back on,the voltage on the micro-channel plate of the detector was athalf power during the collection of the data both over themain rings and through the passage of the F and G rings. Thisvoltage was subsequently increased to the standard runningvoltage. The result was that the detection efficiency for thispass was 56% lower than normal. The instrument was alsonot actuating throughout SOI so that anode three was pointedclosest to the plasma flow when Cassini flew over the rings
and, after a roll maneuver, anode seven was pointed closest tothe plasma flow as the spacecraft crossed the ring plane.[19] Tokar et al. [2005] originally analyzed the SOI data
from over the main rings detecting both O+ and O2+. From this
data, Johnson et al. [2006a, 2006b] determined the existenceof the ring atmosphere with follow-up work done on mod-eling this atmosphere by Luhmann et al. [2006], Bouhramet al. [2006] and, most recently, Tseng et al. [2010]. A sea-sonal effect on the spatial distribution of this atmospherebeyond the rings into the region between the F and G ringswas predicted by Tseng et al. [2010]. Since the analysis byTokar et al. [2005], the efficiency of the detector has beenrevised to an ion species and energy dependent version. Thisrevision was conducted through internal CAPS discussionsand meetings (D. B. Reisenfeld, private communication,2011). Therefore, we re-analyzed the data using the revisedefficiency that was species dependent and lowered to accountfor the voltage settings of the SOI pass over the main ringsand compared our results with the results from the Tokaret al. [2005] study as shown in Figure 4.[20] Cassini’s pass over the main rings occurred at a rela-
tively high altitude, as seen in Figure 1, so that the density ofO+ at spacecraft position was on average higher than that ofO2+, which has a smaller scale height [Johnson et al., 2006a,
2006b; Hill and Michel, 1976]. Outside the main rings asCassini approached and crossed the magnetic equator, the O2
+
density dominated during SOI. Figure 4 shows that there aresimilar trends between the two different analyses of this data.When compared with the Tokar et al. [2005] results thechange in efficiency had the effect of increasing the inferreddensities. This accounts for most of the differences seen inFigure 4; slight differences in technique account for the rest.In addition, the dip in the O2
+ data near 2 Rs is now closer to
Figure 4. Comparison of SOI data from over the main rings as analyzed here with published dataanalyzed by Tokar et al. [2005].
ELROD ET AL.: SEASONAL VARIATIONS IN SATURN’S PLASMA A03207A03207
6 of 16

the Cassini Division located between 1.94 and 2.02 Rs wherethe O2 source is also smaller. Therefore, the new resultsshould be used in future analysis of the ring atmosphere.[21] Although Tokar et al. [2005] showed that O2
+ waspresent outside the main rings, no analysis was conducted.The total ion density beyond the main rings is presented inFigure 5a for each of the sets examined in this study alongwith the published ion densities from the Voyager 2 data[Richardson, 1986]. Since the densities are sensitive to thespacecraft height above the magnetic equator, Figure 5bshows the total densities within 0.05 Rs of the magneticequator to better compare the data from different passes.Surprisingly, we found that the total densities from the 2004pass are approximately two orders of magnitude above thepasses from 2005 and 2007 with the 2010 passes exhibitingthe lowest total densities. The Voyager 2 data are also seen tobe intermediate to the SOI and the 2005–2010 data: about anorder of magnitude higher than 2007–2010 and an order ofmagnitude lower than SOI. Although the 2005 data arebetween the Voyager 2 data and the 2007 data, with sofew points it is hard to draw conclusions about the timebetween 2004 and 2007. Using future passes, when Saturnis approaching northern solstice and the solar activity isincreasing again, might help clarify this trend.[22] Figure 6a shows the individual densities from all the
passes within 0.05 Rs of the magnetic equator. At SOI in2004, O2
+ dominates over the W+ ion densities. In the laterdata from 2005 to 2010, the O2
+ densities are either about thesame or less than the W+ densities. The Voyager 2 data wasfit assuming only O+ (16 amu) for ions inside of 14 Rs[Richardson, 1986]. Not only were the detected densitieshigher by two orders of magnitude at SOI but the O2
+/W+ ratioshown in Figure 6b indicates that there was much more O2
+ atSOI and that this drops off for all the other passes.[23] While the O2
+ densities are higher than the W+ speciesat SOI, by 2007 the W+ densities are comparable. Given thegap in data from SOI between the ring region and Enceladus,it is difficult to conjecture where the W+ ions from Enceladuswould begin to dominate. However, Sittler et al. [2006]found in their analysis of the SOI data, at distances greaterthan 5 Rs (past the orbit of Enceladus) a predominately W+
signal throughout the magnetosphere.
4.2. Ion Temperatures
[24] The ‘pick-up’ temperature is the kinetic energy ofgyromotion around the field lines for freshly created ions. Asthe neutrals move at the Keplerian orbital velocity, Vorb, andthe magnetic field lines move at corotation velocities, Vco,both of which we assume for simplicity are circular, the pick-up temperature is: kTpickup_ion ≈ 1
2= mi(Vco � Vorb)2. Figure 7
is a plot of kTi /mi and compared with the 1/2 (Vco � Vorb)2.
If the ions all have short lifetimes and are dominated bypick-up, then kTi /mi should be approximately equal for eachpass. The ion temperatures are plotted in 0.025 Rs incrementsfeaturing only results within �0.05 Rs of the magneticequator to reduce the effect due to the position of the space-craft. The error bars are generated using one standard devi-ation over each 0.025 Rs step.[25] The temperatures shown in Figure 7 are larger at SOI
in 2004 than they are for the 2005 to 2010 passes. In this plot,the SOI values for kTi /mi, particularly for O2
+, are muchcloser to the expected ‘pick-up’ values consistent with a
significant contribution of directly ionized Oz from the ringatmosphere at SOI. The temperature difference between theW+ and O2
+ ions, however, is large at SOI. In the later passesthe W+ temperatures and O2
+ temperatures are closer to beingequal, but the overall values are much lower than the localpick-up temperatures. Since the analysis is 1D, the extractedtotal temperatures are not exact and are also affected by theuncertainties of the extracted flow speeds discussed below.However, the trends pointed out here are consistent with theenergy spectra being clearly narrower in the more recent datathan in the SOI data. The fit procedure used here assumesthat the temperature is isotropic. Future studies will includeexamination of the 27/28 June 2007 and 19 June 2010 datausing an anisotropic 3D model to obtain the plasma param-eters. These passes in particular are interesting becausethey had the best pointing in the plasma and were actuatingthroughout the pass allowing a 3D analysis.
4.3. Ion Flow Velocities
[26] The parameter U in equation (2) depends on the anodepointing, the plasma flow velocity, and the spacecraftvelocity. Figure 8 depicts U extracted from the fittingprocedure with a correction for the Vphi component of thespacecraft velocity (all converted into cylindrical coordi-nates). As these results were obtained from one-dimensionalfits, the correction to the flow velocity does not includethe radial or z component of the spacecraft velocity. Theresults are compared to a line depicting the corotationvelocity, Vco, and a dashed line for the Keplerian orbitalvelocity of the neutrals, Vorb. To get a better picture ofthe plasma bulk flow speed, an anisotropic Maxwellian 3Dfit accounting for the full velocity vector of the ions isnecessary. Future studies will account for this correction.However, the estimated plasma flow speeds are similar inmagnitude to the co-rotational speeds with values from themore recent data closer to Vco.
5. Electron Densities
[27] To confirm the trend seen in the total ion densities,we compared the ion densities to the electron densitiesobtained using Radio and Plasma Wave Science (RPWS)data [Persoon et al., 2006; Persoon, private communication,2010]. Since the ions are predominately singly ionized in thisregion, charge neutrality implies that the total electron andion densities should be approximately equal. If there aresignificant H+ and H2
+ densities in the region, which are notaccounted for in this study, the electron densities should behigher than our total ion densities. In addition, electrons canbe absorbed by the dust in the E, F, and G rings, therebyaffecting the comparison. Finally, due to the high back-ground radiation within the instrument, it is also difficult toobtain accurate electron densities near 4 Rs; thus there is verylittle overlap with RPWS data in this region.[28] Figure 9 shows the electron densities determined by
RPWS from the SOI and the 2007 orbits where we extend theregion to show the trend in density versus distance fromSaturn for the two 2007 passes. Future studies will includeexamination of RPWS results from 2006, 2010, and 2011.The differences seen in Figure 9 between the ion and electrondensities at SOI are likely due to the fact that their lowenergies are affecting the electrons’ detection, the presence of
ELROD ET AL.: SEASONAL VARIATIONS IN SATURN’S PLASMA A03207A03207
7 of 16
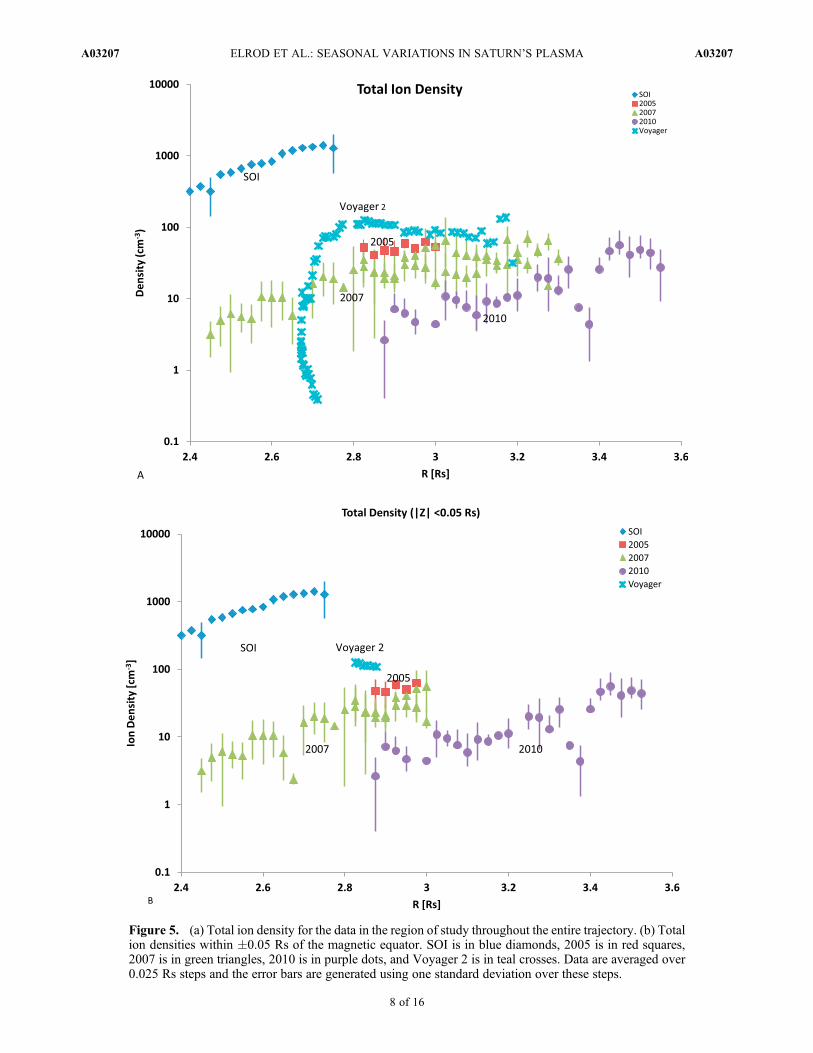
Figure 5. (a) Total ion density for the data in the region of study throughout the entire trajectory. (b) Totalion densities within �0.05 Rs of the magnetic equator. SOI is in blue diamonds, 2005 is in red squares,2007 is in green triangles, 2010 is in purple dots, and Voyager 2 is in teal crosses. Data are averaged over0.025 Rs steps and the error bars are generated using one standard deviation over these steps.
ELROD ET AL.: SEASONAL VARIATIONS IN SATURN’S PLASMA A03207A03207
8 of 16

Figure 6
ELROD ET AL.: SEASONAL VARIATIONS IN SATURN’S PLASMA A03207A03207
9 of 16

potentially electron-absorbing ice grains, which can absorbelectrons, and the high radiation background mentionedabove. However, allowing for these uncertainties, Figure 9demonstrates rough agreement between the trends in the ionand the electron densities. That is, the electron densitiesexhibit a drop between SOI and 2007 similar to the drop inthe ion density between solstice and equinox.
6. Discussion
[29] The ion densities in Figure 5b as well as the electrondensities in Figure 9 indicate that there was a significantchange in the plasma densities in this region from 2004 to2010. The plasma also appeared to change in character asthe relative composition and the ion temperatures also differconsiderably over this period as shown in Figures 6 and 7.The higher-than-normal background for SOI indicates thereare higher levels of penetrating particle radiation. This isalso consistent with the discovery of hot plasma injectionin Saturn’s highly compressive magnetosphere during SOIbecause it was in the corotating interaction region [Bunceet al., 2005]. If only Cassini data were available, then the
SOI data might be considered anomalous. However, theVoyager 2 data within 0.05 Rs of the magnetic equator isalso much higher than the 2007 and 2010 data. Therefore,our results strongly suggest that significant variations in theplasma density, composition, and temperature have occurredconfirming the predicted seasonal variation in the extendedring atmosphere from solstice to equinox.[30] Since the formation of the neutrals and ions from the
main rings has been suggested to be mainly due to solar UVphotons, the production rate will depend on the angle ofincidence of the solar flux with the ring plane, the ring par-ticle temperatures, and the level of solar activity. In 1981,when Voyager 2 encountered the Saturn system, the Sun wasat solar maximum and Saturn was nearly at equinox making alow incidence angle. In 2004, for the SOI pass, Saturn was atsouthern solstice so the incident angle with the southern halfof the ring plane was at its highest, and the solar activity wasaverage. In addition, late in 2003 there was a unique shortperiod of high solar activity that might have had a sustainedeffect. During SOI, the solar wind was strong and Saturn’smagnetosphere was very compressive being in a corotating
Figure 7. Ion temperatures/ion mass [kTi/mi] for all data sets within z =�0.05 Rs of the magnetic equatorcompared to 1/2 (Vco�Vorb)
2 (the solid line). Open shapes are W+ and closed shapes are O2+. SOI is in blue
diamonds, 2005 is in red squares, 2007 is in green triangles, 2010 is in purple dots, and Voyager 2 is in tealcrosses. Data are averaged over 0.025 Rs steps and the error bars are generated using one standard deviationover these steps.
Figure 6. (a) W+ and O2+ ion densities for data in region between�0.05 Rs of the magnetic equator. Open shapes are W+ and
closed shapes are O2+. SOI is in blue diamonds, 2005 is in red squares, 2007 is in green triangles, 2010 is in purple dots, and
Voyager 2 is in teal crosses. (b) Ratio of O2+/W+ for the ion densities in the region. SOI has a significantly higher abundance
of O2+ over the later pass where W+ begins to dominate especially closer to Enceladus. Data are averaged over 0.025 Rs steps
and the error bars are generated using one standard deviation over these steps. Note the Voyager 2 data were only fit assuminga W+ (16 amu).
ELROD ET AL.: SEASONAL VARIATIONS IN SATURN’S PLASMA A03207A03207
10 of 16

interaction region which is the interaction region betweenfast and slow solar wind. Many Cassini observations doneduring SOI were related to the corotating interaction region,such as auroral activity, SKR, tail reconnection, and hotplasma injection [Jackman et al., 2011; Bunce et al., 2005].By 2010, Saturn was near equinox again so the illuminationof the rings was at a minimum. However, by 2006 the solaractivity was also at a minimum possibly affecting the laterpasses. Tseng et al. [2010] described the variation with solarincident angle of the O2 component of the ring atmosphereaccounting for the reduced UV flux, which affects the oxy-gen production rate. Data taken from Composite InfraredSpectrometer (CIRS) and ring occultation data [Spilker et al.,2010], however, found that the average ring particle tem-perature dropped from�100 K at southern solstice in 2004 to�60 K at equinox. This drop in temperature dramaticallyaffects the photo-decomposition rate for ice, as well as thechemical reaction rates on the ice grains, and hence the ringatmosphere density.[31] The seasonal variation in the ring atmosphere
described by Tseng et al. [2010] is updated here byaccounting for the effect of the change in temperature on thedecomposition of ice. The SOI model results are then nor-malized to the CAPS data at SOI in this study (e.g., Figure 4).This normalization process requires that we increase thecalculated O2
+ densities by about a factor of twenty to accountfor the recycling of dissociated oxygen on the surface of thering particles [Johnson et al., 2006a, 2006b; Tseng and Ip,2011], uncertainties in the solar UV flux, and the simplifiedion-molecule scattering description. In addition, updating the
Tseng et al. [2010] results for the effect of the ring particletemperature, we show a new estimate of the extended O2
atmosphere at equinox and SOI. We also show results for theEnceladus source of O and OH from Cassidy et al. [2011] inwhich the spreading of the neutrals from the Enceladusplumes by ion charge exchange and neutral-neutral collisionswas described. The rough bounds are normalized to thepossible variability of the plume source suggested by Smithet al. [2010]. The orbits used in the Enceladus neutral torusstudy come from 2005 and 2008, near to but not the sametime as passes used for this study. If the ionization rates andion lifetimes were similar, the O2
+ and W+ densities would beroughly proportional to the respective neutral densities.[32] The ring atmosphere normalized to CAPS O2
+ data atSOI resulted in the highest O2 densities in Figure 10, whichare about two orders of magnitude higher than at equinox.The modeled neutral densities included the effect of thedeposition of dissociated neutrals [Tseng and Ip, 2011] andions [Farrell et al., 2008] from Enceladus onto ice particlesin the A-ring, which can enhance the production of O2 par-ticularly. However, such an enhancement is also less efficientwith decreasing ring particle temperatures when Saturnapproaches equinox.[33] The Enceladus plume source might experience a var-
iation of about a factor of four over a seven-month observa-tional period [Smith et al., 2010]. Larger variations couldoccur but it is clear that the source rate is reasonably stable asthe E-ring was present during the Voyager 2 pass and an OHtorus discovered between Voyager and Cassini appeared tobe relatively stable [Jurac et al., 2001]. Smith et al. [2010]
Figure 8. Flow velocity of the ions corrected for the Vphi component of the space craft velocity. Vco is thesolid red line and Vorb is the solid green line. SOI is in blue diamonds, 2005 is in red squares, 2007 is ingreen triangles, and 2010 is in purple dots. The velocities are close to corotation as expected. These arefor the data within �0.05 Rs of the magnetic equator. Data are averaged over 0.025 Rs.
ELROD ET AL.: SEASONAL VARIATIONS IN SATURN’S PLASMA A03207A03207
11 of 16

estimated the neutral lifetimes to be on the order of 5–6 �106 s. Given these lifetimes, it is likely that the effects of thevariations of the plumes would only take on the order ofmonths to exhibit changes in these densities. For these rea-sons the large variation in our ion densities does not appearto be directly due to variations in the plume activity.[34] We have shown that there are significant variations
from solstice to equinox in the plasma density and compo-sition. We also discussed how the seasonal variations affectthe neutral densities. To further understand our observationswe have developed a one-box ion chemistry model to simu-late the plasma environment that was observed by CAPS. Inthis model the plasma chemistry between 2.5 and 3.5 Rs nearthe equator is described by the following parameters: theneutral densities, the diffusion loss timescale, and the densityand temperature of hot electrons. The ionization, recombi-nation, and charge exchange for the major neutral torusspecies (W, H, H2, and O2) are also accounted for. The outputis the steady state plasma composition (W+, H+, H2
+, and O2+).
[35] The chemical rate equations for plasma density, dnidt =Si� Li, are solved for a set of initial test parameters, where niis the ion density, Si is a source rate, and Li is a loss rate. Thesources of each ion species are photo-ionization, electron-impact ionizations (both thermal and hot electrons), and
charge exchange reactions with the neutrals. Loss occursby charge exchange, radial diffusion, and recombination.The coupled sets of time-dependant equations for the ionsare solved iteratively using the fourth order Runge–Kuttamethod until steady state is reached.[36] We found that the primary ion source in this region is
photo-ionization, while the hot electron impact ionizationcan only account for �30%. Inside of �4 Rs, the radial dif-fusion is �1–2 months [Rymer et al., 2007, 2008] so it is nota major loss process for plasma. However, due to the lowelectron temperatures (Lewis, ELS moments, private com-munication, 2010), recombination does become a major lossprocess in agreement with Sittler et al. [2008]. They showedthat recombination loss dominated in the magnetosphereinside Dione’s orbit while diffusion loss dominated in theouter magnetosphere. Recombination is the primary lossprocess for H3O
+ and O2+ ions and charge exchange places
important constraints on the loss of H2O+, OH+, and O+.
[37] At SOI we used the Enceladus neutral torus with anaverage source rate of 1028 H2O s�1 and the extended O2 ringatmosphere densities in Figure 10. Although the neutral O2
column densities from the ring atmosphere are smaller thanthe O or OH neutral column densities from Enceladus, wefind that the neutral O2 dominates near the equator which is
Figure 9. Electron density from RPWS compared to our total ion densities. SOI total ion densities are inred solid diamonds, 2007 total ion densities are in blue, and all RPWS densities are in black: pluses are11 June 2007; asterisks are 27 June 2007; and dots are 28 June 2007 [Persoon et al., 2006; Persoon,private communication, 2010].
ELROD ET AL.: SEASONAL VARIATIONS IN SATURN’S PLASMA A03207A03207
12 of 16

consistent with the analysis here, that model O2+ ion density is
the dominant ion at SOI. The model O2+ ion density is about a
few hundred cm�3 at SOI in rough agreement with CAPSdata in Figure 6a.[38] We obtained a total water-group ion density of
�20 cm�3 in our model, which is lower than the SOI datain Figure 6a. There are three possible explanations for thisdiscrepancy. If Enceladus’ plumes are variable, the contri-bution of Enceladus neutral torus could be much higher thanthe values used producing more water-group ions. Second,we ignored the atomic oxygen population produced fromdissociation of ring O2 atmosphere which could increase ourresults. Third, the higher background at SOI suggests a moreactive period, likely consistent with enhanced the ionizationrates or an increased O2 source rate. These considerationswill be explored in future work.[39] The extended O2 ring atmosphere at equinox in
Figure 10 is seen to be about one percent of the atmosphere atsouthern solstice. Thus, near equinox, the model O2
+ iondensity is �5–10 cm�3 using an average Enceladus torussource, while the total water-group ion density is �10–20 cm�3. This result is also remarkably consistent with thedata shown in Figure 6 and indicates that unless the ringatmosphere contribution of O2 is large, as at SOI, O2
+ isformed primarily from the ion-molecule collisions betweenOH+ and O.We have also found that the lifetime of the ions isshort, which is consistent with our observation that the O2
+
temperatures are close to the pick-up temperature. On theother hand, when the ring atmosphere contribution is small,most ions have experienced a number of relatively low speedion-neutral collisions, each of which can reduce the iontemperature [Johnson et al., 2006a, 2006b]. This explanation
could account for ion temperatures well below the pick-uptemperatures in the data closer to equinox (2007–2010),although interactions with the charged grains in the E, F, andG rings can also contribute.[40] Our ion simple chemistry model appears to account
for the large variations in the plasma environment betweensolstice and equinox that we extracted from the CAPS data.However, there are other effects that need to be included,such as the relevance of the increased levels of penetratingradiation at SOI, the solar activity, and the fraction of hotelectrons which affects the ionization rates. In addition, lossprocesses to the tenuous ring particles, O from the main ringatmosphere, and the interactions with the charged grains needto be considered. Future work (W.-L. Tseng et al., manu-script in preparation, 2012) will provide a more detailedmodel to account for these effects.
7. Summary
[41] This is the first detailed analysis of CAPS plasma datain the region between about 2.5 and 3.5 Rs. Here we showedthat surprisingly large changes occurred in the ion density,temperature, and composition between solstice and equinox.Although many aspects of the data presented are not wellunderstood in detail, our simple model of the plasmachemistry remarkably indicates that observed changes in theplasma with time are due to seasonal change in the produc-tion of neutrals from Saturn’s ring atmosphere. Such achange would also affect the amount of oxygen scatteredfrom the ring atmosphere into Saturn’s thermosphere and intothe outer magnetosphere. Our model also indicates that,although O2
+ produced by direct ionization of neutral O2 is a
Figure 10. Neutral column densities with O2 sourced from the ring atmosphere (diamonds) [Tseng et al.,2010] high (SOI) low (equinox). The O and OH water-group neutrals sourced from Enceladus plume(crosses). High [Cassidy et al., 2011], low scaled by the factor of 4 [Smith et al., 2010].
ELROD ET AL.: SEASONAL VARIATIONS IN SATURN’S PLASMA A03207A03207
13 of 16

major contributor to the observed data, the relatively lowspeed ion-neutral collisions in this region can produce sig-nificant amounts of O2
+. Such reactions can also be respon-sible for our observation of reduced ion temperatures on theequinox passes (2007–2010) examined here. This phenom-enon is unlike what is known to occur outside the orbit ofEnceladus, where such ion-molecule interactions occur athigher relative speeds, leading primarily to loss of neutralsfrom the magnetosphere [Johnson et al., 2005]. We note thatthere may be other effects superimposed on our proposedseasonal effect like the variations in the solar activity. Suchenhancements to the simple photochemical model may berequired to better model the new ring atmosphere O2
+ densi-ties in Figure 4 as well as the Voyager 2 plasma data.[42] Since this study examined the CAPS data using a one-
dimensional thermal model of the plasma data, the next stepis a three-dimensional anisotropic analysis of data whenCAPS is actuating and examination of the data from 2011that was not available at the time of this study. This infor-mation will allow for a more accurate determination of theperpendicular and parallel ion temperatures as well as allthree components of the plasma flow velocity in the region.
In addition, continuing this study through to the end of theCassini mission will allow us to observe the full seasonaleffects through the northern summer which could be affectedby the northern offset of the magnetic equator. Continuedexamination of the CAPS data in this region, specificallyusing a three-dimensional anisotropic analysis, as well asmore detailed modeling of the photochemistry and the effectof solar activity, will lead to a better understanding of thering atmosphere and the influence of the Enceladus plumeson the inner magnetosphere.
Appendix A: Additional Fitting Details
[43] Several checks were made to confirm that the positionof the peaks and fit parameters returned by the program wereappropriate. Given that O2
+ is approximately twice the massof the W+ ions, these should have about twice the energy.This difference in energy corresponds to a difference of about3–4 bins of the 63 logarithmically spaced bins in the Singlesdetector. Occasionally an error can occur in the fit procedureif the initial parameters are outside of the peak region. Theprogram will then find another nearby local minimum. Such
Figure A1. Comparison of peak fits using only W+ fits (O+ and OH+) the fits here as indicated by the c2
values are not as good as the fits done using either an O2+ and O+ or O2
+ and OH+. It is from this process andthe dominance of a second peak that there is an O2
+ signature throughout and the peaks are best fit using W+
and O2+.
ELROD ET AL.: SEASONAL VARIATIONS IN SATURN’S PLASMA A03207A03207
14 of 16

fits are visibly different and clearly incorrect. To avoid this,constraints are placed on the parameters, e.g., keeping thetemperature and density positive, constraining the tempera-ture to never significantly exceed the pick-up temperature,and keeping the bulk velocities near corotation. Whenabnormal fits occur, they are re-run through the fitting pro-gram with adjusted inputs that are closer to the expected localminima until these fits are corrected. If they cannot be cor-rected, these abnormal fits are rejected.[44] To confirm that the fits are acceptable, the following
tests on each fit were run: (1) The O2+ ion peak has a higher
energy than the W+ peak and that the difference betweenthese peak maximums is around 3–4 energy bins. (2) Ifthe peak fit hit the maximum number of iterations, the fitwas re-run with adjusted initial parameters for a better fit.(3) Fixing the temperature at pick-up and then fixing thevelocity and corotation to determine how much the densitieswould change, we require that changes should be relativelysmall. (4) To confirm the presence of O2
+ each peak was fitwith just W+ and the results and the quality of the fits werecompared with the fits with O2
+ and W+.[45] We also visually examine the fits to see if they
were poor or if there were results that are inconsistent withthe data, e.g., getting one peak with temperatures in thethousands of eV’s. If this occurred these batches of datawould be re-run with refined initial parameters until all peaksreturned acceptable fits based upon the above criteria.[46] To create an additional check on the densities, given
the constraints on the plasma flow velocity and temperaturesdiscussed earlier, an analytical calculation of the densitieswas performed using equations (1) and (2). We assumed thefit parameters Ti and U returned by the fitting algorithm anddetermined the count values for O2
+ and W+ based on wherethe two individual peak maximums occurred for each slice inthe data. The result of this procedure created an upper boundon the parameters.[47] Preliminary tests were done by comparing fits
obtained using O2+ at mass 32 and various masses for W+ at
16 through 19. Since the masses from 16 to 19 are all veryclose to each other, the peaks tend to overlap and will bewithin 1–2 energy bins of each other in the electrostaticanalyzer. As a result, there was very little difference betweenusing mass 32 and any mass 16–19 for W+. Since Tokar et al.[2005] used mass 16 for the SOI analysis for the pass over themain rings, we felt it was a good comparison for this regionto use mass 16.[48] For SOI, the temperature of the larger mass corre-
sponds to the pick-up temperature for O2+ and not for that of
water-group ions. Indicating, the use of O2+ and W+ was valid
and that the program was correctly fitting these peaks to thespectra. For later spectra, similar comparisons were run withmass 32 versus mass 16 or 17 and the temperature ratios werestill around 2:1 even though the temperatures were lowerthan pick-up. When running a comparison test using 11 and12 October 2005 for several good A-cycles in the data, whereCassini is about 3.2 Rs from Saturn, the results showed thatthe velocities again agreed with published results [Wilsonet al., 2008, 2009], which were approximately corotation.The temperatures from these tests were slightly less than, butclose to the pick-up temperatures of O+ ions.[49] Figure A1 is a comparison of these fits using
W+ (17 amu) only and the resulting least squared difference
c2 = S data�fitð Þ2data return values from the fits. It is seen that the
c2 values generally were higher than using two peaks with Wmasses (i.e., 16–19 amu). While the total densities and tem-peratures were all within approximately 20% to 40% of thevalues calculated, using two species, the c2 values weremuch higher using a single peak by approximately a factorof 5 to 10 on average.
[50] Acknowledgments. We want to thank J. Richardson for theVoyager 2 data, J. Erwin, J. Deighan, and A. Woodson for advice on the fit-ting procedures and many discussions of our results, F. Crary, M. Thomsen,and R. Tokar for advice on the CAPS data set and analysis procedures,Ann Persoon and the RPWS group for their help in obtaining the electrondensities, Gethyn Lewis for his work on the electron temperatures, DanReisenfeld for his work on the CAPS efficiency, and Abi Rymer for heradvice and consultation with high energy electrons and solar activity events.This work was supported at the University of Virginia by SwRI through agrant for the Cassini Mission from JPL.[51] Masaki Fujimoto thanks the reviewers for their assistance in evalu-
ating this paper.
ReferencesBouhram, M., R. E. Johnson, J.-J. Berthelier, J.-M. Illiano, R. L. Tokar,D. T. Young, and F. J. Crary (2006), A test-particle model of theatmosphere/ionosphere system of Saturn’s main rings, Geophys. Res.Lett., 33, L05106, doi:10.1029/2005GL025011.
Bunce, E. J., S. W. H. Cowley, D. M. Wright, A. J. Coates, M. K.Dougherty, N. Krupp, W. S. Kurth, and A. M. Rymer (2005), In situobservations of a solar wind compression-induced hot plasma injec-tion in Saturn’s tail, Geophys. Res. Lett., 32, L20S04, doi:10.1029/2005GL022888.
Cassidy, T. A., and R. E. Johnson (2010), Collisional spreading ofEnceladus’ neutral cloud, Icarus, 209(2), 696–703, doi:1016/j.icarus.2010.04.010.
Cassidy, T. A., R. E. Johnson, and A. R. Hendrix (2011), Collisionalevolution of the Enceladus neutral cloud, in Proceedings of 27th Inter-national Symposium on Rarefied Gas Dynemics, AIP Conf. Proc., 1333,1133–1138, doi:10.1063/1.3562796.
Elrod, M. K., R. E. Johnson, W.-L. Tseng, R. J. Wilson, and R. L. Tokar(2010), Oxygen ions from over the main rings into the inner magneto-sphere, Bull. Am. Astron. Soc., 42, 1008.
Farmer, A. J., and P. Goldrich (2007), How much oxygen is toomuch? Constraining Saturn’s ring atmosphere, Icarus, 188, 108–119,doi:10.1016/j.icarus.2006.11.013.
Farrell, W. M., M. L. Kaiser, D. A. Gurnett, W. S. Kurth, A. M. Persoon,J. E. Wahlund, and P. Canu (2008), Mass unloading along the inneredge of the Enceladus plasma torus, Geophys. Res. Lett., 35, L02203,doi:10.1029/2007GL032306.
Hansen, C. J., L. W. Esposito, A. I. F. Stewart, B. Meinke, B. Wallis, J. E.Colwell, A. R. Hendrix, K. Larsen, W. Pryor, and F. Tian (2008), Watervapour jets inside the plume of gas leaving Enceladus, Nature, 456,477–479, doi:10.1038/nature07542.
Hill, T. W., and F. C. Michel (1976), Heavy ions from the Galilean satellitesand the centrifugal distortion of the Jovian magnetosphere, J. Geophys.Res., 81(25), 4561–4565, doi:10.1029/JA081i025p04561.
Jackman, C. M., J. A. Slavin, and S. W. H. Cowley (2011), Cassini obser-vations of plasmoid structure and dynamics: Implications for the roleof magnetic reconnection in magnetospheric circulation at Saturn,J. Geophys. Res., 116, A10212, doi:10.1029/2011JA016682.
Johnson, R. E., M. Liu, and E. C. Sittler Jr. (2005), Plasma-induced clearingand redistribution of material embedded in planetary magnetospheres,Geophys. Res. Lett., 32, L24201, doi:10.1029/2005GL024275.
Johnson, R. E., et al. (2006a), Production, ionization and redistributionof O2 Saturn’s ring atmosphere, Icarus, 180, 393–402, doi:10.1016/j.icarus.2005.08.021.
Johnson, R. E., H. T. Smith, O. J. Tucker, M. Liu, M. H. Burger, E. C.Sittler, and R. L. Tokar (2006b), The Enceladus and OH torus at Saturn,Astrophys. J., 644, 137–139, doi:10.1086/505750.
Jurac, S., R. E. Johnson, and J. D. Richardson (2001), Saturn’s E ring andproduction of the neutral torus, Icarus, 149(2), 384–396, doi:10.1006/icar.2000.6528.
Luhmann, J. G., R. E. Johnson, R. L. Tokar, S. A. Ledvina, and T. E.Cravens (2006), A model of the ionosphere of Saturn’s rings and itsimplications, Icarus, 181, 465–474, doi:10.1016/j.icarus.2005.11.022.
Martens, H. R., D. B. Reisenfeld, J. D. Williams, R. E. Johnson, andH. T. Smith (2008), Observations of molecular oxygen ions in Saturn’s
ELROD ET AL.: SEASONAL VARIATIONS IN SATURN’S PLASMA A03207A03207
15 of 16

inner magnetosphere, Geophys. Res. Lett., 35, L20103, doi:10.1029/2008GL035433.
Moses, J. I., E. Lellouch, B. Bezard, and G. R. Gladstone (2000),Photochemistry of Saturn’s atmosphere II: Effects of an Influx of externaloxygen, Icarus, 145, 166–202, doi:10.1006/icar.1999.6320.
Persoon, A. M., D. A. Gurnett, W. S. Kurth, and J. B. Groene (2006), Asimple scale height model of the electron density in Saturn’s plasma disk,Geophys. Res. Lett., 33, L18106, doi:10.1029/2006GL027090.
Porco, C. C., et al. (2006), Cassini observes the active South Pole ofEnceladus, Science, 311, 1393, doi:0.1126/science.1123013.
Richardson, J. D. (1986), Thermal ions at Saturn: Plasma parametersand implications, J. Geophys. Res., 91(A2), 1381–1389, doi:10.1029/JA091iA02p01381.
Rymer, A. M., et al. (2007), Electron sources in Saturn’s magnetosphere,J. Geophys. Res., 112, A02201, doi:10.1029/2006JA012017.
Rymer, A. M., B. H. Mauk, T. W. Hill, C. Paranicas, D. G. Mitchell, A. J.Coates, and D. T. Young (2008), Electron circulation in Saturn’s magne-tosphere, J. Geophys. Res., 113, A01201, doi:10.1029/2007JA012589.
Sittler, E. C., Jr., et al. (2006), Cassini observations of Saturn’s innerplasmasphere: Saturn orbit insertion results, Planet. Space Sci., 54,1197–1210, doi:10.1016/j.pss.2006.05.038.
Sittler, E. C., et al. (2008), Ion and neutral sources and sinks within Saturn’sinner magnetosphere: Cassini results, Planet. Space Sci., 56, 3–18,doi:10.1016/j.pss.2007.06.006.
Smith, H. T., R. E. Johnson, M. E. Perry, D. G. Mitchell, R. L. McNutt,and D. T. Young (2010), Enceladus plume variability and the neutralgas densities in Saturn’s magnetosphere, J. Geophys. Res., 115, A10252,doi:10.1029/2009JA015184.
Spilker, L., A. Flandes, R. Morishima, N. Altobelli, C. Leyrat, S. Pilorz,C. Ferrari, and S. Edgington (2010), Saturn ring temperature changesthrough equinox, paper presented at European Planetary Science Con-gress, Eur. Geosci. Union, Rome.
Tokar, R. L., et al. (2005), Cassini observations of the thermal plasma in thevicinity of Saturn’s main rings and the F and G rings, Geophys. Res. Lett.,32, L14S04, doi:10.1029/2005GL022690.
Tseng, W.-L., and W.-H. Ip (2011), An assessment and test of Enceladus asan important source of Saturn’s ring atmosphere and ionosphere, Icarus,212, 294–299, doi:10.1016/j.icarus.2010.12.003.
Tseng, W.-L., W.-H. Ip, R. E. Johnson, T. A. Cassidy, and M. K. Elrod(2010), The structure and time variability of the ring atmosphere andionosphere, Icarus, 206, 382–389, doi:10.1016/j.icarus.2009.05.019.
Tseng, W.-L., R. E. Johnson, M. F. Thomsen, T. A. Cassidy, and M. K.Elrod (2011), Neutral H2 and H2
+ ions in the Saturnian magnetosphere,J. Geophys. Res., 116, A03209, doi:10.1029/2010JA016145.
Wilson, R. J., R. L. Tokar, M. G. Henderson, T. W. Hill, M. F. Thomsen,and D. H. Pontius Jr. (2008), Cassini plasma spectrometer thermal ionmeasurements in Saturn’s inner magnetosphere, J. Geophys. Res., 113,A12218, doi:10.1029/2008JA013486.
Wilson, R. J., R. L. Tokar, and M. G. Henderson (2009), Thermal ion flowin Saturn’s inner magnetosphere measured by the Cassini plasma spec-trometer: A signature of the Enceladus torus?, Geophys. Res. Lett., 36,L23104, doi:10.1029/2009GL040225.
Young, D. T., et al. (2004), Cassini Plasma Spectrometer Investigation,Space Sci. Rev., 114, 1–112, doi:10.1007/s11214-004-1406-4.
M. K. Elrod, R. E. Johnson, and W.-L. Tseng, Department of MaterialScience and Engineering, University of Virginia, Astronomy 102, POBox 400325, Charlottesville, VA 22904-4325, USA. ([email protected]; [email protected]; [email protected])R. J. Wilson, LASP, University of Colorado at Boulder, 1234 Innovation
Dr., Boulder, CO 80303-7814, USA. ([email protected])
ELROD ET AL.: SEASONAL VARIATIONS IN SATURN’S PLASMA A03207A03207
16 of 16