seb nordicoutlook template eng · growth will slow as homebuilding falls, and stimulus from a weak...
TRANSCRIPT

NordicOutlook
May 2018
Weak currency does littleto support Swedish growth
Broad investment boomextending global expansion


Nordic Outlook: May 2018 3
Contents
04 International overview 10 Government bond markets 11 Foreign exchange markets 12 Stock markets 13 The United States 16 The euro zone 19 Theme: The EU in 2025 20 Japan 21 United Kingdom 22 China 23 India 24 Russia 25 Sweden 29 Theme: The Swedish krona 31 Theme: Sweden’s election 33 Denmark 34 Norway 37 Finland 38 Estonia 39 Latvia 40 Lithuania 41 Economic data 46 Contacts

4 Nordic Outlook: May 2018
International overview Broad investment boom extending global economic expansion
Late-cyclical labour market strength and rising capital spending are driving continued healthy global growth, despite temporary weakness early in 2018. Political drama will not greatly hamper activity. Inflation will slowly climb due to rising pay and commodity prices, but monetary policy normalisation is being delayed in many places. The dollar response will remain weak despite persistent US-Western European interest rate spreads. Swedish growth will slow as homebuilding falls, and stimulus from a weak krona will be marginal.
After gradually strengthening in 2017, the global economy showed unstable tendencies early in 2018. In the United States the first quarter was disappointing but a still-robust labour market suggests that the slowdown was temporary. Euro zone indicators fell too, especially in the export sector. One reason may be the strong euro, but more temporary effects such as weather probably played a bigger role. Despite a weak pound the United Kingdom saw a similar trend, a sign that the currency was not so important. In emerging market (EM) economies, the euphoria of 2017 has been replaced by worries about falling growth and the negative impact of higher US interest rates.
Whether the world economy can keep growing above trend in 2018-2019 will be determined by a mix of political and traditionally cyclical questions. With various disruptive processes under way − such as Brexit, attempts to revive European Union integration efforts, Donald Trump’s brand of US leadership and the new role of Russia, and especially China, in the international community − uncertainty is sharply higher. A US-Chinese trade war and escalating Middle Eastern tensions due to the recent US decision to withdraw from the Iran nuclear agreement pose the greatest risks, but our main scenario is that a US-Chinese trade war can be avoided. Both sides have much to lose, and Trump’s actions in other fields suggest that he may view relatively limited concessions from the other side as a success that may be an asset to him in the autumn US mid-term elections. An escalation can probably also be avoided on the Iran issue, but disruptions to Iran’s oil production, along with other underlying factors, are reasons why we now expect higher oil prices than before (USD 85/barrel for Brent crude in 2019).
Yet experience shows that political events rarely have such a big impact on economic activity, so cyclical analysis is crucial. There are many indications that the slowdown early in 2018 was temporary. Labour markets continue to strengthen. Along with rising asset prices, this will lay the groundwork for strong private consumption growth, despite only a moderate upturn in purchasing power. Meanwhile we will see a sharp, synchronised upturn in capital spending, in response to high resource utilisation. We are sticking to an optimistic forecast, with global GDP growth of about 4 per cent yearly both in 2018 and 2019. Our revisions since February’s Nordic Outlook are small.
One important question is to what degree supply-side restrictions will slow expansion. Recent inflation and wage signals generally suggest that central banks will instead have to keep struggling with troublingly low inflation. The main upside risk is that energy and other commodity prices may rise faster than we expect and that this may then spread to generally higher price and wage expectations.
Yet cyclical differences between the US and other advanced economies are larger than usual, greatly impacting our analysis of both the real economy and financial markets. Although US unemployment is now below 4 per cent, the wage response has been moderate, which also gives the Federal Reserve some flexibility, but it has recently been even clearer than the Fed must proceed with its key rate hikes by itself. We expect it to hike its key interest rate three more times this year, then twice to 3 per cent in 2019: close to a neutral level. Compared to February’s Nordic Outlook, this implies an upward adjustment of 0.25 points. For most other central banks, however, our forecast adjustment has been in the opposite direction as a consequence of dovish signals due to unexpectedly low inflation.
Global GDP growth Year-on-year percentage change
2016 2017 2018 2019
United States 1.5 2.3 2.8 2.5
Japan 0.9 1.7 1.2 1.0
Germany 1.9 2.2 2.4 2.1
China 6.7 6.9 6.6 6.2
United Kingdom 1.9 1.8 1.2 1.6
Euro zone 1.8 2.4 2.4 2.3
Nordic countries 2.2 2.3 2.4 2.3
Baltic countries 2.2 4.3 3.4 3.1
OECD 1.8 2.5 2.5 2.3
Emerging markets 4.4 4.8 5.1 5.1
World, PPP* 3.2 3.8 4.0 3.9
Source: OECD, IMF, SEB. * Purchasing power parities

Nordic Outlook: May 2018 5
Although US Treasury yields have tested the 3 per cent level, the yield curve has flattened greatly. Assuming five more Fed rate hikes, that trend will continue. Generally low international yields, combined with continued large Fed holdings of US government securities will limit the upturn in 10-year yields, which we believe will be 3.40 per cent at end-2019. The spread against Western Europe will remain wide, though; we forecast that German 10-year yields will reach only 1.30 per cent by the same date, while 10-year Swedish yields will be 1.70 per cent.
Despite some recovery this past month, the US dollar has reacted cautiously to the prospect of even wider key rate spreads. Although we expect the USD to regain some lost ground in the near term, the exchange rate channel will remain relatively quiet. As the European Central Bank (ECB) moves towards normalisation, structural factors that benefit the euro will again make themselves felt. The EUR/USD exchange rate will thus be in the 1.20-1.26 range during 2019. We expect the Swedish krona to appreciate steadily after the dramatic downturn that occurred after the Riksbank’s signals that it is further raising the bar for starting its policy normalisation. We expect the EUR/SEK rate to reach 9.70 by the end of 2019.
Stock markets have recently shaken off worries about rising US interest rates and threats of trade wars. Instead they have focused on growth prospects. Our forecast implies that share prices should climb about as fast as profits, that is, in the 6 to 10 per cent range in a 12-month perspective. But the growth picture no longer has room for any acceleration, and we expect greater volatility as the economic cycle matures and central bank support increasingly fades. The picture for Nordic stock exchanges is similar to the global situation. A weak krona is helping Swedish exporters but poses challenges to international investors in dealing with hard-to-predict currency movements.
G20: Synchronised capital spending growth Contributions from various regions, volume
Source: OECD
Broad capital spending upturn is driving GDP growth
When resource utilisation starts to become strained well into an economic upturn it is tempting to present a forecast in which GDP growth slows, for example to its trend rate, but history shows that this type of soft landing rarely occurs. On the contrary, late-cyclical demand usually has a strong dynamic. In this phase, household optimism is normally bolstered by a hot labour market and strong balance sheets due to high share and home prices. This pattern is also apparent today, but due to
weak real wage growth, consumption is still not really taking off. Yet we are now seeing broad-based capital spending growth in many countries as capacity utilisation reaches levels that trigger an expansion of production capacity. But this is a bit double-edged from a forecasting standpoint. Of course expanded production capacity improves the potential for long-lasting higher growth. Meanwhile capital spending is the demand component that shows the biggest fluctuations, and an investment boom has often been the final phase of a growth cycle. But because capital spending as a share of GDP is well below its level at the turn of the millennium, there is less risk of major reversals. In light of this, we find it hard not to believe that the slowdown early in 2018 was temporary, so we are sticking to above-trend GDP growth forecasts. In the US, GDP will grow by 2.8 per cent this year and by 2.5 per cent next year, while corresponding figures for the euro zone are 2.4 and 2.3 per cent.
“This time is different” or “business as usual”?
The US economic expansion has now been under way for nearly nine years; according to a National Bureau of Economic Research (NBER) estimate, the recession after the financial crisis ended in June 2009. This means that in terms of longevity, we have just exceeded the expansion of the 1960s. If our forecast proves correct, we will surpass the long 1990s upturn in mid-2019. In such a situation, it is reasonable to wonder how long the expansion can actually last. One argument in favour of its sustainability is that GDP growth since the end of the financial crisis has been lower than in earlier recovery periods. Although global debt is now high, it is not as easy either to identify obvious excesses that must soon or later trigger a recession.
US expansion moving towards record-breakinglongevity
Number of months from bottom to top, starting month
010
20304050607080
90100110120
010
20304050607080
90100110120
Oct Oct May Apr Feb Nov Mar Jul Nov Mar Nov Jun1945 1949 1954 1958 1961 1970 1975 1980 1982 1991 2001 2009
Source: NBER
Equilibrium metrics for GDP and unemployment might be a tool for determining how long the upturn can last. Unfortunately such metrics do not seem very stable, especially well into an upturn. When joblessness approaches levels on a par with or even below prevailing equilibrium estimates without wages and prices starting to accelerate (which has been true in recent decades), central banks and other decision makers face a dilemma. Should they rely on their earlier estimates and thus begin policy normalisation, or let the economy test how far unemployment can be pushed down without causing wages and prices to surge. The Fed seems to be trying to strike a balance between these strategies by continuing to hike rates, while adjusting its equilibrium estimate lower. Meanwhile there are risks in letting go of the “anchor” in analysing economic cycles,
6 Nordic Outlook: May 2018
among other things because inflation tends to surge very late in an almost counter-cyclical way, perhaps especially in Sweden.
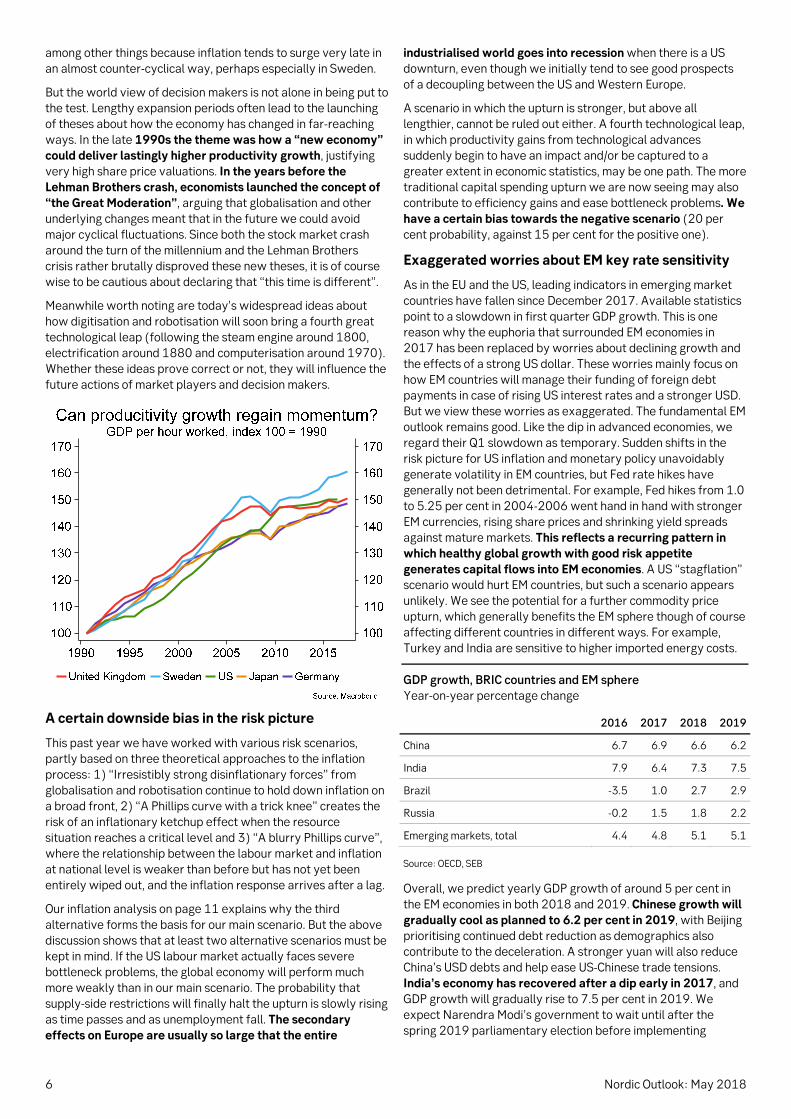
But the world view of decision makers is not alone in being put to the test. Lengthy expansion periods often lead to the launching of theses about how the economy has changed in far-reaching ways. In the late 1990s the theme was how a “new economy” could deliver lastingly higher productivity growth, justifying very high share price valuations. In the years before the Lehman Brothers crash, economists launched the concept of “the Great Moderation”, arguing that globalisation and other underlying changes meant that in the future we could avoid major cyclical fluctuations. Since both the stock market crash around the turn of the millennium and the Lehman Brothers crisis rather brutally disproved these new theses, it is of course wise to be cautious about declaring that “this time is different”.
Meanwhile worth noting are today’s widespread ideas about how digitisation and robotisation will soon bring a fourth great technological leap (following the steam engine around 1800, electrification around 1880 and computerisation around 1970). Whether these ideas prove correct or not, they will influence the future actions of market players and decision makers.
A certain downside bias in the risk picture
This past year we have worked with various risk scenarios, partly based on three theoretical approaches to the inflation process: 1) “Irresistibly strong disinflationary forces” from globalisation and robotisation continue to hold down inflation on a broad front, 2) “A Phillips curve with a trick knee” creates the risk of an inflationary ketchup effect when the resource situation reaches a critical level and 3) “A blurry Phillips curve”, where the relationship between the labour market and inflation at national level is weaker than before but has not yet been entirely wiped out, and the inflation response arrives after a lag.
Our inflation analysis on page 11 explains why the third alternative forms the basis for our main scenario. But the above discussion shows that at least two alternative scenarios must be kept in mind. If the US labour market actually faces severe bottleneck problems, the global economy will perform much more weakly than in our main scenario. The probability that supply-side restrictions will finally halt the upturn is slowly rising as time passes and as unemployment fall. The secondary effects on Europe are usually so large that the entire
industrialised world goes into recession when there is a US downturn, even though we initially tend to see good prospects of a decoupling between the US and Western Europe.
A scenario in which the upturn is stronger, but above all lengthier, cannot be ruled out either. A fourth technological leap, in which productivity gains from technological advances suddenly begin to have an impact and/or be captured to a greater extent in economic statistics, may be one path. The more traditional capital spending upturn we are now seeing may also contribute to efficiency gains and ease bottleneck problems. We have a certain bias towards the negative scenario (20 per cent probability, against 15 per cent for the positive one).
Exaggerated worries about EM key rate sensitivity
As in the EU and the US, leading indicators in emerging market countries have fallen since December 2017. Available statistics point to a slowdown in first quarter GDP growth. This is one reason why the euphoria that surrounded EM economies in 2017 has been replaced by worries about declining growth and the effects of a strong US dollar. These worries mainly focus on how EM countries will manage their funding of foreign debt payments in case of rising US interest rates and a stronger USD. But we view these worries as exaggerated. The fundamental EM outlook remains good. Like the dip in advanced economies, we regard their Q1 slowdown as temporary. Sudden shifts in the risk picture for US inflation and monetary policy unavoidably generate volatility in EM countries, but Fed rate hikes have generally not been detrimental. For example, Fed hikes from 1.0 to 5.25 per cent in 2004-2006 went hand in hand with stronger EM currencies, rising share prices and shrinking yield spreads against mature markets. This reflects a recurring pattern in which healthy global growth with good risk appetite generates capital flows into EM economies. A US “stagflation” scenario would hurt EM countries, but such a scenario appears unlikely. We see the potential for a further commodity price upturn, which generally benefits the EM sphere though of course affecting different countries in different ways. For example, Turkey and India are sensitive to higher imported energy costs.
GDP growth, BRIC countries and EM sphere Year-on-year percentage change
2016 2017 2018 2019
China 6.7 6.9 6.6 6.2
India 7.9 6.4 7.3 7.5
Brazil -3.5 1.0 2.7 2.9
Russia -0.2 1.5 1.8 2.2
Emerging markets, total 4.4 4.8 5.1 5.1
Source: OECD, SEB
Overall, we predict yearly GDP growth of around 5 per cent in the EM economies in both 2018 and 2019. Chinese growth will gradually cool as planned to 6.2 per cent in 2019, with Beijing prioritising continued debt reduction as demographics also contribute to the deceleration. A stronger yuan will also reduce China’s USD debts and help ease US-Chinese trade tensions. India’s economy has recovered after a dip early in 2017, and GDP growth will gradually rise to 7.5 per cent in 2019. We expect Narendra Modi’s government to wait until after the spring 2019 parliamentary election before implementing

Nordic Outlook: May 2018 7
further major reforms. Rising energy prices will boost inflation and force India to hike key interest rates in the second half of 2018. Russia’s economy is hampered by Western sanctions, relatively tight fiscal policy and blockages in reform efforts, but rising oil prices will benefit growth and eventually open the
way to more aggressive reforms. Relations with the EU and US remain tense but will probably have small and transient effects on the economy, so we believe the rouble will regain lost ground.
Political drama with minor economic consequences Because of various political conflicts in different areas, uncertainty is higher today than it has been for the past few decades. Although experience tells us that the short- and medium-term economic consequences will not be so large, these are dramatic events that may affect the world economy in the long term. Here is a summary of the most important areas: After his big tax package was approved by Congress late in 2017, US President Donald Trump turned his attention outward and has begun activating the protectionist agenda from his election campaign. Announcements of new tariffs, especially aimed at China, have repeatedly led to financial market turbulence this spring. Despite the risks, our main scenario is that a full-scale trade war can be avoided. So far, China has shown restraint. Minor concessions may be enough to enable Trump to score points ahead of the autumn mid-term elections. We have also seen US flexibility in North American Free Trade Agreement (NAFTA) negotiations with Canada and Mexico as well as in handling the US trade pact with South Korea (KORUS). Trump’s decision to pull the US out of the Iran nuclear deal is the latest dramatic event and could potentially have disastrous security consequences, considering the tensions in the Middle East. However, there is a good chance that EU countries can bring about compromises that will allow an escalation to be avoided. Trump’s actions in relation to North Korea also show that the mood can shift rapidly. Yet partly due to the prospect of enduring disruptions in Iran’s oil exports, we have adjusted our oil price forecast upward to an average of USD 75/barrel (Brent) in 2018 and USD 85 in 2019. Given the problems in Iran and Venezuela, combined with the agreement between the OPEC oil cartel, Russia and other countries as well as strong underlying demand – the balance between supply and demand has changed greatly. Higher oil prices will also make it easier for Russia to cope with expanded sanctions by the US and the EU.
In Western Europe the focus is on the Brexit process and how to deal with the future of the EU, now that a German grand coalition government has been formed. Late in 2017 the UK and EU reached a partial agreement on the conditions of British withdrawal. Since a transitional solution is also in place, which will delay actual withdrawal until the end of 2020, negotiations can now concentrate on the shape of future relations. A new UK-EU trade agreement is the most important area, but the Ireland border issue may well prove to be a tough nut to crack, carrying potential risks. Brexit talks are likely to be tough as special interests in individual countries are challenged and the unanimity that has predominated on the EU side risks vanishing. Meanwhile the UK government must seek support for future agreements both in its own divided Conservative Party and in a recalcitrant Parliament. Uncertainty is continuing to squeeze the UK economy, especially capital spending, but we still expect the parties to reach an accord since the costs of failure are so large. Increased hopes of deeper integration in the EU and the Economic and Monetary Union (EMU) after the Brexit decision and Emmanuel Macron’s victory in the French presidential election will now be put to the test. In concrete terms, the focus is on establishing a new European Monetary Fund to complete the European Banking Union and establish a new budgetary instrument to give individual countries more manoeuvring room to manage asymmetric shocks. Germany and France have promised major new joint proposals at the coming EU summit on June 28-29, but the outcome appears likely to be quite meagre. So far Germany’s new CDU/CSU-SPD grand coalition has shown limited enthusiasm for attempts by Paris and Brussels to speed up EU integration. One main reason behind German-French tensions is that Paris sees the advantages of centralising various types of risk management related to the euro project, while Berlin is afraid that countries and private market players will be encouraged to take greater risks and that German taxpayers will ultimately have to pay the bill. There is thus nothing that indicates any major breakthroughs at the upcoming summit.
Synchronised Nordic growth
The Nordic economies continue to show stable above-trend growth, which has also tended to become more synchronised. These small, export-dependent economies all benefit from strong global economic conditions and continued expansionary monetary policies. In Denmark, Norway and Sweden, varying degrees of labour market tightness will begin to limit growth potential ahead. Swedish GDP growth will be 2.6 per cent this year and 2.2 per cent in 2019 as residential construction falls significantly, but home prices have stabilised after their decline in the latter part of 2017. Our forecast that the price decline will
be limited to 10 per cent still stands, but a growing surplus of homes for sale implies an uncertain outlook further ahead. The manufacturing sector is gradually taking over as the most important growth driver, but high capacity utilisation will limit the stimulus effects of the weak krona. Meanwhile currency weakness will further strain an already squeezed retail sector due to higher purchase prices (see theme article, p. 29).
Norwegian growth is speeding up and indicators point to stronger conditions as higher increased profitability in the oil sector have positive secondary effects, especially on capital spending. Consumption growth will be relatively weak, with

8 Nordic Outlook: May 2018
higher interest rates squeezing household purchasing power, but housing market stabilisation has greatly reduced the downside risk for the domestic economy. Overall, we expect GDP to grow by 2.0 and 2.3 per cent respectively in 2018 and 2019; the mainland economy (excluding oil, gas and shipping) will grow by a somewhat faster pace in especially 2018. The Finnish economy is on more solid footing but has a long way to go; not until this year will GDP revert to its 2008 level. Exports and capital spending are the main growth drivers, while household spending is limited by continued tight fiscal policy and low pay increases due to the 2016 Competitiveness Pact between government, unions and employers. Denmark’s recovery is continuing; the economy will grow by 2-2.5 per cent yearly in 2018-2019. Consumption faces headwinds from credit tightening, but rising home prices will help households stay in a good mood. Consumption will thus still be the main growth driver, although capital spending will also increase.
Nordics, GDP growth Year-on-year percentage change
2016 2017 2018 2019
Sweden 3.2 2.4 2.6 2.2
Norway 1.1 1.9 2.0 2.3
Denmark 2.0 2.2 2.2 2.3
Finland 2.1 2.6 2.5 2.4
Source: National statistical offices, SEB
Central bank dilemma due to low late-cyclical inflation
Despite dramatic economic fluctuations and large commodity and producer prices movements, core inflation in advanced economies has varied within a range as narrow as the 0.6-1.9 per cent aggregate levels in the above chart. Variations have been a bit larger in individual economies, but here too there has been remarkable stability. Another key observation is that core inflation has climbed late in the cycle: for example, it culminated in 2002 and 2008, lagging well behind the growth peaks in 2000 and 2007. Phases of high core inflation were preceded by relatively long periods of strong expansion, rising world market prices and large energy and food price upturns. These helped lift
total CPI inflation above target, driving up inflation expectations and thus affecting price and wage formation more broadly at a later stage. This almost counter-cyclical inflation dynamic creates a dilemma for central banks, which in most cases they have failed to master. The actions of the ECB and Riksbank in 2001 and 2008 are obvious examples of this.
Subdued pay increases despite tight labour markets
Changes in the rate of pay hikes or the pricing environment of international commodity markets are the main potential sources of changes in the inflation outlook. Pay hikes remain generally low, especially in the euro zone and Japan, averaging just over 2 per cent yearly in the four largest advanced economies, which is generally below the level that is compatible with central bank inflation targets.
Yet it is obvious that US pay increases are connected to labour market changes. Recently the wage response has been weaker than in the previous decade. One reason may be that the labour market is not as tight as the registered employment figures indicate − for example because labour force participation is now much lower than at that time. Another reason may be that we have not yet had anything equivalent to the commodity price-driven upturn in headline CPI in 2004 and 2006, which led to higher inflation expectations. The euro zone lags well behind the US in terms of wage pressure. The recent unexpectedly high collective agreements in Germany’s manufacturing sector will cause acceleration, but it will take time before this spreads to other countries. In Japan, too, some tendencies towards higher pay are discernible, but the wage response to the lowest unemployment since the early 1990s has been disappointing.
It is thus unlikely that the resource situation in itself will push wages up so much that the inflation outlook will change greatly in 2018-2019. The question, then, is whether we may see another commodity-driven inflation surge that will push intermediate goods prices and inflation expectations higher. International producer prices have risen in the past two years, but the upturns are moderate compared to those of the 2000s. The ongoing synchronised economic expansion may push up commodity prices further, and the oil price increase of recent months represents an upside risk. But other factors suggest that the upturn will not be as sharp as in the previous decade. For example, Chinese demand for commodities is unlikely to be as dramatic as it was then. The potential for increased crude oil

Nordic Outlook: May 2018 9
production via North American shale technology and the rapid development of substitutes for fossil fuels also suggest that we will not face dramatic upturns in crude oil prices.
Our conclusion is that the inflation dynamic in most countries is largely following the pattern of recent decades. Our forecast implies that US headline CPI will exceed 2 per cent in the near term. Rising producer prices are an upside risk, but not even in the US is the rate of pay increases currently high enough to generate worryingly high underlying inflation pressure. There are signs that inflation will move higher, even in the euro zone and Japan, but within our forecast horizon most indications are that inflation will remain uncomfortably low for central banks.
Key interest rate spreads wider as Fed keeps hiking
Monetary policy normalisation is still moving slowly, and our inflation forecast confirms the impression that most central banks are struggling with troublingly low inflation. Meanwhile the robust global economy and an increasingly distant deflation threat open up the question of what central banks can do to prepare for the next recession. For example, the International Monetary Fund (IMF) is now, more firmly than before, emphasising the strength of the economy and no longer highlighting the risks of fragile demand (secular stagnation). The IMF has also once again begun to warn about high global debt, thereby providing indirect support to those factions in the central banking world that advocate normalisation.
Central bank key interest rates Per cent
9-May Sep 2018
Dec 2018
Dec 2019
Federal Reserve (Fed) 1.75 2.25 2.50 3.00
ECB (refi rate) 0.00 0.00 0.00 0.25
Bank of England (BoE) 0.50 0.50 0.50 1.00
Bank of Japan (BoJ) -0.10 -0.10 -0.10 -0.10
People’s Bank of China 4,35 4,35 4,35 4,60
Riksbank (Sweden) -0.50 -0.50 -0.50 0.00
Norges Bank (Norway) 0.50 0.75 1.00 1.25
Source: Central banks, SEB
Given an ever-tighter US labour market, the Fed will have to continue its solitary normalisation process, among major central banks. Although a mixed inflation and pay outlook will allow the Fed some flexibility, we expect it to raise its key rate three more times this year, followed by two hikes next year to 3.00 per cent (2.75 per cent in our February forecast). This is in line with the Fed’s own forecasts, but somewhat more than the market is discounting today. In the euro zone, we expect the ECB to decide in July to reduce the size of its bond purchases during the last three months of 2018, then end its quantitative easing. After that, the focus of attention will shift to changes in ECB key rates. We have moved back our forecast of the first hike in the deposit rate for banks to June 2019 and foresee a refi rate hike from zero to 0.25 per cent in September. In the UK, unexpectedly slow growth and low inflation early this year mean that previously signalled rate hikes this spring have been shelved. We now believe that the next UK rate hike will
occur in 2019. After repeated incorrect forecasts, the Bank of Japan no longer dares to say when inflation can be expected to reach its target. Thus no change in current ultra-loose BoJ monetary policy will be considered during our forecast period.
In April, unexpectedly low underlying inflation persuaded the Riksbank to again postpone its first rate hike until the end of 2018. The sharp depreciation in the SEK, combined with rising energy prices, appears likely to push inflation above the 2 per cent target during much of 2018. But as long as the central bank wants to see evidence that the strong economy will leave a mark on pay and service prices, we foresee a risk of further delays. We now believe the first rate hike will occur in April 2019, followed by a hike in the autumn. This means that the repo rate will stand at a low zero per cent at the end of 2019. Norway’s central bank has chosen a different strategy than Sweden’s, by focusing more on resource utilisation and accepting a longer period of below-target inflation. The Norges Bank rate path now indicates a very high probability of a rate hike in September, which we also believe the central bank will deliver. At the end of 2019, its key rate will be 1.25 per cent.
Cross-Atlantic key rate and currency tug-of-war
It is in line with the historical pattern for the US to lead the way in the key rate hiking cycle, but the lag time and key rate spread will be unusually large this time around. The ECB looks set to start its hikes only after the US key rate has reached 3 per cent, a level the Fed now regards as neutral. The continuing growth in the key rate spread reflects lagging euro zone resource utilisation as US unemployment approaches historical lows. The USD has not reacted much to the Fed hikes, which also creates potential for wider key rate spreads; an appreciating dollar would normally slow US inflation due to lower import prices. Conversely, a weaker euro would normally give further inflation support to the ECB, but now the EUR is instead tending to serve as an undesired brake on growth as well as inflation.
There are thus many indications that the ECB will face the next recession with very little interest rate ammunition. This means that its controversial bond purchases (QE) will probably become a continuing element of its policy. ECB officials have recently highlighted the size of the balance sheet, not only its changes, as an important policy tool that can exert downward pressure on interest rates even after net bond purchases have ended. Always having QE available will also allow fiscal policymakers greater flexibility in softening future recessions, since the ECB can intervene with stimulative purchases when falling market confidence in individual countries pushes interest rates and yields higher. This change will be especially evident if the plans for a jointly financed European monetary fund become a reality.
In the US, too, manoeuvring room ahead of a future recession is also limited in a historical perspective. The measures that have been discussed so far, such as a higher inflation target, introduction of (time-limited) price level targets or a transition to a nominal GDP target still seem too radical. One less far-reaching measure would be to allow some overshooting of inflation during the current cycle. The Fed’s statement that its inflation target is symmetric may be interpreted as meaning that the Fed has no problems with a period of above-target inflation for a change. Such a development would also reduce the risks of a further flattening of the yield curve, which at least some Fed policymakers have identified as a source of concern.

10 Nordic Outlook: May 2018
Government bond marketsYields diverging as central banks move in different directions
Due to a widening gap between Fed and ECB actions, spreads between US and German long-term government yields are at their widest since the 1980s. Looking ahead, spreads between key rates will increase even more, but moderate inflation and low international yields will restrain long-term US Treasury yields, leading to a very flat yield curve. The Riksbank’s dovish signals have squeezed Swedish yield spreads against Germany. We see potential for them to narrow further in the near term.
After a sharp upturn in global long-term yields early this year, we have seen shifting patterns recently. Worries about trade wars and geopolitical tensions have occasionally caused long-term yields to fall, but renewed risk appetite and rising inflation expectations have help US yields regain ground. US 10-year Treasuries recently surpassed the “magic” 3 per cent threshold for the first time since early 2014. Weak statistics and dovish central bank signals have pushed German and Swedish yields close to earlier lows. A widening gap between the US Federal Reserve and the European Central Bank is reflected in a yield spread of more than 240 basis points between 10-year US and German government bonds: the widest since the 1980s.
The market is now pricing in slightly more than two more Fed key interest rate hikes in 2018. As market pricing shifts towards our forecast of three hikes, short-term yields will climb. Rising short-term yields along with gradually higher inflation suggest that long-term yields will also climb. Also pulling in this direction is a greater need for US bond issues following an underfunded tax reform and the Fed’s continued shrinking of its balance sheet, which we estimate will be equivalent to about one rate hike in 2018. But our view is that underlying inflation pressure is still moderate. Along with continued loose monetary policies elsewhere in the world, this will limit the upturn in US long-term yields. We forecast that 10-year US Treasuries will climb gradually to 3.15 per cent by the end of 2018 and 3.40 per cent at the end of 2019, but the risk is clearly on the upside.
We thus expect the yield spread between 10-year and 2-year US Treasuries to keep shrinking from the current 45 basis points or so to around 20 bps at the end of 2019. The resulting flatter yield curve will be a focus of attention ahead, since all ten post-war US recessions were preceded by inverted yield curves. Even if the slope of the yield curve remains positive throughout our forecast period, it will probably be close enough to zero for traditional correlations to signal a rather high recession risk. But our assessment is that international long-term yields are being kept artificially low. Although the Fed has begun to shrink its balance sheet, it remains a large owner of Treasury securities. Meanwhile continued exceptional stimulus in Japan and the euro zone is helping to hold down even US long-term yields. This suggests that the slope of the curve is now a less relevant indicator than before (see November’s Nordic Outlook).
We believe that first quarter Western European economic weakness was temporary. Along with a gradual normalisation by the ECB, this suggests that German yields will rebound from their current lows. But due to continued low inflation, the ECB will move more slowly than we had anticipated. We have thus adjusted our forecast of German 10-year yields to 0.80 per cent at the end of 2018 and 1.30 per cent at end-2019. We expect the US-German yield spread to remain wide at the end of 2018 (230 bps) and shrink in 2019 as the ECB begins its hikes.
The Riksbank’s signals that it will postpone its first rate hike, along with its strategy of re-investing bonds maturing in spring 2019, have squeezed the spread between Swedish and German 10-year yields, which are now close to recent years’ lows of around 15 bps. Given our forecast that the Riksbank will wait until 2019 before hiking its key rate and will keep buying more government bonds than are issued, the spread is likely to shrink a bit more. Once the Riksbank begins rate hikes next year, we believe the spread will again widen a bit, reaching 40 bps at end-2019. We thus expect Swedish 10-year yields of 0.95 per cent at the end of 2018 and 1.70 per cent end-2019.
Norwegian bonds trade with a large pick-up against German equivalents. This is partly because Norway has not introduced unconventional monetary policy measures. We expect Norges Bank’s rate hike to keep the 10-year yield spread against Germany at 120 basis points by the end of 2018. In 2019, higher German yields and initial rate hikes from the ECB will tighten the spread to 85 basis points by the end of the year.
Nordic Outlook: May 2018 11
Foreign exchange marketsThe outlook is uncertain, because of diffuse driving forces
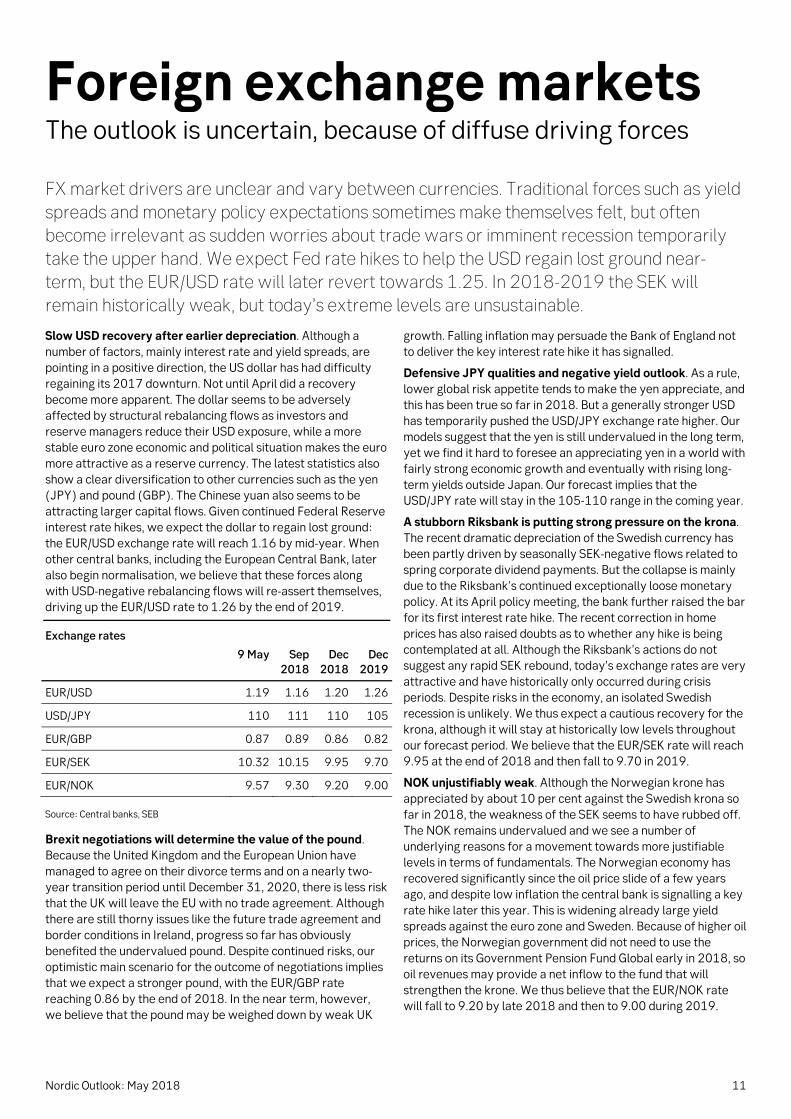
FX market drivers are unclear and vary between currencies. Traditional forces such as yield spreads and monetary policy expectations sometimes make themselves felt, but often become irrelevant as sudden worries about trade wars or imminent recession temporarily take the upper hand. We expect Fed rate hikes to help the USD regain lost ground near-term, but the EUR/USD rate will later revert towards 1.25. In 2018-2019 the SEK will remain historically weak, but today’s extreme levels are unsustainable.
Slow USD recovery after earlier depreciation. Although a number of factors, mainly interest rate and yield spreads, are pointing in a positive direction, the US dollar has had difficulty regaining its 2017 downturn. Not until April did a recovery become more apparent. The dollar seems to be adversely affected by structural rebalancing flows as investors and reserve managers reduce their USD exposure, while a more stable euro zone economic and political situation makes the euro more attractive as a reserve currency. The latest statistics also show a clear diversification to other currencies such as the yen (JPY) and pound (GBP). The Chinese yuan also seems to be attracting larger capital flows. Given continued Federal Reserve interest rate hikes, we expect the dollar to regain lost ground: the EUR/USD exchange rate will reach 1.16 by mid-year. When other central banks, including the European Central Bank, later also begin normalisation, we believe that these forces along with USD-negative rebalancing flows will re-assert themselves, driving up the EUR/USD rate to 1.26 by the end of 2019.
Exchange rates
9 May Sep 2018
Dec 2018
Dec 2019
EUR/USD 1.19 1.16 1.20 1.26
USD/JPY 110 111 110 105
EUR/GBP 0.87 0.89 0.86 0.82
EUR/SEK 10.32 10.15 9.95 9.70
EUR/NOK 9.57 9.30 9.20 9.00
Source: Central banks, SEB
Brexit negotiations will determine the value of the pound. Because the United Kingdom and the European Union have managed to agree on their divorce terms and on a nearly two-year transition period until December 31, 2020, there is less risk that the UK will leave the EU with no trade agreement. Although there are still thorny issues like the future trade agreement and border conditions in Ireland, progress so far has obviously benefited the undervalued pound. Despite continued risks, our optimistic main scenario for the outcome of negotiations implies that we expect a stronger pound, with the EUR/GBP rate reaching 0.86 by the end of 2018. In the near term, however, we believe that the pound may be weighed down by weak UK
growth. Falling inflation may persuade the Bank of England not to deliver the key interest rate hike it has signalled.
Defensive JPY qualities and negative yield outlook. As a rule, lower global risk appetite tends to make the yen appreciate, and this has been true so far in 2018. But a generally stronger USD has temporarily pushed the USD/JPY exchange rate higher. Our models suggest that the yen is still undervalued in the long term, yet we find it hard to foresee an appreciating yen in a world with fairly strong economic growth and eventually with rising long-term yields outside Japan. Our forecast implies that the USD/JPY rate will stay in the 105-110 range in the coming year.
A stubborn Riksbank is putting strong pressure on the krona. The recent dramatic depreciation of the Swedish currency has been partly driven by seasonally SEK-negative flows related to spring corporate dividend payments. But the collapse is mainly due to the Riksbank’s continued exceptionally loose monetary policy. At its April policy meeting, the bank further raised the bar for its first interest rate hike. The recent correction in home prices has also raised doubts as to whether any hike is being contemplated at all. Although the Riksbank’s actions do not suggest any rapid SEK rebound, today’s exchange rates are very attractive and have historically only occurred during crisis periods. Despite risks in the economy, an isolated Swedish recession is unlikely. We thus expect a cautious recovery for the krona, although it will stay at historically low levels throughout our forecast period. We believe that the EUR/SEK rate will reach 9.95 at the end of 2018 and then fall to 9.70 in 2019.
NOK unjustifiably weak. Although the Norwegian krone has appreciated by about 10 per cent against the Swedish krona so far in 2018, the weakness of the SEK seems to have rubbed off. The NOK remains undervalued and we see a number of underlying reasons for a movement towards more justifiable levels in terms of fundamentals. The Norwegian economy has recovered significantly since the oil price slide of a few years ago, and despite low inflation the central bank is signalling a key rate hike later this year. This is widening already large yield spreads against the euro zone and Sweden. Because of higher oil prices, the Norwegian government did not need to use the returns on its Government Pension Fund Global early in 2018, so oil revenues may provide a net inflow to the fund that will strengthen the krone. We thus believe that the EUR/NOK rate will fall to 9.20 by late 2018 and then to 9.00 during 2019.

12 Nordic Outlook: May 2018
Stock marketsA positive but more uncertain outlook for equities
This spring the previous upward stock market trend has been replaced by more volatile, trendless markets. Continued positive fundamentals suggest that this is a correction, not a trend reversal. But the growth outlook no longer has room for any acceleration, and some investors are pondering the next trend after years of good growth. We expect modest stock market upturns for a while, but also greater volatility once the growth outlook turns cloudy and central bank support increasingly fades.
After diving in early February, the MSCI All Country World Index has treaded water: a familiar pattern from earlier corrections. It is actually a sign of health that last year’s nearly linear upturn, followed by a January rally after Trump’s tax cuts, came to an end. The decline has brought down valuations to more reasonable levels, while according to surveys the investor community has pivoted from risk-embracing to more balanced positioning.
Underlying conditions remain positive, given our optimistic 2018 and 2019 growth outlook. This geographically broad expansion is reflected in corporate earnings forecasts. The consensus forecast points to global earnings increases of about 14 per cent this year and nearly 10 per cent in 2019. This year’s forecast is lifted by the impact of tax reform in the US, where earnings are expected to grow more than 17 per cent. For both years, somewhat above-average overall earnings growth in emerging markets is predicted.
Low interest rates and yields are still helping to sustain equities, and early steps to normalise monetary policy are actually a confirmation of the healthy growth outlook. The normal pattern is that the stock market reacts positively when interest rates and yields begin to rise. Although our optimism about the economy is confirmed by generally strong quarterly results, stock exchanges remain hesitant this spring. Worries about trade wars have been cited as one explanation. These worries are probably a contributing factor, but our impression is instead that investors’ view of how long rapid growth can last will determine stock market performance in the next several quarters. Because of the stock market’s reputation as a leading indicator (shares have historically often plunged 6-12 months before the economy), pension funds and other long-term
investors are already hesitating to boost the equity allocation in their portfolios, despite the optimistic macroeconomic outlook.
Signals of faster rate hikes by central banks − especially the US Federal Reserve (Fed) − and US Treasury yields at somewhat more normal levels also mean that impulses from the fixed-income world are approaching the point where headwinds replace tailwinds. A lengthy period of surplus liquidity has helped dampen stock market volatility. Once this liquidity disappears, greater volatility may loom.
Due to positive fundamentals and a lack of attractive alternatives, we are not seeing large outflows from stock markets. Assuming that 2019 will be another good year for economic growth and corporate earnings, there should be reason for continued, though more modest, stock market upturns. This late in the economic cycle, we see only limited room for value-driven upturns. We regard current valuations, with a global price/earnings ratio of just above 15 on 12-month earnings forecasts, as reasonable compared to historical average P/E ratios and yields. This implies that share prices should climb at about the same rate as corporate earnings, or by 6-10 per cent in 12 months. Looking ahead, each quarter that meets today’s expectations will move us closer to the point where we may need to consider reducing the risk in our portfolios. On the other hand, we can argue that if share prices remain flat while earnings keep climbing, stock market valuations will gradually become more attractive. Signs that the economic growth phase will last longer would thus probably fuel larger and/or lengthier upturns.
Weak krona both positive and negative for equities
Because of internationalisation and synchronised growth, the global picture essentially applies to Nordic stock markets as well. Valuations are in line with those in the euro zone, and we expect earnings growth of around 9 per cent for companies in our Nordic universe this year and next. A larger element of cyclical sectors and a weak currency that is benefiting exports are pluses for shares listed in Stockholm, along with good direct returns, but hard-to-predict currency movements seem to be making some international investors wary of Swedish assets, thereby limiting their potential. Conversely, the krona depreciation has given SEK-based investors higher returns on their global holdings and thus new reasons to boost their allocation to Swedish equities somewhat, thus improving the potential for decent stock market performance.

Nordic Outlook: May 2018 13
The United StatesAbove-trend growth but trade tensions are a downside risk
After a temporary dip in Q1 2018, we expect GDP growth to remain above trend during the next few quarters – driven by a strong labour market, tax cuts and business investments. US trade policy has become clearly protectionist, and escalating US-Chinese trade tensions are a downside risk. Inflation is expected to accelerate in 2018, and the Fed will hike its key interest rate three more times this year and twice in 2019 while continuing to shrink its balance sheet as planned.
The US economy will continue to perform well, even though the first quarter was again something of a disappointment. GDP growth slowed to an annualised 2.3 per cent, compared to nearly 3 per cent in the final quarter of 2017. As in prior years, this weak start can be explained by temporary factors. For example, private consumption was pulled down by delayed tax refunds. The slowdown in consumption should also be viewed against the backdrop of a very strong fourth quarter upturn.
We expect economic activity to accelerate again in the second quarter. Sentiment indicators have weakened a bit in recent months, but from record-high levels. Underlying growth potential remains expansive, as the labour market continues to strengthen and tax cuts boost household purchasing power. Capacity utilisation will keep climbing. Combined with more favourable tax conditions, this will provide incentives for businesses to boost their investments. Despite strong export performance, which will draw continued support from healthy international demand, we do not expect net exports to provide any major contribution to growth. Imports will increase even faster than exports and will enjoy an extra stimulus from the tax cuts. The risk of escalation in the US-Chinese trade conflict is a downside risk, but a trade war can probably be avoided. Overall, we are sticking to our forecast that GDP will increase by 2.8 per cent in 2018 and by 2.5 per cent in 2019.
As expected, the Federal Reserve (Fed) hiked its key interest rate in March. We believe that the central bank will hike its key rate three more times in 2018 and then follow this up with two
hikes during 2019. This will leave the key rate at 3.0 per cent by the end of our forecast period.
Protectionism a downside risk to economic growth
Considering Donald Trump’s protectionist rhetoric during the presidential election campaign, US trade policy was surprisingly cautious during his first year in the White House. Although the US withdrew from the Trans-Pacific Partnership (TPP), it did not impose any tariffs on Chinese imports. Nor did Trump exit the North American Free Trade Agreement (NAFTA) but was content to initiate renegotiations. In 2017 his administration focused on domestic issues, including attempts to repeal Obamacare and push through its tax package.
In 2018 the focus shifted towards foreign policy issues, and US trade policies have swung in a clearly protectionist direction. Trump is calculating that a tough trade policy will be popular among his core voters and will benefit the Republicans in the November mid-term elections. In March he announced tariffs on imported steel and aluminium and early in April also tariffs on USD 50 billion worth of imports from China, to be expanded by another USD 100 billion worth of imports. China responded quickly with its own proposed tariffs on US goods. These steps triggered stock market declines, driven by worries that the situation might escalate. Our main scenario, however, is that trade wars can be avoided. It may be enough for China to make some concessions, enabling Trump to score points ahead of the mid-term elections. The NAFTA negotiations and the handling of the US-South Korean trade agreement (KORUS) have shown American flexibility, and there is good potential to reach a NAFTA agreement. So far, China has also shown a degree of restraint in its countermeasures. If fully implemented, the measures announced so far by the US and China would still have little impact on the real economy.
Even if trade tensions do not escalate in the near term, there is no simple solution to the conflicts between the US and China. America’s large bilateral trade deficit will persist, while China’s great power ambitions and President Xi Jinping’s sensitivity to domestic criticism will impose limits on his willingness to compromise. Looking ahead, a major worsening of the situation thus cannot be ruled out.
Tax cuts will increase federal budget deficits
The package of federal tax cuts approved late in 2017 will provide an extra small jolt to US economic growth. Businesses
14 Nordic Outlook: May 2018
will benefit from a corporate tax cut and lower taxation of foreign profits. Households will enjoy lower income taxes as well as a near-doubling of the standard deduction, but these tax cuts will mainly benefit high-income households. We expect the tax cuts to boost GDP growth by around 0.3 percentage points in 2018 and 0.4 points in 2019, thanks to increased capital spending and consumption. This was one reason why we revised our GDP growth forecast upward in February’s Nordic Outlook.
The tax cuts are largely unfunded and will thus weaken federal government finances. In February, Congress also reached a budget agreement that will boost federal spending by around 0.7 per cent of GDP in 2018. The budget deficit is expected to exceed 5 per cent of GDP in 2019. In the short term, the deficit is not a major problem, but a bit further ahead the situation looks worse. In late April, the non-partisan Tax Policy Center presented an updated analysis of US federal finances. The tone of this report is pessimistic. Despite healthy growth and full employment, federal deficits will increase and will remain large as long as significant steps are not taken. We believe that the US national debt will increase to 110 per cent of GDP by 2021.
Temporary dip in consumption
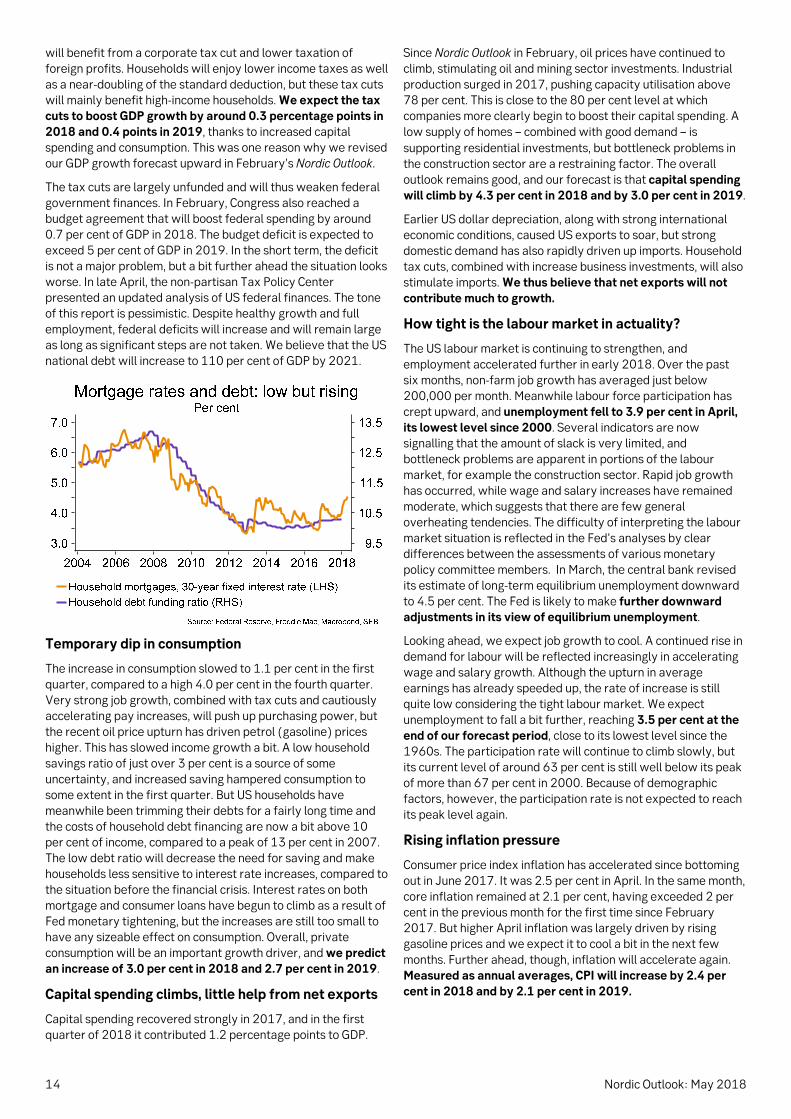
The increase in consumption slowed to 1.1 per cent in the first quarter, compared to a high 4.0 per cent in the fourth quarter. Very strong job growth, combined with tax cuts and cautiously accelerating pay increases, will push up purchasing power, but the recent oil price upturn has driven petrol (gasoline) prices higher. This has slowed income growth a bit. A low household savings ratio of just over 3 per cent is a source of some uncertainty, and increased saving hampered consumption to some extent in the first quarter. But US households have meanwhile been trimming their debts for a fairly long time and the costs of household debt financing are now a bit above 10 per cent of income, compared to a peak of 13 per cent in 2007. The low debt ratio will decrease the need for saving and make households less sensitive to interest rate increases, compared to the situation before the financial crisis. Interest rates on both mortgage and consumer loans have begun to climb as a result of Fed monetary tightening, but the increases are still too small to have any sizeable effect on consumption. Overall, private consumption will be an important growth driver, and we predict an increase of 3.0 per cent in 2018 and 2.7 per cent in 2019.
Capital spending climbs, little help from net exports
Capital spending recovered strongly in 2017, and in the first quarter of 2018 it contributed 1.2 percentage points to GDP.
Since Nordic Outlook in February, oil prices have continued to climb, stimulating oil and mining sector investments. Industrial production surged in 2017, pushing capacity utilisation above 78 per cent. This is close to the 80 per cent level at which companies more clearly begin to boost their capital spending. A low supply of homes − combined with good demand − is supporting residential investments, but bottleneck problems in the construction sector are a restraining factor. The overall outlook remains good, and our forecast is that capital spending will climb by 4.3 per cent in 2018 and by 3.0 per cent in 2019.
Earlier US dollar depreciation, along with strong international economic conditions, caused US exports to soar, but strong domestic demand has also rapidly driven up imports. Household tax cuts, combined with increase business investments, will also stimulate imports. We thus believe that net exports will not contribute much to growth.
How tight is the labour market in actuality?
The US labour market is continuing to strengthen, and employment accelerated further in early 2018. Over the past six months, non-farm job growth has averaged just below 200,000 per month. Meanwhile labour force participation has crept upward, and unemployment fell to 3.9 per cent in April, its lowest level since 2000. Several indicators are now signalling that the amount of slack is very limited, and bottleneck problems are apparent in portions of the labour market, for example the construction sector. Rapid job growth has occurred, while wage and salary increases have remained moderate, which suggests that there are few general overheating tendencies. The difficulty of interpreting the labour market situation is reflected in the Fed’s analyses by clear differences between the assessments of various monetary policy committee members. In March, the central bank revised its estimate of long-term equilibrium unemployment downward to 4.5 per cent. The Fed is likely to make further downward adjustments in its view of equilibrium unemployment.
Looking ahead, we expect job growth to cool. A continued rise in demand for labour will be reflected increasingly in accelerating wage and salary growth. Although the upturn in average earnings has already speeded up, the rate of increase is still quite low considering the tight labour market. We expect unemployment to fall a bit further, reaching 3.5 per cent at the end of our forecast period, close to its lowest level since the 1960s. The participation rate will continue to climb slowly, but its current level of around 63 per cent is still well below its peak of more than 67 per cent in 2000. Because of demographic factors, however, the participation rate is not expected to reach its peak level again.
Rising inflation pressure
Consumer price index inflation has accelerated since bottoming out in June 2017. It was 2.5 per cent in April. In the same month, core inflation remained at 2.1 per cent, having exceeded 2 per cent in the previous month for the first time since February 2017. But higher April inflation was largely driven by rising gasoline prices and we expect it to cool a bit in the next few months. Further ahead, though, inflation will accelerate again. Measured as annual averages, CPI will increase by 2.4 per cent in 2018 and by 2.1 per cent in 2019.

Nordic Outlook: May 2018 15
Producer price inflation (PPI) has continued to accelerate, driven partly by earlier dollar depreciation by also due to an increase in underlying price pressure. Core PPI is now increasing at its fastest pace in seven years. Purchasing manager sub-indices also indicate that businesses will face rising prices.
In March the Fed made a marginal upward revision in its core inflation forecast for the end of 2019, using the personal consumption expenditures (PCE) deflator, but stuck to its forecast that this metric would be slightly below the 2 per cent target at the close of 2018. Our forecast is that core PCE measured as full-year averages will increase by 2.0 per cent in 2018 and 2.2 per cent in 2019. Expectations of a cautiously accelerating inflation rate imply that the Fed can continue with its gradual monetary policy tightening.
Fed will hike its key rate to 3 per cent in 2019
As expected, the Fed hiked its key interest rate at the March policy meeting. The individual rate path forecasts of Federal Open Market Committee members (“dot plots”) shifted clearly towards a total of four rate hikes in 2018, but not enough to change the median forecast from three hikes. The Fed also presented a substantially more optimistic view of economic growth, revising its 2018 and 2019 GDP forecasts upward. It expects tax cuts and expanded budget expenditures to have a significant impact on economic growth. But the Fed left its inflation forecasts largely unchanged, although the central bank clearly now feels more comfortable with its forecast that core PCE, its main inflation metric, will be close to the 2 per cent target at the end of 2018. Our assessment is that the Fed will change its official forecast to four rate hikes in 2018 when it presents updated forecasts in June. We are thus sticking to our forecast of three additional rate hikes this year. Meanwhile we expect the Fed to continue shrinking its balance sheet as planned, with re-investments gradually falling. We believe the reduction process will be completed by about 2020-2021.
There is greater uncertainty about 2019 and later years, accentuated by clear differences between the views of individual FOMC members. Given our macro scenario, with PCE inflation stabilising around the 2 per cent target while economic activity begins to decelerate cautiously late in 2018, we believe that the Fed will be satisfied with two rate hikes in 2019. This would leave the federal funds rate at 3.00 per cent.
Yet there are conceivable scenarios in which the Fed might be forced to make either more or fewer rate hikes. Given an ever-tighter labour market and an expansionary fiscal policy late in
the economic cycle, it cannot be ruled out that inflation might climb more sharply. Such a scenario would force the Fed to speed up its rate hikes further. Some FOMC members have also indicated their openness to such a scenario, where the key rate would need to be hiked above 3 per cent as early as 2019.
Another scenario is that the Fed might be forced to interrupt its rate hikes in order to avoid a policy mistake. This scenario arose in late April when US 10-year Treasury yields broke through the psychologically important 3 per cent level. The yield upturn was connected to greater inflation worries, driven by higher oil prices combined with the Fed’s optimistic view of economic growth and growing expectations of a more aggressive monetary policy, which in turn resulted in stock market instability and a stronger dollar. On the other hand, if long-term yields do not react at all, a flatter yield curve would create uncertainty as the Fed continues its upward march. An inversion in the yield curve (with higher short-term than long-term yields) has historically been a good indicator of approaching recession. However, downward pressure on bond yields due to central banks’ QE programmes and the extremely low interest rates in other OECD countries may be reasons why the current signalling value is not so strong.
However, the Fed has communicated that it is not especially worried about stock market trends and long-term yields. The volatility we have seen to date is far from enough to halt the Fed’s rate hikes. A relatively moderate price level in the housing market, combined with reduced debts in the household sector, also means that the most important macroeconomic sector has increased its resilience to rate hikes. We thus believe that the question of potential policy mistakes connected to the Fed’s rate hiking plans will become an issue primarily in a longer time perspective, beyond our forecast horizon.
16 Nordic Outlook: May 2018
The euro zoneTemporary hesitation, but continued above-trend growth Despite a hesitant start to the year, partly due to weather, growth forces will dominate 2018-2019. Strong labour markets, looser fiscal policies and solid global demand will outweigh a strong euro and trade tensions. GDP will gain 2.4 per cent in 2018 and 2.3 per cent next year. More and more firms are citing recruitment problems, but pay hikes and inflation will remain low. Along with structural reforms, this will allow unemployment to fall further. ECB rate hikes will start only in summer 2019.
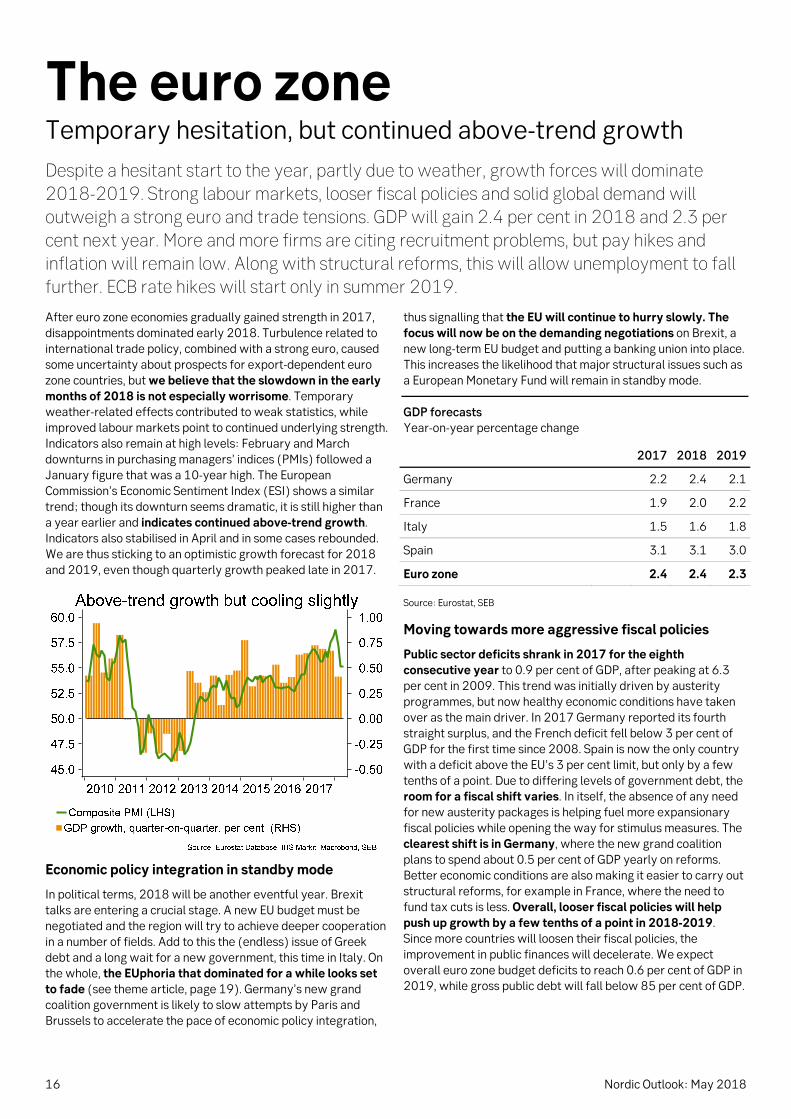
After euro zone economies gradually gained strength in 2017, disappointments dominated early 2018. Turbulence related to international trade policy, combined with a strong euro, caused some uncertainty about prospects for export-dependent euro zone countries, but we believe that the slowdown in the early months of 2018 is not especially worrisome. Temporary weather-related effects contributed to weak statistics, while improved labour markets point to continued underlying strength. Indicators also remain at high levels: February and March downturns in purchasing managers’ indices (PMIs) followed a January figure that was a 10-year high. The European Commission’s Economic Sentiment Index (ESI) shows a similar trend; though its downturn seems dramatic, it is still higher than a year earlier and indicates continued above-trend growth. Indicators also stabilised in April and in some cases rebounded. We are thus sticking to an optimistic growth forecast for 2018 and 2019, even though quarterly growth peaked late in 2017.
Economic policy integration in standby mode
In political terms, 2018 will be another eventful year. Brexit talks are entering a crucial stage. A new EU budget must be negotiated and the region will try to achieve deeper cooperation in a number of fields. Add to this the (endless) issue of Greek debt and a long wait for a new government, this time in Italy. On the whole, the EUphoria that dominated for a while looks set to fade (see theme article, page 19). Germany’s new grand coalition government is likely to slow attempts by Paris and Brussels to accelerate the pace of economic policy integration,
thus signalling that the EU will continue to hurry slowly. The focus will now be on the demanding negotiations on Brexit, a new long-term EU budget and putting a banking union into place. This increases the likelihood that major structural issues such as a European Monetary Fund will remain in standby mode.
GDP forecasts Year-on-year percentage change
2017 2018 2019
Germany 2.2 2.4 2.1
France 1.9 2.0 2.2
Italy 1.5 1.6 1.8
Spain 3.1 3.1 3.0
Euro zone 2.4 2.4 2.3
Source: Eurostat, SEB
Moving towards more aggressive fiscal policies
Public sector deficits shrank in 2017 for the eighth consecutive year to 0.9 per cent of GDP, after peaking at 6.3 per cent in 2009. This trend was initially driven by austerity programmes, but now healthy economic conditions have taken over as the main driver. In 2017 Germany reported its fourth straight surplus, and the French deficit fell below 3 per cent of GDP for the first time since 2008. Spain is now the only country with a deficit above the EU’s 3 per cent limit, but only by a few tenths of a point. Due to differing levels of government debt, the room for a fiscal shift varies. In itself, the absence of any need for new austerity packages is helping fuel more expansionary fiscal policies while opening the way for stimulus measures. The clearest shift is in Germany, where the new grand coalition plans to spend about 0.5 per cent of GDP yearly on reforms. Better economic conditions are also making it easier to carry out structural reforms, for example in France, where the need to fund tax cuts is less. Overall, looser fiscal policies will help push up growth by a few tenths of a point in 2018-2019. Since more countries will loosen their fiscal policies, the improvement in public finances will decelerate. We expect overall euro zone budget deficits to reach 0.6 per cent of GDP in 2019, while gross public debt will fall below 85 per cent of GDP.

Nordic Outlook: May 2018 17
Broad-based growth, both geographic and sectoral
The downturn in indicators early this year was broad-based, but with some interesting differences. In the past six months, PMI in France has generally been higher than in Germany, indicating that other large euro zone economies may take the lead when supply-side restrictions emerge in Germany. We also expect growth in France, Italy and Spain to remain well above trend in 2019, causing euro zone GDP growth to slow moderately from 2.4 per cent this year to 2.3 per cent in 2019 even though Germany will decelerate (but continue growing above trend).
Euro appreciation (about 10 per cent compared to a year ago, both against the US dollar and trade-weighted) is creating headwinds for exports, but weak industrial production early this year was probably due mainly to weather effects and seasonal variations. Despite trade policy threats and the strong euro, businesses remain very optimistic about production in the coming months. According to the ESI, businesses also remain satisfied with the order situation, though a drop in new orders poses a downside risk. Overall, we believe exports will rise by 4.5-5 per cent yearly in 2018 and 2019, but due to the general recovery in the region, imports will rise faster than exports. The euro zone’s large current account surplus will thus gradually shrink but stay above 3 per cent of GDP throughout our forecast period. Yet there are major gaps within the region: Germany’s surplus will remain around 8 per cent of GDP while the other euro zone countries combined will be close to balance. This means Germany will continue to endure criticism, especially from the US, but is likely to adhere to the counter arguments that it cannot influence the role of currency in competitiveness and that its fiscal policy will now become more expansionary.
Rising capacity utilisation is helping push industrial investments higher: uncertainty about trade conditions is not big enough to stop corporate expansion plans. Because home prices are climbing in the euro zone, residential investments are also accelerating. The latest home price statistics show a year-on-year upturn of around 7 per cent in Spain and around 4 per cent in Germany and France, while prices in Italy have stabilised after several years of falling. Overall, we expect capital spending to increase by about 4 per cent yearly in 2018 and 2019.
Subdued consumption, despite optimistic households
In recent months, consumer confidence has remained at close to the highest levels for the past 30 years despite the drop in
business indicators. The gradual labour market improvement has played an especially big role in keeping the mood up, but looser fiscal policies and rising home prices due to extremely low interest rates are also important. But partly because inflation has accelerated a bit − which has dampened purchasing power, while the household savings ratio has started to climb somewhat from depressed levels − consumption and retail sales have shown unexpectedly weak growth. Looking ahead, strong labour markets and rising asset prices will result in a continued favourable consumption climate, but as long as wages and salaries do not take off, real income increases will remain modest. Consumption will increase a bit faster in 2018-2019 than in recent years, at about 2 per cent annually.
Labour markets will show continued strength
Unemployment was 8.5 per cent in February: 1 percentage point lower than a year earlier and the lowest since December 2008. In mid-2017 employment surpassed its pre-crisis peak, and in the past year the number of jobs in the euro zone as a whole rose by 2.3 million. The largest job creation is in Spain and Germany, but France and Italy are also contributing. Most indications are that this positive labour market trend will continue. Measured as annual averages, unemployment will fall to 8.4 per cent in 2018 and 7.9 per cent in 2019. Yet it is clear that in some countries, especially Germany, it is harder and harder to recruit employees. According to the European Commission sentiment indicator, labour shortages are now as important an obstacle to business expansion as demand shortages, which is unique since measurements began in 1985. Even in countries with high unemployment, a shortage of qualified labour seems to be a growing problem, raising the question of how far unemployment can fall in the euro zone.
Generally rather high unemployment, rising labour force participation, geographic labour mobility and a continued need to improve competitiveness in many countries will have a dampening effect on pay increases. Although we see signals, especially from Germany, that the healthy economic situation has enabled labour unions to negotiate faster pay hikes, overall wage response remains weak. We expect average pay hikes to accelerate moderately in the euro zone, from just below 2 per cent in 2017 to 2.5 per cent in 2019. Of the large countries, Germany will lead the upturn, with pay increases creeping up to 3-3.5 per cent, while Italy and Spain will be around 1 per cent. Combined with structural reforms in labour markets, this

18 Nordic Outlook: May 2018
indicates that equilibrium unemployment will be a bit below our forecast of 7.8 per cent at the end of 2019.
Inflation stuck at around 1.5 per cent
After jumping to 2 per cent early in 2017, inflation according to the EU’s harmonised index of consumer prices (HICP) has fallen. In the past year it has been around 1.5 per cent. Even though euro zone growth has clearly accelerated and labour markets are continuing to improve, price pressure remains low. Slightly broader pay increases are probably needed before inflation climbs faster. Core inflation is even more sluggish and has been stable at around 1 per cent since 2013. Viewed over a longer period, positive contributions from food and energy prices seem necessary to bring overall inflation closer to the European Central Bank (ECB) target of “below, but close to, 2 per cent”. We have now seen energy prices climbing, which will have some impact on inflation, but the strength of the euro is meanwhile slowing this effect. We expect core inflation to stay around 1 per cent until early 2019, before climbing slowly towards 1.5 per cent late in the year. HICP inflation will remain around, or a bit below, 1.5 per cent throughout our forecast period.
ECB: The moment of truth is approaching
Despite healthy economic growth, the lethargic upturn in inflation is making the ECB normalisation process lengthy and, if anything, slower than we had previously expected. After the latest extension of its stimulative bond purchases until September this year, we expect no new concrete decisions on monetary policy in the near term. Yet the tug-of-war between ECB hawks and doves continues indirectly via communications in the form of speeches, leaks to the media, releases and press conferences. Our overall view that the winter’s signals of economic weakness are temporary supports a normalisation process that will become clearer starting this summer, but our forecast also indicates that low inflation will remain a headache even after 2018.
The ECB has clearly communicated that its bond purchases will end first and key interest rates will be raised after that. We believe the next important signal about the final phase of bond-buying will come in July. President Mario Draghi has indicated that a decision will come this summer, and the ECB probably wants to wait as long as possible before making it. We expect the ECB to extend its bond-buying one last time by three months,
until the end of 2018, with purchases being reduced to EUR 15 billion per month starting in October. We also expect the ECB to announce then that it will stop its bond-buying at year-end but will re-invest maturing principal and coupons.
Once the ECB has unveiled a plan for ending its bond purchases, the focus of attention will shift to interest rate signalling. At present, the ECB is communicating that key rates will remain at today’s levels for a lengthy period after bond purchases have ended, which market pricing interprets as 6-9 months. We expect the ECB to make these signals more specific, for example by indicating dates when it intends to hike key rates for the first time. Our forecast is that the ECB will take its first step in June 2019 by raising the deposit rate for banks by 15 basis points to -0.25 per cent. The ECB may try to tone down this hike by calling it a technical adjustment that normalises the interest rate corridor to 25 bps. The first refi rate hike, by 25 bps, will occur in September 2019. After he has struggled with euro zone crises and low inflation throughout his eight years as ECB president, this will be Mr. Draghi’s first and last refi rate hike before his term expires in November 2019.

Nordic Outlook: May 2018 19
Theme: The EU in 2025 Time is running short before the 2019 deadline
Ahead of the EU’s June 2018 summit, France and the Commission are pushing member countries, especially Germany, to speed up integration processes. The ECB will find it hard to deal with the next recession, highlighting efforts to create a common euro zone fiscal policy, but countries disagree on risk sharing and reduction. Despite its economic successes, the credit risks are too high for a country like Germany to want to assume greater responsibility for debt. We thus expect the summit to have a meagre outcome.
This spring, Germany and France have promised that at the European Union summit on June 28-29 they will unveil new joint proposals to reform and deepen EU/euro zone cooperation, but the outcome appears likely to be meagre. So far Germany’s new grand coalition has shown limited enthusiasm for attempts by France and the European Commission to speed up economic, fiscal and political integration. Changes in Europe’s security situation due to greater tensions with Russia have also made Berlin sceptical of the benefits of multi-speed EU cooperation.
The 2008-2009 global recession and subsequent recurring euro zone crisis revealed Europe’s economic, financial and institutional weaknesses, which must be addressed if the euro is not to suffer from chronic instability. It is also natural for the integration process to start with the euro, since the euro zone economies will account for 85 per cent of the EU’s total GDP after British withdrawal from the EU. To some extent, this turns non-euro countries like Sweden and Denmark into outsiders.
The euro project also faces new challenges because of changes in European Central Bank monetary policy. First, monetary policy will be normalised. Large-scale ECB bond purchases will end in 2018; these purchases have served as a de facto fiscal policy union. Second, euro zone monetary policy has limited manoeuvring room to manage the next recession. This is focusing attention on today’s decentralised fiscal policies and the likely need for more policy coordination. Euro zone governments have debts averaging nearly 90 per cent of GDP (varying from 180 to 9 per cent); this is a challenge and it increases the risk of political tensions.
But the main reason why Germany, France and other EU countries are still far apart probably has more to do with the allocation of responsibility: how shall the union’s continued large credit risks be managed and shared between countries/institutions and thereby be reduced? Risk sharing and reduction are undoubtedly two sides of the same coin. While Paris and others see the advantages of centralising euro zone risks, Berlin is afraid that countries and private market players will be encouraged to increase their risk-taking and that countries (read: German taxpayers) will ultimately be stuck with paying the bill. Germany’s basic argument is that member countries should be responsible for their economic policies and accept the full consequences of potentially negative effects.
EU and euro zone banks and governments will remain directly and indirectly linked together from a balance sheet perspective. Negative confidence spirals will thus easily take hold. Although the share of doubtful loans in EU banking systems has fallen in recent years, it remains high in countries like Greece (45 per cent of total lending), Portugal (15), Italy (12) and Ireland (12). Meanwhile banks have been encouraged to hold government securities in countries with high public sector debt: Greece (179 per cent of GDP), Italy (132), Portugal (126) and Spain (98). As long as public debt levels are high, Berlin’s interest in quickly deepening euro zone cooperation will be limited.
In 2015 the European Commission published “The Five Presidents’ Report” to address such problems and pave the way to completing Europe’s economic and monetary union (EMU). In spring 2017 the Commission further developed its ideas in its “White Paper” on how the EU might look in 2025. The European Council summit on June 28-29 will have a number of initiatives to discuss (see box). The whole EU 2025 discussion is supposed to culminate in May 2019 (in Sibiu, Romania), after the British have left the EU and just before the European Parliament elections. In Sibiu, EU heads of state and government are supposed to issue a declaration on how the EU should look starting in 2025.
Initiatives for stronger EU/EZ cooperation The European Commission has identified the following areas in which decisions should be made to complete EMU: 1. Establish a European Monetary Fund (EMF); in practice, give the European Stability Mechanism (ESM, current lending capacity EUR 700 billion), expanded powers and link it to the Single Resolution Fund (with EUR 55 billion in 2023) as an extra financial security mechanism. 2. Complete the Banking Union by linking the EMF and SRF and starting a European Deposit Insurance Scheme (EDIS). 3. Establish a new budgetary instrument to help euro zone countries manage asymmetric shocks.
Steps towards deeper EU/euro zone cooperation are both complex and political. Bringing the EU countries across the finish line as early as May 2019 seems like a utopian idea.

20 Nordic Outlook: May 2018
Japan Highly doubtful that BoJ will dare to open exit door in 2019
Japanese growth is surprisingly robust, but progress in boosting inflation is slow. Businesses and households have troublingly low inflation expectations. If the Bank of Japan (BoJ) is to begin monetary normalisation in earnest during 2019, GDP growth and inflation must show they are not dependent on “Abenomics”. But downside risks predominate, especially for inflation. Early monetary exit may jeopardise even small hard-to-achieve successes. The BoJ will thus continue its ultra-loose policy in 2019.
Japan ended 2017 with a strong fourth quarter, bringing preliminary full-year GDP growth up to 1.7 per cent. This is well above trend (0.5 per cent, according to the OECD). The lengthiest recovery in several decades is being bolstered by strong global economic conditions, record-high corporate earnings and uniquely expansionary economic policies, but the first quarter of 2018 began with some growth disappointments.
We expect GDP growth of 1.2 per cent in 2018 and 1.0 per cent in 2019. Growth will slow as fiscal stimulus fades this year, the previously postponed consumption tax hike from 8 to 10 per cent occurs in October 2019, investments related to the 2020 Tokyo Olympics dwindle and monetary exit strategy is debated.
Short- and medium-term risks to the Japanese economy are mainly connected to geopolitical uncertainty, trade wars and a possible rapid deceleration in China. Increased global risk aversion would strengthen the yen, hurt exports and thereby decrease the already weak desire among companies to invest and to raise wages and salaries. This scenario would be made worse by an excessively rapid end to Abenomics − the prime minister’s package of stimulus and structural reforms − and would open the door for a resumption of deflationary forces.
Unemployment will remain at 2-2.5 per cent in 2018-2019, the lowest in 25 years. This trend is even more impressive because reforms have gradually boosted labour force participation among women and foreign-born residents. These are positive signals, given Japan’s long-term and large-scale demographic challenge. Yet a larger labour supply, along with
digitisation and robotisation, are helping hold down wages and salaries, making it harder to meet the official inflation target.
Prime Minister Shinzo Abe, who took office late in 2012, has been drawn into a corruption scandal, lowering his chances of being re-elected in September as leader of the ruling Liberal Democratic Party. This raises uncertainty about the future of Abenomics, which has not yet achieved such targets as bringing the deflation economy to a definite end, managing demographic headwinds and presenting a credible plan for trimming record-high public sector debts; such a plan has been promised by this summer. The government’s budget deficits in 2018-2019 will be 3-3.5 per cent of GDP, or more than 1 point lower than in 2017. Public debt remains at a high 235 per cent of GDP.
Now that the output gap is closed and overheating is equivalent to 1-1.5 per cent of GDP, there is greater potential for the BoJ to achieve its inflation target of a “steady 2 per cent”. The government is also trying to encourage businesses to increase wages and salaries by 3 per cent in 2018. Yet company pay- and price-setting strategies are very cautious. According to the BoJ’s quarterly Tankan report, firms are still not convinced that inflation is on its way up. Their three- and five-year inflation expectations are close to 1 per cent. Household expectations are even lower: 0-5-1.0 per cent. Our forecast is that CPI inflation (excluding food prices) will end up at 1,0 per cent in 2018 and 1,3 per cent in 2019 (0.5 per cent in 2017).
The BoJ and its governor, Haruhiko Kuroda − now in his second term − have begun to prepare their communication about an exit strategy, after many years of exceptional monetary policy. The yearly growth rate of the monetary base now exceeds 9 per cent, the short-term key interest rate is being kept at -0.1 per cent and BoJ purchases of government securities are aimed at keeping 10-year government bond yields “around 0 per cent”.
The reasons behind initiating an exit discussion are logical, since the BoJ has thought itself able to achieve its inflation target by spring 2019, but our analysis shows that this inflation forecast is too optimistic and the downside is too large. Hints of new doubts even within the BoJ were clear from the central bank’s last policy meeting in April. We thus expect unchanged Japanese monetary policy in 2018-2019. We forecast an USD/JPY exchange rate of 110 at the end of 2018 and 100 at end-2019.
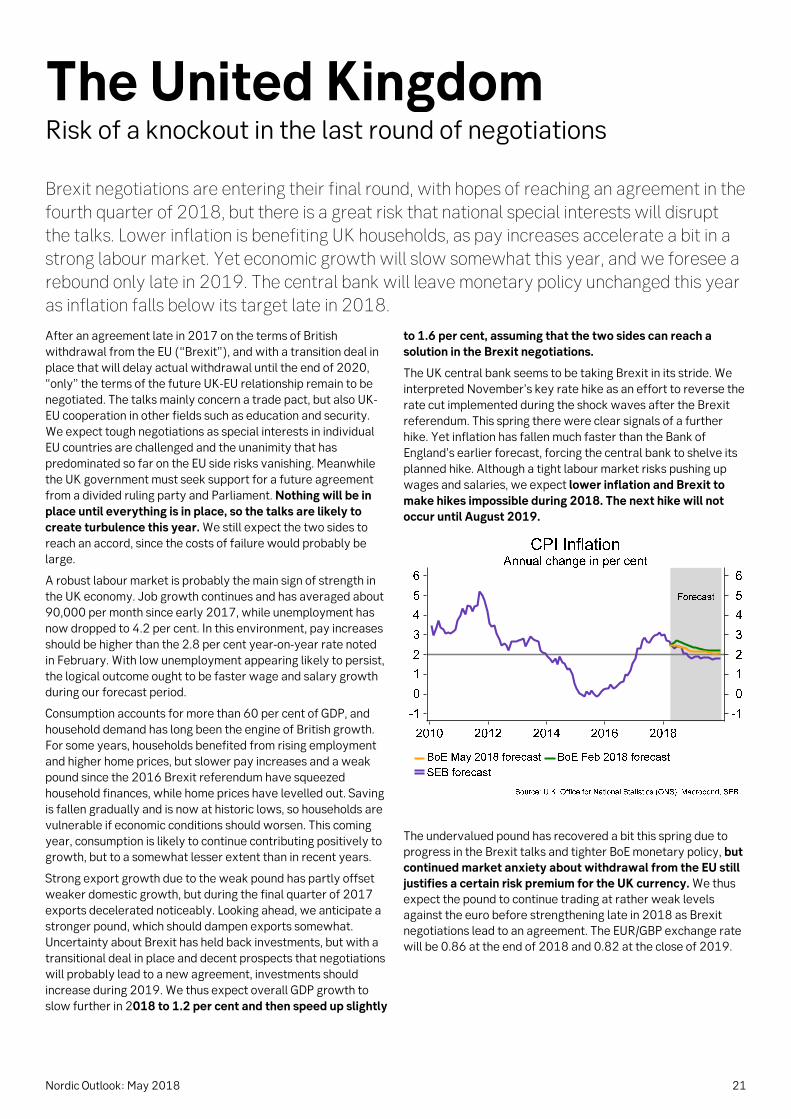
Nordic Outlook: May 2018 21
The United KingdomRisk of a knockout in the last round of negotiations
Brexit negotiations are entering their final round, with hopes of reaching an agreement in the fourth quarter of 2018, but there is a great risk that national special interests will disrupt the talks. Lower inflation is benefiting UK households, as pay increases accelerate a bit in a strong labour market. Yet economic growth will slow somewhat this year, and we foresee a rebound only late in 2019. The central bank will leave monetary policy unchanged this year as inflation falls below its target late in 2018.
After an agreement late in 2017 on the terms of British withdrawal from the EU (“Brexit”), and with a transition deal in place that will delay actual withdrawal until the end of 2020, “only” the terms of the future UK-EU relationship remain to be negotiated. The talks mainly concern a trade pact, but also UK-EU cooperation in other fields such as education and security. We expect tough negotiations as special interests in individual EU countries are challenged and the unanimity that has predominated so far on the EU side risks vanishing. Meanwhile the UK government must seek support for a future agreement from a divided ruling party and Parliament. Nothing will be in place until everything is in place, so the talks are likely to create turbulence this year. We still expect the two sides to reach an accord, since the costs of failure would probably be large.
A robust labour market is probably the main sign of strength in the UK economy. Job growth continues and has averaged about 90,000 per month since early 2017, while unemployment has now dropped to 4.2 per cent. In this environment, pay increases should be higher than the 2.8 per cent year-on-year rate noted in February. With low unemployment appearing likely to persist, the logical outcome ought to be faster wage and salary growth during our forecast period.
Consumption accounts for more than 60 per cent of GDP, and household demand has long been the engine of British growth. For some years, households benefited from rising employment and higher home prices, but slower pay increases and a weak pound since the 2016 Brexit referendum have squeezed household finances, while home prices have levelled out. Saving is fallen gradually and is now at historic lows, so households are vulnerable if economic conditions should worsen. This coming year, consumption is likely to continue contributing positively to growth, but to a somewhat lesser extent than in recent years.
Strong export growth due to the weak pound has partly offset weaker domestic growth, but during the final quarter of 2017 exports decelerated noticeably. Looking ahead, we anticipate a stronger pound, which should dampen exports somewhat. Uncertainty about Brexit has held back investments, but with a transitional deal in place and decent prospects that negotiations will probably lead to a new agreement, investments should increase during 2019. We thus expect overall GDP growth to slow further in 2018 to 1.2 per cent and then speed up slightly
to 1.6 per cent, assuming that the two sides can reach a solution in the Brexit negotiations.
The UK central bank seems to be taking Brexit in its stride. We interpreted November’s key rate hike as an effort to reverse the rate cut implemented during the shock waves after the Brexit referendum. This spring there were clear signals of a further hike. Yet inflation has fallen much faster than the Bank of England’s earlier forecast, forcing the central bank to shelve its planned hike. Although a tight labour market risks pushing up wages and salaries, we expect lower inflation and Brexit to make hikes impossible during 2018. The next hike will not occur until August 2019.
The undervalued pound has recovered a bit this spring due to progress in the Brexit talks and tighter BoE monetary policy, but continued market anxiety about withdrawal from the EU still justifies a certain risk premium for the UK currency. We thus expect the pound to continue trading at rather weak levels against the euro before strengthening late in 2018 as Brexit negotiations lead to an agreement. The EUR/GBP exchange rate will be 0.86 at the end of 2018 and 0.82 at the close of 2019.

22 Nordic Outlook: May 2018
China Continued debt reduction, with expansionary economic policy
According to plan, China will deliver continued high but slower GDP growth in 2018-2019. Beijing’s focus on debt reduction, which will cool the domestic economy, will be offset by occasionally looser monetary and fiscal policies. The yuan will climb further against the US dollar, partly reflecting foreigners’ growing appetite for Chinese equities and bonds. A stronger yuan will also lower the risk of undesired inflation surprises, while making it easier to trim (USD) debt and reduce Chinese-US trade tensions.
China’s GDP growth will cool slightly, after surprising on the upside in 2017. The background is an economic policy that is gradually being made more restrictive, plus some demographic headwinds and less expansionary credit conditions. The service sector, which comprises over 50 per cent of the economy, will also be adversely affected. GDP growth will reach 6.6 per cent in 2018 (6.9 per cent in 2017) – in line with the official target of “about 6.5 per cent” – and then slow to 6.2 per cent in 2019.
The main task of today’s economic policy is to reduce China’s financial stability risks and its overcapacity in certain industrial sectors, in order not to jeopardise political stability. President Xi Jinping has greatly strengthened his power base over the past six months, boosting the probability of reforms. Xi is expected to focus more on the content of growth than on specific GDP targets, which increases the risk of short-term disappointments.
Domestic growth in 2018 and 2019 will be held back by limits on credit growth. These will cool off activity in the construction sector and the real estate market, thereby also slowing private consumption. Exports will also decelerate a bit, partly due to a stronger currency (see below).
Credit growth has already slowedYear-on-year percentage change
10
12
14
16
18
20
22
10
12
14
16
18
20
22
2013 2014 2015 2016 2017
Credit indicator + local govt bonds Credit indicator
Source: SEB
Our main forecast is that fiscal policy will change only marginally in 2018-2019. Yearly budget deficits will be 3-4 per cent of GDP, but with a risk that deficits may grow and fiscal policy may loosen if the economy slows faster than desired due to reduction of state- and local government-owned enterprise debts.
Inflation has showed signs of accelerating. It averaged 2.2 per cent in the first quarter of 2018, a clear upturn compared to 1.6 per cent in 2017. We expect inflation to climb further, averaging 2.3 per cent this year and 2.5 per cent in 2019, while still remaining below the informal target of 3 per cent. A stronger yuan and slightly lower GDP growth than before will decrease inflation risk and increase the likelihood that inflation will surprise on the downside in 2018 and 2019.
In 2017 the People’s Bank of China maintained a neutral monetary policy but was prepared for tightening. During 2018, however, the PBoC has shifted towards a slightly dovish stance. For example, it has eased bank reserve requirements (effective April 25) by 1 percentage point to help support growth. We expect these requirements to be lowered by another point in the second half of 2018. Next year, we believe that the central bank will revert to a tighter monetary policy in order not to jeopardise the overall objective of bringing down financial stability risks: during the first quarter of 2019, the PBoC will hike its key interest rate by 25 basis points to 4.60 per cent.
Central bank not loosening monetary policy The decision to lower reserve requirements is primarily a way to change the liquidity structure in the banking system: banks must use the newly available liquidity to repay loans obtained through the PBoC’s medium-term lending facility (MLF). Any surplus liquidity must be loaned to small enterprises, which are expected to be hurt the most by the government’s desire to deleverage the economy and reduce risks. But the message is clear: the decision is not intended to benefit real estate lending, shadow banks or highly indebted state-owned enterprises.
The Chinese yuan has appreciated by around 3 per cent against the dollar so far in 2018. This movement will continue, and at the end of 2018 the USD/CNY exchange rate will stand at 6.10, partly driven by global investors boosting the percentage of Chinese equities and bonds in their portfolios. When the PBoC hikes its key rate in 2019, the yuan will appreciate further to 5.80 per dollar. This will put a slight damper on exports, while perhaps easing trade-related criticisms and threats from the US.

Nordic Outlook: May 2018 23
India Growth has picked up, but rising oil prices are a concern
GDP growth has picked up. Most indications are that economic activity will accelerate a bit further, but rising oil prices are a source of concern. Given India’s large-scale net oil imports, this price upturn affects inflation, the current account deficit, the government budget and the rupee. Concerned about inflation, the central bank is expected to raise its key rate in the second half of 2018. The Modi government is expected to shelve further major reforms until after the April-May 2019 Lok Sabha election.
India has rebounded after a slump in the first half of 2017. Fourth quarter GDP growth accelerated to 7.2 per cent year-on-year and most indications are that economic activity gained further momentum in the first quarter of 2018. The purchasing managers’ index in the manufacturing sector rose a bit in April and lies above the growth threshold of 50, while business confidence indicators climbed in the first quarter. Industrial production has surged in recent months, while rising car sales and increasing air travel indicate that private consumption has also accelerated. Our forecast is that GDP will increase by 7.3 per cent in 2018 and 7.5 per cent in 2019.
Because of India’s large net oil imports, price increases hurt the economy in several different ways. The widening trade deficit has generated some concern, but given our forecast that oil prices will not continue rising, this deficit is unlikely to grow much further. The government has also imposed taxes on gold imports in order to slow one important driver of the weakened trade balance. Nor is India highly exposed to a more protectionist US trade policy, since trade flows between the two countries are small in relation to the size of their economies.
Higher oil prices are also helping push inflation upward. Consumer price index (CPI) inflation slowed in early 2018 but accelerated to 4.6 per cent in April, above the official 4 per cent target. Core inflation is expected to continue higher, driven by rising capacity utilisation and healthy pay increases.
Measured as full-year averages, we expect inflation to end up at 4.8 per cent in 2018 and 5.0 per cent in 2019.
The Reserve Bank of India (RBI) has left its key interest rate at 6.0 per cent since lowering it in August 2017. Although inflation has slowed somewhat in recent months, the minutes of the April policy meeting show that the central bank is concerned about rising prices. The RBI cites increasing domestic demand, higher oil prices and rising inflation expectations. Worries about a more expansionary fiscal policy also persist. The government has cut fuel taxes and introduced a less ambitious target of bringing down its budget deficit to 3.3 per cent of GDP in the fiscal year that began on April 1. The RBI’s hawkish minutes have triggered a rise in bond yields and support our forecast that the RBI will hike its key rate to 6.50 per cent in the second half of 2018.
The ruling Bharatiya Janata Party (BJP) and Prime Minister Narendra Modi seem to enjoy strong backing among voters and the business community ahead of the lower house (Lok Sabha) election scheduled for April-May 2019. The Modi government has pushed through a number of both major and minor reforms, such as privatisations, a national goods and services tax (GST), bank recapitalisations and deregulation of direct investments in certain sectors, but it has been unable to reform India’s highly regulated labour market or land purchase legislation. No major initiatives are expected before the election. Without extensive reforms in these areas, India cannot reach its ambitious target of 8-10 per cent GDP growth. To achieve breakthroughs in these sensitive areas, the BJP needs a majority in the upper house (Rajya Sabha), but because of the election system it will take a while before it can accomplish this.
The currency is also affected by rising oil prices. Viewed in a long-term perspective, the rupee has performed more strongly than most emerging market (EM) currencies, but so far in 2018 it has weakened noticeably against the US dollar. It is now at its weakest level since February 2017. This depreciation can be explained by rising current account deficits and worries about central government finances. It has also coincided with a deceleration in capital inflows, due to a significant stock market downturn in February and March. Yet India’s currency reserve has increased sharply and is a stabilising factor, along with expectations of accelerating growth. Our forecast is a USD/INR rate of 65.0 at the end of 2018 and 63.0 at the end of 2019.

24 Nordic Outlook: May 2018
Russia Economic recovery temporarily hampered by sanctions
Russia’s economy looks set to grow somewhat more slowly than expected this year, partly due to restrained fiscal policy and lower business confidence following threats of further economic sanctions. Despite talk of structural reforms, we expect no far-reaching changes, but a reprioritisation of federal expenditures towards education and health care appears to be under way. The rouble fell sharply in April, but when political worries fade, we expect the currency to appreciate and interest rates to keep falling.
Russian GDP growth was only 1.5 per cent in 2017 after the economy slowed markedly in the fourth quarter. This was mainly the result of lower oil production due to Russia’s agreement with OPEC and cutbacks in defence expenditures. Available statistics indicate that growth continued at about the same pace early in 2018. Private consumption is the main driver, since capital spending has decelerated and net exports have become a drag on GDP. The slowdown is visible primarily in manufacturing and construction, because government spending has benefitted the service sectors relatively more. In early April, the United States imposed sanctions on companies and individuals connected to President Vladimir Putin, which has slowed economic activity further in Q2. However, we expect a recovery to occur in the second half, with GDP growth reaching 1.8 per cent in 2018 and 2.2 per cent in 2019 as companies become accustomed to the sanctions and as higher oil prices open the way to some fiscal stimulus measures.
Inflation remained at a low 2.4 per cent in April despite a sharp depreciation in the rouble, but it will increase during the coming months as domestic demand climbs and food prices move higher again. Yet inflation will stay below the 4.0 per cent official target in both 2018 and 2019, enabling the central bank to resume its key interest rate cuts after the major decline in the rouble led to a pause in April. We expect the key rate to fall from today’s 7.25 per cent to 6.50 per cent at the end of 2018 and 6.25 per cent at the end of 2019.
The federal budget deficit, 1.5 per cent of GDP, signifies a restrained fiscal policy despite a tough economic situation. The Finance Ministry advocates a balanced budget, but Russia is in great need of better infrastructure, health care and schools. Poverty has risen by about 20 per cent since 2014 and the population expects improvements in public services, which will probably lead to a budget deficit of around 2 per cent of GDP. Government debt is only 17 per cent of GDP, however, and even if it increases somewhat it will remain low in international terms.
Russia’s international reserves have continued to increase gradually, which is a sign that capital outflows have decreased. Even if outflows pick up slightly after the imposition of sanctions, Russia’s large oil-based current account surplus will keep the overall balance of payments accounts positive. Volatility will be higher ahead, since further sanctions against individuals and companies are likely to be imposed.
In his recent address to the nation, President Putin laid out a vision of turning Russia into one of the world’s five largest economies, but it is unlikely that the far-reaching structural reforms needed to boost the country’s growth potential will be implemented. Putin’s convincing victory in the March 2018 presidential election decreased the sense of urgency for such reforms, while special interests and corruption make the reform process more difficult. But greater spending on schools and health care represent an improvement in the structure of the federal budget. The government is likely to fund this shift in priorities by increasing the retirement age, which is currently 60 for men and 55 for women.
Relations with the European Union and the US will remain tense, but we expect political events to have relatively small and transient effects on the Russian economy. As long as growth continues, inflation is kept in check and federal finances are under control, interest rates will slowly fall. The rouble has weakened sharply against the US dollar since early April due to sanctions and the dollar’s new surge in response to heightened expectations of Federal Reserve rate hikes. Once market expectations stabilise again, the rouble will rebound, ending 2018 at RUB 60 and 2019 at RUB 63 per dollar.
Nordic Outlook: May 2018 25
SwedenDeceleration, but growth will remain above trend
Economic growth is still above trend, but homebuilding will slow in 2018 and industry is taking over as a driver. Households are cheerful; employment is rising, but low pay hikes are contributing to consumer hesitation and the savings ratio remains high. CPIF inflation will exceed 2 per cent for much of 2018, but the Riksbank will keep playing a high-stakes game, raising its key rate only in April 2019. Sweden is increasingly likely to enter the next recession with a central bank that has little manoeuvring room.
The Riksbank’s exceptionally loose monetary policy is having an increasing impact on the Swedish economy. GDP growth will remain above trend in 2018-2019, although its driving forces are changing. Domestic demand will cool significantly as home construction declines this year, after rapid expansion in recent years. Higher energy prices and a weaker krona are also helping to hold back household purchasing power. Exports are taking over to some extent as a growth engine, supported by a weak currency and robust international demand, but due to high capacity utilisation and cautious investment behaviour, SEK depreciation will have little impact on volume. Overall, we believe GDP will grow by 2.6 per cent in 2018 and 2.2 per cent in 2019: a downward revision by 0.2 percentage points from our February forecast.
Strong employment has recently contributed to a clear downturn in unemployment. Although job growth will slow a bit, we believe unemployment will continue downward to less than 6 per cent in the second half of 2018. The percentage of employers reporting recruitment problems remains historically very high, but pay increases have remained muted. Wage and salary hikes are gradually accelerating, though not fast enough to keep CPIF (CPI excluding interest rate changes) above the 2 per cent inflation target. Due to weaker exchange rates and higher energy prices, however, CPIF will exceed the target during most of 2018. CPIF excluding energy will nevertheless remain below 2 per cent in both 2018 and 2019.
Despite inflation and inflation expectations close to target, the Riksbank continues to make tough demands before starting even small-scale normalisation of its extreme monetary policy. At its April meeting, it postponed the first key interest rate hike until late 2018, but our inflation forecast indicates that this date may be pushed back further and that no rate hike will occur until April 2019. Later that year, there will be one further hike, bringing the repo rate to 0.0 per cent by the end of 2019. Given this policy, the krona will remain weak, although we believe that it will eventually climb a bit from today’s extremely weak level. By September we expect the EUR/SEK exchange rate to trade at 10.20 and then reach 9.95 by the end of 2018.
The Riksbank is playing a high-stakes game by sticking to with its extremely loose monetary policy, despite an economic boom. It is increasingly likely that Sweden will enter its next recession with highly leveraged households, high real estate prices and a
central bank with little possibility of combating a downturn. There is also a risk that inflation pressure will surge late in the economic cycle, as it did in 2001 and 2008, and that labour unions will then demand compensation in the form of pay hikes. The Riksbank will then face a very difficult dilemma and could quite conceivably act in ways that make the downturn worse.
The government’s election year budget represents a rather expansionary fiscal policy both this year and next, but due to unexpectedly strong public sector finances, the government that takes over after the September 2018 election will have quite a lot of manoeuvring room (see theme article, page 31). One reason is that Sweden’s official budget surplus target will be lowered to 0.33 per cent of GDP in 2019, compared to the current 1 per cent, in keeping with a broad-based 2016 parliamentary agreement. Fiscal policymakers thus have rather good potential to take action if we enter a recession in a situation where monetary policy ammunition is highly limited. But it is not so easy to see how the election can bring an end to the decision-making paralysis of the past eight years on important structural issues, especially in housing, taxation and labour market policies. Our main post-election scenario is some form of minority government led by the Moderate Party.
Industry taking over as a growth engine
During the past six months, hard data in the form of order bookings and industrial production have confirmed the upturn in confidence indicators that began late in 2016. The main driver is a broad-based upturn in international demand, especially in Sweden’s main European markets. A weak krona has also helped, but as resource utilisation climbs, the marginal effect of further currency depreciation on export volume will become weaker and weaker (see theme article, page 29).
Weak service exports during the past year are a source of uncertainty. Sector-specific problems − for example in telecoms − are one reason, but the broader slowdown in transport, travel services and financial services is harder to explain. The flatter economic growth curve may, in part, be a reaction to very rapid expansion in 2015 and the first half of 2016. Overall, we foresee a recovery, among other things considering that the upward trend in service exports has been stable in Germany and most other EU countries. We expect total exports to increase by 7.0 per cent this year and 4.7 per cent in 2019, a substantial acceleration compared to last year’s increase of 3.7 per cent.

26 Nordic Outlook: May 2018
Capital spending has risen at a healthy, relatively steady pace over the past four years, with nearly a 90 per cent surge in housing construction during this period as the main driver. Capital spending by local governments and in private service sectors has also been relatively expansive, along with non-residential construction. But the manufacturing sector has acted cautiously, with a slight falling trend over the past five years. Overall, capital spending in the past four years has increased by an average of about 6 per cent annually. This has pushed capital spending up to about a 25 per cent share of GDP, its highest since 1990 and well above the EU average of 21 per cent.
Looking ahead, this picture will change due to declining home construction. We expect housing starts to fall from 65,000 in 2017 to about 50,000 annually in 2018-2019. Their contribution to total capital spending will thus decrease by about 4 percentage points compared to 2017, while their corresponding decline as a contributor to GDP growth will be 1.2 points. An acceleration in other investments, especially in manufacturing, will partly offset this and cause total capital spending to increase by an estimated 4.5 per cent this year and 3.0 per cent in 2019.
Weaker real incomes will slow consumption growth
Despite a strong labour market and a rise in purchasing power, household consumption behaviour has remained cautious. Although various factors remain favourable, income growth is
slowing compared to 2017. We have also adjusted our forecast downward since February. Household optimism has weakened a bit, while rising energy prices and generally higher import prices due to the weaker SEK will reduce real disposable incomes by more than one per cent in 2018-2019. Meanwhile the strong upturn in employment is slowing, which is another reason why the upturn in real purchasing power will be only 2.3 per cent in 2018 and 1.5 per cent in 2019. Nor do we see any strong motives for households to lower their saving, since several structural factors are behind the record-high level. Real saving is being driven upward by the high level of home construction, while saving via collective occupational pensions remains high. In addition, households’ purchases of new tenant-owned flats (which unlike purchases in the secondary market are recorded as financing saving) will be at a high level over the next 2-3 years. We now believe household consumption will increase by nearly 2 per cent in both 2018 and 2019, a downward adjustment of nearly 0.5 percentage points yearly since our February forecast.
Household finances Year-on-year percentage change
2016 2017 2018 2019
Real disposable income 3.5 2.2 2.3 1.5
Private consumption 2.2 2.4 1.8 1.8
Savings ratio, % of income 16.6 15.9 16.3 15.9
Source: Statistics Sweden, SEB
More stable home prices, but lower sales volume
After falling steeply late in 2017, home prices − adjusted for seasonal variations − were stable in the first quarter of 2018. Since their peak in August, prices according to Valueguard’s housing index (HOX) have fallen by 6-7 per cent. Short-term indicators such as the SEB Housing Price Indicator are pointing to stable or slightly rising prices over the next few months. In the short term, the probability of a soft landing for home prices has thus increased, and our estimate that the price decline will end up at around 10 per cent remains in place. Meanwhile the supply of homes is increasing rather quickly, especially due to large-scale construction in major cities. As a result, uncertainty about the longer-term price trend will persist.

Nordic Outlook: May 2018 27
The clear downturn in unemployment will end
Because of rapidly increasing labour force participation, unemployment was largely unchanged during the second half of 2017. Early in 2018, however, participation levelled out while rapid job growth continued, causing a clear downturn in unemployment. Forward-looking indicators are signalling a more mixed trend ahead, among other things due to weaknesses in the construction sector, but also because the retail sector has significantly reduced its recruitment plans. These downturns are from a high level, however, and we expect employment to continue growing at a healthy pace of 1.7 per cent in 2018 and 1.0 per cent in 2019. We predict that the jobless rate will fall below 6 per cent during the second half of 2018, which is below the equilibrium unemployment estimate of the National Institute of Economic Research (NIER). As long as pay increases remain relatively low, however, it is difficult to determine whether the labour market is overheated. Looking ahead, Sweden’s ability to integrate its large number of new immigrants into the labour force will determine the potential for further employment expansion. The measures undertaken so far are hardly sufficient, and it is thus likely that unemployment will rebound during 2019 and reach a level that is higher than in most other countries in northern Europe.
Weak wage response despite high resource use
After trending upward since late 2013, the Riksbank’s resource utilisation (RU) indicator fell a bit during the first quarter of 2018. With GDP growth still above trend, and with falling unemployment, RU will remain high even though a somewhat cooler labour market may cause it to fall somewhat further. Recruiting problems have so far not resulted in any clear upward pressure on wages and salaries, although some acceleration in pay hikes has occurred in municipal and county governments, as well as in private sector health care and educational services. Unexpectedly high German collective pay agreements are likely to influence the next Swedish wage round, but the existing collective bargaining contracts − averaging 2.2 per cent yearly pay hikes − will remain in force until early 2020. We continue to believe that a tight resource situation will gradually push pay increases up to almost 3.5 per cent in 2019. Anecdotal signals of broad-based higher wage pressure and a higher rate of increase in the pay metric of Sweden’s national accounts are upside risks, while the current lack of a clear upward trend will pull in the opposite direction.
Core inflation will remain below target
Inflation fell early in 2018, although higher energy prices caused CPIF to reach 2.0 per cent in March. Because of continued upward pressure on energy prices, which will also have an extra impact due to the weaker krona, we expect inflation to remain a bit above 2 per cent during much of 2018. Excluding energy, however, inflation pressure is substantially milder. After having been close to target in mid-2017, CPIF excluding energy fell below 1.4 per cent. This downturn is expected to continue in the near term. The significant drop in service sector inflation will continue and is expected to be mainly attributable to base effects from high price increases on banking and other service categories last summer. Food price increases will also slow, in line with developments elsewhere in Europe. Late in 2018, CPIF excluding energy will rise above 2.0 per cent, mainly driven by the krona depreciation of recent months. Higher pay increases and mounting international price pressure will keep inflation up during 2019. We expect CPIF to average 1.8 per cent in 2019 and CPIF excluding energy to average 1.7 per cent; CPIF will also fall short of the 2 per cent target at the end of 2019.
No rate hike until early 2019
In its interest rate announcement in April, the Riksbank again surprised the market by lowering its rate path more than expected. The date of its first key rate hike was postponed until late 2018. The bank’s rate path signals a repo rate of -0.31 per cent after the December policy meeting, implying about a 75 per cent probability of a 25 bp rate hike before the end of 2018.
We have chosen to change our forecast of the Riksbank’s timetable to a later date and now predict that we will not see a first rate hike until April 2019. We believe there will be one further rate hike in 2019, so that the repo rate will be 0.0 per cent at year-end. The background is the Executive Board’s strong focus on ensuring that underlying inflation is in line with the target before it will implement a rate hike, and the fact that the Board seems to see no problem with the exceptionally weak krona. Although our CPIF forecast for 2018 is close to that of the Riksbank, we believe that the central bank’s forecast of CPIF excluding energy (as usual) reaches 2 per cent too quickly, early in 2019. Since the Riksbank also highlights the importance of rising service inflation, it is conceivable that at a later stage the Riksbank will signal that it regards the portion of inflation that is driven by a weaker exchange rate as temporary.

28 Nordic Outlook: May 2018
Assuming that our inflation forecast proves correct, the Executive Board will have to show some (newly gained) flexibility if there are to be any rate hikes at all during 2019. With the European Central Bank moving closer to a rate hike and the rate of pay increases accelerating in Sweden, there should nevertheless be strong enough justifications for a rate hike early in 2019. But in recent years the Riksbank has created a difficult situation for itself because of its exceptional focus on small deviations in the inflation rate. Sweden is increasingly likely to enter its next recession with highly leveraged households, high real estate prices and a central bank that has little possibility of combating a downturn. If there is also some inflation pressure late in the economic cycle, as in 2001 and 2008, it is also possible that the Riksbank will choose to wait (or even hike its key rate), thereby making the downturn even worse.
Continued narrow yield spread against Germany
In line with our forecasts, the yield spread for government bonds against Germany has narrowed during the spring. There have been several drivers. Strong government finances have led to shrinking bond issues, while the Riksbank has continued its bond purchases. In addition, expectations of rate hikes have been postponed. These forces will continue to operate but will not intensify. The National Debt Office has signalled that it will not reduce issue volumes further, even if government finances should against surprise on the upside. Market expectations of key rate hikes are now already depressed. The continuous liquidity deterioration in the government bond market will create uncertainty, but as long as the Riksbank continues its purchases it is unlikely that Swedish bonds will be traded with a risk premium. We expect the spread against German 10-year yields to remain at current low levels of around 15 basis points for the rest of 2018. We continue to believe that during 2019 the spread will widen, since the Riksbank will hike its key rate earlier than the ECB. This implies a 10-year government bond yield of 1.7 per cent at the end of 2019.
SEK will recover, in spite of a stubborn Riksbank
Despite robust international and Swedish economic conditions, the krona has fallen dramatically so far in 2018, with the EUR/SEK exchange rate reaching 10.70 in early May: the weakest krona since the most acute phase of the financial crisis. The Riksbank has repeatedly surprised the market with its extreme monetary policy strategy. After it raised the bar further
as to its prerequisites for starting normalisation, the reaction was powerful.
Underlying changes may also play a role. Sweden’s strong balance sheet has weakened the SEK’s tendency to appreciate as risk appetite has risen. Given the country’s large positive external financial position, partly due to accumulated current account surpluses, in some ways the SEK ends up in the same category as other defensive currencies like the yen and euro. When negative key rates and large liquidity surpluses push down Swedish interbank rates and other short-term rates to extremely low levels, the krona becomes a nearly “perfect” funding currency. Large international asset managers can take advantage of these rates, sell SEK and buy other currencies that pay higher returns. These strategies can also be trend-following, successively expanding krona-negative positions amid a falling krona trend.
Since we see no signs that foreign asset managers are selling their holdings of Swedish equities, government securities or mortgage-backed bonds, we predict no general weakening of confidence in the Swedish economy. But there is also solid confidence that the Riksbank will preserve its monetary policy intact and only very slowly implement normalisation, including a positive repo rate. Looking ahead, inflation outcomes will be very important to the SEK trend. This was underscored by a significant recovery after a small upside surprise when April inflation was reported on May 9. Another trigger might be a change of Riksbank rhetoric concerning the effect of the krona on inflation, indicating that the central bank now feels more confident about the inflation trend. The Riksbank previously welcomed a weaker currency as a way of pushing inflation higher, but now it has created new uncertainty by opening up to the possibility that this type of inflation driver is only temporary. Since pay hikes remain lower than what is compatible with the inflation target in the long term, if it wishes the Riksbank can argue that underlying inflationary forces are not yet in place.
Although we do not believe that either inflation figures or Riksbank rhetoric will change the picture appreciably, the krona is likely to slowly regain some lost ground. One factor is that the spring corporate dividend-payment period, which leads to krona-negative flows as foreign investors exchange SEK for other currencies, is now over. Given above-target inflation during the rest of 2018, we will probably also see both mounting criticism of the Riksbank’s excessively loose policy and expectations that it will end. We thus believe that the EUR/SEK rate will fall slowly to 9,95 by the end of 2018. During 2019, we expect the krona to continue recovering, with the EUR/SEK rate reaching 9.70 by year-end, while the USD/SEK exchange rate will have fallen to 7.70.
Compared to traditional estimates of equilibrium exchange rates, even at the end of our forecast period the krona will still be clearly undervalued. Our own estimate puts the equilibrium EUR/SEK rate at 9.10-9.20. One alternative approach, in which competitiveness is estimated on the basis of changes in relative unit labour cost (ULC), nevertheless indicate that the equilibrium rate may be higher – not far from 9.70 – since Swedish ULC has increased faster than that of other countries.

Nordic Outlook: May 2018 29
Theme: The Swedish kronaWeak krona has little effect on GDP, due to high resource use
An exchange rate depreciation on the scale of this past year would normally stimulate GDP by 0.5-0.6 per cent over two years. But given very high resource utilisation among exporters, uncertain capital spending conditions and structural pressures on retailers, the balance between positive and negative effects is changing dramatically. We thus estimate that the net stimulus effect is close to zero. Today’s SEK depreciation is therefore occurring under unfavourable circumstances and risks creating new imbalances ahead.
Exchange rate movements have played a major role in the Swedish economy for a long time. After the Bretton Woods system collapsed in the early 1970s, Sweden struggled to find a role in the international currency system. Its wage and price formation fell out of step with other countries, leading to recurrent devaluation cycles that shaped the behaviour of economic players. During the past 25 years of floating exchange rates, currency movements have also been relatively large − often driven by relative differences in economic conditions between Sweden and other mainly Western European countries. Like many small currencies, the SEK has tended to depreciate during bouts of international economic weakness, most clearly illustrated by its collapse during the Lehman Brothers crisis.
SEK depreciations have helped to soften economic downturns in Sweden by giving exporters higher profit margins and enabling them to increase market share by holding down prices in foreign currencies. Companies that compete with foreign firms in the Swedish market also gain an advantage, benefiting domestic production. But a weaker exchange rate also carries a price, for example when real household incomes are squeezed by higher import prices. At present, this effect has been softened because many companies find it hard to raise consumer prices, but then their profit margins are squeezed instead. This, in turn, adversely affects their capital spending and hiring plans.
Positive and negative effects of various channels
The dramatic depreciation that we have seen this past year, with the krona losing 6.5 per cent against the euro and 5 per cent in trade weighted terms (KIX index) is different from earlier major SEK depreciations since it is taking place during an international economic boom and amid an almost overheated Swedish labour market. This greatly changes any analysis of the balance between positive and negative consequences.
To get some idea of how a 5 per cent SEK depreciation normally affects GDP and employment, we estimated the effects of the exchange rate on exports, household consumption and capital spending, based on data between 1993 and 2017. Below we discuss what special factors may cause today’s outcome to diverge from the historical average.
Exports: Exports are estimated using a model of international market growth, exchange rates and relative labour costs. Market growth is the dominant factor for export performance,
but exchange rates are also significant and show that a 7 per cent weaker SEK boosts exports by 5 per cent over three years, with the biggest effect coming in the second year.
Household consumption: Consumption is estimated by factoring in disposable household incomes, household assets and unemployment. An SEK depreciation of 5 per cent lowers real household incomes by over 0.5 per cent, which according to our model reduces household consumption by 0.3 per cent.
Capital spending: Capital investments are mainly determined by the trend of demand, and strong export performance has a clearly positive effect. Weaker consumption and higher capital spending prices have the opposite effect. The effect on capital spending is estimated at 2 per cent.
Our overall assessment is that under normal circumstances, a 7 per cent weaker exchange rate boosts Swedish GDP by 0.5-0.6 per cent during a two-year period. We have also adjusted for 1) the import content in various demand components, 2) the fact that domestic producers can take market share from foreign competitors and 3) that the secondary impact of the initial export impulse has a positive effect on domestic demand.

30 Nordic Outlook: May 2018
Weaker GDP effect due to new conditions
Our estimate is based on data from 1993 onward, i.e. the period of floating exchange rates following the collapse of the krona in November 1992. The effects were probably somewhat larger during the earlier period, when various forms of temporary currency pegs were interrupted by 4-5 major devaluations. This applies especially to the capital spending side, with companies at the time having more stable planning conditions in terms of competitiveness. However, there are several reasons to believe that at present, the effects are significantly weaker than during our estimate period. In particular, it is uncertain whether export volume can actually be accelerated further in a situation where capacity utilisation in the manufacturing sector is already close to historical highs at the outset. Given high resource utilisation, there is potential for capital spending to take over as an exchange rate-driven growth force. But relatively cautious investment behaviour by manufacturing companies is probably due to their belief that today’s weak SEK level is not sustainable, which thus also hampers the stimulus effect via this channel.
There may also be fears that the negative impact on domestic demand is larger than out estimates show. Today the retail sector is undergoing a tough restructuring process, driven among other things by increased e-commerce that is leading to stagnating brick-and-mortar store sales. In such a situation, it is especially distressing not to be able to pass on rising exchange rate-driven purchase prices to consumers. The effects are difficult to quantify, but one warning signal is that in April the Swedish retail confidence indicator fell to a level close to its historical average, while the retail sector lowered its hiring plans to the lowest level since 2014. Consumer confidence and optimism in the private service sector have also fallen during the spring. This may very likely be connected to squeezed margins and real incomes. A turbulent housing market and rising energy prices, which boost purchase prices and undermine real incomes as much as the exchange rate, are of course other factors.
Our overall conclusion is that because of a number of factors, the GDP effects of today’s weak krona are much less than before and probably close to zero. In employment terms, the net effect is probably negative, considering that the “losing” sectors are much more job-intensive than the export sector.
Insidious interplay between wage formation and SEK
Timing and sustainability aspects should also be borne in mind when discussing the consequences of today’s extremely weak currency. Even if the Riksbank rejects arguments to gather more ammunition ahead of the next recession, there are other aspects to consider, especially the interplay between exchange rates and wage formation. During the past two national wage rounds, the unions’ modest pay demands were due to unexpectedly low inflation over a long period, which had led to solid real wage increases. But historically, labour unions have instead been very vigilant in ensuring that import prices do not undermine the purchasing power of their members. From that perspective, union support for today’s exceptional monetary policy has been a little divergent. By the next wage round in 2020, it is quite possible that the climate will have changed and that unions will feel pressure from their members to demand compensation for import-driven inflation. To some extent, the Riksbank may view this as proof that its inflation target has regained credibility as an anchor of wage formation. But there is an obvious risk that we will see an overshooting in wage and salary increases at the wrong time, and that this will intensify the kind of late-cyclical inflation surge that has often occurred in Sweden and that created major problems for the Riksbank in 2001 and 2008.
There are other obvious hangover risks now that monetary policymakers are loosening conditions further. The effects of long-lasting extremely low interest rates may contribute to increasing gaps and social tensions, due to soaring asset prices. The correlation between household optimism and home prices has been weakening for some time – another example of how economic players feel uncertain about the sustainability of the ongoing monetary policy experiment. As a consequence, the effectiveness of this policy weakens in the short term as well.
To summarise, the tendency of the krona to depreciate during periods of international instability has clearly helped stabilise the Swedish economy during the floating exchange rate era. The preceding period of devaluations proved to be a dead end − weakening reform pressure and thus productivity growth in the economy − but this does not prevent us from learning some lessons from that period’s thinking when it comes to the impact of exchange rate movements. It is unfortunate that the ongoing monetary policy experiment has now led to a dramatic krona depreciation in a situation where the economy has especially poor potential to reap the fruits of further improvements in competitiveness.

Nordic Outlook: May 2018 31
Theme: Sweden’s electionEven match: when do we get strong, decisive government?
With a booming economy and solid government finances, “krona-by-krona” has been replaced by a late-cyclical splurge mentality. After eight years of weak minority rule it is vital to adopt fresh approaches in labour market, immigrant integration, housing and taxation policies. Yet given prevailing public opinion, it is hard to see how a decisive government can take over after September’s election. The campaign is likely to be dominated by confrontation and tactical positioning, providing little guidance on how to manage structural issues.
After a cautious start to its four-year term, the government abandoned the “krona-by-krona” funding principle in its budget for 2018. Strong finances increased the temptation to propose an expansionary election budget including broad commitments aimed at reaching as many voters as possible. New spending represents a yearly stimulus dose of 0.5 per cent of GDP in 2018-2020, following a largely neutral 2015-2017. Today’s fiscal tailwind will weaken as economic growth slows. Meanwhile the public revenue mix will be less favourable as GDP is driven more by industrial production and exports than by tax-intensive activities like consumption and home construction. Yet the next government will also have ample manoeuvring room. Forecasts indicate a budget surplus around 1 per cent of GDP in both 2018 and 2019, but since the government estimates that resource utilisation now exceeds equilibrium, the structural surplus is a bit below the current target of 1 per cent. Under a 2016 agreement between the government and the opposition Alliance parties, however, the official surplus target will be lowered from 1.0 to 0.33 per cent of GDP in 2019. Put differently, the current government jumped the gun by already applying the new, lower surplus target to 2018, but this will not significantly affect future fiscal manoeuvring room.
We should also observe that general government debt is now declining towards the debt “anchor” (35 per cent of GDP) specified by the 2016 agreement. If the budget target is actually met in the medium term, debt will be pushed even lower. Due to the goal conflict between the budget surplus and
debt targets, it is not unlikely that it will soon be time for a new review that leads to further easing. Purely fiscal justifications for tighter fiscal policy are thus not especially strong.
National household manager or stabiliser-in-chief?
Fiscal strategy must also be viewed in a stabilisation policy perspective. As in the US and Germany, it would have been better if fiscal policy had been looser at an earlier stage, when resource utilisation was not as tight. Yet it is quite common for a finance minister to be torn between the role of a “national household manager” who must allocate the resources generated by a strong economy and that of a “Keynesian” stabiliser-in-chief, who should instead spend more when the economy is weak. Since today’s economic policy, with its inflation target and floating exchange rates, gives chief stabilisation policy responsibility to the Riksbank, the finance minister should focus mainly on meeting budget surplus and government debt targets. If economic policy becomes too loose, it is mainly the Riksbank that must tighten them. If a government and finance minister take over that role, this might be viewed as a signal that they do not really trust the Riksbank’s judgement. One Riksbank official has declared that the central bank may need fiscal policy help, given its limited manoeuvring room during the next economic downturn, but his statement does not conflict with this role allocation. It means that the Riksbank may need urgent support from fiscal policymakers, not that fiscal and monetary policymakers will pull in different directions.
Increasingly clear need for structural measures
One can argue about the details and timing, but our view is that both the 2006-2014 Alliance government and the current ”red-green” government have managed to strike a rather good balance in the general thrust of fiscal policy. Many spending commitments are urgently needed, for example to ease tensions connected to the challenges of immigrant integration and eroding social contracts. But while strong government finances allow aggressive fiscal policy, it is now important to prioritise structural policy measures, especially since Sweden has one of the highest unemployment levels in northern Europe, while employers are reporting record-high recruitment problems.
After nearly eight years of minority governments, the lack of decisive action in this field is increasingly evident. The red-green and Alliance blocs have managed to reach agreements in areas like defence and energy, but in more ideologically
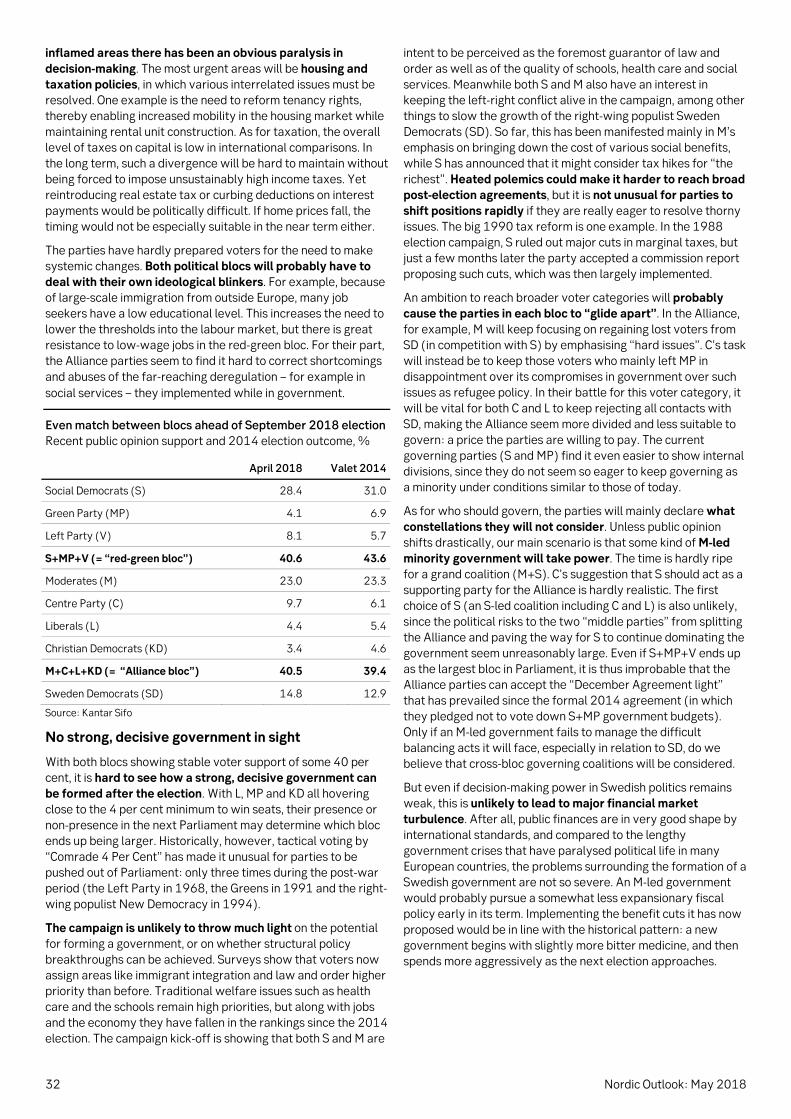
32 Nordic Outlook: May 2018
inflamed areas there has been an obvious paralysis in decision-making. The most urgent areas will be housing and taxation policies, in which various interrelated issues must be resolved. One example is the need to reform tenancy rights, thereby enabling increased mobility in the housing market while maintaining rental unit construction. As for taxation, the overall level of taxes on capital is low in international comparisons. In the long term, such a divergence will be hard to maintain without being forced to impose unsustainably high income taxes. Yet reintroducing real estate tax or curbing deductions on interest payments would be politically difficult. If home prices fall, the timing would not be especially suitable in the near term either.
The parties have hardly prepared voters for the need to make systemic changes. Both political blocs will probably have to deal with their own ideological blinkers. For example, because of large-scale immigration from outside Europe, many job seekers have a low educational level. This increases the need to lower the thresholds into the labour market, but there is great resistance to low-wage jobs in the red-green bloc. For their part, the Alliance parties seem to find it hard to correct shortcomings and abuses of the far-reaching deregulation − for example in social services − they implemented while in government.
Even match between blocs ahead of September 2018 election Recent public opinion support and 2014 election outcome, %
April 2018 Valet 2014
Social Democrats (S) 28.4 31.0
Green Party (MP) 4.1 6.9
Left Party (V) 8.1 5.7
S+MP+V (= “red-green bloc”) 40.6 43.6
Moderates (M) 23.0 23.3
Centre Party (C) 9.7 6.1
Liberals (L) 4.4 5.4
Christian Democrats (KD) 3.4 4.6
M+C+L+KD (= “Alliance bloc”) 40.5 39.4
Sweden Democrats (SD) 14.8 12.9
Source: Kantar Sifo
No strong, decisive government in sight
With both blocs showing stable voter support of some 40 per cent, it is hard to see how a strong, decisive government can be formed after the election. With L, MP and KD all hovering close to the 4 per cent minimum to win seats, their presence or non-presence in the next Parliament may determine which bloc ends up being larger. Historically, however, tactical voting by “Comrade 4 Per Cent” has made it unusual for parties to be pushed out of Parliament: only three times during the post-war period (the Left Party in 1968, the Greens in 1991 and the right-wing populist New Democracy in 1994).
The campaign is unlikely to throw much light on the potential for forming a government, or on whether structural policy breakthroughs can be achieved. Surveys show that voters now assign areas like immigrant integration and law and order higher priority than before. Traditional welfare issues such as health care and the schools remain high priorities, but along with jobs and the economy they have fallen in the rankings since the 2014 election. The campaign kick-off is showing that both S and M are
intent to be perceived as the foremost guarantor of law and order as well as of the quality of schools, health care and social services. Meanwhile both S and M also have an interest in keeping the left-right conflict alive in the campaign, among other things to slow the growth of the right-wing populist Sweden Democrats (SD). So far, this has been manifested mainly in M’s emphasis on bringing down the cost of various social benefits, while S has announced that it might consider tax hikes for “the richest”. Heated polemics could make it harder to reach broad post-election agreements, but it is not unusual for parties to shift positions rapidly if they are really eager to resolve thorny issues. The big 1990 tax reform is one example. In the 1988 election campaign, S ruled out major cuts in marginal taxes, but just a few months later the party accepted a commission report proposing such cuts, which was then largely implemented.
An ambition to reach broader voter categories will probably cause the parties in each bloc to “glide apart”. In the Alliance, for example, M will keep focusing on regaining lost voters from SD (in competition with S) by emphasising “hard issues”. C’s task will instead be to keep those voters who mainly left MP in disappointment over its compromises in government over such issues as refugee policy. In their battle for this voter category, it will be vital for both C and L to keep rejecting all contacts with SD, making the Alliance seem more divided and less suitable to govern: a price the parties are willing to pay. The current governing parties (S and MP) find it even easier to show internal divisions, since they do not seem so eager to keep governing as a minority under conditions similar to those of today.
As for who should govern, the parties will mainly declare what constellations they will not consider. Unless public opinion shifts drastically, our main scenario is that some kind of M-led minority government will take power. The time is hardly ripe for a grand coalition (M+S). C’s suggestion that S should act as a supporting party for the Alliance is hardly realistic. The first choice of S (an S-led coalition including C and L) is also unlikely, since the political risks to the two “middle parties” from splitting the Alliance and paving the way for S to continue dominating the government seem unreasonably large. Even if S+MP+V ends up as the largest bloc in Parliament, it is thus improbable that the Alliance parties can accept the “December Agreement light” that has prevailed since the formal 2014 agreement (in which they pledged not to vote down S+MP government budgets). Only if an M-led government fails to manage the difficult balancing acts it will face, especially in relation to SD, do we believe that cross-bloc governing coalitions will be considered.
But even if decision-making power in Swedish politics remains weak, this is unlikely to lead to major financial market turbulence. After all, public finances are in very good shape by international standards, and compared to the lengthy government crises that have paralysed political life in many European countries, the problems surrounding the formation of a Swedish government are not so severe. An M-led government would probably pursue a somewhat less expansionary fiscal policy early in its term. Implementing the benefit cuts it has now proposed would be in line with the historical pattern: a new government begins with slightly more bitter medicine, and then spends more aggressively as the next election approaches.

Nordic Outlook: May 2018 33
Denmark Still ambling along
A rebound in the fourth quarter brought GDP growth to 2.2 per cent in 2017. We expect growth to continue in the 2-2.5 per cent range during 2018. Consumption will face headwinds from tighter lending conditions, but the underlying drivers remain intact. Both business and construction investment are set to accelerate, supported by global demand. Fiscal policy remains largely neutral and the Danish krone is returning to the centre of its range against the euro.
The upswing in the Danish economy continues, supported by strong employment growth, rising home prices and high confidence among households and firms, while a cautious tightening of credit conditions poses the main headwind. Our forecast of GDP growth in the 2-2.5 per cent range is largely unchanged. Q4 confirmed the temporary nature of the Q3 setback, with annualised growth of 4 per cent. An upward revision from 2.1 to 2.2 per cent in 2017 is matched by a marginal downward adjustment in our 2018 forecast from 2.4 to 2.2 per cent, with 2019 unchanged at 2.3 per cent.
Consumption still the main driver
Consumption surged in Q4, primarily due to a rebound in car sales, since consumers had postponed car-buying in anticipation of tax cuts. We continue to expect more strength in 2018 as firm labour and housing markets continue to support income and confidence levels. Nonetheless, household spending continued to lag behind income throughout 2017, so the savings ratio remains high despite a resurgence of confidence. The most likely explanation is the continued tightening of credit standards in Q1 by the Financial Supervisory Authority, limiting consumers’ ability to monetise wealth gains from the housing market. The broad economy remains robust enough to absorb macro-prudential policy, however. With employment and real wages rising, leverage is not necessary and we expect consumption growth of 2.5-3 per cent, up from last year´s 1.5 per cent.
Exports were unexpectedly weak in 2017, partly due to statistical reasons, making a rebound likely. Fixed investment
should accelerate in 2018. Business investment is supported by rising capacity utilisation, strong corporate earnings growth and solid global demand. Meanwhile, construction investment will get a lift from continued price increases and low mortgage rates.
No overheating risks
March saw employment levels reaching a record high. There might thus be some concerns over labour market strains. Unemployment is trending gradually lower towards 4.5 per cent by the end of our forecast period. However, with wages rising less than 2 per cent, falling household debt-to-income ratios, a record-high current account surplus of 9 per cent of GDP and normal capacity utilisation, there are few signs of overheating.
Stable wages imply limited core CPI downsideAnnual growth, per cent
0.0
1.0
2.0
3.0
4.0
5.0
0.0
1.0
2.0
3.0
4.0
5.0
2002 2004 2006 2008 2010 2012 2014 2016 2018
Wages Core CPI
Source: Statistics Denmark, Macrobond, SEB
Danish CPI has continued to decline, with March showing further downward movement. Wage inflation remains close to 2 per cent, indicating core CPI below 1 per cent. Inflationary pressures thus continue to weaken. Despite low numbers at the start of the year, we expect inflation to reach 1.3 per cent in 2019.
Fiscal policy remains largely neutral. Recent public sector pay negotiations ended without a labour conflict, but with higher wage and salary increases than in previous years. Both factors are mildly supportive of growth. With the Danish krone back above 7.45 per euro, there is little risk of unilateral action from the Danish National Bank. Risks to the growth outlook remain broadly balanced, with upside potential from a positive rebound in global demand after a soft Q1 and a possible downside from unexpectedly rapid global economic policy tightening or the unforeseen effects of domestic macroprudential policy.
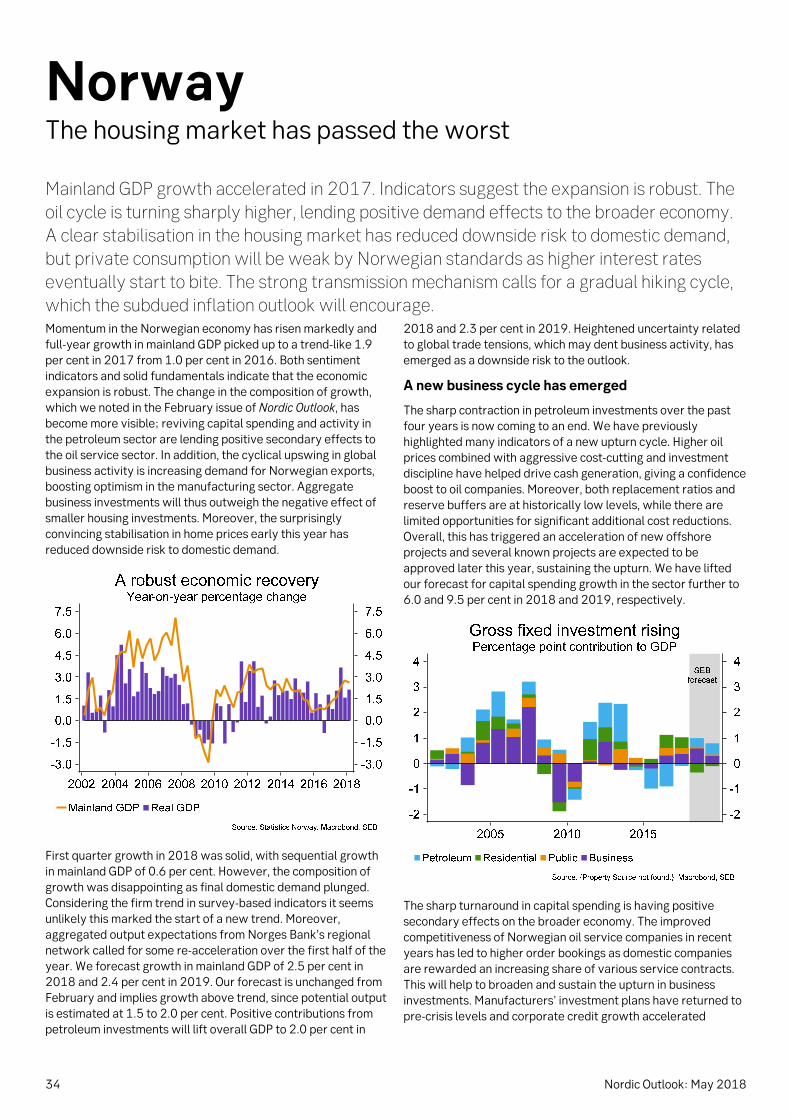
34 Nordic Outlook: May 2018
NorwayThe housing market has passed the worst
Mainland GDP growth accelerated in 2017. Indicators suggest the expansion is robust. The oil cycle is turning sharply higher, lending positive demand effects to the broader economy. A clear stabilisation in the housing market has reduced downside risk to domestic demand, but private consumption will be weak by Norwegian standards as higher interest rates eventually start to bite. The strong transmission mechanism calls for a gradual hiking cycle, which the subdued inflation outlook will encourage. Momentum in the Norwegian economy has risen markedly and full-year growth in mainland GDP picked up to a trend-like 1.9 per cent in 2017 from 1.0 per cent in 2016. Both sentiment indicators and solid fundamentals indicate that the economic expansion is robust. The change in the composition of growth, which we noted in the February issue of Nordic Outlook, has become more visible; reviving capital spending and activity in the petroleum sector are lending positive secondary effects to the oil service sector. In addition, the cyclical upswing in global business activity is increasing demand for Norwegian exports, boosting optimism in the manufacturing sector. Aggregate business investments will thus outweigh the negative effect of smaller housing investments. Moreover, the surprisingly convincing stabilisation in home prices early this year has reduced downside risk to domestic demand.
First quarter growth in 2018 was solid, with sequential growth in mainland GDP of 0.6 per cent. However, the composition of growth was disappointing as final domestic demand plunged. Considering the firm trend in survey-based indicators it seems unlikely this marked the start of a new trend. Moreover, aggregated output expectations from Norges Bank’s regional network called for some re-acceleration over the first half of the year. We forecast growth in mainland GDP of 2.5 per cent in 2018 and 2.4 per cent in 2019. Our forecast is unchanged from February and implies growth above trend, since potential output is estimated at 1.5 to 2.0 per cent. Positive contributions from petroleum investments will lift overall GDP to 2.0 per cent in
2018 and 2.3 per cent in 2019. Heightened uncertainty related to global trade tensions, which may dent business activity, has emerged as a downside risk to the outlook.
A new business cycle has emerged
The sharp contraction in petroleum investments over the past four years is now coming to an end. We have previously highlighted many indicators of a new upturn cycle. Higher oil prices combined with aggressive cost-cutting and investment discipline have helped drive cash generation, giving a confidence boost to oil companies. Moreover, both replacement ratios and reserve buffers are at historically low levels, while there are limited opportunities for significant additional cost reductions. Overall, this has triggered an acceleration of new offshore projects and several known projects are expected to be approved later this year, sustaining the upturn. We have lifted our forecast for capital spending growth in the sector further to 6.0 and 9.5 per cent in 2018 and 2019, respectively.
The sharp turnaround in capital spending is having positive secondary effects on the broader economy. The improved competitiveness of Norwegian oil service companies in recent years has led to higher order bookings as domestic companies are rewarded an increasing share of various service contracts. This will help to broaden and sustain the upturn in business investments. Manufacturers’ investment plans have returned to pre-crisis levels and corporate credit growth accelerated
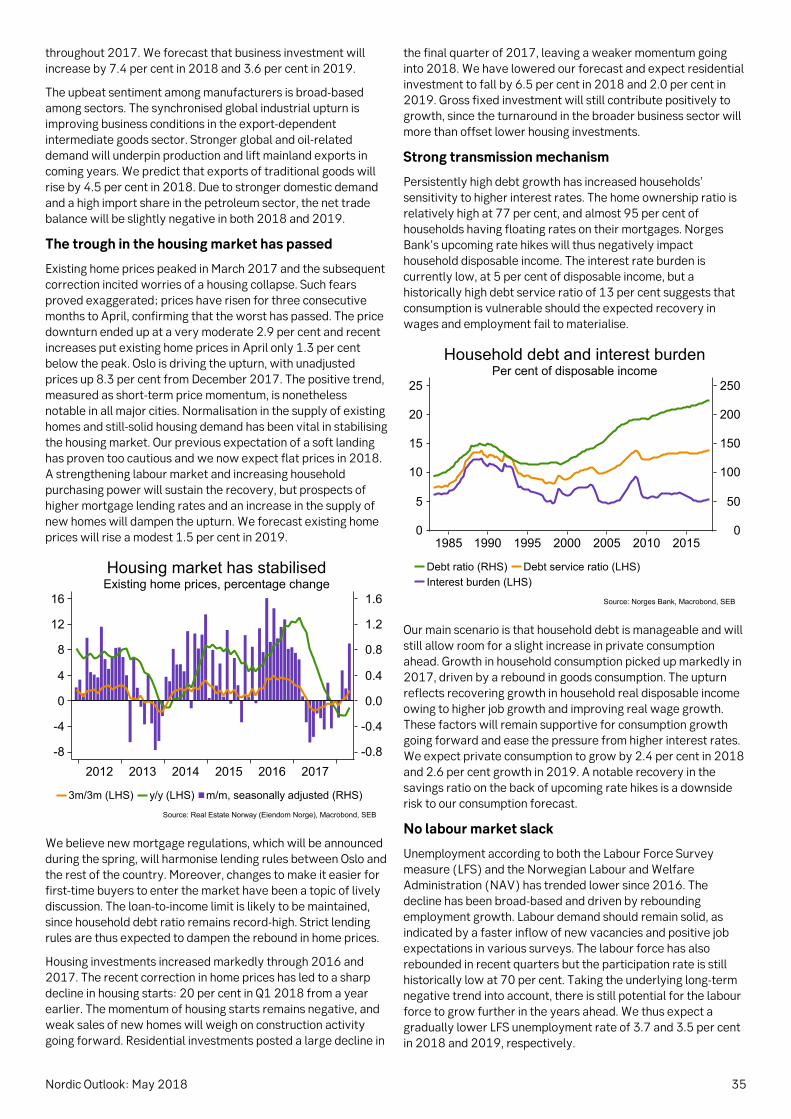
Nordic Outlook: May 2018 35
throughout 2017. We forecast that business investment will increase by 7.4 per cent in 2018 and 3.6 per cent in 2019.
The upbeat sentiment among manufacturers is broad-based among sectors. The synchronised global industrial upturn is improving business conditions in the export-dependent intermediate goods sector. Stronger global and oil-related demand will underpin production and lift mainland exports in coming years. We predict that exports of traditional goods will rise by 4.5 per cent in 2018. Due to stronger domestic demand and a high import share in the petroleum sector, the net trade balance will be slightly negative in both 2018 and 2019.
The trough in the housing market has passed
Existing home prices peaked in March 2017 and the subsequent correction incited worries of a housing collapse. Such fears proved exaggerated; prices have risen for three consecutive months to April, confirming that the worst has passed. The price downturn ended up at a very moderate 2.9 per cent and recent increases put existing home prices in April only 1.3 per cent below the peak. Oslo is driving the upturn, with unadjusted prices up 8.3 per cent from December 2017. The positive trend, measured as short-term price momentum, is nonetheless notable in all major cities. Normalisation in the supply of existing homes and still-solid housing demand has been vital in stabilising the housing market. Our previous expectation of a soft landing has proven too cautious and we now expect flat prices in 2018. A strengthening labour market and increasing household purchasing power will sustain the recovery, but prospects of higher mortgage lending rates and an increase in the supply of new homes will dampen the upturn. We forecast existing home prices will rise a modest 1.5 per cent in 2019.
Housing market has stabilisedExisting home prices, percentage change
-8
-4
0
4
8
12
16
-0.8
-0.4
0.0
0.4
0.8
1.2
1.6
2012 2013 2014 2015 2016 2017
3m/3m (LHS) y/y (LHS) m/m, seasonally adjusted (RHS)
Source: Real Estate Norway (Eiendom Norge), Macrobond, SEB
We believe new mortgage regulations, which will be announced during the spring, will harmonise lending rules between Oslo and the rest of the country. Moreover, changes to make it easier for first-time buyers to enter the market have been a topic of lively discussion. The loan-to-income limit is likely to be maintained, since household debt ratio remains record-high. Strict lending rules are thus expected to dampen the rebound in home prices.
Housing investments increased markedly through 2016 and 2017. The recent correction in home prices has led to a sharp decline in housing starts: 20 per cent in Q1 2018 from a year earlier. The momentum of housing starts remains negative, and weak sales of new homes will weigh on construction activity going forward. Residential investments posted a large decline in
the final quarter of 2017, leaving a weaker momentum going into 2018. We have lowered our forecast and expect residential investment to fall by 6.5 per cent in 2018 and 2.0 per cent in 2019. Gross fixed investment will still contribute positively to growth, since the turnaround in the broader business sector will more than offset lower housing investments.
Strong transmission mechanism
Persistently high debt growth has increased households’ sensitivity to higher interest rates. The home ownership ratio is relatively high at 77 per cent, and almost 95 per cent of households having floating rates on their mortgages. Norges Bank’s upcoming rate hikes will thus negatively impact household disposable income. The interest rate burden is currently low, at 5 per cent of disposable income, but a historically high debt service ratio of 13 per cent suggests that consumption is vulnerable should the expected recovery in wages and employment fail to materialise.
Household debt and interest burdenPer cent of disposable income
0
5
10
15
20
25
0
50
100
150
200
250
1985 1990 1995 2000 2005 2010 2015
Debt ratio (RHS) Debt service ratio (LHS)
Interest burden (LHS)
Source: Norges Bank, Macrobond, SEB
Our main scenario is that household debt is manageable and will still allow room for a slight increase in private consumption ahead. Growth in household consumption picked up markedly in 2017, driven by a rebound in goods consumption. The upturn reflects recovering growth in household real disposable income owing to higher job growth and improving real wage growth. These factors will remain supportive for consumption growth going forward and ease the pressure from higher interest rates. We expect private consumption to grow by 2.4 per cent in 2018 and 2.6 per cent growth in 2019. A notable recovery in the savings ratio on the back of upcoming rate hikes is a downside risk to our consumption forecast.
No labour market slack
Unemployment according to both the Labour Force Survey measure (LFS) and the Norwegian Labour and Welfare Administration (NAV) has trended lower since 2016. The decline has been broad-based and driven by rebounding employment growth. Labour demand should remain solid, as indicated by a faster inflow of new vacancies and positive job expectations in various surveys. The labour force has also rebounded in recent quarters but the participation rate is still historically low at 70 per cent. Taking the underlying long-term negative trend into account, there is still potential for the labour force to grow further in the years ahead. We thus expect a gradually lower LFS unemployment rate of 3.7 and 3.5 per cent in 2018 and 2019, respectively.

36 Nordic Outlook: May 2018
Our understanding is that Norges Bank assumes the equilibrium unemployment level to be near 2.5 per cent on the registered unemployment measure. This would imply that there is little or no slack left and that the output gap has essentially closed, but moderate wage growth lends uncertainty. We believe that the aim of maintaining cost competitiveness will keep pay hikes at a moderate level in a historical comparison. A tighter labour market, above-trend economic growth and improved business profitability will nonetheless push wage and salary growth slightly higher. We forecast annual pay increases of 2.9 and 3.2 per cent in 2018 and 2019, respectively.
Inflation undershooting the official target
The inflation rate fell sharply between summer 2016 and autumn 2017, from almost 4 per cent to below 1 per cent. The downturn was driven by lower prices for imported goods, reflecting fluctuations in the exchange rate. Since then, goods inflation has stabilised at a low level, at least if volatile prices for energy and food are excluded. The exchange rate is expected to make a negligible contribution to inflation over the next 3 to 6 months. CPI-ATE inflation (excluding taxes and energy) rose by just over 1 percent in early 2018. We expect a further gradual upturn, but the directionless trend in the exchange rate makes the outlook less certain. The main driving force behind the upturn in CPI-ATE is related to a normalisation in food prices after last year’s fall. We expect food prices to lift the annual change in CPI-ATE by a couple of tenths this summer.
Domestic inflationary pressures have been weak in recent years, partly reflecting depressed wage and salary increases. Although we expect a slight acceleration in wages over the next few years, the increase will not be enough to bring inflation back to target. Higher service inflation will nevertheless make the inflation rate stabilise in 2019. We share Norges Bank’s assessment that the inflation rate bottomed out last summer, but we continue to see downside risks relative to the central bank’s trajectory. We expect CPI-ATE to increase by 1.3 per cent this year and 1.7 per cent in 2019. Rising energy prices for both petroleum and electricity will lift CPI inflation to 2.2 and 1.7 per cent, respectively.
Lift-off in September
Norges Bank has kept its key interest rate stable at 0.50 per cent since March 2016. Core inflation remains subdued, and despite the inflation target having been lowered to 2.0 from 2.5 per cent, CPI-ATE will continue to undershoot the target
throughout our forecast period. However, a lower numerical inflation target is in itself of little importance for the near-term rate outlook, given Norges Bank’s flexible mandate which assigns greater weight to developments in the real economy. Expectations of strong economic growth, a closed output gap and a stabilisation in home prices support higher inflation over time. The very low level of key rates is thus increasingly out of line with solid domestic fundamentals. Hence, a rate hike is looming, and Norges Bank has signalled a lift-off this autumn. We expect the first hike this September, but a strong transmission mechanism suggests a well-communicated and very gradual hiking cycle. We expect an average of two hikes yearly, with a key rate of 1.25 per cent by the end of 2019.
Higher capacity utilisation justifies rate hikesPer cent
-1.5
-1.0
-0.5
0.0
0.5
1.0
0.0
0.5
1.0
1.5
2.0
2.5
3.0
2010 2012 2014 2016 2018 2020
Key rate (RHS) Norges Bank's rate path (RHS)
Output gap (LHS)
Source: Norges Bank, Macrobond, SEB
Fundamentals support a stronger NOK
The Norwegian krone should benefit from strong economic growth and upcoming rate hikes. Our expectation of a September hike followed by two hikes per year is not fully priced in by markets. Moreover, diminishing fears of a housing collapse should boost confidence in a stronger krone outlook. Rising oil prices have failed to drive the krone notably higher, reflecting a weaker correlation between the exchange rate and oil prices. However, the krone is cheap relative to its long-term valuation. With Norges Bank bringing rates higher, there are several reasons to foresee a stronger krone. We expect the EUR/NOK exchange rate to gradually fall towards 9.20 and 9.00 by the end of 2018 and 2019, respectively.
Higher yields driven by Norges Bank
Norwegian government bonds trade with a large spread against their German equivalents. This partly reflects the fact that Norway has not introduced unconventional monetary policy measures. Hence, higher German yields driven by an ECB policy shift should not affect Norwegian interest rates so much. Moreover, introducing new bonds via syndication will put less steepening pressure on the yield curve, since it reduces supply in the secondary market. The positive krone outlook and the relative attractive yield spread suggest that Norwegian government bonds will outperform. We expect Norges Bank’s rate hike to keep the 10-year yield spread against Germany at 120 basis points by the end of 2018. In 2019, higher German yields and initial rate hikes from the ECB will tighten the spread to 85 basis points by the end of the year.

Nordic Outlook: May 2018 37
Finland Good growth, but a long way to go after a lengthy slowdown
The Finnish economy is obviously on more solid footing. Last year’s growth was the strongest since 2010. Exports have recovered lost ground. Good export and capital spending trends will continue to drive economic performance. Households are in a cheerful mood, but due to low savings and weak pay hikes they are cautious despite job growth. GDP will increase by 2.5 per cent in 2018 and 2.4 per cent in 2019: in line with the other Nordic countries, and marginally better than the euro zone as a whole.
The acceleration in economic growth is encouraging but at the same time insufficient to close the gap that has emerged between Finland and the other Nordic countries as well as the euro zone over the past decade. Given our growth forecast, this year Finland will regain its 2008 level of GDP, while the euro zone is nearly 10 per cent and Sweden about 20 per cent higher.
As elsewhere in the euro zone, indicators have fallen in recent months, but companies remain optimistic and the European Commission’s Economic Sentiment Indicator (ESI) is close to its earlier cyclical peaks. Especially in 2017, indicators actually pointed to even stronger growth than materialised. Large-scale inventory reductions held back Finland’s GDP growth in 2017; a large positive contribution from net exports was neutralised by an equally large negative contribution from inventories.
Companies are upbeat about the order situation in both their domestic and export markets, despite a slight downturn in recent weeks. Industrial production is currently growing at about 5 per cent year-on-year and is expected to maintain this pace in 2018-2019. The 2016 Competitiveness Pact between government, employers and unions is helping to lift the export sector, but the strong euro is increasingly hampering exports, especially compared to Swedish companies that are benefiting from the greatly undervalued krona. Finnish exports are also benefiting from the good economic growth of trading partners; right now such expansion is clearest in markets outside the EU. Imports normally increase at the same time as domestic demand and exports, but this is now happening after a time lag, partly
due to inventory reduction in 2017. Because exports rose faster than imports in 2017, Finland reported a current account surplus for the first time since 2010. The surplus is expected to remain around 0.5 per cent of GDP in 2018-2019. Capacity utilisation will keep rising, and thus also the need for new business investments. Capital spending will increase by about 4 per cent yearly in 2018-2019, which is somewhat slower than the rapid growth of the previous two years. Machinery investments are increasing the fastest, but residential and other investments are also rising. The number of building permits has recently fallen, though, but it is above the level of one year ago.
Home prices are increasing slightly and construction is concentrated in expanding regions. Household are in a better mood than ever but remain cautious in light of changing fundamentals. Although employment is rising, weak real wage growth will limit the upturn in a weak rise in household purchasing power while the savings ratio is negative. Overall we believe household consumption will increase by just short of 2 per cent yearly in 2018-2019.
The labour market is gradually improving, but joblessness remains high. There are clear signs that matching problems are slowing the downturn in unemployment. The number of job openings is the highest since measurements began in the 1960s, suggesting both geographic and skills-related labour shortages. We expect unemployment to fall to 7.5 per cent in 2019. But in order to push it even lower, Finland needs further structural measures such as training programmes and incentives for people to move to regions where the labour market is hottest.
Pay increases are being held back by the Competitiveness Pact but will accelerate to 2-2.5 per cent in 2019. Inflation pressure remains weak and is lower than in the euro zone generally. This is partly due to low wage pressure but primarily to low domestic demand pressure. Food and energy prices are causing some upward pressure, but a stronger euro is offsetting this effect. Inflation will be 1.1 per cent in 2018 and 1.4 per cent in 2019.
Fiscal policy will remain tight. In 2017 the public sector deficit fell to a nine-year low, 0.6 per cent of GDP. It will continue falling to just below zero in 2019. Government debt will drop back below the EU’s limit of 60 per cent of GDP next year.

38 Nordic Outlook: May 2018
Estonia Steady growth pace after last year’s sprint
Estonia’s 2017 GDP growth surpassed all expectations. At 4.9 per cent, it was the fastest since 2011. Growth is now expected to move closer to long-term potential: 3.5 per cent in 2018 and 3.0 per cent in 2019. It will also be better balanced, driven by both domestic demand and exports. However the outlook remains a bit uncertain, since growth in manufacturing has slowed and the impact on consumption of the personal income tax cut remains to be seen. A tight labour market will limit medium-term growth potential.
While many institutions have previously revised their forecasts upward, we are taking a slightly more cautious position in light of recent data and are leaving our GDP growth forecast unchanged at 3.5 per cent in 2018 and 3.0 per cent in 2019. Estonia’s industrial production expanded by a decent 6 per cent during the first quarter of 2018. Yet in manufacturing, growth has been decelerating. Since around 70 per cent of industrial output is exported, the outlook depends mostly on external factors. One clearly negative factor has been the downturn in the Swedish construction market, which has hurt exports of wood products, prefabricated houses and furniture. We believe the euro zone’s weak indicators in Q1 were temporary and expect strong export growth of more than 4 per cent both in 2018 and 2019.
A more longstanding problem is the productivity of the manufacturing sector, which is falling behind the average for the business sector. This reflects the fact that companies operate in a narrow portion of the value chain, while more value-adding activities such as product development and marketing are outsourced abroad. The share of labour costs in total manufacturing value-added is already among the highest in EU. This may force companies relying on cheap labour to leave, while there are very few productive businesses that could absorb the excess labour.
A continuous problem is the low investment appetite of the business sector. In 2017 capital spending finally started to increase in absolute terms, but as a share of business sector revenue, there is little change. After peaking in Q2 2017, manufacturing capacity utilisation has trended downward, confirming that there are few reasons to expect a sudden burst of investment. However, the availability of EU funding continues to foster public sector investments. Overall, this should lead to an increase in capital spending of around 4.6 per cent this year.
In 2018 a new personal income tax system took effect, raising the tax-exempt amount from EUR 180 to EUR 500 for those earning less than EUR 1,200 a month. For incomes above that level the tax- exempt amount progressively decreases, reaching zero for incomes above EUR 2,100. Since the reform’s main beneficiaries have a larger propensity to consume, our forecasts assume a substantial increase in private consumption. Q1retail sales rose by a solid 5 per cent, but the tax reform does not seem to have had a significant impact. We are leaving our forecast for private consumption growth at 4.3 per cent in 2018, but without stronger sales figures this forecast may be
revised downward. Consumption continues to be curbed by inflation, which remains slightly above 3 per cent this year and will ease to 2.5 per cent in 2019.
Besides the tax reform, private consumption continues to be supported by extremely favourable labour market conditions. Employment in the 15-74 age group reached 67.8 per cent last year, the highest in the EU. Strong demand for labour has been a boon for migration. Estonia has become one of the few exceptions among former Soviet countries, demonstrating positive net migration three years in a row. Further job growth is highly negligible, and this is increasingly restricting GDP growth. Due to ongoing labour market reform aimed at boosting participation by people with disabilities, unemployment will rise marginally to 6.0 per cent in 2018 and 6.4 per cent in 2019.
Scarce labour supply has been driving pay increases. In the past three years, average gross earnings have risen by 22 per cent. They are expected to reach around EUR 1,300 this year. As overall pay remains far behind the Nordic countries, this does not seem to have had a major effect on competitiveness. According to our estimates wage pressure will ease a bit in 2019 to 5.3 per cent.
Strong income growth has not only benefited consumption, but also saving. Estonia’s household savings ratio, which previously lagged behind other countries, has now converged with the EU average. Although lending has also picked up, household deposits are increasing at a much faster pace, reaching almost 10 per cent year-on-year.
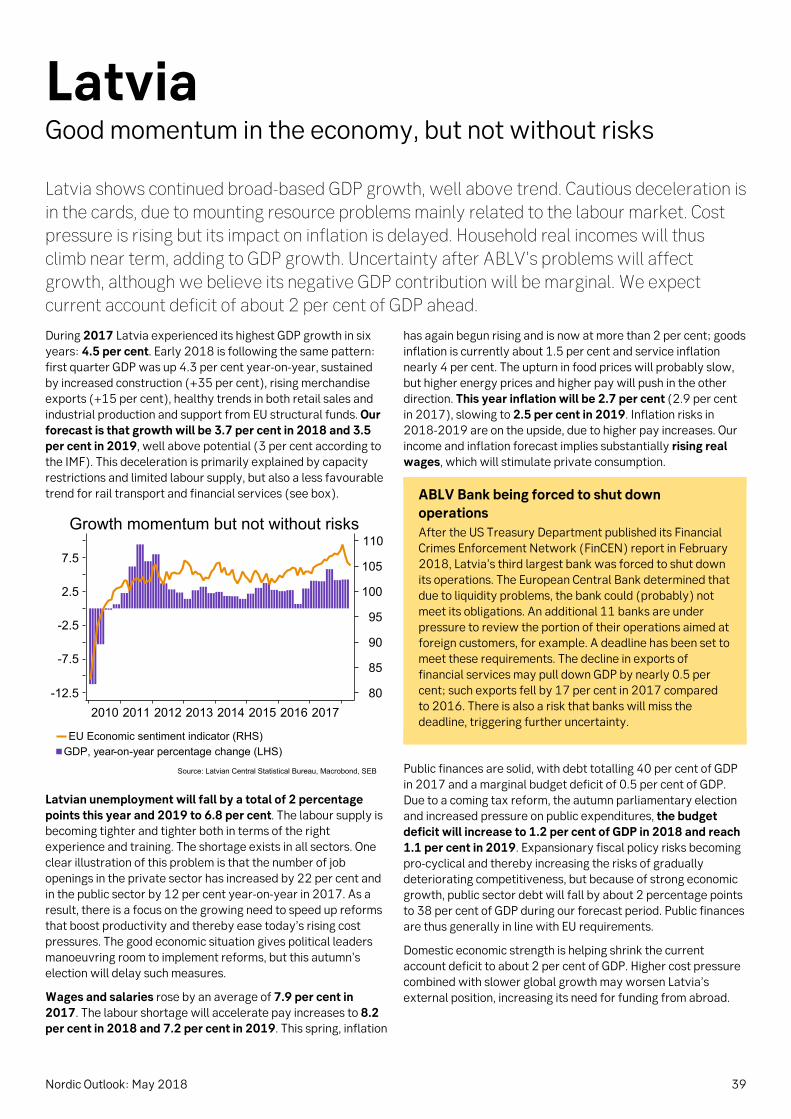
Nordic Outlook: May 2018 39
Latvia Good momentum in the economy, but not without risks
Latvia shows continued broad-based GDP growth, well above trend. Cautious deceleration is in the cards, due to mounting resource problems mainly related to the labour market. Cost pressure is rising but its impact on inflation is delayed. Household real incomes will thus climb near term, adding to GDP growth. Uncertainty after ABLV’s problems will affect growth, although we believe its negative GDP contribution will be marginal. We expect current account deficit of about 2 per cent of GDP ahead.
During 2017 Latvia experienced its highest GDP growth in six years: 4.5 per cent. Early 2018 is following the same pattern: first quarter GDP was up 4.3 per cent year-on-year, sustained by increased construction (+35 per cent), rising merchandise exports (+15 per cent), healthy trends in both retail sales and industrial production and support from EU structural funds. Our forecast is that growth will be 3.7 per cent in 2018 and 3.5 per cent in 2019, well above potential (3 per cent according to the IMF). This deceleration is primarily explained by capacity restrictions and limited labour supply, but also a less favourable trend for rail transport and financial services (see box).
Growth momentum but not without risks
-12.5
-7.5
-2.5
2.5
7.5
80
85
90
95
100
105
110
2010 2011 2012 2013 2014 2015 2016 2017
EU Economic sentiment indicator (RHS)
GDP, year-on-year percentage change (LHS)
Source: Latvian Central Statistical Bureau, Macrobond, SEB
Latvian unemployment will fall by a total of 2 percentage points this year and 2019 to 6.8 per cent. The labour supply is becoming tighter and tighter both in terms of the right experience and training. The shortage exists in all sectors. One clear illustration of this problem is that the number of job openings in the private sector has increased by 22 per cent and in the public sector by 12 per cent year-on-year in 2017. As a result, there is a focus on the growing need to speed up reforms that boost productivity and thereby ease today’s rising cost pressures. The good economic situation gives political leaders manoeuvring room to implement reforms, but this autumn’s election will delay such measures.
Wages and salaries rose by an average of 7.9 per cent in 2017. The labour shortage will accelerate pay increases to 8.2 per cent in 2018 and 7.2 per cent in 2019. This spring, inflation
has again begun rising and is now at more than 2 per cent; goods inflation is currently about 1.5 per cent and service inflation nearly 4 per cent. The upturn in food prices will probably slow, but higher energy prices and higher pay will push in the other direction. This year inflation will be 2.7 per cent (2.9 per cent in 2017), slowing to 2.5 per cent in 2019. Inflation risks in 2018-2019 are on the upside, due to higher pay increases. Our income and inflation forecast implies substantially rising real wages, which will stimulate private consumption.
ABLV Bank being forced to shut down operations After the US Treasury Department published its Financial Crimes Enforcement Network (FinCEN) report in February 2018, Latvia’s third largest bank was forced to shut down its operations. The European Central Bank determined that due to liquidity problems, the bank could (probably) not meet its obligations. An additional 11 banks are under pressure to review the portion of their operations aimed at foreign customers, for example. A deadline has been set to meet these requirements. The decline in exports of financial services may pull down GDP by nearly 0.5 per cent; such exports fell by 17 per cent in 2017 compared to 2016. There is also a risk that banks will miss the deadline, triggering further uncertainty.
Public finances are solid, with debt totalling 40 per cent of GDP in 2017 and a marginal budget deficit of 0.5 per cent of GDP. Due to a coming tax reform, the autumn parliamentary election and increased pressure on public expenditures, the budget deficit will increase to 1.2 per cent of GDP in 2018 and reach 1.1 per cent in 2019. Expansionary fiscal policy risks becoming pro-cyclical and thereby increasing the risks of gradually deteriorating competitiveness, but because of strong economic growth, public sector debt will fall by about 2 percentage points to 38 per cent of GDP during our forecast period. Public finances are thus generally in line with EU requirements.
Domestic economic strength is helping shrink the current account deficit to about 2 per cent of GDP. Higher cost pressure combined with slower global growth may worsen Latvia’s external position, increasing its need for funding from abroad.
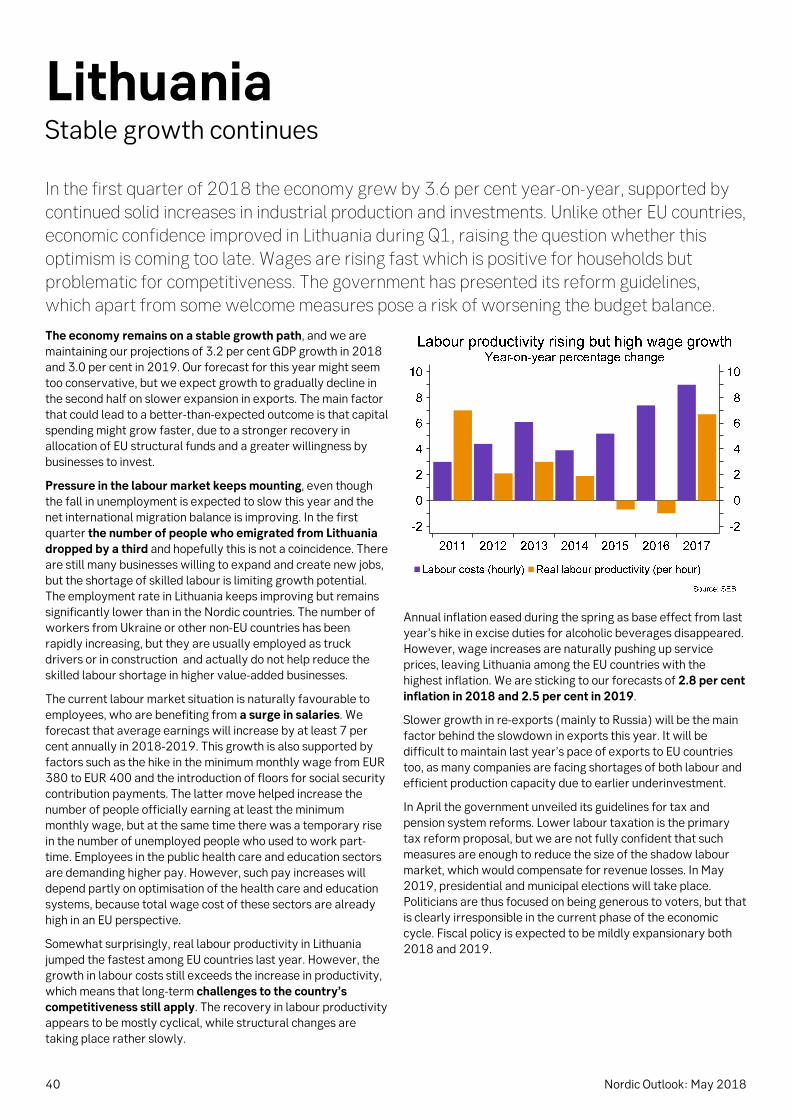
40 Nordic Outlook: May 2018
Lithuania Stable growth continues
In the first quarter of 2018 the economy grew by 3.6 per cent year-on-year, supported by continued solid increases in industrial production and investments. Unlike other EU countries, economic confidence improved in Lithuania during Q1, raising the question whether this optimism is coming too late. Wages are rising fast which is positive for households but problematic for competitiveness. The government has presented its reform guidelines, which apart from some welcome measures pose a risk of worsening the budget balance.
The economy remains on a stable growth path, and we are maintaining our projections of 3.2 per cent GDP growth in 2018 and 3.0 per cent in 2019. Our forecast for this year might seem too conservative, but we expect growth to gradually decline in the second half on slower expansion in exports. The main factor that could lead to a better-than-expected outcome is that capital spending might grow faster, due to a stronger recovery in allocation of EU structural funds and a greater willingness by businesses to invest.
Pressure in the labour market keeps mounting, even though the fall in unemployment is expected to slow this year and the net international migration balance is improving. In the first quarter the number of people who emigrated from Lithuania dropped by a third and hopefully this is not a coincidence. There are still many businesses willing to expand and create new jobs, but the shortage of skilled labour is limiting growth potential. The employment rate in Lithuania keeps improving but remains significantly lower than in the Nordic countries. The number of workers from Ukraine or other non-EU countries has been rapidly increasing, but they are usually employed as truck drivers or in construction and actually do not help reduce the skilled labour shortage in higher value-added businesses.
The current labour market situation is naturally favourable to employees, who are benefiting from a surge in salaries. We forecast that average earnings will increase by at least 7 per cent annually in 2018-2019. This growth is also supported by factors such as the hike in the minimum monthly wage from EUR 380 to EUR 400 and the introduction of floors for social security contribution payments. The latter move helped increase the number of people officially earning at least the minimum monthly wage, but at the same time there was a temporary rise in the number of unemployed people who used to work part-time. Employees in the public health care and education sectors are demanding higher pay. However, such pay increases will depend partly on optimisation of the health care and education systems, because total wage cost of these sectors are already high in an EU perspective.
Somewhat surprisingly, real labour productivity in Lithuania jumped the fastest among EU countries last year. However, the growth in labour costs still exceeds the increase in productivity, which means that long-term challenges to the country’s competitiveness still apply. The recovery in labour productivity appears to be mostly cyclical, while structural changes are taking place rather slowly.
Annual inflation eased during the spring as base effect from last year’s hike in excise duties for alcoholic beverages disappeared. However, wage increases are naturally pushing up service prices, leaving Lithuania among the EU countries with the highest inflation. We are sticking to our forecasts of 2.8 per cent inflation in 2018 and 2.5 per cent in 2019.
Slower growth in re-exports (mainly to Russia) will be the main factor behind the slowdown in exports this year. It will be difficult to maintain last year’s pace of exports to EU countries too, as many companies are facing shortages of both labour and efficient production capacity due to earlier underinvestment.
In April the government unveiled its guidelines for tax and pension system reforms. Lower labour taxation is the primary tax reform proposal, but we are not fully confident that such measures are enough to reduce the size of the shadow labour market, which would compensate for revenue losses. In May 2019, presidential and municipal elections will take place. Politicians are thus focused on being generous to voters, but that is clearly irresponsible in the current phase of the economic cycle. Fiscal policy is expected to be mildly expansionary both 2018 and 2019.

Nordic Outlook: May 2018 41
Global key indicators Yearly change in per cent
2016 2017 2018 2019 GDP OECD 1.8 2.5 2.5 2.3 GDP world (PPP) 3.2 3.8 4.0 3.9 CPI OECD 1.1 2.3 2.3 1.9 Oil price, Brent (USD/barrel) 45 55 75 85
US Yearly change in per cents
2017 level, USD bn 2016 2017 2018 2019 Gross domestic product 19,754 1.5 2.3 2.8 2.5 Private consumption 13,654 2.7 2.8 3.0 2.7 Public consumption 3,407 0.8 0.1 1.0 0.6 Gross fixed investment 3,295 0.6 4.1 4.3 3.0 Stock building (change as % of GDP) -0.4 -0.1 0.0 0.0 Exports 2,420 -0.3 3.4 4.4 3.6 Imports 3,022 1.3 4.0 4.3 2.9 Unemployment (%) 4.9 4.4 3.8 3.7 Consumer prices 1.3 2.1 2.4 2.1 Household savings ratio (%) 4.9 3.4 3.1 3.3 Public sector financial balance, % of GDP -4.4 -3.8 -4.6 -5.1 Public sector debt, % of GDP 107.1 108.1 108.7 109.1
Euro zone Yearly change in per cent
2017 level, EUR bn 2016 2017 2018 2019 Gross domestic product 10,516 1.8 2.4 2.4 2.3 Private consumption 5,754 2.0 1.7 1.8 2.0 Public consumption 2,169 1.8 1.2 1.3 1.5 Gross fixed investment 2,078 4.6 2.9 4.3 4.0 Stock building (change as % of GDP) 0 -0.1 0.1 0.0 0.0 Exports 4,847 3.4 5.1 4.9 4.5 Imports 4,362 4.8 4.3 4.8 4.8 Unemployment (%) 10.0 9.1 8.4 7.9 Consumer prices 0.2 1.5 1.4 1.3 Household savings ratio (%) 6.2 6.3 6.2 6.0 Public sector financial balance, % of GDP -1.5 -0.9 -0.7 -0.6 Public sector debt, % of GDP 89.0 86.7 85.6 83.3

42 Nordic Outlook: May 2018
Other large countries Yearly change in per cent 2016 2017 2018 2019 GDP United Kingdom 1.9 1.8 1.2 1.6 Japan 0.9 1.7 1.2 1.0 Germany 1.9 2.2 2.4 2.1 France 1.2 1.9 2.0 2.2 Italy 0.9 1.5 1.6 1.8 China 6.7 6.9 6.6 6.2 India 7.9 6.4 7.3 7.5 Brazil -3.5 1.0 2.7 2.9 Russia -0.2 1.5 1.8 2.2 Poland 3.0 4.6 4.2 3.2 Inflation United Kingdom 0.6 2.6 2.3 1.9 Japan -0.3 0.5 1.0 1.3 Germany 1.7 1.7 1.5 1.6 France 0.8 1.2 1.5 1.2 Italy -0.1 1.3 1.0 0.9 China 2.0 1.6 2.3 2.5 India 5.0 3.3 4.8 5.0 Brazil 8.8 3.5 3.3 4.2 Russia 7.1 3.7 2.9 4.0 Poland -0.6 2.0 2.0 2.7 Unemployment (%) United Kingdom 4.9 4.4 4.3 4.5 Japan 3.1 2.8 2.5 2.3 Germany 4.1 3.8 3.6 3.7 France 9.9 9.0 8.7 8.5 Italy 11.7 11.3 10.9 10.5
Financial forecasts Official interest rates 09-May Sep-18 Dec-18 Jun-19 Dec-19 US Fed funds 1.75 2.25 2.50 3.00 3.00 Japan Call money rate -0.10 -0.10 -0.10 -0.10 -0.10 Euro zone Refi rate 0.00 0.00 0.00 0.00 0.25 United Kingdom Repo rate 0.50 0.50 0.50 0.50 1.00 Bond yields US 10 years 3.00 3.10 3.15 3.40 3.40 Japan 10 years 0.05 0.05 0.05 0.05 0.05 Germany 10 years 0.56 0.70 0.80 1.10 1.30 United Kingdom 10 years 1.46 1.55 1.65 1.95 2.15 Exchange rates USD/JPY 110 111 110 106 100 EUR/USD 1.19 1.16 1.18 1.22 1.26 EUR/JPY 130 129 130 129 126 EUR/GBP 0.87 0.88 0.86 0.83 0.82 GBP/USD 1.36 1.30 1.37 1.47 1.54

Nordic Outlook: May 2018 43
Sweden Yearly change in per cent 2017 level, SEK bn 2016 2017 2018 2019 Gross domestic product 4,604 3.2 2.4 2.6 2.2 Gross domestic product, working day adjustment
3.0 2.7 2.7 2.2
Private consumption 2,030 2.2 2.4 1.8 1.8 Public consumption 1,198 3.1 0.4 0.8 0.5 Gross fixed investment 1,149 5.6 6.0 4.5 3.0 Stock building (change as % of GDP) 35 0.0 0.1 0.0 0.0 Exports 2,086 3.3 3.7 7.0 4.7 Imports 1,894 3.4 5.0 6.7 4.0 Unemployment, (%) 6.9 6.7 6.0 6.0 Employment 1.5 2.3 1.7 1.0 Industrial production 3.5 4.5 6.0 5.0 CPI 1.0 1.8 1.9 1.8 CPIF 1.4 2.0 2.0 1.8 Hourly wage increases 2.4 2.4 2.9 3.3 Real disposable income 3.5 2.2 2.3 1.5 Household savings ratio (%) 16.6 15.9 16.3 15.9 Current account, % of GDP 4.2 3.2 3.6 3.7 Central government borrowing, SEK bn -85 -62 -70 -40 Public sector financial balance, % of GDP 1.2 1.3 1.1 0.8 Public sector debt, % of GDP 42.1 40.6 37.3 34.8 Financial forecasts 09-May Sep-18 Dec-18 Jun-19 Dec-19 Repo rate -0.50 -0.50 -0.50 -0.25 0.00 3-month interest rate, STIBOR -0.36 -0.50 -0.52 -0.25 0.00 10-year bond yield 0.71 0.85 0.95 1.40 1.70 10-year spread to Germany, bp 15 15 15 30 40 USD/SEK 8.71 8.92 8.56 8.03 7.70 EUR/SEK 10.32 10.15 9.95 9.80 9.70 KIX 120.1 121.0 118.3 114.7 113.5
Finland Yearly change in per cent 2017 level, EUR bn 2016 2017 2018 2019 Gross domestic product 219 2.1 2.6 2.5 2.4 Private consumption 119 1.8 1.6 1.8 1.8 Public consumption 52 1.8 1.3 0.6 0.5 Gross fixed investment 47 7.4 6.3 4.0 3.5 Stock building (change as % of GDP) 0 0.1 -1.6 0.4 0.1 Exports 78 3.5 7.8 4.7 5.0 Imports 79 5.7 3.5 4.5 4.0 Unemployment, OECD harmonised (%) 8.9 8.6 8.1 7.8 CPI, harmonised 0.4 0.8 1.1 1.4 Hourly wage increases 1.1 -1.0 1.5 2.0 Current account, % of GDP -0.3 0.7 0.5 0.5 Public sector financial balance, % of GDP -1.8 -0.6 -0.4 -0.2 Public sector debt, % of GDP 63.0 61.4 60.0 58.0

44 Nordic Outlook: May 2018
Norway Yearly change in per cent 2017 level, NOK bn 2016 2017 2018 2019 Gross domestic product 3,209 1.1 1.9 2.0 2.3 Gross domestic product (Mainland) 2,695 1.0 1.9 2.5 2.4 Private consumption 1,406 1.5 2.3 2.4 2.6 Public consumption 759 2.1 2.0 1.2 1.3 Gross fixed investment 766 -0.2 3.5 3.8 2.3 Stock building (change as % of GDP) 1.4 -0.1 -0.1 0.0 Exports 1,165 -1.8 0.8 2.9 2.5 Imports 1,047 2.3 2.2 3.5 2.7 Unemployment (%) 4.7 4.2 3.7 3.5 CPI 3.6 1.9 2.2 1.7 CPI-ATE 3.1 1.4 1.4 1.7 Annual wage increases 1.7 2.3 2.9 3.2 Financial forecasts 09-May Sep-18 Dec-18 Jun-19 Dec-19 Deposit rate 0.50 0.75 0.75 1.00 1.25 10-year bond yield 1.82 1.90 1.95 2.10 2.15 10-year spread to Germany, bp 126 120 120 100 85 USD/NOK 8.08 7.97 7.80 7.46 7.14 EUR/NOK 9.58 9.25 9.20 9.10 9.00
Denmark Yearly change in per cent 2017 level, DKK bn 2016 2017 2018 2019 Gross domestic product 2,145 2.0 2.2 2.2 2.3 Private consumption 1,015 2.3 1.5 2.8 2.5 Public consumption 536 0.3 1.2 2.0 1.2 Gross fixed investment 437 6.0 3.7 4.5 3.6 Stock building (change as % of GDP) 0.0 0.1 -0.6 0.0 Exports 1,184 2.8 4.5 3.2 3.6 Imports 1,033 3.8 4.1 3.4 4.1 Unemployment, OECD harmonised (%) 6.5 5.4 5.0 4.6 CPI, harmonised 0.3 1.1 0.6 1.0 Hourly wage increases 1.8 1.7 1.8 2.3 Current account, % of GDP 7.9 9.0 8.0 7.0 Public sector financial balance, % of GDP -0.6 0.0 0.5 1.0 Public sector debt, % of GDP 37.7 37.0 36.0 35.0 Financial forecasts 09-May Sep-18 Dec-18 Jun-19 Dec-19 Lending rate 0.05 0.05 0.05 0.05 0.30 10-year bond yield 0.64 0.80 0.90 1.20 1.40 10-year spread to Germany, bp 8 10 10 10 10 USD/DKK 6.28 6.41 6.31 6.10 5.90 EUR/DKK 7.45 7.44 7.44 7.44 7.44

Nordic Outlook: May 2018 45
Lithuania Yearly change in per cent 2017 level, EUR bn 2016 2017 2018 2019 Gross domestic product 42 2.3 3.9 3.2 3.0 Private consumption 27 5.0 3.8 3.6 3.5 Public consumption 7 1.3 1.0 1.3 1.3 Gross fixed investment 8 -0.5 7.3 9.0 6.0 Exports 34 3.5 13.6 5.1 3.7 Imports 33 3.5 12.8 6.2 4.5 Unemployment (%) 7.9 7.1 6.7 6.5 Consumer prices 0.7 3.7 2.8 2.5 Public sector financial balance, % of GDP 0.3 0.5 0.3 0.2 Public sector debt, % of GDP 40.1 39.7 36.0 38.0
Latvia Yearly change in per cent 2017 level, EUR bn 2016 2017 2018 2019 Gross domestic product 25 2.1 4.5 3.7 3.5 Private consumption 15 3.4 5.1 5.4 4.4 Public consumption 4 2.7 4.1 3.5 3.1 Gross fixed investment 5 -15.0 16.0 14.0 7.2 Exports 15 4.1 4.4 3.5 3.2 Imports 14 4.5 9.2 8.0 6.0 Unemployment (%) 9.6 8.7 7.6 6.8 Consumer prices 0.1 2.9 2.7 2.5 Public sector financial balance, % of GDP 0.0 -0.5 -1.2 -1.1 Public sector debt, % of GDP 40.5 40.1 39.4 38.3
Estonia Yearly change in per cent 2017 level, EUR bn 2016 2017 2018 2019 Gross domestic product 21 2.1 4.9 3.5 3.0 Private consumption 11 4.4 2.2 4.3 3.3 Public consumption 4 1.9 0.8 2.2 2.5 Gross fixed investment 5 -1.2 13.1 4.6 3.8 Exports 17 4.1 2.9 4.3 4.0 Imports 16 5.3 3.5 4.5 4.0 Unemployment (%) 6.8 6.3 6.0 6.4 Consumer prices 0.8 3.7 3.2 2.5 Public sector financial balance, % of GDP -0.3 -0.3 -0.3 -0.4 Public sector debt, % of GDP 9.4 9.2 8.8 8.7

46 Nordic Outlook: May 2018
Contacts
Robert Bergqvist Chief Economist Japan + 46 8 506 230 16
Håkan Frisén Head of Economic Forecasting + 46 8 763 80 67
Daniel Bergvall The euro zone, Finland +46 8 506 23118
Erica Blomgren SEB Oslo Norway +47 2282 7277
Ann Enshagen Lavebrink + 46 8 763 80 77
Richard Falkenhäll United Kingdom, Foreign exchange markets +46 8 506 23133
Lina Fransson Government bond markets +46 8 506 232 02
Dainis Gaspuitis SEB Riga Latvia +371 67779994
Johan HagbarthStock markets +46 8 763 69 58
Per Hammarlund Russia +46 8 506 231 77
Carl Hammer +46 8 506 23128
Olle Holmgren Sweden +46 8 763 80 79
Johan Javeus +46 8 506 23019
Melody Jiang SEB Singapore China +65 6505 0584
Andreas Johnson US, India +46 73 523 77 25
Elisabet Kopelman + 46 8 506 23091
Elizabeth Mathiesen SEB Copenhagen Denmark +45 2855 1747
Mihkel Nestor SEB Tallinn Estonia +372 6655172
Tadas Povilauskas SEB Vilnius Lithuania +370 68646476
This report was published on May 16, 2016 Cut-off date for calculations and forecasts was May 09, 2018
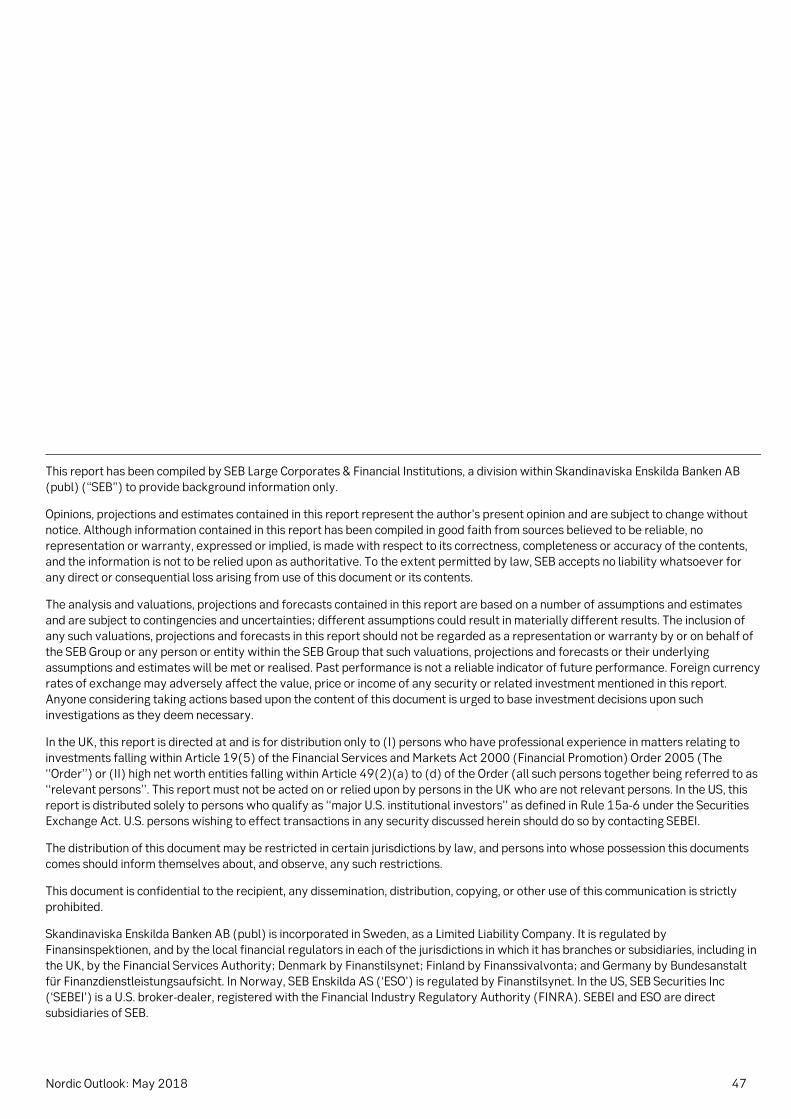
Nordic Outlook: May 2018 47
This report has been compiled by SEB Large Corporates & Financial Institutions, a division within Skandinaviska Enskilda Banken AB(publ) (“SEB”) to provide background information only.
Opinions, projections and estimates contained in this report represent the author’s present opinion and are subject to change withoutnotice. Although information contained in this report has been compiled in good faith from sources believed to be reliable, norepresentation or warranty, expressed or implied, is made with respect to its correctness, completeness or accuracy of the contents,and the information is not to be relied upon as authoritative. To the extent permitted by law, SEB accepts no liability whatsoever forany direct or consequential loss arising from use of this document or its contents.
The analysis and valuations, projections and forecasts contained in this report are based on a number of assumptions and estimatesand are subject to contingencies and uncertainties; different assumptions could result in materially different results. The inclusion ofany such valuations, projections and forecasts in this report should not be regarded as a representation or warranty by or on behalf ofthe SEB Group or any person or entity within the SEB Group that such valuations, projections and forecasts or their underlyingassumptions and estimates will be met or realised. Past performance is not a reliable indicator of future performance. Foreign currencyrates of exchange may adversely affect the value, price or income of any security or related investment mentioned in this report.Anyone considering taking actions based upon the content of this document is urged to base investment decisions upon suchinvestigations as they deem necessary.
In the UK, this report is directed at and is for distribution only to (I) persons who have professional experience in matters relating toinvestments falling within Article 19(5) of the Financial Services and Markets Act 2000 (Financial Promotion) Order 2005 (The‘‘Order’’) or (II) high net worth entities falling within Article 49(2)(a) to (d) of the Order (all such persons together being referred to as‘‘relevant persons’’. This report must not be acted on or relied upon by persons in the UKwho are not relevant persons. In the US, thisreport is distributed solely to persons who qualify as ‘‘major U.S. institutional investors’’ as defined in Rule 15a-6 under the SecuritiesExchange Act. U.S. persons wishing to effect transactions in any security discussed herein should do so by contacting SEBEI.
The distribution of this document may be restricted in certain jurisdictions by law, and persons into whose possession this documentscomes should inform themselves about, and observe, any such restrictions.
This document is confidential to the recipient, any dissemination, distribution, copying, or other use of this communication is strictlyprohibited.
Skandinaviska Enskilda Banken AB (publ) is incorporated in Sweden, as a Limited Liability Company. It is regulated byFinansinspektionen, and by the local financial regulators in each of the jurisdictions in which it has branches or subsidiaries, including inthe UK, by the Financial Services Authority; Denmark by Finanstilsynet; Finland by Finanssivalvonta; and Germany by Bundesanstaltfür Finanzdienstleistungsaufsicht. In Norway, SEB Enskilda AS (‘ESO’) is regulated by Finanstilsynet. In the US, SEB Securities Inc(‘SEBEI’) is a U.S. broker-dealer, registered with the Financial Industry Regulatory Authority (FINRA). SEBEI and ESO are directsubsidiaries of SEB.

SEGR01412018.05
SEB is a leading Nordic financial services group with a strong beliefthat entrepreneurial minds and innovative companies are key in creat-ing a better world. SEB takes a long term perspective and supports itscustomers in good times and bad. In Sweden and the Baltic countries,SEB offers financial advice and a wide range of financial services. InDenmark, Finland, Norway, Germany and the United Kingdom, thebank’s operations have a strong focus on corporate and investmentbanking based on a full-service offering to corporate and institutionalclients. The international nature of SEB’s business is reflected in itspresence in some 20 countries worldwide. At 31March 2018, theGroup’s total assets amounted to SEK 2,903bn while its assets undermanagement totalled SEK 1,854bn. The Group has around 15,000employees..
With capital knowledge and experience, we generate value for ourcustomers – a tast in which our research activities are highly benefi-cial.
Macroeconomic assessments are provided by our SEB Research &Strategy unit. Based on current conditions, official policies and thelong-term performance of financial market, the Bank presents itsviews on the economic situation – locally, regionally and globally.
One of the key publications from the SEB Research & Strategy unit isthe quarterly Nordic Outlook, which presents anlyses covering theeconomic situation in the world as well as Europe and Sweden.
Readmore about SEB at www.sebgroup.com