secarb phase iii cranfield project (early test) · pdf file ·...
TRANSCRIPT
SECARB Phase III Cranfield Project (Early Test)
Gulf Coast Carbon Center Bureau of Economic Geology,
The University of Texas at Austin
Presented by Katherine Romanak March 8, 2018 Atlanta Georgia
Susan Hovorka, Principle Investigator

Early Test at Cranfield
• One of the earlier storage projects to lead off RCSP effort • Data collection and characterization began in 2008 • 25 institutions collaborating • As of April 2015, project metrics and field activities completed • Current focus making Cranfield project knowledge…
• Commercial via engagement in other projects. • Impactful through developing major conceptual advances • Practical through knowledge sharing
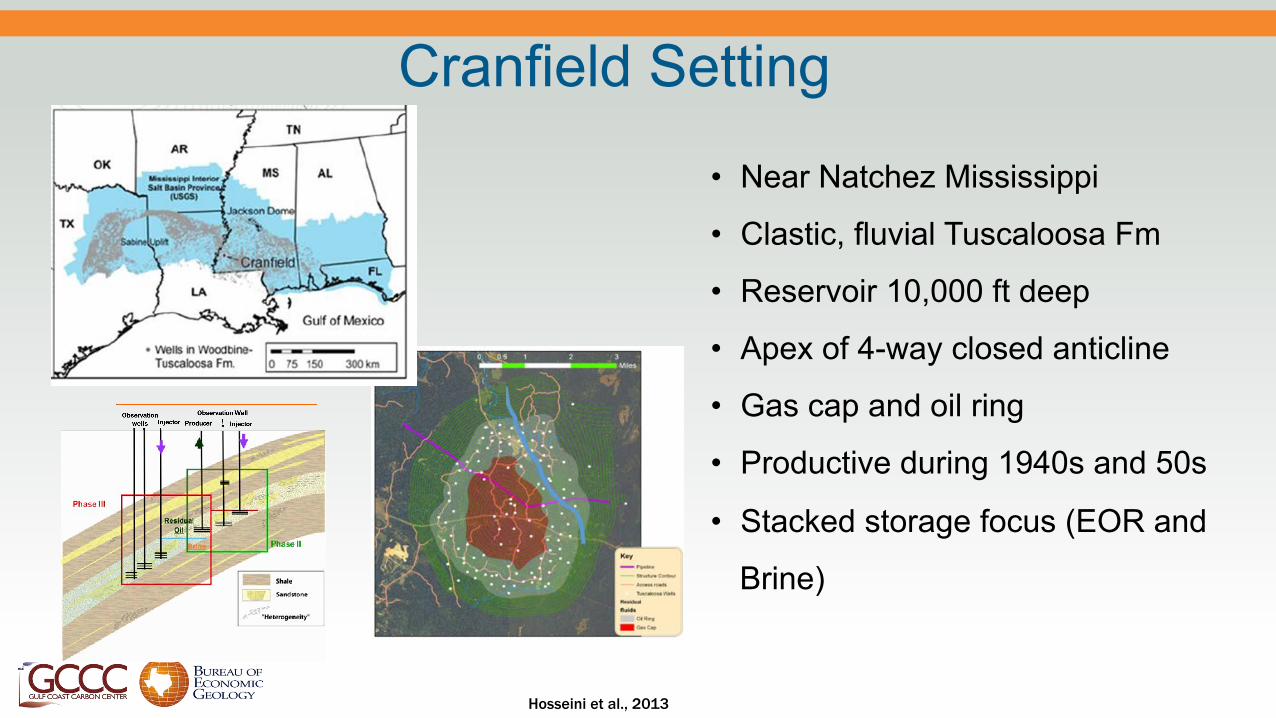
• Near Natchez Mississippi
• Clastic, fluvial Tuscaloosa Fm
• Reservoir 10,000 ft deep
• Apex of 4-way closed anticline
• Gas cap and oil ring
• Productive during 1940s and 50s
• Stacked storage focus (EOR and
Brine)
Hosseini et al., 2013
Cranfield Setting
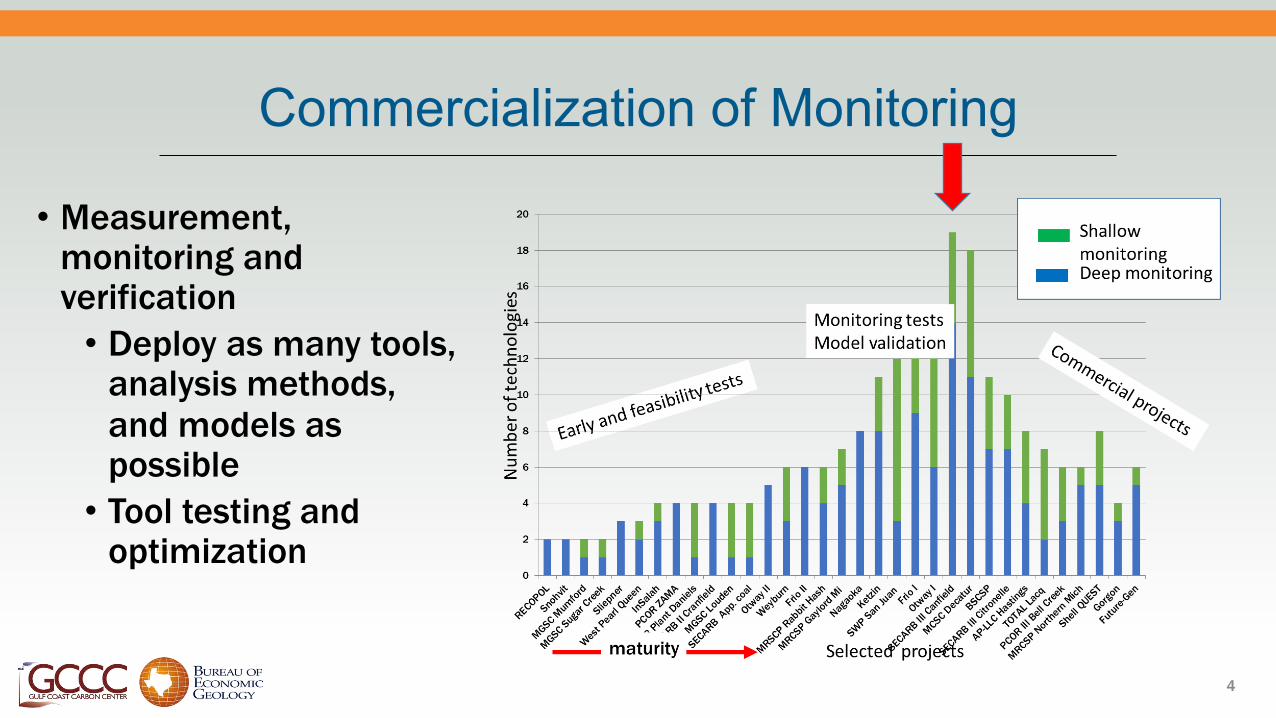
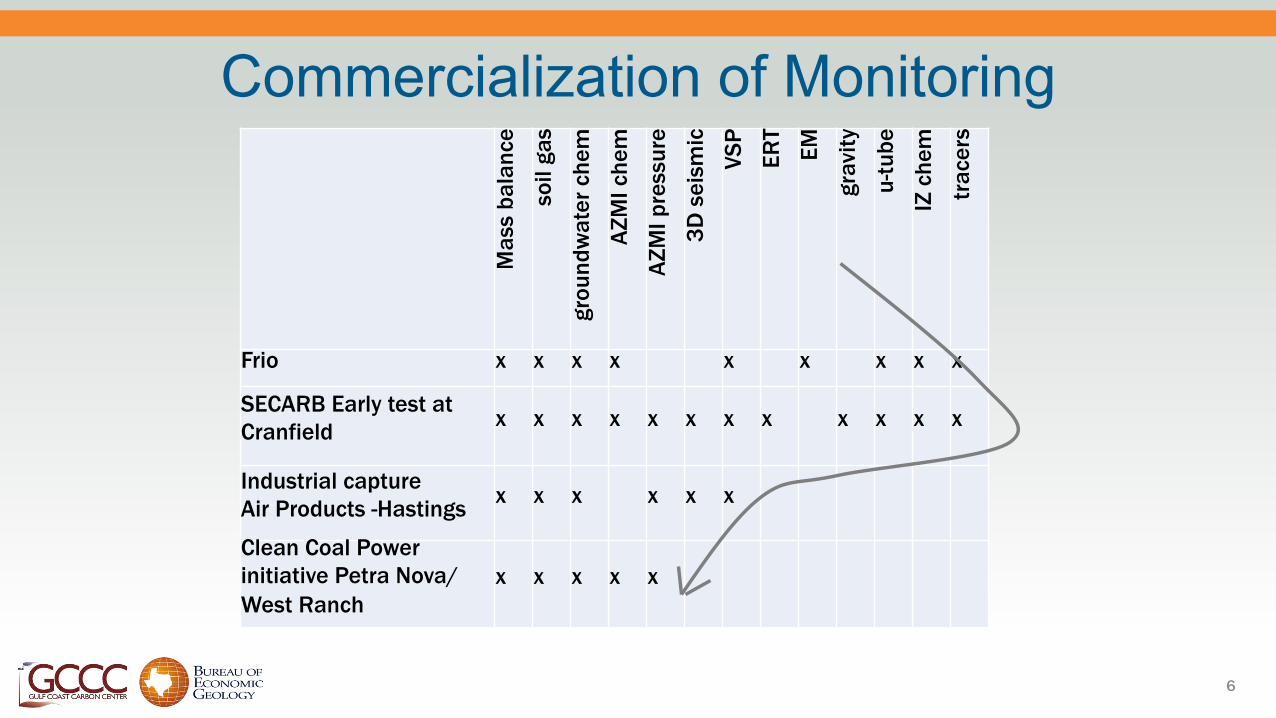
Commercialization of Monitoring
• Measurement, monitoring and verification
• Deploy as many tools, analysis methods, and models as possible
• Tool testing and optimization
4
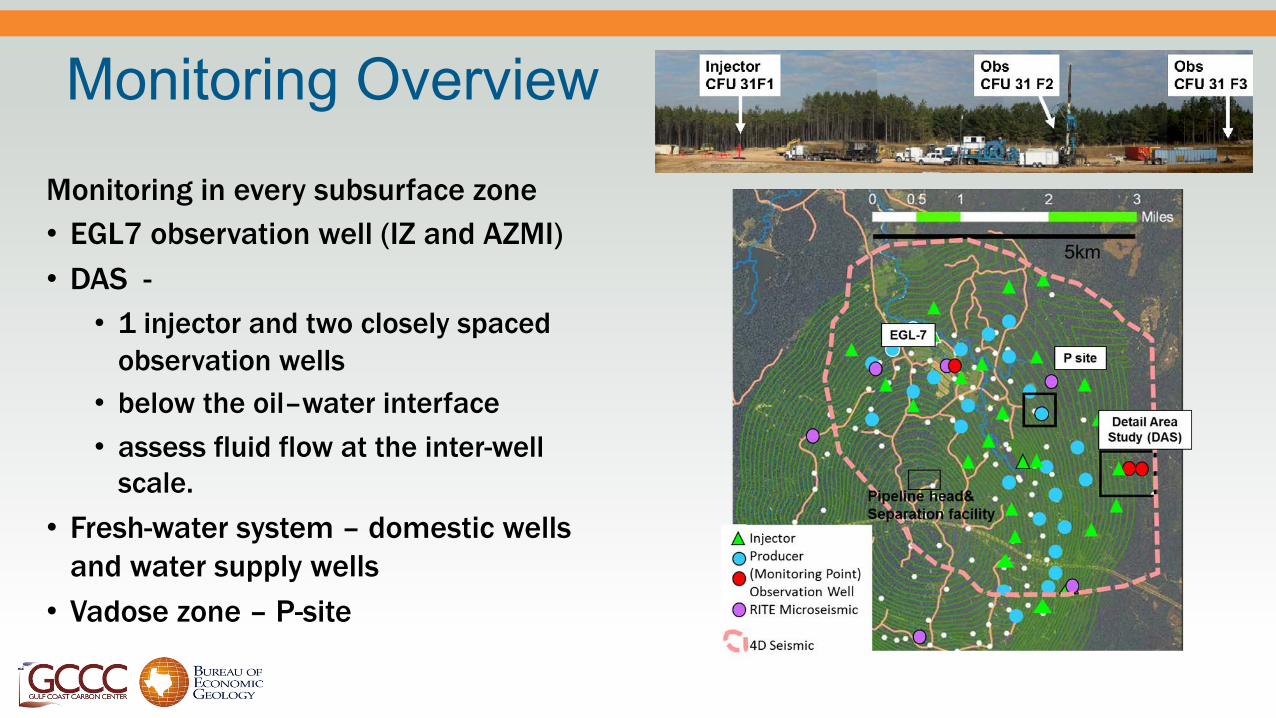
Monitoring Overview
Monitoring in every subsurface zone • EGL7 observation well (IZ and AZMI) • DAS -
• 1 injector and two closely spaced observation wells
• below the oil–water interface • assess fluid flow at the inter-well
scale. • Fresh-water system – domestic wells
and water supply wells • Vadose zone – P-site
Commercialization of Monitoring
6
Mas
s ba
lanc
e
soil
gas
grou
ndw
ater
che
m
AZM
I che
m
AZM
I pre
ssur
e
3D s
eism
ic
VSP
ERT
EM
grav
ity
u-tu
be
IZ c
hem
trac
ers
Frio x x x x x x x x x
SECARB Early test at Cranfield x x x x x x x x x x x x
Industrial capture Air Products -Hastings x x x x x x
Clean Coal Power initiative Petra Nova/ West Ranch
x x x x x
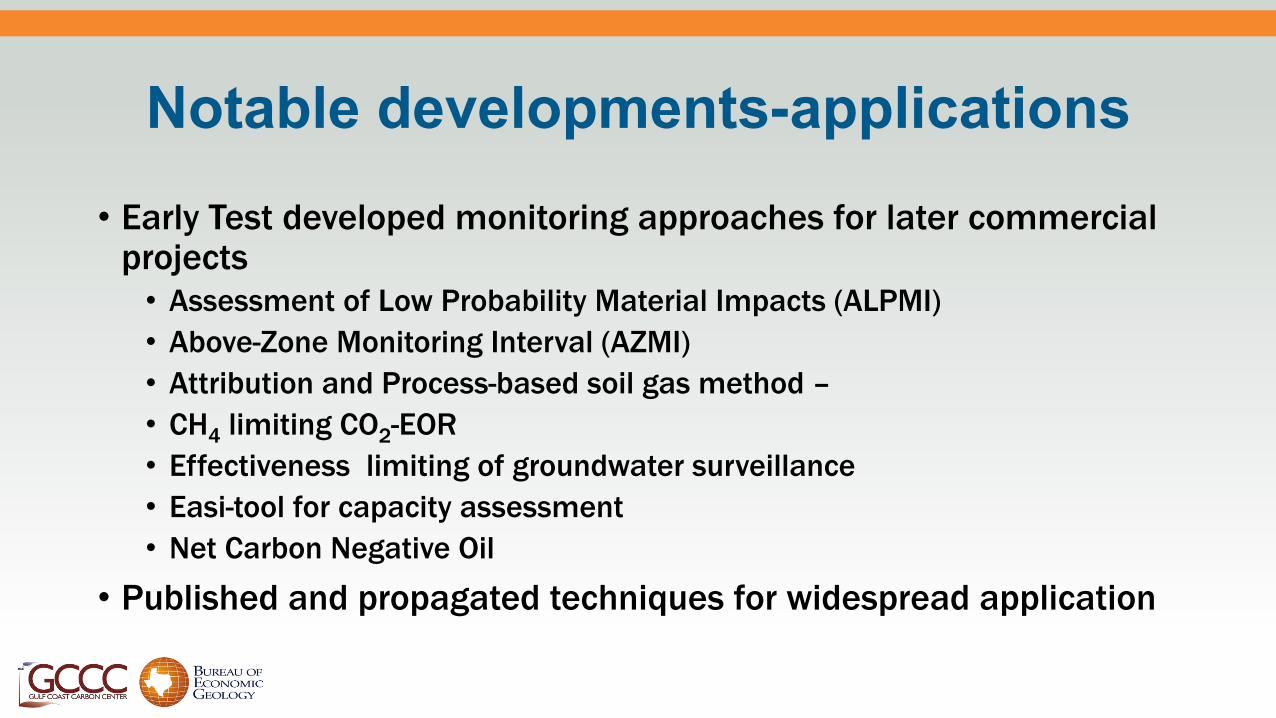
Notable developments-applications
• Early Test developed monitoring approaches for later commercial projects
• Assessment of Low Probability Material Impacts (ALPMI) • Above-Zone Monitoring Interval (AZMI) • Attribution and Process-based soil gas method – • CH4 limiting CO2-EOR • Effectiveness limiting of groundwater surveillance • Easi-tool for capacity assessment • Net Carbon Negative Oil
• Published and propagated techniques for widespread application
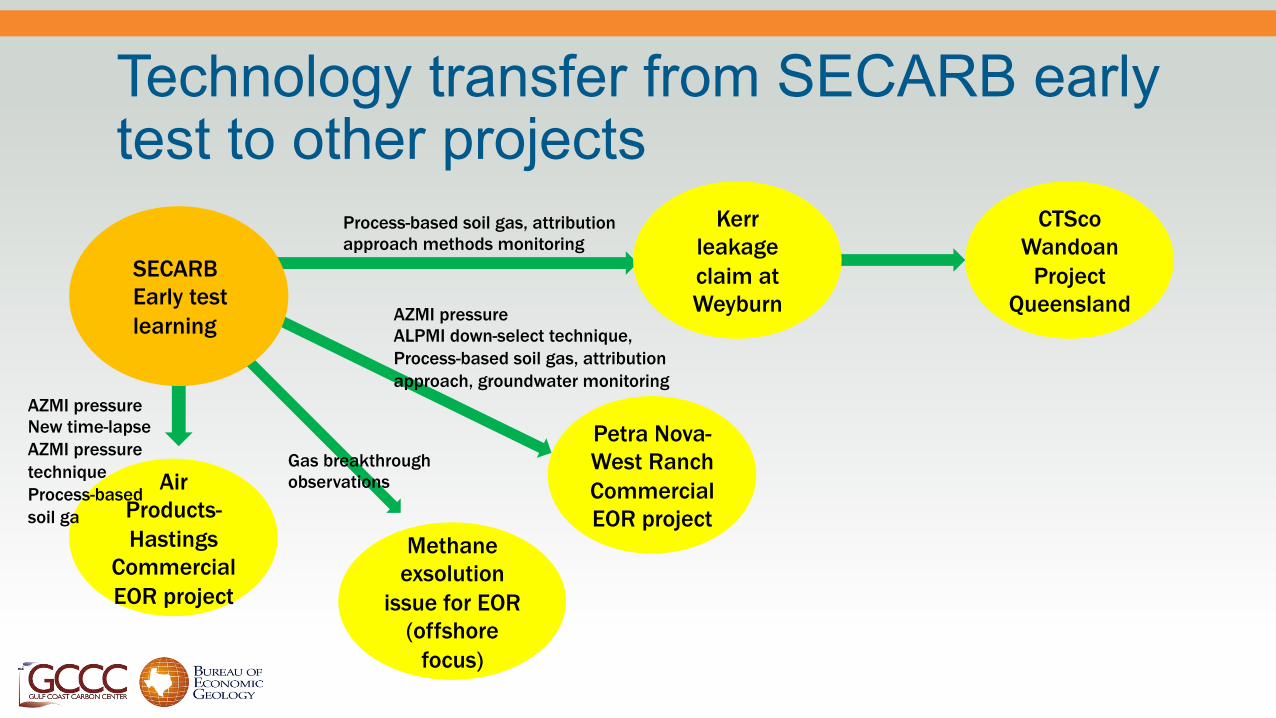
Technology transfer from SECARB early test to other projects
SECARB Early test learning
Air Products- Hastings
Commercial EOR project
AZMI pressure New time-lapse AZMI pressure technique Process-based soil ga
Petra Nova- West Ranch Commercial EOR project
AZMI pressure ALPMI down-select technique, Process-based soil gas, attribution approach, groundwater monitoring
CTSco Wandoan
Project Queensland
Methane exsolution
issue for EOR (offshore
focus)
Gas breakthrough observations
Process-based soil gas, attribution approach methods monitoring
Kerr leakage claim at Weyburn
ALPMI - Assessment of Low-Probability
Material Impacts
Susan Hovorka

Engineers
Experts
Linking risk assessment with monitoring
Process of designing and selecting monitoring can be complex, conducted without documented process, non-linear and therefore difficult to
duplicate or justify
Regulators
Select monitoring systems
Chadwick BGS
Onuma and Ohkawa, 2009 Romanak
Risk Assessment method
K-12 B (CO2CARE)
Bow Tie
Process is cloudy or obscured
ALPMI method
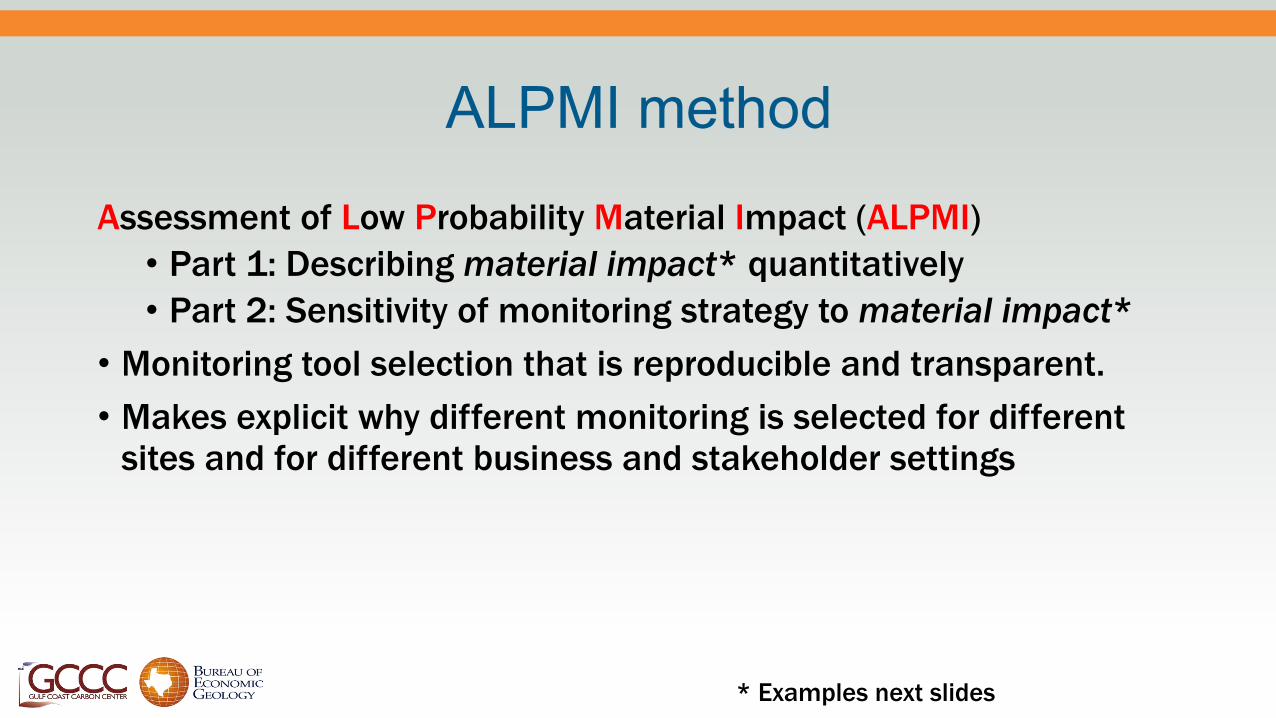
Assessment of Low Probability Material Impact (ALPMI) • Part 1: Describing material impact* quantitatively • Part 2: Sensitivity of monitoring strategy to material impact*
• Monitoring tool selection that is reproducible and transparent. • Makes explicit why different monitoring is selected for different
sites and for different business and stakeholder settings
* Examples next slides

ALPMI Workflow Risk assessment method
as usual
Quantify risks to define material impact
Model material impact scenarios
Identify signals in the earth system that indicate or preferably precede material impact
Select monitoring tools that can detect these signals at required sensitivity
Deploy tools, collect and analyze data
Report if material impact did/did not occur
Specify magnitude, duration, location, rate of material impact
• Avoid subjective terms like safe and effective. • E.g. : Specify mass of leakage at identified horizon or
magnitude of seismicity. • Specify certainty with which assurance is needed
Explicitly model unacceptable outcomes showing leakage cases.
ALPMI uses models differently than the typical history matching the expected performance
This method down selects to consider only signals that may
indicate material impact is occurring or may occur.
Approaches like those normally seismic survey design should be deployed for all modeling tools
Forward modeling tool response is essential to developing the expected negative finding: “No material impact was detected by a system that could detect this impact.”
Only via this ALPMI process can a finding that the material
impact did not occur be robustly documented
This activity as traditionally conducted. Include all the expected components, such as
attribution, updating as needed, feedback , etc.
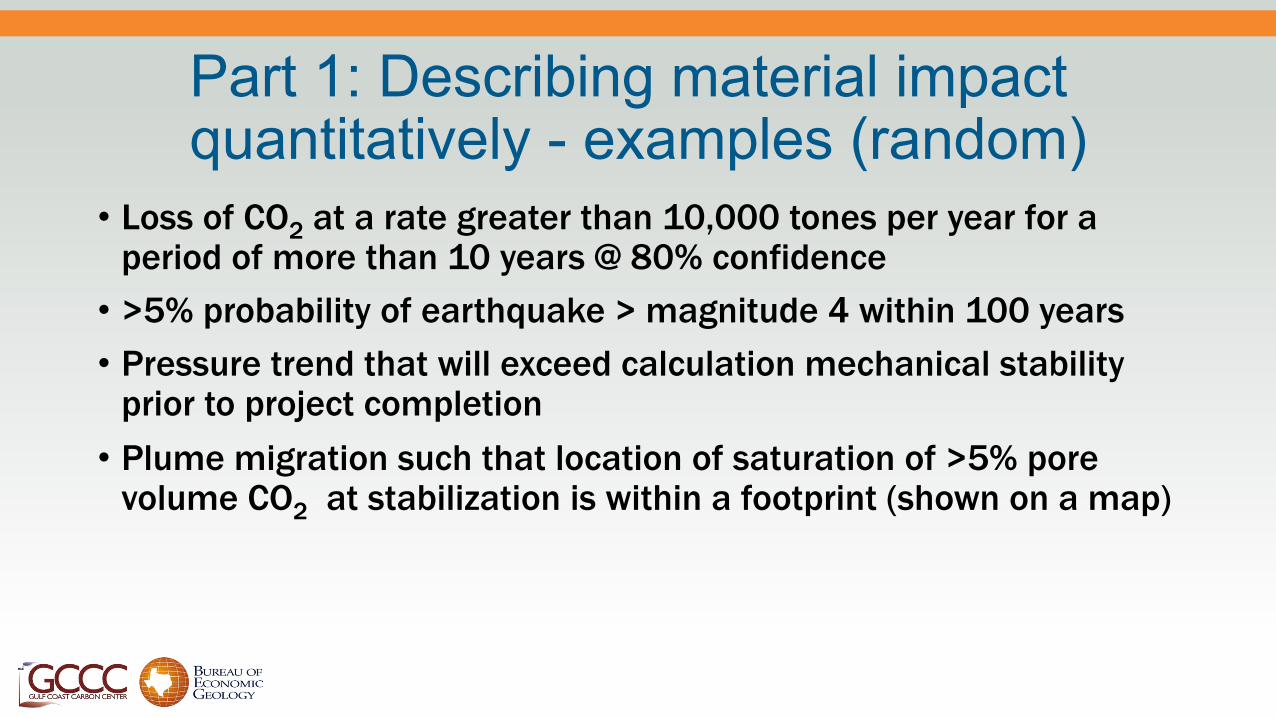
Part 1: Describing material impact quantitatively - examples (random)
• Loss of CO2 at a rate greater than 10,000 tones per year for a period of more than 10 years @ 80% confidence
• >5% probability of earthquake > magnitude 4 within 100 years • Pressure trend that will exceed calculation mechanical stability
prior to project completion • Plume migration such that location of saturation of >5% pore
volume CO2 at stabilization is within a footprint (shown on a map)
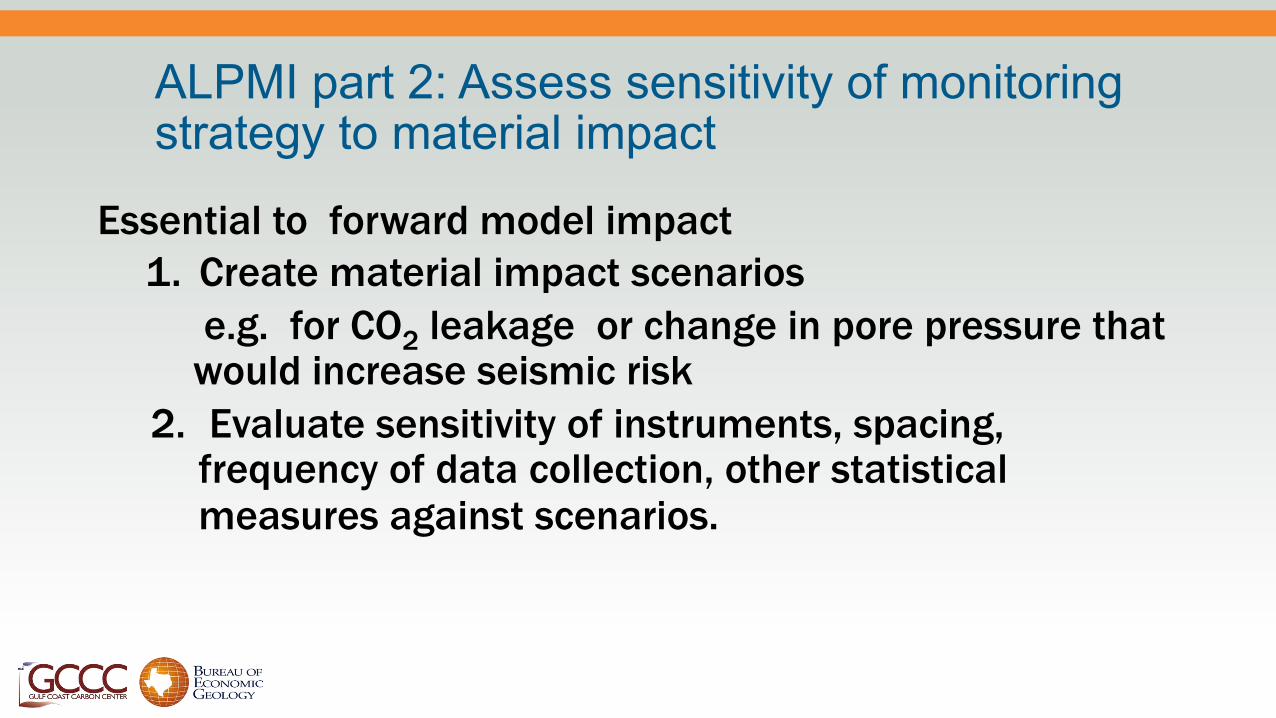
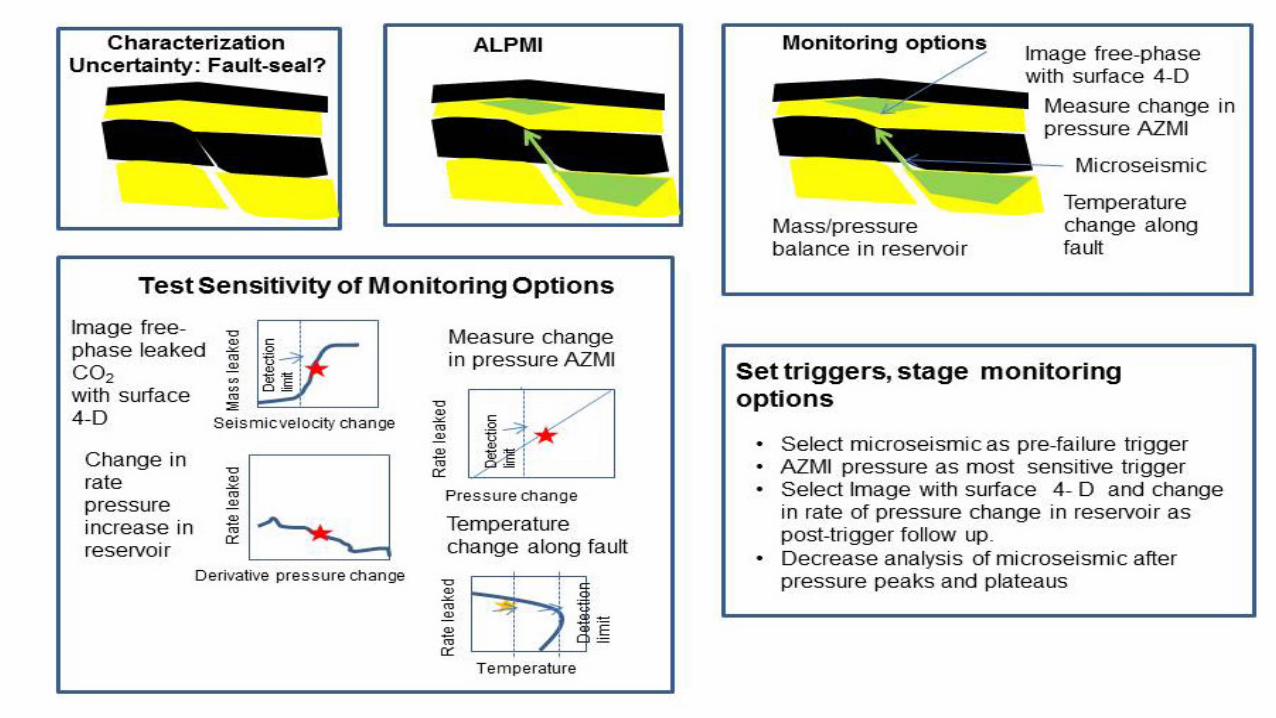
ALPMI part 2: Assess sensitivity of monitoring strategy to material impact
Essential to forward model impact 1. Create material impact scenarios
e.g. for CO2 leakage or change in pore pressure that would increase seismic risk
2. Evaluate sensitivity of instruments, spacing, frequency of data collection, other statistical measures against scenarios.
Above-Zone Monitoring Interval (AZMI)
Susan Hovorka, Tip Meckel, Behni Bllhassani, Seyyed Hosseini
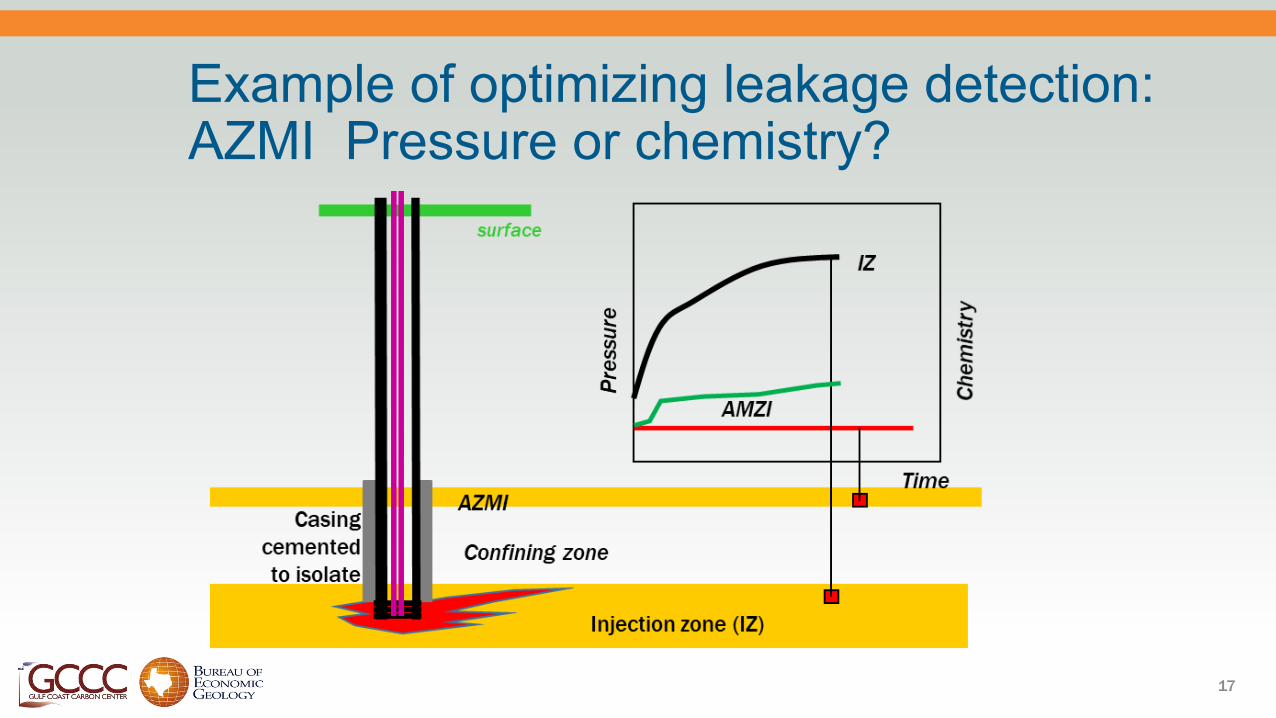
Example of optimizing leakage detection: AZMI Pressure or chemistry?
17

Simple model of leakage response: Input parameters - CMG
18
Pressure-based
Model Parameter
Value Unit
Permeability 9.87e-13 (m2)
Porosity of monitoring reservoir 0.25 -
Leakage rate at reservoir condition 0.0001 (m3/s)
Total compressibility 1E-9 (Pa-1)
Temperature 47.78 °C
Pressure 9,652,660 (Pa)
Thickness of monitoring reservoir 25 (m)
Monitoring detection time 365 (day)
Radius of leaky well 0.05 (m)
Viscosity 0.000578 (Pa.s)
CO2 viscosity 0.0000302 (Pa.s)
CO2 density 401 (kg/m3)
Pressure gauge detection threshold 10000 (Pa)
Geochemical-
based Model
Parameter
Value Unit
Dispersion coefficient 400 dm
Hydraulic gradient 0.05 -
Cpi1 (CO2 initial concentration) 0.71552e-3 mol/day
Cpi2 (H+ initial concentration) 0.61843e-7 mol/day
Cpi3 (HCOE- initial concentration) 0.47522e-2 mol/day
Cpi4 (CO3-2 initial concentration) 0.30728e-5 mol/day
Cpi5 (OH- initial concentration) 0.15091e-6 mol/day
Cpi6 (Ca+2 initial concentration) 0.77923e-3 mol/day
Leakage detection limit 10*cpi mol/day
Behni Bollhassani, UT MS thesis
User defined parameters
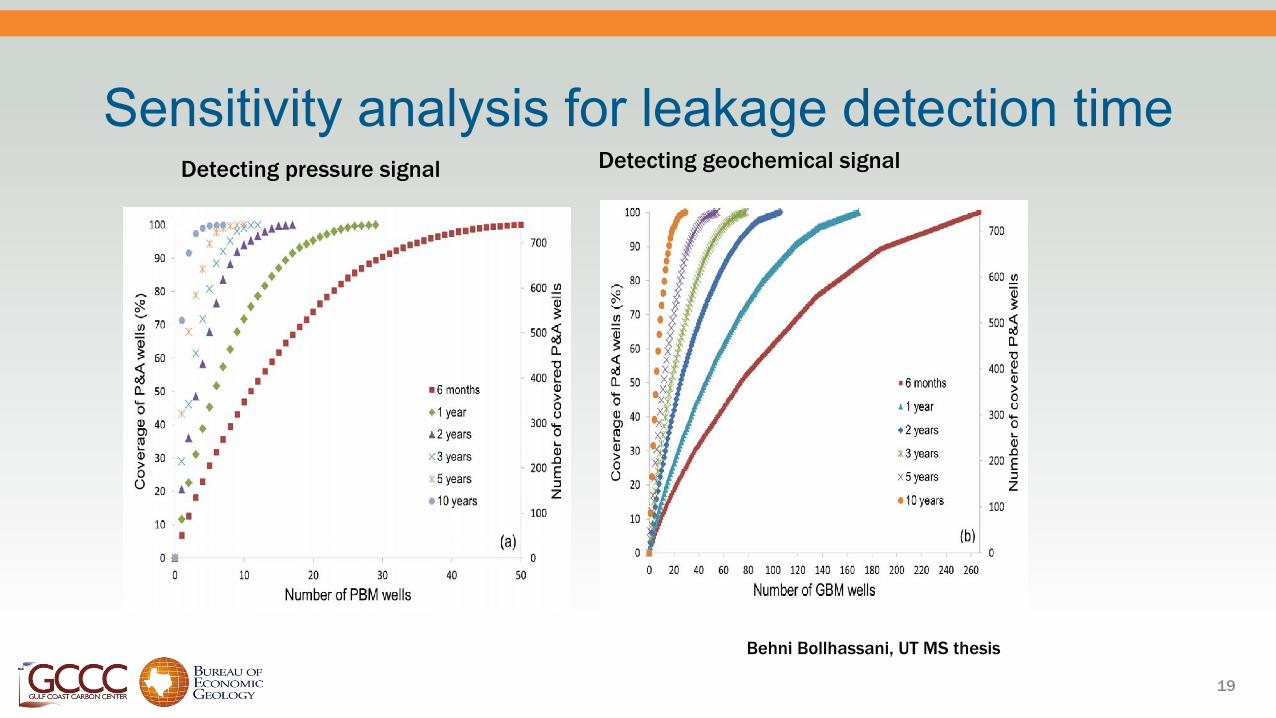
Sensitivity analysis for leakage detection time
19
Detecting pressure signal Detecting geochemical signal
Behni Bollhassani, UT MS thesis

2. Process-based soil gas method and the importance of attribution
Katherine Romanak, Changbing Yang, Jacob Anderson
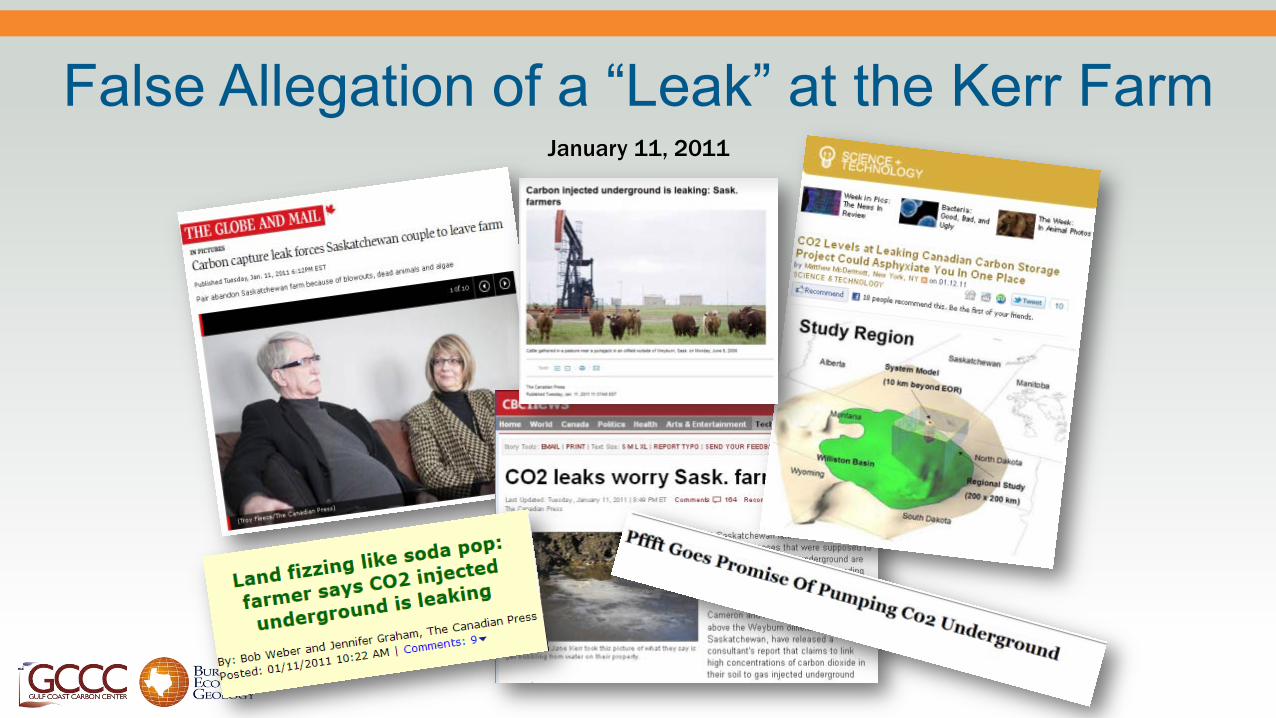
False Allegation of a “Leak” at the Kerr Farm January 11, 2011
Attribution of Near-surface Anomalies
Attribution is: • Response to an incident or an allegation (and how to tell the
difference) • Essential to plan in advance to avoid damage to project reputation • Should be accurate AND stakeholder-friendly • Is required BEFORE corrective action, mitigation, remediation, and
quantification (if needed) • Difficult (as shown by experience)

Source Attribution is Critical
23
Dixon and Romanak, 2015, Improving monitoring protocols for CO2 geological storage with technical advances in CO2 attribution monitoring, IJGGC vol 41
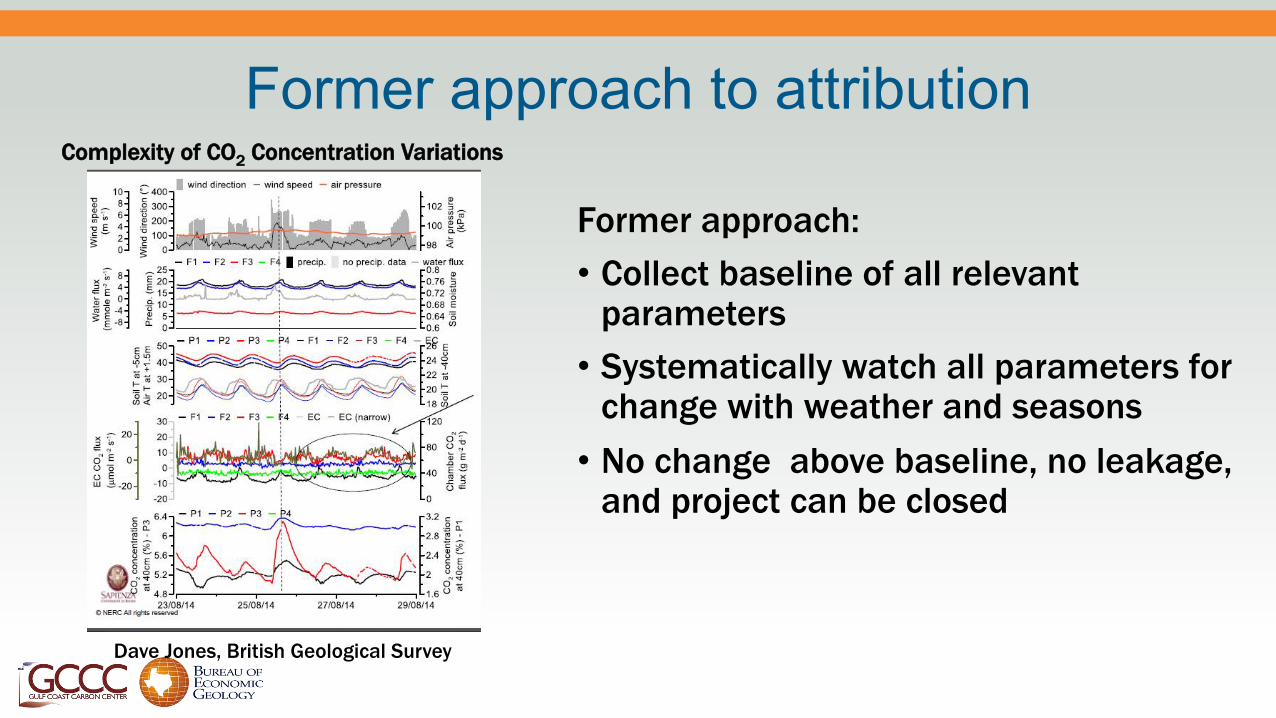
Former approach to attribution
Former approach: • Collect baseline of all relevant
parameters • Systematically watch all parameters for
change with weather and seasons • No change above baseline, no leakage,
and project can be closed
Dave Jones, British Geological Survey
Complexity of CO2 Concentration Variations

Many troubles with change from baseline approach • Ambient temporal and spatial variably is
high • False positives
• Parameters are naturally dynamic • Land use, climate, environmental improvement
• High cost to explain all the changes that occur
• Too complex for stakeholder engagement • Difficult to pre-define trigger points • Risk to project financially and in terms of
public acceptance of expecting no change
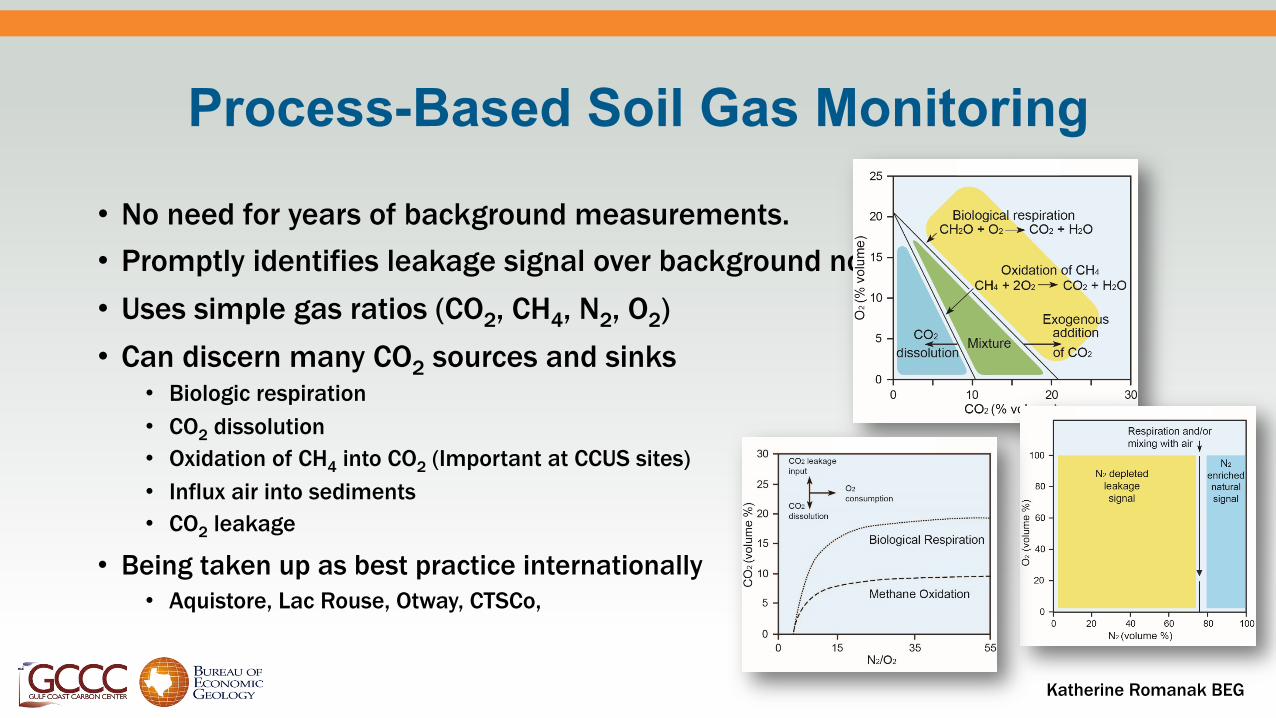
Process-Based Soil Gas Monitoring
• No need for years of background measurements. • Promptly identifies leakage signal over background noise. • Uses simple gas ratios (CO2, CH4, N2, O2) • Can discern many CO2 sources and sinks
• Biologic respiration • CO2 dissolution • Oxidation of CH4 into CO2 (Important at CCUS sites) • Influx air into sediments • CO2 leakage
• Being taken up as best practice internationally • Aquistore, Lac Rouse, Otway, CTSCo,
Katherine Romanak BEG
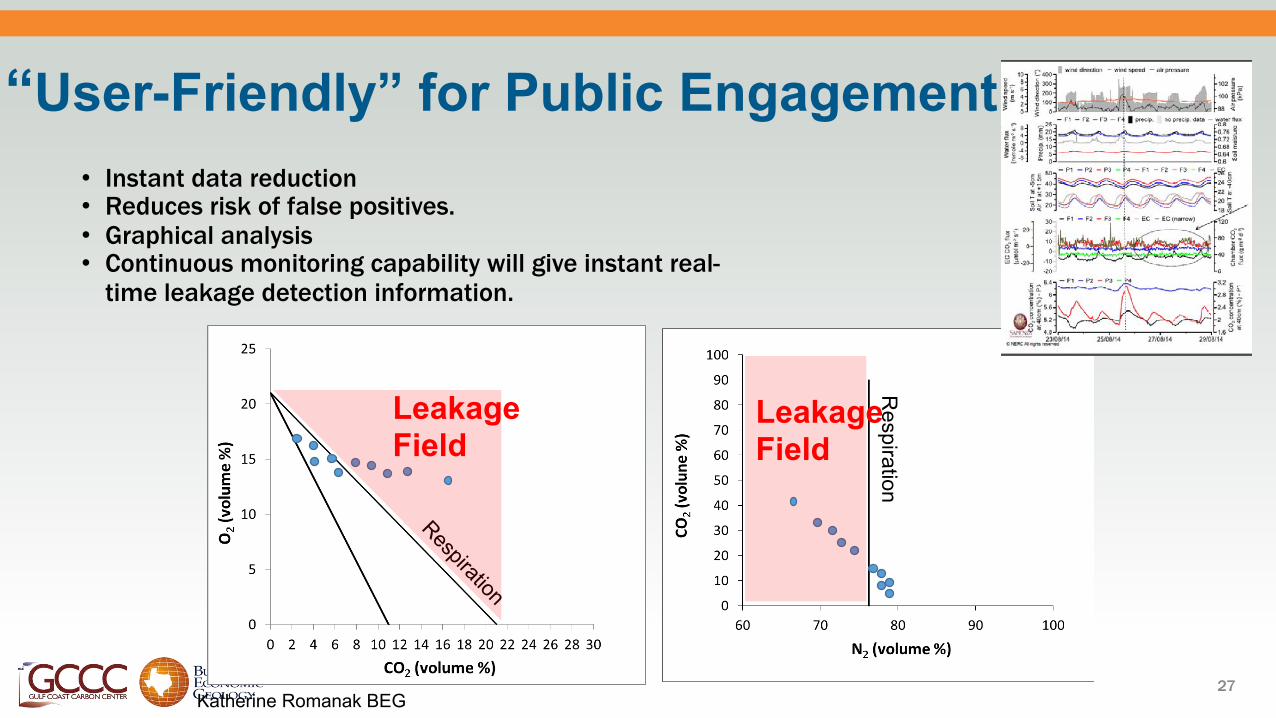
“User-Friendly” for Public Engagement • Instant data reduction • Reduces risk of false positives. • Graphical analysis • Continuous monitoring capability will give instant real-
time leakage detection information.
27
Respiration
Leakage Field
Leakage Field
Katherine Romanak BEG
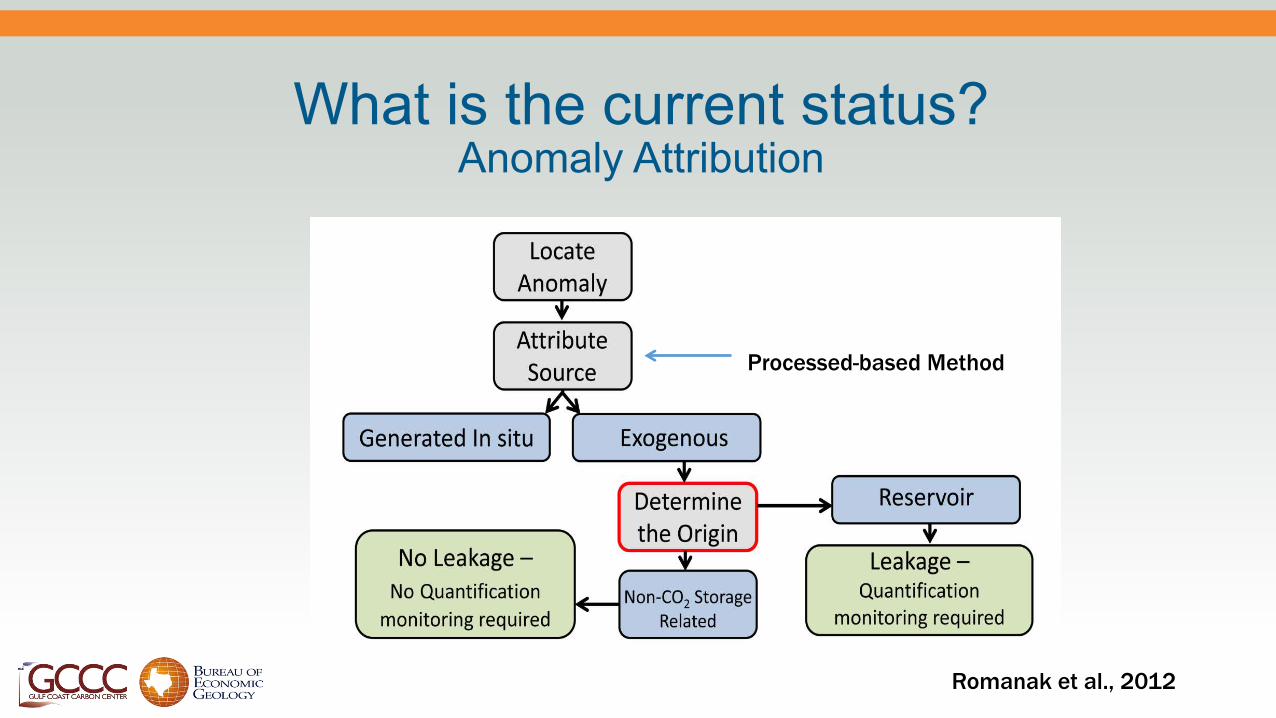
What is the current status? Anomaly Attribution
Processed-based Method
Romanak et al., 2012
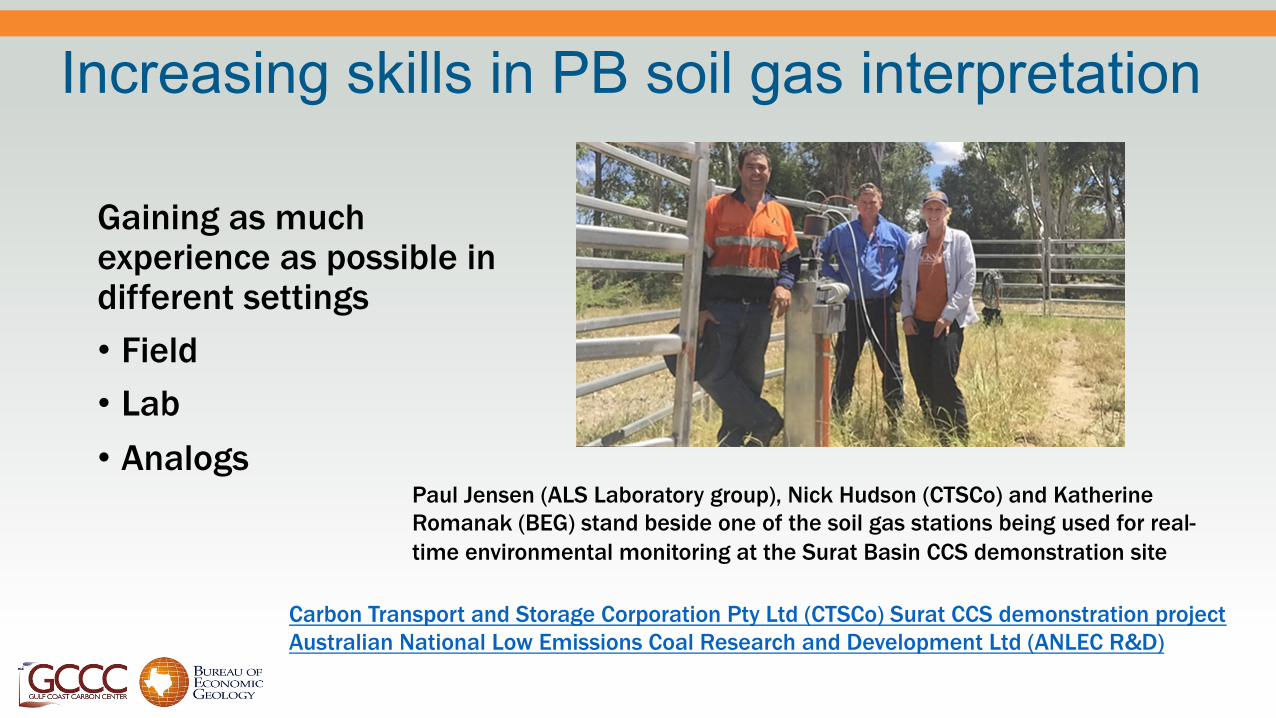
Increasing skills in PB soil gas interpretation
Gaining as much experience as possible in different settings • Field • Lab • Analogs
Paul Jensen (ALS Laboratory group), Nick Hudson (CTSCo) and Katherine Romanak (BEG) stand beside one of the soil gas stations being used for real-time environmental monitoring at the Surat Basin CCS demonstration site
Carbon Transport and Storage Corporation Pty Ltd (CTSCo) Surat CCS demonstration project Australian National Low Emissions Coal Research and Development Ltd (ANLEC R&D)

Lab work on recognizing CO2 leaked from depth in near surface settings
• To define and quantify changes to soil gas ratios under varying conditions
• Expand the process-based matrix to additional processes
• Develop best practice for anomaly attribution
Closed/Open Anaerobic/Aerobic
Katherine Romanak and students
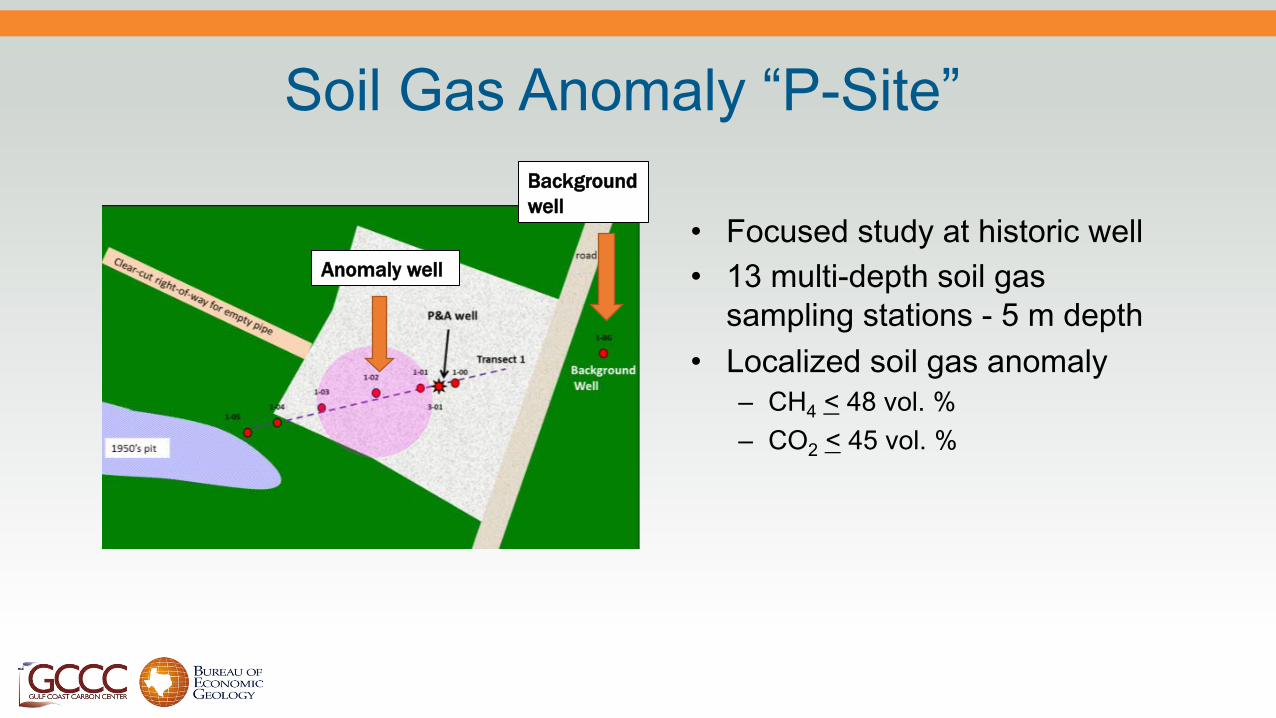
Soil Gas Anomaly “P-Site”
• Focused study at historic well • 13 multi-depth soil gas
sampling stations - 5 m depth • Localized soil gas anomaly
– CH4 < 48 vol. % – CO2 < 45 vol. %
Background well
Anomaly well
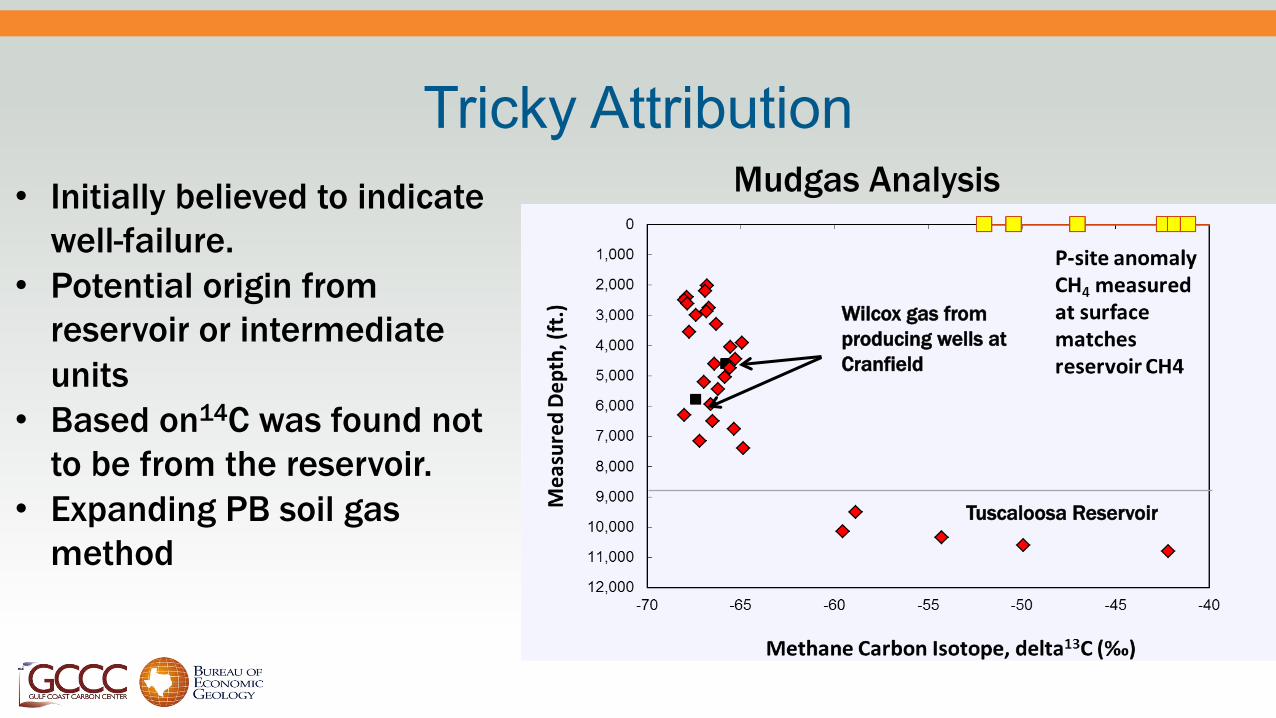
Mudgas Analysis
Tuscaloosa Reservoir
Wilcox gas from producing wells at Cranfield
• Initially believed to indicate well-failure.
• Potential origin from reservoir or intermediate units
• Based on14C was found not to be from the reservoir.
• Expanding PB soil gas method
Tricky Attribution
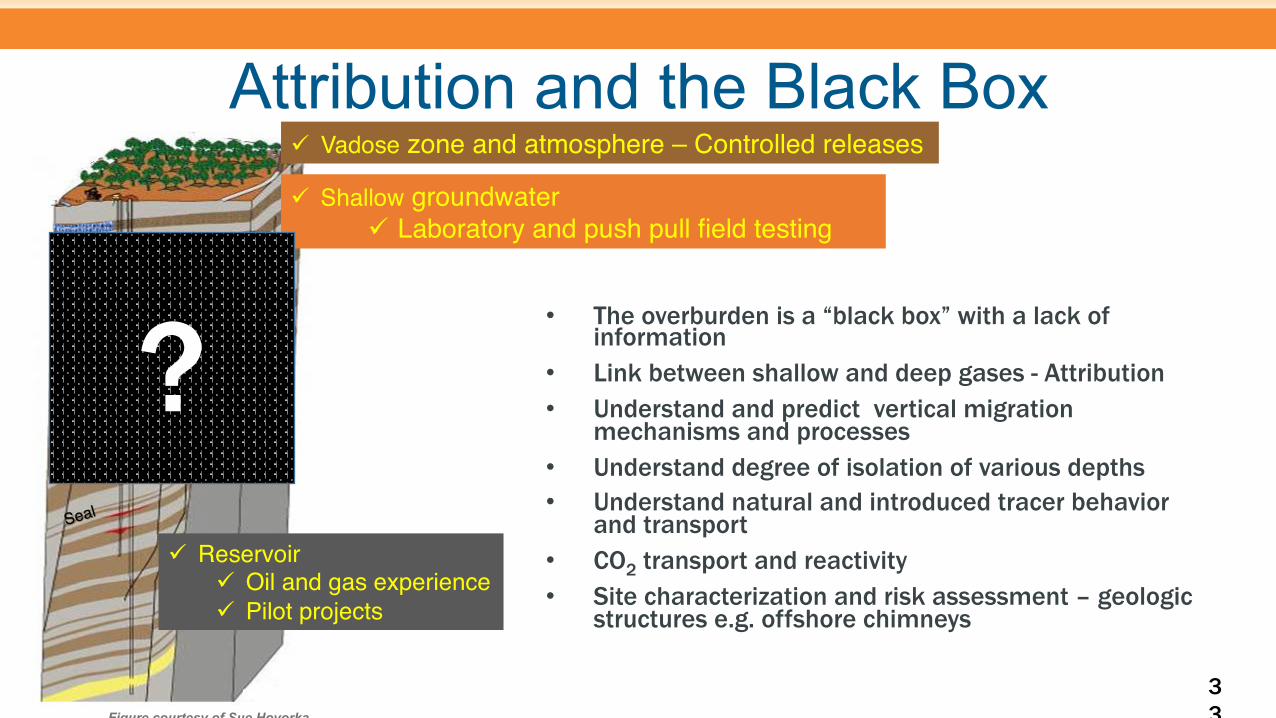
Attribution and the Black Box
• The overburden is a “black box” with a lack of information
• Link between shallow and deep gases - Attribution • Understand and predict vertical migration
mechanisms and processes • Understand degree of isolation of various depths • Understand natural and introduced tracer behavior
and transport • CO2 transport and reactivity • Site characterization and risk assessment – geologic
structures e.g. offshore chimneys
33
Seal
ü Reservoirü Oil and gas experienceü Pilot projects
ü Shallow groundwaterü Laboratory and push pull field testing
ü Vadose zone and atmosphere – Controlled releases
?
Figure courtesy of Sue Hovorka

What’s the Problem?
Geochemistry of Anomalies
Geochemical Changes during
Migration

Site 1 Site 2 Site 3 Site 4
Hydrocarbon Systems as an Analog

Forward Model CO2
Effectiveness of groundwater surveillance
Changbing Yang

C. Yang, BEG
Groundwater Sampling at the Cranfield Site
§ More than 12 field campaigns
§ 130 groundwater samples collected for chemical analysis
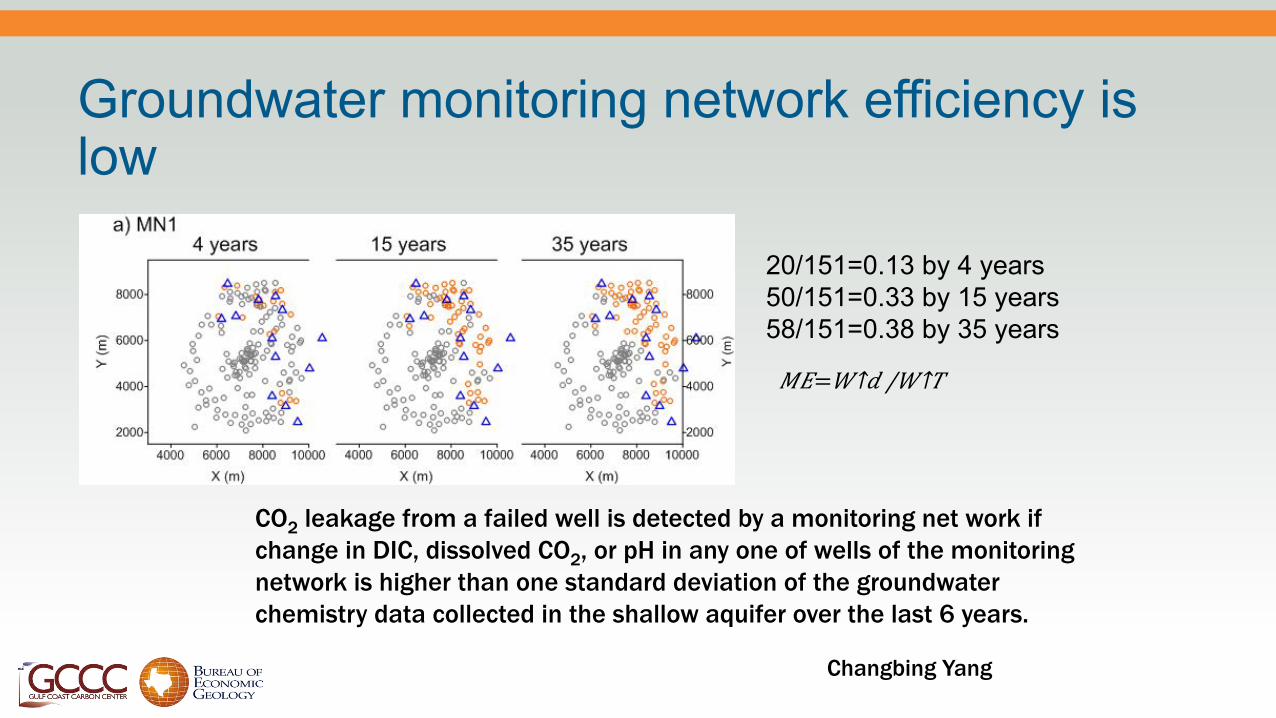
20/151=0.13 by 4 years 50/151=0.33 by 15 years 58/151=0.38 by 35 years
𝑀𝐸= 𝑊↑𝑑 /𝑊↑𝑇
CO2 leakage from a failed well is detected by a monitoring net work if change in DIC, dissolved CO2, or pH in any one of wells of the monitoring network is higher than one standard deviation of the groundwater chemistry data collected in the shallow aquifer over the last 6 years.
Groundwater monitoring network efficiency is low
Changbing Yang

Monitoring efficiency of MN7 with dissolved CO2 as an indicator
Regional hydraulic gradient J2: 0.5% , J3: 0.8% J4: 1.0%
Leakage rate: metric ton/yr LR1: 0.94, LR2: 6.28 LR3: 25.1, LR4: 37.7 LR5: 50.3, LR6: 100
Groundwater monitoring network efficiency is low
Changbing Yang
Enhanced Analytical Simulation Tool (EASiTool)
Dynamic Capacity Estimation
Seyyed A. Hosseini, Reza Ganjdanesh, Seunghee Kim, Ali Goudarzi Tip Meckel, Luca Trevisan, Prasanna Krishnamurthy, Emily Beckham
Alex Sun, Akand Islam, Hoonyoung Jeong
41

EASiTool version 4.0
42
Enhanced Analytical Simulation Tool (EASiTool) • A new scientific and user-friendly CO2
storage capacity estimation tool • Estimate CO2 storage capacity in saline
aquifers limited by pressure buildup. • Estimate maximum injection pressure for
a given formation. • Incorporate brine extraction into storage
capacity estimation. • Provide sensitivity analysis for input
parameters.
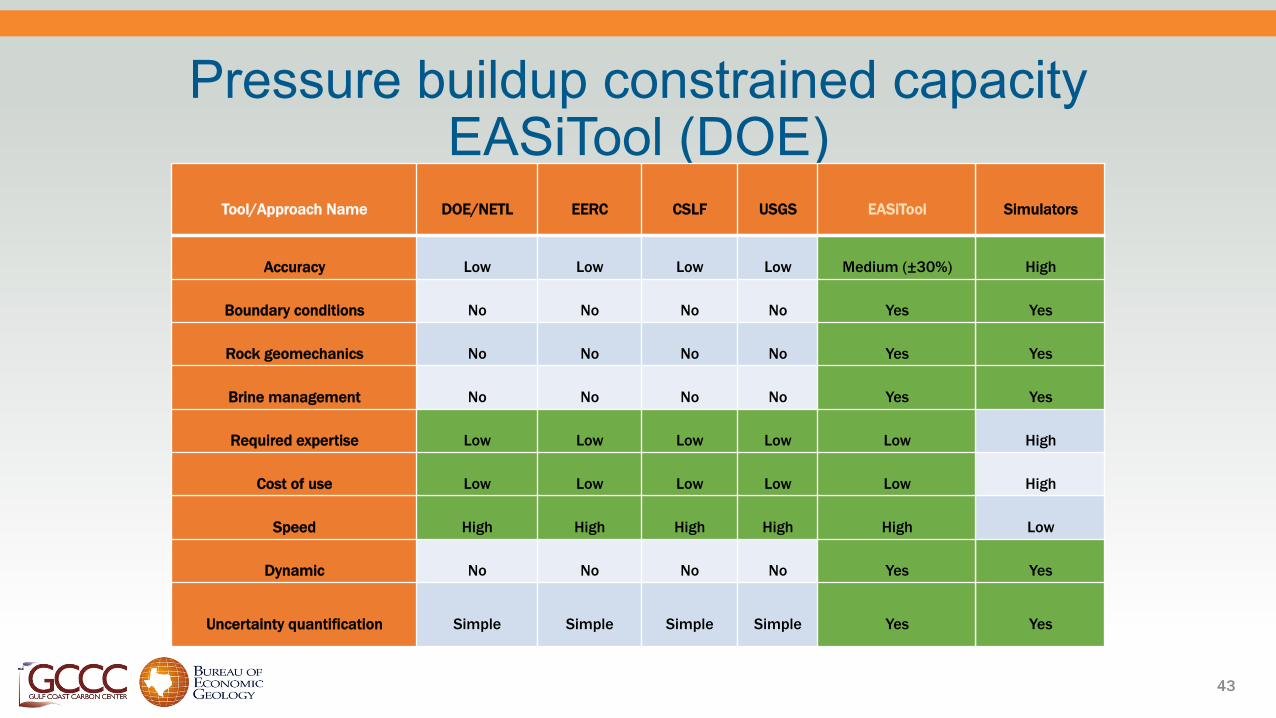
Pressure buildup constrained capacity EASiTool (DOE)
Tool/Approach Name DOE/NETL EERC CSLF USGS EASiTool Simulators
Accuracy Low Low Low Low Medium (±30%) High
Boundary conditions No No No No Yes Yes
Rock geomechanics No No No No Yes Yes
Brine management No No No No Yes Yes
Required expertise Low Low Low Low Low High
Cost of use Low Low Low Low Low High
Speed High High High High High Low
Dynamic No No No No Yes Yes
Uncertainty quantification Simple Simple Simple Simple Yes Yes
43
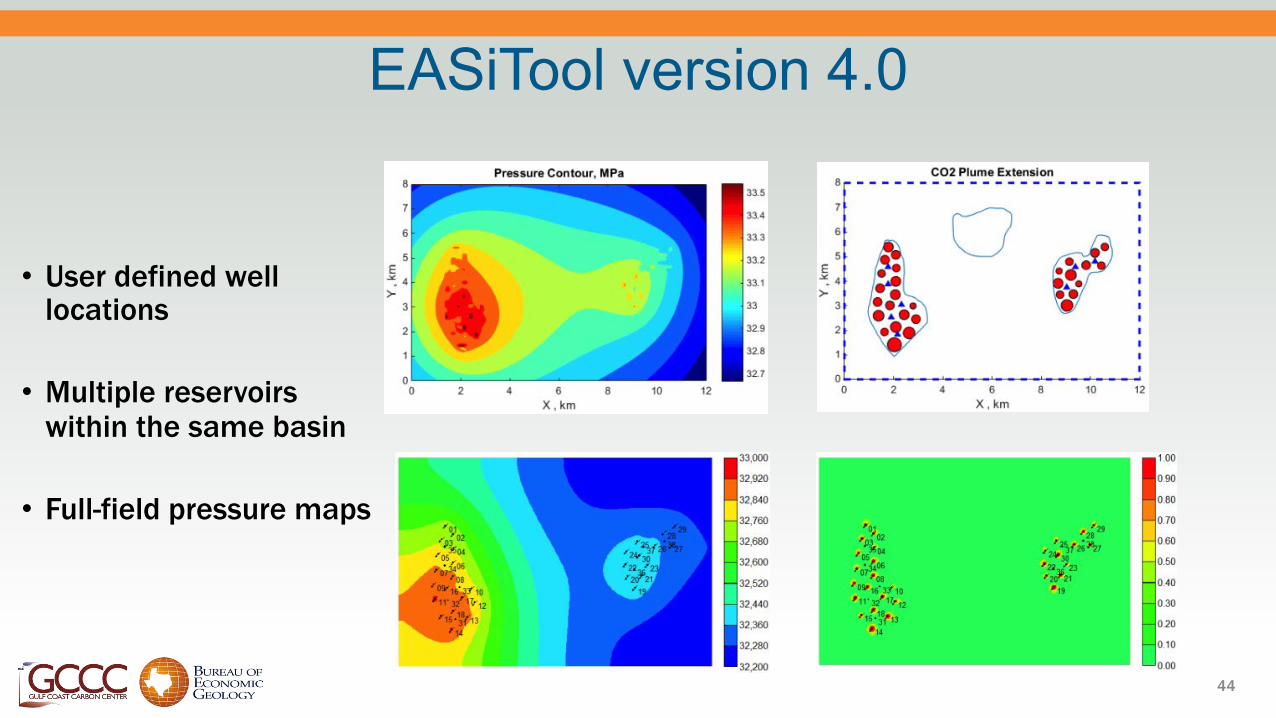
EASiTool version 4.0
44
• User defined well locations
• Multiple reservoirs within the same basin
• Full-field pressure maps
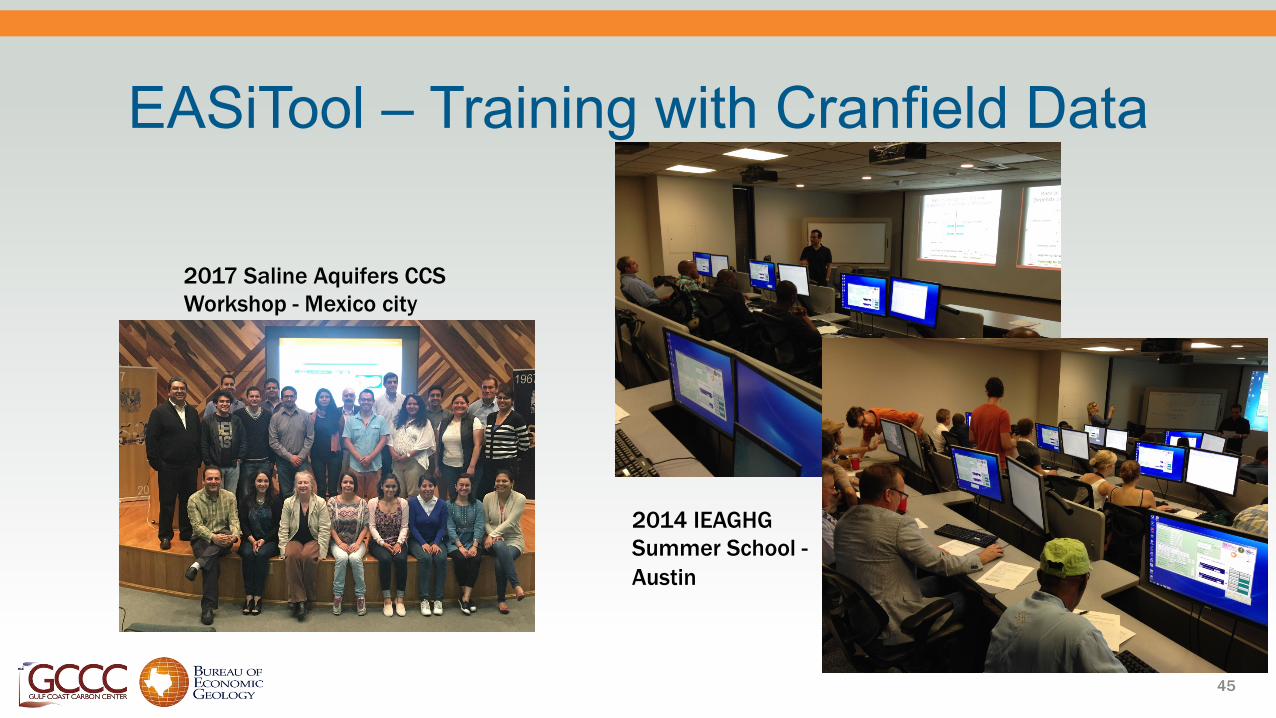
EASiTool – Training with Cranfield Data
45
2014 IEAGHG Summer School -Austin
2017 Saline Aquifers CCS Workshop - Mexico city

Methane Exsolution
Tip Meckel
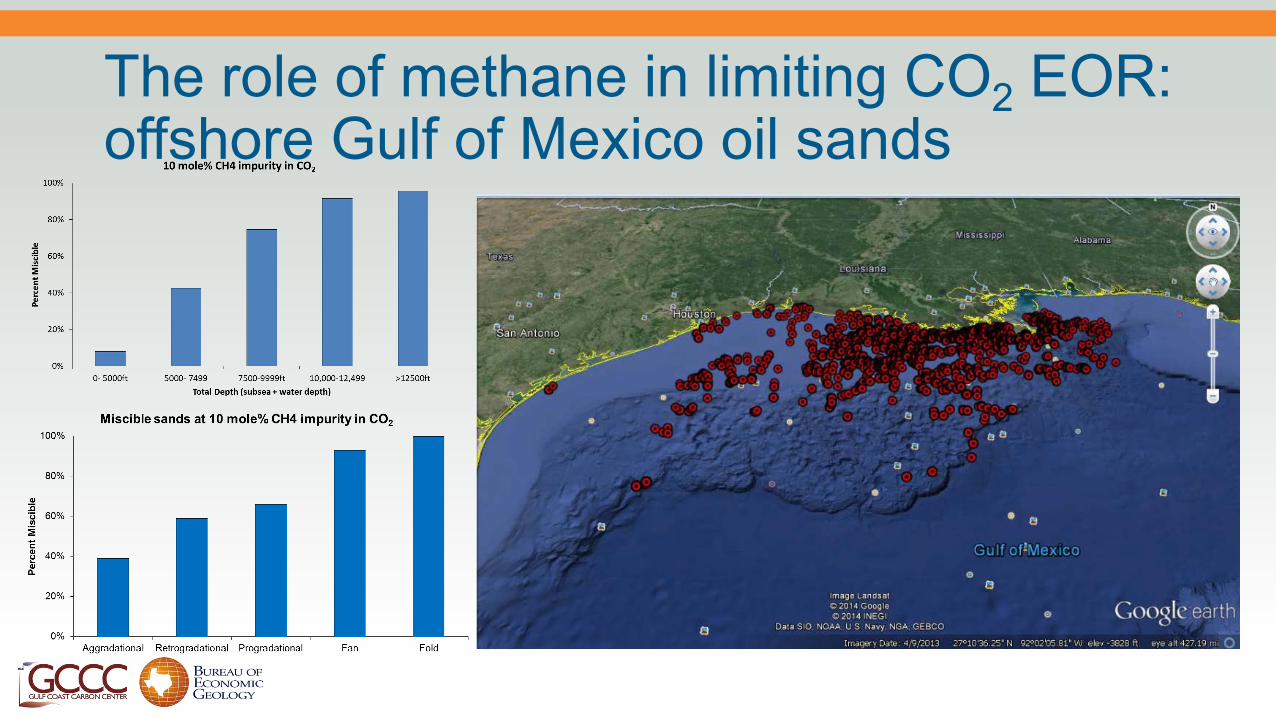
The role of methane in limiting CO2 EOR: offshore Gulf of Mexico oil sands
Net Carbon Negative Oil Mass accounting Cranfield case Study
Vanessa Nuñez López, Seyyed Hosseini, Ramón Gil-Egui, Pooneh Hosseininosheri Bureau of Economic Geology
THE UNIVERSITY OF TEXAS AT AUSTIN
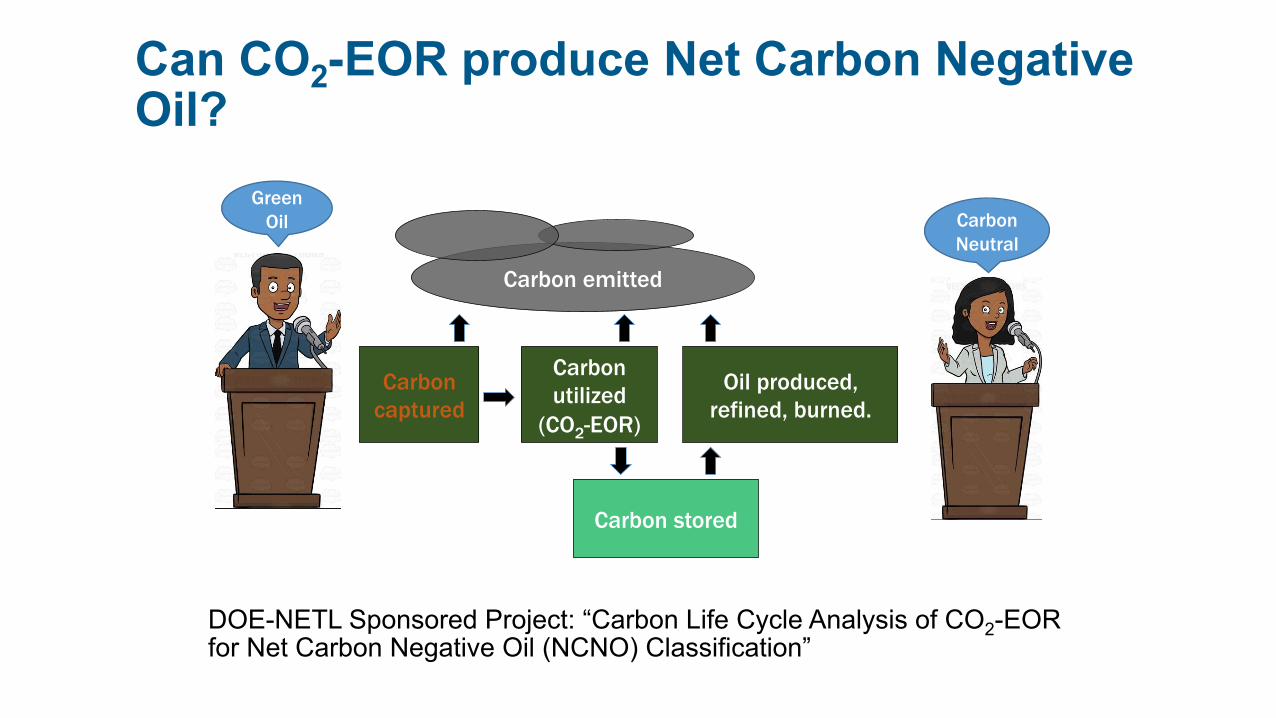
Carbon captured
Carbon utilized
(CO2-EOR)
Carbon stored
Oil produced, refined, burned.
Carbon emitted
Can CO2-EOR produce Net Carbon Negative Oil?
Carbon Neutral
Green Oil
DOE-NETL Sponsored Project: “Carbon Life Cycle Analysis of CO2-EOR for Net Carbon Negative Oil (NCNO) Classification”

Study focus: CO2 utilization ratios
50
CO2 injection [MMCF]
CO2 Utilization [MMCF/bbl]
Produced oil [bbl]
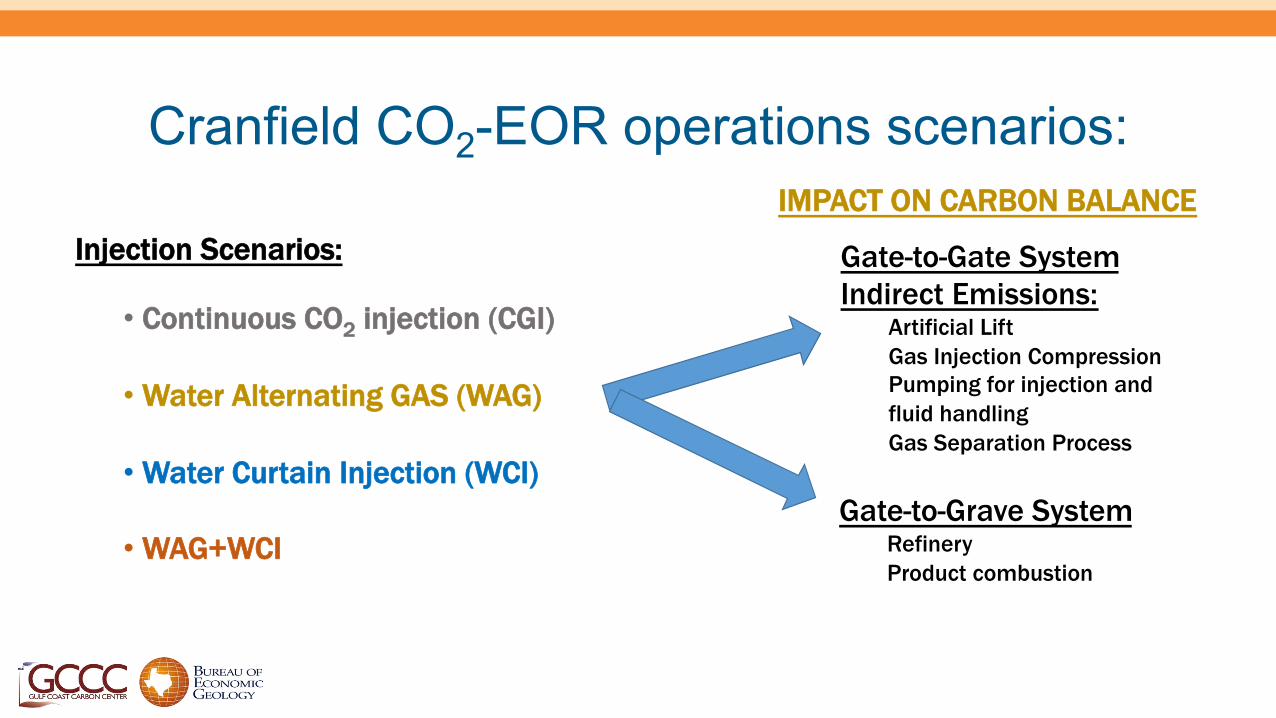
Cranfield CO2-EOR operations scenarios:
Injection Scenarios:
• Continuous CO2 injection (CGI)
• Water Alternating GAS (WAG)
• Water Curtain Injection (WCI)
• WAG+WCI
IMPACT ON CARBON BALANCE Gate-to-Gate System
Indirect Emissions: Artificial Lift Gas Injection Compression Pumping for injection and fluid handling Gas Separation Process
Gate-to-Grave System
Refinery Product combustion
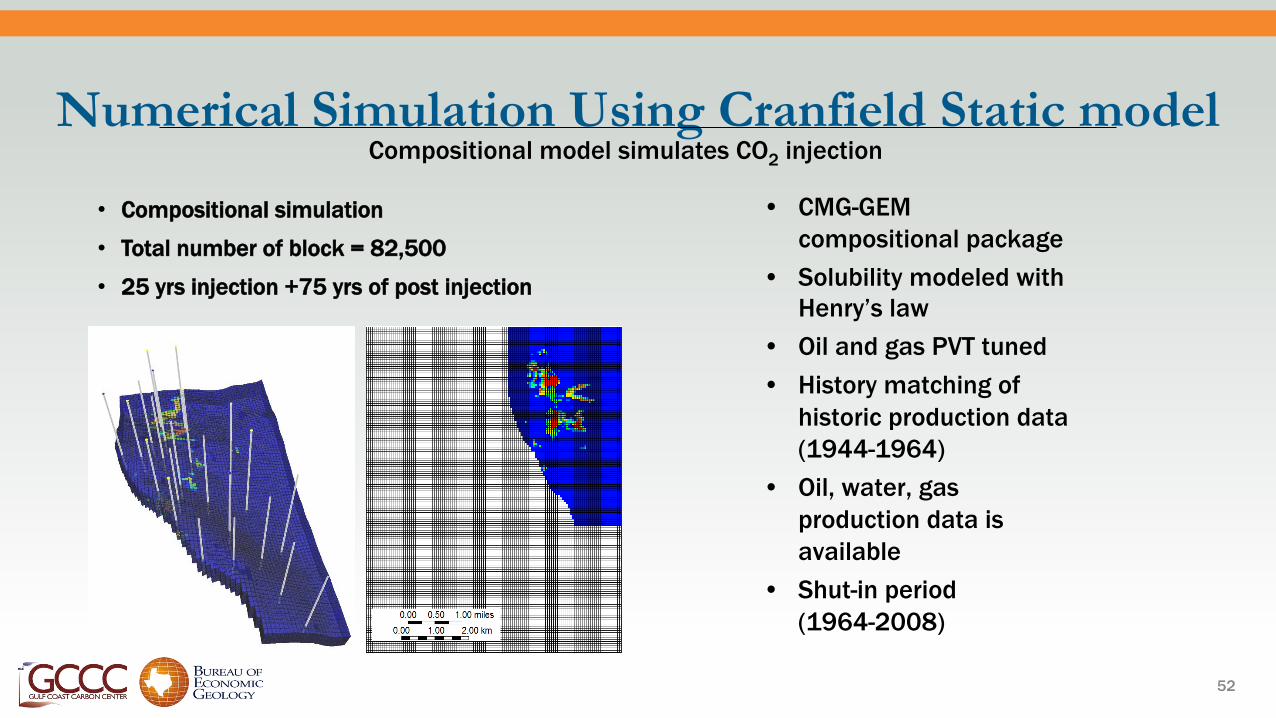
Numerical Simulation Using Cranfield Static model
• Compositional simulation
• Total number of block = 82,500
• 25 yrs injection +75 yrs of post injection
52
Compositional model simulates CO2 injection
• CMG-GEM compositional package
• Solubility modeled with Henry’s law
• Oil and gas PVT tuned • History matching of
historic production data (1944-1964)
• Oil, water, gas production data is available
• Shut-in period (1964-2008)
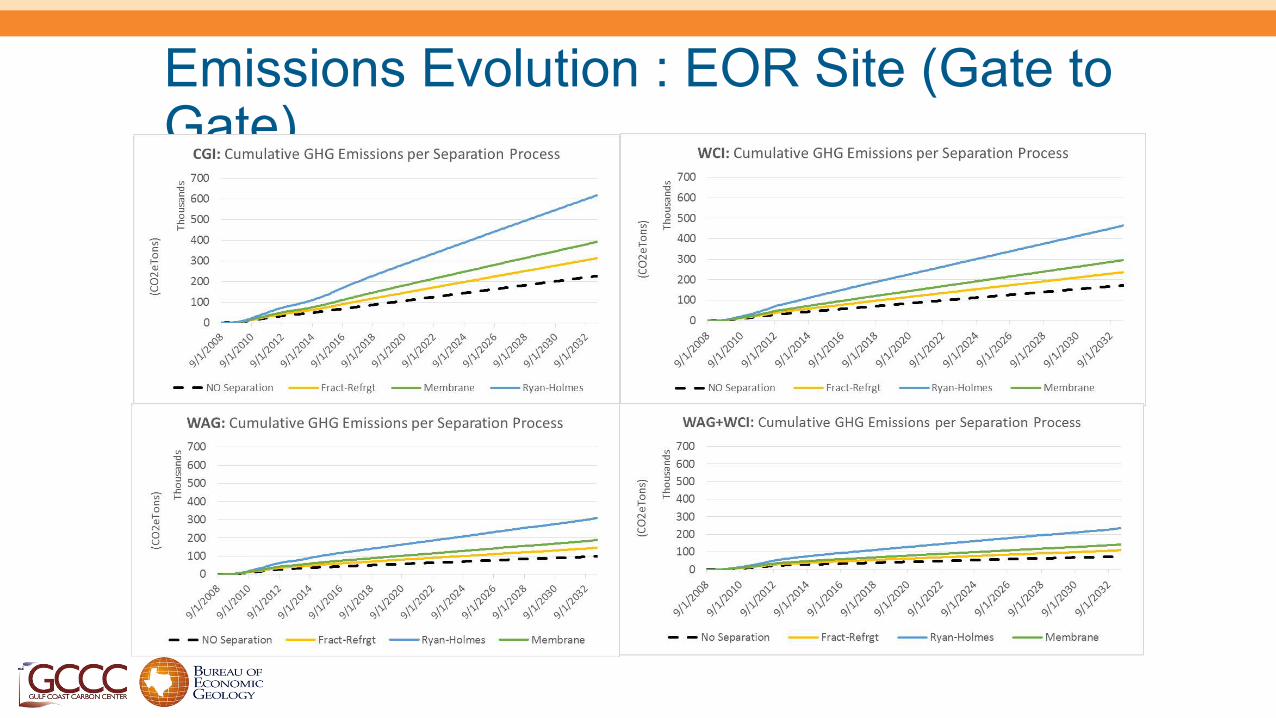
Emissions Evolution : EOR Site (Gate to Gate)
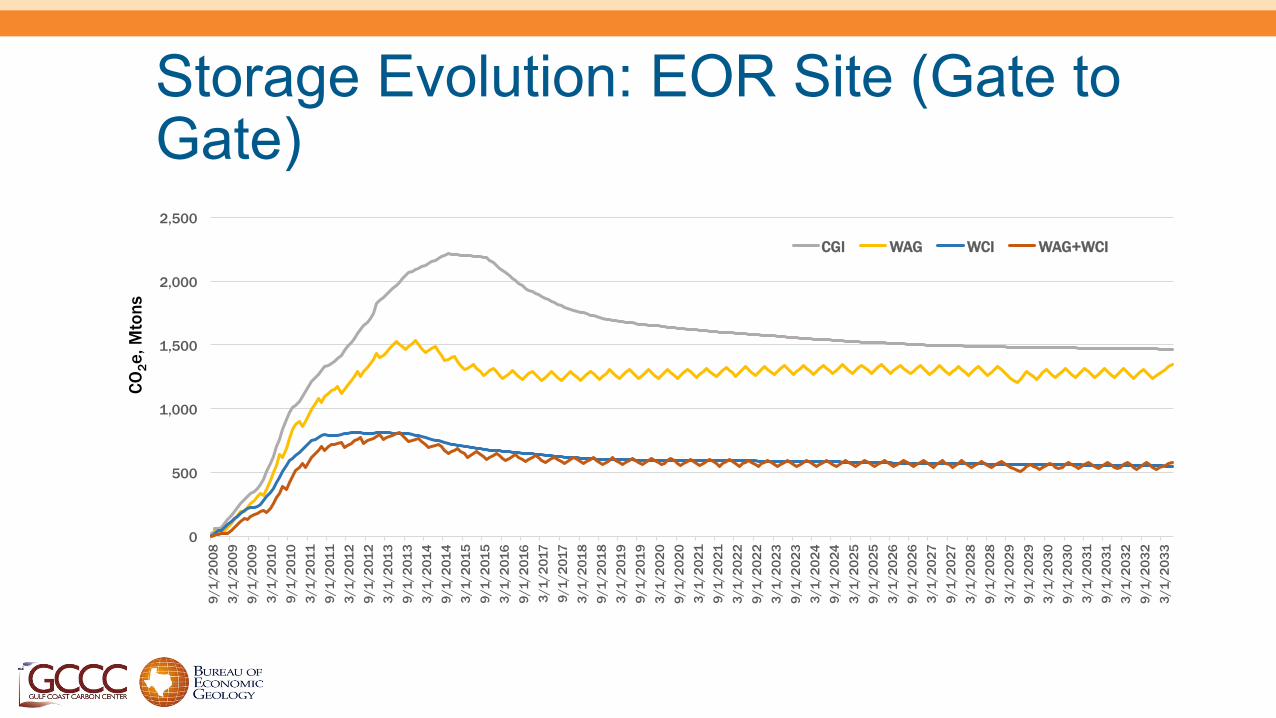
Storage Evolution: EOR Site (Gate to Gate)
0
500
1,000
1,500
2,000
2,500 9/
1/20
08
3/1/
2009
9/
1/20
09
3/1/
2010
9/
1/20
10
3/1/
2011
9/
1/20
11
3/1/
2012
9/
1/20
12
3/1/
2013
9/
1/20
13
3/1/
2014
9/
1/20
14
3/1/
2015
9/
1/20
15
3/1/
2016
9/
1/20
16
3/1/
2017
9/
1/20
17
3/1/
2018
9/
1/20
18
3/1/
2019
9/
1/20
19
3/1/
2020
9/
1/20
20
3/1/
2021
9/
1/20
21
3/1/
2022
9/
1/20
22
3/1/
2023
9/
1/20
23
3/1/
2024
9/
1/20
24
3/1/
2025
9/
1/20
25
3/1/
2026
9/
1/20
26
3/1/
2027
9/
1/20
27
3/1/
2028
9/
1/20
28
3/1/
2029
9/
1/20
29
3/1/
2030
9/
1/20
30
3/1/
2031
9/
1/20
31
3/1/
2032
9/
1/20
32
3/1/
2033
CO2
Stor
age,
MTo
ns Th
ousa
nds
CGI WAG WCI WAG+WCI
CO2e
, Mto
ns

Impact of Downstream Emissions (Gate to Grave)
(CGI Scenario)
NCNO
Gate to Gate Gate to Grave
NEGATIVE EMISSIONS
0
500
1,000
1,500
2,000
2,500
(CO
2eTo
ns)
Thou
sand
s
CGI: Emissions vs Storage
Emissions (Fract-Refrgt) Emissions (Ryan-Holmes)
Emissions (Membrane) Storage
0
500
1,000
1,500
2,000
2,500
(CO
2eTo
ns)
Thou
sand
s
CGI: Emissions vs Storage
Total (Fract-Refrgt) + DS Total (Ryan-Holmes) + DS
Total (Membrane) + DS Storage
NCPO
CO2e
, Mto
ns
CO2e
, Mto
ns
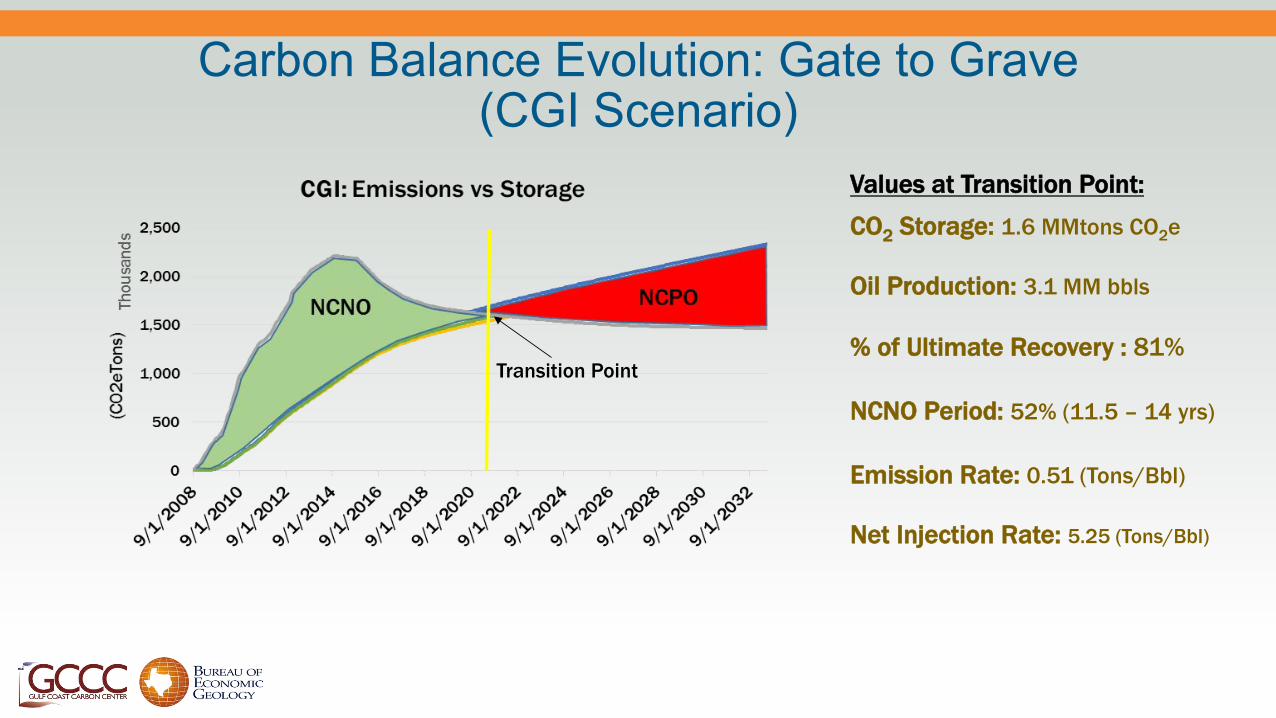
Carbon Balance Evolution: Gate to Grave (CGI Scenario)
CO2 Storage: 1.6 MMtons CO2e Oil Production: 3.1 MM bbls % of Ultimate Recovery : 81% NCNO Period: 52% (11.5 – 14 yrs) Emission Rate: 0.51 (Tons/Bbl) Net Injection Rate: 5.25 (Tons/Bbl)
Transition Point
Values at Transition Point:
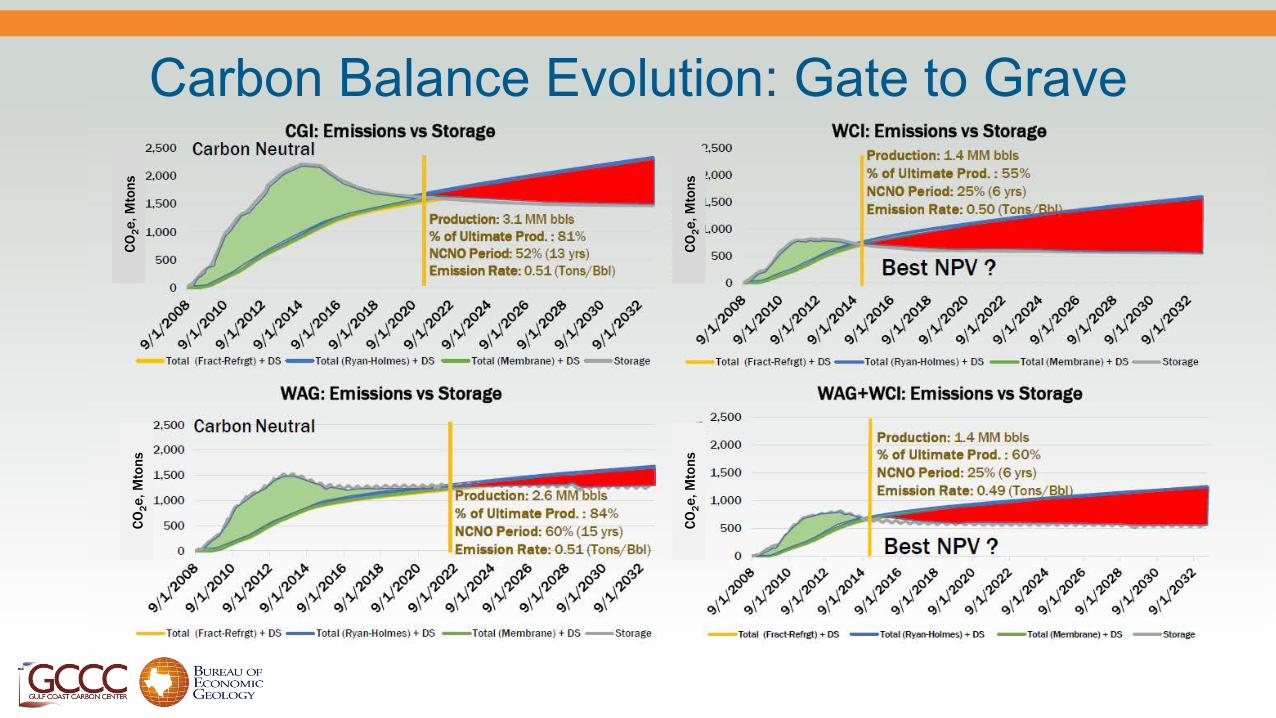
Carbon Balance Evolution: Gate to Grave CO
2e, M
tons
CO2e
, Mto
ns
CO2e
, Mto
ns
CO2e
, Mto
ns

ü Validated CO2-EOR as a greenhouse gas emission reduction technology.
ü Obtained results that show how in our case study (Cranfield) all CO2-EOR injection strategies start producing NCNO and at some point transition into producing net carbon positive oil (NCPO).
ü The NCNO period can be engineered to last longer, as it is highly dependent on the CO2 injection strategy.
Impacts and Key Findings

Knowledge Sharing
Gulf Coast Carbon Center

Knowledge Sharing
• Transmit SECARB research results to stakeholder groups though diverse, effective communication strategies.
• Engage key stakeholders, decision-makers, informal and formal education professionals and students, relevant industry and regulatory participants, or new programs.
• Provide peer review. • Bring information developed elsewhere back for US application.
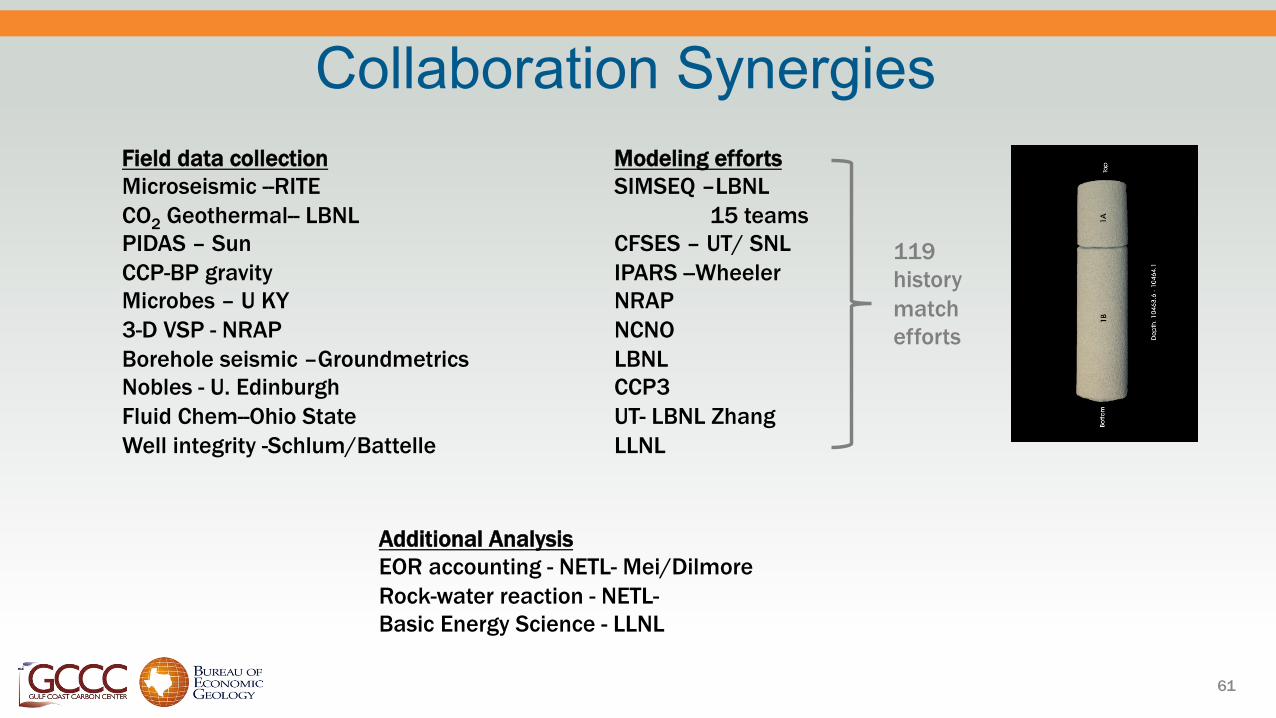
Collaboration Synergies
61
Field data collection Microseismic --RITE CO2 Geothermal-- LBNL PIDAS – Sun CCP-BP gravity Microbes – U KY 3-D VSP - NRAP Borehole seismic –Groundmetrics Nobles - U. Edinburgh Fluid Chem--Ohio State Well integrity -Schlum/Battelle
Modeling efforts SIMSEQ –LBNL
15 teams CFSES – UT/ SNL IPARS --Wheeler NRAP NCNO LBNL CCP3 UT- LBNL Zhang LLNL
Additional Analysis EOR accounting - NETL- Mei/Dilmore Rock-water reaction - NETL- Basic Energy Science - LLNL
119 history match efforts
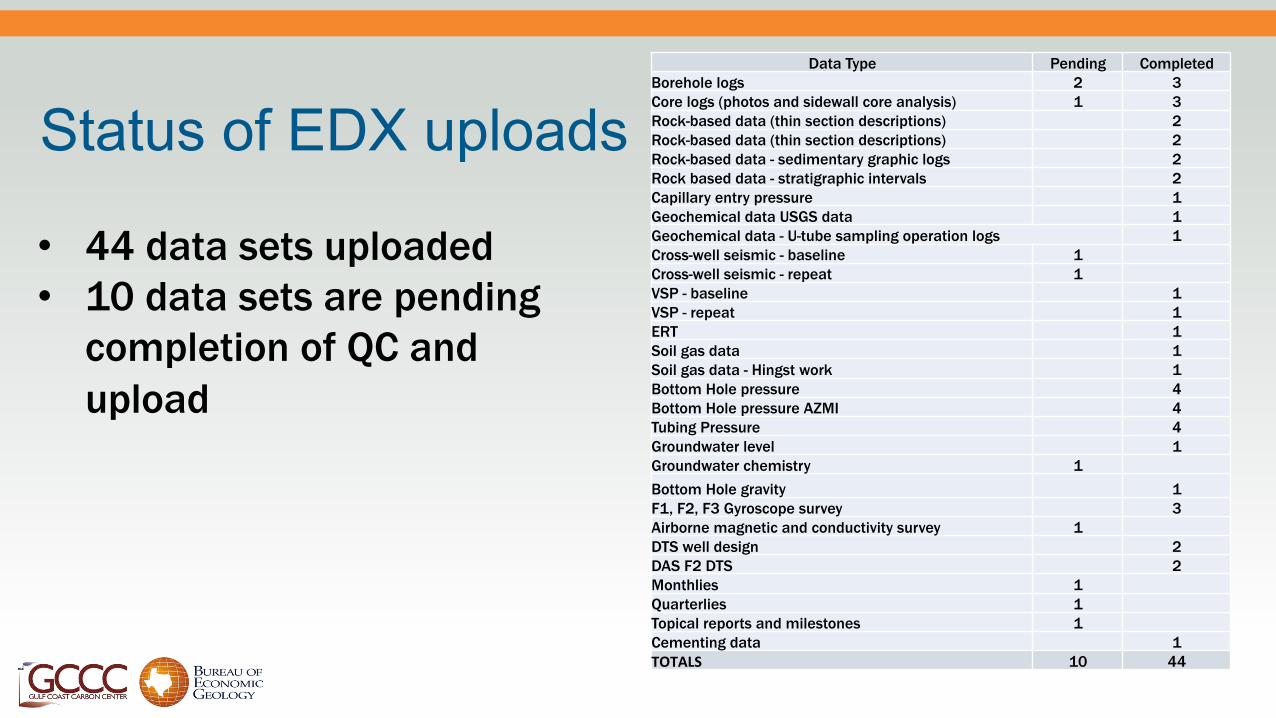
Status of EDX uploads Data Type Pending Completed
Borehole logs 2 3Core logs (photos and sidewall core analysis) 1 3Rock-based data (thin section descriptions) 2Rock-based data (thin section descriptions) 2Rock-based data - sedimentary graphic logs 2Rock based data - stratigraphic intervals 2Capillary entry pressure 1Geochemical data USGS data 1Geochemical data - U-tube sampling operation logs 1Cross-well seismic - baseline 1Cross-well seismic - repeat 1VSP - baseline 1VSP - repeat 1ERT 1Soil gas data 1Soil gas data - Hingst work 1Bottom Hole pressure 4Bottom Hole pressure AZMI 4Tubing Pressure 4Groundwater level 1Groundwater chemistry 1 Bottom Hole gravity 1F1, F2, F3 Gyroscope survey 3Airborne magnetic and conductivity survey 1DTS well design 2DAS F2 DTS 2Monthlies 1Quarterlies 1Topical reports and milestones 1Cementing data 1TOTALS 10 44
• 44 data sets uploaded • 10 data sets are pending
completion of QC and upload
Knowledge Transfer
• 96 publications including a special issue on Cranfield • Technical input into International Standards Organization (ISO) standard
265 on CCS, in particular working group 6 on storage associated with EOR • Presentations and review California Air Resource Board Draft CCS
Protocol • Draft Regulatory Amendments to the Low Carbon Fuel Standard as these
pertain to CCS technology
63

Presentations in the past four years
• 203 presentations included SECARB results
• Most were technical • 14 to students and public • 11 targeted to press
Australia [CATEGORY NAME] [CATEGORY
NAME]
[CATEGORY NAME]
[CATEGORY NAME]
[CATEGORY NAME]
[CATEGORY NAME] [CATEGORY NAME] [CATEGORY NAME] [CATEGORY NAME] [CATEGORY NAME]
Taiwan [CATEGORY
NAME] [CATEGORY NAME] [CATEGORY NAME] [CATEGORY NAME] [CATEGORY NAME]
[CATEGORY NAME]
[CATEGORY NAME]
[CATEGORY
NAME]
[CATEGORY NAME]
[CATEGORY NAME]
Location presentations given
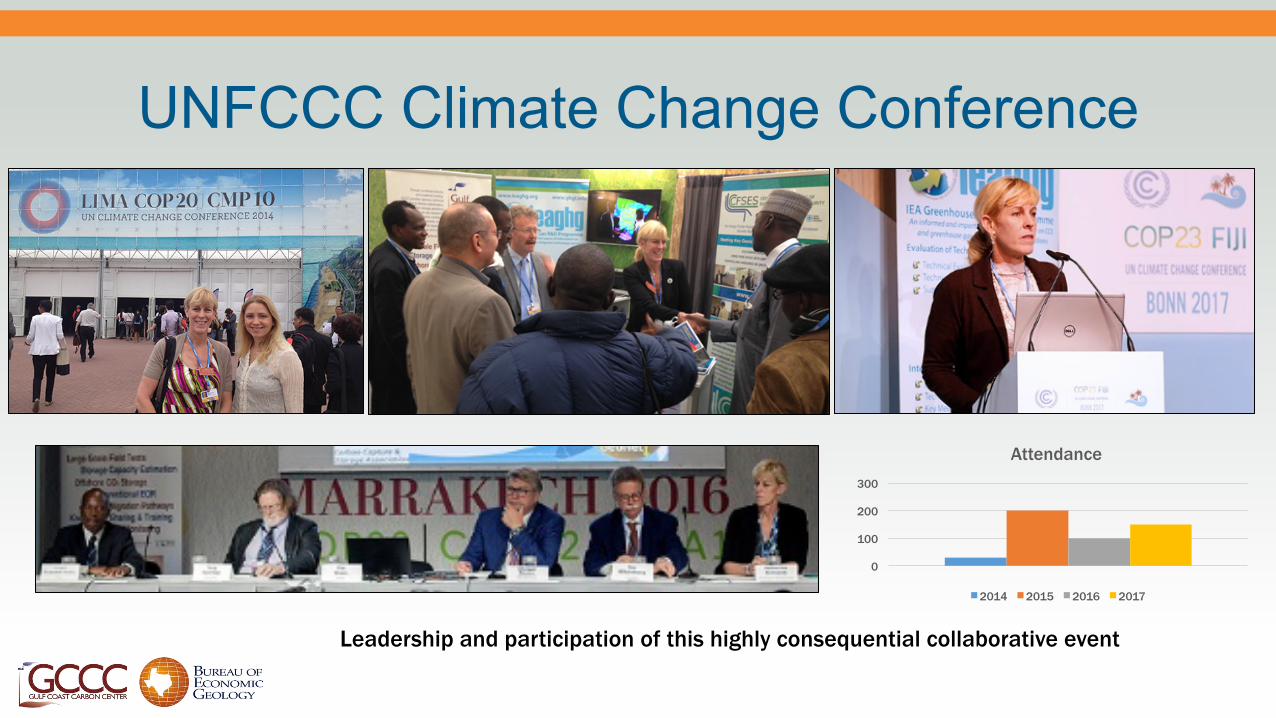
UNFCCC Climate Change Conference
Leadership and participation of this highly consequential collaborative event
0
100
200
300
Attendance
2014 2015 2016 2017
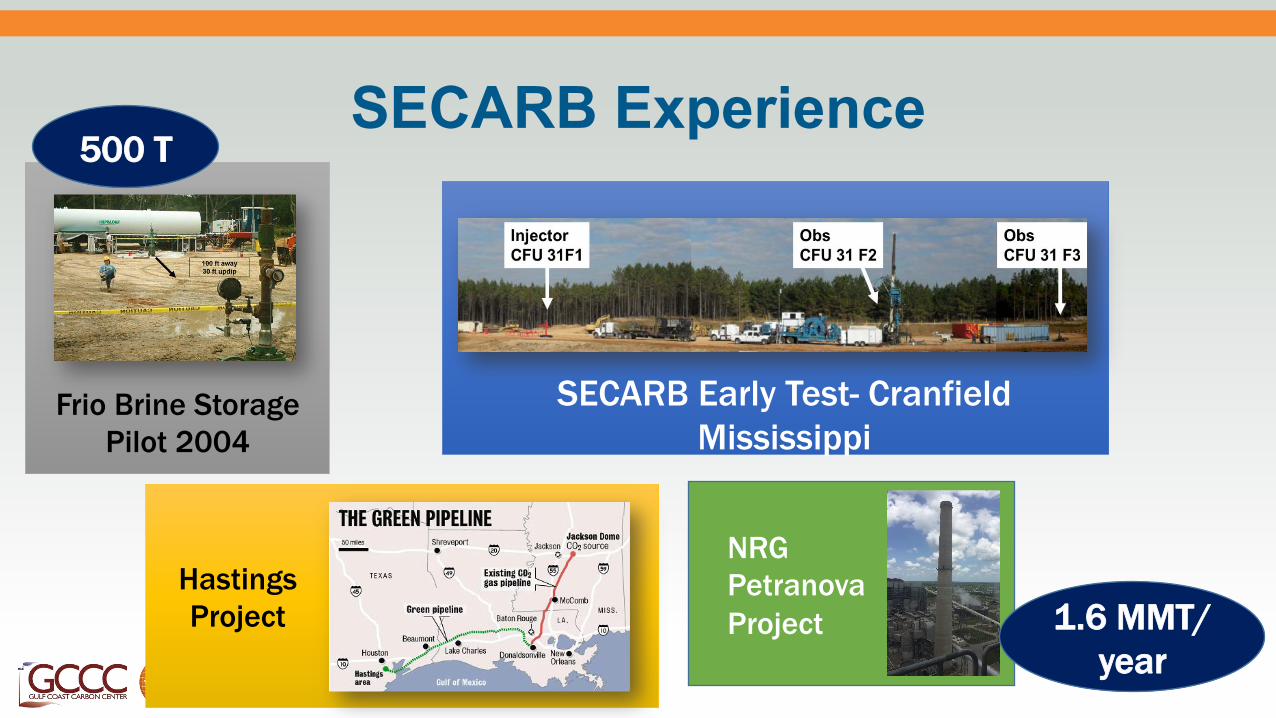
SECARB Experience
SECARB Early Test- Cranfield Mississippi
Hastings Project
Frio Brine Storage Pilot 2004
500 T
NRG Petranova Project 1.6 MMT/
year

Participation in document preparation
• Presentations and comments to California Air Board on accounting for CCS
• International Standards Organization draft standards 265 about EOR as part of CCS
• Society of Petroleum Engineers Storage Resources Management System (SRMS)
• Letter to Executive Secretary of the United Nations Framework Convention on Climate Change with assurances that CCS is secure and safe

Progress in application of SECARB Learnings
• Progress on optimization of monitoring approach: ALPMI method • Recognition of need for attribution to prepare for incident or allegation • Understanding limitations of groundwater surveillenve • Tool and methodology development and demonstrations
• Soil gas • Groundwater • Pressure-based methods
• Methane limits to CO2-EOR offshore • Project development to maximize NCNO • Taking approaches to the field in commercial projects • Monitoring network design • Integrated system development • Outreach to technical and non-technical stakeholders

Thank you Katherine Romanak
Gulf Coast Carbon Center Bureau of Economic Geology
The University of Texas at Austin [email protected] http://www.beg.utexas.edu/gccc/
69

Subsurface Results (Cranfield)
Ø WAGshowsagoodbalancebetweenmaximizingoilproductionandCO2storagewitha lowergrossutilizationratiocomparedtootherscenarios.
0
0.5
1
1.5
2
2.5
0 1 2 3 4 5 6 7 8
NetCO2Stored(Milliontonnes)
HCPVinjected
CGI
WAG
WCI
WCI+WAG