second budget hearing
TRANSCRIPT

SECOND BUDGET HEARING
SEPT 27, 2021

2021 – 2022 BUDGET SIGNIFICANT CALENDAR DATES
MAY 10 to MAY 14, 2021 – Individual Commission Briefings
JUNE 1, 2021 – Property Appraiser sends estimated property values
JULY 1, 2021 – Budget Estimate submitted to City Commission
JULY 1, 2021 – Property Appraiser certifies preliminary taxable values
JULY 1 to JULY 14, 2021 – State revenue estimates available online
JULY 8, 2021 – Review Budget Estimate with Budget Advisory Board
JULY 14, 2021 – Budget Workshop – Presentation of Budget Estimate
AUGUST 4, 2021 – Certify tax rate to the Property Appraiser
SEPTEMBER 13, 2021 – 1st Budget Hearing
SEPTEMBER 27, 2021 – 2nd Budget Hearing
2

Three-year event:FY20, FY21 & FY22
The goal is to keep each fiscal year’s potential revenue shortfall contained to that fiscal year without the use of fund balance.
BUDGET REDUCTION METHODOLOGY
3

FY20Projected Revenue Shortfall
$9.2MActual Revenue Shortfall
$8.2MBudget Reductions Applied to Budget
• Full & Part Time Positions Frozen: $(3.3M)• Oper. Accts Frozen + Normal Surplus: $(3.9M)• Capital Project Deferments: $(1.0M)
BUDGET REDUCTION METHODOLOGY
4
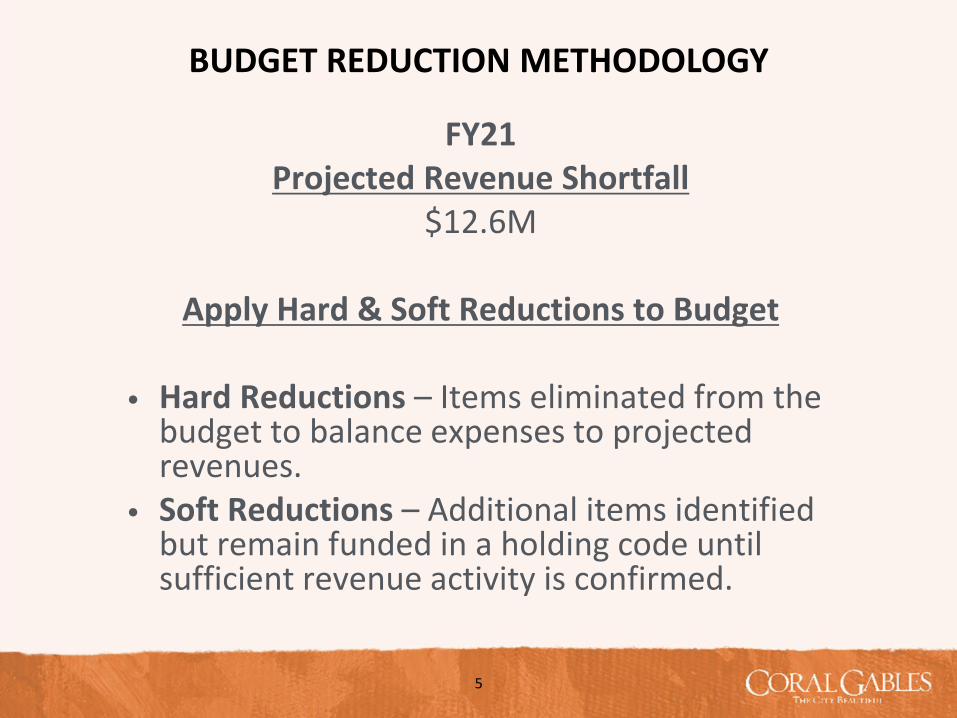
FY21Projected Revenue Shortfall
$12.6M
Apply Hard & Soft Reductions to Budget
• Hard Reductions – Items eliminated from the budget to balance expenses to projected revenues.
• Soft Reductions – Additional items identified but remain funded in a holding code until sufficient revenue activity is confirmed.
BUDGET REDUCTION METHODOLOGY
5
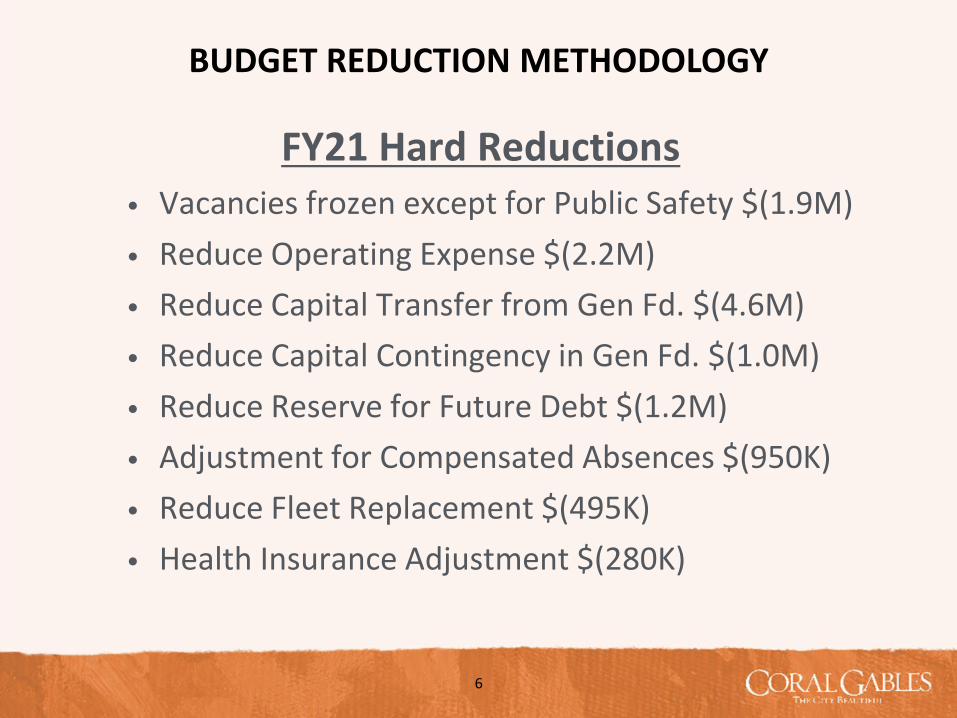
FY21 Hard Reductions• Vacancies frozen except for Public Safety $(1.9M)• Reduce Operating Expense $(2.2M)• Reduce Capital Transfer from Gen Fd. $(4.6M)• Reduce Capital Contingency in Gen Fd. $(1.0M)• Reduce Reserve for Future Debt $(1.2M)• Adjustment for Compensated Absences $(950K)• Reduce Fleet Replacement $(495K)• Health Insurance Adjustment $(280K)
BUDGET REDUCTION METHODOLOGY
6

FY21 Soft Reductions• Contingency for Budget Reductions $(5.4M)• Reduce Reserve for Future Debt $(600K)• Pension Stabilization $(1.0M)
BUDGET REDUCTION METHODOLOGY
7

FY22 Soft Reductions• Contingency for Budget Reductions $(1.2M)• Reduce Reserve for Future Debt $(600K)• Pension Stabilization $(1.0M)
BUDGET REDUCTION METHODOLOGY
8
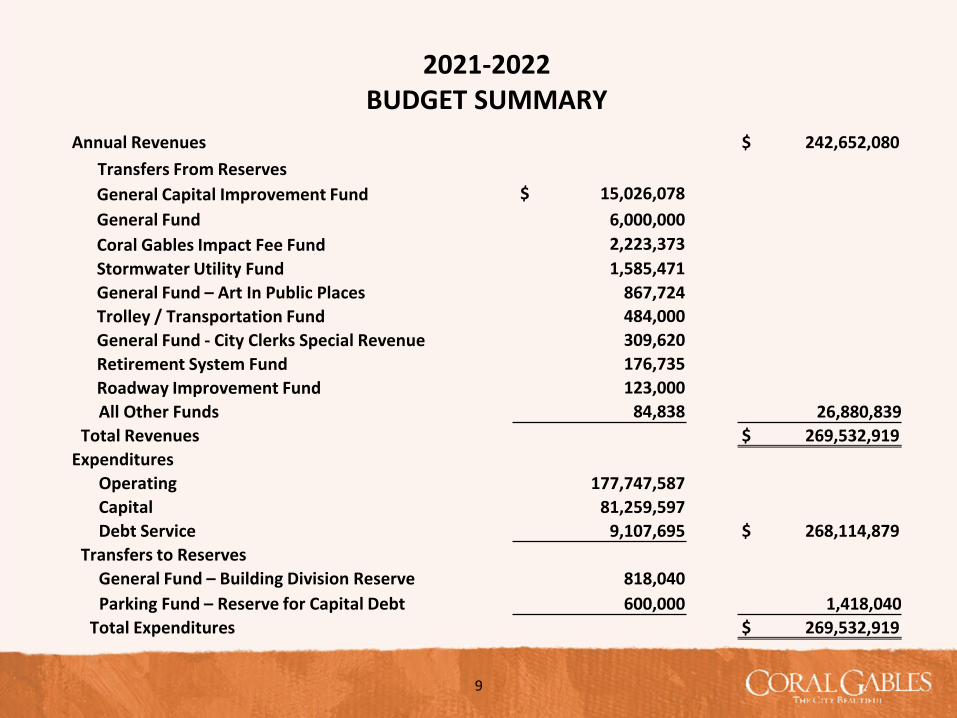
2021-2022BUDGET SUMMARY
Annual Revenues $ 242,652,080Transfers From ReservesGeneral Capital Improvement Fund $ 15,026,078General Fund 6,000,000Coral Gables Impact Fee Fund 2,223,373Stormwater Utility Fund 1,585,471General Fund – Art In Public Places 867,724 Trolley / Transportation Fund 484,000General Fund - City Clerks Special Revenue 309,620Retirement System Fund 176,735Roadway Improvement Fund 123,000All Other Funds 84,838 26,880,839
Total Revenues $ 269,532,919Expenditures
Operating 177,747,587Capital 81,259,597Debt Service 9,107,695 $ 268,114,879
Transfers to ReservesGeneral Fund – Building Division Reserve 818,040Parking Fund – Reserve for Capital Debt 600,000 1,418,040
Total Expenditures $ 269,532,919
9

REVENUE INCREASES AFFECTING THE BUDGET
TotalRevenues Increases RevenueDebt Proceeds – Capital Projects $ 42,000,000 $ 42,000,000
Property Tax * 3,616,258 95,894,690 Automobile Parking Fees 2,865,952 15,294,390 Stormwater Utility Fees 595,000 6,725,000 Permit Fees 507,000 7,526,000 Transportation Sales Tax 390,000 2,150,000 Golf Fees 369,400 1,073,500 General Government Fees 295,000 2,700,000Franchise Fees 240,000 6,835,000Swimming Fees 227,900 1,287,000Local Option Gas Tax 172,000 1,100,000Other Revenue Increases 675,483 38,454,968
Total Revenue Increases $ 51,953,993 $ 221,040,548
* Property Tax estimate based on July 1st property valuations. The City’s millage rate has been maintained at 5.559 for 7 consecutive years.
10

REVENUE DECREASES AFFECTING THE BUDGET
TotalRevenues Decreases RevenueSale of Land/Buildings $ (5,198,586) $ -Miami-Dade County Roadway Impact Fees (1,452,395) -Intergovernmental Revenues (394,217) 6,552,349Investment Earnings – General Fund (408,500) 111,500Rentals/Concessions – Biltmore Complex (120,448) 1,325,197Rentals/Concessions – General Fund (106,284) 3,342,079Tennis Fees (29,000) 687,000Commercial Waste Fees (12,000) -All Other Revenue Decreases (797,658) 9,593,407
Total Revenue Decreases (8,519,088) 21,611,532
Net Change/Total Revenues $ 43,434,905 $ 242,652,080
11

EXPENDITURE CHANGES
AFFECTING THE BUDGETINCREASE TOTAL
(DECREASE) BUDGET
Personal Services (PS)
Salaries $ 1,356,185 $ 71,767,956
Overtime (35,610) 2,269,662
Employee Benefits
Retirement (Index, Assumption Change & Additional 401a) 911,103 30,335,567
FICA 118,617 4,681,597
Workers Compensation - 2,000,000
Health & OPEB 1,083,499 11,174,006
Other Misc. Benefits (2,020) 224,325
Total Change in Personal Services $ 3,431,774
Total Personal Services Budget $ 122,453,113
12
EXPENDITURE CHANGES
AFFECTING THE BUDGETINCREASE TOTAL
(DECREASE) BUDGET
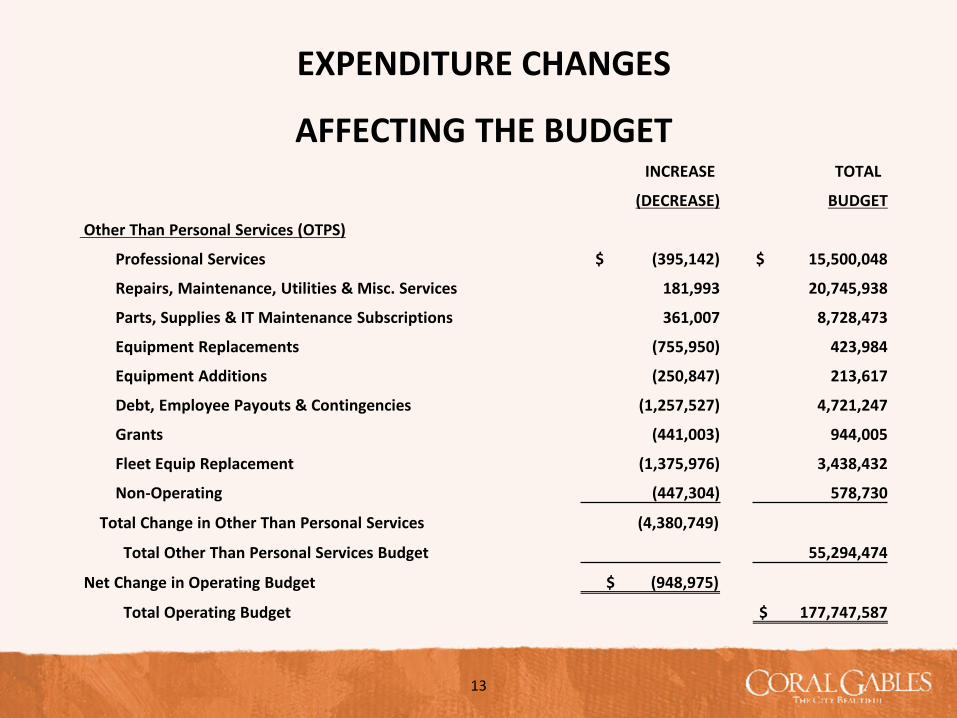
Other Than Personal Services (OTPS)
Professional Services $ (395,142) $ 15,500,048
Repairs, Maintenance, Utilities & Misc. Services 181,993 20,745,938
Parts, Supplies & IT Maintenance Subscriptions 361,007 8,728,473
Equipment Replacements (755,950) 423,984
Equipment Additions (250,847) 213,617
Debt, Employee Payouts & Contingencies (1,257,527) 4,721,247
Grants (441,003) 944,005
Fleet Equip Replacement (1,375,976) 3,438,432
Non-Operating (447,304) 578,730
Total Change in Other Than Personal Services (4,380,749)
Total Other Than Personal Services Budget 55,294,474
Net Change in Operating Budget $ (948,975)
Total Operating Budget $ 177,747,587
13
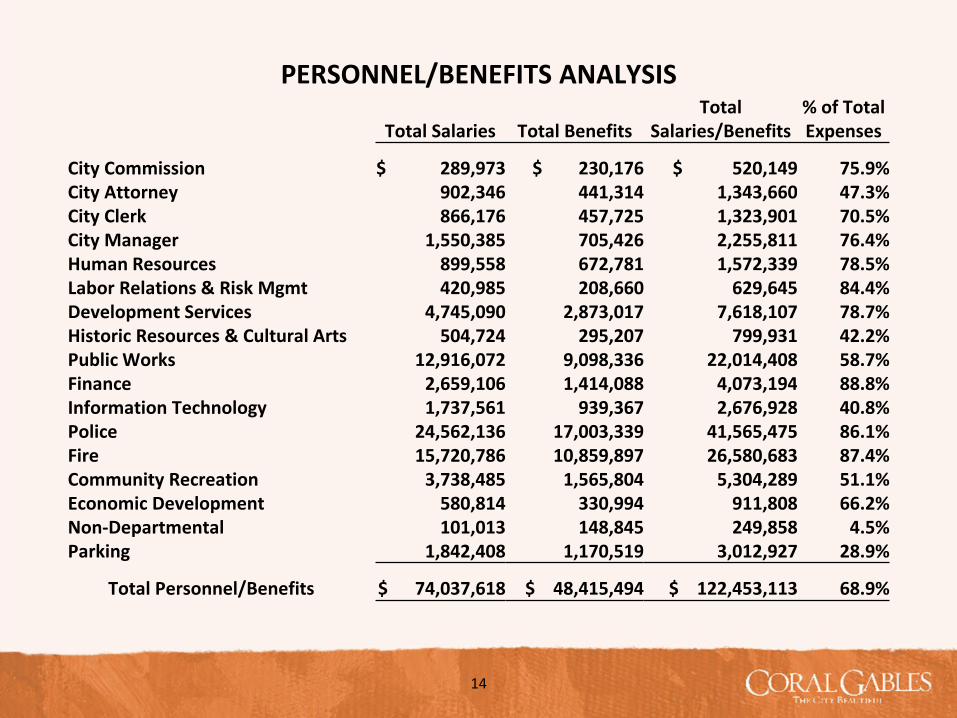
PERSONNEL/BENEFITS ANALYSIS Total % of Total
Total Salaries Total Benefits Salaries/Benefits Expenses
City Commission $ 289,973 $ 230,176 $ 520,149 75.9%City Attorney 902,346 441,314 1,343,660 47.3%City Clerk 866,176 457,725 1,323,901 70.5%City Manager 1,550,385 705,426 2,255,811 76.4%Human Resources 899,558 672,781 1,572,339 78.5%Labor Relations & Risk Mgmt 420,985 208,660 629,645 84.4%Development Services 4,745,090 2,873,017 7,618,107 78.7%Historic Resources & Cultural Arts 504,724 295,207 799,931 42.2%Public Works 12,916,072 9,098,336 22,014,408 58.7%Finance 2,659,106 1,414,088 4,073,194 88.8%Information Technology 1,737,561 939,367 2,676,928 40.8%Police 24,562,136 17,003,339 41,565,475 86.1%Fire 15,720,786 10,859,897 26,580,683 87.4%Community Recreation 3,738,485 1,565,804 5,304,289 51.1%Economic Development 580,814 330,994 911,808 66.2%Non-Departmental 101,013 148,845 249,858 4.5%Parking 1,842,408 1,170,519 3,012,927 28.9%
Total Personnel/Benefits $ 74,037,618 $ 48,415,494 $ 122,453,113 68.9%
14

EMPLOYEE CLASSIFICATIONTEN-YEAR COMPARISON
FISCAL POLICE FIRE- GENERAL
YEAR OFFICERS FIGHTERS EMPLOYEES TOTAL
2013 184 139 469 7922014 191 139 470 8002015 191 139 485 8152016 192 139 498 8292017 192 139 500 8312018 192 139 506 8372019 192 139 509 8402020 193 139 514 8462021 193 139 514 8462022 * 193 139 514 846
* Proposed
15
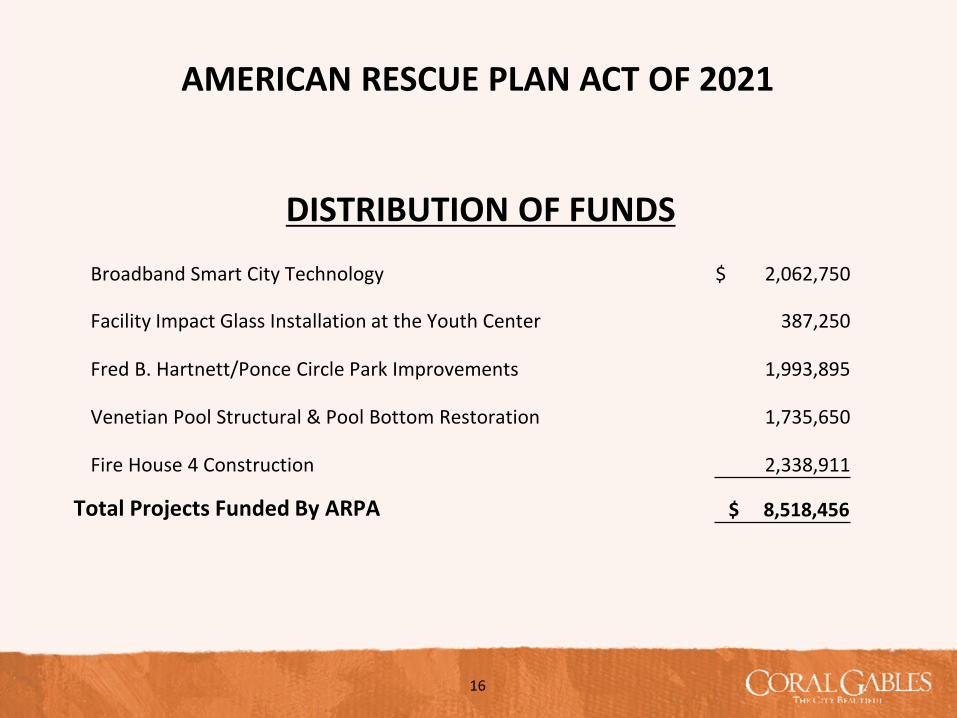
DISTRIBUTION OF FUNDS
AMERICAN RESCUE PLAN ACT OF 2021
16
Broadband Smart City Technology $ 2,062,750
Facility Impact Glass Installation at the Youth Center 387,250
Fred B. Hartnett/Ponce Circle Park Improvements 1,993,895
Venetian Pool Structural & Pool Bottom Restoration 1,735,650
Fire House 4 Construction 2,338,911
Total Projects Funded By ARPA $ 8,518,456

CAPITAL PROJECTS - NEW/ADDITIONAL FUNDING2021-2022 BUDGET
PROJECTS 2021-2022BUDGET
Capital EquipmentIT Data Systems Equipment Replacement/Upgrade $ 2,107,502 Public Art Restoration Matrix 159,150Wi-Fi Improvement Program 235,500 Broadband Smart City Technology 1,862,750
Total Capital Equipment 4,364,902
Facility Repairs/ImprovementsRoof Replacements Program - Citywide 516,536 HVAC Replacements Program - Citywide 484,886Elevator Repair/Replacement Matrix 113,514Facility Environmental Remediation 283,902Renovation of 240 Aragon Avenue (Cinema) 175,000ADA Remediation 150,000Energy & Water Efficiency Improvement Program 140,200 Facilities Impact Window Upgrade Program 387,250 Fuel Station Metal Canopy 7,500
Total Facility Repairs/Improvements Projects 2,258,788
17
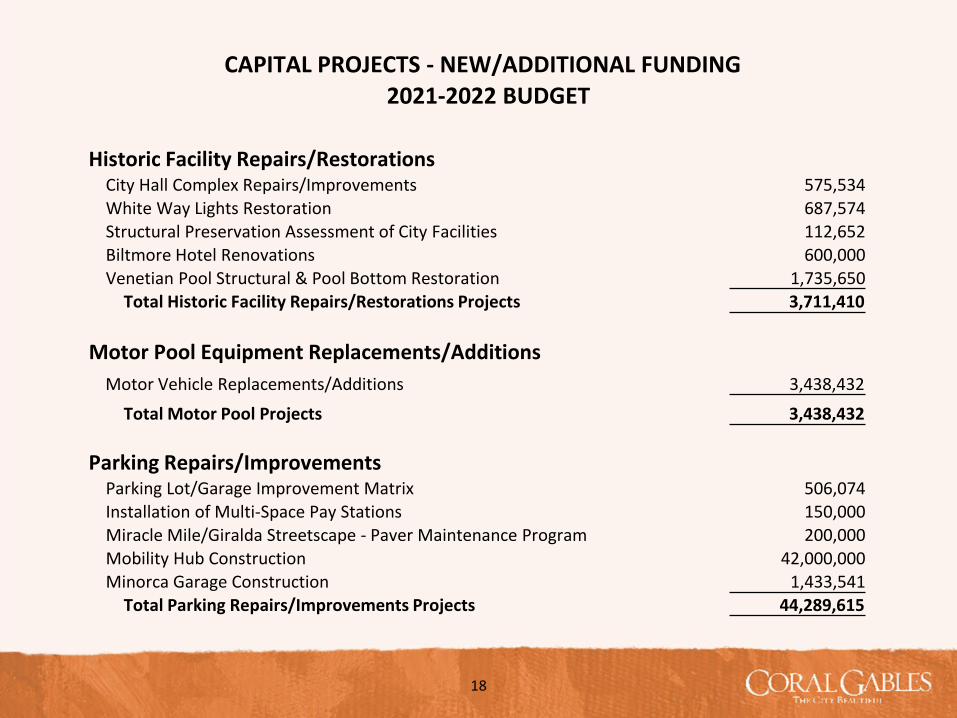
CAPITAL PROJECTS - NEW/ADDITIONAL FUNDING2021-2022 BUDGET
Historic Facility Repairs/RestorationsCity Hall Complex Repairs/Improvements 575,534 White Way Lights Restoration 687,574Structural Preservation Assessment of City Facilities 112,652 Biltmore Hotel Renovations 600,000Venetian Pool Structural & Pool Bottom Restoration 1,735,650
Total Historic Facility Repairs/Restorations Projects 3,711,410
Motor Pool Equipment Replacements/Additions Motor Vehicle Replacements/Additions 3,438,432
Total Motor Pool Projects 3,438,432
Parking Repairs/ImprovementsParking Lot/Garage Improvement Matrix 506,074Installation of Multi-Space Pay Stations 150,000Miracle Mile/Giralda Streetscape - Paver Maintenance Program 200,000Mobility Hub Construction 42,000,000Minorca Garage Construction 1,433,541
Total Parking Repairs/Improvements Projects 44,289,615
18

CAPITAL PROJECTS - NEW/ADDITIONAL FUNDING2021-2022 BUDGET
Parks & Recreation Repairs/ImprovementsPurchase of Land 1,462,624Parks & Recreation Major Repairs 1,876,302Cooper & Moore Park Enhancements 652,425Fred B. Hartnett/Ponce Circle Park Improvements 3,916,109Phillips Park Renovation & Enhancement 1,740,584
Total Parks & Recreation Repairs/Improvements Projects 9,648,044
Public Safety ImprovementsFire Equipment Replacement Program 225,845Construction of New Public Safety Building 50,000Fire House 4 Construction 2,610,080Fire Station 3 - Repairs & Improvements 40,000Mobile Radio Replacement Program 423,321Police Sniper Rifle Replacement Program 12,878
Total Public Safety Improvement Projects 3,362,124
19

CAPITAL PROJECTS - NEW/ADDITIONAL FUNDING2021-2022 BUDGET
Transportation & Right of Way ImprovementsCitywide Pedestrian Infrastructure Program 1,200,000Citywide Street Resurfacing Program 500,000Citywide Alleyway Repaving Program 75,000Channel Markers Upgrade & Maintenance Program 15,000Citywide Traffic Calming Program 1,400,000Street Tree Succession Plan 150,000Cocoplum Street Lighting - Phase I 55,000Miracle Mile Streetscape Improvements - Electrical & Irrigation 30,000Granada Blvd & Coral Way Intersection Improvements 750,000Bridge Repairs & Improvements 75,000Last Mile Transit Stop Improvements 205,000Street Ends Beautification 100,000
Total Transportation & Right of Way Improvement Projects 4,555,000
Utility Repairs/Improvements ProjectsSanitary Sewer Major Repair 1,589,714Pump Station Remote Monitoring 400,000Journey's End Pump Station and Force Main Replacement 700,000Granada Golf/Tennis Conversion to Sewer 50,000
20

CAPITAL PROJECTS - NEW/ADDITIONAL FUNDING2021-2022 BUDGET
Utility Repairs/Improvements Projects - ContinuedElectric Atlas Update & Model Calibration 50,000Sewer Pipe Cameras 5,000Sea Level Rise Mitigation Program (Infrastructure Reserve) 3,225,000Stormwater System Improvement Program 400,000Cross Connection Removal 200,000Storm Drainage Infrastructure Verification 750,000Coral Gables Waterways Maintenance 650,000Storm Drainage Master Plan 500,000Galiano St. & Madeira Ave. Storm Water Improvements 400,000Downtown Drainage Improvements 150,000
Total Utility Repairs/Improvement Projects 9,069,714
Total Projects $ 84,698,029
21
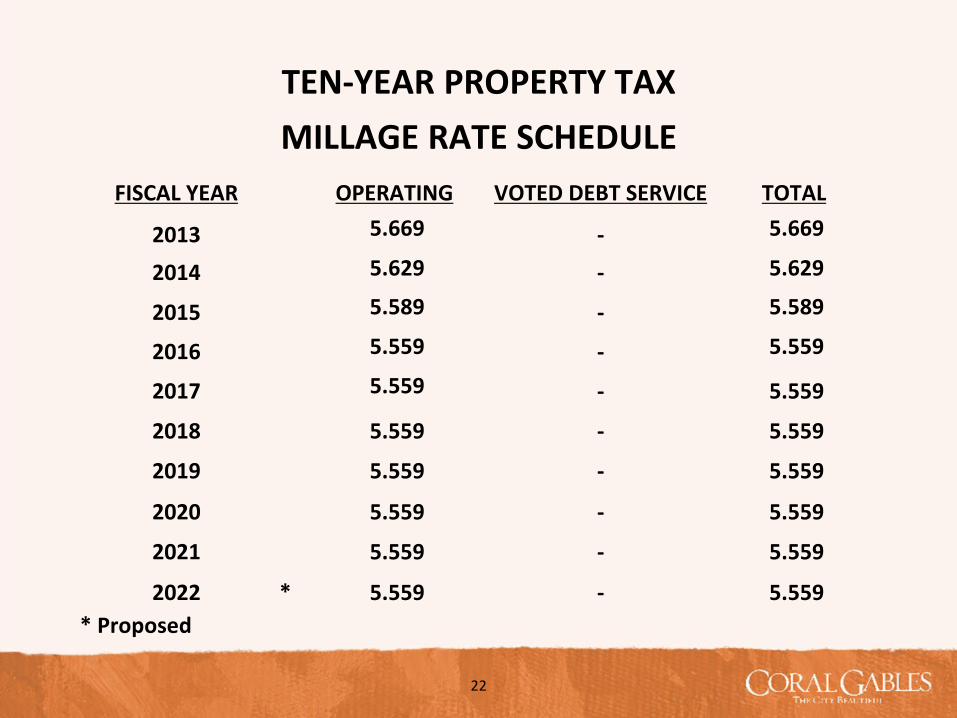
TEN-YEAR PROPERTY TAXMILLAGE RATE SCHEDULE
FISCAL YEAR OPERATING VOTED DEBT SERVICE TOTAL
2013 5.669 - 5.669
2014 5.629 - 5.629
2015 5.589 - 5.589
2016 5.559 - 5.559
2017 5.559 - 5.559
2018 5.559 - 5.559
2019 5.559 - 5.559
2020 5.559 - 5.559
2021 5.559 - 5.559
2022 * 5.559 - 5.559 * Proposed
22

ESTIMATED AVERAGE TAXABLE VALUEOF A HOMESTEADED PROPERTY
Tax Year 2017 2018 2019 2020 * 2021 *
Taxable Value $ 621,277 $ 651,651 $ 654,191 $ 704,611 $ 725,749
Percentage 5.12% 4.89% 0.39% 3.00% 3.00%
Millage Rate 5.559 5.559 5.559 5.559 5.559EstimatedCoral Gables Portion ofProperty Tax 3,454 3,623 3,637 3,917 4,034
Increase 166 169 14 280 117
* Average taxable value based on July 1, 2020 property valuations.
23

ESTIMATED AVERAGE TAXABLE VALUEOF A HOMESTEADED PROPERTY
City Coral Gables Miami Miami Beach Hialeah Key Biscayne
Millage Rate 5.559 7.990 6.0515 6.3018 3.3267
Estimated City Portion ofProperty Tax 4,034 5,791 4,386 4,567 2,411
Difference from Coral Gables - 1,756 351 533 (1,623)
24
Comparison of Full-Service Cities in Miami-Dade County based on average homesteaded value of $725,749

52.8% 52.3% 52.6% 52.3% 52.2% 52.9% 52.1%
34.8% 34.5% 33.5% 33.6% 33.7% 33.0% 33.7%
7.0% 7.6% 8.3% 8.5% 8.8% 8.8% 8.9%
5.5% 5.8% 5.7% 5.6% 5.3% 5.3% 5.2% -
2,000
4,000
6,000
8,000
10,000
12,000
2015 2016 2017 2018 2019 2020 2021
Homestead Residential Non-Homestead ResidentialCommercial All Others
CORAL GABLES PROPERTIES BY TYPE(PROPERTY COUNT 19,963)
25

$31.9$35.2
$37.1 $37.3$39.5 $40.7
$42.2
$21.4 $20.2 $21.2$24.0 $25.4 $26.2 $27.2
$14.2 $15.0 $15.6 $16.4 $17.3 $17.9 $18.6
$5.7 $6.1 $6.2 $6.8 $7.2 $7.5 $7.7
$0$5
$10$15$20$25$30$35$40$45
2015 2016 2017 2018 2019 2020 2021
Mill
ions
Homestead Residential Non-Homestead ResidentialCommercial All Others
PROPERTY TAX REVENUE BY PROPERTY TYPE(TOTAL FY22 PROJECTED PROPERTY TAX REVENUE $95.7M)
26

Homestead Residential42,229,723
44.1%
Non-Homestead Residential27,181,077
28.4%
Commercial18,564,829
19.4%All Others7,744,061
8.1%
PROPERTY TAX REVENUE BY PROPERTY TYPE(TOTAL FY22 PROJECTED PROPERTY TAX REVENUE $95.7M)
27

2.00
3.00
4.00
5.00
6.00
7.00
8.00
9.00
2012 2013 2014 2015 2016 2017 2018 2019 2020 2021
Coral Gables Miami Hialeah Key Biscayne Miami Beach
GOOD
TEN-YEAR MUNICIPAL MILLAGE RATES FOR FULL-SERVICE CITIES BY TAX YEAR
28

RANKING OF MIAMI-DADE/MUNICIPALITY 2020 ADOPTED MILLAGE RATES COMPARED TO CORAL GABLES 2021 PROPOSED MILLAGE RATE
0.0000
5.0000
10.0000
15.0000
20.0000
25.0000
30.0000
11th - Coral Gables
GOOD
29

Coral Gables Regional
School BoardDade County
$.29 per Tax Dollar $95,719,690 5.5590 Mills
$.32 per Tax Dollar$102,596,906 5.9584 Mills
$.02 per Tax Dollar$5,157,051 .2995 Mills
$.37 per Tax Dollar$120,687,049 7.0090 Mills
PROPERTY TAX DISTRIBUTION PER TAX DOLLAR
Property Tax Based on Estimated Taxable Values on July 1, 2021 of $18,125,124,740 at 95% collection. Millage rates for the County, School Board and Regional are prior year rates.
30

$22,945,743 $23,090,720
$25,094,362 $24,183,338 $23,800,003
$22,715,521
$3,273,396 $3,347,274
$2,471,544 $4,052,226 $5,027,013 $6,941,834 $349,692 $432,735
$439,505 $514,275
$597,448
$677,721
$15,000,000
$17,000,000
$19,000,000
$21,000,000
$23,000,000
$25,000,000
$27,000,000
$29,000,000
$31,000,000
$33,000,000
2017 2018 2019 2020 2021 2022
Annual Pension Contributions
Annual Required Contribution Extra Pension Payment FRS/401 Payments
31

57.5% 53.0% 51.6%54.3%
56.6% 59.4% 60.8% 61.7% 63.6% 65.1%68.7%
42.5%47.0% 48.4%
45.7%43.4%
40.6%39.2%
38.3%36.4% 34.9%
31.3%
$15,000,000
$115,000,000
$215,000,000
$315,000,000
$415,000,000
$515,000,000
$615,000,000
$715,000,000
2010 2011 2012 2013 2014 2015 2016 2017 2018 2019 2020
Funding Ratio of Pension Plan
Funded Unfunded
GOOD
32

0%5%10%15%20%25%30%35%40%45%50%55%60%65%70%75%80%85%90%95%100%
$-
$20,000,000
$40,000,000
$60,000,000
$80,000,000
$100,000,000
$120,000,000
$140,000,000
$160,000,000
$180,000,000
$200,000,000
2011 2012 2013 2014 2015 2016 2017 2018 2019 2020 2021
General Fund Reserve Analysis
Total Operating & Debt Service Budget Unrestricted Fund Balance General Fund Reserve %
The City’s reserve policy calculates reserve requirements at 25% of the total operatingbudget, not just 25% of the General Fund. However, the 25% reserve is held in GeneralFund dollars, freeing up other fund balances for investment in capital infrastructure. FY18-FY21 reserves are less than 25% pending FEMA/State/County/Insurance reimbursementsfor Hurricane Irma/CARES/ARPA.
33
A WORLD CLASS CITY WITH A HOMETOWN FEEL
34