second generation logarithmic estimates ofsingle-pool...
TRANSCRIPT
Journal of the American Society of Nephrology 1205
Second Generation Logarithmic Estimates of Single-PoolVariable Volume Kt/V: An Analysis of Error’
John T. Daugirdas2
J.T. Daugirdas. Department of Medicine and Research,
Westside V.A. Medical Center and University of Illinois
at Chicago, Chicago, IL
(J. Am. Soc. Nephrol. 1993; 4:1205-1213)
ABSTRACTThe original formula proposed to estimate variable-volume single-pool (VVSP) Kt/V was Kt/V = -ln(R -0.008 � t - f * UF/W), where in the Kt/V range of 0.7to 1.3, f = 1.0 (* denotes multiplication). This formula
tends to overestimate Kt/V as the Kt/V increasesabove I .3. Because higher Kt/V values are now com-monly delivered, the validity of both the urea gen-
eration term (0.008 � t) and correction for UF/W wereexplored by solving VVSP equations for simulatedhemodialysis situations, with Kt/V ranging from 0.6 to2.6. The analysis led to the development of a sec-ond-generation formula, namely: Kt/V = -ln(R -
0.008 * t) + (4-3.5 � l�) s UF/W. The first and secondgeneration formulas were then used to estimate themodeled VVSP Kt/V in 500 modeling sessions in whichthe Kt/V ranged widely from 0.7 to 2. 1 . An analysis oferror showed that this second-generation formulaeliminated the overestimation of Kt/V in the highranges found with the first-generation formula. Also,total error (absolute value percent error + 2 SD) was
reduced with the second-generation formula. Theseresults led to the proposal of a new formula that canbe used for a very wide range of delivered Kt/V.
Key Words: Urea, kinetic modeling. hemodialysis
T he classical (variable-volume, single-poolIvy SP]) method of urea kinetic modeling as
proposed by Sargent and Gotch (1 ) is based on threemeasurements of plasma urea nitrogen (UN) levels
and on estimates or measurements of dialyzer andresidual renal urea clearances. From the predialysisand postdialysis plasma UN values, a mean plasma
I Received November 2. 1992. Accepted June 16. 1993.2 Correspondence to Dr. J. T. Daugirdas, Department of Research (151), West-
sIde VA Medical Center, Chicago, IL 60612.
1046-6673/0405-1205503.00/0Journal of the American Society of NephrologyCopyright C 1992 by the American Society of Nephrology
UN value during the dialysis session can be esti-mated. This is multiplied by the estimated or meas-
ured dialyzer urea clearance to arrive at the amountof urea removed during the treatment. Once the
amount of urea removed is known, the urea distri-bution volume (V) can be estimated from the predi-abysis and postdialysis plasma UN values. The next
step is to estimate the urea generation rate (g). Oncethe urea distribution volume (V) has been deter-mined, the urea generation rate (�) can be calculated
from the increase in the plasma UN value over theinterdiabytic interval plus the amount of urea cx-creted in the urine. Because urea generation during
the dialysis session will have an effect (albeit a minorone) on the computation of V. simple algebra cannotbe used to solve for V and g. These arc derived by theiterative solution of two equations (1 ,2) that take intoaccount the decrease in urea distribution volume that
occurs during dialysis because of ultrafiltration andthe subsequent increase in V during the interdialyticperiod.
There arc a number of problems with the classicVVSP model, including difficulties in estimating di-
abyzcr urea clearance accurately (3), the need to con-
sider the arteriovenous urea gradient that developsduring dialysis (4), and the effect of postdiabysis re-bound in the plasma urea concentration as the result
of intracellular/extracellubar urea gradients and/orof differences in urea removal from the regional blood
circulations (5). A discussion of these is beyond thescope of this report. Problems with the VVSP ureakinetic model have led to new approaches to ureakinetics on the basis of dialysate urea sampling (6,7)and/or to mubtipoob blood-side modeling (2).
One valuable construct of the urea kinetic model isthe term Kt/V, which is the fractional clearance ofurea (8). If K is the urea clearance and t is time, theterm Kt will be a volume. The ratio of Kt to V willrepresent that part of the urea distribution volume
that has been totally cleared of urea. In the U.S.National Cooperative Dialysis Study, a Kt/V of lessthan 0.8 was associated with a poor outcome (8).Publication of that study greatly increased the inter-est in urea kinetic modeling and in monitoring Kt/V.
Because of the complexity of urea kinetic modeling,a number of shortcut methods of estimating Kt/Vhave been proposed (9-12). According to the ureakinetic modeling equations, Kt/V is determined prim-cipabby by the natural logarithm (ln) of the ratio ofthe postdiabysis to the predialysis plasma UN concen-
Second-Generation Logarithmic Estimates
1206 Volume 4 ‘ Number 5 ‘ 1993
trations R. Thus, Kt/V = -bn(R). Because of ureageneration during dialysis and because of urea re-moval in the course of ultrafiltration (which contrib-
utes to the urea clearance K, but does not affect R),Kt/V computed as -bn(R) will overestimate the Kt/Vderived from three-point VVSP by an average ofabout 1 8% (1 0, 1 3). To correct for this, we proposedderiving a value called R’. R’ was what the value ofR would have been if there had been no urea gener-ation during the dialysis session and if the amount
of urea removed by ultrafiltration was instead re-moved by diffusion dialysis with a fixed, postdialysis
V. R’, then, was always less than the measured value
of R, expressed as follows:
R’ = R - 0.008*t - f*UF/W
where: R is the post/pre plasma UN ratio, t is the
dialysis session length (in hours), f is the “fudgefactor,” UF is the ultrafiltrate volume (in liters), W is
the postdialysis weight (in kilograms), and s denotesmultiplication. The term 0.008 * t represented the �Rvalue during the dialysis session as the result of urea
generation, and the term f * UF/W represented the�R as the result of the additional urea removed dueto volume contraction. Using this information, wederived a highly precise formula for Kt/V that corre-sponded very well with the Kt/V value computed from
three-point VVSP modeling (10,1 1):
Kt/V = -bn(R’)
= -ln(R - 0.008 * t - f * UF/W) (Equation 1)
It was recognized that the correction factor f for UF/W varied as a function of Kt/V. It was proposed thatf be set to 1 .0 in the usual clinical Kt/V range of 0.7to 1 .3, to 1 .25 when Kt/V was less than 0.7, and to
0.75 when Kt/V was more than 1 .3 (1 0). However,Kt/V is not known beforehand, which limits the use-fulness of this approach. Also, high values of Kt/Vare now commonly delivered. For this reason, a moregeneralized formula is needed. The purpose of thisarticle was to derive and test such a formula.
METHODS
Simulated Dialysis Situations
By the use of a spreadsheet, approximately 200simulated dialysis situations were created. A three-
times-a-week dialysis schedule was assumed, andresidual renal urea clearance was set to zero. Diabyzerclearance (K) was kept constant at 200 mL/min.Patient weight was set at 50, 70, or 90 kg. The ureadistribution volume (V) was assumed to be 55% ofthe postdialysis weight. For each “patient,” the di-abysis session length (t) was varied to arrive at Kt/Vvalues of 0.6 through 2.6, in 0.2-U increments. Thepredialysis plasma UN level (CO) was either fixed or
based on the expected steady-state predialysis value
based on the normalized protein catabolic rate (nPCR)and Kt/V. Computation of the steady-state CO wasdone by the use of a two-point single-pool urea kinetic
model (1 4). In the analyses, g was computed from thenPCR (2). based on nPCR values of 0.8, 1 .0, or 1 .2 g/kg per day. The ultrafiltrate volume during dialysiswas set to zero (negligibly low) or to 1 , 2, 3, or 4 L.Thus, these simulations included most clinical situ-
ations encountered when a three-times-a-week treat-
ment schedule is delivered.
Effect of Urea Generation (g) on the Post/Pre-Ratio (R)
Equations derived from “classic” three-point, ureakinetic modeling (2) were used to derive, in eachsimulated patient, a value for the postdialysis plasmaUN concentration (Ct):
Ct = CO(Vt/VO) ((K-U)/U) +
(g/K-U)) * (1 - (Vt/VO) ((K-U)/U)
Where Ct is the postdialysis plasma UN level (inmilligrams per milliliter), CO is the initial plasma UN
level (in milligrams per milliliter), Vt is the postdi-abysis urea distribution volume (in milliliters), VO isthe prediabysis urea distribution volume (in milli-biters), K is the dialyzer clearance (in milliliters perminute), U is the ultrafiltration rate (in milliliters perminute), g is the urea generation rate (in milligramsper minute), and represents exponentiation. Ct wascomputed both when g = 0 and when g corresponded
to nPCR values of 0.8, 1 .0, and 1 .2 g/kg per day. U,the ultrafiltration rate in milliliters per minute, wasvaried to corresponding UF values of 1 , 2, 3, 4, and5 L removed per session.
To derive the effect of g on � z�R was computedby use of the following equation:
�R = (Ct� - Ct�..0)/CO
The manner in which �R varied as a function of
dialysis session length (t), CO. and nPCR was thenexplored by graphing and regression analysis.
Effect of UF/W
In these simulations, g was set to zero. The effectof UF/W was explored in the context of two estima-tion equations:
Kt/V = -ln (R - fi * UF/W) (Equation 2)
Kt/V = -ln (R) + f2 * UF/W (Equation 3)
In the first approach, (Equation 2), a corrected valuefor R is computed, namely, (R-fi *UF/�T). This termrepresents the value of R that would have beenachieved if the same amount of Kt/V had been dcliv-

Co = 75 mg/dl
0 .1 2 3 4 5 6 7 8
Daugirdas
Journal of the American Society of Nephrology 1207
cred without volume contraction. In the second ap-proach (Equation 3), the volume contraction compo-nent of Kt/V is estimated separately, as f2 #{149}UF/W,
and this term is added to the Kt/V obtained fromdiffusion dialysis, -ln(R). The effect of Kt/V and Ron fl and f2 was explored by graphing, and regres-sion lines were computed for fl and f2 versus R.
In Vivo Validation
The simulation analysis (see Results) suggested
that a new formula would be even more precise and
would have less systematic error:
Kt/V = -ln(R - 0.008 * t)
+ (4-3.5 * R) * UF/W (Equation 4)
This equation was used to estimate Kt/V in a large
population (N = 500) of three-times-a-week dialysissessions in 374 patients, in which the Kt/V rangedwidely from 0.7 to 2. 1 . For purposes of analysis, 160sessions in which the Kt/V was above 1 .4 were ama-lyzed separately, because this is the range in whichEquation 1 , - ln (R - 0.008 s � - f * UF/W), was cx-
pected to have problems. To avoid a step function inthe values for f, Equation 1 was evaluated twice,once with f = 1 .0 and once with f = 0.75 for theentire Kt/V range. The Kt/V as determined by VVSPthree-point modeling (2) was compared with the Kt/V value estimated from variations of Equations 1 and
4. The modeled Kt/V values were divided into
subgroups 0. 1 Kt/V unit wide; for each subgroup, themean ± SD percent error of the estimate, as well asthe absolute value of the mean percent error, wascomputed. The total error was calculated as I percent
errorl + 2 SD. This method of comparison has beenshown to be more valid than regression analysis(1 5, 1 6). Statistical comparison among the different
formulas was by regression analysis and by paired t
testing.In the “low Kt/V” group of 340 modeling sessions,
the mean Kt/V was 1 .03 ± 0. 19 (SD). The meandiabyzer blood water urea clearance was 1 96 ± 34mL/min. The mean patient weight was 69 ± 1 1 kg,
and the mean ratio of V/W was 0.56 ± 08. In the“high Kt/V group” of 1 60 modeling sessions, the
mean Kt/V was 1 .6 1 . The mean dialyzer blood waterurea clearance was 235 ± 23, the mean patientweight was 61 ± 9.65 kg, and the mean ratio of V/Wwas 0.54 ± 0.09.
RESULTS
Simulation Studies: Effect of Dialysis SessionLength (t) on R
The effect of urea generation on R will be deter-mined primarily by the length of the dialysis session
(t). As t increases, the total amount of urea generatedwill be increased, and the effect on Ct and R will bemore pronounced. For example, if a Kt/V of 1 .0 is
delivered in 6 h, Ct and therefore R will be higherthan if a Kt/V of 1 .0 is delivered in 2 h. Although
time is the main factor, the effect of t on R alsodepends on whether g is high or low. In Figure 1 , theeffect of g, expressed as nPCR, is shown. When nPCR
is high, there will be more urea generated per unit
time, and Ct, as well as R, will be higher than cx-pected. On the other hand, when g is bow, the effectof g on R will be less, and the regression curve of �\Rversus time will have a lower profile.
In Figure 1 , the value for CO was kept constant at75 mg/dL. In Figure 2, we explore the effect of CO onthe relationship between dialysis session length (t)
and �.R. High values of CO will dampen the effect oft on R. This can be understood intuitively: assumethat g is such that, in the absence of dialysis, the
amount of urea produced would raise the plasma urealevel by 4 mg/dL over 4 h. This amount of ureageneration will have much less effect on Ct/CO when
CO is 200 mg/dL than when CO is 20 mg/dL. In thesimulations used to derive Figure 2, CO was variedwhereas g was held constant, corresponding to an
nPCR of 1 .0 g/kg per day.From Figures 1 and 2 together, an interesting in-
sight is obtained: high values of g magnify the effectof dialysis session length on �R, whereas high valuesof CO dampen the effect. Because g and CO are usu-ally correlated, their effects tend to cancel. This is
shown by the graph in Figure 3. In this figure, the
same simulation points as those in Figures 1 and 2were used, except that the value for CO used de-
0.08
00
a’
� 0.040.02
0.00
Dialysis session length (t, hours)
Figure 1. The effect of dialysis session length in hours (t) on�R. The effect is modulated by the value of g (expressedas nPCR). CO was fixed at 75 mg/dL.
0.06

00
a’
0
0Aa’
.4-,
0
0.08
0.06
0.04
0.02
0.00
nPCR = 1.0 g/kg/day
0 1 2 3 4 5 6 7 8
- Y = 0.008* t
---Y=0.03
0 nPCR
. nPCR
0 nPCR
00
a’
0
0Aa’
0
= 0.8 g/kg/day
= 1.0 g/kg/day
= 1.2 g/kg/day
0.12
0.10
0.08
0.06
0.04
0.02
0.00
Co = f(nPCR, Kt/V)
1.4
1 .3
1 .2
1 .1
1 .0
9-
0.9
0.8
0.7
0.6
0.5
0.40.50 0.75 1.00 1.25 1.50 1.75 2.00 2.25 2.50
Second-Generation Logarithmic Estimates
1208 Volume 4 ‘ Number 5 ‘ 1993
Dialysis session length (t, hours)
Figure 2. The effect of dialysis session length (t) on �R. Thistime, g was fixed and CO was varied. It can be seen that�R is dampened at high values for CO and exaggerated atlow values of CO.
2 3 4 5 6 7 8
Dialysis session length (t, hours)
Figure 3. Effect of dialysis session length (I) on �R when COand g are linked. CO was set at the steady-state valueexpected for each datum point based on Kt/V and nPCR,using a two-point VVSP urea kinetic model. Because g andCO have opposite effects on �R, when CO and g tend torise and fall in tandem, their combined effect �R is reducedand the principal variance of �\R is now the dialysis sessionlength (t). The modeling line of 0.008 s t selected wasslightly lower than the ideal regression line in order tominimize overestimation of Kt/V.
pended on nPCR and Kt/V (the computation was by
two-point VVSP modeling [1 4]). In Figure 3, thosepoints in which g was high had relatively high valuesof CO. and those points in which g was low had
relatively low values of CO. As a result, the effect ofdialysis session length on z�R is now largely mdc-
pendent of CO and g and can be expressed simply as0.008 * t. A point aside: in some versions of Equation1 , we have chosen to simplify 0.008 * t as 0.03, which
assumes an average dialysis session length of 3.5 to4.0 h.
The Effect of UF/W on R and Kt/V: ComparingEquation 2 With Equation 3 and DerivingRobust Values for fi and f2
Figure 4 presents the values of fl (Equation 2)necessary to arrive at a correct Kt/V value for eachsimulation point. In these simulations, g was setequal to zero. It is evident that fi = 1 when Kt/V is
close to 1 .0. The optimal value for fi is 0.75 whenKt/V is close to 1 .5. This is the basis of our previously
advocated Equation 1 (10). Because the modeled Kt/V is not known, the fi values from Figure 4 were
repbotted against the predicted R (Figure 5). The data
suggest that fi could be approximated beforehand as1 .9 * R + 0.2 and that a more general form of Equa-tion 1 would be:
Kt/V = -bn (R - 0.008 * t
- (1.9 * R+ 0.2) * UF/W) (Eq. la)
Kt/V = -ln(R - fi * UF/W)
- �S\
I I s;-
- Ic - - -
- tc� - -
Ni
Kt/V
Figure 4. Effect of Kt/V on fi by the use of Equation 2 (seetext). It can be seen that the value of fi is close to I whenO.7<Kt/V< 1.3.
Kt/V = -In (R - fi * UF/W) Kt/V= -ln(R)+f2*UF/W
(N9-
0.1 0.2 0.3 0.4 0.5 0.6
1.4
1 .2
1 .0
‘-. 0.8‘4-
0.6
0.4
0.2
0.00.0
R (Ct/Co)
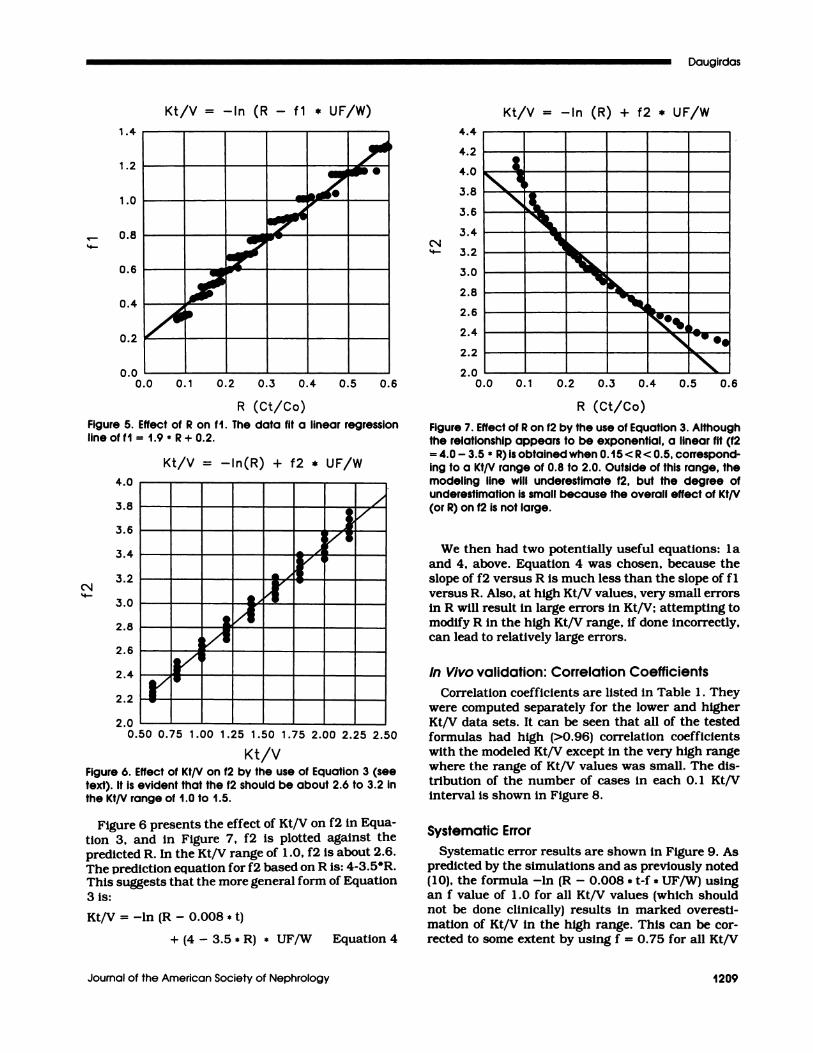
Figure 5. Effect of R on fi . The data fit a linear regressionlineoffl = 1.9 * R+ 0.2.
Kt/V = -ln(R) + f2 * UF/W
4.0
3.8
3.6
3.4
3.2(N‘4-
3.0
2.8
2.6
2.4
2.2
2.00.50 0.75 1.00 1.25 1.50 1.75 2.00 2.25 2.50
R (Ct/Co)
Daugirdas
Journal of the American Society of Nephrology 1209
Kt/V
Figure 6. Effect of Kt/V on f2 by the use of Equation 3 (seetext). It is evident that the f2 should be about 2.6 to 3.2 inthe Kt/V range of 1.0 to 1.5.
Figure 6 presents the effect of Kt/V on f2 in Equa-tion 3, and in Figure 7, f2 is plotted against thepredicted R. In the Kt/V range of 1 .0, f2 is about 2.6.The prediction equation for f2 based on R is: 4-3.5R.This suggests that the more general form of Equation3 is:
Kt/V = -bn (R - 0.008 * t)
+ (4 - 3.5 * R) * UF/W Equation 4
Figure 7. Effect of P on f2 by the use of Equation 3. Althoughthe relationship appears to be exponential, a linear fit (f2= 4.0 - 3.5 * R) is obtained when 0. 15 < R < 0.5, correspond-ing to a Kt/V range of 0.8 to 2.0. Outside of this range, themodeling line will underestimate f2, but the degree ofunderestimation is small because the overall effect of Kt/V(or R) on f2 is not large.
We then had two potentially useful equations: la
and 4, above. Equation 4 was chosen, because theslope of f2 versus R is much less than the slope of fiversus R. Also, at high Kt/V values, very small errorsin R will result in barge errors in Kt/V; attempting tomodify R in the high Kt/V range, if done incorrectly,can lead to relatively large errors.
In Vivo validation: Correlation Coefficients
Correlation coefficients are listed in Table 1 . Theywere computed separately for the lower and higher
Kt/V data sets. It can be seen that all of the testedformulas had high (>0.96) correlation coefficientswith the modeled Kt/V except in the very high rangewhere the range of Kt/V values was small. The dis-tribution of the number of cases in each 0. 1 Kt/Vinterval is shown in Figure 8.
Systematic Error
Systematic error results are shown in Figure 9. Aspredicted by the simulations and as previously noted(10). the formula -bn (R - 0.008 * t-f s UF/W) usingan f value of 1 .0 for all Kt/V values (which shouldnot be done clinically) results in marked overesti-
mation of Kt/V in the high range. This can be cor-rected to some extent by using f = 0.75 for all Kt/V
U)Q)U)a0
0
C
70
60
50
40
30
20
10
0
12
10
z 8
LU� 6
4- 40.� 0
a)� -2a)
0�
-6
0.5 1.0 1.2 1.4 1.6 1.8 2.0 0.6 0.8 1.0 1.2 1.4 1.6 1.8 2.0
Second-Generation Logarithmic Estimates
1210 Volume 4 #{149}Number 5 ‘ 1993
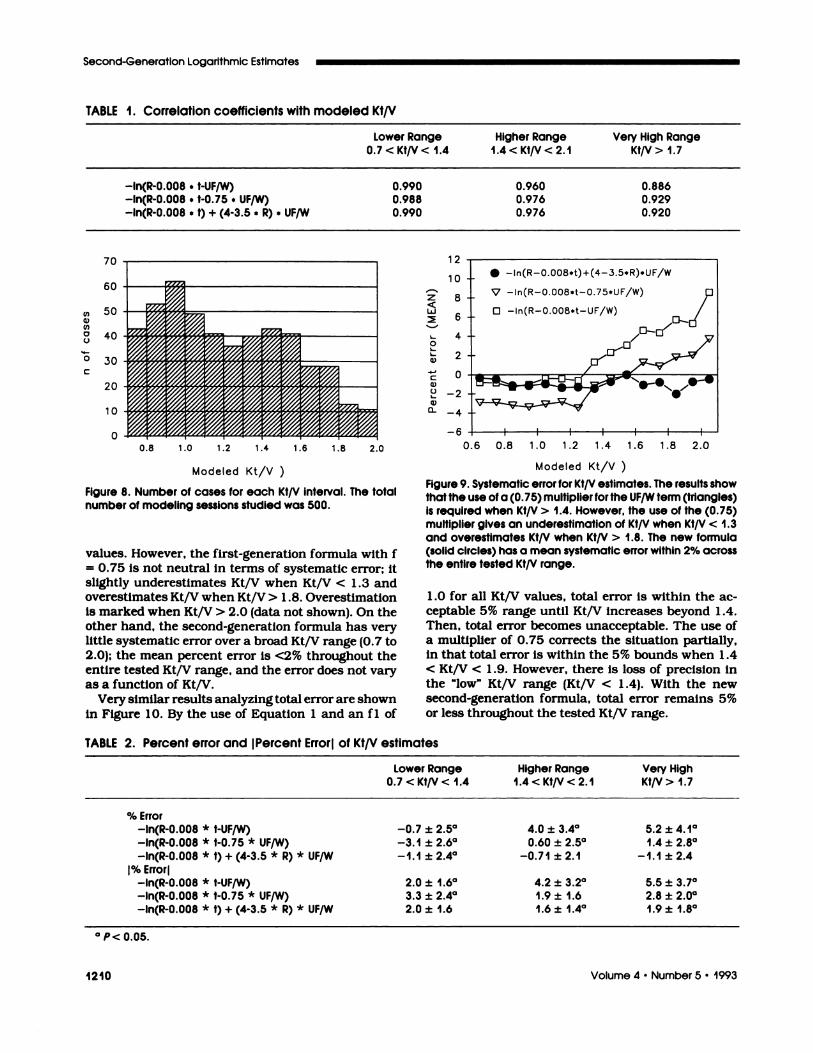
TABLE I . Correlation coefficients with modeled Kt/V
Lower RangeO.7<Kt/V<1.4
Higher Range1.4<Kt/V<2.1
Very High RangeKt/V>1.7
-ln(R-O.0O8 � t-UF/W) 0.990 0.960 0.886-ln(R-O.O08 * t-O.75 s UF/W) 0.988 0.976 0.929-In(R-O.O08 a t) + (4-3.5 a R) a UF/W 0.990 0.976 0.920
Modeled Kt/V
Figure 8. Number of cases for each Kt/V interval. The total
number of modeling sessions studied was 500.
values. However, the first-generation formula with f= 0.75 is not neutral in terms of systematic error; itslightly underestimates Kt/V when Kt/V < 1 .3 andoverestimates Kt/V when Kt/V > 1 .8. Overestimationis marked when Kt/V > 2.0 (data not shown). On theother hand, the second-generation formula has very
little systematic error over a broad Kt/V range (0.7 to2.0); the mean percent error is <2% throughout theentire tested Kt/V range, and the error does not varyas a function of Kt/V.
Very similar results analyzing total error are shownin Figure 10. By the use of Equation 1 and an fi of
Modeled Kt/V
Figure 9. Systematic error for KtJV estimates. The results showthatthe use ofa(O.75)multiplierforthe UF/W term (triangles)is required when Kt/V > 1.4. However, the use of the (0.75)multiplier gives an underestimation of Kt/V when Kt/V < 1.3and overestimates Kt/V when Kt/V > 1.8. The new formula(solid circles) has a mean systematic error within 2% acrossthe entire tested Kt/V range.
1 .0 for all Kt/V values, total error is within the ac-
ceptable 5% range until Kt/V increases beyond 1.4.Then, total error becomes unacceptable. The use ofa multiplier of 0.75 corrects the situation partially,in that total error is within the 5% bounds when 1.4< Kt/V < 1 .9. However, there is loss of precision inthe “low” Kt/V range (Kt/V < 1 .4). With the newsecond-generation formula, total error remains 5%
or bess throughout the tested Kt/V range.
TABLE 2. Percent error and Percent Errorl of Kt/V estimates
Lower Range0.7 < Kt/V < I.4
Higher Range1.4 < Kt/V < 2. 1
Very HighKt/V > I.7
% Error
-ln(R-O.0O8 * t-UF/W) -0.7 ± 2.5#{176} 4.0 ± 3.4#{176} 5.2 ± 4.1#{176}-ln(R-O.0O8 * t-O.75 * UF/W) -3.1 ± 2.6#{176} 0.60 ± 2.5#{176} 1.4 ± 2.8#{176}-ln(R-O.OO8 * t)+(4-3.5 * R) * UF/W -1.1 ± 2.4#{176} -0.71 ± 2.1 -1,1 ± 2.4
1% Errorl-ln(R-O.OO8 * t-UF/W) 2.0 ± 1.6#{176} 4.2 ± 3.2#{176} 5.5 ± 3.7#{176}-ln(R-O.0O8 * t-O.75 * UF/W) 3.3 ± 2.4#{176} 1.9 ± 1.6 2.8 ± 2.0#{176}
-ln(R-O.0O8 * t) + (4-3.5 * R) * UF/W 2.0 ± 1.6 1.6 ± 1.4#{176} 1.9 ± 1.8#{176}
#{176}P< 0.05.

0
a)
Ca)
I- (/)
-+
a) C� a
-ba)>Ea)
0U)�0
20
15
10
5
0
UF/W,.,�000
0000
0.6 0.8 1.0 1.2 1.4 1.6 1.8 2.0
0.2 0.3 0.4 0.5 0.6 0.7 0.8
z
LU
:�
0
a)
Ca)0
a)
0�
30
20
10
0
-10
-20
-30
A
0.6 0.8 1.0 1.2 1.4 1.6 1.8 2.0 2.2
Modeled Kt/V
Figure 12. Systematic error of two commonly used linearformulas based on PRU (percent reduction in urea). Notethatthe yaxis scale is threefold higher than in Figure 9. Withthese two formulas, systematic error is large and stronglydependent on the level of Kt/V. The formula of Basile et a!.(12) has much less error than the equation advocated byJindal eta!. (9), buttheformula of Basile et a!. overestimatesKt/V in the critical area of Kt/V < 1.0.
Daugirdas
Journal of the American Society of Nephrology 1211
Modeled Kt/V
Figure 10. Total error (95% confidence band) for first- andsecond-generation Kt/V estimates. The benefits of using anf multiplier of 0.75 in the high Kt/V range (triangles) areapparent. The second-generation formula (solid circles)has a total error within 5% across the entire tested Kt/Vrange.
DISCUSSION
Our results lead to a new formula for estimatingKt/V, useful especially in units where high Kt/V
amounts are routinely delivered. The formula is morecomplex than before, but it still can be calculated atthe bedside and requires only a calculator capable ofcomputing natural logarithms. The formula has beenput into the form of a nomogram (Figure 1 1 ) for easyuse. We emphasize our previous recommendation
that the formula -ln(R - 0.008 a t-UF/W) (assumingf = 1 .0 and dropping the term) should not be usedwhen delivered Kt/V values routinely exceed 1 .3 to1 .4. A reasonable solution is to use the formula -bn
(R - 0.008 a t - 0.75 a UF/W) as the standard, giventhe trend to deliver high Kt/V values. However, evenless systematic error results when the new second-generation equation is used.
How do these formulas compare with others com-monby advocated to estimate the Kt/V? For compari-son purposes, Figures 1 2 and 1 3 analyze the error of
two linear formulas, as advocated by Jindal et al. (9)and by Basile and colleagues (12). It is evident that
these formulas arc far less precise and, more impor-tantly, that error is not constant but varies with thelevel of Kt/V.
“Bedside” estimations of Kt/V have been criticizedfrom several points of view. Some say that Kt/V is aneedless construct and that adequate morbidity/mor-tality information can be obtained by use of the Ct/CO ratio (or the urea reduction ratio equal to 1 -Ct/CO)(17). However, in patients with minimal residual
renal function, knowledge of Kt/V allows the use ofa nomogram to estimate the nPCR (2). Furthermore,much clinical information has been obtained in
2.0
1.9
> 1.8
� 1.7
� 1.6
E 1.3.;( 1.2
0L. 1.1a-a- 1.0
< 0.9
0.8
0.7
0.6
0.5
liii ii iii iii ii
E EEE�E�_�Ct/CO (R)
Figure 1 1 . A nomogram based on the formula Kt/V = -In(R - 0.03) + (4 - 3.5 a R) a UF/W. In most cases, the curvecorresponding to a UF/W of 0.03 (heavy line) should beused. Find R on the x axis, move up to the proper UF/Wcurve, and read Kt/V off the y axis.
� 0.O4aPRU-1.2 (Jindol)
0 0.O23aPRU-0.284 (Bosile)

0(1)N+
zLU
0
a)
Ca)0
a)0�
a):�a>
0Cl)
.0
40
35
30
25
20
15
10
5
0
0.6 0.8 1.0 1.2 1.4 1.6 1.8 2.0 2.2
rate. Once K is known, the modeled V can be com-
puted from the “bedside” Kt/V, the nomogram-de-rivcd K, and t (18).
A final critique has to do with precision versusaccuracy. Although the formulas described may veryprecisely predict the value of Kt/V derived from VVSP
modeling. the accuracy of single-pool modeling hasbeen cabled into question, especially for modelinghigh-efficiency, short-session-length treatments. Tocompensate for this, two-pool blood-sided modeling4echniques and methods that depend on dialysateurea determination have been developed. In thesesituations, the bedside formulas described here canstill be used, but the postdiabysis urea sample should
be drawn 30 mm after dialysis (7,19).In summary, a second-generation formula is pro-
posed to estimate Kt/V by the VVSP approach. Thisnew formula can be used across a wide range of Kt/V values.
REFERENCES
1 . Sargent J, Gotch F. Principles and biophysicsof dialysis. In: Drukkcr W, Parsons F, Maher J,Eds. Replacement of Renal Function by Dialysis.2nd Ed. The Hague: Martinues Nijhoff; 1985:53.
2. Gotch F. Kinetic modeling in hemodiabysis. In:Nissenson AR, Fine RN, Gentile DE, Eds. ClinicalDialysis. 2nd Ed. Norwalk: Appleton Century-Crofts; 1989:
3. Saha LK, Van Stone JC: Differences betweenKt/V measuring during dialysis and Kt/V pre-dicted from manufacturer clearance data. Int JArtif Organs 1 992; 15:447-504.
4. SChneditZ D, Kaufman AM, Polaschegg H,Levizi NW, Daugirdas JT: Cardiopulmonary re-circulation during hemodiabysis. Kidney Int1992;42: 1450-1456.
5. Schneditz D, Van Stone JC, Daugirdas JT: Aregional blood circulation alternative to in-seriestwo compartment urea kinetic modeling. ASAIOJ 1993:M573-M577.
6. Buur T, Larsson R: Accuracy of hemodialysisurea kinetic modeling. Comparison of differentmodels. Ncphron 1991;59:358-363.
7. Keshaviah P, Ebben J, Luhring D, Emerson P.Collins A: Clinical evaluation of a new on-linemonitor of dialysis adequacy. J Am Soc Nephrol1992;3:374.
8. Gotch FA, Sargent JA: A mechanistic analysisof the National Cooperative Dialysis Study(NCDS). Kidney Int 1985;28:526-534.
9. Jindal KK, Manuel A, Goldstein MB: Percentreduction in blood urea concentration during he-modialysis (PRU). Trans Am Soc Artif InternOrgans 1987;33:286-288.
10. Daugirdas JT: The post:pre-dialysis plasmaurea nitrogen ratio to estimate Kt/V and NPCR:Mathematical modeling. Int J Artif Organs1989;12:41 1-419.
1 1 . Daugirdas JT: The post:pre-dialysis plasmaurea nitrogen ratio to estimate Kt/V and NPCR:Validation. Int J Artif Organs 1 989; 12:420-427.
1 2. Basile C, Casino F, Lopez T: Percent reduction
Second-Generation Logarithmic Estimates
1212 Volume 4 ‘ Number 5 ‘ 1993
Modeled Kt/V
Figure 13. Total error (95% confidence band) of two com-monly used linear formulas. The yaxis scale is twofold higherthan in Figure 10. Total error is never reduced to the desir-able 5% range at any level of Kt/V, and total error is highlydependent on the level of Kt/V. PRU, percent reduction inurea.
terms of the VVSP-dcrived Kt/V, and thus, there isclinical value in knowing the Kt/V per se.
Another criticism is that by not modeling V. oneloses the opportunity to identify problem dialysis
sessions, in which the modeled V deviates markedlyfrom the V derived by nomogram. For example, sup-pose that a given modeling session revealed a Kt/V
of 1 .5 and a modeled V of 20 L in an 80-kg patient.The fact that the modeled V is only 25% of the body
weight does not make sense and immediately identi-fics the value for Kt/V as probable artifact. Theresults point to a laboratory error in measuring
serum UN or to a mistake in the drawing of the blood(e.g. , from the venous line). The use of even a veryprecise bedside formula would generate a similar Kt/
V value but would not flag it as a possible error.
Similarly, if two similar dialysis treatments givewidely different Kt/V values, an analysis of the mod-
eled V can help determine which of the two values ismore likely to be correct. For this reason, bedsidetechniques arc best suited for the rapid estimation ofKt/V when a computerized analysis is not available
or for monitoring dialysis delivery in units, programs,
or nationwide by external auditing agencies. In de-fense of our bedside formula, however, it is not dif-ficubt to obtain a modeled V manually. Two further
nomograms are required: one to estimate the diabyzermass transfer urea coefficient from factory-suppliedclearance data and another to estimate the in vivodialyzer clearance K based on dialyzer urea masstransfer area coefficient (K0A) and the blood flow

Daugirdas
Journal of the American Society of Nephrology 1213
in blood urea concentration during dialysis esti-mates Kt/V in a simple and accurate way. Am JKidney Dis 199O;15:40-45.
1 3. Delmez JA, Windus DW: Hemodialysis prescrip-tion and delivery in a metropolitan community.The St. Louis Nephrobogy Study Group. Kidneymt 1992;41:1023-1O28.
1 4. Depner TA, Cheer AY: Modeling urea kineticswith two vs. three BUN measurements: A criticalcomparison. Trans Am Soc Artif Intern Organs1 989;35:499-5O2.
1 5. Bland JM, Altman DG: Statistical methods forassessing agreement between two methods ofclinical measurement. Lancet 1 986; 1 :307-310.
16. Levene H. Robust tests for equality of variance.
In: 01km I, Ed. Contributions to Probability andStatistics. Palo Alto: Stanford University Press;1960:278-292.
1 7. Lowrie EG, Lew NL, Liu Y: The effect of differ-ences in urea reduction ratio (URR) on death riskin hemodiabysis patients: A preliminary analy-sis. Memo to National Medical Care DSD MedicalDirectors. 1 99 1 ;Novcmber 5: 1 -13.
1 8. Daugirdas JT, Depner TA: A nomogram ap-proach to hemodialysis urea modeling. Am JKidney Dis 1 994, in press.
19. Depner TE, Cheer A, Vedantham R: Is two-compartment modeling required for high-fluxhemodialysis lAbstract]? J Am Soc Nephrol1990; 1:354.