second quarter 2015 results - csav csav reported a profit of mmus$ 9.1 for the second quarter of...
TRANSCRIPT
Second Quarter 2015 Results August 2015
Agenda
1. Highlights
2. Market Situation
3. Second Quarter Results
4. Cash Position
5. Outlook
Highlights
CSAV reported a profit of MMUS$ 9.1 for the second quarter of 2015, an improvement of MMUS$ 67.6 compared to the loss of MMUS$ 58.5 reported for the same quarter in 2014, and a decrease of MMUS$ 61.8 with respect to the profit of MMUS$ 70.9 posted for the first quarter of 2015.
The second quarter earnings are explained mainly by the profit of MMUS$ 19.5 from the investment in Hapag-Lloyd AG (HLAG), which was partially offset by the tax expense of MMUS$ 12.9 related mostly to the effects of the variation in the euro exchange rate on the financing structure between CSAV and the Group subsidiaries associated with the investment in HLAG. CSAV's container shipping operations posted a loss of MMUS$ 51.4 for the same period in 2014 (accounted for as discontinued operations).
CSAV's other transport services (other than container shipping) reported a loss before-taxes of MMUS$ 2.1 for the second quarter of 2015, marking a slight improvement over the first quarter of 2015. This loss, however, compares positively to the loss of MMUS$ 20.3 recorded for the second quarter of the prior year.
4
Highlights
Thanks to cost cutting and fleet flexibility programs being implemented by CSAV, the Company has been able to partially mitigate the negative impacts of the reduced demand for vehicle transport observed since 2014.
In order to improve its financing structure, on August 11, 2015, the Company informed the prepayment of its outstanding UF bonds in full. The balance payable will be UF 1,044,643, plus unpaid interest accrued as of September 10, 2015. On August 10, 2015, CSAV subscribed a credit facility with Banco Itaú Chile for MMUS$ 45.0, which will be used mainly for the bond prepayment mentioned above.
5

Containership Fleet Graph 2: Idle Fleet: 377,000 TEU or 1.9% (August 2015)
Source: Clarkson
Graph 1: Orderbook / Fleet: 21,2% (August 2015)
7
Graph 3: Scrap Evolution (August 2015)
Source: Alphaliner
Source: Alphaliner
0%10%20%30%40%50%60%70%80%90%
0
5
10
15
20
25
199
619
97
199
819
99
200
020
01
200
220
03
200
420
05
200
620
07
200
820
09
201
020
11
201
220
13
201
420
15
Ord
erbo
ok/Flee
t
Mill
ion
Te
us
Fleet Orderbook Orderbook to Fleet Ratio
0%
2%
4%
6%
8%
10%
12%
14%
16%
0
200
400
600
800
1.000
1.200
1.400
1.600
Oct
/08
Feb
/09
May
/09
Sep
/09
Dec
/09
Ap
r/10
Jul/
10
Oct
/10
Jan
/11
May
/11
Au
g/1
1
No
v/1
1
Feb
/12
Jun
/12
Sep
/12
Dec
/12
Mar
/13
Jul/
13
Oct
/13
Jan
/14
Ap
r/14
Jul/
14
No
v/1
4
Feb
/15
May
/15
% o
f Total Flee
t
Idle
Cap
acit
y in
Th
. Te
us
Idle Fleet % of Total Fleet
20
22
24
26
28
30
0
100
200
300
400
500
20
00
20
01
20
02
20
03
20
04
20
05
20
06
20
07
20
08
20
09
20
10
20
11
20
12
20
13
20
14
20
15
(8m
)
AV
erage
Age
(years)
Th. T
eu
s
Scrap Other Deletions Average Age

0
200
400
600
800
1.000
1.200
1.400
1.600
1.800
Dec
-09
Ap
r-1
0
Au
g-1
0
Dec
-10
Ap
r-1
1
Au
g-1
1
Dec
-11
Ap
r-1
2
Au
g-1
2
Dec
-12
Ap
r-1
3
Au
g-1
3
Dec
-13
Ap
r-1
4
Au
g-1
4
Dec
-14
Ap
r-1
5
SCFI -RTM Margin Rotterdam Platts SCFI
Market Evolution Graph 4: SCFI vs Rotterdam Platts
Average Margin 2010 = 918
Average Margin 2011 = 392
Source: SCFI, Platts.
Average Margin 2012 = 605
8
Average Margin 2013 = 480
Average Margin 2014 = 536
Margin Jan-Jun
2010 938
2011 454
2012 583
2013 508
2014 501
2015 541
Average Margin H1´15= 541
Notes: (1) SCFI – RTM Margin is only referential since fuel oil consumption
per TEU may vary depending on the trade and on the vessel efficiency
(2) The SCFI index includes: Spot rates for Main Haul trades exports from Shanghai

237 273
249 210
120 106
24
22
17
14
9 7
0
50
100
150
200
250
300
350
H1'12 H1'13 H1'14 H1'15 Q2'14 Q2'15
Tho
usa
nd
of
Ve
hic
les
Light Vehicles Heavy Vehicles
Market Evolution
9
Source: ANAC (Chile) and ARAPER (Perú)
Graph 5: Vehicles Sales Evolution (Chile and Perú)
-16%
-12%

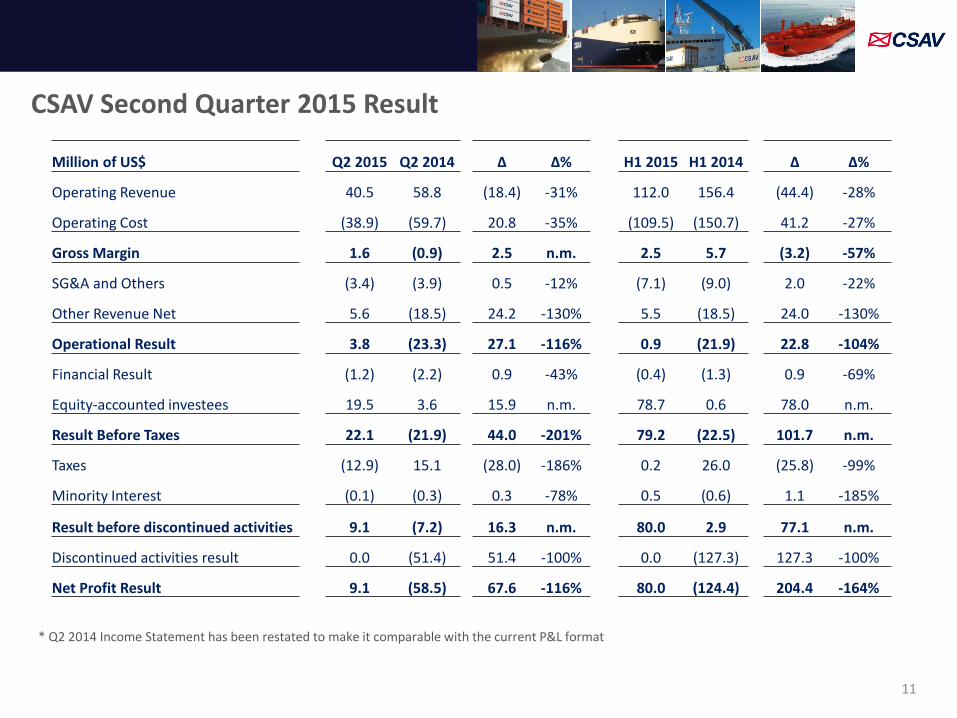
CSAV Second Quarter 2015 Result
11
* Q2 2014 Income Statement has been restated to make it comparable with the current P&L format
Million of US$ Q2 2015 Q2 2014 ∆ ∆% H1 2015 H1 2014 ∆ ∆%
Operating Revenue 40.5 58.8 (18.4) -31% 112.0 156.4 (44.4) -28%
Operating Cost (38.9) (59.7) 20.8 -35% (109.5) (150.7) 41.2 -27%
Gross Margin 1.6 (0.9) 2.5 n.m. 2.5 5.7 (3.2) -57%
SG&A and Others (3.4) (3.9) 0.5 -12% (7.1) (9.0) 2.0 -22%
Other Revenue Net 5.6 (18.5) 24.2 -130% 5.5 (18.5) 24.0 -130%
Operational Result 3.8 (23.3) 27.1 -116% 0.9 (21.9) 22.8 -104%
Financial Result (1.2) (2.2) 0.9 -43% (0.4) (1.3) 0.9 -69%
Equity-accounted investees 19.5 3.6 15.9 n.m. 78.7 0.6 78.0 n.m.
Result Before Taxes 22.1 (21.9) 44.0 -201% 79.2 (22.5) 101.7 n.m.
Taxes (12.9) 15.1 (28.0) -186% 0.2 26.0 (25.8) -99%
Minority Interest (0.1) (0.3) 0.3 -78% 0.5 (0.6) 1.1 -185%
Result before discontinued activities 9.1 (7.2) 16.3 n.m. 80.0 2.9 77.1 n.m.
Discontinued activities result 0.0 (51.4) 51.4 -100% 0.0 (127.3) 127.3 -100%
Net Profit Result 9.1 (58.5) 67.6 -116% 80.0 (124.4) 204.4 -164%
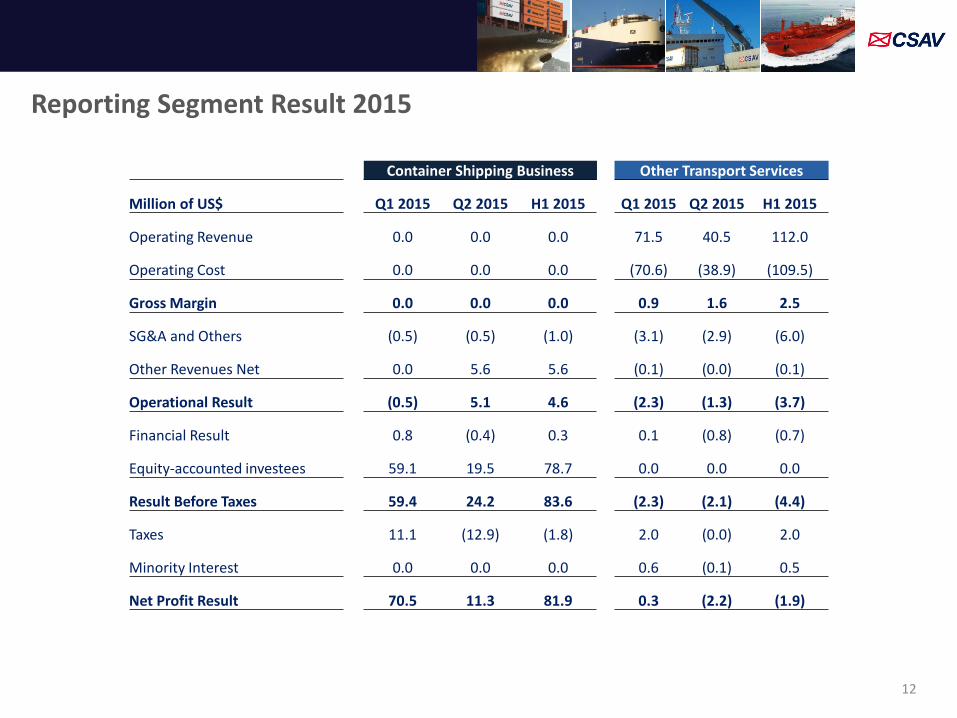
Reporting Segment Result 2015
12
Container Shipping Business Other Transport Services
Million of US$ Q1 2015 Q2 2015 H1 2015 Q1 2015 Q2 2015 H1 2015
Operating Revenue 0.0 0.0 0.0 71.5 40.5 112.0
Operating Cost 0.0 0.0 0.0 (70.6) (38.9) (109.5)
Gross Margin 0.0 0.0 0.0 0.9 1.6 2.5
SG&A and Others (0.5) (0.5) (1.0) (3.1) (2.9) (6.0)
Other Revenues Net 0.0 5.6 5.6 (0.1) (0.0) (0.1)
Operational Result (0.5) 5.1 4.6 (2.3) (1.3) (3.7)
Financial Result 0.8 (0.4) 0.3 0.1 (0.8) (0.7)
Equity-accounted investees 59.1 19.5 78.7 0.0 0.0 0.0
Result Before Taxes 59.4 24.2 83.6 (2.3) (2.1) (4.4)
Taxes 11.1 (12.9) (1.8) 2.0 (0.0) 2.0
Minority Interest 0.0 0.0 0.0 0.6 (0.1) 0.5
Net Profit Result 70.5 11.3 81.9 0.3 (2.2) (1.9)
Hapag-Lloyd H1 2015 Result
For more details on HLAG´s results please visit IR Section of HLAG website
– http://www.hapag-lloyd.com/en/investor_relations/overview.html
13

Cash Position
Graph 6: Cash Position (USD million)
15
72.8
-1.2
-18.4 -2.3 -0.4
50.6
Cash 31-Mar-15 EBITDA Working Capital andUse of Provisions
Investment Cash Flow Financing Cash Flow Cash 30-Jun-15
* EBITDA index does not include MMUSD$ 5.6 of reversed liabilities associated to the closing of the transaction with HLAG
*


0
200
400
600
800
1.000
1.200
1.400
1.600
1.800
Dec
-09
Ap
r-1
0
Au
g-1
0
Dec
-10
Ap
r-1
1
Au
g-1
1
Dec
-11
Ap
r-1
2
Au
g-1
2
Dec
-12
Ap
r-1
3
Au
g-1
3
Dec
-13
Ap
r-1
4
Au
g-1
4
Dec
-14
Ap
r-1
5
Au
g-1
5
SCFI -RTM Margin Rotterdam Platts SCFIGraph 7: SCFI vs Rotterdam Platts
Avg. Margin ‘10 = 918 Avg. Margin ‘11 = 392 Avg. Margin ‘12 = 605
Outlook
17
Avg. Margin ‘13 = 480 Avg. Margin ‘14 = 536
Margin Jan-Aug
2010 983
2011 438
2012 620
2013 507
2014 512
2015 518
Jan-15 811
Feb-15 754
Mar-15 571
Apr-15 436
May-15 339
Jun-15 277
Avg. Margin YTD‘15 = 518
Source: SCFI, Platts.
Notes: (1) SCFI – RTM Margin is only referential since fuel oil consumption
per TEU may vary depending on the trade and on the vessel efficiency
(2) The SCFI index includes: Spot rates for Main Haul trades exports from Shanghai
Jul-15 389
Aug-15 505
Disclaimer This presentation provides general information about Compañía Sud Americana de Vapores S.A. (“CSAV”). It consists of summary information and does not purport to be complete. It is not intended to be relied upon as advice to potential investors.
No representations or warranties, express or implied, are made as to, and no reliance should be placed on, the accuracy, fairness or completeness of the information presented or contained in this presentation. Neither CSAV nor any of its affiliates, advisers or representatives, accepts any responsibility whatsoever for any loss or damage arising from any information presented or contained in this presentation. The information presented or contained in this presentation is subject to change without notice and its accuracy is not guaranteed. Neither the Company nor any of its affiliates, advisers or representatives make any undertaking to update any such information subsequent to the date hereof.
This presentation contains forward looking statements within the meaning of the 'safe harbor' provision of the US securities laws. These statements are based on management's current expectations or beliefs and are subject to a number of factors and uncertainties that could cause actual results to differ materially from those described in the forward-looking statements. Actual results may differ from those set forth in the forward-looking statements as a result of various factors (including, but not limited to, future global economic conditions, market conditions affecting the container shipping industry, intense competition in the markets in which we operate, potential environmental liability and capital costs of compliance with applicable laws, regulations and standards in the markets in which we operate, diverse political, legal, economic and other conditions affecting the markets in which we operate, our ability to successfully integrate business acquisitions and our ability to service our debt requirements). Many of these factors are beyond our control.
This presentation is intended to provide a general overview of CSAV business and does not purport to deal with all aspects and details regarding CSAV. Accordingly, neither CSAV nor any of its directors, officers, employees or advisers nor any other person makes any representation or warranty, expressed or implied, as to, and accordingly no reliance should be placed on, the fairness, accuracy or completeness of the information contained in the presentation or of the views given or implied. Neither CSAV nor any of its directors, officers, employees or advisors nor any other person shall have any liability whatsoever for any errors or omissions or any loss howsoever arising, directly or indirectly, from any use of this information or its contents or otherwise arising in connection therewith.
Each investor must conduct and rely on its own evaluation in taking an investment decision.
This presentation does not constitute an offer, or invitation, or solicitation of an offer, to subscribe for or purchase any securities. Neither this presentation nor anything contained herein shall form the basis of any contract or commitment whatsoever.
Recipients of this presentation are not to construe the contents of this summary as legal, tax or investment advice and recipients should consult their own advisors in this regard.
18