second quarter 2018 - vulcan value partners
TRANSCRIPT
www.vulcanvaluepartners.com
¹Peer ranking information sourced from eVestment as of July 18, 2018 using Vulcan Value Partners Large Cap, Focus and Focus Plus
Composites versus peer group of US Large Cap Value Equity Universe, Vulcan Value Partners Small Cap Composite versus peer group of
US Small Cap Value Equity Universe and Vulcan Value Partners All Cap Composite versus peer group of US All Cap Value Equity Universe
since inception ending June 30, 2018. All returns are shown gross and net of fees. Vulcan Value Partners claims compliance with the Global Investment Performance Standards (GIPS®). *Inception date is 3/31/2007 for Large Cap, Small Cap, and Focus Plus
Composites. Inception date is 11/30/2007 for Focus Composite. Inception date is 4/1/2011 for All Cap Composite. Past performance
is no guarantee of future results.
Second
Quarter
2018
Directory
Introduction 1
Large Cap
Review 3
Small Cap
Review 6
Focus Review 8
Focus Plus
Review 10
All Cap Review 12
Closing 14
Disclosures 15
For more information
please contact us at :
Vulcan Value Partners
Three Protective Center
2801 Hwy 280 South
Suite 300
Birmingham, AL 35223
205.803.1582 phone
Portfolio Review
General
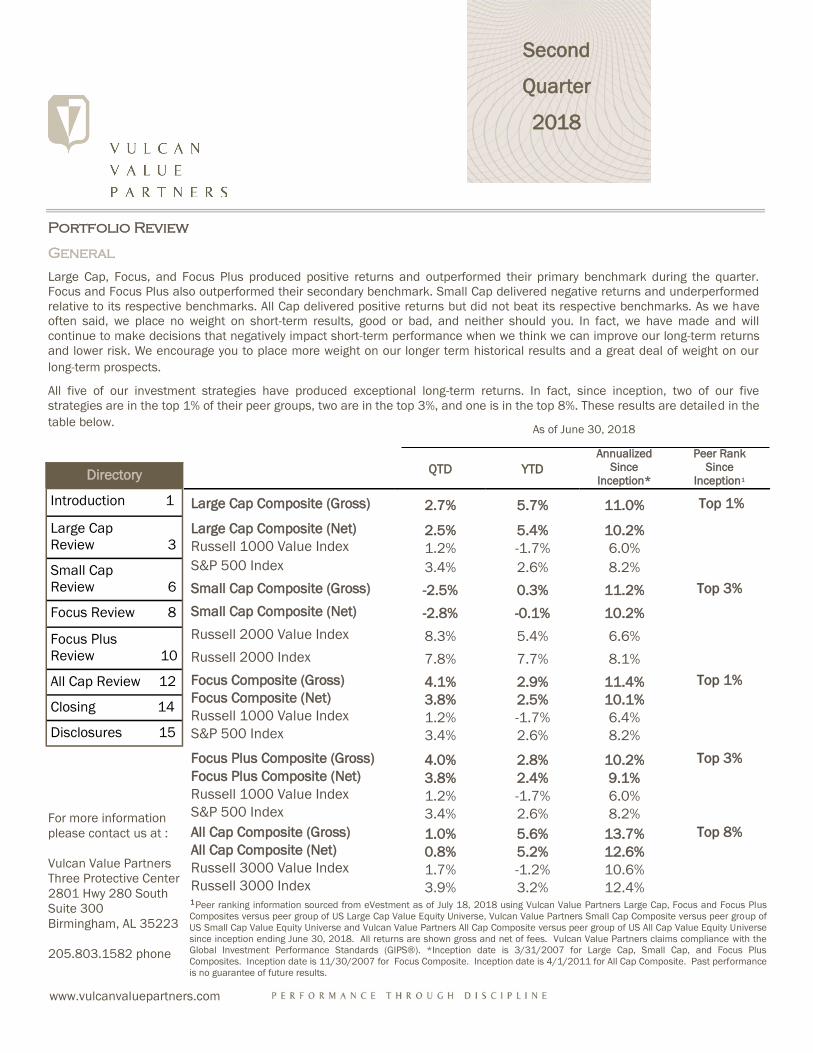
Large Cap, Focus, and Focus Plus produced positive returns and outperformed their primary benchmark during the quarter.
Focus and Focus Plus also outperformed their secondary benchmark. Small Cap delivered negative returns and underperformed
relative to its respective benchmarks. All Cap delivered positive returns but did not beat its respective benchmarks. As we have
often said, we place no weight on short-term results, good or bad, and neither should you. In fact, we have made and will
continue to make decisions that negatively impact short-term performance when we think we can improve our long-term returns
and lower risk. We encourage you to place more weight on our longer term historical results and a great deal of weight on our
long-term prospects.
All five of our investment strategies have produced exceptional long-term returns. In fact, since inception, two of our five
strategies are in the top 1% of their peer groups, two are in the top 3%, and one is in the top 8%. These results are detailed in the
table below.
QTD
YTD
Annualized
Since
Inception*
Peer Rank
Since
Inception¹
Large Cap Composite (Gross) 2.7% 5.7% 11.0% Top 1%
Large Cap Composite (Net) 2.5% 5.4% 10.2%
Russell 1000 Value Index 1.2% -1.7% 6.0%
S&P 500 Index 3.4% 2.6% 8.2%
Small Cap Composite (Gross) -2.5% 0.3% 11.2% Top 3%
Small Cap Composite (Net) -2.8% -0.1% 10.2%
Russell 2000 Value Index 8.3% 5.4% 6.6%
Russell 2000 Index 7.8% 7.7% 8.1%
Focus Composite (Gross) 4.1% 2.9% 11.4% Top 1%
Focus Composite (Net) 3.8% 2.5% 10.1%
Russell 1000 Value Index 1.2% -1.7% 6.4%
S&P 500 Index 3.4% 2.6% 8.2%
Focus Plus Composite (Gross) 4.0% 2.8% 10.2% Top 3%
Focus Plus Composite (Net) 3.8% 2.4% 9.1%
Russell 1000 Value Index 1.2% -1.7% 6.0%
S&P 500 Index 3.4% 2.6% 8.2%
All Cap Composite (Gross) 1.0% 5.6% 13.7% Top 8%
All Cap Composite (Net) 0.8% 5.2% 12.6%
Russell 3000 Value Index 1.7% -1.2% 10.6%
Russell 3000 Index 3.9% 3.2% 12.4%
As of June 30, 2018
2
Portfolio Review (Cont.)
In the discussion that follows, we generally define material contributors and detractors as companies having a greater
than 1% impact on the portfolio.
Second
Quarter
2018

3
Vulcan Value Partners Large Cap Review
We are pleased with the progress we made this quarter. Our price to value ratios have continued to improve and the
portfolio has become more concentrated with larger positions in more discounted, high quality names. We are fully
invested, with cash at a 1% position.
We purchased four new positions and exited seven positions in the second quarter.
There was one material contributor to and no material detractors from performance.
In the second quarter, we purchased United Parcel Service, Broadcom, KKR, and Teradyne.
United Parcel Service (UPS) is one of the leading delivery companies in the world. Roughly 6% of US GDP and 3% of global
GDP flows through its network. The company uses only one network for air and ground delivery which helps make them
more efficient compared to their primary competitor, FedEx, which uses separate networks. Over an economic cycle UPS
generates excellent free cash flow. The company is benefiting from growth in e-commerce. In fact, UPS has been unable
to keep up with demand, which has led to higher costs and caused them to miss earnings estimates last year. The
company is investing heavily to expand and improve its network so that it can efficiently meet demand. We think that
investing for the long term makes sense while investors with shorter time horizons have punished the stock. In addition,
UPS has a shareholder friendly mentality with large employee ownership.
Broadcom competes in the high-end radio frequency space with Skyworks and Qorvo, two of our other portfolio holdings.
The company has a high return on assets and produces excellent levels of free cash flow. Broadcom recently acquired CA
Technologies which added critical software to their business. Acquisitions typically make us wary, but Broadcom has a
track record of improving operations in acquired companies. We feel this deal will allow them to effectively expand their
product and service offerings.
Large
Cap
As of June 30, 2018
Annualized
Investment
Strategy QTD
YTD
1 year 3 year 5 year Since
Inception* 10 year
VVP Large Cap (Gross) 2.7% 5.7% 11.9% 8.7% 12.8% 11.0% 13.5%
VVP Large Cap (Net) 2.5% 5.4% 11.3% 8.1% 12.2% 10.2% 12.7%
Russell 1000 Value Index 1.2% -1.7% 6.8% 8.3% 10.3% 6.0% 8.5%
S&P 500 Index 3.4% 2.6% 14.4% 11.9% 13.4% 8.2% 10.2%
*Inception Date March 31, 2007

4
Vulcan Value Partners Large Cap Review (Cont.)
KKR is a global investment firm that manages multiple alternative asset classes, including private equity, energy,
infrastructure, real estate, various debt strategies, hedge funds, and portfolio re-financings. The company has stable
capital, with an average duration in excess of eight years, and predictable base fees. Recently, KKR converted from a
publicly-traded limited partnership to a C-Corp, a step made easier by the Tax Cuts and Jobs Act of 2017. As a C-Corp, KKR
is likely to attract a wider investor base. In addition, its financial reporting will be simplified and easier to follow. Over time,
we expect KKR’s very attractive price to value gap to close. In the meantime, we are gratified to be able to own this high
quality company with a substantial margin of safety.
Teradyne is the global leader in semiconductor test equipment. The business generates excellent free cash flow and
returns on capital are high. In addition, Teradyne has a rapidly growing industrial automation business specializing in
easy-to-operate robots that work alongside humans. These robots are commonly referred to as “cobots.” This segment of
the robotics industry is small but growing faster than the industry as a whole. Teradyne’s strategy in the cobot segment is
very much like Apple’s approach with the iPhone in that they champion ease of use (think iPhone apps). This open
architecture, in turn, attracts a large following of app designers who want to make a good return creating apps for cobots.
The increased adoption afforded by such an app ecosystem should make the cobots more valuable and improve
Teradyne’s competitive position. By our estimation, we bought Teradyne for the price of its semiconductor test business
and have acquired the rapidly-growing industrial automation business for free.
This quarter we sold United Technologies, Axalta Coating Systems, CBRE Group, Autozone, O’Reilly Automotive, and Sabre.
All of these companies were sold in order to redeploy capital into more discounted businesses of equal or better quality
with larger margins of safety.
Also, we sold Cardinal Health as a result of their acquisition of Cordis. Cardinal, along with McKesson and
AmerisourceBergen, both of whom we also own, is one of the three largest U.S. pharmaceutical distributors, together
controlling 85% of the market. Cardinal bought Cordis in 2015. Subsequently, Cardinal implemented new ERP and
inventory management systems, a process that took roughly two years. As a result, in the second quarter of 2018,
Cardinal discovered they had a lot of inventory related to the Cordis acquisition, which they did not control and was going
to expire before it could be used. When they disclosed their finding, we analyzed the situation and felt Cardinal’s capital
allocation and operational decision-making were disappointing. We insist on good businesses run by capable
shareholder-oriented managers who are also good capital allocators. Since Cardinal no longer meets these criteria, we
followed our discipline and decided to sell our position.
National Oilwell Varco makes drilling rigs and equipment that enable oil and gas companies to extract their resources and
also provides aftermarket servicing. As we have said before, our investment case for this company does not depend on oil
prices, but on the replacement demand for equipment. This replacement cycle has been elongated during this down cycle.
The stock price has begun to reflect the inevitable improvement in the company’s earnings. We remain pleased to own
this great business.
Large
Cap
5
Vulcan Value Partners Large Cap Review (Cont.)
Large
Cap
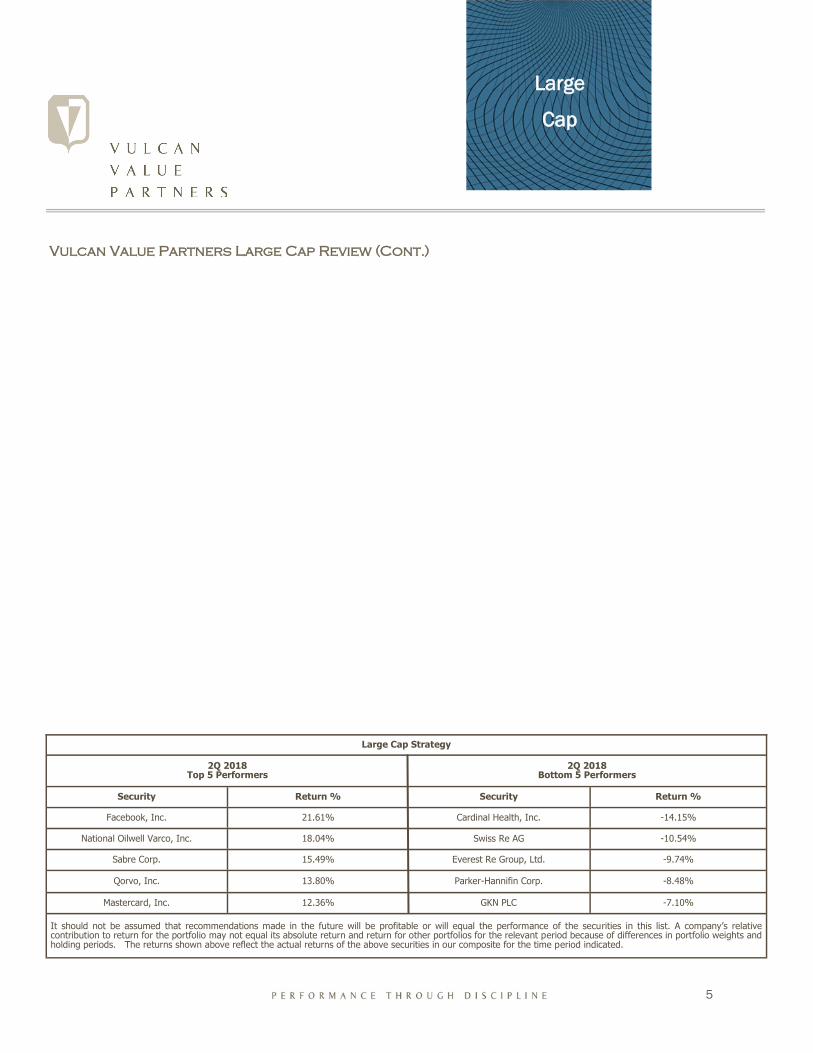
Large Cap Strategy
2Q 2018 Top 5 Performers
2Q 2018 Bottom 5 Performers
Security Return % Security Return %
Facebook, Inc. 21.61% Cardinal Health, Inc. -14.15%
National Oilwell Varco, Inc. 18.04% Swiss Re AG -10.54%
Sabre Corp. 15.49% Everest Re Group, Ltd. -9.74%
Qorvo, Inc. 13.80% Parker-Hannifin Corp. -8.48%
Mastercard, Inc. 12.36% GKN PLC -7.10%
It should not be assumed that recommendations made in the future will be profitable or will equal the performance of the securities in this list. A company’s relative contribution to return for the portfolio may not equal its absolute return and return for other portfolios for the relevant period because of differences in portfolio weights and holding periods. The returns shown above reflect the actual returns of the above securities in our composite for the time period indicated.

6
Vulcan Value Partners Small Cap Review
Small cap valuations continue to be stretched, and our opportunity set is not robust. Price to value ratios for our small cap
portfolio have improved somewhat, but cash levels remain high as we have not been able to find enough discounted
companies that meet our quality criteria. During the second quarter, a number of businesses that do not meet our quality
criteria, and which we do not want to own, rallied. Our performance this quarter reflects these challenges.
We purchased four new positions and exited two positions in the second quarter.
There were no material contributors to and one material detractor from performance.
New purchases included Donaldson, Versum Materials, Sleep Country Canada, and ServiceMaster, which was
subsequently sold in the same quarter.
Donaldson is a technology-led filtration company which we have owned previously. Their filters increase efficiency and
lower maintenance costs for their customers. The company is a market leader in many of its primary product lines. It has
an extremely diversified customer base both by industry and geography which lends itself to consistent results.
Versum is a leading supplier of electronic materials to the circuit and flat panel display markets. Their products include
specialty chemicals and materials such as high purity gases. They also provide delivery systems to ensure safe and
efficient application. We like this company due to its high value relative to low cost in the semiconductor supply chain,
tremendous breadth of offering, and durable contractual cycles with customers.
Sleep Country Canada is our third investment in the bedding industry and is the top mattress retailer in Canada. It
employs omni-channel distribution and competes solely in the Canadian market which has grown at a steady rate for over
a decade. Its primary competitor is going out of business, so we expect increased market share opportunity in the near
term. They have strong brand recognition and scale and continue to add higher margin accessories which now comprise a
healthy portion of their product line.
Small
Cap
As of June 30, 2018
Annualized
Investment
Strategy QTD
YTD
1 year 3 year 5 year Since
Inception* 10 year
VVP Small Cap (Gross) -2.5% 0.3% 5.2% 8.2% 10.8% 11.2% 14.3%
VVP Small Cap (Net) -2.8% -0.1% 4.4% 7.3% 9.8% 10.2% 13.2%
Russell 2000 Value Index 8.3% 5.4% 13.1% 11.2% 11.2% 6.6% 9.9%
Russell 2000 Index 7.8% 7.7% 17.6% 11.0% 12.5% 8.1% 10.6%
*Inception Date March 31, 2007

7
Vulcan Value Partners Small Cap Review (Cont.)
ServiceMaster is another business we purchased during the quarter. It has a few fairly distinct but related businesses
including Terminix, American Home Shield, and its franchise services group. It is a quality company which was modestly
discounted at purchase. It quickly reached our estimate of fair value before the end of the quarter, and we sold it.
Likewise, Lindsay Corporation was another quality holding whose stock price reached our estimate of fair value and was
subsequently sold.
We began purchasing Despegar.com, the top online travel agency in Latin America, in the first quarter. During the second
quarter, Despegar.com reported results that disappointed Wall Street, but still managed to grow its operating income by
13%. The stock traded down due to fears that increased competition would lead to margin declines. In addition, the
Argentinian Peso fell sharply. We believe that Despegar.com is making a wise decision to increase marketing expenditures
in order to capture market share from weaker, local competitors. As Despegar.com continues to scale its business, we
expect margins to improve over the long term. Despite its short-term performance, we have confidence in the company’s
prospects as management is making the appropriate trade-offs in support of the long-term. It enjoys sustainable tailwinds
due to increased internet adoption, the surge in smart phone usage, and a growing middle class.
As valuation levels in the U.S. small caps have remained challenging, we have been finding more attractive opportunities
outside the U.S. Our investment process is exactly the same, wherever our companies are domiciled. We are agnostic. We
want to own competitively entrenched companies with stable values at a substantial margin of safety. These international
names hurt our performance in the second quarter as U.S. small caps rallied, but we think they will prove to be superior
investments over our five year time horizon.
Small
Cap
Small Cap Strategy
2Q 2018 Top 5 Performers
2Q 2018 Bottom 5 Performers
Security Return % Security Return %
Actuant Corp. 26.24% Despegar.com -32.90%
Sabre Corp. 15.49% Sleep Number Corp. -17.44%
Forward Air Corp. 12.05% Lectra SA -17.19%
ServiceMaster Holdings, Inc. 11.28% Acuity Brands, Inc. -16.67%
Howden Joinery Group PLC 11.15% Savills PLC -14.38%
It should not be assumed that recommendations made in the future will be profitable or will equal the performance of the securities in this list. A company’s relative contribution to return for the portfolio may not equal its absolute return and return for other portfolios for the relevant period because of differences in portfolio weights and holding periods. The returns shown above reflect the actual returns of the above securities in our composite for the time period indicated.

8
Vulcan Value Partners Focus Review
We purchased one new position and exited one position in the second quarter.
There were two material contributors to and no material detractors from performance.
KKR is a global investment firm that manages multiple alternative asset classes, including private equity, energy,
infrastructure, real estate, various debt strategies, hedge funds, and portfolio re-financings. The company has stable
capital, with an average duration in excess of eight years, and predictable base fees. Recently, KKR converted from a
publicly-traded limited partnership to a C-Corp, a step made easier by the Tax Cuts and Jobs Act of 2017. As a C-Corp,
KKR is likely to attract a wider investor base. In addition, its financial reporting will be simplified and easier to follow. Over
time, we expect KKR’s very attractive price to value gap to close. In the meantime, we are gratified to be able to own this
high quality company with a substantial margin of safety.
Following our investment discipline, we sold AmerisourceBergen to improve the quality of the portfolio.
MasterCard and Visa continue to compound their value along with their stock prices. They have grown steadily, and we
are pleased with their performance.
Focus
*Inception Date November 30, 2007
As of June 30, 2018
Annualized
Investment
Strategy QTD
YTD
1 year 3 year 5 year Since
Inception* 10 year
VVP Focus (Gross) 4.1% 2.9% 8.2% 8.3% 12.8% 11.4% 13.2%
VVP Focus (Net) 3.8% 2.5% 7.2% 7.4% 11.9% 10.1% 12.0%
Russell 1000 Value Index 1.2% -1.7% 6.8% 8.3% 10.3% 6.4% 8.5%
S & P 500 Index 3.4% 2.6% 14.4% 11.9% 13.4% 8.2% 10.2%

9
Vulcan Value Partners Focus Review (Cont.)
Focus
Focus Strategy
2Q 2018 Top 5 Performers
2Q 2018 Bottom 5 Performers
Security Return % Security Return %
Mastercard, Inc. 12.36% McKesson Corp. -5.08%
Visa, Inc. 10.90% Oracle Corp. -3.30%
Alphabet, Inc. 8.13% Hilton Worldwide Holdings, Inc. 0.69%
AmerisourceBergen Corp. 7.39% KKR & Co., Inc. 3.71%
Bank of New York Mellon Corp. 5.12% ACI Worldwide, Inc. 4.01%
It should not be assumed that recommendations made in the future will be profitable or will equal the performance of the securities in this list. A company’s relative contribution to return for the portfolio may not equal its absolute return and return for other portfolios for the relevant period because of differences in portfolio weights and holding periods. The returns shown above reflect the actual returns of the above securities in our composite for the time period indicated.
10
Vulcan Value Partners Focus Plus Review
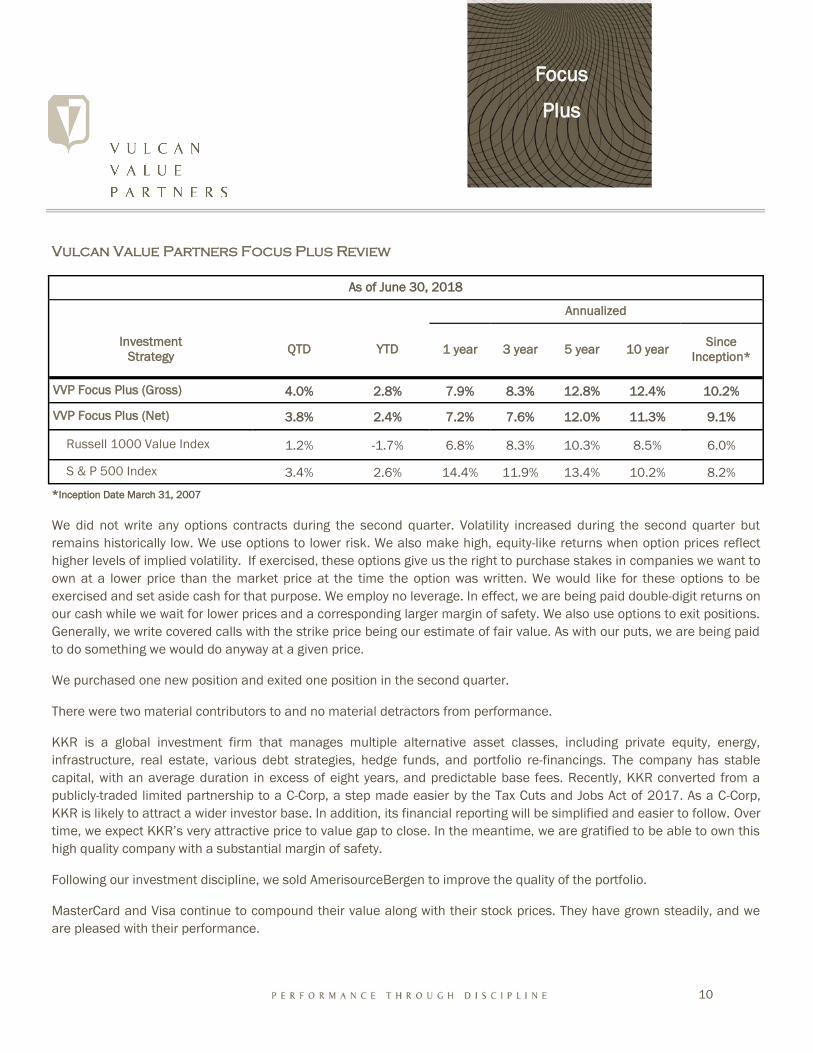
We did not write any options contracts during the second quarter. Volatility increased during the second quarter but
remains historically low. We use options to lower risk. We also make high, equity-like returns when option prices reflect
higher levels of implied volatility. If exercised, these options give us the right to purchase stakes in companies we want to
own at a lower price than the market price at the time the option was written. We would like for these options to be
exercised and set aside cash for that purpose. We employ no leverage. In effect, we are being paid double-digit returns on
our cash while we wait for lower prices and a corresponding larger margin of safety. We also use options to exit positions.
Generally, we write covered calls with the strike price being our estimate of fair value. As with our puts, we are being paid
to do something we would do anyway at a given price.
We purchased one new position and exited one position in the second quarter.
There were two material contributors to and no material detractors from performance.
KKR is a global investment firm that manages multiple alternative asset classes, including private equity, energy,
infrastructure, real estate, various debt strategies, hedge funds, and portfolio re-financings. The company has stable
capital, with an average duration in excess of eight years, and predictable base fees. Recently, KKR converted from a
publicly-traded limited partnership to a C-Corp, a step made easier by the Tax Cuts and Jobs Act of 2017. As a C-Corp,
KKR is likely to attract a wider investor base. In addition, its financial reporting will be simplified and easier to follow. Over
time, we expect KKR’s very attractive price to value gap to close. In the meantime, we are gratified to be able to own this
high quality company with a substantial margin of safety.
Following our investment discipline, we sold AmerisourceBergen to improve the quality of the portfolio.
MasterCard and Visa continue to compound their value along with their stock prices. They have grown steadily, and we
are pleased with their performance.
Focus
Plus
*Inception Date March 31, 2007
As of June 30, 2018
Annualized
Investment
Strategy QTD
YTD
1 year 3 year 5 year Since
Inception* 10 year
VVP Focus Plus (Gross) 4.0% 2.8% 7.9% 8.3% 12.8% 10.2% 12.4%
VVP Focus Plus (Net) 3.8% 2.4% 7.2% 7.6% 12.0% 9.1% 11.3%
Russell 1000 Value Index 1.2% -1.7% 6.8% 8.3% 10.3% 6.0% 8.5%
S & P 500 Index 3.4% 2.6% 14.4% 11.9% 13.4% 8.2% 10.2%

11
Vulcan Value Partners Focus Plus Review (Cont.)
Focus
Plus
Focus Plus Strategy
2Q 2018 Top 5 Performers
2Q 2018 Bottom 5 Performers
Security Return % Security Return %
Mastercard, Inc. 12.36% McKesson Corp. -5.08%
Visa, Inc. 10.90% Oracle Corp. -3.30%
Alphabet, Inc. 8.13% Hilton Worldwide Holdings, Inc. 0.69%
AmerisourceBergen Corp. 7.39% KKR & Co.,Inc. 3.71%
Bank of New York Mellon 5.12% ACI Worldwide, Inc. 4.01%
It should not be assumed that recommendations made in the future will be profitable or will equal the performance of the securities in this list. A company’s relative contribution to return for the portfolio may not equal its absolute return and return for other portfolios for the relevant period because of differences in portfolio weights and holding periods. The returns shown above reflect the actual returns of the above securities in our composite for the time period indicated.

12
Vulcan Value Partners All Cap Review
We are pleased with the continued improvement of the price to value ratio of the portfolio and the solid value growth of
the companies we owned during the second quarter. Recent volatility gave us the opportunity to redeploy capital into
more discounted companies in the portfolio, improving our overall margin of safety.
We purchased four new positions in the second quarter and exited seven positions.
There was one material contributor to and no material detractors from performance in the second quarter.
In the second quarter we purchased Parker-Hannifin, Acuity Brands, Ibstock, and KKR.
We have previously held Parker-Hannifin and sold it in the fourth quarter of 2017 as it had risen very close to our
estimate of fair value. We are pleased to own this great company again at a discount.
Acuity Brands is North America’s leading provider of lighting and building management solutions, primarily serving
non-residential markets. We have previously purchased this company in our other strategies. We believe Acuity’s market
share will expand and that their value proposition to customers and competitive advantages will continue to strengthen.
Ibstock is a U.K.-based company that manufactures clay bricks and concrete products. We like that the company has
rational competition as well as solid growth and pricing. Its experienced management team has been disciplined with
capital allocation and production, allowing them to prosper in the fundamentally strong U.K. housing market. We own this
high quality company in other strategies and are pleased that we can continue to increase our ownership.
KKR is a global investment firm that manages multiple alternative asset classes, including private equity, energy,
infrastructure, real estate, various debt strategies, hedge funds, and portfolio re-financings. The company has stable
capital, with an average duration in excess of eight years, and predictable base fees. Recently, KKR converted from a
publicly-traded limited partnership to a C-Corp, a step made easier by the Tax Cuts and Jobs Act of 2017. As a C-Corp,
All
Cap
*Inception Date April 1, 2011
As of June 30, 2018
Annualized
Investment
Strategy QTD
YTD
1 year 3 year 5 year Since
Inception*
VVP All Cap (Gross) 1.0% 5.6% 10.7% 8.9% 12.5% 13.7%
VVP All Cap (Net) 0.8% 5.2% 9.8% 8.0% 11.6% 12.6%
Russell 3000 Value Index 1.7% -1.2% 7.3% 8.5% 10.4% 10.6%
Russell 3000 Index 3.9% 3.2% 14.8% 11.6% 13.3% 12.4%

13
Vulcan Value Partners All Cap Review (Cont.)
KKR is likely to attract a wider investor base. In addition, its financial reporting will be simplified and easier to follow.
Over time, we expect KKR’s very attractive price to value gap to close. In the meantime, we are gratified to be able to
own this high quality company with a substantial margin of safety.
During the second quarter we sold Anthem, Moody’s, Howden Joinery, Sotheby’s, and Aspen Insurance in order to
improve the overall quality of the portfolio.
Also, we sold Cardinal Health as a result of their acquisition of Cordis. As we have discussed in past letters, Cardinal,
along with McKesson and AmerisourceBergen, is one of the three largest pharmaceutical distributors, together
controlling 85% of the U.S. market. Cardinal bought Cordis in 2015. Cardinal implemented new ERP and inventory
management systems, a process that took roughly two years. As a result, in the second quarter of 2018, Cardinal
discovered they had a lot of inventory related to the Cordis acquisition, which they did not control and was going to expire
before it could be used. When they disclosed their finding, we analyzed the situation and felt Cardinal’s capital allocation
and operational decision-making were disappointing. We insist on good businesses run by capable shareholder-oriented
managers who are also good capital allocators. Since Cardinal no longer meets these criteria, we followed our discipline
and decided to sell our position.
GKN is a British industrial company with leading positions in aerospace and driveline. In December, Melrose Industries
announced a cash and stock offer for GKN at a price very close to our estimate of fair value. We respect Melrose, but
given the lack of a margin of safety and the execution risk of a major acquisition, we decided to sell our stake in GKN
rather than participate in the offer by taking Melrose stock. GKN was a great investment for us.
National Oilwell Varco makes drilling rigs and equipment that enable oil and gas companies to extract their resources
and also provides aftermarket servicing. As we have said before, our investment case for this company does not depend
on oil prices, but on the replacement demand for equipment. This replacement cycle has been elongated during this
down cycle. The stock price has begun to reflect the inevitable improvement in the company’s earnings. We remain
pleased to own this great business.
All
Cap
All Cap Strategy
2Q 2018 Top 5 Performers
2Q 2018 Bottom 5 Performers
Security Return % Security Return %
National Oilwell Varco, Inc. 18.04% Sleep Number Corp. -17.44%
Sabre Corp. 15.49% Cardinal Health, Inc. -16.34%
Qorvo, Inc. 13.80% Swiss Re AG -10.54%
Mastercard, Inc. 12.36% Everest Re Group, Ltd. -9.74%
Visa, Inc. 10.90% Ebro Foods SA ADR -7.52%
It should not be assumed that recommendations made in the future will be profitable or will equal the performance of the securities in this list. A company’s relative contribution to return for the portfolio may not equal its absolute return and return for other portfolios for the relevant period because of differences in portfolio weights and holding periods. The returns shown above reflect the actual returns of the above securities in our composite for the time period indicated.

14
Second
Quarter
2018
Closing
We appreciate your confidence in us and your patient capital. As your fellow investors and fiduciaries, we are aligned with
and focused on the best interests of our clients. We assure you we will continue to follow our investment process with
discipline.
We hope you are enjoying your summer, and we look forward to updating you next quarter.
The Vulcan Value Partners Investment Team
C.T. Fitzpatrick, CFA
R. Bruce Donnellan, CFA
McGavock Dunbar, CFA
James N. Falbe, CFA
F. Hampton McFadden, Jr., CFA
Stephen W. Simmons, CFA

15
Disclosures
The performance presented is for our Large Cap Composite, Focus Composite, Focus Plus Composite, Small Cap Composite, and All Cap Composite. The model composite portfolio performance figures reflect the deduction of brokerage or other commissions and the reinvestment of dividends and capital gains. Past performance is no guarantee of future results and we may not achieve our return goal. We have presented returns gross and net of fees. Gross of fees returns are calculated gross of management and custodial fees and net of transaction costs. Net of fees returns are calculated net of management fees and transaction costs and gross of custodian fees, taken at the highest applicable fee. The performance figures do not reflect the deduction of any taxes an investor might pay on distributions or redemptions. Our standard fees are presented in Part 2 of our ADV. Value is our estimate of the intrinsic worth of a company based on our assessment of certain quantitative and qualitative factors. Vulcan defines risk reduction as reducing the portfolio’s price to value ratio by either buying (or adding to existing positions) high quality companies which are trading well below fair value as estimated by Vulcan, or selling positions which are trading at or near their fair values. Total return percentage for an individual security is the performance of the security from price at initial purchase date to the price at final sale date. Actual returns for the composites holdings of those securities may differ from total return as the composites rebalanced or changed weights in the individual securities. There may be market or economic conditions which affect our performance, or that of our relevant benchmarks, that may have changed Vulcan Value Partners’ views regarding the prospects of any particular investment. It should not be assumed that recommendations made in the future will be profitable or will equal the performance of the securities discussed in this letter. The information provided in this presentation is furnished as of the date shown, and no representation is being made with respect to its accuracy on any future date. Vulcan Value Partners does not assume any duty to update any information in this presentation. Vulcan buys concentrated positions for our portfolios, at times averaging 5% in our model portfolios, which may make our performance more volatile than that of our benchmark indices, and our performance may diverge from an index, positively or negatively, as a result. Our focus is on long term capital appreciation, so our clients should consider at least a five year time horizon for an investment with Vulcan. The S&P 500 Index is an unmanaged index of 500 common stocks chosen for market size, liquidity, and industry group representation. It is a market-value weighted index. The Russell 1000® Value Index measures the performance of the large-cap value segment of the U.S. equity universe. It includes those Russell 1000 companies with lower price-to-book ratios and lower expected growth values. The Russell 2000® Index includes the 2000 firms from the Russell 3000® Index with the smallest market capitalizations. The Russell 2000® Value Index measures the performance of those Russell 2000 companies with lower price-to-book ratios and lower forecasted growth values. Index figures do not reflect deductions for any fees, expenses, or taxes. Investors cannot invest directly in an index. Vulcan Value Partners is an investment adviser registered with the Securities and Exchange Commission under the Investment Advisers Act of 1940. Vulcan focuses on long term capital appreciation; targeting securities purchases that we believe have a substantial margin of safety in terms of value over price and limiting our investments to companies that we believe have sustainable competitive advantages that will allow them to earn superior returns on capital. Vulcan Value Partners claims compliance with the Global Investment Performance Standards (GIPS®). To receive a complete list and description of Vulcan Value Partners’ composites and a presentation that adheres to the GIPS standards, please contact Blevins Naff at 205.803.1582 or write Vulcan Value Partners, Three Protective Center, 2801 Highway 280 South, Suite 300, Birmingham, AL 35223. Large Cap Composite Information: This portfolio strategy invests in companies with larger market capitalizations. Subject to price, any publicly traded company with above average economics that is too large to be included in our small capitalization composite would be a potential investment in this portfolio. A core position is 5% so that theoretically our clients would hold 20 names diversified across various industries. It is very rare that enough companies are sufficiently discounted to warrant this level of concentration so concentration will vary with the price to value ratio. We will invest client assets in positions as small as 1% when price to value ratios are higher. We will not invest client assets in any business that is trading above our estimate of fair value. The composite benchmark is the S&P 500 which is an index of 500 stocks selected based on market size, liquidity, and sector and is designed to provide a broad snapshot of the overall U.S. equity market. New accounts that fit the composite definition are added at the beginning of the first full calendar month for which the account is under management. Closed account data is included in the composite as mandated by the standards in order to eliminate a survivorship bias. The composite was created on March 31, 2007. Portfolios below the minimum asset level of $50,000 are not included in the composite. Focus Composite Information: This portfolio strategy invests in companies with larger market capitalizations. Subject to price, any publicly traded company with above average economics that is too large to be included in our small capitalization composite would be a potential investment in this portfolio. This is a very concentrated portfolio holding between seven and fourteen positions. We will not invest client assets in any business that is trading above our estimate of fair value. The composite benchmark is the S&P 500 which is an index of 500 stocks selected based on market size, liquidity, and sector and is designed to provide a broad snapshot of the overall U.S. equity market. New accounts that fit the composite definition are added at the beginning of the first full calendar month for which the account is under management. Closed account data is included in the composite as mandated by the standards in order to eliminate a survivorship bias. The composite was created on November 30, 2007. Portfolios below the minimum asset level of $50,000 are not included in the composite.
Second
Quarter
2018

16
Disclosures (Cont.)
Focus Plus Composite Information: This portfolio strategy invests in companies with larger market capitalizations. Subject to price, any publicly traded company with above average economics that is too large to be included in our small capitalization composite would be a potential investment in this portfolio. This is a very concentrated portfolio holding between seven and fourteen positions. We will use options instead of limit orders to acquire and/or sell the stock. We do not intend to employ any leverage, but will utilize options to sell volatility when it is expensive and buy volatility when it is cheap. We will focus on options which give our clients the right to buy or sell stock in companies at prices that we would buy or sell anyway, and we will generate revenue through option premiums. Generally, we plan to use options instead of buying stock directly when we can earn double digit returns from selling options. We only intend to purchase options under rare circumstances, and to continue to focus on reducing risk through the purchase of qualifying companies at attractive prices. We will not invest client assets in any business that is trading above our estimate of fair value. The composite benchmark is the S&P 500 which is an index of 500 stocks selected based on market size, liquidity, and sector and is designed to provide a broad snapshot of the overall U.S. equity market. New accounts that fit the composite definition are added at the beginning of the first full calendar month for which the account is under management. Closed account data is included in the composite as mandated by the standards in order to eliminate a survivorship bias. The composite was created on March 31, 2007. Portfolios below the minimum asset level of $50,000 are not included in the composite. Small Cap Composite Information: This portfolio strategy invests in companies with smaller market capitalizations. Subject to price, any publicly traded company with above average economics that is not “large” would be a potential investment in this portfolio. While we do not have any defined cutoffs, we use the Russell 2000 as a guide to define small cap, and any small publicly traded company with reasonable economics would be a potential investment in this portfolio. A core position is 5% so that theoretically our clients would hold 20 names diversified across various industries. It is very rare that enough companies are sufficiently discounted to warrant this level of concentration so concentration will vary with the price to value ratio. We will invest client assets in positions as small as 1% when price to value ratios are higher. We will not invest client assets in any business that is trading above our estimate of fair value. The composite benchmark is the Russell 2000 Index which measures the performance of the small-cap segment of the U.S. Equity universe and includes approximately 2,000 of the smallest securities based on a combination of their market cap and current index membership. New accounts that fit the composite definition are added at the beginning of the first full calendar month for which the account is under management. Closed account data is included in the composite as mandated by the standards in order to eliminate a survivorship bias. The composite was created on March 31, 2007. Portfolios below the minimum asset level of $50,000 are not included in the composite. All Cap Composite Information: This portfolio strategy invests in companies across all market capitalizations. Generally, positions held in this strategy will also be held in either the Large Cap or Small Cap strategies, though sometimes with differing weights. As with those strategies, a core position in this portfolio is 5% so that theoretically we would hold 20 positions diversified across various industries. Because it is rare that we would find 20 companies meeting our investment guidelines, concentration will vary with the price to value ratios we determine for companies in which we invest. We will invest client assets in positions as small as 1% when price to value ratios are higher. We will not invest client assets in any business that is trading above our estimate of fair value. The composite benchmark is the Russell 3000 Index which measures the performance of the largest 3000 US companies representing approximately 98% of the investable US Equity market. New accounts that fit the composite definition are added at the beginning of the first full calendar month for which the account is under management. Closed account data is included in the composite as mandated by the standards in order to eliminate a survivorship bias. The composite was created on April 1, 2011. Portfolios below the minimum asset level of $50,000 are not included in the composite. All returns are expressed in US dollars.
Second
Quarter
2018