second quarter 2019 investor presentation
TRANSCRIPT

SECOND QUARTER2019 Investor Presentation
2
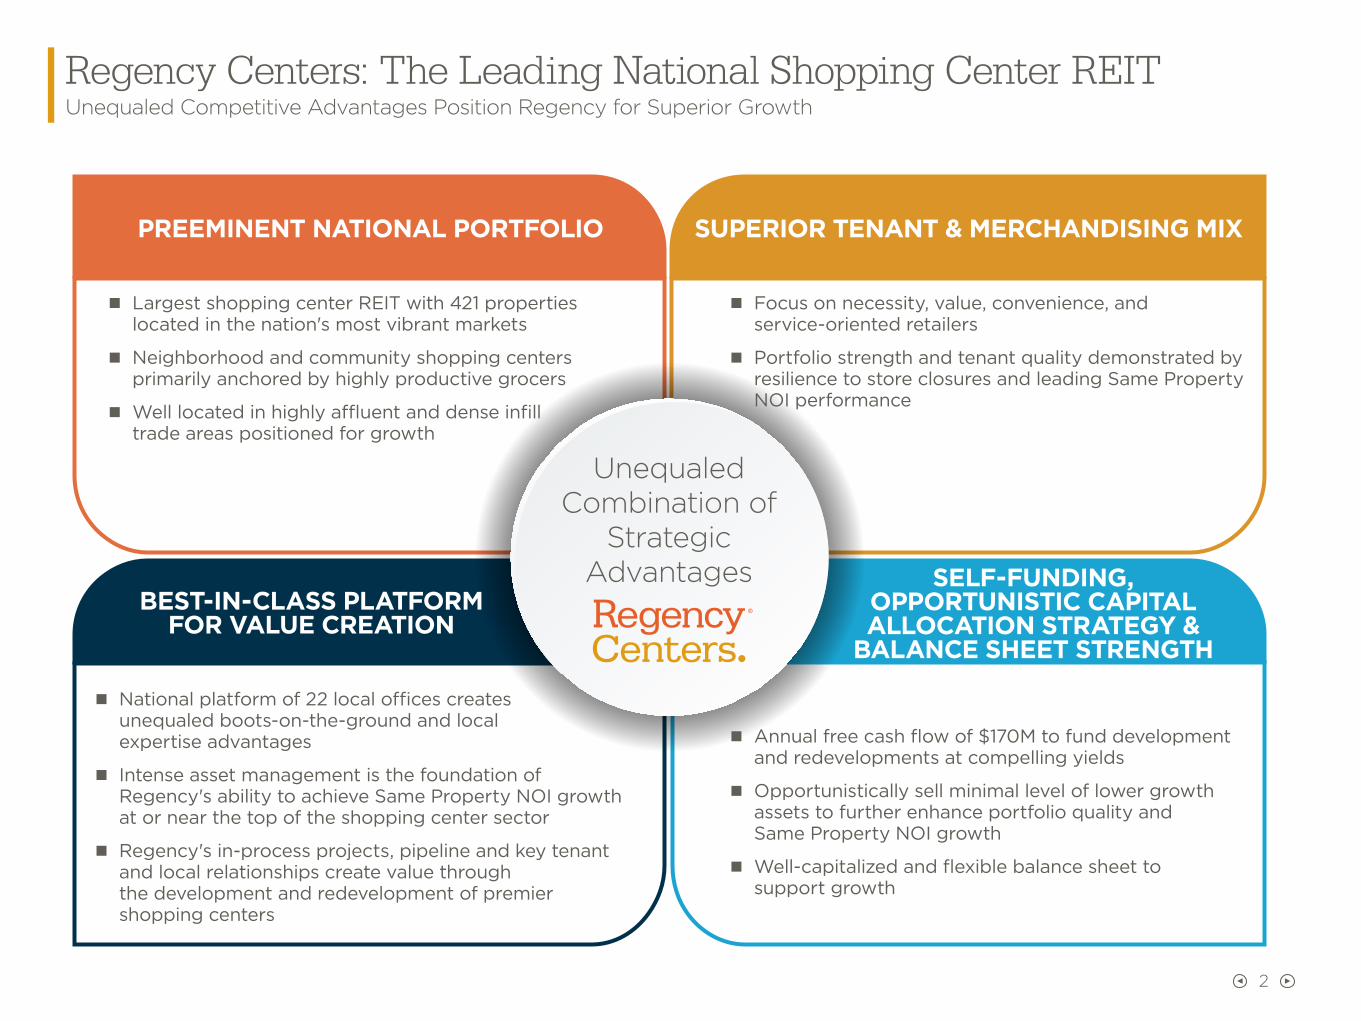
Regency Centers: The Leading National Shopping Center REITUnequaled Competitive Advantages Position Regency for Superior Growth
Unequaled Combination of
Strategic Advantages
PREEMINENT NATIONAL PORTFOLIO
nn Largest shopping center REIT with 421 properties located in the nation's most vibrant markets
nn Neighborhood and community shopping centers primarily anchored by highly productive grocers
nn Well located in highly affluent and dense infill trade areas positioned for growth
SUPERIOR TENANT & MERCHANDISING MIX
nn Focus on necessity, value, convenience, and service-oriented retailers
nn Portfolio strength and tenant quality demonstrated by resilience to store closures and leading Same Property NOI performance
BEST-IN-CLASS PLATFORM FOR VALUE CREATION
nn National platform of 22 local offices creates unequaled boots-on-the-ground and local expertise advantages
nn Intense asset management is the foundation of Regency's ability to achieve Same Property NOI growth at or near the top of the shopping center sector
nn Regency's in-process projects, pipeline and key tenant and local relationships create value through the development and redevelopment of premier shopping centers
SELF-FUNDING, OPPORTUNISTIC CAPITAL ALLOCATION STRATEGY &
BALANCE SHEET STRENGTH
nn Annual free cash flow of $170M to fund development and redevelopments at compelling yields
nn Opportunistically sell minimal level of lower growth assets to further enhance portfolio quality and Same Property NOI growth
nn Well-capitalized and flexible balance sheet to support growth
3
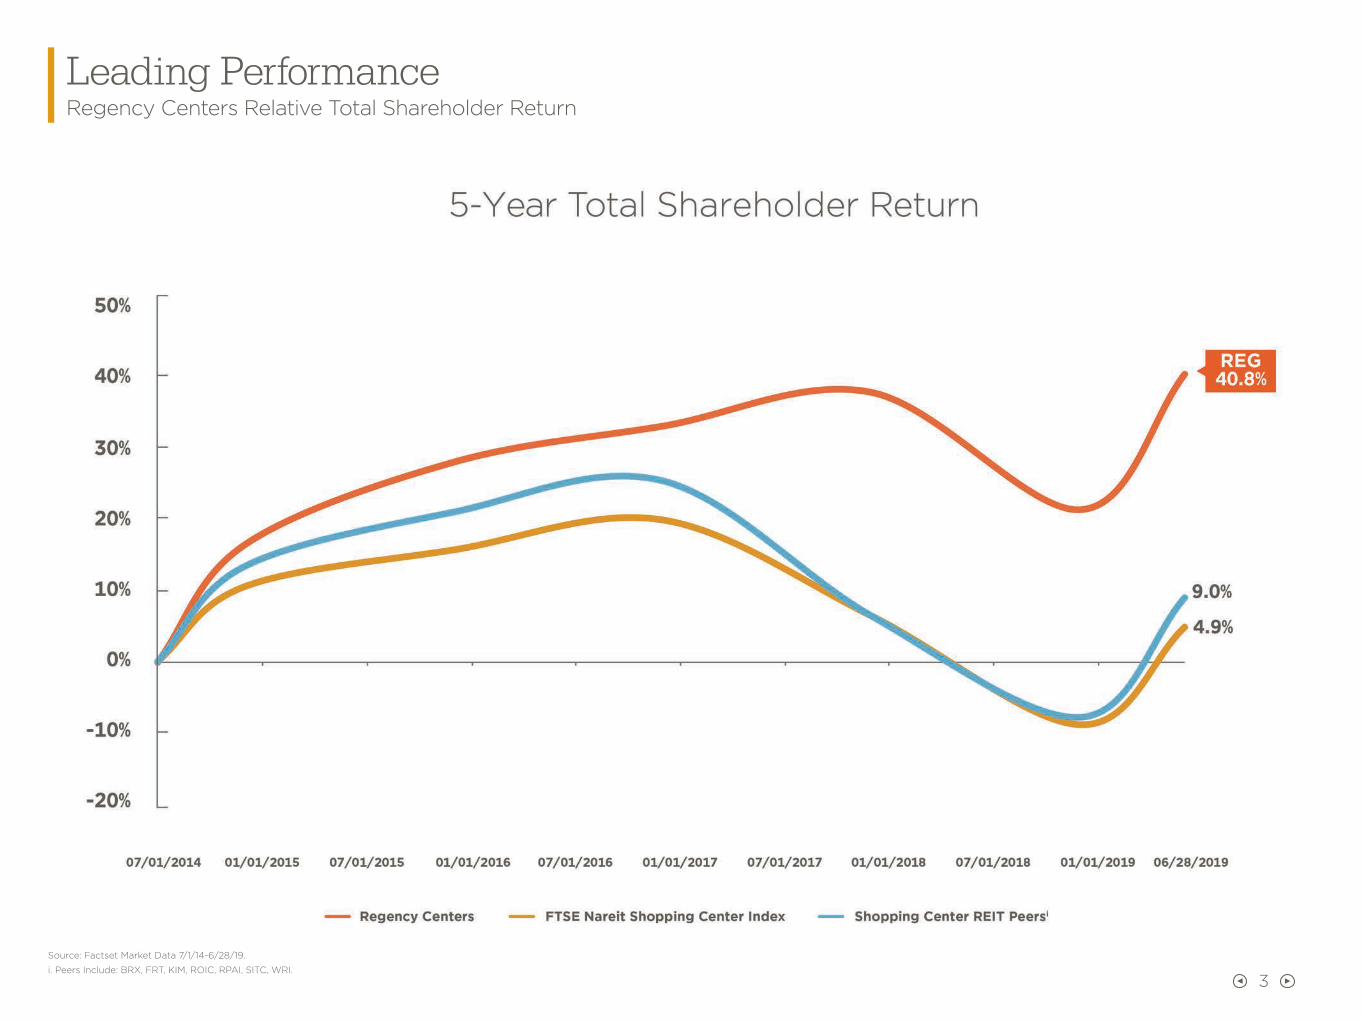
Leading PerformanceRegency Centers Relative Total Shareholder Return
Source: Factset Market Data 7/1/14-6/28/19.
i. Peers Include: BRX, FRT, KIM, ROIC, RPAI, SITC, WRI.
4
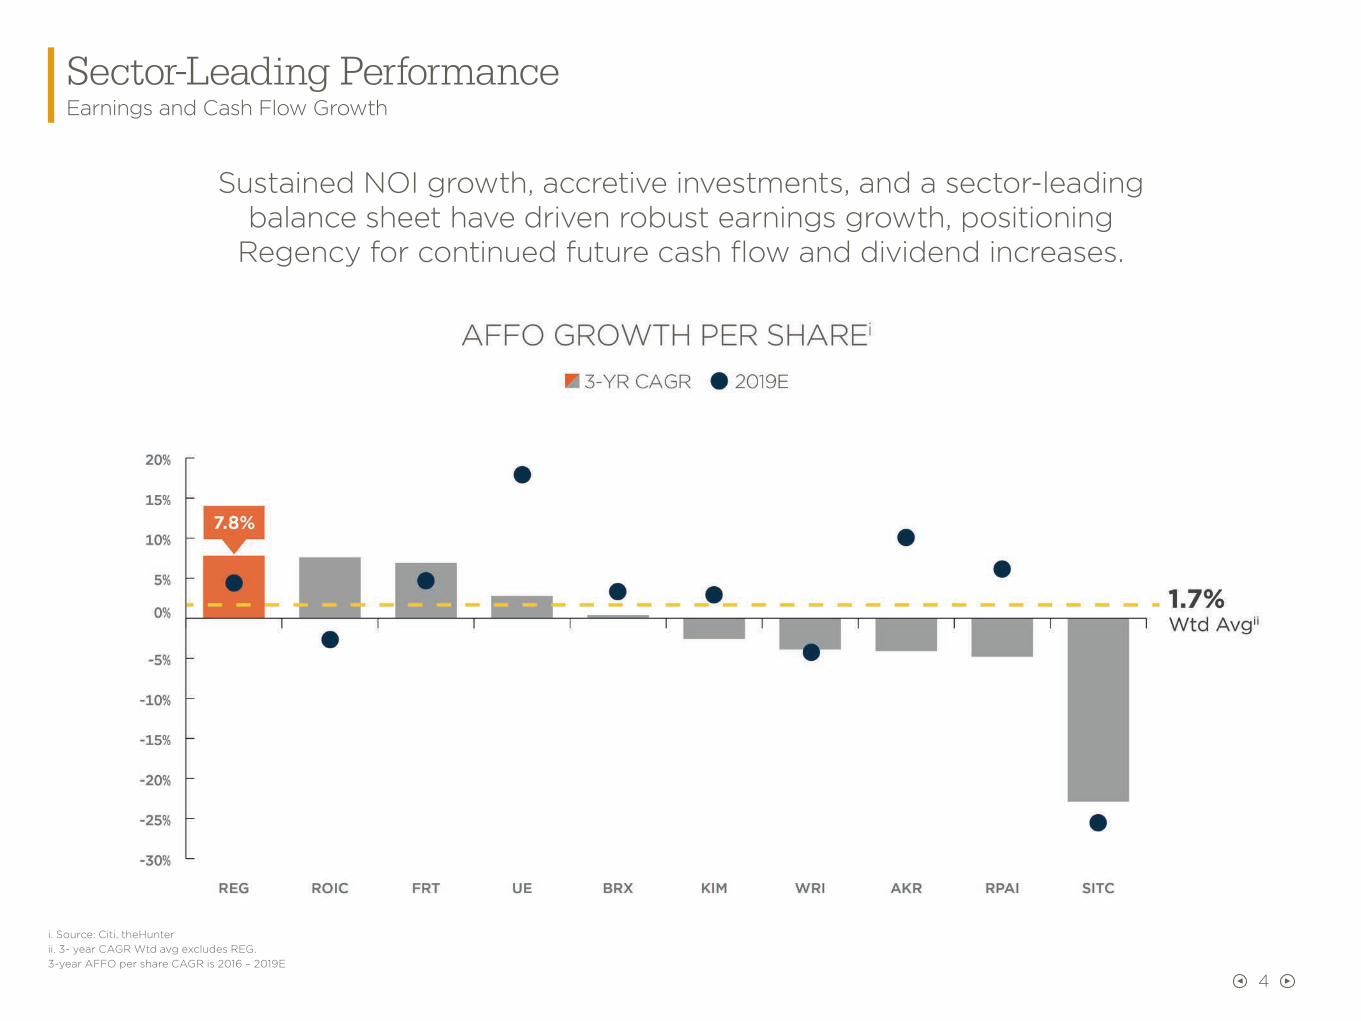
Sector-Leading PerformanceEarnings and Cash Flow Growth
Sustained NOI growth, accretive investments, and a sector-leading balance sheet have driven robust earnings growth, positioning
Regency for continued future cash flow and dividend increases.
i. Source: Citi, theHunterii. 3- year CAGR Wtd avg excludes REG.3-year AFFO per share CAGR is 2016 – 2019E
5
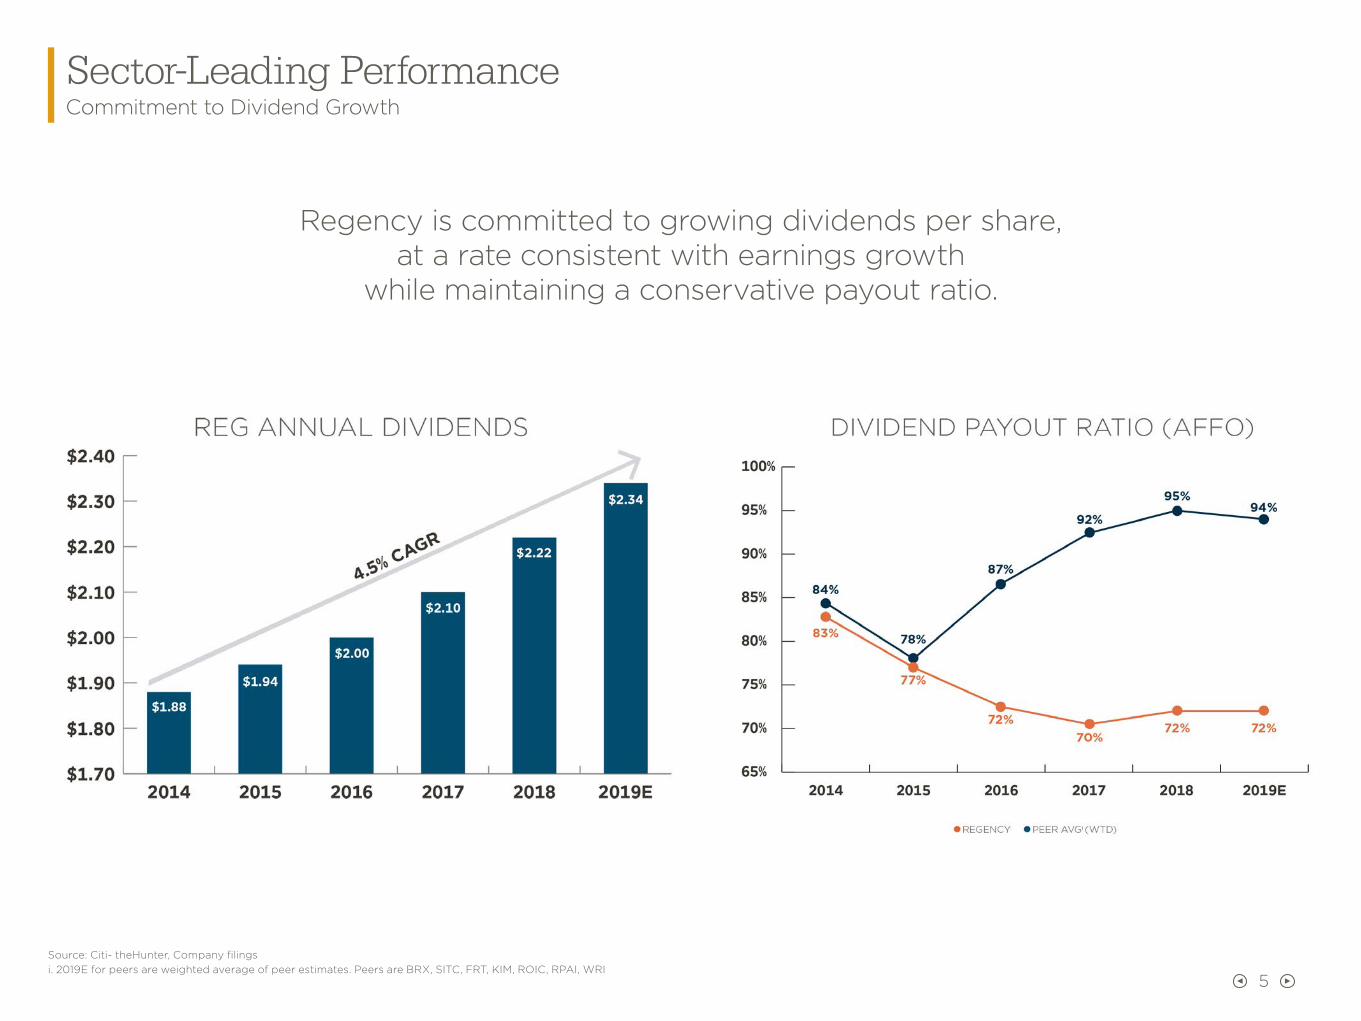
Sector-Leading PerformanceCommitment to Dividend Growth
Regency is committed to growing dividends per share, at a rate consistent with earnings growth
while maintaining a conservative payout ratio.
REG ANNUAL DIVIDENDS
Source: Citi- theHunter, Company filingsi. 2019E for peers are weighted average of peer estimates. Peers are BRX, SITC, FRT, KIM, ROIC, RPAI, WRI

6
Retail Landscape The Evolution & Future of Retail Real Estate
CONSUMER PREFERENCES
ConvenienceValue
Experiential OfferingsBrand Connectivity
Regency's superior merchandising mix consists primarily of best-in-class necessity, value and service-oriented
retailers that draw consumers and drive foot traffic.
RELEVANT RETAILERS
Seeking Centers That Are:Well-located
Well-conceivedWell-merchandised
Regency's neighborhood & community shopping centers,
conveniently located close to the customer, are enhanced by our
Fresh Look® philosophy that focuses on optimizing merchandising,
placemaking and connecting at our shopping centers.
TARGETED LOCATIONS
High-QualityBarriers to Entry
Attractive DemographicsClose to Customer
Regency's high-quality portfolio, evidenced by ABR PSF among the
highest in the sector, as well as attractive demographics averaging
145,000 people and average incomes of $120,000 within 3-mile radius, is positioned to thrive and
sustain average NOI growth of 3%+ over the long term.
Source: i. Evercore 3/11/19 Annual Demo Update, Green Street Advisors - Sector Update 5/16/19

7
Retail LandscapeBest-In-Class Operators Opening New Locations in High-Quality Centers
High-quality physical locations remain a critical component of retail strategy, with many retailers focusing on new store growth.
Expansion plans of 100 new locations into
the Carolinas and Virginia plus 9 new
Greenwise locations.
Plans to reaccelerate footprint growth
with focus on flagship banner.
Expects to open ~240 net new stores in fiscal year 2019.
Plans to open as many as 3,000
physical locations.
Raised its long-term projected store potential 3,000
locations from 1,700.
Focused on new store growth
with ~150 locations planned in 2019.
Long-term goal of 1,500 to 1,700
new stores, with 80 planned in 2019.
More than 500 studios in the new location pipeline.
Plans to open 30 stores per year for the near term.
Expecting to open 225 locations in 2019 and 500 within
next 3 years.
Sources: Green Street Advisors, Company Filings, Creditntell Special Analysis 5/16/19

8
Grocer LandscapeThe Future of Grocery
Winning grocers are investing in critical aspects of their evolving business to remain relevant.
A physical store presence, close to the customer, is the foundation of a
successful multichannel strategy.
Supported by the physical store, a successful e-commerce platform is
critical in the future of grocery.
nn Restock Kroger strategic initiative: Customer Experience, Customer Value, Develop Talent, and Live Kroger's Purpose
nn Partnership with Microsoft that will reinvent the customer experience driven by data and technology
nn Self-checkout, Scan-Bag-Go, LED lit shelves and cloud-based signage
nn Digital sales have increased >50%
nn Partnered with Ocado to build out infrastructure for online sales and delivery
nn Expanded Pickup or Delivery sales to reach 91% of Kroger households
nn $1.5B Capital Plan for Redevelopment
nn Expansion plans into new markets
nn Expect 100 new store locations
nn Renewed focus on Greenwise Markets
nn Publix Delivery app option for delivery or pick-up all powered through Instacart
nn Remerchandising 400 stores: more fresh, natural and organic products and some with gourmet and artisanal products, upscale décor and experiential elements
nn Expanding "Plated" meal kit delivery and "Drive Up and Go" stores
nn Same-day online delivery offered through Shipt and Instacart
nn Investments made in broader technology strategy and emerging technologies impacting the grocery business
nn Amazon's acquisition of Whole Foods and recent reports on launch of new grocery store business, demonstrates critical advantage of a brick-and-mortar presence close to the customer
nn Whole Foods will have new store growth and openings
nn Whole Foods benefiting from synergies with Amazon, resulting in lower prices, savings for Prime members and Prime Now delivery
nn Delivery through Amazon's Prime Now platform
nn Store delivery expanding, offering ultrafast delivery on in-store products
Sources: Retailer Radar – Suntrust, Creditntell, Company’s website, Company’s 10-Q, USA Today, Business Insider
9
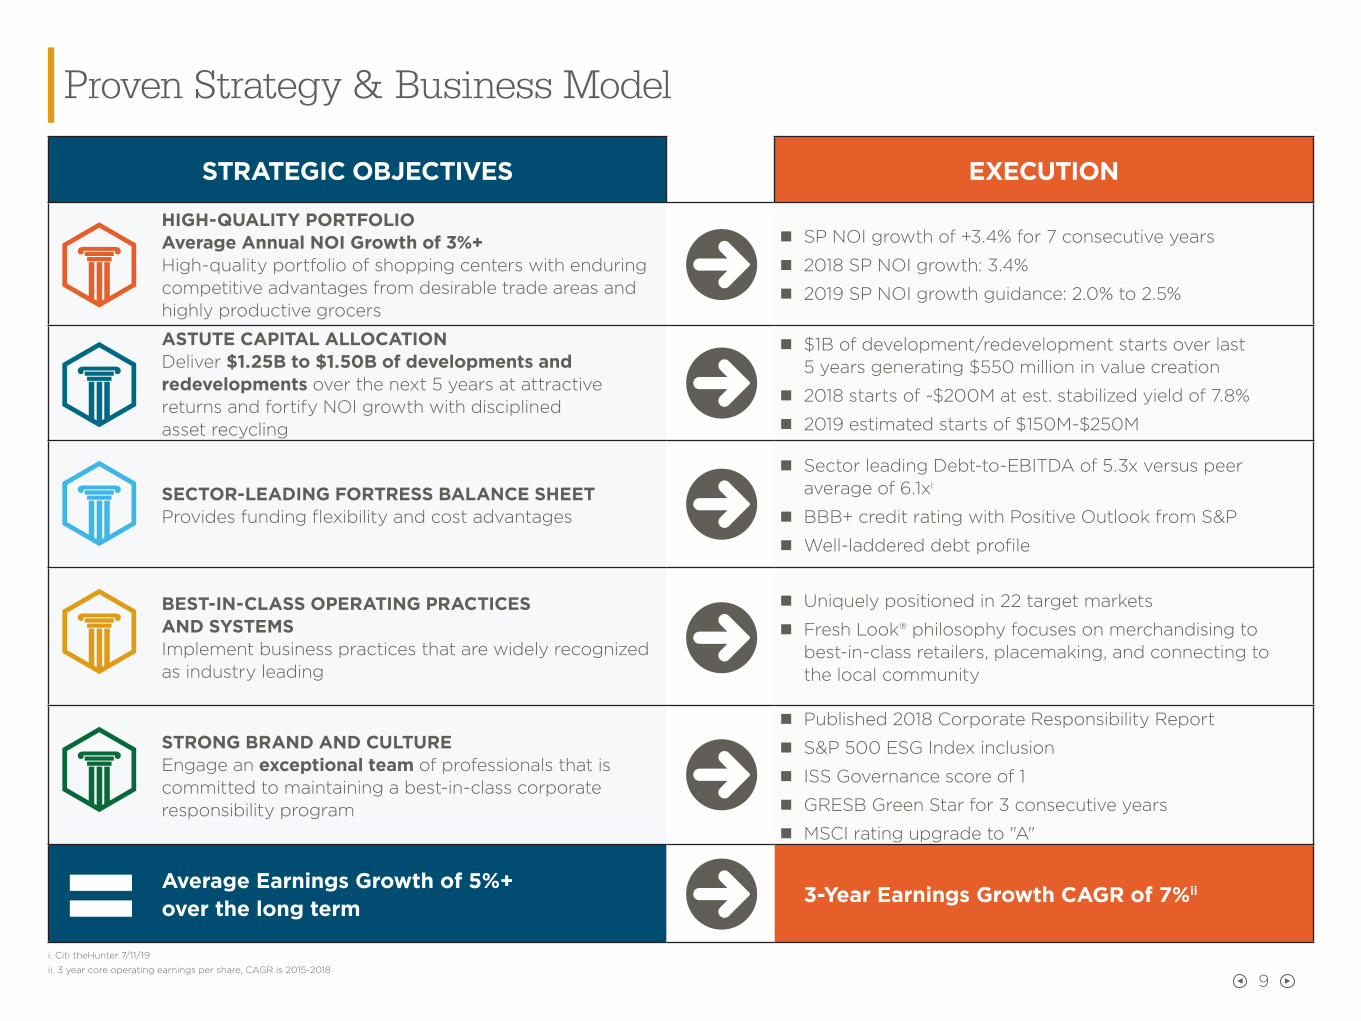
Proven Strategy & Business Model
STRATEGIC OBJECTIVES EXECUTION
HIGH-QUALITY PORTFOLIO Average Annual NOI Growth of 3%+ High-quality portfolio of shopping centers with enduring competitive advantages from desirable trade areas and highly productive grocers
nn SP NOI growth of +3.4% for 7 consecutive years
nn 2018 SP NOI growth: 3.4%
nn 2019 SP NOI growth guidance: 2.0% to 2.5%
ASTUTE CAPITAL ALLOCATION Deliver $1.25B to $1.50B of developments and redevelopments over the next 5 years at attractive returns and fortify NOI growth with disciplined asset recycling
nn $1B of development/redevelopment starts over last 5 years generating $550 million in value creation
nn 2018 starts of ~$200M at est. stabilized yield of 7.8%
nn 2019 estimated starts of $150M-$250M
SECTOR-LEADING FORTRESS BALANCE SHEETProvides funding flexibility and cost advantages
nn Sector leading Debt-to-EBITDA of 5.3x versus peer average of 6.1xi
nn BBB+ credit rating with Positive Outlook from S&P
nn Well-laddered debt profile
BEST-IN-CLASS OPERATING PRACTICES AND SYSTEMSImplement business practices that are widely recognized as industry leading
nn Uniquely positioned in 22 target markets
nn Fresh Look® philosophy focuses on merchandising to best-in-class retailers, placemaking, and connecting to the local community
STRONG BRAND AND CULTUREEngage an exceptional team of professionals that is committed to maintaining a best-in-class corporate responsibility program
nn Published 2018 Corporate Responsibility Report
nn S&P 500 ESG Index inclusion
nn ISS Governance score of 1
nn GRESB Green Star for 3 consecutive years
nn MSCI rating upgrade to "A"
Average Earnings Growth of 5%+ over the long term 3-Year Earnings Growth CAGR of 7%ii
i. Citi theHunter 7/11/19
ii. 3 year core operating earnings per share, CAGR is 2015-2018

HIGH QUALITYPORTFOLIO
Portfolio Overview
421Properties
95.1%Leasedi
56M+ SFTotal GLA
~9,000Total Tenants
$22+ PSFAverage ABR
80%of properties are grocery anchored
i. Same property portfolio
ii. Annualized base rent as of 6/30/2019
* Converted 2018 sales in Euros to USD
** Nordstrom Rack revenues shown are for Nordstrom parent company
GROCERY-ANCHORED
COMMUNITY AND NEIGHBORHOOD CENTERS (NON-GROCER)
OTHER
POWER AND LIFESTYLE CENTERS
*Pro rata NOI
10
11
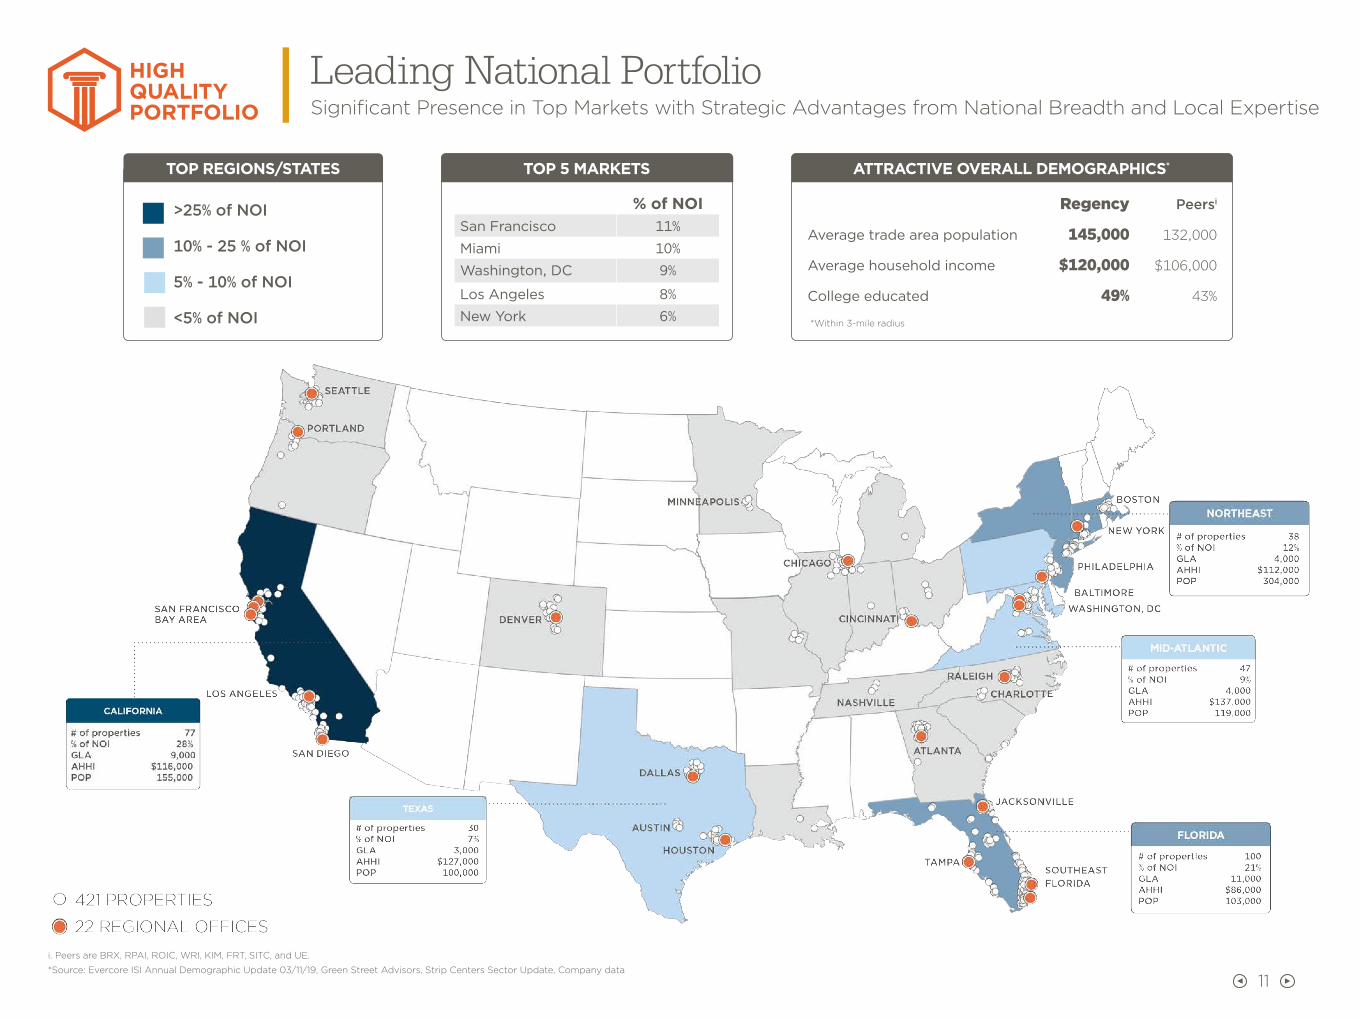
HIGH QUALITYPORTFOLIO
Leading National PortfolioSignificant Presence in Top Markets with Strategic Advantages from National Breadth and Local Expertise
TOP REGIONS/STATES
>25% of NOI
10% - 25 % of NOI
5% - 10% of NOI
<5% of NOI
TOP 5 MARKETS
% of NOISan Francisco 11%
Miami 10%
Washington, DC 9%
Los Angeles 8%
New York 6%
ATTRACTIVE OVERALL DEMOGRAPHICS*
Regency Peersi
Average trade area population 145,000 132,000
Average household income $120,000 $106,000
College educated 49% 43%
*Within 3-mile radius
i. Peers are BRX, RPAI, ROIC, WRI, KIM, FRT, SITC, and UE.
*Source: Evercore ISI Annual Demographic Update 03/11/19, Green Street Advisors, Strip Centers Sector Update, Company data

12
HIGH QUALITYPORTFOLIO
Premier Asset Quality and Trade Areas
Premier centers are those with inherent characteristics that will position a center with long-term competitive advantages, resulting in superior NOI growth,
including strong trade areas that feature buying power and spending growth surrounding a shopping center with a top competitive position.
Asset Quality DNAi
i. Based upon Regency Centers proprietary quality model as % of pro-rata value.
13
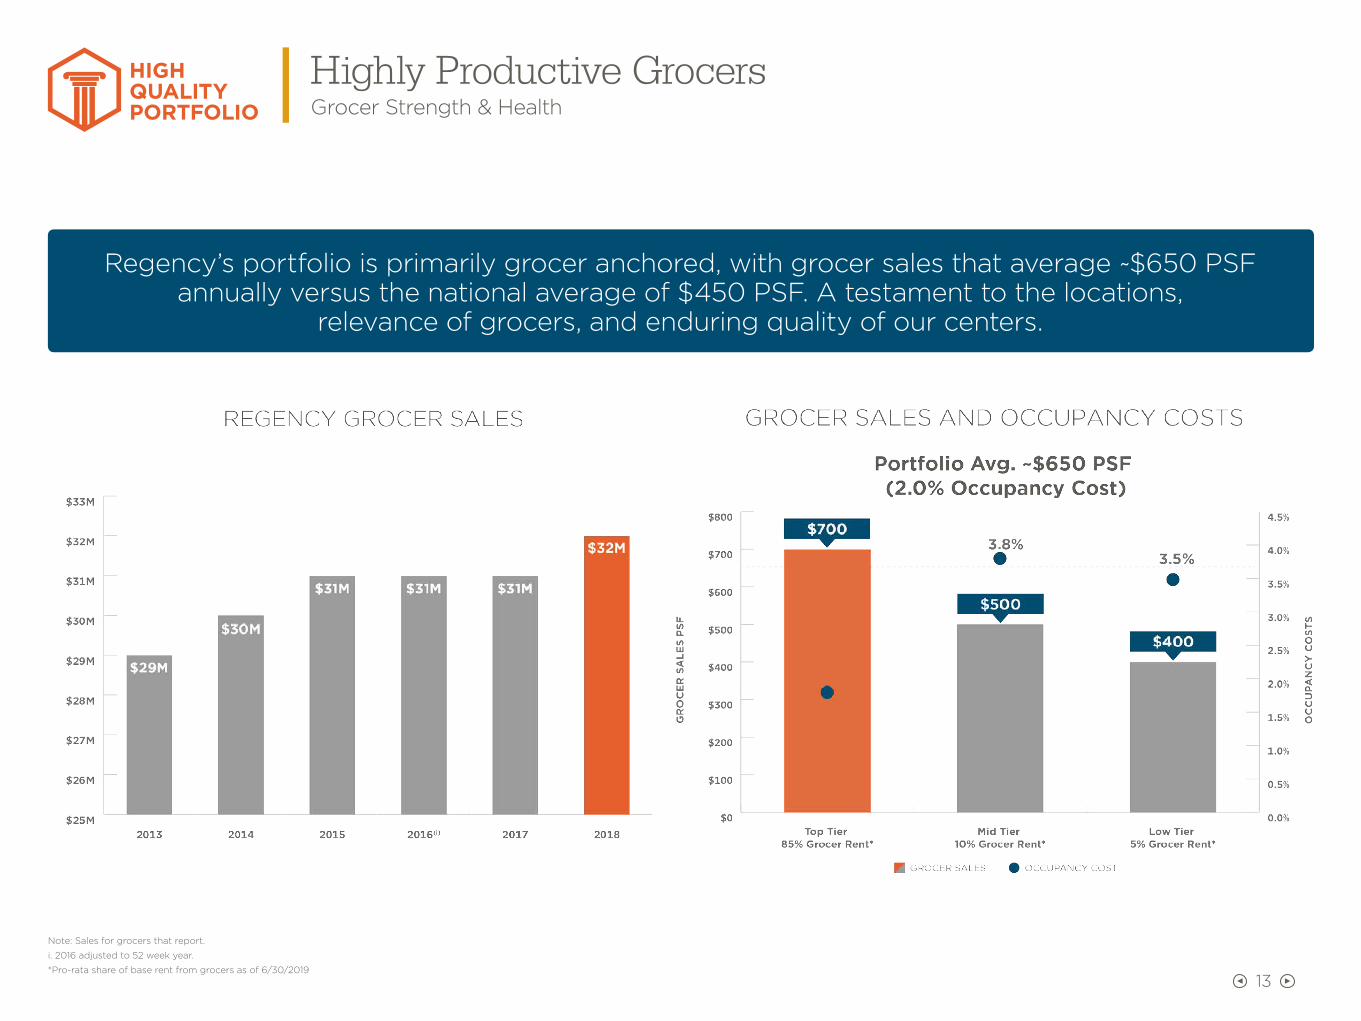
HIGH QUALITYPORTFOLIO
Highly Productive GrocersGrocer Strength & Health
Regency’s portfolio is primarily grocer anchored, with grocer sales that average ~$650 PSF annually versus the national average of $450 PSF. A testament to the locations,
relevance of grocers, and enduring quality of our centers.
Note: Sales for grocers that report.
i. 2016 adjusted to 52 week year.
*Pro-rata share of base rent from grocers as of 6/30/2019
14
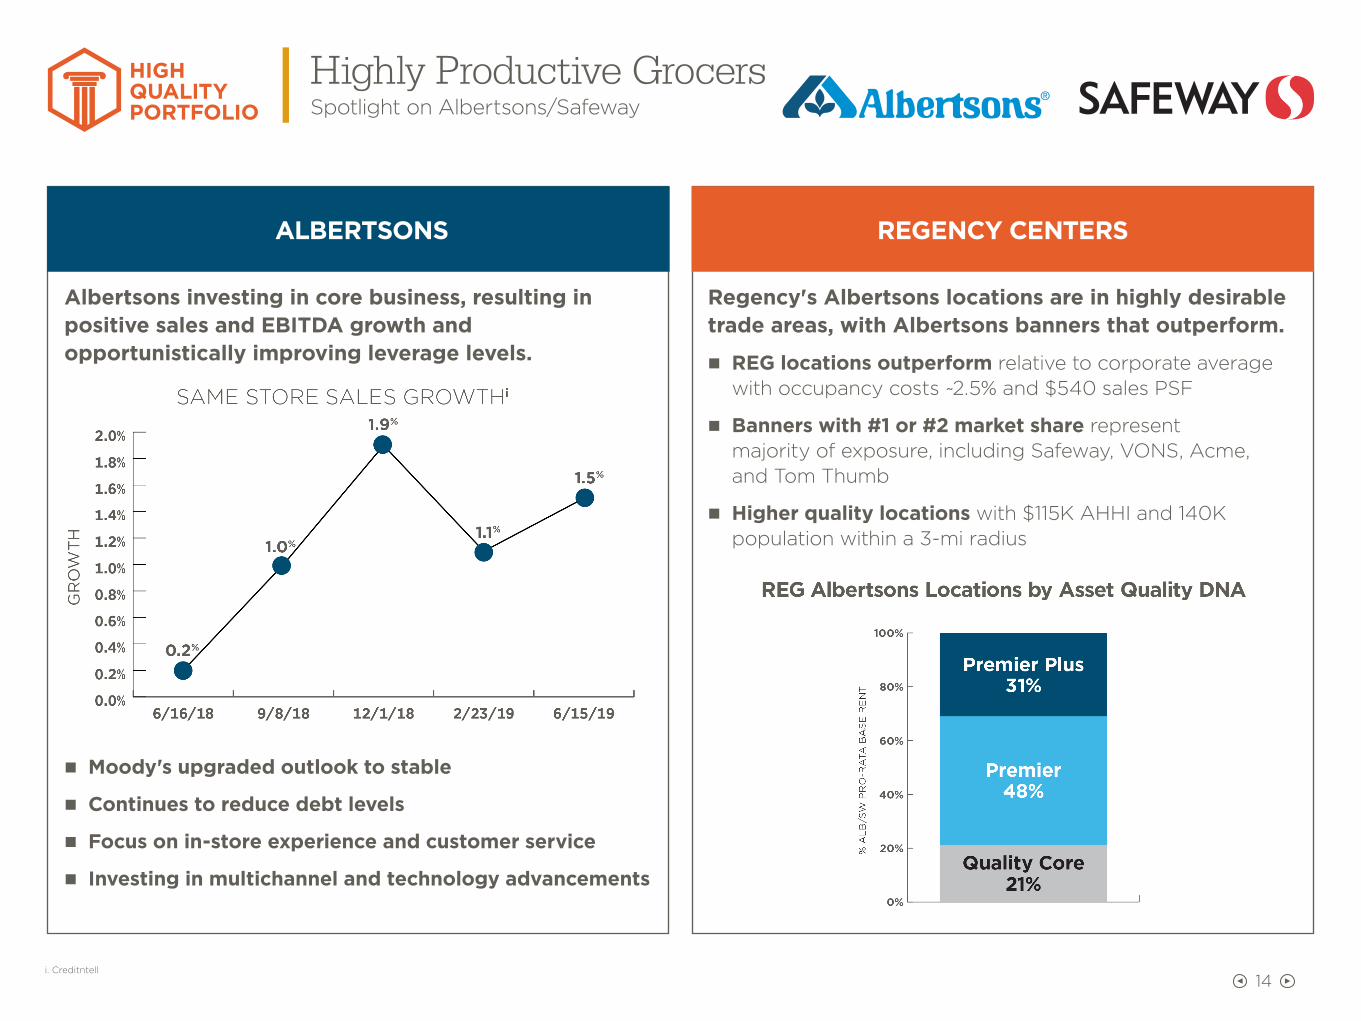
HIGH QUALITYPORTFOLIO
Highly Productive GrocersSpotlight on Albertsons/Safeway
ALBERTSONS
Albertsons investing in core business, resulting inpositive sales and EBITDA growth and opportunistically improving leverage levels.
nn Moody's upgraded outlook to stable
nn Continues to reduce debt levels
nn Focus on in-store experience and customer service
nn Investing in multichannel and technology advancements
REGENCY CENTERS
Regency's Albertsons locations are in highly desirable trade areas, with Albertsons banners that outperform.
nn REG locations outperform relative to corporate average with occupancy costs ~2.5% and $540 sales PSF
nn Banners with #1 or #2 market share represent majority of exposure, including Safeway, VONS, Acme, and Tom Thumb
nn Higher quality locations with $115K AHHI and 140K population within a 3-mi radius
i. Creditntell
15
HIGH QUALITYPORTFOLIO
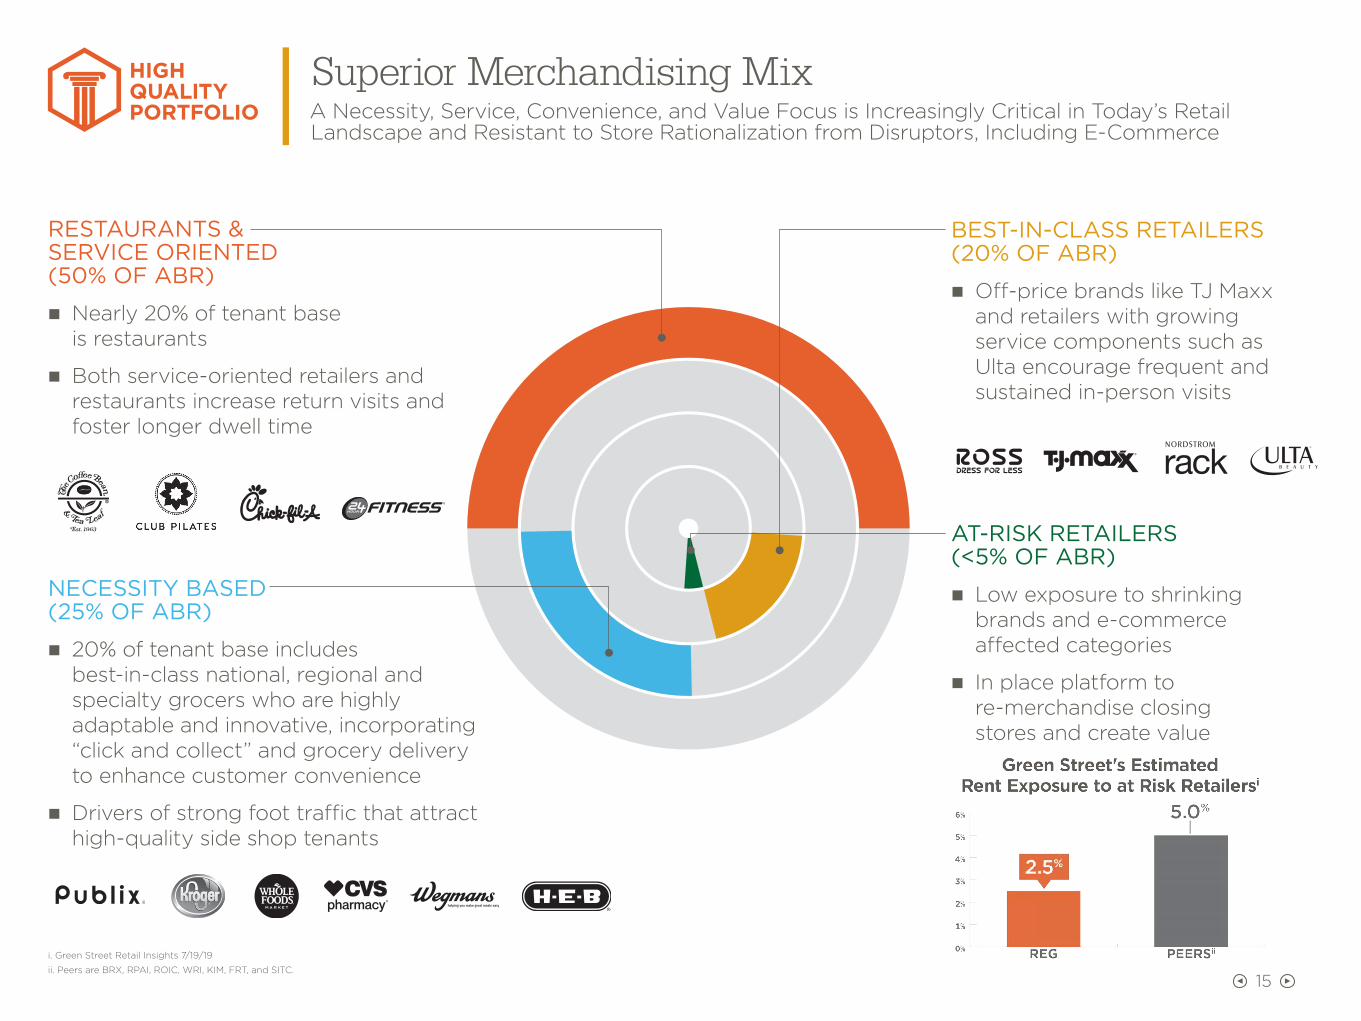
Superior Merchandising MixA Necessity, Service, Convenience, and Value Focus is Increasingly Critical in Today’s Retail Landscape and Resistant to Store Rationalization from Disruptors, Including E-Commerce
RESTAURANTS & SERVICE ORIENTED (50% OF ABR)
nn Nearly 20% of tenant base is restaurants
nn Both service-oriented retailers and restaurants increase return visits and foster longer dwell time
NECESSITY BASED (25% OF ABR)
nn 20% of tenant base includes best-in-class national, regional and specialty grocers who are highly adaptable and innovative, incorporating “click and collect” and grocery delivery to enhance customer convenience
nn Drivers of strong foot traffic that attract high-quality side shop tenants
BEST-IN-CLASS RETAILERS (20% OF ABR)
nn Off-price brands like TJ Maxx and retailers with growing service components such as Ulta encourage frequent and sustained in-person visits
AT-RISK RETAILERS (<5% OF ABR)
nn Low exposure to shrinking brands and e-commerce affected categories
nn In place platform to re-merchandise closing stores and create value
i. Green Street Retail Insights 7/19/19
ii. Peers are BRX, RPAI, ROIC, WRI, KIM, FRT, and SITC.
16
HIGH QUALITYPORTFOLIO
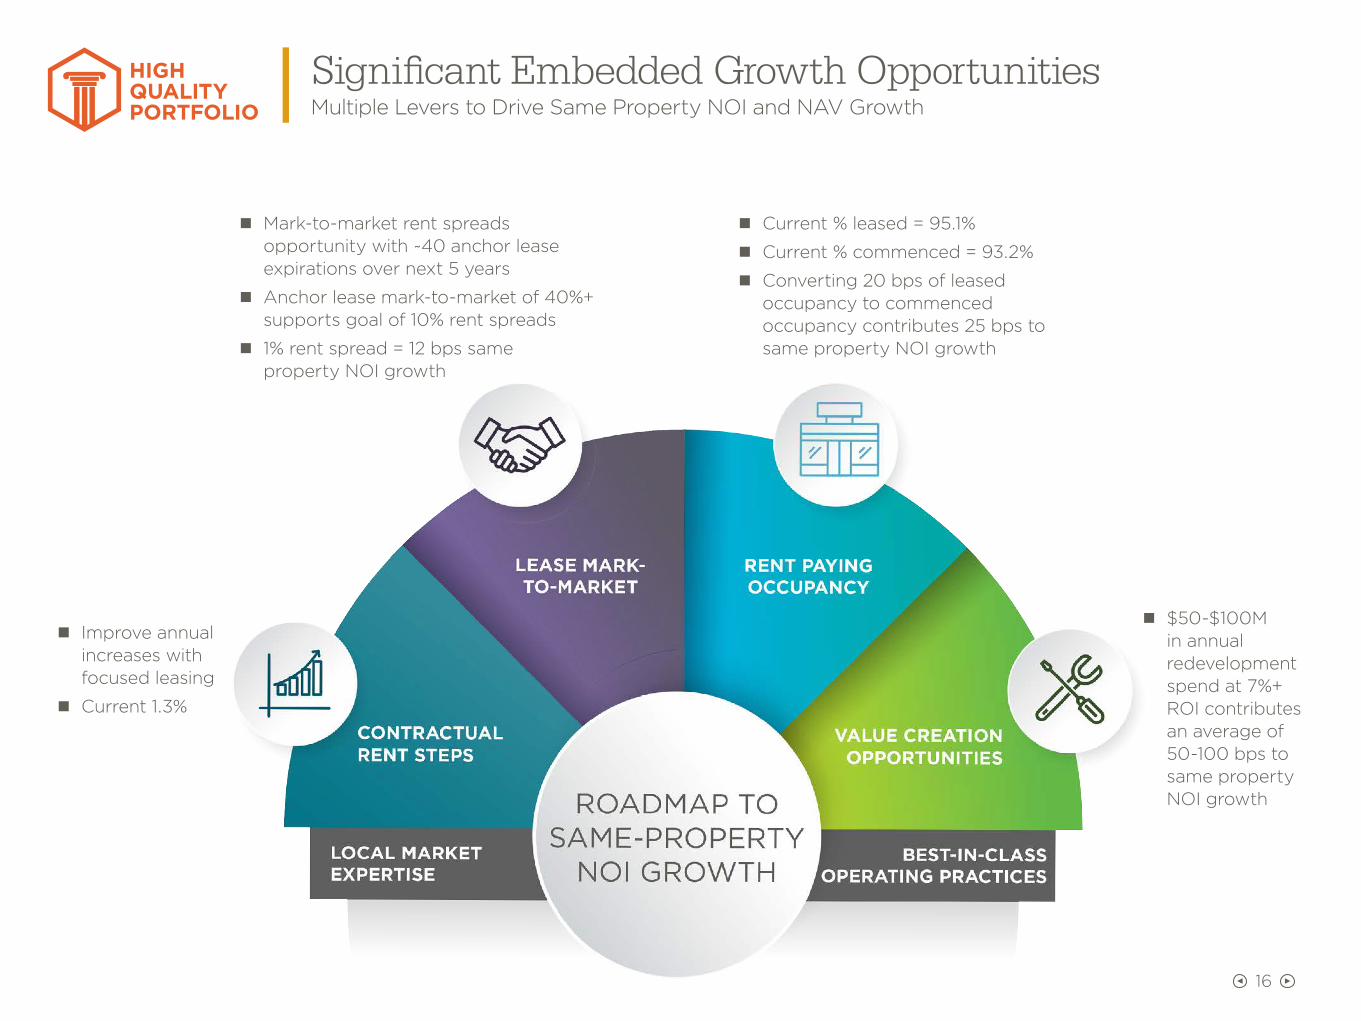
Significant Embedded Growth Opportunities Multiple Levers to Drive Same Property NOI and NAV Growth
nn Improve annual increases with focused leasing
nn Current 1.3%
nn Mark-to-market rent spreads opportunity with ~40 anchor lease expirations over next 5 years
nn Anchor lease mark-to-market of 40%+ supports goal of 10% rent spreads
nn 1% rent spread = 12 bps same property NOI growth
nn Current % leased = 95.1%
nn Current % commenced = 93.2%
nn Converting 20 bps of leased occupancy to commenced occupancy contributes 25 bps to same property NOI growth
nn $50-$100M in annual redevelopment spend at 7%+ ROI contributes an average of 50-100 bps to same property NOI growth

17
HIGH QUALITYPORTFOLIO
Track Record of Sustained OutperformanceSame Property NOI CAGR
Regency has a proven track record of sector-leading same property NOI growth over the long term. We are confident in our ability to achieve our objective of
averaging same property NOI growth of 3%+ over the next 5 years.
Source: Citi, theHunter for 2019E growth, Company filings
Note: Peer Avg excludes REG

18
ASTUTECAPITALALLOCATION
Astute Capital AllocationFree Cash Flow Fully Funds Developments and Redevelopments on a Leverage Neutral Basis
SOURCES
Free Cash Flow is the Foundation of Self-Funded Leverage Neutral Business Model
DISPOSITION OF LOWER GROWTH ASSETS +/- 1% of
$15B portfolio
FREE CASH FLOW
~$170M Annually
EQUITY When Priced Attractively
DEBT On a Leverage Neutral Basis
USES
Value Creation that Enhances NAV and Property Quality, While Fortifying 3%+ Same Property NOI Growth and Free Cash Flow
ACQUISITIONS With Superior
Growth
DEVELOPMENT/ REDEVELOPMENT at Compelling Yields ~$250M+ Annually
SHARE REPURCHASES
When Priced Attractively

19
ASTUTECAPITALALLOCATION
Astute Capital AllocationTrack Record of Value Creation
i. Represents the ratio of Regency’s underwritten NOI at stabilization to total estimated net development costs, before any adjustments for expected JV partner buyouts.
20
ASTUTECAPITALALLOCATION
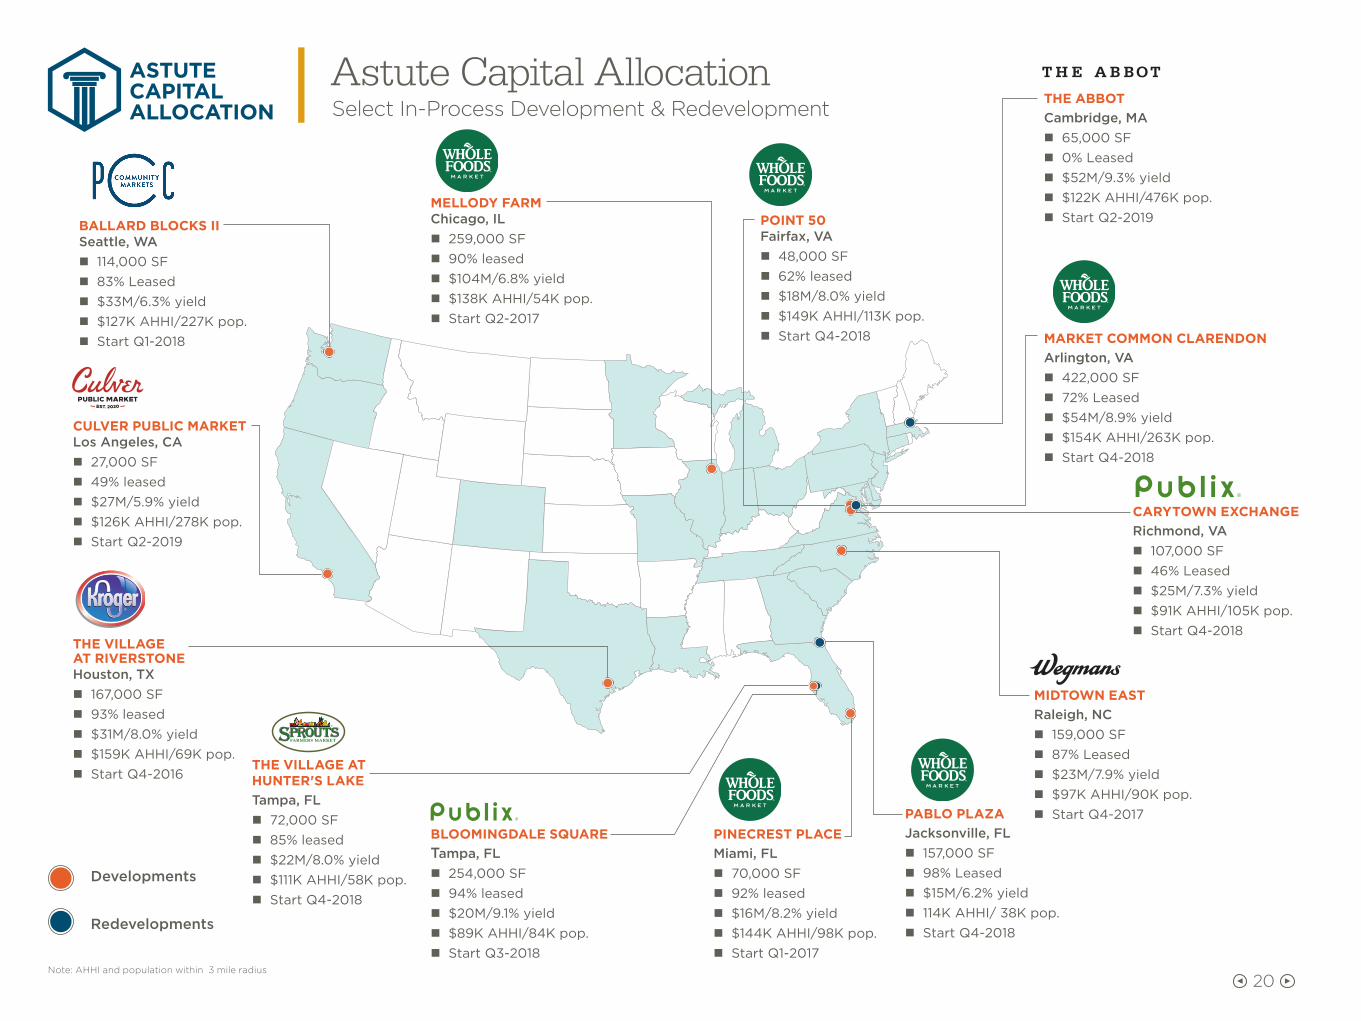
Astute Capital AllocationSelect In-Process Development & Redevelopment
Developments
Redevelopments
BALLARD BLOCKS IISeattle, WA
n 114,000 SF n 83% Leased n $33M/6.3% yield n $127K AHHI/227K pop. n Start Q1-2018
CULVER PUBLIC MARKETLos Angeles, CA
n 27,000 SF n 49% leased n $27M/5.9% yield n $126K AHHI/278K pop. n Start Q2-2019
THE VILLAGE AT RIVERSTONEHouston, TX
n 167,000 SF n 93% leased n $31M/8.0% yield n $159K AHHI/69K pop. n Start Q4-2016
THE VILLAGE AT HUNTER'S LAKETampa, FL
n 72,000 SF n 85% leased n $22M/8.0% yield n $111K AHHI/58K pop. n Start Q4-2018
BLOOMINGDALE SQUARETampa, FL
n 254,000 SF n 94% leased n $20M/9.1% yield n $89K AHHI/84K pop. n Start Q3-2018
PINECREST PLACEMiami, FL
n 70,000 SF n 92% leased n $16M/8.2% yield n $144K AHHI/98K pop. n Start Q1-2017
PABLO PLAZAJacksonville, FL
n 157,000 SF n 98% Leased n $15M/6.2% yield n 114K AHHI/ 38K pop. n Start Q4-2018
MIDTOWN EASTRaleigh, NC
n 159,000 SF n 87% Leased n $23M/7.9% yield n $97K AHHI/90K pop. n Start Q4-2017
CARYTOWN EXCHANGERichmond, VA
n 107,000 SF n 46% Leased n $25M/7.3% yield n $91K AHHI/105K pop. n Start Q4-2018
MARKET COMMON CLARENDONArlington, VA
n 422,000 SF n 72% Leased n $54M/8.9% yield n $154K AHHI/263K pop. n Start Q4-2018
THE ABBOTCambridge, MA
n 65,000 SF n 0% Leased n $52M/9.3% yield n $122K AHHI/476K pop. n Start Q2-2019POINT 50
Fairfax, VA n 48,000 SF n 62% leased n $18M/8.0% yield n $149K AHHI/113K pop. n Start Q4-2018
MELLODY FARMChicago, IL
n 259,000 SF n 90% leased n $104M/6.8% yield n $138K AHHI/54K pop. n Start Q2-2017
Note: AHHI and population within 3 mile radius

21
ASTUTECAPITALALLOCATION
Future Value CreationDevelopment and Redevelopment Pipeline
Strategic objective: Deliver $1.25B to $1.50B over next 5 years
Ground Up Developments
Ground-up construction of a new operating shopping center in a location without material preexisting retail real estate.
CARYTOWN EXCHANGE Richmond, VA
Identified Locations n Washington, D.C.
n Denver
n Jacksonville
n Los Angeles
n Houston
n Dallas
n Miami
Larger Scale Redevelopments
Redevelopment of an existing retail real estate site where the investment is large, relative to the total development and redevelopment program, and results in a complete transformation of the center. In some instances will incorporate mixed use components that may or may not be part of the total investment from Regency.
COSTA VERDE CENTER San Diego, CA
Identified Locations n Washington, D.C. | Westwood Shopping Center
n San Diego | Costa Verde Center
n Atlanta | Piedmont Peachtree Crossing
n San Francisco | Serramonte Center
n Los Angeles | Town and Country Center
n San Francisco | Potrero Center
n Austin | Hancock Shopping Center
Core Redevelopments
Redevelopment of an existing retail real estate site that includes one or more of the following: addition of GLA through tenant expansion, outparcel development and/or other enhancements that change the competitive position of the center.
POINT 50 Fairfax, VA
Identified Locations n Miami | Gateway Plaza at Aventura
n Westport | The Village Center
n Miami | West Bird Plaza
n Fort Lauderdale | Young Circle Shopping Center
n Tampa | Regency Square
n Charlotte | Carmel Commons
n Atlanta | Dunwoody Village
Note: Scope and economics of development and redevelopment program and projects could change materially from estimated data provided due to one or more of the following:
any significant changes in the economy, market conditions, tenant requirements and demands, construction costs, new supply, regulatory and entitlement processes or project design.

22
ASTUTECAPITALALLOCATION
Astute Capital AllocationDisciplined Retail Development and Redevelopment Leading to Significant Value Creation
nn Regency invests in Premier shopping centers in dense infill and affluent trade areas with dominant anchors and a focus on long-term growth potential
nn Regency’s core competency is retail development and redevelopment. We are well positioned to capitalize on increasing opportunities for adjacent and vertical mixed use projects, resulting from “Work, Live, Play” lifestyles where retail is the primary driver of the project
nn Regency partners with best-in-class operators and developers of non-retail uses that enhance our retail project
nn Regency's projects in development and/or pipeline include 6M+ SF of mixed-use projects
Select in-process and pipeline retail projects that incorporate a mix of uses:
BALLARD BLOCKS Seattle, WA
Multi-level existing urban retail acquired in 2018 along with adjacent land for mixed use ground-
up development. In-process development includes space for retail, office and medical uses.
TOWN & COUNTRY CENTER Los Angeles, CA
Operating retail property acquired in 2018 with densification redevelopment
opportunity, where Regency will redevelop retail and ground lease mid-rise apartments
to best-in-class residential developer and operator Holland Partner Group.
WESTWOOD SHOPPING CENTER Bethesda, MD
Operating retail property with densification redevelopment opportunity to include retail and residential. Regency will redevelop the retail component in phases while partnering with a best-in-class residential developer and operator and invest a minority interest in the
residential component.

23
ASTUTECAPITALALLOCATION
Redevelopment Spotlight — In-ProcessThe Abbot, Cambridge, MA
Transformative Mixed-Use Redevelopment
nn Located in the heart of Harvard Square
nn Project start in 2Q 2019
nn Restoration of 65K SF historic building into a modern, flagship mixed-use project with retail/office uses
nn Total project investment of $52M, yielding 9.3%+ at stabilization
nn Estimated project stabilization in 2021
nn 3-mi Demographics: $120K AHHI/224K pop
MT. AUBURN STREET
WINTHROP STREET
MT. AUBURN STREET
BRATTLE STREET
MT. AUBURN STREET
MASSACHUSETTS AVENUE
BRATTLE STREET
CHURCH STREET
JFK S
TREET
ELIOT STREET
SMITH CAMPUS CENTERALL TENANTS COMING SOON
7,181 Undergrad Students
14,044 Post-Grad Students
15,107 Staff
RENDERING
24
ASTUTECAPITALALLOCATION
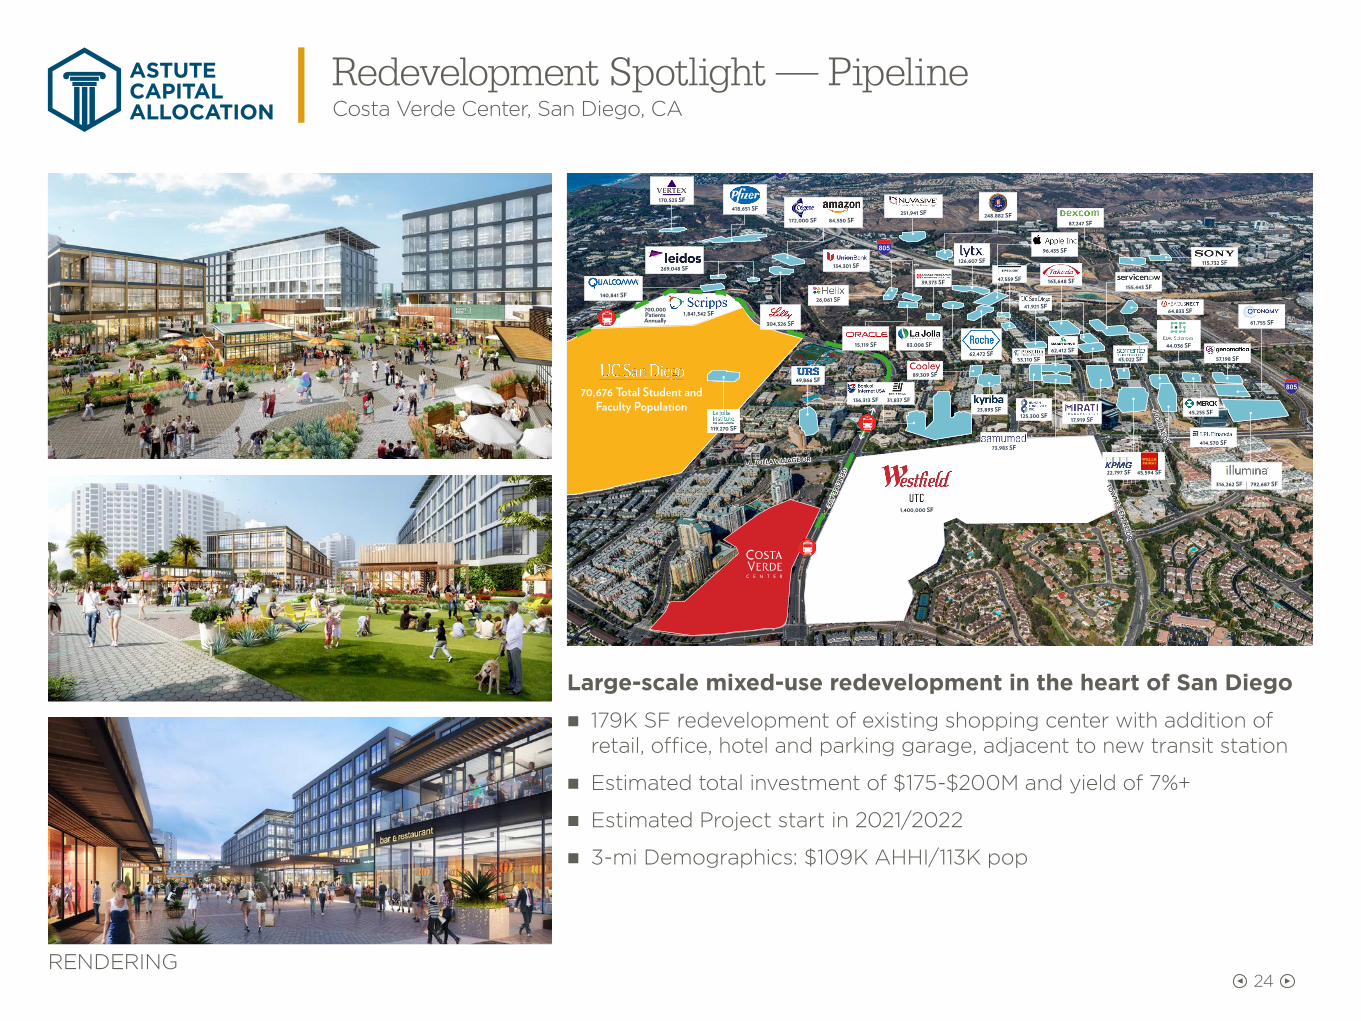
Redevelopment Spotlight — PipelineCosta Verde Center, San Diego, CA
Large-scale mixed-use redevelopment in the heart of San Diego
nn 179K SF redevelopment of existing shopping center with addition of retail, office, hotel and parking garage, adjacent to new transit station
nn Estimated total investment of $175-$200M and yield of 7%+
nn Estimated Project start in 2021/2022
nn 3-mi Demographics: $109K AHHI/113K pop
170,523 SF
248,882 SF
126,607 SF
39,373 SF
125,300 SF23,893 SF
89,309 SF
44,036 SF
418,651 SF
140,841 SF
251,941 SF
49,866 SF
26,061 SF
62,472 SF
134,301 SF
61,755 SF
73,983 SF
83,008 SF
53,110 SF
41,921 SF
96,435 SF
163,648 SF155,443 SF
57,198 SF
414,570 SF
45,255 SF17,919 SF
43,022 SF62,412 SF
87,247 SF
115,732 SF
64,833 SF
269,048 SF
172,000 SF 84,550 SF
316,262 SF 792,687 SF
22,797 SF 45,594 SFLA JOLLA VILLAGE DR
TOW
NE C
ENTRE D
R
47,559 SF
JUD
ICIA
L DR
136,313 SF 31,837 SF
15,119 SF
304,326 SF
GEN
ESEE AV
E
1,841,342 SF700,000 Patients Annually
70,676 Total Student and Faculty Population
1,400,000 SF
119,270 SF
RENDERING

25
SECTOR-LEADING FORTRESS BALANCE SHEET
Commitment to Conservative Financial RatiosSector-Leading Balance Sheet Affords Financial Flexibility
5.3xNet Debt to EBITDArei
4.3xFixed Charge Coveragei
BBB+Rating From S&P
Baa1Rating From Moody’s
$1.25BLine Of Credit
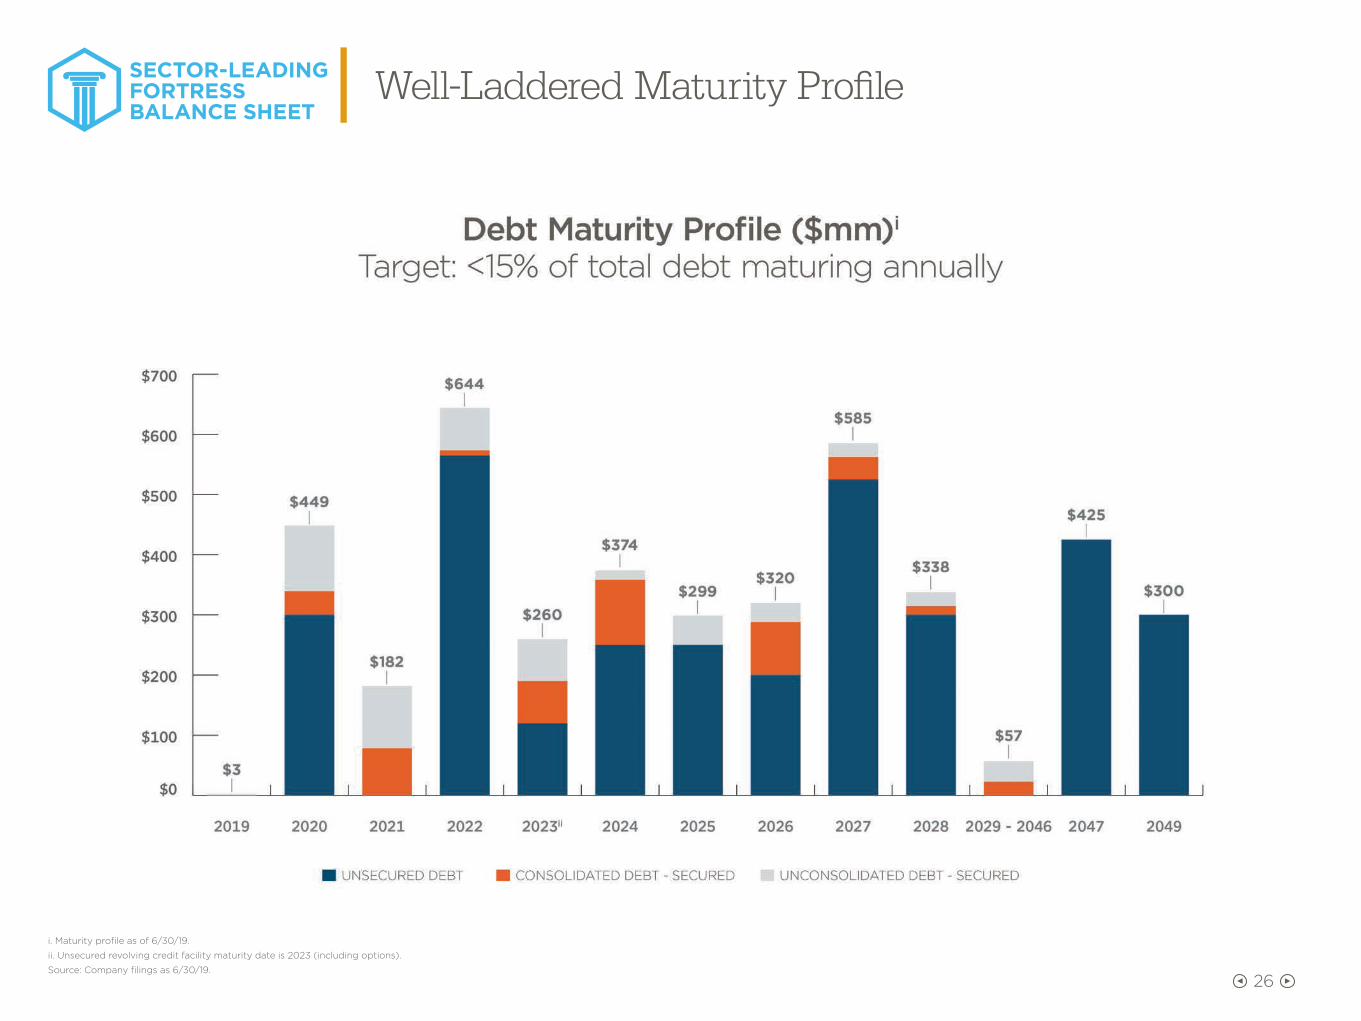
nn Well-laddered debt maturity profile with limited near-term maturities
nn Substantial liquidity and capacity with $1.25 billion line of credit
nn Large unencumbered asset pool and deep lender relationships
nn S&P 500 inclusion enhances liquidity
nn Positive outlook from S&P
Sources: Company filings as of 6/30/19, Citi theHunter
i. EBITDAare and FCCR are calculated on the trailing twelve months.
26
SECTOR-LEADING FORTRESS BALANCE SHEET
Well-Laddered Maturity Profile
i. Maturity profile as of 6/30/19.
ii. Unsecured revolving credit facility maturity date is 2023 (including options).
Source: Company filings as 6/30/19.
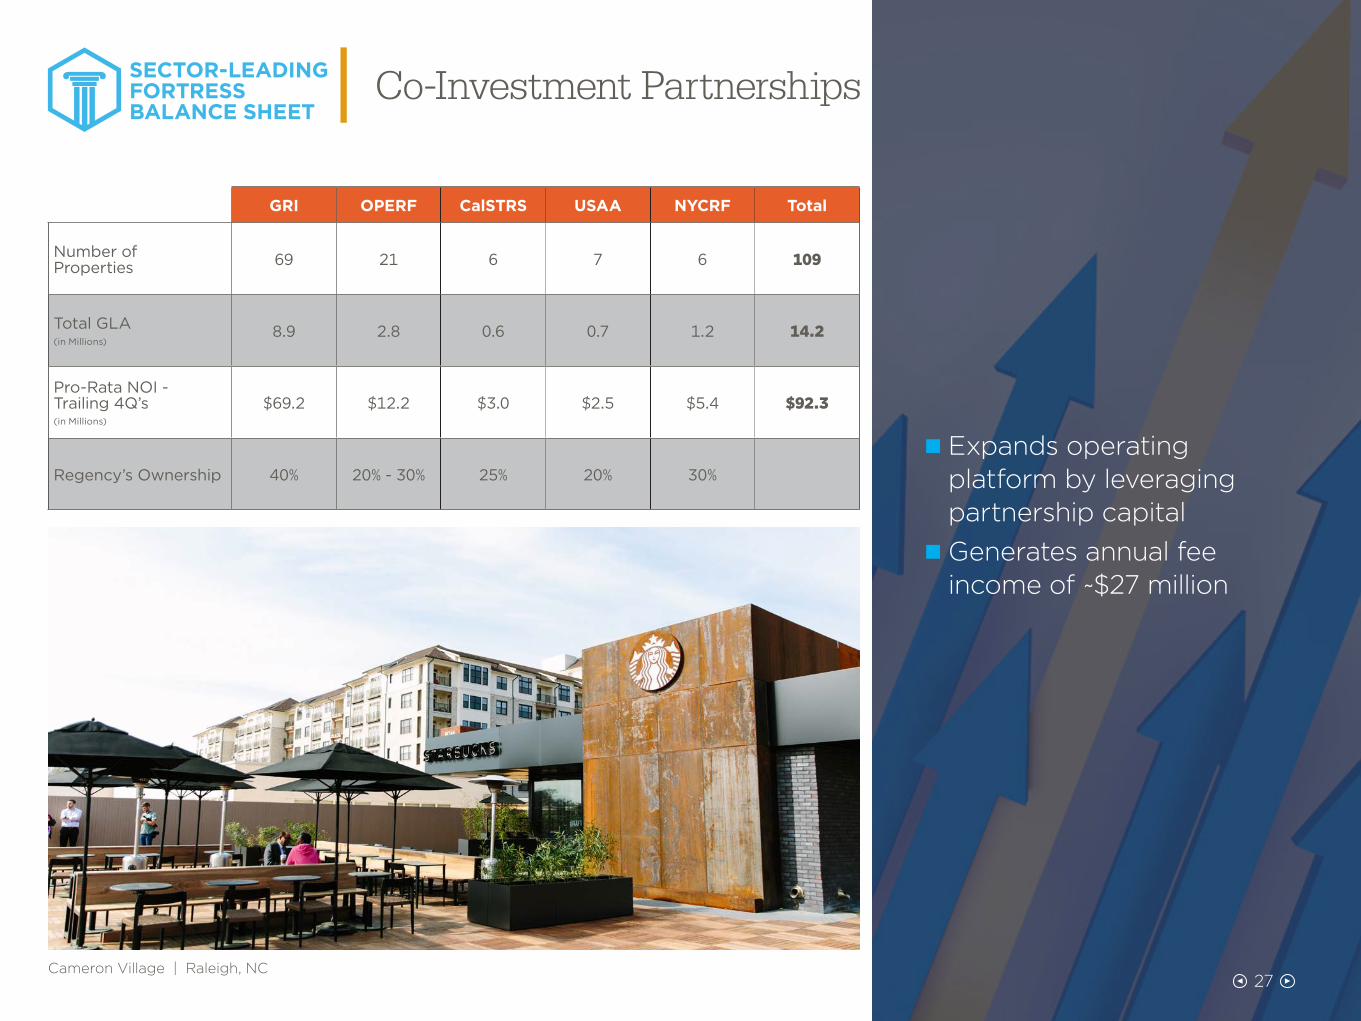
SECTOR-LEADING FORTRESS BALANCE SHEET
Co-Investment Partnerships
GRI OPERF CalSTRS USAA NYCRF Total
Number of Properties 69 21 6 7 6 109
Total GLA (in Millions)
8.9 2.8 0.6 0.7 1.2 14.2
Pro-Rata NOI - Trailing 4Q’s (in Millions)
$69.2 $12.2 $3.0 $2.5 $5.4 $92.3
Regency’s Ownership 40% 20% - 30% 25% 20% 30%
Cameron Village | Raleigh, NC
n Expands operating platform by leveraging partnership capital nGenerates annual fee income of ~$27 million
27
28
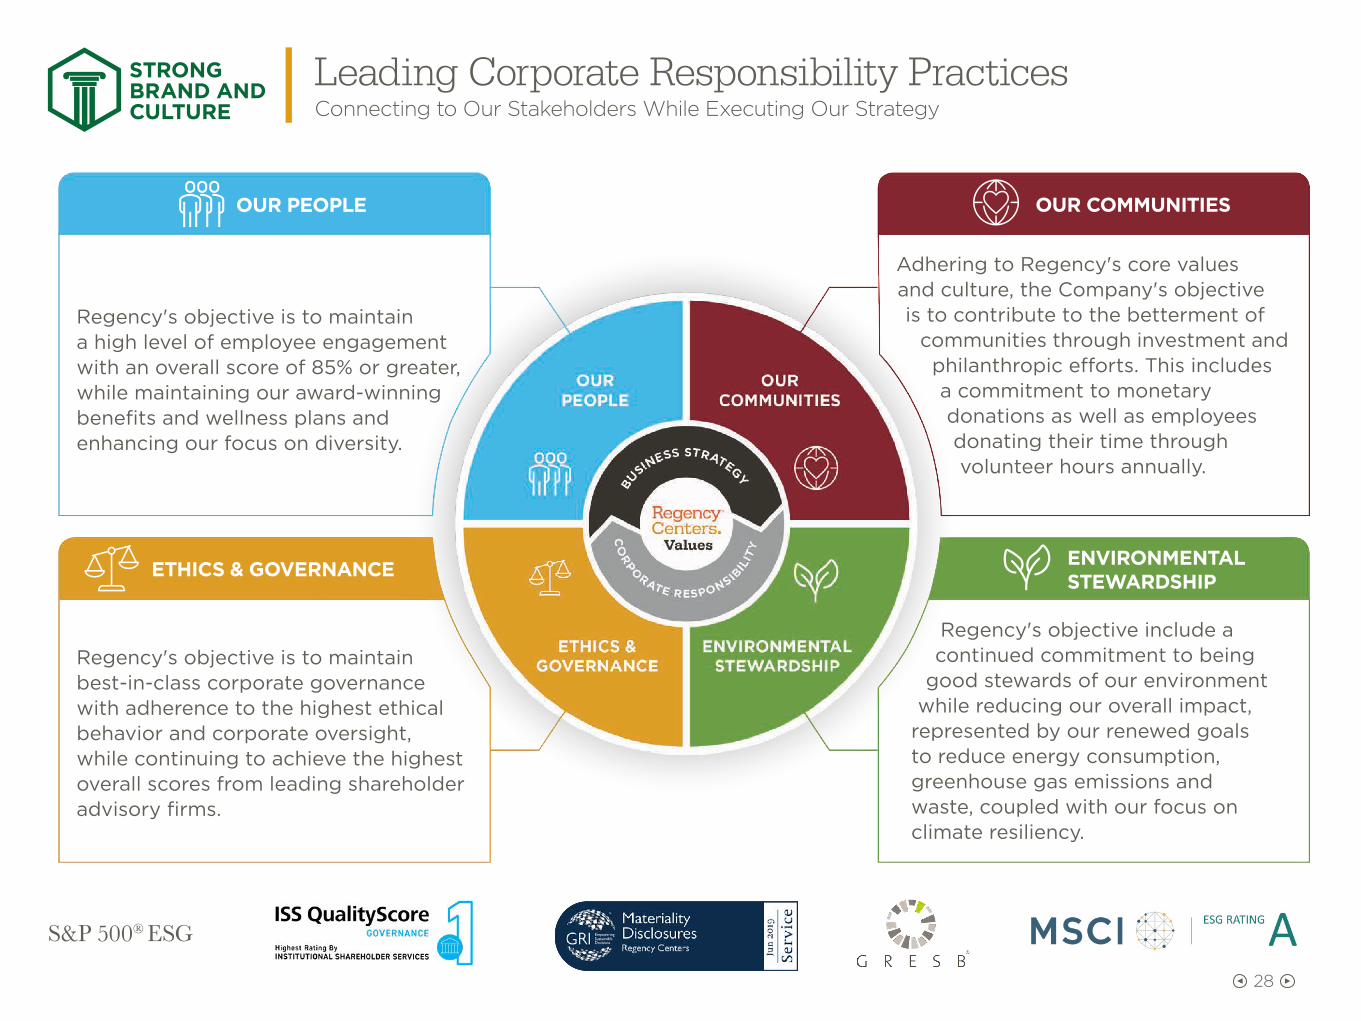
STRONG BRAND AND CULTURE
Leading Corporate Responsibility PracticesConnecting to Our Stakeholders While Executing Our Strategy
OUR PEOPLE
Regency's objective is to maintain a high level of employee engagement with an overall score of 85% or greater, while maintaining our award-winning benefits and wellness plans and enhancing our focus on diversity.
ETHICS & GOVERNANCE
Regency's objective is to maintain best-in-class corporate governance with adherence to the highest ethical behavior and corporate oversight, while continuing to achieve the highest overall scores from leading shareholder advisory firms.
OUR COMMUNITIES
Adhering to Regency's core values and culture, the Company's objective is to contribute to the betterment of
communities through investment and philanthropic efforts. This includes a commitment to monetary donations as well as employees donating their time through volunteer hours annually.
ENVIRONMENTALSTEWARDSHIP
Regency's objective include a continued commitment to being
good stewards of our environment while reducing our overall impact,
represented by our renewed goals to reduce energy consumption, greenhouse gas emissions and waste, coupled with our focus on climate resiliency.
S&P 500® ESG
29
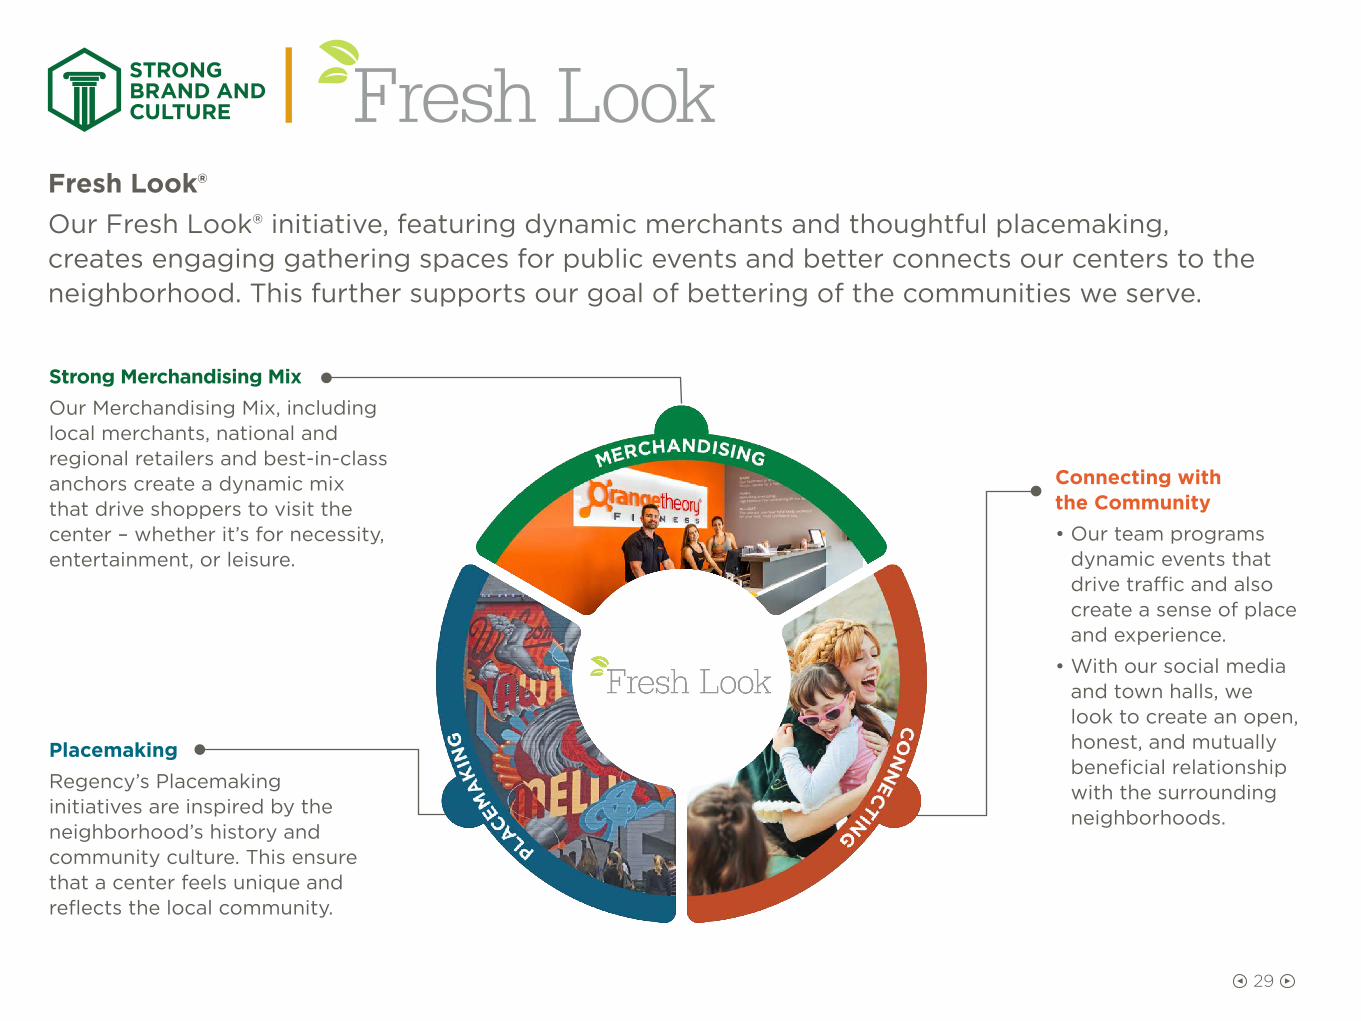
STRONG BRAND AND CULTURE
Fresh Look®Our Fresh Look® initiative, featuring dynamic merchants and thoughtful placemaking, creates engaging gathering spaces for public events and better connects our centers to the neighborhood. This further supports our goal of bettering of the communities we serve.
Strong Merchandising MixOur Merchandising Mix, including local merchants, national and regional retailers and best-in-class anchors create a dynamic mix that drive shoppers to visit the center – whether it’s for necessity, entertainment, or leisure.
PlacemakingRegency’s Placemaking initiatives are inspired by the neighborhood’s history and community culture. This ensure that a center feels unique and reflects the local community.
Connecting with the Community• Our team programs
dynamic events that drive traffic and also create a sense of place and experience.
• With our social media and town halls, we look to create an open, honest, and mutually beneficial relationship with the surrounding neighborhoods.
30
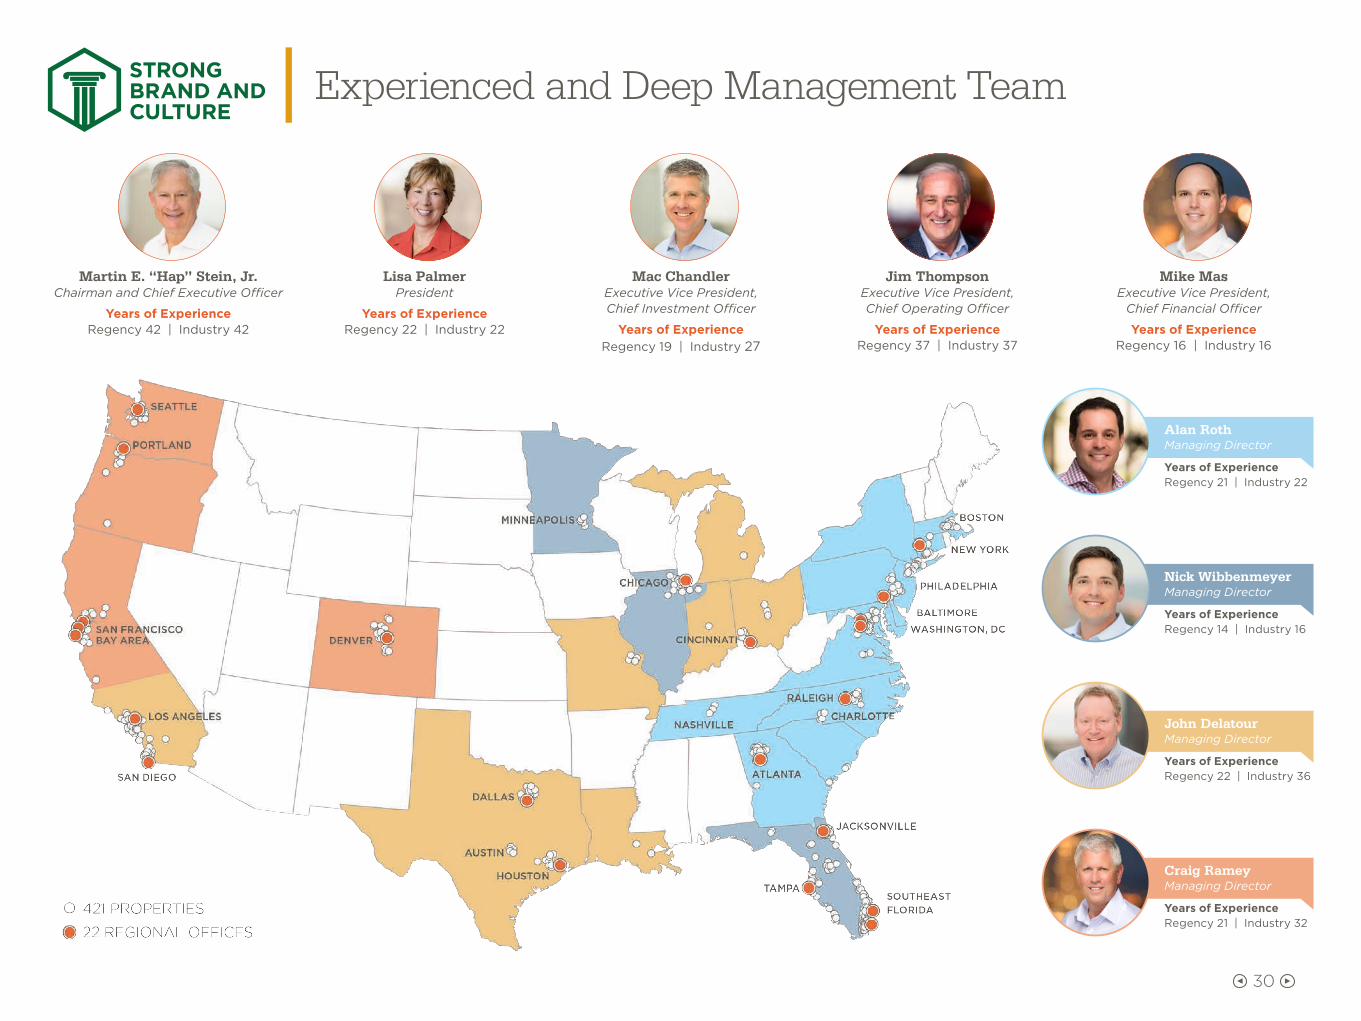
STRONG BRAND AND CULTURE
Experienced and Deep Management Team
Martin E. “Hap” Stein, Jr.Chairman and Chief Executive Officer
Years of ExperienceRegency 42 | Industry 42
Lisa PalmerPresident
Years of ExperienceRegency 22 | Industry 22
Mac ChandlerExecutive Vice President, Chief Investment Officer
Years of ExperienceRegency 19 | Industry 27
Jim ThompsonExecutive Vice President, Chief Operating Officer
Years of ExperienceRegency 37 | Industry 37
Mike MasExecutive Vice President,
Chief Financial Officer
Years of ExperienceRegency 16 | Industry 16
Alan Roth Managing Director
Years of ExperienceRegency 21 | Industry 22
Nick WibbenmeyerManaging Director
Years of ExperienceRegency 14 | Industry 16
John DelatourManaging Director
Years of ExperienceRegency 22 | Industry 36
Craig RameyManaging Director
Years of ExperienceRegency 21 | Industry 32
31
Glossary of Terms
Adjusted Funds From Operations (AFFO): An additional performance measure used by Regency that reflects cash available to fund the Company’s business needs and distribution to shareholders. AFFO is calculated by adjusting Operating FFO for (i) capital expenditures necessary to maintain the Company’s portfolio of properties, (ii) interest charges and (iii) other non-cash amounts as they occur.
Non-Same Property: A property acquired, sold, or a Development Completion during either calendar year period being compared. Non-retail properties and corporate activities, including the captive insurance program, are part of Non-Same Property.
Operating EBITDAre: NAREIT EBITDAre is a measure of REIT performance, which the NAREIT defines as net income, computed in accordance with GAAP, excluding (i) interest expense; (ii) income tax expense; (iii) depreciation and amortization; (iv) gains and losses from sales of depreciable property or land; (v) and operating real estate or land impairments; and (vi) adjustments to reflect the Company’s share of unconsolidated partnerships and joint ventures. Operating EBITDAre excludes from NAREIT EBITDAre certain non-cash components of earnings derived from above and below market rent amortization and straight-line rents. The Company provides a reconciliation of Net Income to Operating EBITDAre.
Core Operating Earnings: An additional performance measure used by Regency that excludes from NAREIT FFO: (i) transaction related income or expenses; (ii) gains or losses from the early extinguishment of debt; (iii) certain non-cash components of earnings derived from above and below market rent amortization, straight-line rents, and amortization of mark-to-market of debt adjustments; and (iv) other amounts as they occur. The Company provides a reconciliation of Net Income to NAREIT FFO to Core Operating Earnings.
Same Property: Retail Operating Properties that were owned and operated for the entirety of both calendar year periods being compared. This term excludes all Projects In Development and Non-Same Properties.
Value Creation: The estimated incremental value at completion using underwritten NOI at stabilization, valued at a market cap rate less estimated development costs.
32
Safe Harbor and Non-GAAP Disclosures
Forward-looking statements involve risks and uncertainties. Actual future performance, outcomes and results may differ materially from those expressed in forward-looking statements. Please refer to the documents filed by Regency Centers Corporation with the SEC, specifically the most recent reports on forms 10K and 10Q, which identify important risk factors which could cause actual results to differ from those contained in the forward-looking statements.
This presentation references certain non-GAAP financial measures. More information regarding these non-GAAP financial measures can be found in company documents filed with the SEC.