second quarter and first half 2019 results...2020/01/06 · second quarter and first half 2019...
TRANSCRIPT

Press Release
1
Second quarter and first half 2019 results1
Paris, July 25, 2019 - Total’s Board of Directors met on July 24, 2019, to approve the Group’s second quarter 2019 financial statements. Commenting on the results, Chairman and CEO Patrick Pouyanné said: “Markets remained volatile with Brent averaging $69/b in the second quarter, an increase of 9% compared to the previous quarter, but natural gas prices were down 36% in Europe and 26% in Asia. In this context, with a slight increase in production to 2.96 Mboe/d, adjusted net income increased by 5% compared to the previous quarter to 2.9 B$, and the return on equity remained above 11%. Fueled by the ramp up of cash flow accretive projects, like Egina in Nigeria, Ichthys in Australia and Kaombo Norte in Angola, plus the second-quarter start-ups of Kaombo Sul in Angola and Culzean in the UK North Sea, debt-adjusted cash flow (DACF) increased by 10% compared to the previous quarter to 7.2 B$. Cash flow after organic investments increased to 3.7 B$, up 13% from the previous quarter. Thus, the organic pre-dividend breakeven is below $25/b and the organic post-dividend breakeven is below $50/b. Exploration & Production benefited from the higher Brent with a 15% increase in operating cash flow before working capital changes. Although gas prices fell sharply, iGRP increased its operating cash flow before working capital changes by 42% thanks to 8% production growth and a 10% increase in LNG sales. Compared to the second quarter 2018, operating cash flow before working capital changes increased by 77%, driven by a doubling of LNG sales. In signing an agreement with Occidental to acquire Anadarko’s assets in Africa, the Group is preparing for its future and capitalizing on its strengths. In Mozambique, it leverages its expertise in LNG, in Ghana, the deep offshore and, in Algeria, its historic presence. The Group continues to grow in LNG with the signing of a sales contract with the Chinese company Guanghui, the takeover of Toshiba’s LNG portfolio and the start-up of Cameron LNG in the United States. This strategy is complemented by the divestment of high-breakeven assets, such as the recent sale of mature assets in the UK North Sea. This active portfolio management policy will continue with the sale of 5 B$ of assets over the 2019-20 period, the majority coming from Exploration & Production. In the Downstream, adjusted net operating income was 1.1 B$, up 4% compared to the previous quarter, in an environment where refining margins fell by 16%. In addition, the Group strengthened its presence in biofuels with the start-up of the La Mède bio-refinery. Total maintains a solid financial position with gearing of 20.6%, after taking into account the payment of two interim dividends in the quarter and the impact of the new IFRS 16 standard (2.7%). Consistent with its shareholder return policy, the Group increased the second interim dividend by 3.1% compared to last year to €0.66 per share and bought back 0.76 B$ as part of its target to buy back 1.5 B$ of share in 2019 with Brent at $60/b. The cash returned to shareholders, expressed in dollars, stands at 37% of operating cash flow before working capital changes for the first half 2019.”
1 Definition on page 2
2Q19 Changevs 2Q18 1H19 Change
vs 1H18
Adjusted net income (Group share)1
- in billions of dollars (B$) 2.9 -19% 5.6 -12%- in dollars per share 1.05 -20% 2.07 -14%
DACF1 (B$) 7.2 +6% 13.7 +10%
Cash Flow from operations (B$) 6.3 - 9.9 +19%
Net income (Group share) of 2.8 B$ in 2Q19, a 26% decrease compared to 2Q18Net-debt-to-capital ratio of 20.6% at June 30, 2019Hydrocarbon production of 2,957 kboe/d in 2Q19, an increase of 9% compared to 2Q18Ex-dividend date for second 2019 interim dividend of 0.66 €/share on January 06, 2020

2
Key figures23456789
2019 data take into account the impact of the new rule IFRS16 “Leases”, effective January 1, 2019. * Average €-$ exchange rate: 1.1237 in the second quarter 2019 and 1.1298 in the first half 2019. ** 2Q18 and 1H18 restated; historical data for 2017 and 2018 available on www.total.com. Highlights since the beginning of the second quarter 201910
• Signed agreement with Occidental to acquire the African assets of Anadarko for 8.8 B$
• Sold mature fields in the UK North Sea for 0.6 B$
• Started production at Kaombo Sul in Angola
• Started production at Culzean in the UK North Sea
• Launched the second development phase for the giant Mero field in Brazil
• Launched the third development phase of the Dunga field in Kazakhstan
• Started production at Cameron LNG in the United States
• Agreed with Toshiba to take over its LNG portfolio, including a 20-year 2.2 Mt/y tolling agreement for the third train at Freeport LNG in the United States
• Started up the biorefinery at La Mède in France
• Started up second solar plant in Japan
2 Adjusted results are defined as income using replacement cost, adjusted for special items, excluding the impact of changes for fair value; adjustment items are on page 11. 3 Tax on adjusted net operating income / (adjusted net operating income – income from equity affiliates – dividends received from investments – impairment of goodwill + tax on adjusted net operating income). 4 In accordance with IFRS rules, adjusted fully-diluted earnings per share is calculated from the adjusted net income less the interest on the perpetual subordinated bond 5 Organic investments = net investments excluding acquisitions, asset sales and other operations with non-controlling interests. 6 Net acquisitions = acquisitions – assets sales – other transactions with non-controlling interests (see page 11). 7 Net investments = Organic investments + net acquisitions (see page 11). 8 Operating cash flow before working capital changes, is defined as cash flow from operating activities before changes in working capital at replacement cost, and effective second quarter 2019 including organic loan repayments from equity affiliates. The inventory valuation effect is explained on page 13. The reconciliation table for different cash flow figures is on page 11. 9 DACF = debt adjusted cash flow, is defined as operating cash flow before working capital changes and financial charges. 10 Certain transactions referred to in the highlights are subject to approval by authorities or to other conditions as per the agreements.
2Q19 1Q19 2Q182Q19
vs 2Q18
In millions of dollars, except effective tax rate,earnings per share and number of shares 1H19 1H18
1H19 vs
1H18
3,589 3,413 4,179 -14% Adjusted net operating income from business segments 7,002 7,564 -7%
2,022 1,722 2,315 -13% Exploration & Production** 3,744 4,132 -9%
429 592 565 -24% Integrated Gas, Renewables & Power** 1,021 1,046 -2%
715 756 821 -13% Refining & Chemicals 1,471 1,541 -5%
423 343 478 -12% Marketing & Services 766 845 -9%
457 614 766 -40% Contribution of equity affiliates to adjusted net income 1,071 1,403 -24%
33.0% 40.5% 38.6% Group effective tax rate3 36.9% 39.2%
2,887 2,759 3,553 -19% Adjusted net income (Group share) 5,646 6,437 -12%
1.05 1.02 1.31 -20% Adjusted fully-diluted earnings per share (dollars)4 2.07 2.41 -14%
0.94 0.90 1.10 -15% Adjusted fully-diluted earnings per share (euros)* 1.84 1.99 -8%
2,625 2,620 2,646 -1% Fully-diluted weighted-average shares (millions) 2,622 2,608 +1%
2,756 3,111 3,721 -26% Net income (Group share) 5,867 6,357 -8%
3,028 2,784 2,780 +9% Organic investments5 5,811 5,400 +8%
402 306 (267) ns Net acquisitions6 709 1,252 -43%
3,430 3,090 2,513 +36% Net investments7 6,520 6,652 -2%
6,707 6,033 6,399 +5%Operating cash flow before working capital changes8 12,740 11,769 +8%
7,208 6,536 6,797 +6%Operating cash flow before working capital changes w/o financial charges (DACF)9 13,744 12,465 +10%
6,251 3,629 6,246 - Cash flow from operations 9,880 8,327 +19%

3
Key figures of environment and Group production
> Environment* – liquids and gas price realizations**, refining margins
* The indicators are shown on page 14. ** Consolidated subsidiaries.
> Production*
* Group production = EP production + iGRP production. Hydrocarbon production was 2,957 thousand barrels of oil equivalent per day (kboe/d) in second quarter 2019, an increase of 9% compared to last year, due to: • +13% related to the start-up and ramp-up of new projects, including Yamal LNG in Russia, Ichthys in
Australia, Kaombo in Angola and Egina in Nigeria, • -3% due to the natural decline of the fields, • -1% due to maintenance, notably in Nigeria. Hydrocarbon production was 2,951 thousand barrels of oil equivalent per day (kboe/d) in first half 2019, an increase of 9% compared to last year, due to: • +12% related to the start-up and ramp-up of new projects, including Yamal LNG in Russia, Ichthys in
Australia, Kaombo in Angola and Egina in Nigeria, • +1% due to portfolio effect, notably the integration of the Maersk Oil assets, • -3% due to the natural decline of the fields, • -1% due to maintenance, notably in Nigeria.
2Q19 1Q19 2Q182Q19
vs 2Q18
1H19 1H181H19 vs
1H18
68.9 63.1 74.4 -7% Brent ($/b) 66.0 70.6 -7%
2.5 2.9 2.8 -11% Henry Hub ($/Mbtu) 2.7 2.8 -5%
4.1 6.3 7.2 -44% NBP ($/Mbtu) 5.2 7.2 -27%
4.9 6.6 8.8 -44% JKM ($/Mbtu) 5.8 9.1 -37%
63.7 58.7 68.4 -7% Average price of liquids ($/b)** 61.2 64.7 -5%
3.82 4.51 4.62 -17% Average price of gas ($/Mbtu)** 4.16 4.71 -12%
27.6 33.0 33.9 -19% Variable cost margin - Refining Europe, VCM ($/t) 30.6 31.7 -4%
2Q19 1Q19 2Q182Q19
vs 2Q18
1H19 1H181H19 vs
1H18
2,957 2,946 2,717 +9% Hydrocarbon production (kboe/d) 2,951 2,710 +9%
1,407 1,425 1,400 +1% Oil (including bitumen) (kb/d) 1,416 1,349 +5%
1,549 1,521 1,317 +18% Gas (including condensates and associated NGL) (kboe/d) 1,535 1,361 +13%
2,957 2,946 2,717 +9% Hydrocarbon production (kboe/d) 2,951 2,710 +9%
1,624 1,629 1,582 +3% Liquids (kb/d) 1,627 1,532 +6%
7,477 7,321 6,176 +21% Gas (Mcf/d) 7,399 6,419 +15%

4
Analysis of business segments Exploration & Production (EP – redefined scope)
> Production
> Results
* Details on adjustment items are shown in the business segment information annex to financial statements. ** Tax on adjusted net operating income / (adjusted net operating income - income from equity affiliates - dividends received from investments - impairment of goodwill + tax on adjusted net operating income). *** Excluding financial charges, except those related to leases. Exploration & Production adjusted net operating income was:
• 2,022 M$ in the second quarter 2019, a decrease of 13% year-on-year, reflecting lower Brent and natural gas prices.
• 3,744 M$ in the first half 2019, a decrease of 9%, for the same reasons as well as the higher exploration expenses in the first quarter 2019.
Operating cash flow before working capital changes, compared to last year, increased by 2% in the second quarter to 4.9 B$ and by 5% in the first half to 9.1 B$, driven by the start-up of strong cash generating fields. Exploration & Production generated cash flow after organic investments of 2.9 B$ in the second quarter of 2019 and 5.2 B$ in the first half 2019.
2Q19 1Q19 2Q182Q19
vs 2Q18
Hydrocarbon production 1H19 1H181H19 vs
1H18
2,398 2,428 2,375 +1% EP (kboe/d) 2,413 2,367 +2%
1,551 1,563 1,544 - Liquids (kb/d) 1,557 1,495 +4%
4,629 4,707 4,536 +2% Gas (Mcf/d) 4,668 4,755 -2%
2Q19 1Q19 2Q182Q19
vs 2Q18
In millions of dollars, except effective tax rate 1H19 1H181H19 vs
1H18
2,022 1,722 2,315 -13% Adjusted net operating income* 3,744 4,132 -9%
239 213 327 -27% including income from equity affiliates 452 555 -19%
39.5% 48.6% 46.6% Effective tax rate** 44.0% 47.5%
1,995 1,958 1,785 +12% Organic investments 3,953 3,583 +10%
204 38 361 -44% Net acquisitions 242 1,932 -87%
2,199 1,996 2,146 +2% Net investments 4,195 5,515 -24%
4,882 4,246 4,800 +2% Operating cash flow before working capital changes *** 9,128 8,721 +5%
3,768 3,936 4,474 -16% Cash flow from operations *** 7,704 7,796 -1%

5
Integrated Gas, Renewables & Power (iGRP)
> Production and liquefied natural gas (LNG) sales
* The Group's equity production may be sold by Total or by the joint ventures. Total LNG sales more than doubled compared to last year for the second quarter and first half 2019 thanks to the start-up of Yamal LNG trains 2 and 3 in Russia, Ichthys LNG in Australia, the first Cameron LNG train in the United States, and the acquisition of the portfolio of LNG contracts from Engie in 2018. The growth in condensate production compared to last year is essentially due to the start-up of condensate production from Ichthys in Australia in the third quarter 2018.
> Results
* Detail of adjustment items shown in the business segment information annex to financial statements. ** Excluding financial charges, except those related to leases. Operating cash flow before working capital changes for the iGRP segment increased by 77% in the second quarter 2019 and 67% in the first half 2019, thanks notably to the ramp-ups of Ichthys in Australia and Yamal LNG in Russia as well as the doubling of total LNG sales. Adjusted net operating income was 429 M$ in the second quarter 2019 and 1,021 M$ in the first half 2019, a decrease of 24% and 2%, respectively, compared to last year, impacted by lower gas prices in Europe and Asia in particular and the amortization of new projects.
2Q19 1Q19 2Q182Q19
vs 2Q18
Hydrocarbon production (kboe/d) 1H19 1H181H19 vs
1H18
559 518 342 +63% iGRP (kboe/d) 538 343 +57%
73 66 38 +92% Liquids (kb/d) 70 37 +87%
2,848 2,614 1,640 +74% Gas (Mcf/d) 2,731 1,664 +64%
2Q19 1Q19 2Q182Q19
vs 2Q18
Liquefied Natural Gas in Mt 1H19 1H181H19 vs
1H18
8.5 7.7 3.9 x2.2 Overall LNG sales 16.2 7.7 x2.1
4.1 3.8 2.5 +65% incl. Sales from equity production* 7.9 5.0 +59%
6.7 6.0 2.7 x2.5 incl. Sales by Total from equity production and third party purchases 12.7 5.4 x2.4
2Q19 1Q19 2Q182Q19
vs 2Q18
In millions of dollars 1H19 1H181H19 vs
1H18
429 592 565 -24% Adjusted net operating income* 1,021 1,046 -2%
195 255 250 -22% including income from equity affiliates 450 478 -6%
442 493 388 +14% Organic investments 935 724 +29%
159 400 (380) ns Net acquisitions 559 (294) ns
601 893 8 x75.1 Net investments 1,494 430 x3.5
869 610 492 +77% Operating cash flow before working capital changes ** 1,479 885 +67%
641 892 258 x2.5 Cash flow from operations ** 1,533 326 x4.7
6
Downstream (Refining & Chemicals and Marketing & Services)
> Results
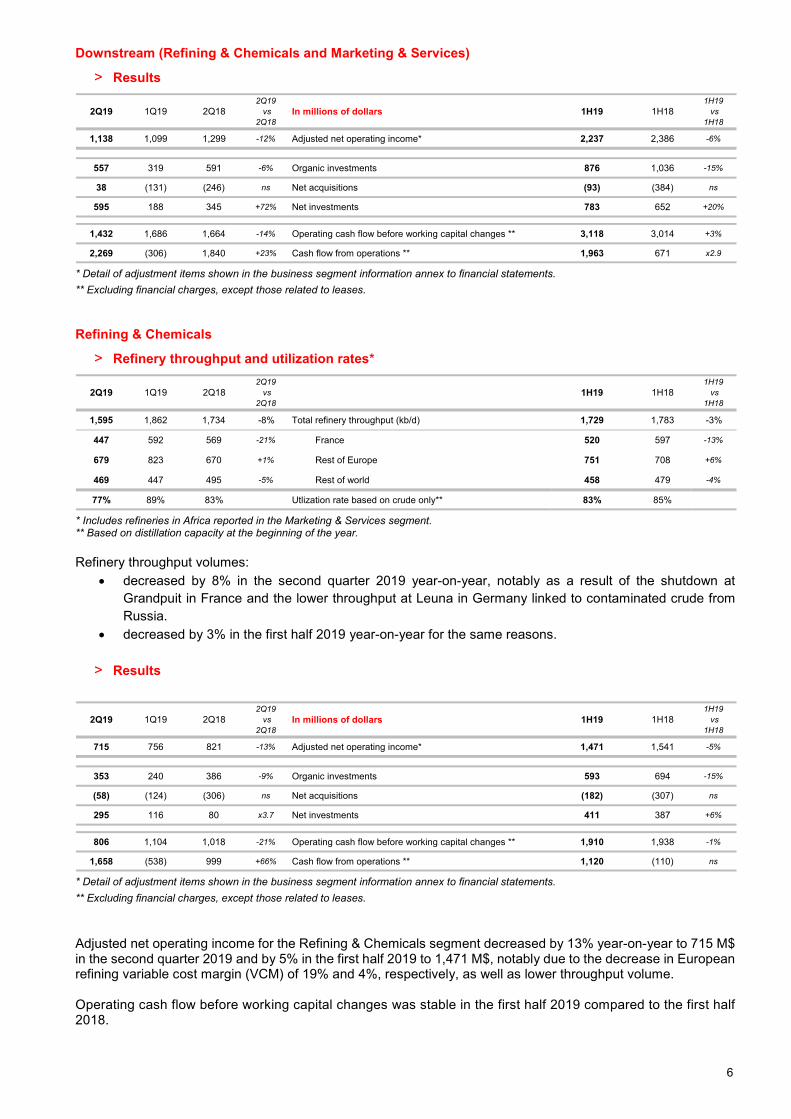
* Detail of adjustment items shown in the business segment information annex to financial statements. ** Excluding financial charges, except those related to leases. Refining & Chemicals
> Refinery throughput and utilization rates*
* Includes refineries in Africa reported in the Marketing & Services segment. ** Based on distillation capacity at the beginning of the year. Refinery throughput volumes:
• decreased by 8% in the second quarter 2019 year-on-year, notably as a result of the shutdown at Grandpuit in France and the lower throughput at Leuna in Germany linked to contaminated crude from Russia.
• decreased by 3% in the first half 2019 year-on-year for the same reasons.
> Results
* Detail of adjustment items shown in the business segment information annex to financial statements. ** Excluding financial charges, except those related to leases.
Adjusted net operating income for the Refining & Chemicals segment decreased by 13% year-on-year to 715 M$ in the second quarter 2019 and by 5% in the first half 2019 to 1,471 M$, notably due to the decrease in European refining variable cost margin (VCM) of 19% and 4%, respectively, as well as lower throughput volume. Operating cash flow before working capital changes was stable in the first half 2019 compared to the first half 2018.
2Q19 1Q19 2Q182Q19
vs 2Q18
In millions of dollars 1H19 1H181H19 vs
1H18
1,138 1,099 1,299 -12% Adjusted net operating income* 2,237 2,386 -6%
557 319 591 -6% Organic investments 876 1,036 -15%
38 (131) (246) ns Net acquisitions (93) (384) ns
595 188 345 +72% Net investments 783 652 +20%
1,432 1,686 1,664 -14% Operating cash flow before working capital changes ** 3,118 3,014 +3%
2,269 (306) 1,840 +23% Cash flow from operations ** 1,963 671 x2.9
2Q19 1Q19 2Q182Q19
vs 2Q18
1H19 1H181H19 vs
1H18
1,595 1,862 1,734 -8% Total refinery throughput (kb/d) 1,729 1,783 -3%
447 592 569 -21% France 520 597 -13%
679 823 670 +1% Rest of Europe 751 708 +6%
469 447 495 -5% Rest of world 458 479 -4%
77% 89% 83% Utlization rate based on crude only** 83% 85%
2Q19 1Q19 2Q182Q19
vs 2Q18
In millions of dollars 1H19 1H181H19 vs
1H18
715 756 821 -13% Adjusted net operating income* 1,471 1,541 -5%
353 240 386 -9% Organic investments 593 694 -15%
(58) (124) (306) ns Net acquisitions (182) (307) ns
295 116 80 x3.7 Net investments 411 387 +6%
806 1,104 1,018 -21% Operating cash flow before working capital changes ** 1,910 1,938 -1%
1,658 (538) 999 +66% Cash flow from operations ** 1,120 (110) ns

7
Marketing & Services
> Petroleum product sales
* Excludes trading and bulk refining sales Sales of petroleum products increased by 3% in the second quarter 2019 and the first half 2019, due to the development of activities in the African and American regions, notably Mexico and Brazil.
> Results
* Detail of adjustment items shown in the business segment information annex to financial statements. ** Excluding financial charges, except those related to leases Adjusted net operating income was 423 M$ in the second quarter 2019 and 766 M$ in the first half 2019, down 12% and 9% year-on-year. Operating cash flow before working capital changes increased by 12% in the first half 2019 compared to the first half 2018. Group results
> Adjusted net operating income from business segments Adjusted net operating income from the business segments was:
• 3,589 M$ in the second quarter 2019, down 14% compared to last year due to lower Brent and natural gas prices.
• 7,002 M$ in the first half 2019, down 7% compared to last year for the same reasons.
> Adjusted net income (Group share) Adjusted net income (Group share) was:
• 2,887 M$ in the second quarter 2019, down 19% compared to last year. This decrease reflects the decrease in the net operating income of the segments and the increase in the net cost of net debt compared to a year ago mainly due to the rise in U.S. dollar interest rates.
• 5,646 M$ in the first half 2019, down 12% compared to last year for the same reasons.
Adjusted net income excludes the after-tax inventory effect, special items and the impact of effects of changes in fair value11. Total net income adjustments12 were:
• -131 M$ in the second quarter 2019. • 221 M$ in the first half 2019.
The effective tax rate for the Group was:
• 33.0% in the second quarter 2019, compared to 38.6% the same quarter last year. • 36.9% in the first half 2019, compared to 39.2% the first half 2018.
11 Adjustment items shown on page 11. 12 Details shown on page 11 and in the annex to the financial statements.
2Q19 1Q19 2Q182Q19
vs 2Q18
Sales in kb/d* 1H19 1H181H19 vs
1H18
1,860 1,836 1,799 +3% Total Marketing & Services sales 1,848 1,800 +3%
1,004 1,012 1,001 - Europe 1,008 997 +1%
856 824 798 +7% Rest of world 840 803 +5%
2Q19 1Q19 2Q182Q19
vs 2Q18
In millions of dollars 1H19 1H181H19 vs
1H18
423 343 478 -12% Adjusted net operating income* 766 845 -9%
204 80 205 -1% Organic investments 283 342 -17%
96 (8) 60 +61% Net acquisitions 89 (77) ns
300 72 265 +13% Net investments 372 265 +40%
626 582 646 -3% Operating cash flow before working capital changes ** 1,208 1,076 +12%
611 232 841 -27% Cash flow from operations ** 843 781 +8%

8
> Adjusted fully-diluted earnings per share Adjusted earnings per share was:
• $1.05 in the second quarter 2019, a decrease of 20%, calculated on the basis of a weighted average of 2,625 million fully-diluted shares, compared to $1.31 in the second quarter 2018.
• $2.07 in the first half 2019, a decrease of 14%, calculated on the basis of a weighted average of 2,622 million fully-diluted shares, compared to $2.41 in the first half 2018.
In the context of the shareholder return policy announced in February 2018, the Group has continued to buy back shares, including:
• the buyback of shares issued in 2019 under the scrip dividend option (not renewed at the 2019 General Assembly) to cancel any dilution related to the exercise of this option: 14.9 million shares repurchased in the second quarter 2019 and 16.1 million shares in the first half 2019
• the buyback of additional shares: 7.5 million shares repurchased in the second quarter 2019 for 0.41 B$ and 13.7 million shares in the first half 2019 for 0.76 B$ as part of the 5 B$ buyback program for 2018-20
The number of fully-diluted shares was 2,619 million on June 30, 2019.
> Asset sales – acquisitions Asset sales were:
• 212 M$ in the second quarter 2019, linked notably to the sale of the interest in the Wepec refinery in China.
• 575 M$ in the first half 2019, linked notably to the sale of the interest in the Wepec refinery in China and the sale of the Group’s interest in the Hazira terminal in India and polystyrene activities in China.
Acquisitions were:
• 614 M$ in the second quarter 2019, linked notably to the acquisition of Chevron’s interest in the Danish Underground Consortium in Denmark, the joint development with Saudi Aramco of a network of service stations in Saudi Arabia, the alliance with the Adani group in the natural gas and retail fuel network in India and the capital increase in Total Eren for its acquisition of Novenergia.
• 1,284 M$ in the first half 2019, linked notably to the elements above as well as to the signing of the acquisition of a 10% stake in the Arctic LNG 2 project in Russia.
> Net cash flow
Net cash flow13 for the Group was: • 3,277 M$ in the second quarter 2019, a 16% decrease compared to last year due to an increase in net
acquisitions. • 6,220 M$ in the first half 2019, a 22% increase compared to last year due to higher operating cash flow
before working capital changes and lower net acquisitions.
> Profitability The return on equity was 11.1% for the twelve months ended June 30, 2019, an increase compared to the same period last year.
The return on average capital employed was 10.4% for the twelve months ended June 30, 2019, an increase compared to the same period last year.
Total S.A. accounts Net income for Total S.A., the parent company, was 6,282 million euros in the first half 2019, compared to 4,079 million euros a year ago. 13 Net cash flow = operating cash flow before working capital changes - net investments (including other transactions with non-controlling interests).
Adjusted net income
Average adjusted shareholders' equity
Return on equity (ROE)
In millions of dollars July 1, 2018 April 1, 2018 July 1, 2017June 30, 2018June 30, 2019 March 31, 2019
12,299
113,251
10.9%11.1% 11.7%
13,125 13,810
117,787 118,094
Adjusted net operating income
Average capital employed
ROACE
145,247 146,210 136,355
10.4% 10.7% 10.1%
15,087 15,697 13,748
In millions of dollars July 1, 2018 April 1, 2018 July 1, 2017June 30, 2019 March 31, 2019 June 30, 2018

9
2019 Sensitivities*
* Sensitivities are revised once per year upon publication of the previous year’s fourth quarter results. Sensitivities are estimates based on assumptions about the Group’s portfolio in 2019. Actual results could vary significantly from estimates based on the application of these sensitivities. The impact of the $-€ sensitivity on adjusted net operating income is essentially attributable to Refining & Chemicals. ** In a 60 $/b Brent environment. Summary and outlook Since the start of the third quarter 2019, Brent has traded above $60/b in a context of renewed OPEC+ quotas and uncertainties about the evolution of production in Libya, Venezuela and Iran. The environment remains volatile, with uncertainty about hydrocarbon demand growth related to the outlook for global economic growth. The Group maintains its spending discipline in 2019 with an organic investment target of around 14 B$ and an average production cost of $5.5/boe. The organic pre-dividend cash flow breakeven will remain below $30/b. Production growth should exceed 9% in 2019, thanks to the ramp-up of projects started in 2018 and the start-ups in the first half 2019 of Kaombo Sul in Angola and Culzean in the UK North Sea, as well as the upcoming Johan Sverdrup in Norway and Iara 1 in Brazil. The Group will continue to take advantage of the favorable cost environment to sanction new projects, notably Arctic LNG 2 and Lapa 3. At the start of the third quarter, European refining margins, while still volatile, increased, and the Downstream should benefit from restarting the Grandpuit refinery in France and the Leuna refinery in Germany. In this context, the Group is continuing to implement its shareholder return policy. The dividend in euro will be increased by 3.1% in 2019 representing a total increase of 6.5% since 2017, in line with the target increase of 10% over the period 2018-2020. Total will buy back 1.5 B$ of shares in 2019 at $60/b as part of its 5 B$ share buyback program over the 2018-2020 period.
• • • To listen to the presentation by CEO Patrick Pouyanné, CFO Patrick de La Chevardière and Deputy CFO Jean-Pierre Sbraire today at 13:00 (London time) please log on to total.com or call +44 (0) 207 192 8000 in Europe or +1 631 510 7495 in the United States (code: 6785179). To listen to the replay, please consult the website or call +44 (0) 333 300 9785 in Europe or +1 917 677 7532 in the United States (code: 6785179).
* * * * *
Total contacts
Media Relations: +33 1 47 44 46 99 l [email protected] l @TotalPress
Investors Relations: +44 (0) 207 719 7962 l [email protected]
ChangeEstimated impact on
adjustednet operating income
Estimated impact on cash flow from
operations
Dollar +/- 0.1 $ per € -/+ 0.1 B$ ~0 B$
Average liquids price** +/- 10 $/b +/- 2.7 B$ +/- 3.2 B$
Variable cost margin, European refining (VCM) +/- 10 $/t +/- 0.5 B$ +/- 0.6 B$

10
Operating information by segment
> Group production (Exploration & Production + iGRP)
> Downstream (Refining & Chemicals and Marketing & Services)
2Q19 1Q19 2Q182Q19
vs 2Q18
Combined liquids and gasproduction by region (kboe/d) 1H19 1H18
1H19 vs
1H18
997 990 842 +18% Europe and Central Asia 993 864 +15%
686 697 672 +2% Africa 691 673 +3%
703 686 681 +3% Middle East and North Africa 695 660 +5%
358 373 401 -11% Americas 365 386 -5%
214 201 121 +76% Asia-Pacific 207 128 +62%
2,957 2,946 2,717 +9% Total production 2,951 2,710 +9%
750 709 616 +22% includes equity affiliates 730 670 +9%
2Q19 1Q19 2Q182Q19
vs 2Q18
Liquids production by region (kb/d) 1H19 1H181H19 vs
1H18
328 352 332 -1% Europe and Central Asia 340 315 +8%
549 540 511 +7% Africa 545 507 +7%
546 522 539 +1% Middle East and North Africa 534 520 +3%
160 177 190 -16% Americas 168 177 -5%
41 39 11 x3.8 Asia-Pacific 40 12 x3.4
1,624 1,629 1,582 +3% Total production 1,627 1,532 +6%
225 217 233 -3% includes equity affiliates 221 268 -18%
2Q19 1Q19 2Q182Q19
vs 2Q18
Gas production by region (Mcf/d) 1H19 1H181H19 vs
1H18
3,639 3,426 2,754 +32% Europe and Central Asia 3,532 2,954 +20%
703 792 772 -9% Africa 748 815 -8%
866 905 787 +10% Middle East and North Africa 885 774 +14%
1,107 1,101 1,192 -7% Americas 1,104 1,175 -6%
1,162 1,097 671 +73% Asia-Pacific 1,130 701 +61%
7,477 7,321 6,176 +21% Total production 7,399 6,419 +15%
2,868 2,653 2,026 +42% includes equity affiliates 2,761 2,141 +29%
2Q19 1Q19 2Q182Q19
vs 2Q18
Petroleum product sales by region (kb/d) 1H19 1H181H19 vs
1H18
2,018 2,022 1,942 +4% Europe 2,020 1,922 +5%
751 658 652 +15% Africa 705 703 -
846 839 802 +6% Americas 842 781 +8%
536 616 644 -17% Rest of world 576 662 -13%
4,152 4,135 4,040 +3% Total consolidated sales 4,143 4,068 +2%
535 557 556 -4% Includes bulk sales 546 563 -3%
1,757 1,742 1,685 +4% Includes trading 1,749 1,705 +3%

11
Adjustment items to net income (Group share)
Investments - Divestments
* Effective second quarter 2019, organic loan repayments from equity affiliates are defined as loan repayments from equity affiliates coming from their cash flow from operations. Cash flow
2Q19 1Q19 2Q18 In millions of dollars 1H19 1H18
(56) (14) (358) Special items affecting net income (Group share) (70) (553)
- - (2) Gain (loss) on asset sales - (103)
(31) (2) (46) Restructuring charges (33) (67)
(57) - (236) Impairments (57) (248)
32 (12) (74) Other 20 (135)
(28) 388 517 After-tax inventory effect : FIFO vs. replacement cost 360 472
(47) (22) 9 Effect of changes in fair value (69) 1
(131) 352 168 Total adjustments affecting net income 221 (80)
2Q19 1Q19 2Q182Q19
vs 2Q18
In millions of dollars 1H19 1H181H19 vs
1H18
3,028 2,784 2,780 +9% Organic investments ( a ) 5,811 5,400 +8%
185 232 137 +35% capitalized exploration 417 248 +68%
370 130 140 x2.6 increase in non-current loans 500 311 +61%
(254) (134) (581) ns repayment of non-current loans, excluding organic loan repayment from equity affiliates* (388) (997) ns
614 669 426 +44% Acquisitions ( b ) 1,284 4,114 -69%
212 363 693 -69% Asset sales ( c ) 575 2,862 -80%
- - - ns Other transactions with non-controlling interests (d) - - ns
3,430 3,090 2,513 +36% Net investments ( a + b - c - d ) 6,520 6,652 -2%
(99) ns Organic loan repayment from equity affiliates* ( e ) (99) ns
3,331 3,090 2,513 +33% Cash flow used in investing activities ( a + b - c + e ) 6,421 6,652 -3%
2Q19 1Q19 2Q182Q19
vs 2Q18
In millions of dollars 1H19 1H181H19 vs
1H18
7,208 6,536 6,797 +6%Operating cash flow before working capital changes w/o financials charges (DACF) 13,744 12,465 +10%
(501) (503) (398) ns Financial charges (1,004) (696) ns
6,707 6,033 6,399 +5% Operating cash flow before working capital changes ( a ) 12,740 11,769 +8%
(317) (2,970) (856) ns (Increase) decrease in working capital (3,287) (4,078) ns
(40) 566 703 ns Inventory effect 526 636 -17%
(99) Organic loan repayment from equity affiliates (99)
6,251 3,629 6,246 - Cash flow from operations 9,880 8,327 +19%
3,028 2,784 2,780 +9% Organic investments ( b ) 5,811 5,400 +8%
3,679 3,249 3,619 +2%Free cash flow after organic investments,w/o net asset sales ( a - b ) 6,929 6,369 +9%
3,430 3,090 2,513 +36% Net investments ( c ) 6,520 6,652 -2%
3,277 2,943 3,886 -16% Net cash flow ( a - c ) 6,220 5,117 +22%
12
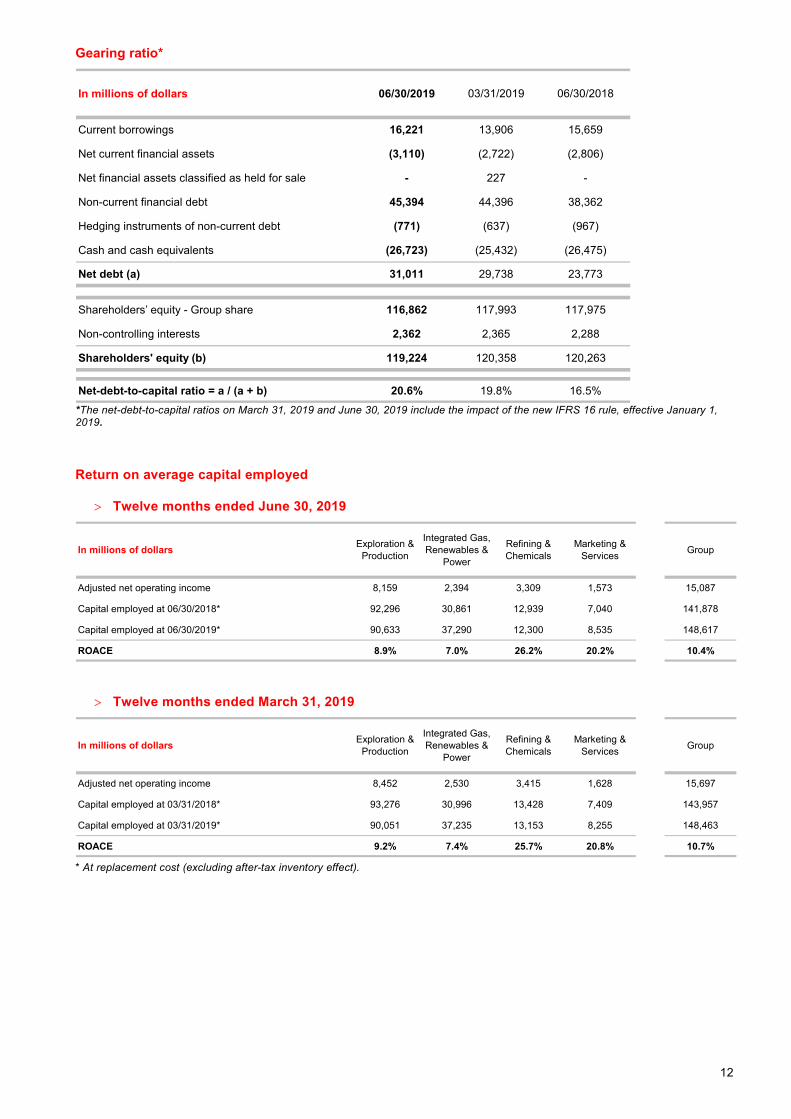
Gearing ratio*
*The net-debt-to-capital ratios on March 31, 2019 and June 30, 2019 include the impact of the new IFRS 16 rule, effective January 1, 2019. Return on average capital employed
> Twelve months ended June 30, 2019
> Twelve months ended March 31, 2019
* At replacement cost (excluding after-tax inventory effect).
In millions of dollars 06/30/2019 03/31/2019 06/30/2018
Current borrowings 16,221 13,906 15,659
Net current financial assets (3,110) (2,722) (2,806)
Net financial assets classified as held for sale - 227 -
Non-current financial debt 45,394 44,396 38,362
Hedging instruments of non-current debt (771) (637) (967)
Cash and cash equivalents (26,723) (25,432) (26,475)
Net debt (a) 31,011 29,738 23,773
Shareholders’ equity - Group share 116,862 117,993 117,975
Non-controlling interests 2,362 2,365 2,288
Shareholders' equity (b) 119,224 120,358 120,263
Net-debt-to-capital ratio = a / (a + b) 20.6% 19.8% 16.5%
In millions of dollars Exploration & Production
Integrated Gas, Renewables &
Power
Refining & Chemicals
Marketing & Services Group
Adjusted net operating income 8,159 2,394 3,309 1,573 15,087
Capital employed at 06/30/2018* 92,296 30,861 12,939 7,040 141,878
Capital employed at 06/30/2019* 90,633 37,290 12,300 8,535 148,617
ROACE 8.9% 7.0% 26.2% 20.2% 10.4%
In millions of dollars Exploration & Production
Integrated Gas, Renewables &
Power
Refining & Chemicals
Marketing & Services Group
Adjusted net operating income 8,452 2,530 3,415 1,628 15,697
Capital employed at 03/31/2018* 93,276 30,996 13,428 7,409 143,957
Capital employed at 03/31/2019* 90,051 37,235 13,153 8,255 148,463
ROACE 9.2% 7.4% 25.7% 20.8% 10.7%
13
This document does not constitute the Financial Report for the first half of 2019 which will be separately published, in accordance with article L. 451-1-2 III of the French Code monétaire et financier, and is available on the Total website total.com. This press release presents the results for the second quarter and half-year 2019 from the consolidated financial statements of TOTAL S.A. as of June 30, 2019). The limited review procedures by the Statutory Auditors are underway. The notes to these consolidated financial statements (unaudited) are available on the TOTAL website total.com This document may contain forward-looking information on the Group (including objectives and trends), as well as forward-looking statements within the meaning of the Private Securities Litigation Reform Act of 1995, notably with respect to the financial condition, results of operations, business, strategy and plans of TOTAL. These data do not represent forecasts within the meaning of European Regulation No. 809/2004. Such forward-looking information and statements included in this document are based on a number of economic data and assumptions made in a given economic, competitive and regulatory environment. They may prove to be inaccurate in the future, and are subject to a number of risk factors that could lead to a significant difference between actual results and those anticipated, the price of petroleum products, the ability to realize cost reductions and operating efficiencies without unduly disrupting business operations, changes in regulations including environmental and climate, currency fluctuations, as well as economic and political developments and changes in business conditions. Certain financial information is based on estimates particularly in the assessment of the recoverable value of assets and potential impairments of assets relating thereto. Neither TOTAL nor any of its subsidiaries assumes any obligation to update publicly any forward-looking information or statement, objectives or trends contained in this document whether as a result of new information, future events or otherwise. Further information on factors, risks and uncertainties that could affect the Group’s business, financial condition, including its operating income and cash flow, reputation or outlook is provided in the most recent Registration Document, the French language version of which is filed by the Company with the French Autorité des Marchés Financiers and annual report on Form 20-F filed with the United States Securities and Exchange Commission (“SEC”). Financial information by business segment is reported in accordance with the internal reporting system and shows internal segment information that is used to manage and measure the performance of TOTAL. In addition to IFRS measures, certain alternative performance indicators are presented, such as performance indicators excluding the adjustment items described below (adjusted operating income, adjusted net operating income, adjusted net income), return on equity (ROE), return on average capital employed (ROACE), gearing ratio and operating cash flow before working capital changes. These indicators are meant to facilitate the analysis of the financial performance of TOTAL and the comparison of income between periods. They allow investors to track the measures used internally to manage and measure the performance of the Group. These adjustment items include: (i) Special items Due to their unusual nature or particular significance, certain transactions qualified as "special items" are excluded from the business segment figures. In general, special items relate to transactions that are significant, infrequent or unusual. However, in certain instances, transactions such as restructuring costs or asset disposals, which are not considered to be representative of the normal course of business, may be qualified as special items although they may have occurred within prior years or are likely to occur again within the coming years. (ii) Inventory valuation effect The adjusted results of the Refining & Chemicals and Marketing & Services segments are presented according to the replacement cost method. This method is used to assess the segments’ performance and facilitate the comparability of the segments’ performance with those of its competitors. In the replacement cost method, which approximates the LIFO (Last-In, First-Out) method, the variation of inventory values in the statement of income is, depending on the nature of the inventory, determined using either the month-end price differentials between one period and another or the average prices of the period rather than the historical value. The inventory valuation effect is the difference between the results according to the FIFO (First-In, First-Out) and the replacement cost. (iii) Effect of changes in fair value The effect of changes in fair value presented as an adjustment item reflects, for some transactions, differences between internal measures of performance used by TOTAL’s management and the accounting for these transactions under IFRS. IFRS requires that trading inventories be recorded at their fair value using period-end spot prices. In order to best reflect the management of economic exposure through derivative transactions, internal indicators used to measure performance include valuations of trading inventories based on forward prices. Furthermore, TOTAL, in its trading activities, enters into storage contracts, whose future effects are recorded at fair value in Group’s internal economic performance. IFRS precludes recognition of this fair value effect. The adjusted results (adjusted operating income, adjusted net operating income, adjusted net income) are defined as replacement cost results, adjusted for special items, excluding the effect of changes in fair value. Euro amounts presented for the fully adjusted-diluted earnings per share represent dollar amounts converted at the average euro-dollar (€-$) exchange rate for the applicable period and are not the result of financial statements prepared in euros. Cautionary Note to U.S. Investors – The SEC permits oil and gas companies, in their filings with the SEC, to separately disclose proved, probable and possible reserves that a company has determined in accordance with SEC rules. We may use certain terms in this press release, such as “potential reserves” or “resources”, that the SEC’s guidelines strictly prohibit us from including in filings with the SEC. U.S. investors are urged to consider closely the disclosure in our Form 20-F, File N° 1-10888, available from us at 2, place Jean Millier – Arche Nord Coupole/Regnault - 92078 Paris-La Défense Cedex, France, or at our website total.com. You can also obtain this form from the SEC by calling 1-800-SEC-0330 or on the SEC’s website sec.gov.

14
Main indicators
$/€ Brent ($/b) Average liquids price* ($/b) Average gas price* ($/Mbtu) Variable cost margin, European refining**
($/t) Second quarter 2019 1.12 68.9 63.7 3.82 27.6
First quarter 2019 1.14 63.1 58.7 4.51 33.0
Fourth quarter 2018 1.14 68.8 59.2 5.01 40.8
Third quarter 2018 1.16 75.2 68.8 5.06 47.2
Second quarter 2018 1.19 74.4 68.4 4.62 33.9
* Sales in $ / sales in volume for consolidated subsidiaries (excluding stock value variation). ** This indicator represents the average margin on variable costs realized by Total’s European refining business (equal to the difference between the sales of refined products realized by Total’s European refining and the crude purchases as well as associated variable costs, divided by refinery throughput in tons).
Disclaimer: data is based on Total’s reporting and is not audited. To the extent permitted by law, TOTAL S.A. disclaims all liability from the use of the main indicators.
Total financial statements Second quarter and first half 2019 consolidated accounts, IFRS

16
CONSOLIDATED STATEMENT OF INCOME
TOTAL
(unaudited)
2nd quarter 1st quarter 2nd quarter (M$)(a) 2019 2019 2018 Sales 51,242 51,205 52,540 Excise taxes (6,040) (6,081) (6,438) Revenues from sales 45,202 45,124 46,102
Purchases, net of inventory variation (30,390) (29,721) (30,599) Other operating expenses (7,078) (6,725) (6,761) Exploration costs (170) (288) (158) Depreciation, depletion and impairment of tangible assets and mineral interests (3,661) (3,466) (3,435) Other income 321 247 252 Other expense (189) (209) (413)
Financial interest on debt (568) (561) (478) Financial income and expense from cash & cash equivalents (42) (28) (54) Cost of net debt (610) (589) (532)
Other financial income 326 160 321 Other financial expense (188) (195) (159)
Net income (loss) from equity affiliates 812 711 1,103 Income taxes (1,571) (1,909) (2,087) Consolidated net income 2,804 3,140 3,634 Group share 2,756 3,111 3,721 Non-controlling interests 48 29 (87)
Earnings per share ($) 1.01 1.17 1.38 Fully-diluted earnings per share ($) 1.00 1.16 1.38
(a) Except for per share amounts.

17
CONSOLIDATED STATEMENT OF COMPREHENSIVE INCOME TOTAL (unaudited)
2nd quarter 1st quarter 2nd quarter (M$) 2019 2019 2018
Consolidated net income 2,804 3,140 3,634 Other comprehensive income Actuarial gains and losses (223) 164 42 Change in fair value of investments in equity instruments 74 33 (2) Tax effect 59 (45) (20) Currency translation adjustment generated by the parent company 1,057 (1,531) (4,761) Items not potentially reclassifiable to profit and loss 967 (1,379) (4,741) Currency translation adjustment (619) 806 1,330 Cash flow hedge (246) (127) 77 Variation of foreign currency basis spread 43 11 2 Share of other comprehensive income of equity affiliates, net amount (135) 388 36 Other 1 1 (2) Tax effect 69 38 (27) Items potentially reclassifiable to profit and loss (887) 1,117 1,416 Total other comprehensive income (net amount) 80 (262) (3,325) Comprehensive income 2,884 2,878 309 Group share 2,797 2,840 450 Non-controlling interests 87 38 (141)
18
CONSOLIDATED STATEMENT OF INCOME
TOTAL
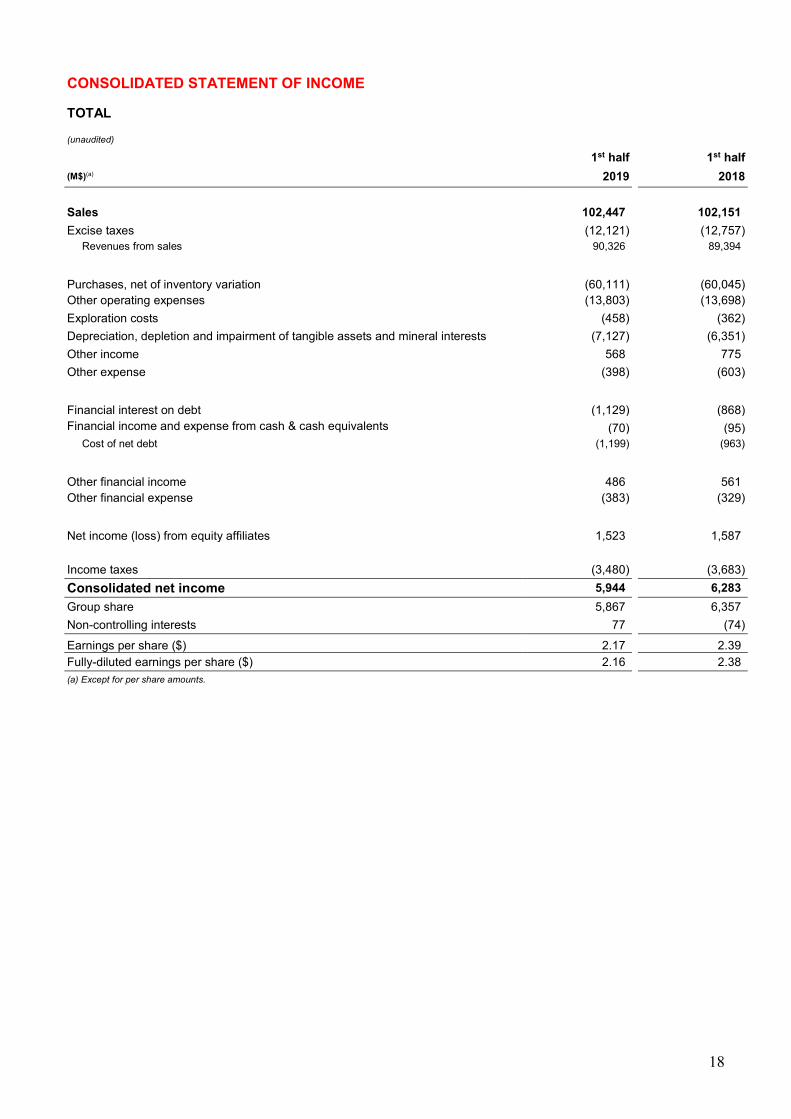
(unaudited) 1st half 1st half (M$)(a) 2019 2018
Sales 102,447 102,151 Excise taxes (12,121) (12,757) Revenues from sales 90,326 89,394
Purchases, net of inventory variation (60,111) (60,045) Other operating expenses (13,803) (13,698) Exploration costs (458) (362) Depreciation, depletion and impairment of tangible assets and mineral interests (7,127) (6,351) Other income 568 775 Other expense (398) (603) Financial interest on debt (1,129) (868) Financial income and expense from cash & cash equivalents (70) (95) Cost of net debt (1,199) (963)
Other financial income 486 561 Other financial expense (383) (329) Net income (loss) from equity affiliates 1,523 1,587 Income taxes (3,480) (3,683) Consolidated net income 5,944 6,283 Group share 5,867 6,357 Non-controlling interests 77 (74)
Earnings per share ($) 2.17 2.39 Fully-diluted earnings per share ($) 2.16 2.38 (a) Except for per share amounts.

19
CONSOLIDATED STATEMENT OF COMPREHENSIVE INCOME
TOTAL
(unaudited)
1st half 1st half (M$) 2019 2018
Consolidated net income 5,944 6,283 Other comprehensive income
Actuarial gains and losses (59) 67 Change in fair value of investments in equity instruments 107 5 Tax effect 14 (18) Currency translation adjustment generated by the parent company (474) (2,630) Items not potentially reclassifiable to profit and loss (412) (2,576) Currency translation adjustment 187 968 Cash flow hedge (373) 255 Variation of foreign currency basis spread 54 (27) Share of other comprehensive income of equity affiliates, net amount 253 (132) Other 2 (2) Tax effect 107 (75) Items potentially reclassifiable to profit and loss 230 987 Total other comprehensive income (net amount) (182) (1,589) Comprehensive income 5,762 4,694 Group share 5,637 4,806 Non-controlling interests 125 (112)

20
CONSOLIDATED BALANCE SHEET TOTAL June 30,
2019 March 31,
2019 December 31,
2018 June 30,
2018
(M$) (unaudited) (unaudited) (unaudited)
ASSETS
Non-current assets Intangible assets, net 29,229 28,727 28,922 24,562 Property, plant and equipment, net 118,063 117,881 113,324 114,047 Equity affiliates : investments and loans 26,473 25,996 23,444 22,443 Other investments 1,660 1,468 1,421 1,396 Non-current financial assets 771 637 680 967 Deferred income taxes 6,022 6,246 6,663 5,348 Other non-current assets 2,306 2,156 2,509 3,384 Total non-current assets 184,524 183,111 176,963 172,147
Current assets Inventories, net 16,410 17,075 14,880 18,392 Accounts receivable, net 20,349 19,321 17,270 16,974 Other current assets 15,958 16,237 14,724 14,408 Current financial assets 3,536 3,373 3,654 3,609 Cash and cash equivalents 26,723 25,432 27,907 26,475 Assets classified as held for sale - 314 1,364 - Total current assets 82,976 81,752 79,799 79,858 Total assets 267,500 264,863 256,762 252,005 LIABILITIES & SHAREHOLDERS' EQUITY
Shareholders' equity
Common shares 8,301 8,231 8,227 8,305 Paid-in surplus and retained earnings 123,351 123,702 120,569 121,896 Currency translation adjustment (11,177) (11,606) (11,313) (9,764) Treasury shares (3,613) (2,334) (1,843) (2,462) Total shareholders' equity - Group share 116,862 117,993 115,640 117,975 Non-controlling interests 2,362 2,365 2,474 2,288 Total shareholders' equity 119,224 120,358 118,114 120,263
Non-current liabilities Deferred income taxes 11,486 11,339 11,490 11,969 Employee benefits 3,375 3,150 3,363 3,329 Provisions and other non-current liabilities 21,629 21,020 21,432 18,807 Non-current financial debt 45,394 44,396 40,129 38,362 Total non-current liabilities 81,884 79,905 76,414 72,467
Current liabilities Accounts payable 27,059 26,416 26,134 25,021 Other creditors and accrued liabilities 22,686 23,361 22,246 17,792 Current borrowings 16,221 13,906 13,306 15,659 Other current financial liabilities 426 651 478 803 Liabilities directly associated with the assets classified as held for sale - 266 70 - Total current liabilities 66,392 64,600 62,234 59,275 Total liabilities & shareholders' equity 267,500 264,863 256,762 252,005

21
CONSOLIDATED STATEMENT OF CASH FLOW
TOTAL
(unaudited)
2nd quarter 1st quarter 2nd quarter (M$) 2019 2019 2018 CASH FLOW FROM OPERATING ACTIVITIES Consolidated net income 2,804 3,140 3,634 Depreciation, depletion, amortization and impairment 3,819 3,716 3,508 Non-current liabilities, valuation allowances and deferred taxes 239 140 35 (Gains) losses on disposals of assets (191) (173) (148) Undistributed affiliates' equity earnings (168) (306) (298) (Increase) decrease in working capital (317) (2,970) (856) Other changes, net 65 82 371 Cash flow from operating activities 6,251 3,629 6,246 CASH FLOW USED IN INVESTING ACTIVITIES Intangible assets and property, plant and equipment additions (2,881) (2,704) (3,513) Acquisitions of subsidiaries, net of cash acquired (208) - 12 Investments in equity affiliates and other securities (437) (753) (146) Increase in non-current loans (370) (130) (140) Total expenditures (3,896) (3,587) (3,787) Proceeds from disposals of intangible assets and property, plant and equipment 155 8 304 Proceeds from disposals of subsidiaries, net of cash sold (1) 147 (7) Proceeds from disposals of non-current investments 58 208 396 Repayment of non-current loans 353 134 581 Total divestments 565 497 1,274 Cash flow used in investing activities (3,331) (3,090) (2,513) CASH FLOW USED IN FINANCING ACTIVITIES Issuance (repayment) of shares: - Parent company shareholders 449 1 473 - Treasury shares (1,279) (491) (1,182) Dividends paid: - Parent company shareholders (2,935) (1,830) (2,692) - Non-controlling interests (93) - (72) Net issuance (repayment) of perpetual subordinated notes - - - Payments on perpetual subordinated notes (175) (140) (116) Other transactions with non-controlling interests - (150) - Net issuance (repayment) of non-current debt 2,331 1,250 52 Increase (decrease) in current borrowings 37 (1,526) (738) Increase (decrease) in current financial assets and liabilities (164) 106 (1,779) Cash flow used in financing activities (1,829) (2,780) (6,054) Net increase (decrease) in cash and cash equivalents 1,091 (2,241) (2,321) Effect of exchange rates 200 (234) (1,296) Cash and cash equivalents at the beginning of the period 25,432 27,907 30,092 Cash and cash equivalents at the end of the period 26,723 25,432 26,475

22
CONSOLIDATED STATEMENT OF CASH FLOW TOTAL
(unaudited)
1st half 1st half (M$) 2019 2018 CASH FLOW FROM OPERATING ACTIVITIES Consolidated net income 5,944 6,283 Depreciation, depletion, amortization and impairment 7,535 6,554 Non-current liabilities, valuation allowances and deferred taxes 379 149 (Gains) losses on disposals of assets (364) (273) Undistributed affiliates' equity earnings (474) (557) (Increase) decrease in working capital (3,287) (4,078) Other changes, net 147 249 Cash flow from operating activities 9,880 8,327 CASH FLOW USED IN INVESTING ACTIVITIES Intangible assets and property, plant and equipment additions (5,585) (9,178) Acquisitions of subsidiaries, net of cash acquired (208) (714) Investments in equity affiliates and other securities (1,190) (308) Increase in non-current loans (500) (311) Total expenditures (7,483) (10,511) Proceeds from disposals of intangible assets and property, plant and equipment 163 2,282 Proceeds from disposals of subsidiaries, net of cash sold 146 (4) Proceeds from disposals of non-current investments 266 584 Repayment of non-current loans 487 997 Total divestments 1,062 3,859 Cash flow used in investing activities (6,421) (6,652) CASH FLOW USED IN FINANCING ACTIVITIES Issuance (repayment) of shares: - Parent company shareholders 450 482 - Treasury shares (1,770) (1,740) Dividends paid: - Parent company shareholders (4,765) (4,208) - Non-controlling interests (93) (84) Net issuance (repayment) of perpetual subordinated notes - - Payments on perpetual subordinated notes (315) (266) Other transactions with non-controlling interests (150) - Net issuance (repayment) of non-current debt 3,581 (2,428) Increase (decrease) in current borrowings (1,489) 969 Increase (decrease) in current financial assets and liabilities (58) (624) Cash flow used in financing activities (4,609) (7,899) Net increase (decrease) in cash and cash equivalents (1,150) (6,224) Effect of exchange rates (34) (486) Cash and cash equivalents at the beginning of the period 27,907 33,185 Cash and cash equivalents at the end of the period 26,723 26,475
23
CONSOLIDATED STATEMENT OF CHANGES IN SHAREHOLDERS' EQUITY TOTAL (unaudited)
Common shares issued Paid-in surplus and
retained earnings
Currency translation adjustment
Treasury shares Shareholders' equity - Group
Share
Non-controlling
interests
Total shareholders'
equity (M$) Number Amount
Number Amount
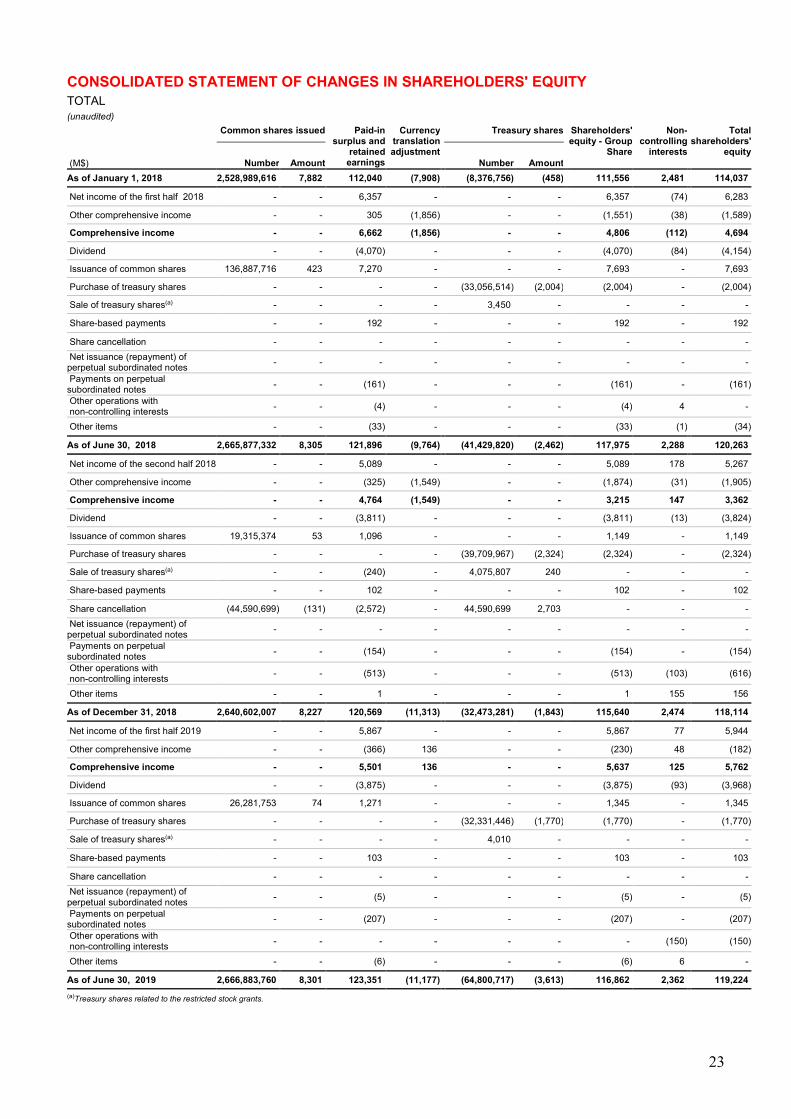
As of January 1, 2018 2,528,989,616 7,882 112,040 (7,908) (8,376,756) (458) 111,556 2,481 114,037 Net income of the first half 2018 - - 6,357 - - - 6,357 (74) 6,283 Other comprehensive income - - 305 (1,856) - - (1,551) (38) (1,589) Comprehensive income - - 6,662 (1,856) - - 4,806 (112) 4,694 Dividend - - (4,070) - - - (4,070) (84) (4,154) Issuance of common shares 136,887,716 423 7,270 - - - 7,693 - 7,693 Purchase of treasury shares - - - - (33,056,514) (2,004) (2,004) - (2,004) Sale of treasury shares(a) - - - - 3,450 - - - - Share-based payments - - 192 - - - 192 - 192 Share cancellation - - - - - - - - - Net issuance (repayment) of perpetual subordinated notes - - - - - - - - - Payments on perpetual subordinated notes - - (161) - - - (161) - (161) Other operations with non-controlling interests - - (4) - - - (4) 4 - Other items - - (33) - - - (33) (1) (34)
As of June 30, 2018 2,665,877,332 8,305 121,896 (9,764) (41,429,820) (2,462) 117,975 2,288 120,263 Net income of the second half 2018 - - 5,089 - - - 5,089 178 5,267 Other comprehensive income - - (325) (1,549) - - (1,874) (31) (1,905) Comprehensive income - - 4,764 (1,549) - - 3,215 147 3,362 Dividend - - (3,811) - - - (3,811) (13) (3,824) Issuance of common shares 19,315,374 53 1,096 - - - 1,149 - 1,149 Purchase of treasury shares - - - - (39,709,967) (2,324) (2,324) - (2,324) Sale of treasury shares(a) - - (240) - 4,075,807 240 - - - Share-based payments - - 102 - - - 102 - 102 Share cancellation (44,590,699) (131) (2,572) - 44,590,699 2,703 - - - Net issuance (repayment) of perpetual subordinated notes - - - - - - - - - Payments on perpetual subordinated notes - - (154) - - - (154) - (154) Other operations with non-controlling interests - - (513) - - - (513) (103) (616) Other items - - 1 - - - 1 155 156
As of December 31, 2018 2,640,602,007 8,227 120,569 (11,313) (32,473,281) (1,843) 115,640 2,474 118,114 Net income of the first half 2019 - - 5,867 - - - 5,867 77 5,944 Other comprehensive income - - (366) 136 - - (230) 48 (182) Comprehensive income - - 5,501 136 - - 5,637 125 5,762 Dividend - - (3,875) - - - (3,875) (93) (3,968) Issuance of common shares 26,281,753 74 1,271 - - - 1,345 - 1,345 Purchase of treasury shares - - - - (32,331,446) (1,770) (1,770) - (1,770) Sale of treasury shares(a) - - - - 4,010 - - - - Share-based payments - - 103 - - - 103 - 103 Share cancellation - - - - - - - - - Net issuance (repayment) of perpetual subordinated notes - - (5) - - - (5) - (5) Payments on perpetual subordinated notes - - (207) - - - (207) - (207) Other operations with non-controlling interests - - - - - - - (150) (150) Other items - - (6) - - - (6) 6 -
As of June 30, 2019 2,666,883,760 8,301 123,351 (11,177) (64,800,717) (3,613) 116,862 2,362 119,224 (a)Treasury shares related to the restricted stock grants.

24
INFORMATIONS BY BUSINESS SEGMENT TOTAL (unaudited)
2nd quarter 2019 Exploration &
Production
Integrated Gas, Renewables
& Power
Refining &
Chemicals
Marketing &
Services Corporate Intercompany Total
(M$)
Non-Group sales 2,273 3,789 22,509 22,671 - - 51,242 Intersegment sales 7,586 632 8,293 139 36 (16,686) - Excise taxes - - (761) (5,279) - - (6,040) Revenues from sales 9,859 4,421 30,041 17,531 36 (16,686) 45,202 Operating expenses (4,205) (3,878) (29,168) (16,844) (229) 16,686 (37,638) Depreciation, depletion and impairment of tangible assets and mineral interests (2,687) (328) (389) (237) (20) - (3,661) Operating income 2,967 215 484 450 (213) - 3,903 Net income (loss) from equity affiliates and other items 173 661 111 111 26 - 1,082
Tax on net operating income (1,161) (450) 46 (170) 64 - (1,671) Net operating income 1,979 426 641 391 (123) - 3,314 Net cost of net debt (510) Non-controlling interests (48) Net income - group share 2,756
2nd quarter 2019 (adjustments)(a) Exploration &
Production
Integrated Gas, Renewables
& Power
Refining &
Chemicals
Marketing &
Services Corporate Intercompany Total
(M$)
Non-Group sales - (59) - - - - (59) Intersegment sales - - - - - - - Excise taxes - - - - - - - Revenues from sales - (59) - - - - (59) Operating expenses - (54) (43) (34) - - (131) Depreciation, depletion and impairment of tangible assets and mineral interests (43) (11) (10) - - - (64) Operating income (b) (43) (124) (53) (34) - - (254) Net income (loss) from equity affiliates and other items - 407 (49) (7) - - 351
Tax on net operating income - (286) 28 9 - - (249) Net operating income (b) (43) (3) (74) (32) - - (152) Net cost of net debt (4) Non-controlling interests 25 Net income - group share (131) (a) Adjustments include special items, inventory valuation effect and the effect of changes in fair value. (b) Of which inventory valuation effect - On operating income - - (6) (34) - - On net operating income - - (1) (25) -
2nd quarter 2019 (adjusted) Exploration
& Production
Integrated Gas, Renewables
& Power
Refining &
Chemicals
Marketing &
Services Corporate Intercompany Total
(M$)
Non-Group sales 2,273 3,848 22,509 22,671 - - 51,301 Intersegment sales 7,586 632 8,293 139 36 (16,686) - Excise taxes - - (761) (5,279) - - (6,040) Revenues from sales 9,859 4,480 30,041 17,531 36 (16,686) 45,261 Operating expenses (4,205) (3,824) (29,125) (16,810) (229) 16,686 (37,507) Depreciation, depletion and impairment of tangible assets and mineral interests (2,644) (317) (379) (237) (20) - (3,597) Adjusted operating income 3,010 339 537 484 (213) - 4,157 Net income (loss) from equity affiliates and other items 173 254 160 118 26 - 731
Tax on net operating income (1,161) (164) 18 (179) 64 - (1,422) Adjusted net operating income 2,022 429 715 423 (123) - 3,466 Net cost of net debt (506) Non-controlling interests (73) Adjusted net income - group share 2,887
2nd quarter 2019 Exploration &
Production
Integrated Gas, Renewables
& Power
Refining &
Chemicals
Marketing &
Services Corporate Intercompany Total
(M$)
Total expenditures 2,257 857 363 383 36 3,896 Total divestments 60 349 70 85 1 565 Cash flow from operating activities 3,768 641 1,658 611 (427) 6,251

25
INFORMATIONS BY BUSINESS SEGMENT TOTAL (unaudited)
1st quarter 2019 Exploration &
Production
Integrated Gas, Renewables
& Power
Refining &
Chemicals
Marketing &
Services Corporate Intercompany Total
(M$)
Non-Group sales 1,794 6,419 21,711 21,279 2 - 51,205 Intersegment sales 7,716 627 8,017 162 27 (16,549) - Excise taxes - - (776) (5,305) - - (6,081) Revenues from sales 9,510 7,046 28,952 16,136 29 (16,549) 45,124 Operating expenses (4,029) (6,409) (27,334) (15,334) (177) 16,549 (36,734) Depreciation, depletion and impairment of tangible assets and mineral interests (2,529) (315) (374) (233) (15) - (3,466) Operating income 2,952 322 1,244 569 (163) - 4,924 Net income (loss) from equity affiliates and other items 194 380 149 (10) 1 - 714
Tax on net operating income (1,424) (173) (292) (164) 60 - (1,993) Net operating income 1,722 529 1,101 395 (102) - 3,645 Net cost of net debt (505) Non-controlling interests (29) Net income - group share 3,111
1st quarter 2019 (adjustments)(a) Exploration &
Production
Integrated Gas, Renewables
& Power
Refining &
Chemicals
Marketing &
Services Corporate Intercompany Total
(M$)
Non-Group sales - (27) - - - - (27) Intersegment sales - - - - - - - Excise taxes - - - - - - - Revenues from sales - (27) - - - - (27) Operating expenses - (58) 492 74 - - 508 Depreciation, depletion and impairment of tangible assets and mineral interests - - - - - - - Operating income (b) - (85) 492 74 - - 481 Net income (loss) from equity affiliates and other items - 6 2 - - - 8
Tax on net operating income - 16 (149) (22) - - (155) Net operating income (b) - (63) 345 52 - - 334 Net cost of net debt (4) Non-controlling interests 22 Net income - group share 352 (a) Adjustments include special items, inventory valuation effect and the effect of changes in fair value. (b) Of which inventory valuation effect - On operating income - - 492 74 - - On net operating income - - 345 52 -
1st quarter 2019 (adjusted) Exploration &
Production
Integrated Gas, Renewables
& Power
Refining &
Chemicals
Marketing &
Services Corporate Intercompany Total
(M$)
Non-Group sales 1,794 6,446 21,711 21,279 2 - 51,232 Intersegment sales 7,716 627 8,017 162 27 (16,549) - Excise taxes - - (776) (5,305) - - (6,081) Revenues from sales 9,510 7,073 28,952 16,136 29 (16,549) 45,151 Operating expenses (4,029) (6,351) (27,826) (15,408) (177) 16,549 (37,242) Depreciation, depletion and impairment of tangible assets and mineral interests (2,529) (315) (374) (233) (15) - (3,466) Adjusted operating income 2,952 407 752 495 (163) - 4,443 Net income (loss) from equity affiliates and other items 194 374 147 (10) 1 - 706
Tax on net operating income (1,424) (189) (143) (142) 60 - (1,838) Adjusted net operating income 1,722 592 756 343 (102) - 3,311 Net cost of net debt (501) Non-controlling interests (51) Adjusted net income - group share 2,759
1st quarter 2019 Exploration &
Production
Integrated Gas, Renewables
& Power
Refining &
Chemicals
Marketing &
Services Corporate Intercompany Total
(M$)
Total expenditures 2,025 1,118 285 144 15 3,587 Total divestments 29 225 169 72 2 497 Cash flow from operating activities 3,936 892 (538) 232 (893) 3,629

26
INFORMATIONS BY BUSINESS SEGMENT TOTAL (unaudited)
2nd quarter 2018 Exploration &
Production
Integrated Gas, Renewables
& Power
Refining &
Chemicals
Marketing &
Services Corporate Intercompany Total
(M$)
Non-Group sales 3,119 3,547 23,349 22,528 (3) - 52,540 Intersegment sales 7,646 469 9,440 293 (63) (17,785) - Excise taxes - - (867) (5,571) - - (6,438) Revenues from sales 10,765 4,016 31,922 17,250 (66) (17,785) 46,102 Operating expenses (4,791) (3,605) (30,369) (16,416) (122) 17,785 (37,518) Depreciation, depletion and impairment of tangible assets and mineral interests (2,345) (603) (304) (172) (11) - (3,435) Operating income 3,629 (192) 1,249 662 (199) - 5,149 Net income (loss) from equity affiliates and other items 256 441 289 107 11 - 1,104
Tax on net operating income (1,687) (104) (279) (194) 85 - (2,179) Net operating income 2,198 145 1,259 575 (103) - 4,074 Net cost of net debt (440) Non-controlling interests 87 Net income - group share 3,721
2nd quarter 2018 (adjustments)(a) Exploration &
Production
Integrated Gas, Renewables
& Power
Refining &
Chemicals
Marketing &
Services Corporate Intercompany Total
(M$)
Non-Group sales - 24 - - - - 24 Intersegment sales - - - - - - - Excise taxes - - - - - - - Revenues from sales - 24 - - - - 24 Operating expenses (97) (9) 569 134 - - 597 Depreciation, depletion and impairment of tangible assets and mineral interests - (424) - - - - (424) Operating income (b) (97) (409) 569 134 - - 197 Net income (loss) from equity affiliates and other items (66) (4) 46 1 - - (23)
Tax on net operating income 46 (7) (177) (38) - - (176) Net operating income (b) (117) (420) 438 97 - - (2) Net cost of net debt (9) Non-controlling interests 179 Net income - group share 168 (a) Adjustments include special items, inventory valuation effect and the effect of changes in fair value. (b) Of which inventory valuation effect - On operating income - - 569 134 - - On net operating income - - 438 97 -
2nd quarter 2018 (adjusted) Exploration &
Production
Integrated Gas, Renewables
& Power
Refining &
Chemicals
Marketing &
Services Corporate Intercompany Total
(M$)
Non-Group sales 3,119 3,523 23,349 22,528 (3) - 52,516 Intersegment sales 7,646 469 9,440 293 (63) (17,785) - Excise taxes - - (867) (5,571) - - (6,438) Revenues from sales 10,765 3,992 31,922 17,250 (66) (17,785) 46,078 Operating expenses (4,694) (3,596) (30,938) (16,550) (122) 17,785 (38,115) Depreciation, depletion and impairment of tangible assets and mineral interests (2,345) (179) (304) (172) (11) - (3,011) Adjusted operating income 3,726 217 680 528 (199) - 4,952 Net income (loss) from equity affiliates and other items 322 445 243 106 11 - 1,127
Tax on net operating income (1,733) (97) (102) (156) 85 - (2,003) Adjusted net operating income 2,315 565 821 478 (103) - 4,076 Net cost of net debt (431) Non-controlling interests (92) Adjusted net income - group share 3,553
2nd quarter 2018 Exploration
& Production
Integrated Gas, Renewables
& Power
Refining &
Chemicals
Marketing &
Services Corporate Intercompany Total
(M$)
Total expenditures 2,612 447 404 310 14 3,787 Total divestments 466 439 324 45 - 1,274 Cash flow from operating activities 4,474 258 999 841 (326) 6,246

27
INFORMATIONS BY BUSINESS SEGMENT TOTAL (unaudited)
1sthalf 2019 Exploration &
Production
Integrated Gas, Renewables
& Power
Refining &
Chemicals
Marketing &
Services Corporate Intercompany Total
(M$)
Non-Group sales 4,067 10,208 44,220 43,950 2 - 102,447 Intersegment sales 15,302 1,259 16,310 301 63 (33,235) - Excise taxes - - (1,537) (10,584) - - (12,121) Revenues from sales 19,369 11,467 58,993 33,667 65 (33,235) 90,326 Operating expenses (8,234) (10,287) (56,502) (32,178) (406) 33,235 (74,372) Depreciation, depletion and impairment of tangible assets and mineral interests (5,216) (643) (763) (470) (35) - (7,127) Operating income 5,919 537 1,728 1,019 (376) - 8,827 Net income (loss) from equity affiliates and other items 367 1,041 260 101 27 - 1,796
Tax on net operating income (2,585) (623) (246) (334) 124 - (3,664) Net operating income 3,701 955 1,742 786 (225) - 6,959 Net cost of net debt (1,015) Non-controlling interests (77) Net income - group share 5,867
1sthalf 2019 (adjustments)(a) Exploration &
Production
Integrated Gas, Renewables
& Power
Refining &
Chemicals
Marketing &
Services Corporate Intercompany Total
(M$)
Non-Group sales - (86) - - - - (86) Intersegment sales - - - - - - - Excise taxes - - - - - - - Revenues from sales - (86) - - - - (86) Operating expenses - (112) 449 40 - - 377 Depreciation, depletion and impairment of tangible assets and mineral interests (43) (11) (10) - - - (64) Operating income (b) (43) (209) 439 40 - - 227 Net income (loss) from equity affiliates and other items - 413 (47) (7) - - 359
Tax on net operating income - (270) (121) (13) - - (404) Net operating income (b) (43) (66) 271 20 - - 182 Net cost of net debt (8) Non-controlling interests 47 Net income - group share 221 (a) Adjustments include special items, inventory valuation effect and the effect of changes in fair value. (b) Of which inventory valuation effect - On operating income - - 486 40 - - On net operating income - - 344 27 -
1sthalf 2019 (adjusted) Exploration
& Production
Integrated Gas, Renewables
& Power
Refining &
Chemicals
Marketing &
Services Corporate Intercompany Total
(M$)
Non-Group sales 4,067 10,294 44,220 43,950 2 - 102,533 Intersegment sales 15,302 1,259 16,310 301 63 (33,235) - Excise taxes - - (1,537) (10,584) - - (12,121) Revenues from sales 19,369 11,553 58,993 33,667 65 (33,235) 90,412 Operating expenses (8,234) (10,175) (56,951) (32,218) (406) 33,235 (74,749) Depreciation, depletion and impairment of tangible assets and mineral interests (5,173) (632) (753) (470) (35) - (7,063) Adjusted operating income 5,962 746 1,289 979 (376) - 8,600 Net income (loss) from equity affiliates and other items 367 628 307 108 27 - 1,437
Tax on net operating income (2,585) (353) (125) (321) 124 - (3,260) Adjusted net operating income 3,744 1,021 1,471 766 (225) - 6,777 Net cost of net debt (1,007) Non-controlling interests (124) Adjusted net income - group share 5,646
1sthalf 2019 Exploration &
Production
Integrated Gas, Renewables
& Power
Refining &
Chemicals
Marketing &
Services Corporate Intercompany Total
(M$)
Total expenditures 4,282 1,975 648 527 51 7,483 Total divestments 89 574 239 157 3 1,062 Cash flow from operating activities 7,704 1,533 1,120 843 (1,320) 9,880

28
TOTAL (unaudited)
1sthalf 2018 Exploration &
Production
Integrated Gas, Renewables
& Power
Refining &
Chemicals
Marketing &
Services Corporate Intercompany Total
(M$)
Non-Group sales 5,337 7,887 45,088 43,836 3 - 102,151 Intersegment sales 14,423 961 17,396 491 34 (33,305) - Excise taxes - - (1,714) (11,043) - - (12,757) Revenues from sales 19,760 8,848 60,770 33,284 37 (33,305) 89,394 Operating expenses (8,721) (8,123) (58,248) (31,919) (399) 33,305 (74,105) Depreciation, depletion and impairment of tangible assets and mineral interests (4,561) (807) (617) (346) (20) - (6,351) Operating income 6,478 (82) 1,905 1,019 (382) - 8,938 Net income (loss) from equity affiliates and other items 577 795 417 193 9 - 1,991
Tax on net operating income (3,119) (237) (383) (297) 181 - (3,855) Net operating income 3,936 476 1,939 915 (192) - 7,074 Net cost of net debt (791) Non-controlling interests 74 Net income - group share 6,357
1sthalf 2018 (adjustments)(a) Exploration &
Production
Integrated Gas, Renewables
& Power
Refining &
Chemicals
Marketing &
Services Corporate Intercompany Total
(M$)
Non-Group sales - 13 - - - - 13 Intersegment sales - - - - - - - Excise taxes - - - - - - - Revenues from sales - 13 - - - - 13 Operating expenses (150) (101) 531 105 (9) - 376 Depreciation, depletion and impairment of tangible assets and mineral interests - (446) - - - - (446) Operating income (b) (150) (534) 531 105 (9) - (57) Net income (loss) from equity affiliates and other items (167) (15) 25 - - - (157)
Tax on net operating income 121 (21) (158) (35) - - (93) Net operating income (b) (196) (570) 398 70 (9) - (307) Net cost of net debt (19) Non-controlling interests 246 Net income - group share (80) (a) Adjustments include special items, inventory valuation effect and the effect of changes in fair value. (b) Of which inventory valuation effect - On operating income - - 531 105 - - On net operating income - - 415 70 -
1sthalf 2018 (adjusted) Exploration &
Production
Integrated Gas, Renewables
& Power
Refining &
Chemicals
Marketing &
Services Corporate Intercompany Total
(M$)
Non-Group sales 5,337 7,874 45,088 43,836 3 - 102,138 Intersegment sales 14,423 961 17,396 491 34 (33,305) - Excise taxes - - (1,714) (11,043) - - (12,757) Revenues from sales 19,760 8,835 60,770 33,284 37 (33,305) 89,381 Operating expenses (8,571) (8,022) (58,779) (32,024) (390) 33,305 (74,481) Depreciation, depletion and impairment of tangible assets and mineral interests (4,561) (361) (617) (346) (20) - (5,905) Adjusted operating income 6,628 452 1,374 914 (373) - 8,995 Net income (loss) from equity affiliates and other items 744 810 392 193 9 - 2,148
Tax on net operating income (3,240) (216) (225) (262) 181 - (3,762) Adjusted net operating income 4,132 1,046 1,541 845 (183) - 7,381 Net cost of net debt (772) Non-controlling interests (172) Adjusted net income - group share 6,437
1sthalf 2018 Exploration &
Production
Integrated Gas, Renewables
& Power
Refining &
Chemicals
Marketing &
Services Corporate Intercompany Total
(M$)
Total expenditures 8,157 1,022 736 538 58 10,511 Total divestments 2,642 592 349 273 3 3,859 Cash flow from operating activities 7,796 326 (110) 781 (466) 8,327 -

29
Reconciliation of the information by business segment with Consolidated Financial Statements TOTAL (unaudited)
Consolidated 2nd quarter 2019 statement (M$) Adjusted Adjustments(a) of income Sales 51,301 (59) 51,242 Excise taxes (6,040) - (6,040) Revenues from sales 45,261 (59) 45,202 Purchases net of inventory variation (30,295) (95) (30,390) Other operating expenses (7,042) (36) (7,078) Exploration costs (170) - (170) Depreciation, depletion and impairment of tangible assets and mineral interests (3,597) (64) (3,661) Other income 253 68 321 Other expense (117) (72) (189) Financial interest on debt (564) (4) (568) Financial income and expense from cash & cash equivalents (42) - (42) Cost of net debt (606) (4) (610) Other financial income 326 - 326 Other financial expense (188) - (188) Net income (loss) from equity affiliates 457 355 812 Income taxes (1,322) (249) (1,571) Consolidated net income 2,960 (156) 2,804 Group share 2,887 (131) 2,756 Non-controlling interests 73 (25) 48 (a) Adjustments include special items, inventory valuation effect and the effect of changes in fair value. Consolidated 2nd quarter 2018 statement (M$) Adjusted Adjustments(a) of income Sales 52,516 24 52,540 Excise taxes (6,438) - (6,438) Revenues from sales 46,078 24 46,102 Purchases net of inventory variation (31,263) 664 (30,599) Other operating expenses (6,694) (67) (6,761) Exploration costs (158) - (158) Depreciation, depletion and impairment of tangible assets and mineral interests (3,011) (424) (3,435) Other income 254 (2) 252 Other expense (55) (358) (413) Financial interest on debt (469) (9) (478) Financial income and expense from cash & cash equivalents (54) - (54) Cost of net debt (523) (9) (532) Other financial income 321 - 321 Other financial expense (159) - (159) Net income (loss) from equity affiliates 766 337 1,103 Income taxes (1,911) (176) (2,087) Consolidated net income 3,645 (11) 3,634 Group share 3,553 168 3,721 Non-controlling interests 92 (179) (87) (a) Adjustments include special items, inventory valuation effect and the effect of changes in fair value.

30
Reconciliation of the information by business segment with Consolidated Financial Statements TOTAL (unaudited)
Consolidated 1sthalf 2019 statement of (M$) Adjusted Adjustments(a) income Sales 102,533 (86) 102,447 Excise taxes (12,121) - (12,121) Revenues from sales 90,412 (86) 90,326 Purchases net of inventory variation (60,533) 422 (60,111) Other operating expenses (13,758) (45) (13,803) Exploration costs (458) - (458) Depreciation, depletion and impairment of tangible assets and mineral interests (7,063) (64) (7,127) Other income 453 115 568 Other expense (190) (208) (398) Financial interest on debt (1,121) (8) (1,129) Financial income and expense from cash & cash equivalents (70) - (70) Cost of net debt (1,191) (8) (1,199) Other financial income 486 - 486 Other financial expense (383) - (383) Net income (loss) from equity affiliates 1,071 452 1,523 Income taxes (3,076) (404) (3,480) Consolidated net income 5,770 174 5,944 Group share 5,646 221 5,867 Non-controlling interests 124 (47) 77 (a) Adjustments include special items, inventory valuation effect and the effect of changes in fair value. Consolidated 1sthalf 2018 statement of (M$) Adjusted Adjustments(a) income Sales 102,138 13 102,151 Excise taxes (12,757) - (12,757) Revenues from sales 89,381 13 89,394 Purchases net of inventory variation (60,623) 578 (60,045) Other operating expenses (13,496) (202) (13,698) Exploration costs (362) - (362) Depreciation, depletion and impairment of tangible assets and mineral interests (5,905) (446) (6,351) Other income 628 147 775 Other expense (115) (488) (603) Financial interest on debt (849) (19) (868) Financial income and expense from cash & cash equivalents (95) - (95) Cost of net debt (944) (19) (963) Other financial income 561 - 561 Other financial expense (329) - (329) Net income (loss) from equity affiliates 1,403 184 1,587 Income taxes (3,590) (93) (3,683) Consolidated net income 6,609 (326) 6,283 Group share 6,437 (80) 6,357 Non-controlling interests 172 (246) (74) (a) Adjustments include special items, inventory valuation effect and the effect of changes in fair value.