secretos revelados de cómo israel manipula la opinión pública estadounidense
DESCRIPTION
Uno de los secretos del gobierno israelí a la manipulación de los medios de comunicación estadounidenses ha sido revelado por primera vez por una nueva investigación.Israel lanza habitualmente su más impopular y, a veces, los ataques mortales contra los palestinos en Cisjordania y Gaza para coincidir con acontecimientos noticiosos grandes aquí en los EE.UU., por lo que no reciben demasiada atención pública, según el estudio.TRANSCRIPT
Attack When the World Is Not Watching?International Media and the Israeli-Palestinian
Conflict∗
Ruben Durante† Ekaterina Zhuravskaya‡
February 2015
ABSTRACT
Governments often take unpopular measures. To minimize the political costof such measures policy makers may strategically time them to coincide withother newsworthy events, which distract the media and the public. We test thishypothesis using data on the recurrent Israeli-Palestinian conflict. Combiningdaily data on attacks on both sides of the conflict with data on the content ofevening news for top U.S. TV networks, we show that Israeli attacks are morelikely to be carried out when the U.S. news are expected to be dominated byimportant (non-Israel-related) events on the following day. In contrast, we findno evidence of strategic timing for Palestinian attacks. The timing of Israeli at-tacks that we document is suggestive of the intention to minimize next-day newscoverage which, as confirmed by comprehensive video content analysis, is es-pecially charged with negative emotional content. We also find that: i) strategictiming of Israeli attacks is less relevant in period of more intense fighting, whenthe need to quickly retaliate reduces Israel’s capacity to time operations strate-gically; ii) strategic timing is present only for the Israeli attacks that bear risk ofcivilians being affected; and iii) Israeli attacks are timed to newsworthy eventsthat are predictable.
Keywords: Conflict, mass media, accountability, strategic timing
∗We thank Morten Bennedsen, Tim Besley, Matteo Cervellati, Antonio Ciccone, Oeindrila Dube, PascalineDupas, Irena Grosfeld, Fred Finan, Sophie Hatte, Emeric Henry, Roberto Galbiati and Tommaso Oliviero,as well as participants in the 2014 Workshop on Media Economics at CSEF, the 2015 Workshop on Conflictat the University of Munich, and the 2015 Conference on the “Political economy of Conflict” (Villars), andseminar participants at Sciences Po, the London School of Economics, INSEAD, and Mannheim for helpfulcomments. We thank Monica Consorti, Florin Cucu, Etienne Fize, and especially Iván Torre for outstandingresearch assistance.†Sciences Po. E-mail: [email protected] (corresponding author).‡Paris School of Economics (EHESS). E-mail: [email protected].
1. INTRODUCTION
On August 8 2008, day of the opening ceremony of the Beijing Summer Olympics, Russia
initiated the invasion of Georgia. On July 8 2014, day of the FIFA World Cup semifinal
between Brazil and Germany, Israeli launched operation “Protective Edge” in Gaza. On
July 13 1994, the day Italy qualified to the final of the FIFA World Cup, the government
of Silvio Berlusconi passed an emergency decree - the so-called “save-the-thieves” decree -
that allowed hundreds of corrupt politicians to avoid jail sentence.
In this paper we argue that the timing of these seemingly unrelated events is hardly
a coincidence. Governments are accountable to the extent that the public is informed about
their actions. Mass media ensure accountability by informing citizens about government ac-
tions (e.g., Besley and Prat, 2006; Snyder and Stromberg, 2010). Yet, how effectively mass
media inform the public depends, among other things, on the presence of other newsworthy
events that may crowd out the news coverage of governments’ actions (e.g., Eisensee and
Stromberg, 2007). To minimize negative publicity policy-makers may strategically manipu-
late the timing of their unpopular actions so that they coincide with particular moments when
the mass media and the public are distracted by other events.1
This paper aims at testing this proposition focusing on the timing of military oper-
ations during an on-going conflict. Military operations often receive negative international
publicity, especially when they result in civilian casualties. If the attacker cares about inter-
national public opinion and if the conflict is recurrent, this conflict is a good testing ground
for strategic timing considerations as time series data exist both on military operations (i.e.,
the unpopular policy measure) and on the occurrence of other newsworthy events.
Our focus is on the Israeli-Palestinian conflict. Both Israelis and Palestinians care
about international public opinion and recognize the importance of international media in
shaping it. Since the 1970s, the Israeli government places a special emphasis on the efforts to
project a positive image of Israel and of the Israeli army abroad, a policy known as hasbara,
Hebrew for “explanation.” This policy encompasses public diplomacy, the work of Israeli
government with international journalists in Israel, and the presence of Israeli advocates on
1 Figure A.1 in the online appendix presents an example of the front pages of three national and internationalnewspapers that covered the three the political events, mentioned above. Noticeably, the space allocated tothese events was substantially smaller than that devoted to the sports events with which they coincided.
1
social media. Arguably, nothing has a stronger negative impact on the international public
opinion of any side in a military conflict than the presence of civilian casualties as a result of
its military action. The Israeli-Palestinian conflict is no exception to this rule; and both sides
of the conflict recognize it and acknowledge the role of the media in informing the public
about the conflict. This is exemplified by Israeli Prime Minister Benjamin Netanyahu who
stated in an interview to CNN on July 20 2014, while explaining the heart-wrenching images
of civilian Palestinian victims in Gaza:“[Hamas] wants to pile up as many civilian dead as
they can... they use telegenically dead Palestinians for their cause.”2
The main question of this paper is whether either side of the conflict chooses the
timing of its attacks to coincide with other newsworthy international events so as to minimize
the negative impact of their actions on international public opinion.
As for Israel, our hypothesis is that Israeli authorities wants to avoid international
media coverage of their military operations - especially if and when these may yield civil-
ian casualties - since this may attract criticism from international organizations and human
rights activists, and risk to alienate popular support in key partner countries, such as the U.S.
Importantly, domestic news coverage (in addition to international news coverage) of the mil-
itary incidents that lead to civilian casualties is also costly for the domestic popularity of
incumbent Israeli government.
As for Palestinian groups, their incentives are a priori less clear cut due to coun-
tervailing effects of international and domestic publicity. On the one hand, international
coverage of Palestinian attacks–especially those resulting in civilian victims–may sway in-
ternational public opinion in favor of Israel, which serves against the Palestinian cause. On
the other hand, however, domestic coverage of the attacks against Israel may foster popular
support for terrorist organizations among the Palestinian population, and make it is easier
for them to attract new recruits. Furthermore, terrorists are usually interested in higher do-
mestic publicity because it is associated with higher devastation and fear, which presumably
is one of the main goals of the terrorist attacks. In addition, Palestinian terrorist attacks are
carried out by a number of independent factions, which creates a possibility of coordination
problems between them. Thus, in the case of Palestinians, the hypothesis is ambiguous.
2 http://cnnpressroom.blogs.cnn.com/2014/07/20/netanyahu-to-cnns-wolf-blitzer-i-support-taking-whatever-action-is-necessary-to-stop-this-insane-situation/ (accessed on January 19, 2015).
2
We test these hypotheses using daily time series on the occurrence and the severity
of both Israeli military operations in the West Bank and Gaza strip, and attacks by Pales-
tinian militant groups on Israeli territory between 2000 and 2011. These data, which were
compiled by two independent human rights organizations, include information on the num-
ber of attacks (and the resulting number of casualties) carried out by each side on each day.
We combine this information with a measure of the presence of other newsworthy events on
international media that may crowd out news coverage of the Israeli-Palestinian conflict. In
particular, we use the direct analogue of the news pressure variable first proposed by Eisensee
and Stromberg (2007). We compute news pressure as the time devoted to the top three sto-
ries, not related to either Israel or Palestine, in the evening news in three U.S. TV networks,
NBC, ABC, and CBS. This measure captures the presence of competing news stories on
each given day.
As a starting point, we confirm that important attacks in the Israeli-Palestinian con-
flict are often covered by international media and that, as the work of Eisensee and Stromberg
(2007) suggests, the probability that the attacks are covered, conditional on their severity, de-
creases with an increase in news pressure, due to the occurrence of other newsworthy events
on the same day. Furthermore, using data on Google searches, we document that TV cov-
erage of Israeli and Palestinian attacks, conditional on their severity, increases the public’s
attention to the conflict: the daily volume of Google searches for the topic “Israeli-Palestinian
conflict” increases by 12% with each additional news story on the conflict featured on U.S.
prime-time TV news.
As a next step, we examine how the timing of the attacks (on both sides) is related to
the daily international news pressure. We relate the incidence of a deadly attack on a given
day by each side in the conflict and its intensity measured by the log number of fatalities to
the news pressure recorded on each day around the attack.
Our empirical strategy is based on the assumption that news in the U.S. that are not
related to Israel or Palestine - and hence the news pressure variable - are exogenous to actions
by both Israelis and Palestinians.
We find that the likelihood of deadly military attacks by Israeli forces against Pales-
tinians, as well as the number of victims they cause, is positively and significantly related
3
to the level of news pressure on the day after the attack is carried out. This suggests that
Israeli authorities may chose the timing of their attacks strategically to minimize negative
international publicity. In contrast, we find no evidence that attacks by Palestinian militant
groups are timed to U.S. news pressure. The result on the timing of Israeli attacks to news
pressure is not driven by the presence of outliers, and is robust to controlling for the retali-
ation motive of the Israeli attacks (with dummies for the presence of a Palestinian attack in
previous days), for seasonality (with calendar month and day of the week fixed effects), and
for the general dynamics in conflict intensity (with year fixed effects). Finally, it is robust to
accounting for serial correlation by different means, i.e., including lags and leads, adjusting
standard errors to Newey-West estimation, or clustering them by month-year.
If the relationship between the Israeli attacks and the U.S. news pressure the fol-
lowing day is, indeed, driven by the strategic timing considerations on the part of Israeli
government, several testable implications arise. First, the timing of an attack can only be
affected by strategic considerations when the intensity of the conflict is sufficiently low to
leave some discretion in choosing when to attack. Our data span across two distinct peri-
ods with sharply different intensity of the conflict: 1) the Second Intifada period (September
28, 2000 - February 8, 2005), characterized by very intense violence with deadly attacks
occurring, on two out of each three days; and 2) the post-Intifada period (from February 9,
2005 to the end of our sample period), characterized by a much lower intensity of fighting,
with the average distance between one Israeli attack and the following one being seven times
larger than during Intifada. Given the high intensity of fighting during the Second Intifada,
we expect Israel to have had little room for manoeuvre and, therefore, little strategic adjust-
ment of timing of operations to minimize publicity during this period. This prediction finds
support in the data: we find that the timing of Israeli operations is significantly affected by
news pressure on U.S. media only in the post-Intifada period. We also find that during the
Intifada, the timing of the Israeli attacks was more affected by the need to quickly retaliate
against Palestinian attacks.3
Second, one should expect only those military operations that are likely to gener-
3 Another much shorter episode of a very intense violence broke out during the Gaza War, also known as the“Operation Cast Lead,” between December 27, 2008 and January 18, 2009. All our results are very similarirrespective of whether we exclude the Gaza War period from the sample.
4
ate negative publicity to be timed to news pressure. Since the main source of the negative
publicity, which sways international public opinion against Israel, is the presence civilian
casualties, only the attacks that carry the risk of civilians being affected should be subject to
strategic timing. We test this prediction using three alternative measures of whether an attack
has ex ante a higher risk to result in civilian casualties: 1) the presence or absence of fatalities
(ex post), 2) the type of the weapon used, i.e. heavy weapons vs. light ammunition, and 3)
whether the attack took place in a densely populated area. While only 34.4% of all Israeli
military operations result in deaths, this is the case for 68% of the attacks involving heavy
weapons (e.g., artillery shells, missiles), and for 49.6% of the attacks, carried out in densely
populated areas. We find evidence that only military operations that do result in deaths, in
contrast to attacks that do not cause fatalities, are timed to news pressure. We also find the
strategic timing effect to be significant only for attacks involving heavy weapons, and for
those localized in densely populated areas. Summing-up, the data support the prediction that
only serious operations, that are more likely to generate negative publicity due to higher risk
of civilian casualties, are strategically timed to minimize media coverage.
Third, in order to time the military operations so that they occur one day before the
high news pressure, Israeli authorities should be able to predict news pressure. As the news
pressure variable is based on all news stories that do not involve either Israel or Palestine,
high news pressure may be due to the occurrence of both predictable newsworthy events
(e.g., notable political or sports events), and unpredictable ones (e.g., natural disasters). To
test whether Israeli attacks are timed to the predictable component of news pressure, we
analyze the text of the headlines of the news stories featured on the days with very high news
pressure separately for the days, when an Israeli attack occurred the day before, and the days,
when no Israeli attack occurred the day before. We find that in days with high news pressure
and no Israeli operation on the day before 46% of all headlines contained words that evoked
natural or human-made disasters; in contrast, in days with high news pressure preceded by
an Israeli operation, only 12% of the headlines were related to disasters. In contrast, we
find that Israeli attacks are more likely to occur prior to days with very high news pressure
driven by clearly predictable events (e.g., U.S. holiday shopping). Overall, our analysis
suggests that Israeli attacks are timed to news pressure associated with predictable rather
5
than unpredictable events.
Finally, we examine the mechanism behind the strategic timing effect. In particular,
we test alternative explanations for why Israel times its attacks to the news pressure on the
following day rather than to the news pressure on the same day. First, we test and reject the
hypothesis that news coverage of the conflict on U.S. TV is “slow,” i.e., that Israeli attacks
are more likely to appear on the news the day after the attack than on the same day. We find
that, on average, twice as many stories about the Israeli-Palestinian conflict appear on the
news on the day of an Israeli attack than on the next day.
This suggests that it is not the mere fact that its attacks get covered in the news that
the Israeli government is trying to avoid by choosing the timing of the attacks strategically,
but, rather, a particular type of coverage of the attacks. Using data on the length of each news
story, we examine how much time is devoted by U.S. media to stories about Israeli attacks
on the same and on the following day. Despite the fact that Israeli attacks are significantly
more likely to appear on the news on the day of the attack than on the following day, the
average length of the conflict-related stories is not statistically different between the same
and the next day. This is due to the fact that–provided that an attack is covered–conflict-
related stories, appearing on the day following an attack, are on average longer than those
featured the same day.
To examine the differences in the actual content of the broadcasts of same- vs. next-
day, we coded all videos related to Israeli-Palestinian conflict that appeared on prime-time
news on two networks, NBC and CNN, between 2000 and 2011 (available from the Vander-
bilt Television News Archive). We focused on the type and the form of information provided
in each story. Out of total of 582 videos on the Israeli-Palestinian conflict, 499 reported on
Israeli or Palestinian attacks occurred on the same or on the previous day, 324 reported on Is-
raeli attacks but also spoke about Palestinian attacks, and 201 were about a particular Israeli
attack and did not mention any Palestinian attack. Regardless of how we restrict the sample,
we find that the type of coverage of Israeli attacks differs substantially (and statistically sig-
nificantly) between same-day and next-day reports. In particular, while both same-day and
next-day news stories are equally likely to report information on the number of victims and
the location of the attack, news stories that appear on the day after the attack are much more
6
likely to present personal life stories of the civilian victims and include interviews with their
relatives or friends. Furthermore, next-day coverage is significantly more likely to include
emotionally-charged visuals of burial processions and scenes of mourning. In contrast, of-
ficial reactions by the Israeli authorities about the incident are less likely to be reported in
next-day coverage.
Anecdotal evidence suggests that these differences are driven both by technical as-
pects of news-reporting of armed conflicts, and by local customs and traditions specific to
the Middle East. First, when Israel strikes against Palestinian militants, there are usually no
international reporters in the vicinity of the target area, and it takes time for them to get on
site. Second, even when reporters are nearby, it is often dangerous to reach the the actual
location of the attack due to the risk of follow-up attacks; for the same reason (potential)
witnesses of the attack also hide so that even if journalists arrive on site, finding information
quickly can be difficult. Third, it takes time for reporters to uncover the details about what
actually happened. Forth, the local tradition dictates that victims are buried the day after
the death. The burial ceremony presents a relatively easy and safe opportunity to produce
emotionally-charged footage, as the ceremony takes place in open air and is generally widely
attended by the local population. Furthermore, it provides reporters with a good opportunity
to access information about the victims, as people who personally knew them participate in
the ceremony.
Both the actual informational content (statistics vs. personal stories) and the form in
which it is presented (with or without the visual), have very different effect on the recipients
of the news. As well-established in the cognitive and social psychology literature, people
react more strongly to personal stories than to statistics and dry facts (e.g., Borgida and
Nisbett, 1977; Martin and Powers, 1982; Wilkins, 1983), and information transmitted only
by means of words is less likely to be retained than information than if accompanied by
images (e.g., Mandl and Levin, eds, 1989; Houghton and Willows, eds, 1987a,b; Houts et
al., 2006).
Taken together, our findings suggest that Israeli authorities behave strategically in
timing their attacks to predictable international newsworthy events in order to minimize neg-
ative publicity abroad, and that such strategy is sophisticated in that it takes into account both
7
the technology of news reporting in war areas and the cognitive psychology of information
transmission and retention.
Our research relates to several strends of literature. First, our study contributes to the
literature on political accountability and mass media (see, for instance, surveys by Prat and
Stromberg, 2013; Sobbrio, 2014). To the best of our knowledge, our paper is the first to pro-
vide systematic evidence that policy makers act strategically to minimize the negative impact
of media reporting of their unpopular actions by manipulating the timing of their actions to
coincide with other newsworthy events. Second, our paper contributes to a growing body
of work on the role of mass media in conflicts. Economic contributions on the topic have
largely focused on estimating the persuasion effects of mass media on conflict (DellaVigna
et al., 2014; Yanagizawa-Drott, 2014; Adena et al., 2013). In contrast, historians and polit-
ical scientists alike have directly addressed the issue of how media may constrain behavior
in a conflict environment (see, for instance, a collection of articles in Seethaler et al., eds,
2013), without, however, providing any systematic evidence of the kind presented here. Fi-
nally, our paper contributes to the literature on strategic behavior in conflicts both in general
(see Blattman and Miguel, 2010; Jackson and Morelli, 2009) and in the Israeli-Palestinian
conflict, in particular (e.g., Jaeger et al., 2010; Jaeger and Paserman, 2008, 2006, 2009).
The remainder of the paper is organized as follows. Section 2 provides background
information on the Israeli-Palestinian conflict. Section 3 describes the data. Section 4
presents the results on the relationship between the timing of attacks and news pressure
and section 5 provides evidence on the mechanism. Section 6 concludes.
2. BACKGROUND: ISRAELI-PALESTINIAN CONFLICT
Israeli-Palestinian conflict is long-lasting. The fighting on both sides continues with varying
intensity since 1948. During our observation period, i.e., between September 29, 2000 and
November 24, 2011, it lead to 7690 fatalities, including 6401 on the Palestinian side and
1289 on the Israeli side.4 The three weeks of Gaza War (or the Operation Cast Lead) between
December 27, 2008 and January 18, 2009 was the period of most intense fighting yielding
17.8% all fatalities out of the total death tall during the observation period, namely, 1349
4 The fatalities tall excludes the suicide bombers.
8
Palestinians and 19 Israelis. Figure 1 presents the monthly number of fatalities on both
sides of the conflict for the entire observation period and excluding the three weeks of most
intense fighting during the Gaza War, which is our baseline sample. Once the Gaza War
is excluded, it becomes evident that our sample period covers two stages of the conflict,
that differ substantially in terms of intensity of the fighting: the Second Intifada (from the
begging of our observation period up to February 8, 2005) and the Post-Intifada period (from
February 9, 2005 onward).5 Horizontal lines on the figure present the average number of
fatalities per month on both sides of the conflict separately for the two periods, substantially
higher during the Second Intifada.
Two observations are important for our story. First, the Israeli-Palestinian conflict is
characterized by a relatively large number of civilian victims and a relatively large number of
minors affected compared to an average military conflict: 47% of all Palestinians casualties
and 68% of all Israeli casualties were civilians; 21% of Palestinian casualties and 11% Israeli
casualties were children. Second, the conflict attracts a lot of attention by international
media. On average, 39 minutes were devoted to Israeli-Palestinian fighting in an average
month over our observation period by the evening news on NBC, ABC, and CBS.
3. DATA SOURCES AND MAIN VARIABLES
Our empirical analysis uses data on: i) the timing and characteristics of the attacks by both
sides in the conflict, ii) the U.S. TV prime-time news, including the information on the length
and keywords of each story appearing daily and the detailed content analysis of news stories
about the conflict, and iii) daily volume of Google searches about the conflict.
3.1. DATA ON TV EVENING NEWS IN THE U.S.
3.1.1. NEWS PRESSURE
Daily data on TV prime-time news broadcast by the top four U.S.networks, NBC, ABC,
CBS, and CNN, are available from the Vanderbilt Television News Archive for the period
5 The Second Intifada ended with an agreement signed by Mahmoud Abbas and Ariel Sharon at the Sharmel-Sheikh Summit.
9
of 2000-2011.6 For each day and each network, the following information is available for
every story featured in the evening edition: the order of appearance, the length in seconds,
and the keywords, summarizing the topic. We use this information to construct a measure
of the presence of other important newsworthy events that are not related to any Israeli or
Palestinian actions and may crowd out the coverage of the Israeli-Palestinian conflict on
prime-time news. Following Eisensee and Stromberg (2007), we define a variable, called
“news pressure,” to be equal to the time devoted to the top three news stories that are in
unrelated to Israel and Palestine. First, for each day and each network, we identify news
stories that focus on Israel or Palestine or both, i.e., news stories with summaries that contain
any mention of Israel or Palestine. In contrast to CNN, which features news around the
clock, NBC, ABC and CBS, have a well-defined 30-minute time-slot allocated to evening
news. As Eisensee and Stromberg (2007) argued, the fact that this time-slot is limited to
30 minutes allows to measure the importance of newsworthy events featured on the news:
more important stories both take longer and appear before less important stories.7 Thus,
we compute news pressure for each of the three networks with evening edition limited to
30 minutes. On each of these networks, news pressure is set to be equal to the time (in 10
minutes) allocated to top three stories on the days, when Israel and Palestine are not covered
by the news. On the days, when Israel or Palestine are covered, the time devoted to all
other (unrelated-to-conflict) news gets automatically reduced by the time allocated to the
conflict-related stories. Thus, on the days, when Israeli-Palestinian conflict is discussed, the
news pressure equals to the length of top three non-conflict-related stories, divided by the
time allocated to all non-conflict related stories and multiplied by the total length of news
broadcast in order to have comparable units across the days, when the Israel or Palestine are
and are not featured by the news.8 The examples in Table A.1 in the online appendix illustrate
how the news pressure measure is constructed when Israel-or-Palestine-related content is
6 Data on FOX News are available for a much shorter period of time.7 The main reason for this is the competition between networks for audience: if the evening news covered
less important news first, they would have lost audience to a competitor network that cover more importantnews at the same time.
8 Even though the evening news are limited to 30 minutes, the actual length of time devoted to the news variessomewhat from one day to the next, as weather forecast takes the rest of the time. Our results are completelyunaffected by whether we adjust the length of the top-thee news stories by the actual length of the news thatday minus of the time devoted to Israel/Palestine story or by the median length of time devoted to news onthe particular network, again, minus the time devoted to Israel/Palestine.
10
present and absent from the newscast. Finally, to get daily time series of the news pressure
variable, we take the median of the network-specific news pressures on each given day and
use 10 minutes as a unit of measurement. As presented in Table A.2 in the online appendix,
the news pressure ranges from 2.3 minutes to 29.3 minutes. We plot the the distribution
of the daily news pressure in Figure A.2 in the online appendix. As can be seen from the
figure, the distribution is substantially skewed to the right. The distance between the median
(8.3 minutes) and the 90th percentile (12.3 minutes) is almost twice as large as between the
median and the 10th percentile of the distribution (6.1 minutes).
In addition, to the news pressure variable, we use these data to compute various mea-
sures of daily news coverage of the conflict events. We identify all stories that are devoted to
Israeli-Palestinian conflict and construct the following variables: i) a dummy for any conflict-
related story appearing in the news, ii) the average number of conflict-related stories featured
in the news, and iii) the average length (in seconds) of the conflict-related stories appearing
on the news. Summary statistics for all variables used in the analysis are presented in the
Table A.2 in the online appendix.
3.1.2. CONTENT ANALYSIS OF THE NEWS ON CONFLICT
In order to test for the mechanism behind the relationship between news pressure and the
timing of the attacks, we collect data on the content of news on the conflict. The Vanderbilt
Television News Archive contains the actual videos of evening newscasts of two networks:
CNN and NBC. We identified all news stories on the Israeli-Palestinian conflict for our ob-
servation period, i.e., from September 29, 2000 to November 24, 2011. To be precise, 582
stories during this time were devoted to the conflict. We asked independent (human) ana-
lysts to code the content of these stories. In particular, the analysts filled the questionnaire
consisting of 23 questions about the content of these videos. The exact list of the questions
and summary statistics for the answers are provided in the Table A.3 in the online appendix.
The aim of the questionnaire was to evaluated conflict-related newscasts along several di-
mensions. In particular, whether the story describes a particular attack, and if so, whether
the video reported information about the attack (location, weapon used, number of victims),
included footage and personal information of the victims, included images of the victims’
11
burials and scenes of mourning, included interviews with the victims’ relatives or friends,
and whether the story gave official reactions by Israeli or Palestinian authorities. Out of 582
video extracts, 499 are related to attacks that occurred on the same or on the previous day, the
data on these attacks allow us to analyze the differences in content between news coverage
of the attacks on the same and on the next day.
3.2. DATA ON ATTACKS
The data on the attacks come from two sources: the Israeli Information Center for Hu-
man Rights, B’Tselem (http://www.btselem.org/) and the United Nations Office for Coor-
dination of Humanitarian Affairs in the Occupied Palestinian Territory, UNOCHA (http:
//www.ochaopt.org/).
B’Tselem data set covers the period between September 29, 2000 and November
24, 2011. It contains information on every attack by Israeli defense forces or Palestinian
militants that resulted in fatalities. For each attack the data include information on the day
of the attack, the perpetrator, the number of fatal victims, as well as the name, gender, age,
and the town of residence for each victim. Additional information regarding the location of
the attack, the type of weapon used in the attack, and whether the victim participated in the
hostilities is available only for a subset of observations.
UNOCHA data set covers the period between January 3, 2005 and November 24,
2011. It contains more comprehensive information on all attacks by each side, including
those that resulted in injuries rather than deaths. It includes comprehensive information on
the location of each attack and the type of the weapon used.
We aggregate the data from each of these two sources by date and perpetrator. Hence,
we construct daily time series for the following variables: the occurrence of the attacks
by each side of the conflict, the number of fatal and non-fatal casualties as a result of the
attacks by each side, the occurrence of the attacks involving the use of heavy vs. non-heavy
weapons, and the location of the attacks in areas with population density above and below
the sample median. The information of occurrence and severity of the deadly attacks is
available for the entire period (between 2000 and 2011). Other variables are defined for
the shorter period (between 2005 and 2011). In order to differentiate attacks by the type
12
of weapon used, we define the following weapons as heavy weapons: all types of missiles
(air plane missile, helicopter missile, surface-to-surface rocket), sound bombs, explosives,
tank shells, shock grenades, and the following weapons as non-heavy: live ammunition,
physical assaults, rubber-coated metal bullets, tear gas, etc. (The summary statistics for
these variables are presented in the Table A.2 in the online appendix.)
3.3. DATA ON GOOGLE SEARCHES
To construct a measure of the U.S. public’s interest in the Israeli-Palestinian conflict, we col-
lect data on the volume of conflict-related searches on Google search engine. Google Trends
provide high-frequency data on the volume of Google searches for specific queries from 2004
to present. We focus, in particular, on all searches that fall into a search topic: “The Israeli-
Palestinian Conflict,” as defined by Google. When measuring the volume of searches for any
particular search topic, Google algorithms count many different search queries (i.e., search
terms) that may relate to the same search topic. Google Trends does provides a measure of
the daily volume of searches for each search topic normalized by the highest search volume
recorded over a three-month interval of interest. There are no data available on the absolute
number of searches. Hence, comparing search volumes for the same topic in different peri-
ods requires rescaling of the data using a common scale defined over the global time frame.
We used a single query for the search volume at weekly frequency for the entire 7-year period
to bring the thirty-two separate daily queries to the same scale. As a result, we were able to
construct a daily measure of the search volume for the search topic “Israeli-Palestinian Con-
flict” for the period between January 2004 and November 2011. (The summary statistics for
the volume of Google searches are also presented in the Table A.2 in the online appendix.)
4. ARE ATTACKS TIMED TO NEWS PRESSURE?
4.1. NEWS ON THE CONFLICT ON THE U.S. TV
The first step in our analysis, before we come to the main hypothesis testing, is to test
the main premises that lay the foundation for the formulation of our main hypothesis. In
particular, we verify whether U.S. TV news cover the Israeli-Palestinian conflict, whether
13
the unrelated-to-Israel-or-Palestine news pressure affects the coverage of the conflict, and
whether conflict-related news on TV matter for drawing public attention to the conflict.
The results presented in the first three columns of Table 1 confirm that the important
events in the Israeli-Palestinian conflict do get covered by the U.S. prime-time TV news. We
estimate time-series regression specifications, in which we relate the dummy for any news
of the conflict, the number of news on the conflict, and the number of seconds devoted to
the conflict daily on the evening news to whether an Israeli or Palestinian deadly attack took
place the same day or the day before, controlling for yeah fixed effects, calendar month fixed
effects, and day of the week fixed effects. We find that an average Israeli attack with fatalities
has a 9 percent chance and an average Palestinian attack with fatalities has an 8 percent
chance to appear on any U.S. TV news network. The number of stories appearing on the three
networks following an average Israeli and Palestinian attack are 0.18 and 0.27, respectively.
The average time allocated to the conflict on the evening news in the U.S. increases by 27
seconds following an Israeli attack and by 50.5 seconds following a Palestinian attack.9
The columns 4 to 6 of Table 1 show that, conditional on the severity of the conflict
events, news pressure has a negative and significant effect on the likelihood of these events
being covered on U.S. TV news. We restrict the sample to the days of the attacks and the days
immediately following the attacks and regress our measures of the coverage of the conflict
by U.S. TV news (namely, the dummy for any news on the conflict, the number of news on
the conflict, and the length of news on the conflict) on the news pressure, controlling for the
log numbers of victims, as well as year, calendar month, and day of the week fixed effects.
An increase in the news pressure by 4 minutes (equivalent to a shift in the distribution of
news pressure from the 75th to the 95th percentile or to a shift from the median to the 90th
percentile) leads to a decrease in the probability of any news on conflict of 4.4 percentage
9 Note that the Israeli attacks are more frequent and more deadly. The number of the Israeli attacks is 3.5 timeslarger than of the Palestinian attacks for our period of observation. On average, an Israeli attack causes 4fatal casualties and a Palestinian attack causes 1.6 casualties. The fact that the US news cover the Palestinianattacks more is consistent with several alternative explanations. It could be related to a pro-Israeli bias ofthe U.S. media as each attack is less likely to be covered if Israel is the perpetrator. It could also be related tothe difference in the frequency of the attacks between the two sides, as the overall time allocated to specificIsraeli attacks on prime-time news is substantially larger than that for specific Palestinian attacks: 33 vs. 17minutes per month, on average, over our observation period. Finally, as we discuss below, it could also berelated to the fact that Israel makes a special effort for inform international journalists about the Palestinianattacks and creates favorable conditions, both in terms of access and security, for the journalists to film theaftermath of the Palestinian attacks.
14
points, a decrease in the number of news stories on conflict by 0.17 and a decrease in the
time devoted to the conflict by 41 seconds.
In Table 2 we present evidence that the coverage of the conflict on the U.S. TV news
affects the attention of the public in the U.S. to the conflict events. The daily volume of
Google searches in the U.S. for the search topic “the Israeli-Palestinian Conflict” signifi-
cantly increases with the news coverage of the conflict, conditional on the severity of the
conflict-related events. If at least one network features a news story about the conflict, the
volume of Google searches increases by 8%. The volume of Google searches would increase
by 35% if all three networks feature one story about a particular attack compared to the situ-
ation, when none of the networks speak about this attack. A 5 minutes worth of stories about
the Israeli-Palestinian conflict, increase the volume of Google searchers by 24%.
4.2. TESTING OF THE MAIN HYPOTHESIS
Our main hypothesis is that Israel times its attacks to other newsworthy events that may
crowd out news coverage of the attacks in order to avoid negative publicity associated with
possible collateral damage, and in particular, civilian victims. We can use news pressure
from the U.S., as a proxy for the presence of the competing newsworthy events, because
Israel cares about public opinion in the U.S. and the U.S. news pressure, as we construct it to
be completely unrelated to any stories about Israel or Palestine, is exogenous from the point
of view of Israel. Importantly, as we discussed in the introduction, the news coverage of the
civilian casualties of Israeli attacks is bad for Israel both internationally and domestically.
This is why we can formulate an unambiguous prediction. In contrast, the effect of news
pressure on the timing of the terrorist attacks by Palestinian combatants is a priori ambigu-
ous. The reason for this is that the news coverage of the terrorist attacks in the international
and domestic press can have the opposite effects from the point of view of the Palestinian
terrorists. The coverage of the terrorist attacks in international media shifts the international
public opinion in favor Israel and, therefore, goes against the goals of the attackers. The cov-
erage of these attacks in domestic media, in contrast, may serve the purpose of the terrorists.
As news pressure, in part, depends on the presence of events that are considered newsworthy
globally, the domestic and international news pressure may be correlated. Thus, we cannot
15
formulate an unambiguous prediction about the relationship between the Palestinian attacks
and the U.S. news pressure.
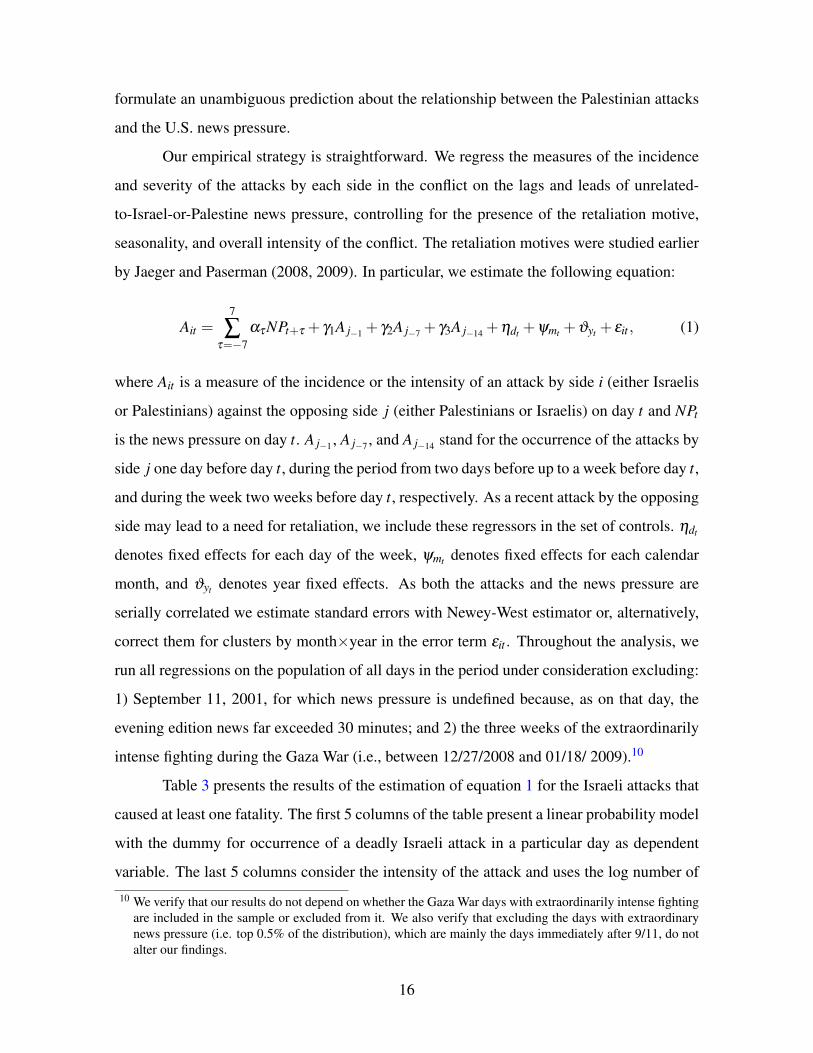
Our empirical strategy is straightforward. We regress the measures of the incidence
and severity of the attacks by each side in the conflict on the lags and leads of unrelated-
to-Israel-or-Palestine news pressure, controlling for the presence of the retaliation motive,
seasonality, and overall intensity of the conflict. The retaliation motives were studied earlier
by Jaeger and Paserman (2008, 2009). In particular, we estimate the following equation:
Ait =7
∑τ=−7
ατNPt+τ + γ1A j−1 + γ2A j−7 + γ3A j−14 +ηdt +ψmt +ϑyt + εit , (1)
where Ait is a measure of the incidence or the intensity of an attack by side i (either Israelis
or Palestinians) against the opposing side j (either Palestinians or Israelis) on day t and NPt
is the news pressure on day t. A j−1 , A j−7 , and A j−14 stand for the occurrence of the attacks by
side j one day before day t, during the period from two days before up to a week before day t,
and during the week two weeks before day t, respectively. As a recent attack by the opposing
side may lead to a need for retaliation, we include these regressors in the set of controls. ηdt
denotes fixed effects for each day of the week, ψmt denotes fixed effects for each calendar
month, and ϑyt denotes year fixed effects. As both the attacks and the news pressure are
serially correlated we estimate standard errors with Newey-West estimator or, alternatively,
correct them for clusters by month×year in the error term εit . Throughout the analysis, we
run all regressions on the population of all days in the period under consideration excluding:
1) September 11, 2001, for which news pressure is undefined because, as on that day, the
evening edition news far exceeded 30 minutes; and 2) the three weeks of the extraordinarily
intense fighting during the Gaza War (i.e., between 12/27/2008 and 01/18/ 2009).10
Table 3 presents the results of the estimation of equation 1 for the Israeli attacks that
caused at least one fatality. The first 5 columns of the table present a linear probability model
with the dummy for occurrence of a deadly Israeli attack in a particular day as dependent
variable. The last 5 columns consider the intensity of the attack and uses the log number of
10 We verify that our results do not depend on whether the Gaza War days with extraordinarily intense fightingare included in the sample or excluded from it. We also verify that excluding the days with extraordinarynews pressure (i.e. top 0.5% of the distribution), which are mainly the days immediately after 9/11, do notalter our findings.
16
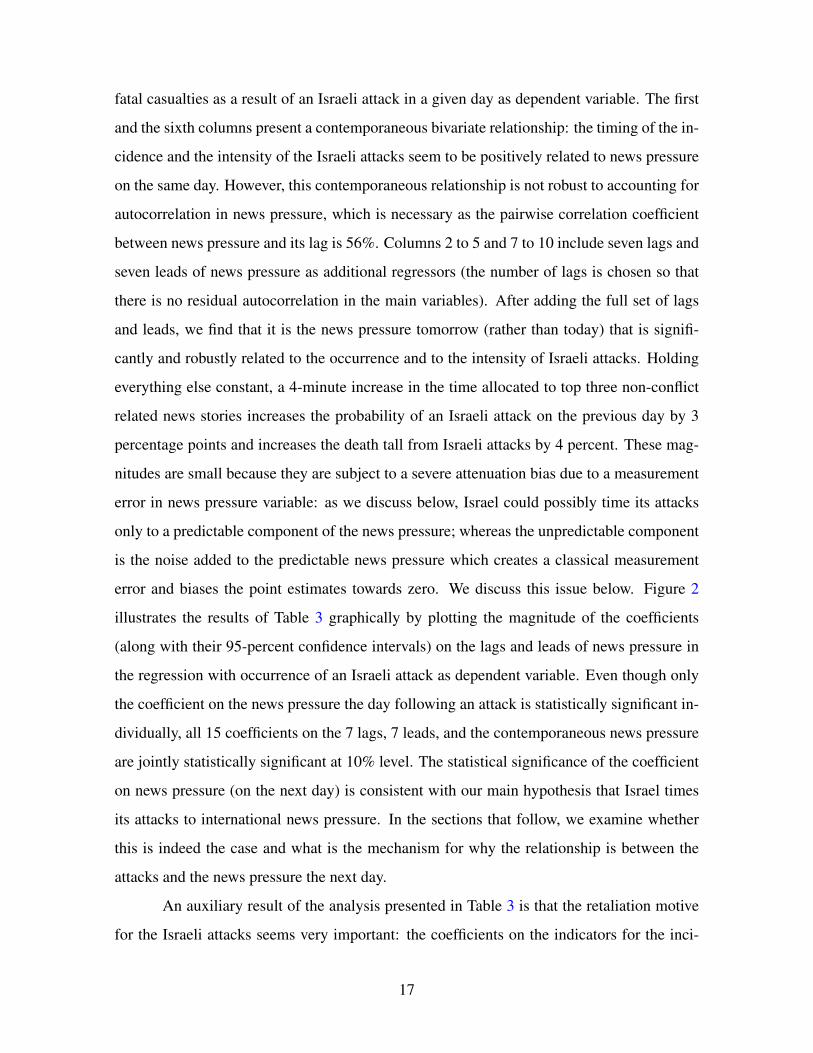
fatal casualties as a result of an Israeli attack in a given day as dependent variable. The first
and the sixth columns present a contemporaneous bivariate relationship: the timing of the in-
cidence and the intensity of the Israeli attacks seem to be positively related to news pressure
on the same day. However, this contemporaneous relationship is not robust to accounting for
autocorrelation in news pressure, which is necessary as the pairwise correlation coefficient
between news pressure and its lag is 56%. Columns 2 to 5 and 7 to 10 include seven lags and
seven leads of news pressure as additional regressors (the number of lags is chosen so that
there is no residual autocorrelation in the main variables). After adding the full set of lags
and leads, we find that it is the news pressure tomorrow (rather than today) that is signifi-
cantly and robustly related to the occurrence and to the intensity of Israeli attacks. Holding
everything else constant, a 4-minute increase in the time allocated to top three non-conflict
related news stories increases the probability of an Israeli attack on the previous day by 3
percentage points and increases the death tall from Israeli attacks by 4 percent. These mag-
nitudes are small because they are subject to a severe attenuation bias due to a measurement
error in news pressure variable: as we discuss below, Israel could possibly time its attacks
only to a predictable component of the news pressure; whereas the unpredictable component
is the noise added to the predictable news pressure which creates a classical measurement
error and biases the point estimates towards zero. We discuss this issue below. Figure 2
illustrates the results of Table 3 graphically by plotting the magnitude of the coefficients
(along with their 95-percent confidence intervals) on the lags and leads of news pressure in
the regression with occurrence of an Israeli attack as dependent variable. Even though only
the coefficient on the news pressure the day following an attack is statistically significant in-
dividually, all 15 coefficients on the 7 lags, 7 leads, and the contemporaneous news pressure
are jointly statistically significant at 10% level. The statistical significance of the coefficient
on news pressure (on the next day) is consistent with our main hypothesis that Israel times
its attacks to international news pressure. In the sections that follow, we examine whether
this is indeed the case and what is the mechanism for why the relationship is between the
attacks and the news pressure the next day.
An auxiliary result of the analysis presented in Table 3 is that the retaliation motive
for the Israeli attacks seems very important: the coefficients on the indicators for the inci-
17
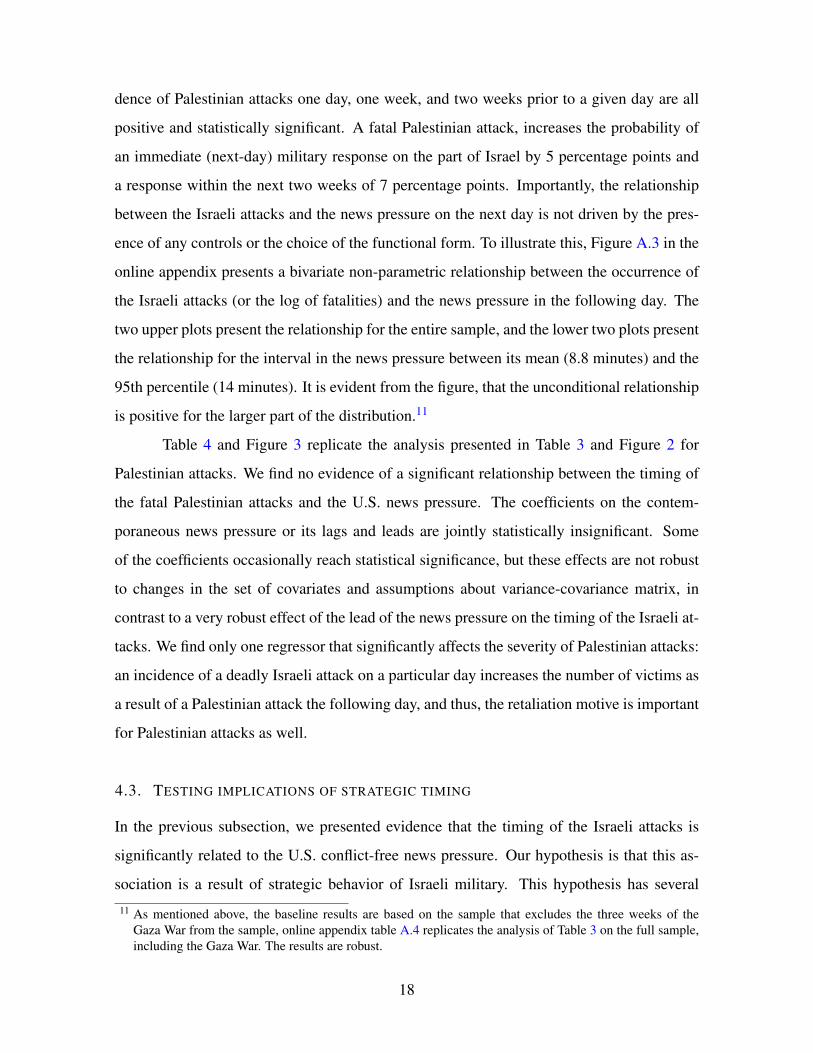
dence of Palestinian attacks one day, one week, and two weeks prior to a given day are all
positive and statistically significant. A fatal Palestinian attack, increases the probability of
an immediate (next-day) military response on the part of Israel by 5 percentage points and
a response within the next two weeks of 7 percentage points. Importantly, the relationship
between the Israeli attacks and the news pressure on the next day is not driven by the pres-
ence of any controls or the choice of the functional form. To illustrate this, Figure A.3 in the
online appendix presents a bivariate non-parametric relationship between the occurrence of
the Israeli attacks (or the log of fatalities) and the news pressure in the following day. The
two upper plots present the relationship for the entire sample, and the lower two plots present
the relationship for the interval in the news pressure between its mean (8.8 minutes) and the
95th percentile (14 minutes). It is evident from the figure, that the unconditional relationship
is positive for the larger part of the distribution.11
Table 4 and Figure 3 replicate the analysis presented in Table 3 and Figure 2 for
Palestinian attacks. We find no evidence of a significant relationship between the timing of
the fatal Palestinian attacks and the U.S. news pressure. The coefficients on the contem-
poraneous news pressure or its lags and leads are jointly statistically insignificant. Some
of the coefficients occasionally reach statistical significance, but these effects are not robust
to changes in the set of covariates and assumptions about variance-covariance matrix, in
contrast to a very robust effect of the lead of the news pressure on the timing of the Israeli at-
tacks. We find only one regressor that significantly affects the severity of Palestinian attacks:
an incidence of a deadly Israeli attack on a particular day increases the number of victims as
a result of a Palestinian attack the following day, and thus, the retaliation motive is important
for Palestinian attacks as well.
4.3. TESTING IMPLICATIONS OF STRATEGIC TIMING
In the previous subsection, we presented evidence that the timing of the Israeli attacks is
significantly related to the U.S. conflict-free news pressure. Our hypothesis is that this as-
sociation is a result of strategic behavior of Israeli military. This hypothesis has several
11 As mentioned above, the baseline results are based on the sample that excludes the three weeks of theGaza War from the sample, online appendix table A.4 replicates the analysis of Table 3 on the full sample,including the Gaza War. The results are robust.
18
implications that we test in this sub-section.
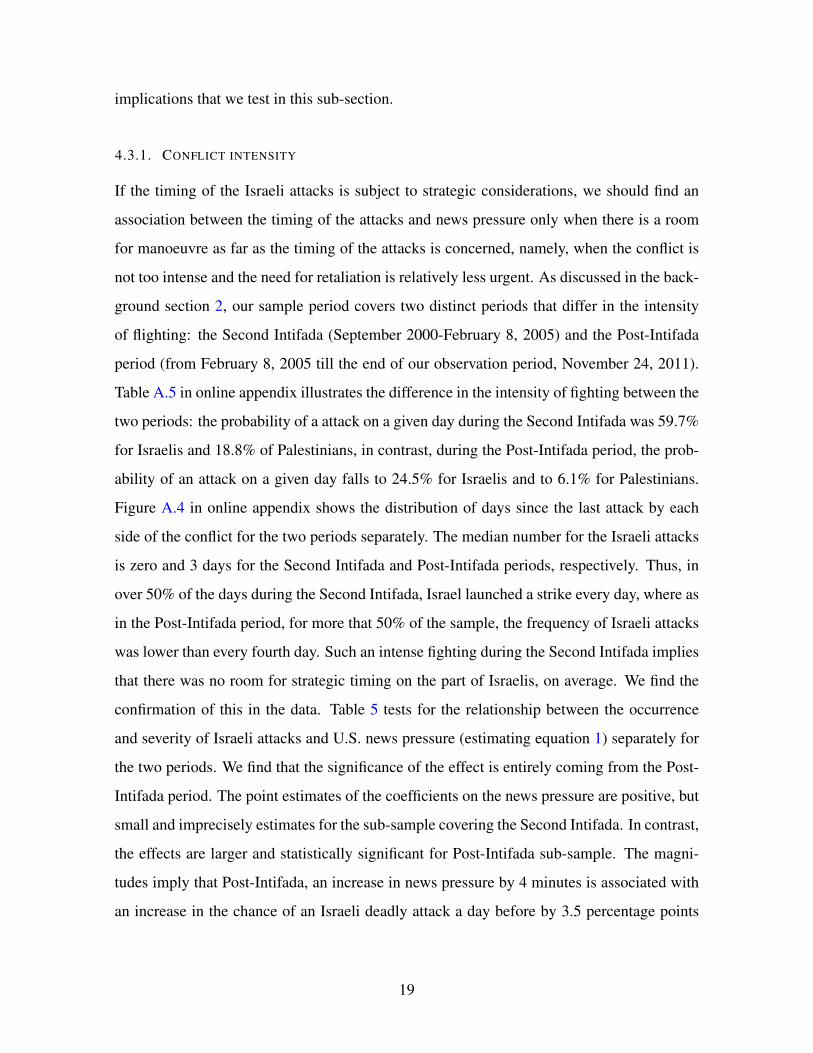
4.3.1. CONFLICT INTENSITY
If the timing of the Israeli attacks is subject to strategic considerations, we should find an
association between the timing of the attacks and news pressure only when there is a room
for manoeuvre as far as the timing of the attacks is concerned, namely, when the conflict is
not too intense and the need for retaliation is relatively less urgent. As discussed in the back-
ground section 2, our sample period covers two distinct periods that differ in the intensity
of flighting: the Second Intifada (September 2000-February 8, 2005) and the Post-Intifada
period (from February 8, 2005 till the end of our observation period, November 24, 2011).
Table A.5 in online appendix illustrates the difference in the intensity of fighting between the
two periods: the probability of a attack on a given day during the Second Intifada was 59.7%
for Israelis and 18.8% of Palestinians, in contrast, during the Post-Intifada period, the prob-
ability of an attack on a given day falls to 24.5% for Israelis and to 6.1% for Palestinians.
Figure A.4 in online appendix shows the distribution of days since the last attack by each
side of the conflict for the two periods separately. The median number for the Israeli attacks
is zero and 3 days for the Second Intifada and Post-Intifada periods, respectively. Thus, in
over 50% of the days during the Second Intifada, Israel launched a strike every day, where as
in the Post-Intifada period, for more that 50% of the sample, the frequency of Israeli attacks
was lower than every fourth day. Such an intense fighting during the Second Intifada implies
that there was no room for strategic timing on the part of Israelis, on average. We find the
confirmation of this in the data. Table 5 tests for the relationship between the occurrence
and severity of Israeli attacks and U.S. news pressure (estimating equation 1) separately for
the two periods. We find that the significance of the effect is entirely coming from the Post-
Intifada period. The point estimates of the coefficients on the news pressure are positive, but
small and imprecisely estimates for the sub-sample covering the Second Intifada. In contrast,
the effects are larger and statistically significant for Post-Intifada sub-sample. The magni-
tudes imply that Post-Intifada, an increase in news pressure by 4 minutes is associated with
an increase in the chance of an Israeli deadly attack a day before by 3.5 percentage points
19
and an increase in death toll as a result of the Israeli attacks by 4.4 percent.12
4.3.2. A RISK OF CIVILIAN CASUALTIES
As the main source of negative publicity for Israel is the presence of civilian casualties as
a result of Israeli attacks, strategic timing should only apply to attacks that bear a risk of
civilian casualties. The time-series data on whether the victims of the attacks were civilians
or not are unavailable. However, the UNOCHA dataset covers all attacks, including those
that did not result in fatalities, and it contains detailed information on the location of the
attack and the weapon used. Using these data, we construct three alternative proxies for the
likelihood that civilians are affected by a particular attack: 1) whether a particular attack
resulted in fatal casualties; 2) whether heavy weapons (such as artillery, missiles, rockets,
sound bombs, explosives, tank shells, or shock grenades) or non-heavy weapons (such as
live ammunition, rubber-coated metal bullets, or tear gas) were used for the attack; and 3)
whether the target of the attack is located in the Palestine’s governorates with the above-
median or below-median population density. Presumably, attacks that result in deaths, are
executed with heavy weapons, and target densely-populated areas are more likely to affect
civilians. In Table 6, we present the results (the upper panel of the table considers occurrence
of Israeli attacks as dependent variable and the lower panel - the severity of the attacks, mea-
sured in log number of casualties). In column 1, we present the results of the estimation of
the equation 1 for all Israeli attacks, including those that resulted only in injuries. We find no
statistically significant association between news pressure the next day and the occurrence or
severity of all attacks (the point estimates are positive, but small and imprecisely estimated),
in contrast to the significant and strong association between news pressure and the timing
and the severity of the deadly attacks, which we presented earlier using B’Tselem data, and
replicate in column 2 using UNOCHA data and sample. In column 4, we restrict the sample
to only densely-populated areas and in column 5 to non-densely populated areas. We find
that the news pressure significantly affects the timing and severity of the Israeli attacks in
densely populated areas only. In column 6, we use the dummy for whether Israel executed
12 Table A.6 in the online appendix reports the results for the full sample, including Gaza War. As above theresults are robust.
20
an attack using heavy weapons on a particular day as dependent variable; again, we find that
the news pressure the day after the attack is a strong and significant predictor of the attacks
executed with heavy weapons and their severity. The results show, again, as expected, that
the coefficient on new pressure is larger in magnitude than for any attack suggesting that
more serious attacks are more likely to be times to other newsworthy events. Thus, con-
sistent with our hypothesis, all the restrictions that we make on the attacks that increase ex
ante probability that these attacks affect civilians increase the magnitude and the precision
of the estimates of the effect of news pressure on the attacks. Finally, as an illustration, in
columns 3 and 7, we restrict the sample to days with no deadly attacks and days with no
attacks with heavy weapons, respectively, and relate the remaining attacks and their severity,
i.e., non-deadly attacks and attacks without use of heavy weapons weapons, to news pres-
sure. We find no statistically significant relationship, as expected. The results of these four
regressions, however, should be interpreted with caution as the sample selection in these re-
gressions is done of the basis of dependent variable (as the most severe attacks are dropped
from the sample).13 Overall, we find a confirmation to our hypothesis that Israel times to
news pressure only those attacks that are likely to result in civilian casualties.
4.3.3. PREDICTABILITY OF THE NEWSWORTHY EVENTS
Not all newsworthy events can be predicted. Many important news stories focus on unex-
pected events, such as the onset of human-made or natural disasters, with examples ranging
from the Columbine High School shooting to Hurricane Katrina or the Gulf of Mexico oil
spill. Much of the newscast, however, is devoted to perfectly predictable and well-timed
events, such as elections, important speeches by the U.S. leaders, e.g., the State of the Union
Addresses, key sports events, e.g., Olympics, FIFA World Cups and Super Bowls, or Black
Fridays’ shopping. If the association between the timing of the Israeli attacks and U.S.
news pressure is explained by the strategic behavior of Israeli military, it can only be driven
by the predictable component of news pressure. To test whether this is indeed the case,
we analyzed the keywords for the content of the top three news stories on the days when
13 At the bottom of Table 6, we present for each considered type of the attacks, its corresponding probabilityto result in fatal casualties.
21
news pressure is extraordinarily high; to be precise, we consider days with news pressure
between the 98th and 99.5th percentile of its distribution. Figure 4 presents the frequency
distribution of the most frequent keywords of the top three news stories separately for the
days with and without a deadly Israeli attack on the previous day, i.e., the compliers and
non-compliers of the relationship between news pressure and the Israeli attacks. The top 6
keywords among the compliers are: Iraq and War (referring to the then-on-going Iraq war),
Campaign, Gore, Bush, Florida, Recount (referring to the important political events in the
U.S.); these are perfectly predictable events. The top 6 keywords among the non-compliers
are: Hurricane, Earthquake, Coast, Katrina, Japan and Tsunami; all of these keywords refer
to different natural disasters, with completely unpredictable onset. We also grouped all key-
words for news stories during the extraordinarily high news pressure days into the following
six categories: human-made and natural disasters, U.S. political events, Iraq war, holiday
shopping, economic news, and other. Figure 5 presents the distribution of keywords among
these categories for compliers and non-compliers. As expected, keywords in the category
that is perfectly predictable, namely, holiday shopping, are only present among compliers;
keywords in the category U.S. politics, which likely refer to predictable events, are more
frequent among compliers than among non-compliers; in contrast, keywords in the disas-
ters category, which refer to events that are likely to be unpredictable (especially, in their
very beginning), are more frequent among non-compliers. This evidence suggests that Israel
times its attacks to predictable newsworthy events, consistent with the hypothesis about its
strategic behavior.
5. MECHANISM: COVERAGE OF CONFLICT ON THE SAME VS. NEXT DAY
In this section, we turn to the exploration of the mechanism behind the effect. The main
question here is why Israel times its attacks to the level of news pressure on the next day,
rather than on the same day. The most obvious potential explanation would be that news
may be slow in making and it may take time for the journalists to prepare a story. If the
news about important events in the Israeli-Palestinian conflict appeared in the media only
one day after their actual occurrence, it would not be surprising that Israel timed its attacks
to the news pressure in the following day. We test and reject this hypothesis in columns
22
1-4 of Table 7. Column 1 restricts the sample to all the days such that there was no deadly
Israeli attack the day before and there was no deadly Palestinian attack either the day before
or on the same day, and estimates the effect of having a deadly Israeli attack on the number
of stories about Israeli-Palestinian conflict that appear the same day on prime-time news
of the three U.S. TV networks, controlling for contemporaneous news pressure, day of the
week, calendar month and year fixed effects. Column 2 presents a similar regression, which
restricts attention to the days such that there was no deadly Israeli attack on the same day and
there was no Palestinian attack either on the same day or on the day before, and estimates
the effect of having a deadly Israeli attack on the number of stories about Israeli-Palestinian
conflict that appear the next day on the three U.S. TV networks (all controls are in column
1). The comparison of the estimated coefficients yields that the news about an Israeli attack
does get covered by the U.S. TV news both on the same and on the next day, but the number
of stories about the conflict that appear on the same day is twice as large as the number of
stories on the next day. Columns 3 and 4 report results of the regressions on the full sample,
in which the dummy for news on the conflict and the number of conflict-related news are
regressed on indicators of Israeli and Palestinian attacks separately at time t and at time t−1
(conditional on the same covariates). Again, holding everything else constant, we find that
an Israeli attack is about twice as likely to be covered on U.S. TV news is large on the day of
the attack than on the next day (more precisely, 10.5 vs. 4 percent) and the number of stories
that cover the conflict is about twice a large on the day of the attack than on the next day
(precisely, 0.23 vs. 0.13 stories).
Evidently, the reason for why Israel times its attacks to news pressure on the next day
is unrelated to whether the attacks are covered on the same and on the next day, because the
coverage of a given attack is more likely to happen on same day. Therefore, the explanation
must be related to how the attacks are covered on the same and on the next day. If the content
of coverage on the next day is less favorable for the public image of Israel, this can explain
the association between the timing of the attacks and next-day news pressure. To test this
mechanism, we first compare the length of news stories that appear on the same and on the
next day. Column 5 of Table 7 shows that, on average, the length of the coverage on the
same day and on the next day differ very little, despite a much lower probability of a story
23
about the attack appearing on the next day. Columns 6 and 7 of Table 7 show why this is the
case, by estimating the length of the coverage on the same and on the next day, conditional
on the story being covered. In column 6, we restrict the sample to days with news on the
conflict. The length of the story on the conflict if it appears on the next day arrears to be
twice as long compared to when it appears on the same day. In column 7, we use the whole
sample, but look at the effect of the interaction between the attacks and the incident of them
being covered in the news. Again, we find that the next-day stories are longer, however, the
difference is not that stark, as found in column 6.
In order to understand the differences in the actual content of the news stories about
the conflict that appear on the same and on the next day, we analyze the coding of the content
of all news stories devoted to the Israeli-Palestinian conflict on two networks, NBC and
CNN, for the period under study: September 2000 - November 2011. The questionnaires,
filled by independent analysts, for each of these 582 videos contained questions about the
content of the stories. In particular, whether the stories provided factual information about
the number of victims, weapons, location, etc., whether they contained videos or photos of
the victims, or videos of the scenes of burial and mourning, interviews with relatives and
friends of the victims, and whether the official reaction of Israeli or Palestinian authorities
was presented. Table A.3 in the online appendix lists all the questions in the questionnaire
and the mean values for the answers. Out of 582 newscasts devoted to the conflict, 326
covered Israeli attacks against Palestinians and 210 of those did not mention any Palestinian
attacks in the same story. Only 2 of these 326 stories on Israeli attacks were aired not on
the day of the attack or on the following day and 46 were aired on the day following the
attack. 156 videos were devoted fully to Palestinian attacks against Israelis and 116 spoke
about the attacks on both sides. Overall, 499 videos were devoted to the attacks on either
side that occurred on the same or on the previous day. 98 conflict-related videos were not
focusing on fighting on either side and instead covered other issues, such as, for instance,
peace negotiations. In Table 8, we report the main results of the comparison of the content
of stories that appeared on the same and on the next day. Table A.7 in the online appendix
presents results of exactly the same specifications estimated for all the remaining variables
measuring the content from the questionnaire. In the Panel A of both tables, we confine
24
the analysis to the most restrictive sample of videos that were devoted to a particular Israeli
attack, did not mention any Palestinian attacks, and took place either on the same day or
the day before the news story was aired. There are 201 videos like that; out of which 36
were aired on the day following the attack. We present regression results, in which the
answers to the questions in the questionnaire are regressed on the dummy for whether the
story appeared one day after the attack conditional on network fixed effects. In panel B of
both tables, in contrast, we use the entire population of videos and regress the answers to
each question about the content on the dummy for weather the video was aired on the next
day, controlling for the following list of covariates: a dummy indicating videos that aired
neither on the same, nor on the next day (leaving the same-day videos as the comparison
group), the interaction between the dummy for weather the video was aired on the next day
with the dummy for whether it covered a Palestinian attack, and a dummy indicating whether
the story was devoted to a particular attack (rather than, for instance, a series of attacks), and
network fixed effects. In both panels, we adjust standard errors to clusters in error terms at
the level of each month×year.
The results of both specifications draw a consistent picture. The only difference in
the factual informational content between the same-day and the next-day coverage of the
Israeli attacks against Palestinians, that we find, is in the information provided on the exact
location of the attack, which is 40 percentage points more likely to appear on the next-day
news. On average, the exact location of the Israeli attack is reported in 36% of the same-day
newscasts as compared to 76% of the next-day newscasts). Other dry facts about the attack,
such as the number of victims, including the number of civilian victims or the weapon used
are as likely to be reported by the same-day as in the next-day news story. In contrast,
personal information about the civilian victims, such as their names and family stories, is
significantly more likely to appear on the next-day newscast (the difference is large: 10%
of same-day stories report any personal information on civilian victims vs. 30.5% of the
next-day stories). The footage of burials and mourning is also significantly more likely to
appear on the next-day newscast than on the same-day newscast. In particular, the average
rate of appearance of such highly-emotional scenes on there same day is 11%; and on the
next day, it is 29%. Interviews with family members, friends of the victims and witnesses
25
of the incident are also more likely to appear on the next day newscast (in particular, 8%
of the same-day stories and 14% of the next-day stories feature such interviews).14 Finally,
we find that the next-day videos are significantly less likely to report the reaction of Israeli
authorities about the incident (54% of the same-day videos vs. 34% of the next-day videos).
We report the magnitudes based on the most restrictive sample of videos that are devoted to
a particular Israeli attack, which takes place either on the same day as the newscast or on
the previous day and does not mention any Palestinian attack. From the estimation based on
the full sample, in addition, we can conclude that 1) same-day stories about the Palestinian
attacks are significantly more likely to contain the basic information about the attack, the
personal information about the victims, interviews with witnesses, footage of victims and
the reaction of Israeli authorities than the same-day stories about the Israeli attacks, as can
be seen from the estimated coefficient on the dummy for the story about Palestinian attack;
2) there is little difference between the content of same-day and next-day videos devoted to
Palestinian attacks, as can be seen from the estimated coefficients on the interaction between
the next-day coverage and dummy for story about Palestinian attacks (with the exception of
the information on the exact location which is more likely to appear on the same-day news
story); and 3) stories that appear not on the same or the next day are much less likely to
present any information or visuals regarding the attacks on either side, which most likely
means that the attacks are not the main focus of these stories.
This evidence on the differences in content strongly suggests the reason why Israel
is much more concerned about the next-day compared to the same-day coverage by interna-
tional media. The next-day coverage is less favorable to Israel. First, the next-day coverage
must have an unambiguously more negative effect on the international public opinion about
Israeli actions compared to the same-say coverage because it is more emotionally charged.
As is well-known in cognitive and social psychology, personal stories, as means of informa-
tion transmission, are more powerful than dry statistics, as they help the listeners, readers,
and viewers to relate to the news story; similarly, and–specific to TV news–the information
transmission is more powerful (and in our context, more negative) in the form of visuals
14 We combine 2 questions about the interviews with witnesses and interviews with friends and relatives in onevariable to maximize the variation, as only combined these questions result in sufficient number of videos,which contain interviews.
26
than in the form of words, as the story seems more real when scenes of mourning by civil-
ians are presented to the viewers. Second, because the next-day stories are focused on the
personal stories of civilian victims, Israeli official position less likely to be a part of the
newscast. Thus, we conclude that Israeli authorities time their most deadly attacks to in-
ternational news pressure in order to avoid most emotionally-involved and, therefore, most
negative towards Israel, news coverage of civilian fatalities.
Why are there significant differences in the content of international coverage between
the same and the next day for the Israeli attacks against Palestinians and no differences in
the content of the next-day vs. same-day international news coverage of the Palestinian
attacks against Israelis? The differences in the coverage of Israeli attacks are most likely
driven by a combination of technological reasons of news-reporting of an armed conflict,
i.e., what kind of information is available to journalists immediately after the attack and one
day later and the local traditions of burials specific to the Middle East. As for technology
of news production is concerned, in the immediate aftermath of the Israeli attacks, most of
the time, there are no international journalists in the vicinity, as Israelis do not share their
intentions with the journalists. Moreover, even when the journalists are located close to the
site of the attack and can quickly get to it, it is often considered dangerous for them and for
(potential) witnesses to be on the site because of the risk of repeated strikes. Thus, it is hard
for journalists to film on the day of the attack and to find any details about the personalities of
victims immediately after the attack. In contrast, the day following the attack, the conditions
for journalistic work are very different. Local traditions prescribe burial of victims one day
after death occurs. The burial ceremony takes place in open air with many people around.
This is an easy and safe opportunity for journalists to access information about the victims.
(The fact that there are many people on the street is the best insurance against a possible
Israeli attack; and relatives and friends of the victims are present). The funeral is also an easy
and safe opportunity to produce an emotionally-charged visual. As some Israelis suggest
(see, for instance, the quote from Benjamin Netanyahu, cited above), Palestinians do use
the occasion of burials of civilian victims of Israeli attacks in order to tell the international
community about them.15
15 Note that our sample period ends before the twitter revolution and therefore we cannot analyze how socialmedia, and twitter, in particular, affected the strategic timing effects that we uncover.
27
The reason why there are no content differences in coverage of the same-day and
next-day stories about the Palestinian attacks against Israel also suggest the same conclusion,
i.e., Israelis behave strategically. Israelis create conditions for international journalists to
access all the necessary information about the Palestinian attacks right after an attack occurs;
they bring the international journalists to the site of the attack, allow them to film the site,
interview witnesses, and produce visual of the damage and victims. Evidently, Israelis do
this because they also realize well the effect of this coverage on international public opinion.
6. CONCLUSIONS
We use the case of recurrent Israeli-Palestinian conflict and its coverage in the international
media to find systematic evidence of a strategic behavior of policy makers, who time their
unpopular actions to other newsworthy events that distract the public’s attention in order to
minimize negative publicity as a result of their actions. In the considered case, the policy
maker’s strategy is developed with full understanding of both cognitive psychology of the
effect of the media coverage of conflict on international public opinion and of the technology
of war reporting.
We show that Israeli military forces choose the timing of their attacks so that the cov-
erage of burials of (potential) civilian victims coincides with other newsworthy international
events. This strategy is used to minimize the negative impact of the Israeli attacks on the
assessment of Israel’s role in the conflict by international public opinion. We find that the
strategic timing is only applied when there is room for it (i.e., the conflict is not very intense)
and when there are reasons for it (i.e., when the risk of having civilians affected by an attack
is particularly high).
We find no such effect for the Palestinian terrorist attacks, which could be explained
by the expected different sign of the effect for the domestic vs. international news pressure or
by the lack of coordination among different Palestinian factions involved in violence against
Israel, such as Al-Aqsa Martyr Brigades, Hamas, or Palestinian Islamic Jihad, or by the lack
of sophistication on the part of terrorists.
28
REFERENCES
Adena, Maja, Ruben Enikolopov, Maria Petrova, Veronica Santarosa, and Ekaterina Zhu-ravskaya, “Radio and the Rise of the Nazis in Prewar Germany,” PSE Working Papers, ParisSchool of Economics September 2013.
Besley, Timothy and Andrea Prat, “Handcuffs for the Grabbing Hand? Media Capture and PoliticalAccountability,” American Economic Review, 2006, 96 (3), 720–736.
Blattman, Christopher and Edward Miguel, “Civil War,” Journal of Economic Literature, March2010, 48 (1), 3–57.
Borgida, Eugene and Richard E. Nisbett, “The Differential Impact of Abstract vs. Concrete Infor-mation on Decisions,” Journal of Applied Psychology, 1977, 7 (3), 258–271.
DellaVigna, Stefano, Ruben Enikolopov, Vera Mironova, Maria Petrova, and Ekaterina Zhu-ravskaya, “Cross-Border Media and Nationalism: Evidence from Serbian Radio in Croatia,”American Economic Journal: Applied Economics, July 2014, 6 (3), 103–32.
Eisensee, Thomas and David Stromberg, “News Droughts, News Floods, and U.S. Disaster Relief,”The Quarterly Journal of Economics, 05 2007, 122 (2), 693–728.
Houghton, Harvey A. and Dale M. Willows, eds, The psychology of illustration: Volume 1. Basicresearch. Springer-Verlag New York 1987.and , eds, The psychology of illustration: Volume 2. Instructional issues. Springer-Verlag New
York 1987.Houts, Peter S., Cecilia C. Doak, Leonard G. Doak, and Matthew J. Loscalzo, “The role of
pictures in improving health communication: A review of research on attention, comprehension,recall, and adherence,” Patient Education and Counseling, 2006, (61), 173–190.
Jackson, Matthew O. and Massimo Morelli, “The Reasons for Wars Ð an Updated Survey,” inChristopher J. Coyne and Rachel L. Mathers, eds., The Handbook on the Political Economy ofWar, Cheltenham, UK: Elgar Publishing, 2009.
Jaeger, David A. and Daniele M. Paserman, “The Shape of Things to Come? Assessing the Effec-tiveness of Suicide Attacks and Targeted Killings,” American Economic Review, 2009, 4, 315–342.and M. Daniele Paserman, “Israel, the Palestinian Factions, and the Cycle of Violence,” Ameri-
can Economic Review, May 2006, 96 (2), 45–49.and , “The Cycle of Violence? An Empirical Analysis of Fatalities in the Palestinian-Israeli
Conflict,” American Economic Review, September 2008, 98 (4), 1591–1604., Esteban F. Klor, Sami H. Miaari, and M. Daniele Paserman, “Can Militants Use Violence toWin Public Support? Evidence from the Second Intifada,” NBER Working Papers 16475, NationalBureau of Economic Research, Inc October 2010.
Mandl, Heinz and Joel R. Levin, eds, Knowledge acquisition from text and pictures. North-HollandAmsterdam 1989.
Martin, Joanne and Melanie E. Powers, “Organizational stories: More vivid and persuasive thanquantitative data,” in Barry Staw, ed., Psychological Foundations of Organizational Behavior,Glenview, IL: Scott Foresman, 1982.
Prat, Andrea and David Stromberg, “The political economy of mass media,” in Daron Acemoglu,Manuel Arellano, and Eddie Dekel, eds., Advances in Economics and Econometrics, Cambridge:Cambridge University Press, 2013.
Seethaler, Josef, Matthias Karmasin, Gabriele Melischek, and Romy Wohlert, eds, Selling War:The Role of the Mass Media in Hostile Conflicts from World War I to the “War to Terror.” IntellectLtd., University of Chicago Press Chicago 2013.
Snyder, James M. and David Stromberg, “Press Coverage and Political Accountability,” Journalof Political Economy, 04 2010, 118 (2), 355–408.
29
Sobbrio, Francesco, “The political economy of news media: theory, evidence and open issues,”in Francesco Forte, Ram Mudambi, and Pietro Maria Navarra, eds., A Handbook of AlternativeTheories of Public Economics, Chelthenam: Edward Elgar Press, 2014.
Wilkins, Alan L., “Organizational Stories as Symbols Which Control the Organization,” in Samuel B.Bacharach, ed., Monographs in Organization Behavior and Industrial Relations, Greenwich: JAIPress, Inc., 1983.
Yanagizawa-Drott, David Hans, “Propaganda and Conflict: Evidence from the Rwandan Genocide,”The Quarterly Journal of Economics, 2014, 129 (4), 1947–1994.
30
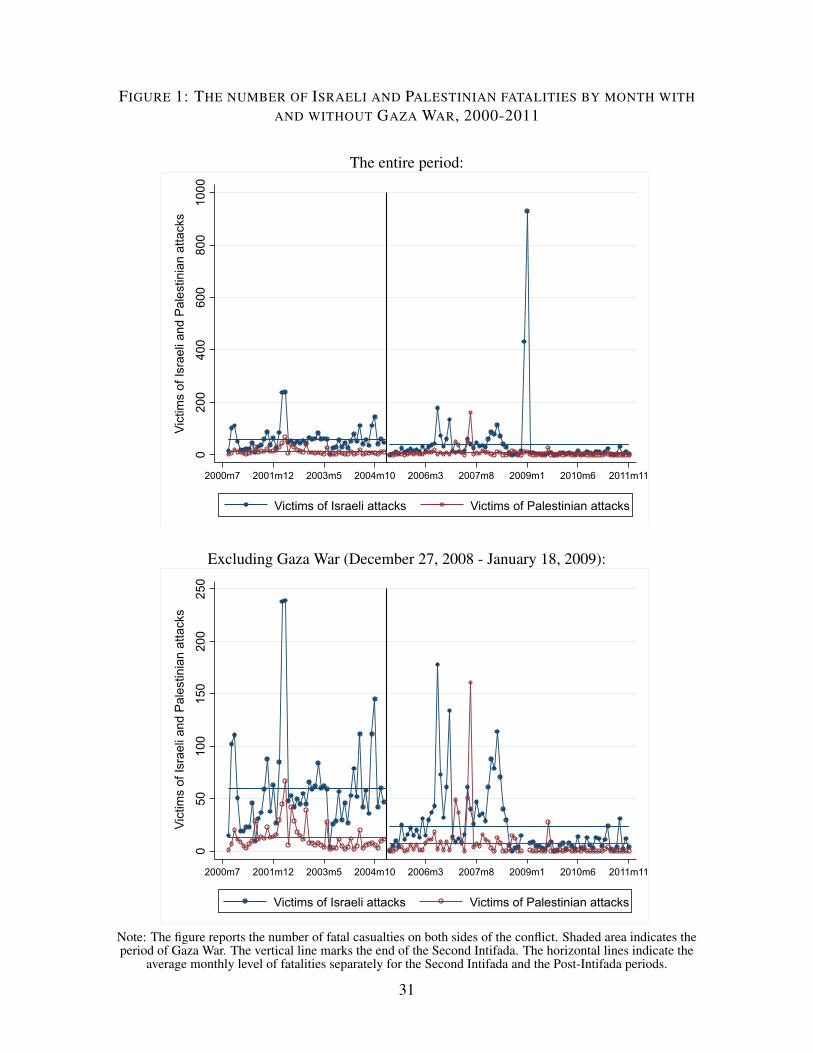
FIGURE 1: THE NUMBER OF ISRAELI AND PALESTINIAN FATALITIES BY MONTH WITH
AND WITHOUT GAZA WAR, 2000-2011
The entire period:
020
040
060
080
010
00
Vic
tims
of Is
rael
i and
Pal
estin
ian
atta
cks
2000m7 2001m12 2003m5 2004m10 2006m3 2007m8 2009m1 2010m6 2011m11
Victims of Israeli attacks Victims of Palestinian attacks
Excluding Gaza War (December 27, 2008 - January 18, 2009):
050
100
150
200
250
Vic
tims
of Is
rael
i and
Pal
estin
ian
atta
cks
2000m7 2001m12 2003m5 2004m10 2006m3 2007m8 2009m1 2010m6 2011m11
Victims of Israeli attacks Victims of Palestinian attacks
Note: The figure reports the number of fatal casualties on both sides of the conflict. Shaded area indicates theperiod of Gaza War. The vertical line marks the end of the Second Intifada. The horizontal lines indicate the
average monthly level of fatalities separately for the Second Intifada and the Post-Intifada periods.
31
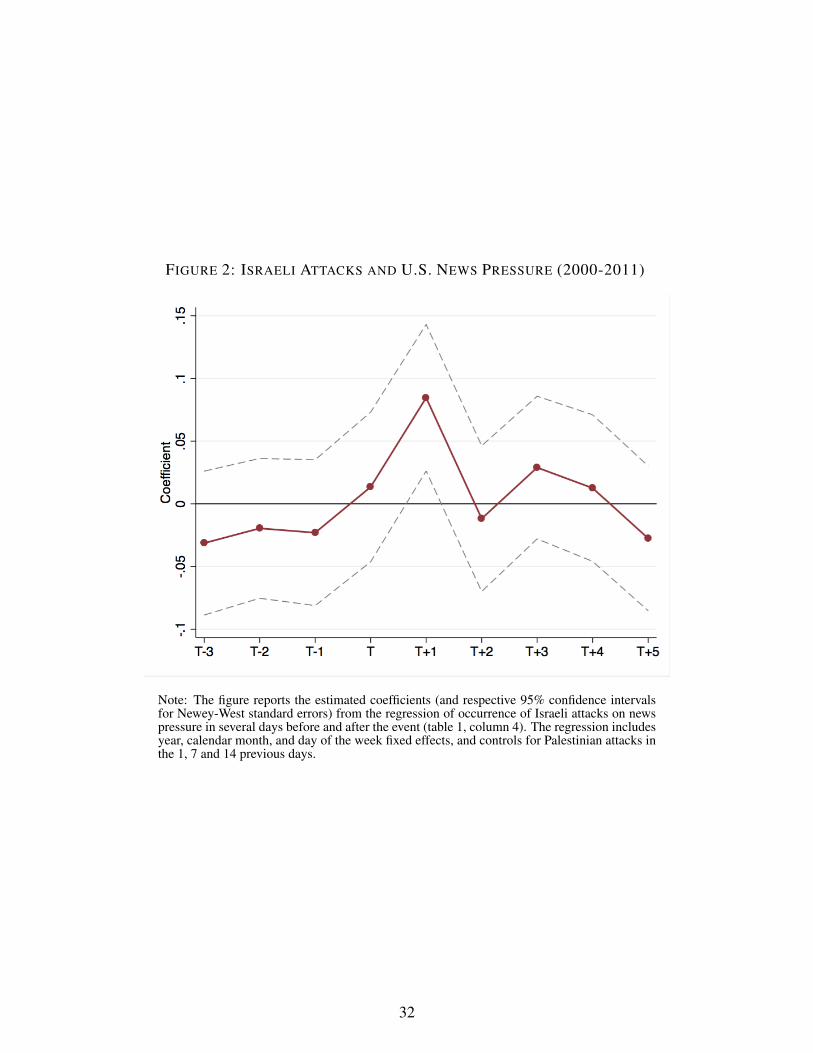
FIGURE 2: ISRAELI ATTACKS AND U.S. NEWS PRESSURE (2000-2011)
Note: The figure reports the estimated coefficients (and respective 95% confidence intervalsfor Newey-West standard errors) from the regression of occurrence of Israeli attacks on newspressure in several days before and after the event (table 1, column 4). The regression includesyear, calendar month, and day of the week fixed effects, and controls for Palestinian attacks inthe 1, 7 and 14 previous days.
32
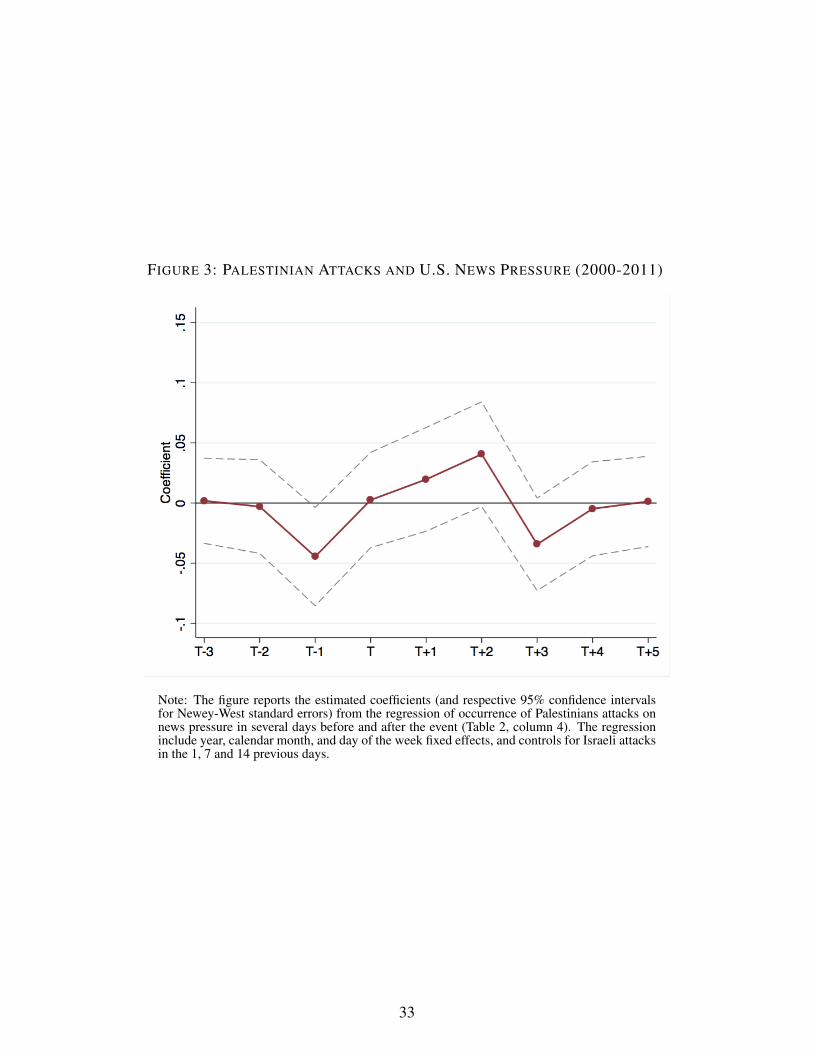
FIGURE 3: PALESTINIAN ATTACKS AND U.S. NEWS PRESSURE (2000-2011)
Note: The figure reports the estimated coefficients (and respective 95% confidence intervalsfor Newey-West standard errors) from the regression of occurrence of Palestinians attacks onnews pressure in several days before and after the event (Table 2, column 4). The regressioninclude year, calendar month, and day of the week fixed effects, and controls for Israeli attacksin the 1, 7 and 14 previous days.
33
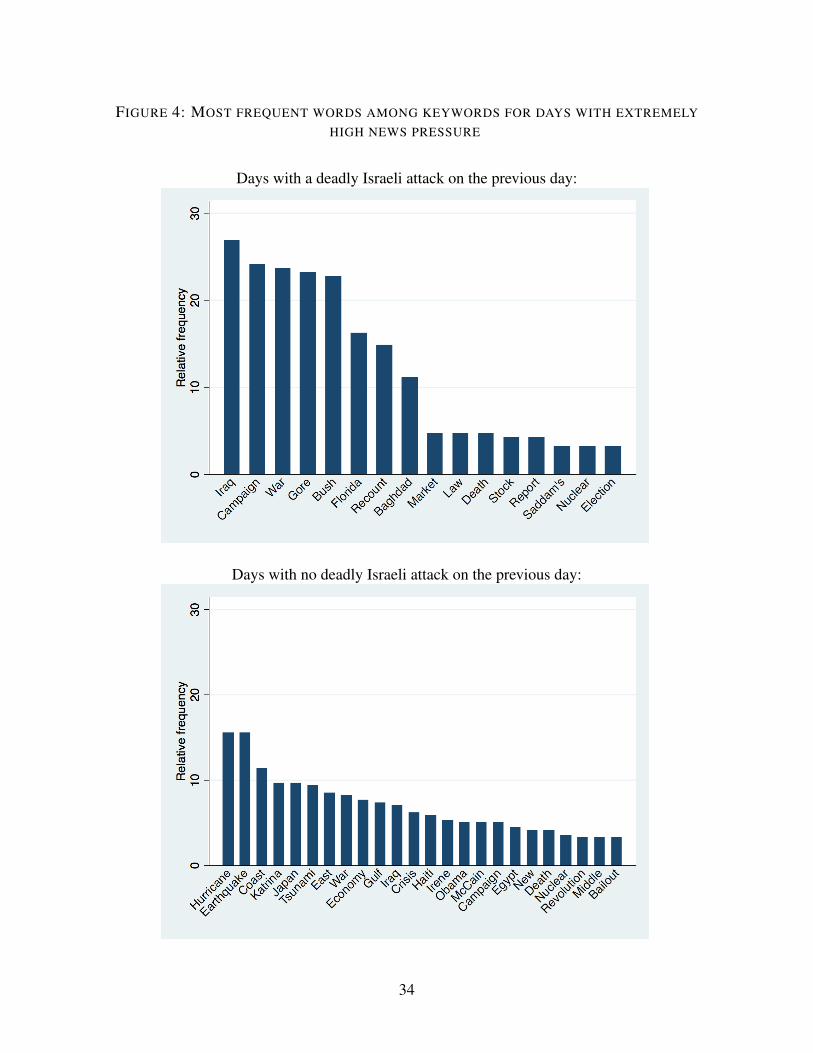
FIGURE 4: MOST FREQUENT WORDS AMONG KEYWORDS FOR DAYS WITH EXTREMELY
HIGH NEWS PRESSURE
Days with a deadly Israeli attack on the previous day:
Days with no deadly Israeli attack on the previous day:
34
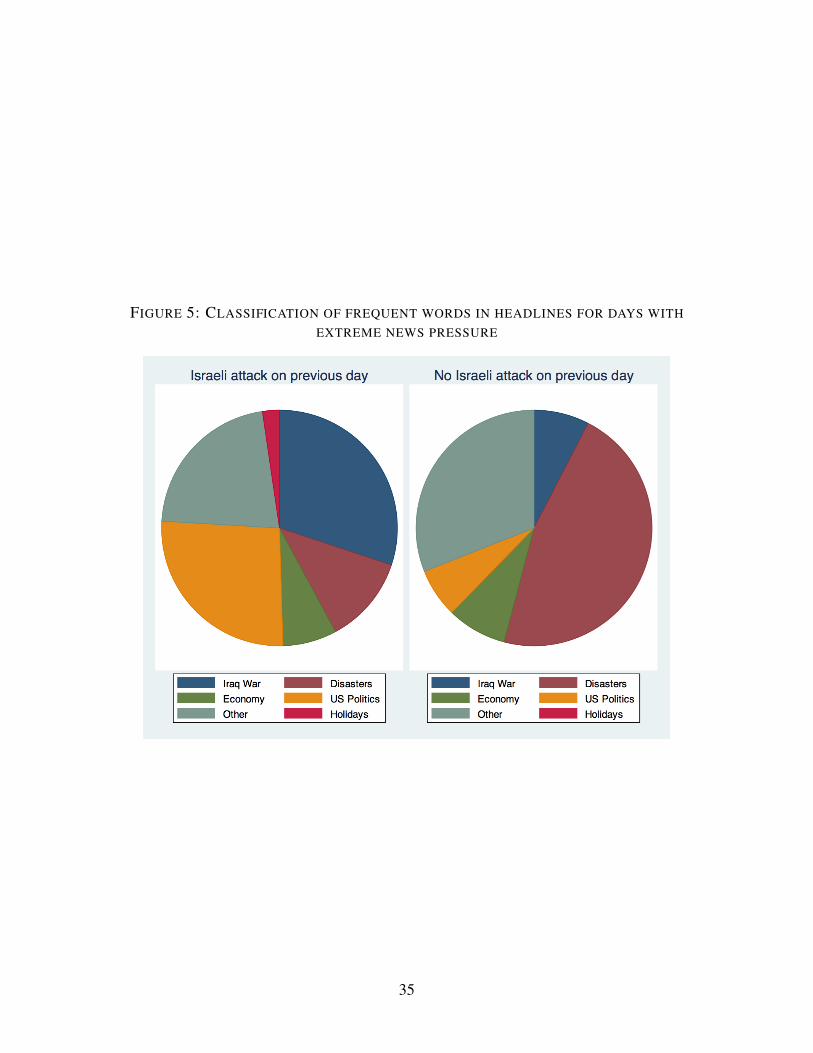
FIGURE 5: CLASSIFICATION OF FREQUENT WORDS IN HEADLINES FOR DAYS WITH
EXTREME NEWS PRESSURE
35
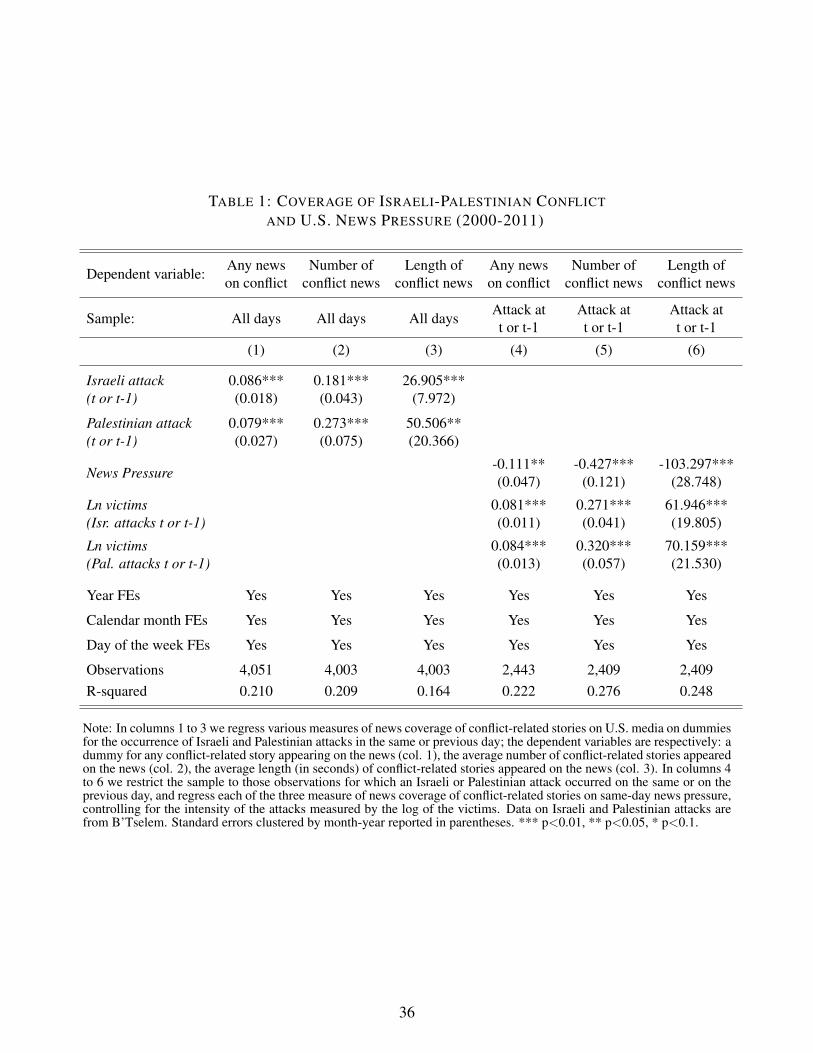
TABLE 1: COVERAGE OF ISRAELI-PALESTINIAN CONFLICT
AND U.S. NEWS PRESSURE (2000-2011)
Dependent variable:Any news Number of Length of Any news Number of Length ofon conflict conflict news conflict news on conflict conflict news conflict news
Sample: All days All days All daysAttack at Attack at Attack att or t-1 t or t-1 t or t-1
(1) (2) (3) (4) (5) (6)
Israeli attack 0.086*** 0.181*** 26.905***(t or t-1) (0.018) (0.043) (7.972)
Palestinian attack 0.079*** 0.273*** 50.506**(t or t-1) (0.027) (0.075) (20.366)
News Pressure-0.111** -0.427*** -103.297***(0.047) (0.121) (28.748)
Ln victims 0.081*** 0.271*** 61.946***(Isr. attacks t or t-1) (0.011) (0.041) (19.805)
Ln victims 0.084*** 0.320*** 70.159***(Pal. attacks t or t-1) (0.013) (0.057) (21.530)
Year FEs Yes Yes Yes Yes Yes Yes
Calendar month FEs Yes Yes Yes Yes Yes Yes
Day of the week FEs Yes Yes Yes Yes Yes Yes
Observations 4,051 4,003 4,003 2,443 2,409 2,409R-squared 0.210 0.209 0.164 0.222 0.276 0.248
Note: In columns 1 to 3 we regress various measures of news coverage of conflict-related stories on U.S. media on dummiesfor the occurrence of Israeli and Palestinian attacks in the same or previous day; the dependent variables are respectively: adummy for any conflict-related story appearing on the news (col. 1), the average number of conflict-related stories appearedon the news (col. 2), the average length (in seconds) of conflict-related stories appeared on the news (col. 3). In columns 4to 6 we restrict the sample to those observations for which an Israeli or Palestinian attack occurred on the same or on theprevious day, and regress each of the three measure of news coverage of conflict-related stories on same-day news pressure,controlling for the intensity of the attacks measured by the log of the victims. Data on Israeli and Palestinian attacks arefrom B’Tselem. Standard errors clustered by month-year reported in parentheses. *** p<0.01, ** p<0.05, * p<0.1.
36
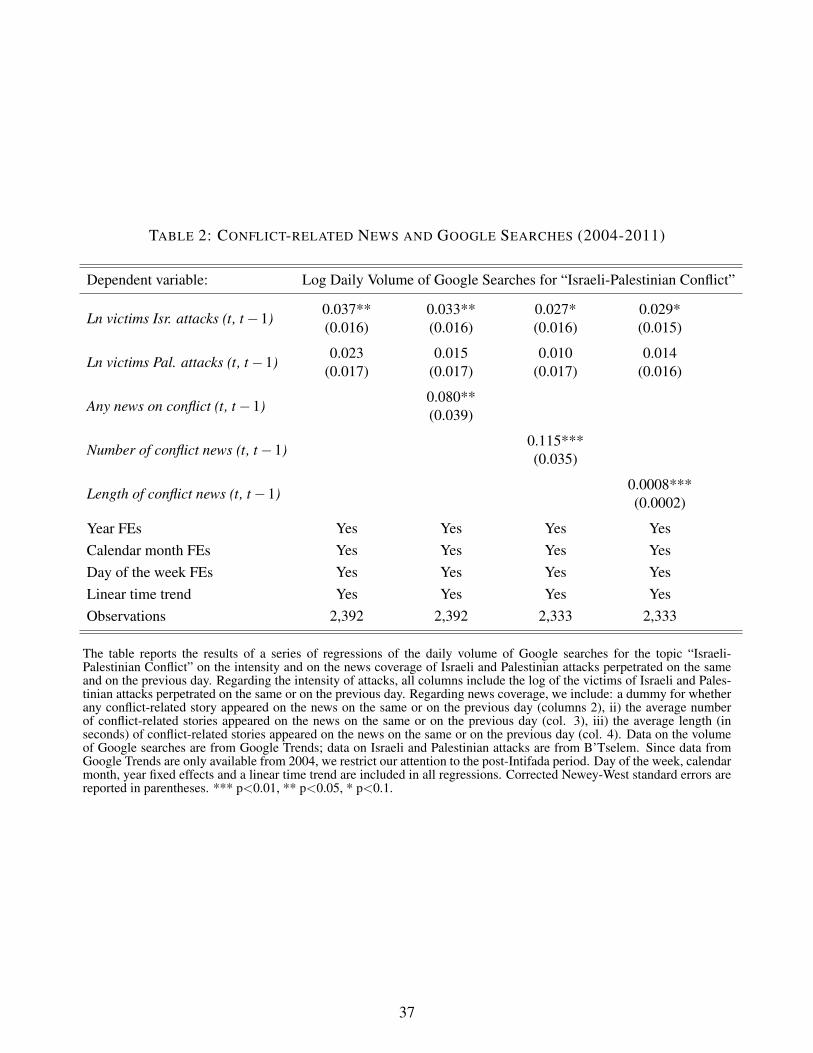
TABLE 2: CONFLICT-RELATED NEWS AND GOOGLE SEARCHES (2004-2011)
Dependent variable: Log Daily Volume of Google Searches for “Israeli-Palestinian Conflict”
Ln victims Isr. attacks (t, t−1)0.037** 0.033** 0.027* 0.029*(0.016) (0.016) (0.016) (0.015)
Ln victims Pal. attacks (t, t−1)0.023 0.015 0.010 0.014
(0.017) (0.017) (0.017) (0.016)
Any news on conflict (t, t−1)0.080**(0.039)
Number of conflict news (t, t−1)0.115***(0.035)
Length of conflict news (t, t−1)0.0008***(0.0002)
Year FEs Yes Yes Yes YesCalendar month FEs Yes Yes Yes YesDay of the week FEs Yes Yes Yes YesLinear time trend Yes Yes Yes YesObservations 2,392 2,392 2,333 2,333
The table reports the results of a series of regressions of the daily volume of Google searches for the topic “Israeli-Palestinian Conflict” on the intensity and on the news coverage of Israeli and Palestinian attacks perpetrated on the sameand on the previous day. Regarding the intensity of attacks, all columns include the log of the victims of Israeli and Pales-tinian attacks perpetrated on the same or on the previous day. Regarding news coverage, we include: a dummy for whetherany conflict-related story appeared on the news on the same or on the previous day (columns 2), ii) the average numberof conflict-related stories appeared on the news on the same or on the previous day (col. 3), iii) the average length (inseconds) of conflict-related stories appeared on the news on the same or on the previous day (col. 4). Data on the volumeof Google searches are from Google Trends; data on Israeli and Palestinian attacks are from B’Tselem. Since data fromGoogle Trends are only available from 2004, we restrict our attention to the post-Intifada period. Day of the week, calendarmonth, year fixed effects and a linear time trend are included in all regressions. Corrected Newey-West standard errors arereported in parentheses. *** p<0.01, ** p<0.05, * p<0.1.
37
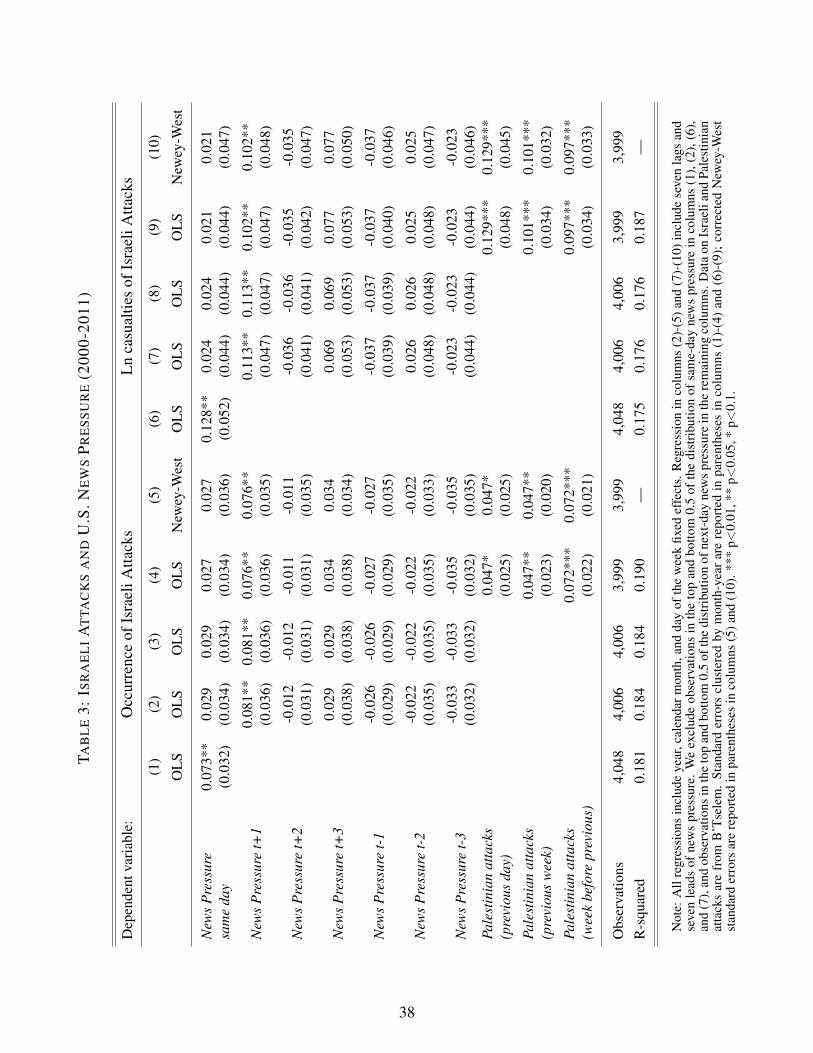
TAB
LE
3:IS
RA
EL
IA
TTA
CK
SA
ND
U.S
.NE
WS
PR
ES
SU
RE
(200
0-20
11)
Dep
ende
ntva
riab
le:
Occ
urre
nce
ofIs
rael
iAtta
cks
Ln
casu
altie
sof
Isra
eliA
ttack
s
(1)
(2)
(3)
(4)
(5)
(6)
(7)
(8)
(9)
(10)
OL
SO
LS
OL
SO
LS
New
ey-W
est
OL
SO
LS
OL
SO
LS
New
ey-W
est
New
sP
ress
ure
0.07
3**
0.02
90.
029
0.02
70.
027
0.12
8**
0.02
40.
024
0.02
10.
021
sam
eda
y(0
.032
)(0
.034
)(0
.034
)(0
.034
)(0
.036
)(0
.052
)(0
.044
)(0
.044
)(0
.044
)(0
.047
)
New
sP
ress
ure
t+1
0.08
1**
0.08
1**
0.07
6**
0.07
6**
0.11
3**
0.11
3**
0.10
2**
0.10
2**
(0.0
36)
(0.0
36)
(0.0
36)
(0.0
35)
(0.0
47)
(0.0
47)
(0.0
47)
(0.0
48)
New
sP
ress
ure
t+2
-0.0
12-0
.012
-0.0
11-0
.011
-0.0
36-0
.036
-0.0
35-0
.035
(0.0
31)
(0.0
31)
(0.0
31)
(0.0
35)
(0.0
41)
(0.0
41)
(0.0
42)
(0.0
47)
New
sP
ress
ure
t+3
0.02
90.
029
0.03
40.
034
0.06
90.
069
0.07
70.
077
(0.0
38)
(0.0
38)
(0.0
38)
(0.0
34)
(0.0
53)
(0.0
53)
(0.0
53)
(0.0
50)
New
sP
ress
ure
t-1
-0.0
26-0
.026
-0.0
27-0
.027
-0.0
37-0
.037
-0.0
37-0
.037
(0.0
29)
(0.0
29)
(0.0
29)
(0.0
35)
(0.0
39)
(0.0
39)
(0.0
40)
(0.0
46)
New
sP
ress
ure
t-2
-0.0
22-0
.022
-0.0
22-0
.022
0.02
60.
026
0.02
50.
025
(0.0
35)
(0.0
35)
(0.0
35)
(0.0
33)
(0.0
48)
(0.0
48)
(0.0
48)
(0.0
47)
New
sP
ress
ure
t-3
-0.0
33-0
.033
-0.0
35-0
.035
-0.0
23-0
.023
-0.0
23-0
.023
(0.0
32)
(0.0
32)
(0.0
32)
(0.0
35)
(0.0
44)
(0.0
44)
(0.0
44)
(0.0
46)
Pale
stin
ian
atta
cks
0.04
7*0.
047*
0.12
9***
0.12
9***
(pre
viou
sda
y)(0
.025
)(0
.025
)(0
.048
)(0
.045
)
Pale
stin
ian
atta
cks
0.04
7**
0.04
7**
0.10
1***
0.10
1***
(pre
viou
sw
eek)
(0.0
23)
(0.0
20)
(0.0
34)
(0.0
32)
Pale
stin
ian
atta
cks
0.07
2***
0.07
2***
0.09
7***
0.09
7***
(wee
kbe
fore
prev
ious
)(0
.022
)(0
.021
)(0
.034
)(0
.033
)
Obs
erva
tions
4,04
84,
006
4,00
63,
999
3,99
94,
048
4,00
64,
006
3,99
93,
999
R-s
quar
ed0.
181
0.18
40.
184
0.19
0—
0.17
50.
176
0.17
60.
187
—
Not
e:A
llre
gres
sion
sin
clud
eye
ar,c
alen
darm
onth
,and
day
ofth
ew
eek
fixed
effe
cts.
Reg
ress
ion
inco
lum
ns(2
)-(5
)and
(7)-
(10)
incl
ude
seve
nla
gsan
dse
ven
lead
sof
new
spr
essu
re.
We
excl
ude
obse
rvat
ions
inth
eto
pan
dbo
ttom
0.5
ofth
edi
stri
butio
nof
sam
e-da
yne
ws
pres
sure
inco
lum
ns(1
),(2
),(6
),an
d(7
),an
dob
serv
atio
nsin
the
top
and
botto
m0.
5of
the
dist
ribu
tion
ofne
xt-d
ayne
ws
pres
sure
inth
ere
mai
ning
colu
mns
.Dat
aon
Isra
elia
ndPa
lest
inia
nat
tack
sar
efr
omB
’Tse
lem
.St
anda
rder
rors
clus
tere
dby
mon
th-y
ear
are
repo
rted
inpa
rent
hese
sin
colu
mns
(1)-
(4)
and
(6)-
(9);
corr
ecte
dN
ewey
-Wes
tst
anda
rder
rors
are
repo
rted
inpa
rent
hese
sin
colu
mns
(5)a
nd(1
0).*
**p<
0.01
,**
p<0.
05,*
p<0.
1.
38
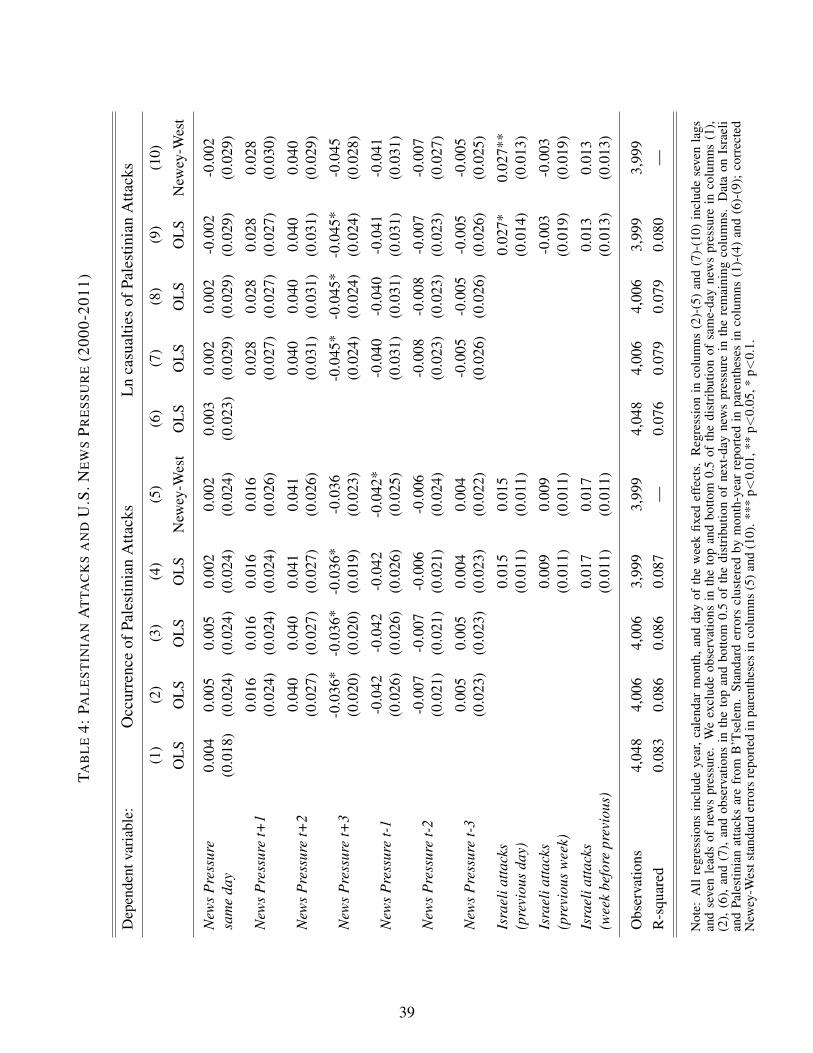
TAB
LE
4:PA
LE
ST
INIA
NA
TTA
CK
SA
ND
U.S
.NE
WS
PR
ES
SU
RE
(200
0-20
11)
Dep
ende
ntva
riab
le:
Occ
urre
nce
ofPa
lest
inia
nA
ttack
sL
nca
sual
ties
ofPa
lest
inia
nA
ttack
s
(1)
(2)
(3)
(4)
(5)
(6)
(7)
(8)
(9)
(10)
OL
SO
LS
OL
SO
LS
New
ey-W
est
OL
SO
LS
OL
SO
LS
New
ey-W
est
New
sP
ress
ure
0.00
40.
005
0.00
50.
002
0.00
20.
003
0.00
20.
002
-0.0
02-0
.002
sam
eda
y(0
.018
)(0
.024
)(0
.024
)(0
.024
)(0
.024
)(0
.023
)(0
.029
)(0
.029
)(0
.029
)(0
.029
)
New
sP
ress
ure
t+1
0.01
60.
016
0.01
60.
016
0.02
80.
028
0.02
80.
028
(0.0
24)
(0.0
24)
(0.0
24)
(0.0
26)
(0.0
27)
(0.0
27)
(0.0
27)
(0.0
30)
New
sP
ress
ure
t+2
0.04
00.
040
0.04
10.
041
0.04
00.
040
0.04
00.
040
(0.0
27)
(0.0
27)
(0.0
27)
(0.0
26)
(0.0
31)
(0.0
31)
(0.0
31)
(0.0
29)
New
sP
ress
ure
t+3
-0.0
36*
-0.0
36*
-0.0
36*
-0.0
36-0
.045
*-0
.045
*-0
.045
*-0
.045
(0.0
20)
(0.0
20)
(0.0
19)
(0.0
23)
(0.0
24)
(0.0
24)
(0.0
24)
(0.0
28)
New
sP
ress
ure
t-1
-0.0
42-0
.042
-0.0
42-0
.042
*-0
.040
-0.0
40-0
.041
-0.0
41(0
.026
)(0
.026
)(0
.026
)(0
.025
)(0
.031
)(0
.031
)(0
.031
)(0
.031
)
New
sP
ress
ure
t-2
-0.0
07-0
.007
-0.0
06-0
.006
-0.0
08-0
.008
-0.0
07-0
.007
(0.0
21)
(0.0
21)
(0.0
21)
(0.0
24)
(0.0
23)
(0.0
23)
(0.0
23)
(0.0
27)
New
sP
ress
ure
t-3
0.00
50.
005
0.00
40.
004
-0.0
05-0
.005
-0.0
05-0
.005
(0.0
23)
(0.0
23)
(0.0
23)
(0.0
22)
(0.0
26)
(0.0
26)
(0.0
26)
(0.0
25)
Isra
elia
ttack
s0.
015
0.01
50.
027*
0.02
7**
(pre
viou
sda
y)(0
.011
)(0
.011
)(0
.014
)(0
.013
)
Isra
elia
ttack
s0.
009
0.00
9-0
.003
-0.0
03(p
revi
ous
wee
k)(0
.011
)(0
.011
)(0
.019
)(0
.019
)
Isra
elia
ttack
s0.
017
0.01
70.
013
0.01
3(w
eek
befo
repr
evio
us)
(0.0
11)
(0.0
11)
(0.0
13)
(0.0
13)
Obs
erva
tions
4,04
84,
006
4,00
63,
999
3,99
94,
048
4,00
64,
006
3,99
93,
999
R-s
quar
ed0.
083
0.08
60.
086
0.08
7—
0.07
60.
079
0.07
90.
080
—
Not
e:A
llre
gres
sion
sin
clud
eye
ar,c
alen
dar
mon
th,a
ndda
yof
the
wee
kfix
edef
fect
s.R
egre
ssio
nin
colu
mns
(2)-
(5)
and
(7)-
(10)
incl
ude
seve
nla
gsan
dse
ven
lead
sof
new
spr
essu
re.
We
excl
ude
obse
rvat
ions
inth
eto
pan
dbo
ttom
0.5
ofth
edi
stri
butio
nof
sam
e-da
yne
ws
pres
sure
inco
lum
ns(1
),(2
),(6
),an
d(7
),an
dob
serv
atio
nsin
the
top
and
botto
m0.
5of
the
dist
ribu
tion
ofne
xt-d
ayne
ws
pres
sure
inth
ere
mai
ning
colu
mns
.D
ata
onIs
rael
ian
dPa
lest
inia
nat
tack
sar
efr
omB
’Tse
lem
.St
anda
rder
rors
clus
tere
dby
mon
th-y
ear
repo
rted
inpa
rent
hese
sin
colu
mns
(1)-
(4)
and
(6)-
(9);
corr
ecte
dN
ewey
-Wes
tsta
ndar
der
rors
repo
rted
inpa
rent
hese
sin
colu
mns
(5)a
nd(1
0).*
**p<
0.01
,**
p<0.
05,*
p<0.
1.
39

TABLE 5: ISRAELI ATTACKS AND U.S. NEWS PRESSURE DURING THE SECOND INTIFADA
(2000-2004) AND AFTER IT (2005-2011)
Dependent variable: Occurrence Occurrence Ln Casualties Occurrence Occurrence Ln Casualties
Sample: During Intifada Post-Intifada
(1) (2) (3) (4) (5) (6)
News Pressure (t+1)0.041 0.029 0.041 0.090** 0.088** 0.111**
(0.060) (0.062) (0.092) (0.044) (0.043) (0.053)Palestinian attacks 0.093*** 0.215*** -0.041 -0.036(previous day) (0.030) (0.056) (0.043) (0.066)Palestinian attacks 0.073** 0.152*** 0.028 0.076*(previous week) (0.028) (0.046) (0.028) (0.043)Palestinian attacks 0.071** 0.143*** 0.067** 0.067*(week before previous) (0.031) (0.051) (0.027) (0.040)
News pressure same day Yes Yes Yes Yes Yes YesNews pressure (lags) Yes Yes Yes Yes Yes YesNews pressure (leads) Yes Yes Yes Yes Yes Yes
Observations 1,571 1,564 1,564 2,435 2,435 2,435Probability of attack 59.7% 59.7% 59.7% 25.4% 25.4% 25.4%
Note: Day of the week fixed effects, calendar month fixed effects, year fixed effects, same day news pressure, as wellas seven leads and seven lags of news pressure are included in all regressions. Corrected Newey-West standard errorsreported in parentheses; *** p<0.01, ** p<0.05, * p<0.1.
40
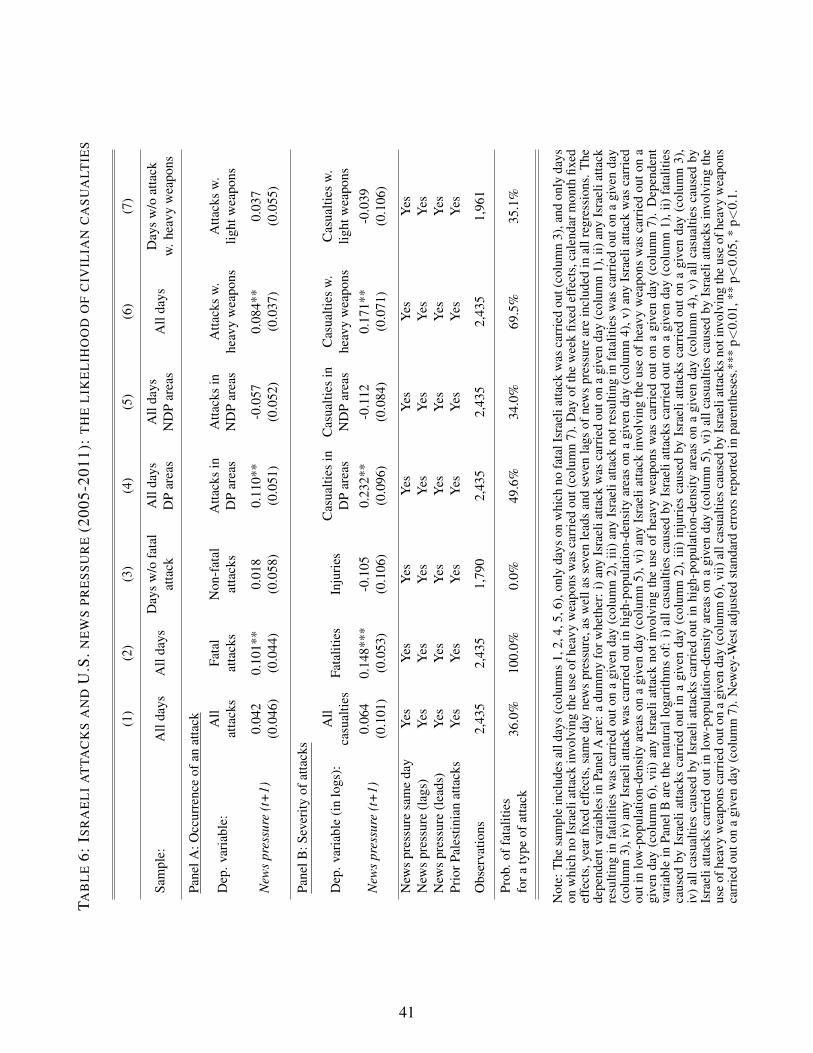
TAB
LE
6:IS
RA
EL
IA
TTA
CK
SA
ND
U.S
.NE
WS
PR
ES
SU
RE
(200
5-20
11):
TH
EL
IKE
LIH
OO
DO
FC
IVIL
IAN
CA
SU
ALT
IES
(1)
(2)
(3)
(4)
(5)
(6)
(7)
Sam
ple:
All
days
All
days
Day
sw
/ofa
tal
All
days
All
days
All
days
Day
sw
/oat
tack
atta
ckD
Par
eas
ND
Par
eas
w.h
eavy
wea
pons
Pane
lA:O
ccur
renc
eof
anat
tack
Dep
.var
iabl
e:A
llFa
tal
Non
-fat
alA
ttack
sin
Atta
cks
inA
ttack
sw
.A
ttack
sw
.at
tack
sat
tack
sat
tack
sD
Par
eas
ND
Par
eas
heav
yw
eapo
nslig
htw
eapo
ns
New
spr
essu
re(t
+1)
0.04
20.
101*
*0.
018
0.11
0**
-0.0
570.
084*
*0.
037
(0.0
46)
(0.0
44)
(0.0
58)
(0.0
51)
(0.0
52)
(0.0
37)
(0.0
55)
Pane
lB:S
ever
ityof
atta
cks
Dep
.var
iabl
e(i
nlo
gs):
All
Fata
litie
sIn
juri
esC
asua
lties
inC
asua
lties
inC
asua
lties
w.
Cas
ualti
esw
.ca
sual
ties
DP
area
sN
DP
area
she
avy
wea
pons
light
wea
pons
New
spr
essu
re(t
+1)
0.06
40.
148*
**-0
.105
0.23
2**
-0.1
120.
171*
*-0
.039
(0.1
01)
(0.0
53)
(0.1
06)
(0.0
96)
(0.0
84)
(0.0
71)
(0.1
06)
New
spr
essu
resa
me
day
Yes
Yes
Yes
Yes
Yes
Yes
Yes
New
spr
essu
re(l
ags)
Yes
Yes
Yes
Yes
Yes
Yes
Yes
New
spr
essu
re(l
eads
)Y
esY
esY
esY
esY
esY
esY
esPr
iorP
ales
tinia
nat
tack
sY
esY
esY
esY
esY
esY
esY
es
Obs
erva
tions
2,43
52,
435
1,79
02,
435
2,43
52,
435
1,96
1
Prob
.off
atal
ities
36.0
%10
0.0%
0.0%
49.6
%34
.0%
69.5
%35
.1%
fora
type
ofat
tack
Not
e:T
hesa
mpl
ein
clud
esal
lday
s(c
olum
ns1,
2,4,
5,6)
,onl
yda
yson
whi
chno
fata
lIsr
aeli
atta
ckw
asca
rrie
dou
t(co
lum
n3)
,and
only
days
onw
hich
noIs
rael
iatta
ckin
volv
ing
the
use
ofhe
avy
wea
pons
was
carr
ied
out(
colu
mn
7).D
ayof
the
wee
kfix
edef
fect
s,ca
lend
arm
onth
fixed
effe
cts,
year
fixed
effe
cts,
sam
eda
yne
ws
pres
sure
,as
wel
las
seve
nle
ads
and
seve
nla
gsof
new
spr
essu
rear
ein
clud
edin
allr
egre
ssio
ns.T
hede
pend
entv
aria
bles
inPa
nelA
are:
adu
mm
yfo
rwhe
ther
:i)a
nyIs
rael
iatta
ckw
asca
rrie
dou
ton
agi
ven
day
(col
umn
1),i
i)an
yIs
rael
iatta
ckre
sulti
ngin
fata
litie
sw
asca
rrie
dou
ton
agi
ven
day
(col
umn
2),i
ii)an
yIs
rael
iatta
ckno
tres
ultin
gin
fata
litie
sw
asca
rrie
dou
ton
agi
ven
day
(col
umn
3),i
v)an
yIs
rael
iatta
ckw
asca
rrie
dou
tin
high
-pop
ulat
ion-
dens
ityar
eas
ona
give
nda
y(c
olum
n4)
,v)a
nyIs
rael
iatta
ckw
asca
rrie
dou
tin
low
-pop
ulat
ion-
dens
ityar
eas
ona
give
nda
y(c
olum
n5)
,vi)
any
Isra
elia
ttack
invo
lvin
gth
eus
eof
heav
yw
eapo
nsw
asca
rrie
dou
ton
agi
ven
day
(col
umn
6),v
ii)an
yIs
rael
iatta
ckno
tinv
olvi
ngth
eus
eof
heav
yw
eapo
nsw
asca
rrie
dou
ton
agi
ven
day
(col
umn
7).
Dep
ende
ntva
riab
lein
Pane
lBar
eth
ena
tura
llog
arith
ms
of:
i)al
lcas
ualti
esca
used
byIs
rael
iatta
cks
carr
ied
outo
na
give
nda
y(c
olum
n1)
,ii)
fata
litie
sca
used
byIs
rael
iatta
cks
carr
ied
outi
na
give
nda
y(c
olum
n2)
,iii)
inju
ries
caus
edby
Isra
elia
ttack
sca
rrie
dou
ton
agi
ven
day
(col
umn
3),
iv)
allc
asua
lties
caus
edby
Isra
elia
ttack
sca
rrie
dou
tin
high
-pop
ulat
ion-
dens
ityar
eas
ona
give
nda
y(c
olum
n4)
,v)
allc
asua
lties
caus
edby
Isra
elia
ttack
sca
rrie
dou
tin
low
-pop
ulat
ion-
dens
ityar
eas
ona
give
nda
y(c
olum
n5)
,vi)
allc
asua
lties
caus
edby
Isra
elia
ttack
sin
volv
ing
the
use
ofhe
avy
wea
pons
carr
ied
outo
na
give
nda
y(c
olum
n6)
,vii)
allc
asua
lties
caus
edby
Isra
elia
ttack
sno
tinv
olvi
ngth
eus
eof
heav
yw
eapo
nsca
rrie
dou
ton
agi
ven
day
(col
umn
7).N
ewey
-Wes
tadj
uste
dst
anda
rder
rors
repo
rted
inpa
rent
hese
s.**
*p<
0.01
,**
p<0.
05,*
p<0.
1.
41
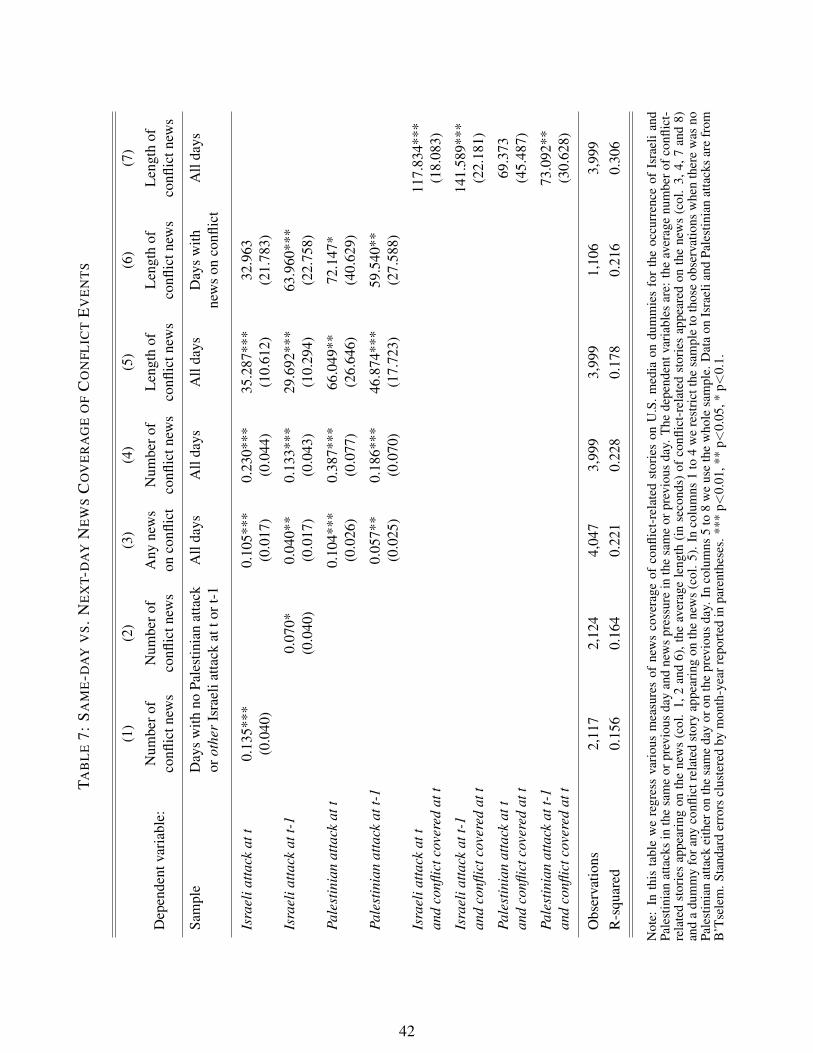
TAB
LE
7:S
AM
E-D
AY
VS.
NE
XT-
DA
YN
EW
SC
OV
ER
AG
EO
FC
ON
FLIC
TE
VE
NT
S
(1)
(2)
(3)
(4)
(5)
(6)
(7)
Dep
ende
ntva
riab
le:
Num
bero
fN
umbe
rof
Any
new
sN
umbe
rof
Len
gth
ofL
engt
hof
Len
gth
ofco
nflic
tnew
sco
nflic
tnew
son
confl
ict
confl
ictn
ews
confl
ictn
ews
confl
ictn
ews
confl
ictn
ews
Sam
ple
Day
sw
ithno
Pale
stin
ian
atta
ckA
llda
ysA
llda
ysA
llda
ysD
ays
with
All
days
orot
her
Isra
elia
ttack
atto
rt-1
new
son
confl
ict
Isra
elia
ttack
att
0.13
5***
0.10
5***
0.23
0***
35.2
87**
*32
.963
(0.0
40)
(0.0
17)
(0.0
44)
(10.
612)
(21.
783)
Isra
elia
ttack
att-
10.
070*
0.04
0**
0.13
3***
29.6
92**
*63
.960
***
(0.0
40)
(0.0
17)
(0.0
43)
(10.
294)
(22.
758)
Pale
stin
ian
atta
ckat
t0.
104*
**0.
387*
**66
.049
**72
.147
*(0
.026
)(0
.077
)(2
6.64
6)(4
0.62
9)
Pale
stin
ian
atta
ckat
t-1
0.05
7**
0.18
6***
46.8
74**
*59
.540
**(0
.025
)(0
.070
)(1
7.72
3)(2
7.58
8)
Isra
elia
ttack
att
117.
834*
**an
dco
nflic
tcov
ered
att
(18.
083)
Isra
elia
ttack
att-
114
1.58
9***
and
confl
ictc
over
edat
t(2
2.18
1)
Pale
stin
ian
atta
ckat
t69
.373
and
confl
ictc
over
edat
t(4
5.48
7)
Pale
stin
ian
atta
ckat
t-1
73.0
92**
and
confl
ictc
over
edat
t(3
0.62
8)
Obs
erva
tions
2,11
72,
124
4,04
73,
999
3,99
91,
106
3,99
9R
-squ
ared
0.15
60.
164
0.22
10.
228
0.17
80.
216
0.30
6
Not
e:In
this
tabl
ew
ere
gres
sva
riou
sm
easu
res
ofne
ws
cove
rage
ofco
nflic
t-re
late
dst
orie
son
U.S
.med
iaon
dum
mie
sfo
rth
eoc
curr
ence
ofIs
rael
ian
dPa
lest
inia
nat
tack
sin
the
sam
eor
prev
ious
day
and
new
spr
essu
rein
the
sam
eor
prev
ious
day.
The
depe
nden
tvar
iabl
esar
e:th
eav
erag
enu
mbe
rofc
onfli
ct-
rela
ted
stor
ies
appe
arin
gon
the
new
s(c
ol.
1,2
and
6),t
heav
erag
ele
ngth
(in
seco
nds)
ofco
nflic
t-re
late
dst
orie
sap
pear
edon
the
new
s(c
ol.
3,4,
7an
d8)
and
adu
mm
yfo
rany
confl
ictr
elat
edst
ory
appe
arin
gon
the
new
s(c
ol.5
).In
colu
mns
1to
4w
ere
stri
ctth
esa
mpl
eto
thos
eob
serv
atio
nsw
hen
ther
ew
asno
Pale
stin
ian
atta
ckei
ther
onth
esa
me
day
oron
the
prev
ious
day.
Inco
lum
ns5
to8
we
use
the
who
lesa
mpl
e.D
ata
onIs
rael
iand
Pale
stin
ian
atta
cks
are
from
B’T
sele
m.S
tand
ard
erro
rscl
uste
red
bym
onth
-yea
rrep
orte
din
pare
nthe
ses.
***
p<0.
01,*
*p<
0.05
,*p<
0.1.
42
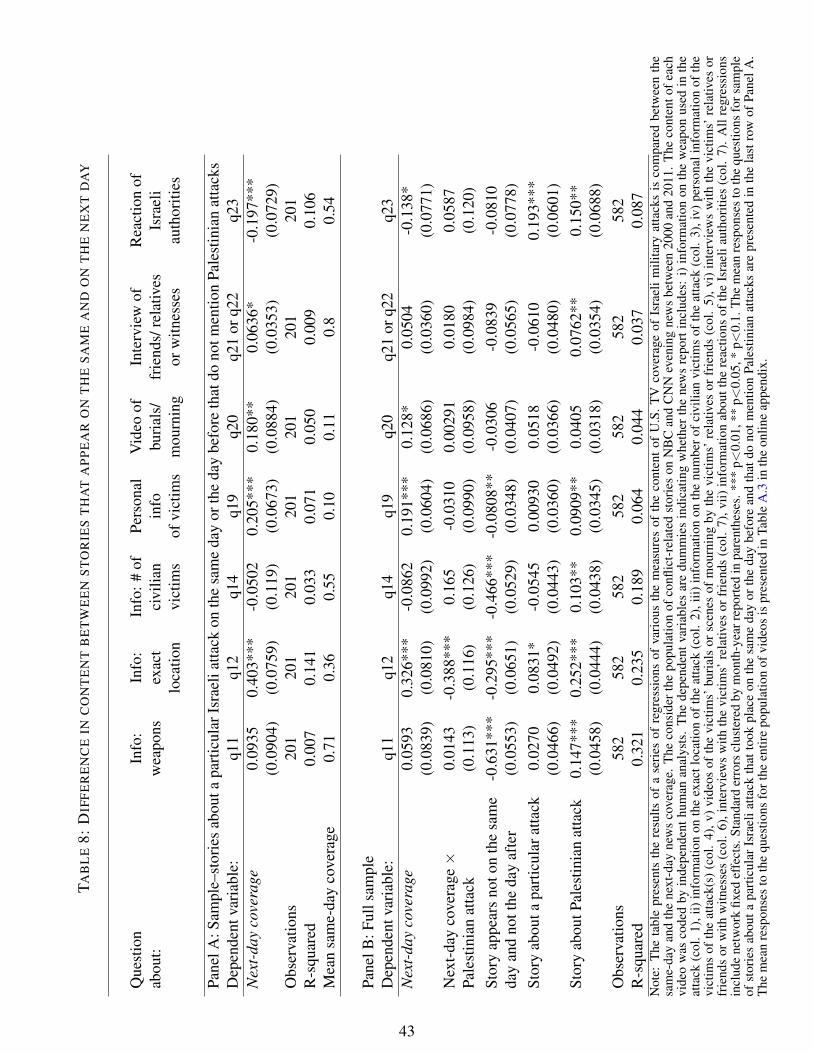
TAB
LE
8:D
IFF
ER
EN
CE
INC
ON
TE
NT
BE
TW
EE
NS
TO
RIE
ST
HA
TA
PP
EA
RO
NT
HE
SA
ME
AN
DO
NT
HE
NE
XT
DA
Y
Que
stio
nIn
fo:
Info
:In
fo:#
ofPe
rson
alV
ideo
ofIn
terv
iew
ofR
eact
ion
ofab
out:
wea
pons
exac
tci
vilia
nin
fobu
rial
s/fr
iend
s/re
lativ
esIs
rael
ilo
catio
nvi
ctim
sof
vict
ims
mou
rnin
gor
witn
esse
sau
thor
ities
Pane
lA:S
ampl
e–st
orie
sab
outa
part
icul
arIs
rael
iatta
ckon
the
sam
eda
yor
the
day
befo
reth
atdo
notm
entio
nPa
lest
inia
nat
tack
sD
epen
dent
vari
able
:q1
1q1
2q1
4q1
9q2
0q2
1or
q22
q23
Nex
t-da
yco
vera
ge0.
0935
0.40
3***
-0.0
502
0.20
5***
0.18
0**
0.06
36*
-0.1
97**
*(0
.090
4)(0
.075
9)(0
.119
)(0
.067
3)(0
.088
4)(0
.035
3)(0
.072
9)O
bser
vatio
ns20
120
120
120
120
120
120
1R
-squ
ared
0.00
70.
141
0.03
30.
071
0.05
00.
009
0.10
6M
ean
sam
e-da
yco
vera
ge0.
710.
360.
550.
100.
110.
80.
54
Pane
lB:F
ulls
ampl
eD
epen
dent
vari
able
:q1
1q1
2q1
4q1
9q2
0q2
1or
q22
q23
Nex
t-da
yco
vera
ge0.
0593
0.32
6***
-0.0
862
0.19
1***
0.12
8*0.
0504
-0.1
38*
(0.0
839)
(0.0
810)
(0.0
992)
(0.0
604)
(0.0
686)
(0.0
360)
(0.0
771)
Nex
t-da
yco
vera
ge×
0.01
43-0
.388
***
0.16
5-0
.031
00.
0029
10.
0180
0.05
87Pa
lest
inia
nat
tack
(0.1
13)
(0.1
16)
(0.1
26)
(0.0
990)
(0.0
958)
(0.0
984)
(0.1
20)
Stor
yap
pear
sno
ton
the
sam
e-0
.631
***
-0.2
95**
*-0
.466
***
-0.0
808*
*-0
.030
6-0
.083
9-0
.081
0da
yan
dno
tthe
day
afte
r(0
.055
3)(0
.065
1)(0
.052
9)(0
.034
8)(0
.040
7)(0
.056
5)(0
.077
8)St
ory
abou
tapa
rtic
ular
atta
ck0.
0270
0.08
31*
-0.0
545
0.00
930
0.05
18-0
.061
00.
193*
**(0
.046
6)(0
.049
2)(0
.044
3)(0
.036
0)(0
.036
6)(0
.048
0)(0
.060
1)St
ory
abou
tPal
estin
ian
atta
ck0.
147*
**0.
252*
**0.
103*
*0.
0909
**0.
0405
0.07
62**
0.15
0**
(0.0
458)
(0.0
444)
(0.0
438)
(0.0
345)
(0.0
318)
(0.0
354)
(0.0
688)
Obs
erva
tions
582
582
582
582
582
582
582
R-s
quar
ed0.
321
0.23
50.
189
0.06
40.
044
0.03
70.
087
Not
e:T
heta
ble
pres
ents
the
resu
ltsof
ase
ries
ofre
gres
sion
sof
vari
ous
the
mea
sure
sof
the
cont
ent
ofU
.S.T
Vco
vera
geof
Isra
eli
mili
tary
atta
cks
isco
mpa
red
betw
een
the
sam
e-da
yan
dth
ene
xt-d
ayne
ws
cove
rage
.T
heco
nsid
erth
epo
pula
tion
ofco
nflic
t-re
late
dst
orie
son
NB
Can
dC
NN
even
ing
new
sbe
twee
n20
00an
d20
11.
The
cont
ento
fea
chvi
deo
was
code
dby
inde
pend
enth
uman
anal
ysts
.T
hede
pend
entv
aria
bles
are
dum
mie
sin
dica
ting
whe
ther
the
new
sre
port
incl
udes
:i)
info
rmat
ion
onth
ew
eapo
nus
edin
the
atta
ck(c
ol.
1),i
i)in
form
atio
non
the
exac
tloc
atio
nof
the
atta
ck(c
ol.
2),i
ii)in
form
atio
non
the
num
ber
ofci
vilia
nvi
ctim
sof
the
atta
ck(c
ol.
3),i
v)pe
rson
alin
form
atio
nof
the
vict
ims
ofth
eat
tack
(s)
(col
.4)
,v)
vide
osof
the
vict
ims’
buri
als
orsc
enes
ofm
ourn
ing
byth
evi
ctim
s’re
lativ
esor
frie
nds
(col
.5)
,vi)
inte
rvie
ws
with
the
vict
ims’
rela
tives
orfr
iend
sor
with
witn
esse
s(c
ol.
6),i
nter
view
sw
ithth
evi
ctim
s’re
lativ
esor
frie
nds
(col
.7)
,vii)
info
rmat
ion
abou
tthe
reac
tions
ofth
eIs
rael
iaut
hori
ties
(col
.7)
.A
llre
gres
sion
sin
clud
ene
twor
kfix
edef
fect
s.St
anda
rder
rors
clus
tere
dby
mon
th-y
earr
epor
ted
inpa
rent
hese
s.**
*p<
0.01
,**
p<0.
05,*
p<0.
1.T
hem
ean
resp
onse
sto
the
ques
tions
fors
ampl
eof
stor
ies
abou
tapa
rtic
ular
Isra
elia
ttack
that
took
plac
eon
the
sam
eda
yor
the
day
befo
rean
dth
atdo
notm
entio
nPa
lest
inia
nat
tack
sar
epr
esen
ted
inth
ela
stro
wof
Pane
lA.
The
mea
nre
spon
ses
toth
equ
estio
nsfo
rthe
entir
epo
pula
tion
ofvi
deos
ispr
esen
ted
inTa
ble
A.3
inth
eon
line
appe
ndix
.
43
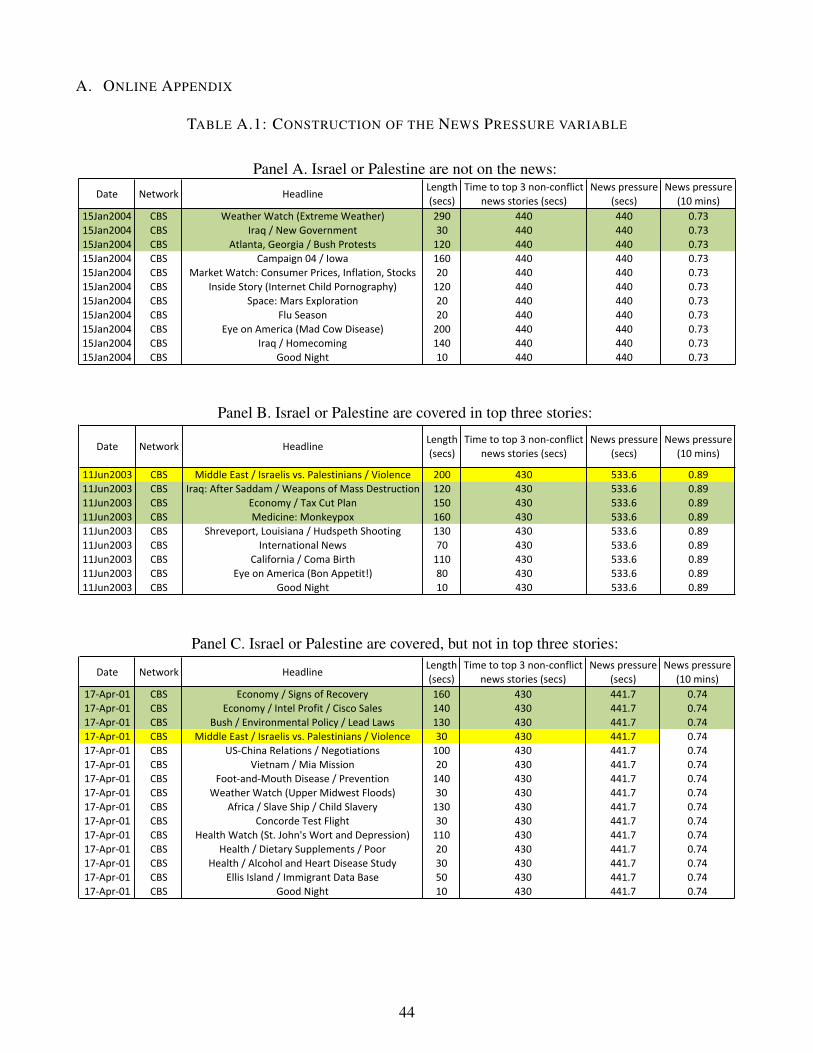
A. ONLINE APPENDIX
TABLE A.1: CONSTRUCTION OF THE NEWS PRESSURE VARIABLE
Panel A. Israel or Palestine are not on the news:Date Network Headline Length
(secs)Time to top 3 non-‐conflict
news stories (secs)News pressure
(secs)News pressure
(10 mins)15Jan2004 CBS Weather Watch (Extreme Weather) 290 440 440 0.7315Jan2004 CBS Iraq / New Government 30 440 440 0.7315Jan2004 CBS Atlanta, Georgia / Bush Protests 120 440 440 0.7315Jan2004 CBS Campaign 04 / Iowa 160 440 440 0.7315Jan2004 CBS Market Watch: Consumer Prices, Inflation, Stocks 20 440 440 0.7315Jan2004 CBS Inside Story (Internet Child Pornography) 120 440 440 0.7315Jan2004 CBS Space: Mars Exploration 20 440 440 0.7315Jan2004 CBS Flu Season 20 440 440 0.7315Jan2004 CBS Eye on America (Mad Cow Disease) 200 440 440 0.7315Jan2004 CBS Iraq / Homecoming 140 440 440 0.7315Jan2004 CBS Good Night 10 440 440 0.73
Panel B. Israel or Palestine are covered in top three stories:
Date Network Headline Length (secs)
Time to top 3 non-‐conflict news stories (secs)
News pressure (secs)
News pressure (10 mins)
11Jun2003 CBS Middle East / Israelis vs. Palestinians / Violence 200 430 533.6 0.8911Jun2003 CBS Iraq: After Saddam / Weapons of Mass Destruction 120 430 533.6 0.8911Jun2003 CBS Economy / Tax Cut Plan 150 430 533.6 0.8911Jun2003 CBS Medicine: Monkeypox 160 430 533.6 0.8911Jun2003 CBS Shreveport, Louisiana / Hudspeth Shooting 130 430 533.6 0.8911Jun2003 CBS International News 70 430 533.6 0.8911Jun2003 CBS California / Coma Birth 110 430 533.6 0.8911Jun2003 CBS Eye on America (Bon Appetit!) 80 430 533.6 0.8911Jun2003 CBS Good Night 10 430 533.6 0.89
Panel C. Israel or Palestine are covered, but not in top three stories:
Date Network Headline Length (secs)
Time to top 3 non-‐conflict news stories (secs)
News pressure (secs)
News pressure (10 mins)
17-‐Apr-‐01 CBS Economy / Signs of Recovery 160 430 441.7 0.7417-‐Apr-‐01 CBS Economy / Intel Profit / Cisco Sales 140 430 441.7 0.7417-‐Apr-‐01 CBS Bush / Environmental Policy / Lead Laws 130 430 441.7 0.7417-‐Apr-‐01 CBS Middle East / Israelis vs. Palestinians / Violence 30 430 441.7 0.7417-‐Apr-‐01 CBS US-‐China Relations / Negotiations 100 430 441.7 0.7417-‐Apr-‐01 CBS Vietnam / Mia Mission 20 430 441.7 0.7417-‐Apr-‐01 CBS Foot-‐and-‐Mouth Disease / Prevention 140 430 441.7 0.7417-‐Apr-‐01 CBS Weather Watch (Upper Midwest Floods) 30 430 441.7 0.7417-‐Apr-‐01 CBS Africa / Slave Ship / Child Slavery 130 430 441.7 0.7417-‐Apr-‐01 CBS Concorde Test Flight 30 430 441.7 0.7417-‐Apr-‐01 CBS Health Watch (St. John's Wort and Depression) 110 430 441.7 0.7417-‐Apr-‐01 CBS Health / Dietary Supplements / Poor 20 430 441.7 0.7417-‐Apr-‐01 CBS Health / Alcohol and Heart Disease Study 30 430 441.7 0.7417-‐Apr-‐01 CBS Ellis Island / Immigrant Data Base 50 430 441.7 0.7417-‐Apr-‐01 CBS Good Night 10 430 441.7 0.74
44
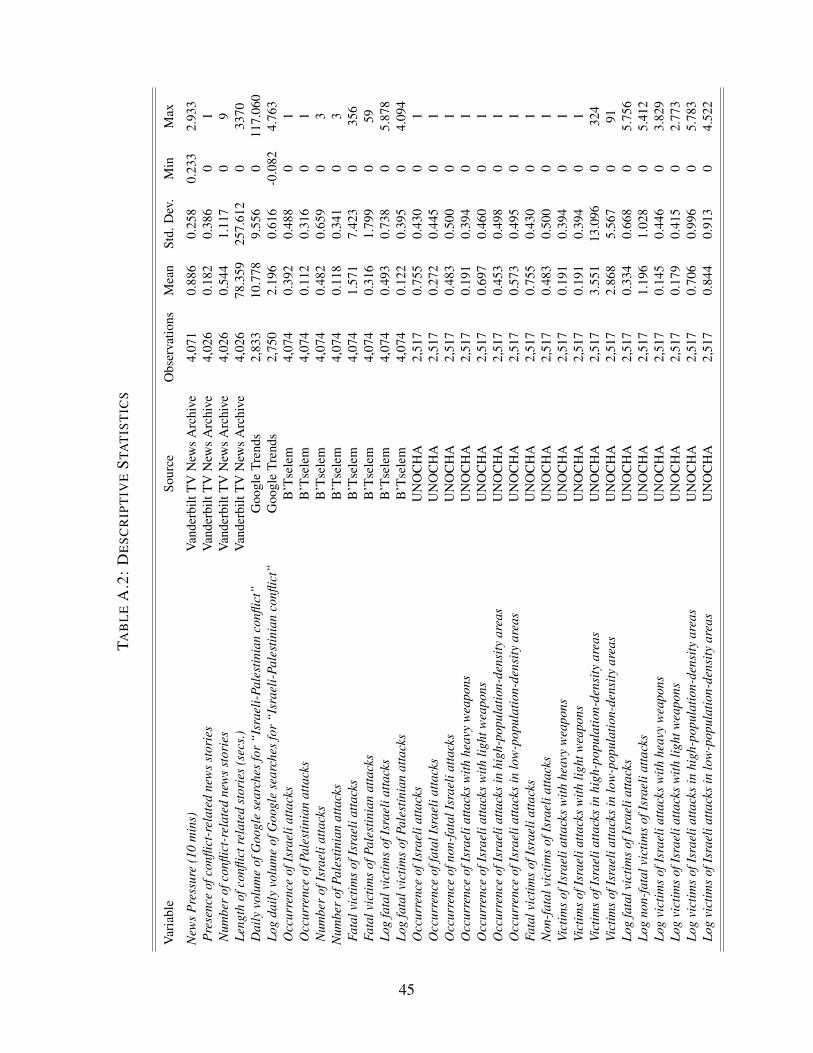
TAB
LE
A.2
:D
ES
CR
IPT
IVE
STA
TIS
TIC
S
Var
iabl
eSo
urce
Obs
erva
tions
Mea
nSt
d.D
ev.
Min
Max
New
sP
ress
ure
(10
min
s)V
ande
rbilt
TV
New
sA
rchi
ve4,
071
0.88
60.
258
0.23
32.
933
Pre
senc
eof
confl
ict-
rela
ted
new
sst
orie
sV
ande
rbilt
TV
New
sA
rchi
ve4,
026
0.18
20.
386
01
Num
ber
ofco
nflic
t-re
late
dne
ws
stor
ies
Van
derb
iltT
VN
ews
Arc
hive
4,02
60.
544
1.11
70
9Le
ngth
ofco
nflic
trel
ated
stor
ies
(sec
s.)
Van
derb
iltT
VN
ews
Arc
hive
4,02
678
.359
257.
612
033
70D
aily
volu
me
ofG
oogl
ese
arch
esfo
r“I
srae
li-Pa
lest
inia
nco
nflic
t”G
oogl
eTr
ends
2,83
310
.778
9.55
60
117.
060
Log
daily
volu
me
ofG
oogl
ese
arch
esfo
r“I
srae
li-Pa
lest
inia
nco
nflic
t”G
oogl
eTr
ends
2,75
02.
196
0.61
6-0
.082
4.76
3O
ccur
renc
eof
Isra
elia
ttack
sB
’Tse
lem
4,07
40.
392
0.48
80
1O
ccur
renc
eof
Pale
stin
ian
atta
cks
B’T
sele
m4,
074
0.11
20.
316
01
Num
ber
ofIs
rael
iatta
cks
B’T
sele
m4,
074
0.48
20.
659
03
Num
ber
ofPa
lest
inia
nat
tack
sB
’Tse
lem
4,07
40.
118
0.34
10
3Fa
talv
ictim
sof
Isra
elia
ttack
sB
’Tse
lem
4,07
41.
571
7.42
30
356
Fata
lvic
tims
ofPa
lest
inia
nat
tack
sB
’Tse
lem
4,07
40.
316
1.79
90
59Lo
gfa
talv
ictim
sof
Isra
elia
ttack
sB
’Tse
lem
4,07
40.
493
0.73
80
5.87
8Lo
gfa
talv
ictim
sof
Pale
stin
ian
atta
cks
B’T
sele
m4,
074
0.12
20.
395
04.
094
Occ
urre
nce
ofIs
rael
iatta
cks
UN
OC
HA
2,51
70.
755
0.43
00
1O
ccur
renc
eof
fata
lIsr
aeli
atta
cks
UN
OC
HA
2,51
70.
272
0.44
50
1O
ccur
renc
eof
non-
fata
lIsr
aeli
atta
cks
UN
OC
HA
2,51
70.
483
0.50
00
1O
ccur
renc
eof
Isra
elia
ttack
sw
ithhe
avy
wea
pons
UN
OC
HA
2,51
70.
191
0.39
40
1O
ccur
renc
eof
Isra
elia
ttack
sw
ithlig
htw
eapo
nsU
NO
CH
A2,
517
0.69
70.
460
01
Occ
urre
nce
ofIs
rael
iatta
cks
inhi
gh-p
opul
atio
n-de
nsity
area
sU
NO
CH
A2,
517
0.45
30.
498
01
Occ
urre
nce
ofIs
rael
iatta
cks
inlo
w-p
opul
atio
n-de
nsity
area
sU
NO
CH
A2,
517
0.57
30.
495
01
Fata
lvic
tims
ofIs
rael
iatta
cks
UN
OC
HA
2,51
70.
755
0.43
00
1N
on-f
atal
vict
ims
ofIs
rael
iatta
cks
UN
OC
HA
2,51
70.
483
0.50
00
1Vi
ctim
sof
Isra
elia
ttack
sw
ithhe
avy
wea
pons
UN
OC
HA
2,51
70.
191
0.39
40
1Vi
ctim
sof
Isra
elia
ttack
sw
ithlig
htw
eapo
nsU
NO
CH
A2,
517
0.19
10.
394
01
Vict
ims
ofIs
rael
iatta
cks
inhi
gh-p
opul
atio
n-de
nsity
area
sU
NO
CH
A2,
517
3.55
113
.096
032
4Vi
ctim
sof
Isra
elia
ttack
sin
low
-pop
ulat
ion-
dens
ityar
eas
UN
OC
HA
2,51
72.
868
5.56
70
91Lo
gfa
talv
ictim
sof
Isra
elia
ttack
sU
NO
CH
A2,
517
0.33
40.
668
05.
756
Log
non-
fata
lvic
tims
ofIs
rael
iatta
cks
UN
OC
HA
2,51
71.
196
1.02
80
5.41
2Lo
gvi
ctim
sof
Isra
elia
ttack
sw
ithhe
avy
wea
pons
UN
OC
HA
2,51
70.
145
0.44
60
3.82
9Lo
gvi
ctim
sof
Isra
elia
ttack
sw
ithlig
htw
eapo
nsU
NO
CH
A2,
517
0.17
90.
415
02.
773
Log
vict
ims
ofIs
rael
iatta
cks
inhi
gh-p
opul
atio
n-de
nsity
area
sU
NO
CH
A2,
517
0.70
60.
996
05.
783
Log
vict
ims
ofIs
rael
iatta
cks
inlo
w-p
opul
atio
n-de
nsity
area
sU
NO
CH
A2,
517
0.84
40.
913
04.
522
45
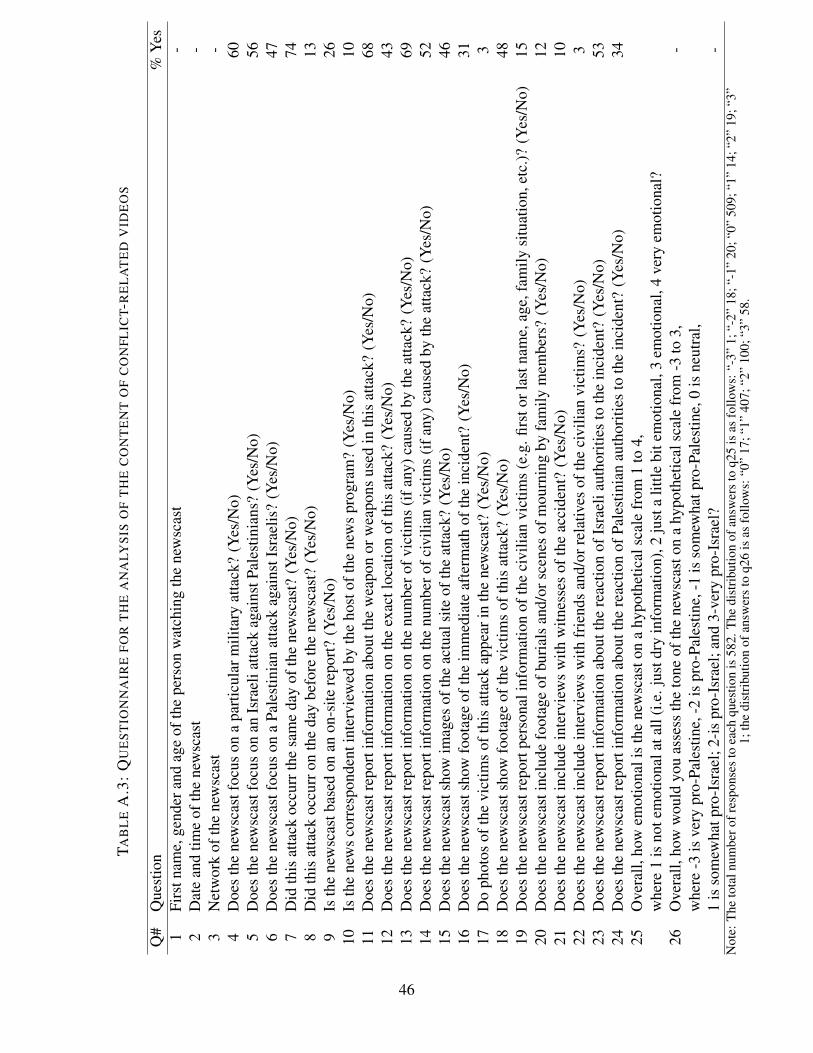
TAB
LE
A.3
:Q
UE
ST
ION
NA
IRE
FO
RT
HE
AN
ALY
SIS
OF
TH
EC
ON
TE
NT
OF
CO
NFL
ICT-
RE
LA
TE
DV
IDE
OS
Q#
Que
stio
n%
Yes
1Fi
rstn
ame,
gend
eran
dag
eof
the
pers
onw
atch
ing
the
new
scas
t-
2D
ate
and
time
ofth
ene
wsc
ast
-3
Net
wor
kof
the
new
scas
t-
4D
oes
the
new
scas
tfoc
uson
apa
rtic
ular
mili
tary
atta
ck?
(Yes
/No)
605
Doe
sth
ene
wsc
astf
ocus
onan
Isra
elia
ttack
agai
nstP
ales
tinia
ns?
(Yes
/No)
566
Doe
sth
ene
wsc
astf
ocus
ona
Pale
stin
ian
atta
ckag
ains
tIsr
aelis
?(Y
es/N
o)47
7D
idth
isat
tack
occu
rrth
esa
me
day
ofth
ene
wsc
ast?
(Yes
/No)
748
Did
this
atta
ckoc
curr
onth
eda
ybe
fore
the
new
scas
t?(Y
es/N
o)13
9Is
the
new
scas
tbas
edon
anon
-site
repo
rt?
(Yes
/No)
2610
Isth
ene
ws
corr
espo
nden
tint
ervi
ewed
byth
eho
stof
the
new
spr
ogra
m?
(Yes
/No)
1011
Doe
sth
ene
wsc
astr
epor
tinf
orm
atio
nab
outt
hew
eapo
nor
wea
pons
used
inth
isat
tack
?(Y
es/N
o)68
12D
oes
the
new
scas
trep
orti
nfor
mat
ion
onth
eex
actl
ocat
ion
ofth
isat
tack
?(Y
es/N
o)43
13D
oes
the
new
scas
trep
orti
nfor
mat
ion
onth
enu
mbe
rofv
ictim
s(i
fany
)cau
sed
byth
eat
tack
?(Y
es/N
o)69
14D
oes
the
new
scas
trep
orti
nfor
mat
ion
onth
enu
mbe
rofc
ivili
anvi
ctim
s(i
fany
)cau
sed
byth
eat
tack
?(Y
es/N
o)52
15D
oes
the
new
scas
tsho
wim
ages
ofth
eac
tual
site
ofth
eat
tack
?(Y
es/N
o)46
16D
oes
the
new
scas
tsho
wfo
otag
eof
the
imm
edia
teaf
term
ath
ofth
ein
cide
nt?
(Yes
/No)
3117
Do
phot
osof
the
vict
ims
ofth
isat
tack
appe
arin
the
new
scas
t?(Y
es/N
o)3
18D
oes
the
new
scas
tsho
wfo
otag
eof
the
vict
ims
ofth
isat
tack
?(Y
es/N
o)48
19D
oes
the
new
scas
trep
ortp
erso
nali
nfor
mat
ion
ofth
eci
vilia
nvi
ctim
s(e
.g.fi
rsto
rlas
tnam
e,ag
e,fa
mily
situ
atio
n,et
c.)?
(Yes
/No)
1520
Doe
sth
ene
wsc
asti
nclu
defo
otag
eof
buri
als
and/
orsc
enes
ofm
ourn
ing
byfa
mily
mem
bers
?(Y
es/N
o)12
21D
oes
the
new
scas
tinc
lude
inte
rvie
ws
with
witn
esse
sof
the
acci
dent
?(Y
es/N
o)10
22D
oes
the
new
scas
tinc
lude
inte
rvie
ws
with
frie
nds
and/
orre
lativ
esof
the
civi
lian
vict
ims?
(Yes
/No)
323
Doe
sth
ene
wsc
astr
epor
tinf
orm
atio
nab
outt
here
actio
nof
Isra
elia
utho
ritie
sto
the
inci
dent
?(Y
es/N
o)53
24D
oes
the
new
scas
trep
orti
nfor
mat
ion
abou
tthe
reac
tion
ofPa
lest
inia
nau
thor
ities
toth
ein
cide
nt?
(Yes
/No)
3425
Ove
rall,
how
emot
iona
lis
the
new
scas
ton
ahy
poth
etic
alsc
ale
from
1to
4,w
here
1is
note
mot
iona
lata
ll(i
.e.j
ustd
ryin
form
atio
n),2
just
alit
tlebi
tem
otio
nal,
3em
otio
nal,
4ve
ryem
otio
nal?
26O
vera
ll,ho
ww
ould
you
asse
ssth
eto
neof
the
new
scas
ton
ahy
poth
etic
alsc
ale
from
-3to
3,-
whe
re-3
isve
rypr
o-Pa
lest
ine,
-2is
pro-
Pale
stin
e,-1
isso
mew
hatp
ro-P
ales
tine,
0is
neut
ral,
1is
som
ewha
tpro
-Isr
ael;
2-is
pro-
Isra
el;a
nd3-
very
pro-
Isra
el?
-N
ote:
The
tota
lnum
bero
fres
pons
esto
each
ques
tion
is58
2.T
hedi
stri
butio
nof
answ
ers
toq2
5is
asfo
llow
s:“-
3”1;
“-2”
18;“
-1”
20;“
0”50
9;“1
”14
;“2”
19;“
3”1;
the
dist
ribu
tion
ofan
swer
sto
q26
isas
follo
ws:
“0”
17;“
1”40
7;“2
”10
0;“3
”58
.
46
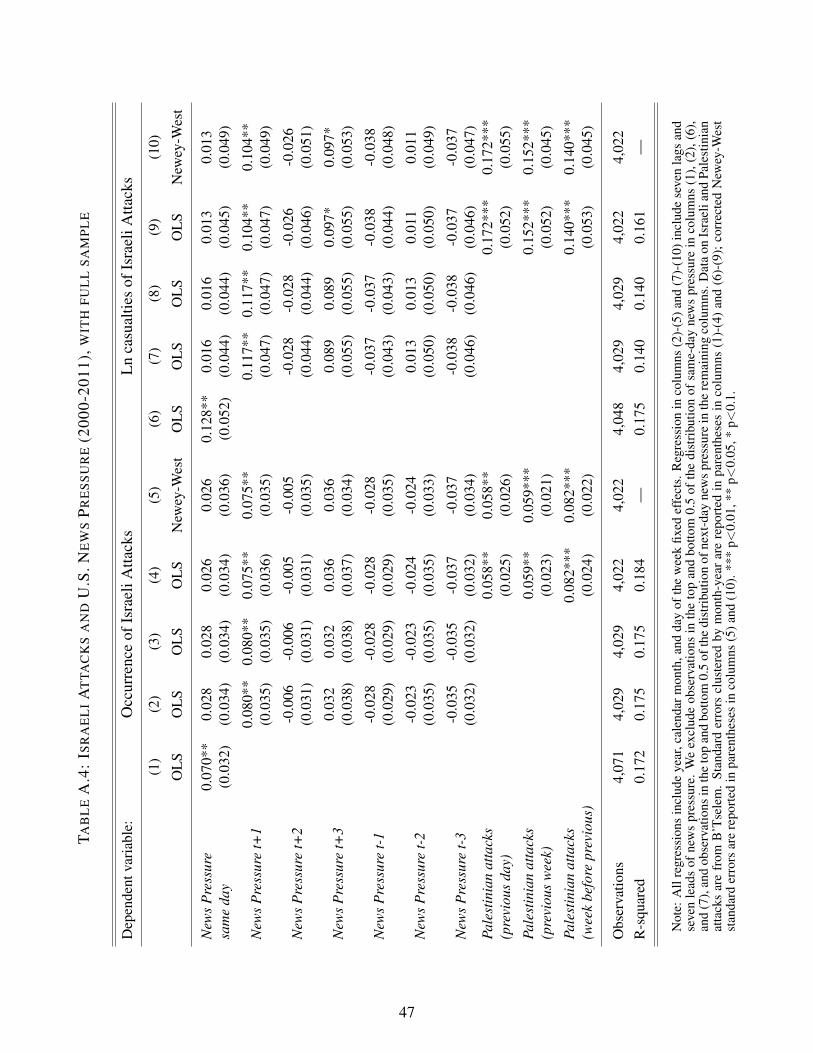
TAB
LE
A.4
:IS
RA
EL
IA
TTA
CK
SA
ND
U.S
.NE
WS
PR
ES
SU
RE
(200
0-20
11),
WIT
HF
UL
LS
AM
PL
E
Dep
ende
ntva
riab
le:
Occ
urre
nce
ofIs
rael
iAtta
cks
Ln
casu
altie
sof
Isra
eliA
ttack
s
(1)
(2)
(3)
(4)
(5)
(6)
(7)
(8)
(9)
(10)
OL
SO
LS
OL
SO
LS
New
ey-W
est
OL
SO
LS
OL
SO
LS
New
ey-W
est
New
sP
ress
ure
0.07
0**
0.02
80.
028
0.02
60.
026
0.12
8**
0.01
60.
016
0.01
30.
013
sam
eda
y(0
.032
)(0
.034
)(0
.034
)(0
.034
)(0
.036
)(0
.052
)(0
.044
)(0
.044
)(0
.045
)(0
.049
)
New
sP
ress
ure
t+1
0.08
0**
0.08
0**
0.07
5**
0.07
5**
0.11
7**
0.11
7**
0.10
4**
0.10
4**
(0.0
35)
(0.0
35)
(0.0
36)
(0.0
35)
(0.0
47)
(0.0
47)
(0.0
47)
(0.0
49)
New
sP
ress
ure
t+2
-0.0
06-0
.006
-0.0
05-0
.005
-0.0
28-0
.028
-0.0
26-0
.026
(0.0
31)
(0.0
31)
(0.0
31)
(0.0
35)
(0.0
44)
(0.0
44)
(0.0
46)
(0.0
51)
New
sP
ress
ure
t+3
0.03
20.
032
0.03
60.
036
0.08
90.
089
0.09
7*0.
097*
(0.0
38)
(0.0
38)
(0.0
37)
(0.0
34)
(0.0
55)
(0.0
55)
(0.0
55)
(0.0
53)
New
sP
ress
ure
t-1
-0.0
28-0
.028
-0.0
28-0
.028
-0.0
37-0
.037
-0.0
38-0
.038
(0.0
29)
(0.0
29)
(0.0
29)
(0.0
35)
(0.0
43)
(0.0
43)
(0.0
44)
(0.0
48)
New
sP
ress
ure
t-2
-0.0
23-0
.023
-0.0
24-0
.024
0.01
30.
013
0.01
10.
011
(0.0
35)
(0.0
35)
(0.0
35)
(0.0
33)
(0.0
50)
(0.0
50)
(0.0
50)
(0.0
49)
New
sP
ress
ure
t-3
-0.0
35-0
.035
-0.0
37-0
.037
-0.0
38-0
.038
-0.0
37-0
.037
(0.0
32)
(0.0
32)
(0.0
32)
(0.0
34)
(0.0
46)
(0.0
46)
(0.0
46)
(0.0
47)
Pale
stin
ian
atta
cks
0.05
8**
0.05
8**
0.17
2***
0.17
2***
(pre
viou
sda
y)(0
.025
)(0
.026
)(0
.052
)(0
.055
)
Pale
stin
ian
atta
cks
0.05
9**
0.05
9***
0.15
2***
0.15
2***
(pre
viou
sw
eek)
(0.0
23)
(0.0
21)
(0.0
52)
(0.0
45)
Pale
stin
ian
atta
cks
0.08
2***
0.08
2***
0.14
0***
0.14
0***
(wee
kbe
fore
prev
ious
)(0
.024
)(0
.022
)(0
.053
)(0
.045
)
Obs
erva
tions
4,07
14,
029
4,02
94,
022
4,02
24,
048
4,02
94,
029
4,02
24,
022
R-s
quar
ed0.
172
0.17
50.
175
0.18
4—
0.17
50.
140
0.14
00.
161
—
Not
e:A
llre
gres
sion
sin
clud
eye
ar,c
alen
darm
onth
,and
day
ofth
ew
eek
fixed
effe
cts.
Reg
ress
ion
inco
lum
ns(2
)-(5
)and
(7)-
(10)
incl
ude
seve
nla
gsan
dse
ven
lead
sof
new
spr
essu
re.
We
excl
ude
obse
rvat
ions
inth
eto
pan
dbo
ttom
0.5
ofth
edi
stri
butio
nof
sam
e-da
yne
ws
pres
sure
inco
lum
ns(1
),(2
),(6
),an
d(7
),an
dob
serv
atio
nsin
the
top
and
botto
m0.
5of
the
dist
ribu
tion
ofne
xt-d
ayne
ws
pres
sure
inth
ere
mai
ning
colu
mns
.Dat
aon
Isra
elia
ndPa
lest
inia
nat
tack
sar
efr
omB
’Tse
lem
.St
anda
rder
rors
clus
tere
dby
mon
th-y
ear
are
repo
rted
inpa
rent
hese
sin
colu
mns
(1)-
(4)
and
(6)-
(9);
corr
ecte
dN
ewey
-Wes
tst
anda
rder
rors
are
repo
rted
inpa
rent
hese
sin
colu
mns
(5)a
nd(1
0).*
**p<
0.01
,**
p<0.
05,*
p<0.
1.
47
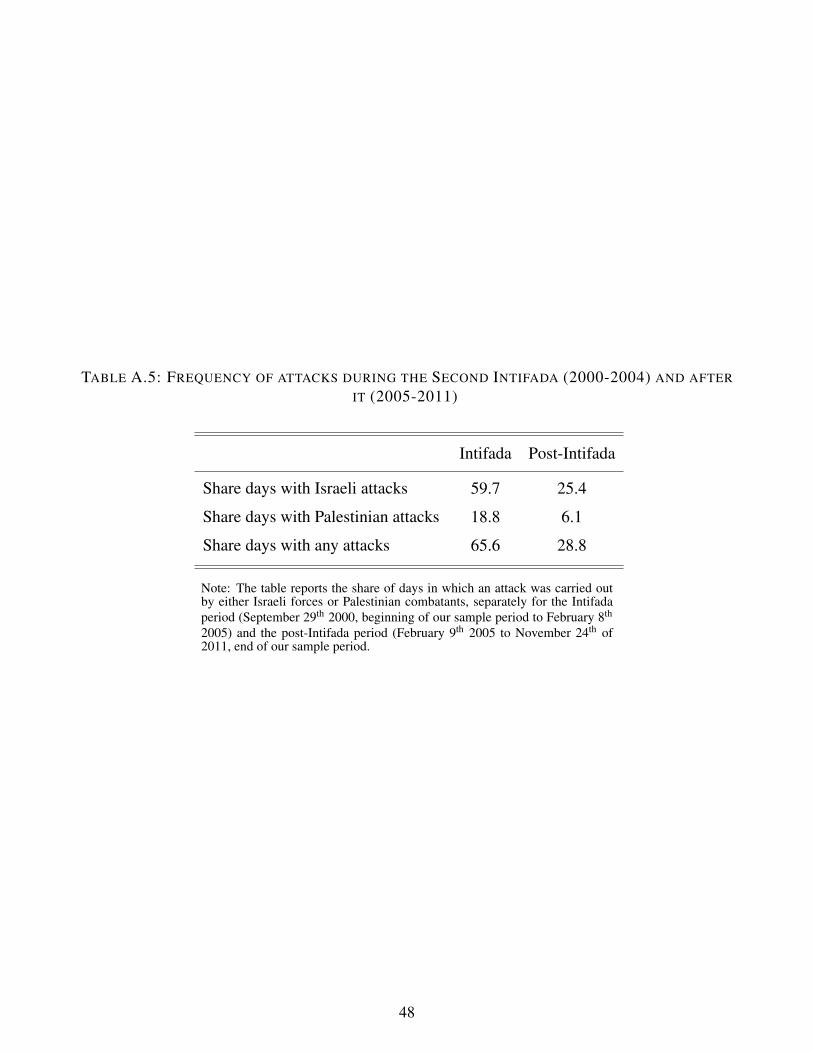
TABLE A.5: FREQUENCY OF ATTACKS DURING THE SECOND INTIFADA (2000-2004) AND AFTER
IT (2005-2011)
Intifada Post-Intifada
Share days with Israeli attacks 59.7 25.4
Share days with Palestinian attacks 18.8 6.1
Share days with any attacks 65.6 28.8
Note: The table reports the share of days in which an attack was carried outby either Israeli forces or Palestinian combatants, separately for the Intifadaperiod (September 29th 2000, beginning of our sample period to February 8th
2005) and the post-Intifada period (February 9th 2005 to November 24th of2011, end of our sample period.
48
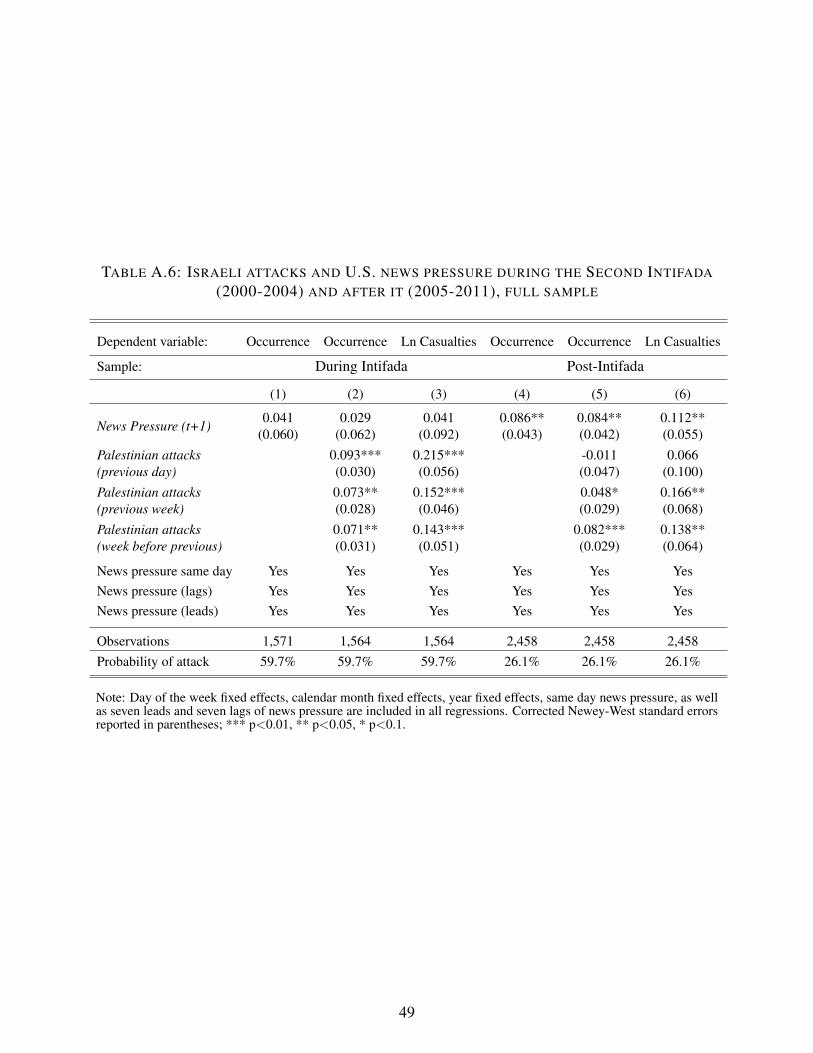
TABLE A.6: ISRAELI ATTACKS AND U.S. NEWS PRESSURE DURING THE SECOND INTIFADA
(2000-2004) AND AFTER IT (2005-2011), FULL SAMPLE
Dependent variable: Occurrence Occurrence Ln Casualties Occurrence Occurrence Ln Casualties
Sample: During Intifada Post-Intifada
(1) (2) (3) (4) (5) (6)
News Pressure (t+1)0.041 0.029 0.041 0.086** 0.084** 0.112**
(0.060) (0.062) (0.092) (0.043) (0.042) (0.055)Palestinian attacks 0.093*** 0.215*** -0.011 0.066(previous day) (0.030) (0.056) (0.047) (0.100)Palestinian attacks 0.073** 0.152*** 0.048* 0.166**(previous week) (0.028) (0.046) (0.029) (0.068)Palestinian attacks 0.071** 0.143*** 0.082*** 0.138**(week before previous) (0.031) (0.051) (0.029) (0.064)
News pressure same day Yes Yes Yes Yes Yes YesNews pressure (lags) Yes Yes Yes Yes Yes YesNews pressure (leads) Yes Yes Yes Yes Yes Yes
Observations 1,571 1,564 1,564 2,458 2,458 2,458Probability of attack 59.7% 59.7% 59.7% 26.1% 26.1% 26.1%
Note: Day of the week fixed effects, calendar month fixed effects, year fixed effects, same day news pressure, as wellas seven leads and seven lags of news pressure are included in all regressions. Corrected Newey-West standard errorsreported in parentheses; *** p<0.01, ** p<0.05, * p<0.1.
49
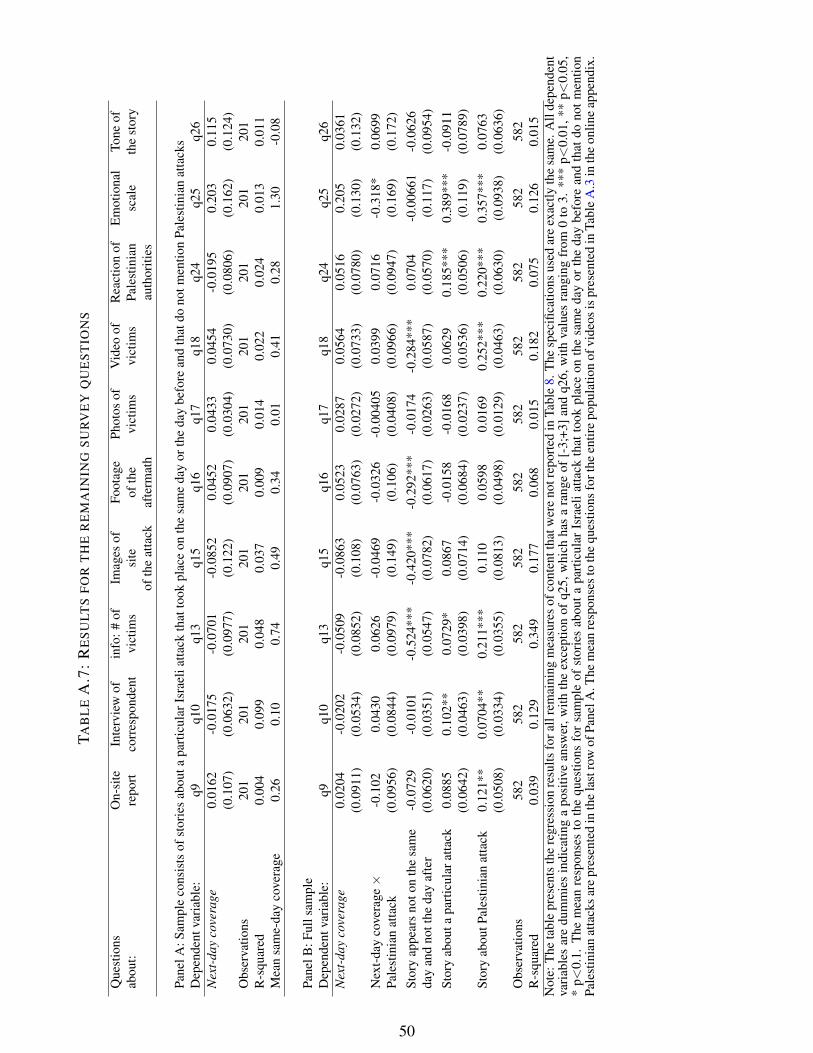
TAB
LE
A.7
:R
ES
ULT
SF
OR
TH
ER
EM
AIN
ING
SU
RV
EY
QU
ES
TIO
NS
Que
stio
nsO
n-si
teIn
terv
iew
ofin
fo:#
ofIm
ages
ofFo
otag
ePh
otos
ofV
ideo
ofR
eact
ion
ofE
mot
iona
lTo
neof
abou
t:re
port
corr
espo
nden
tvi
ctim
ssi
teof
the
vict
ims
vict
ims
Pale
stin
ian
scal
eth
est
ory
ofth
eat
tack
afte
rmat
hau
thor
ities
Pane
lA:S
ampl
eco
nsis
tsof
stor
ies
abou
tapa
rtic
ular
Isra
elia
ttack
that
took
plac
eon
the
sam
eda
yor
the
day
befo
rean
dth
atdo
notm
entio
nPa
lest
inia
nat
tack
sD
epen
dent
vari
able
:q9
q10
q13
q15
q16
q17
q18
q24
q25
q26
Nex
t-da
yco
vera
ge0.
0162
-0.0
175
-0.0
701
-0.0
852
0.04
520.
0433
0.04
54-0
.019
50.
203
0.11
5(0
.107
)(0
.063
2)(0
.097
7)(0
.122
)(0
.090
7)(0
.030
4)(0
.073
0)(0
.080
6)(0
.162
)(0
.124
)O
bser
vatio
ns20
120
120
120
120
120
120
120
120
120
1R
-squ
ared
0.00
40.
099
0.04
80.
037
0.00
90.
014
0.02
20.
024
0.01
30.
011
Mea
nsa
me-
day
cove
rage
0.26
0.10
0.74
0.49
0.34
0.01
0.41
0.28
1.30
-0.0
8
Pane
lB:F
ulls
ampl
eD
epen
dent
vari
able
:q9
q10
q13
q15
q16
q17
q18
q24
q25
q26
Nex
t-da
yco
vera
ge0.
0204
-0.0
202
-0.0
509
-0.0
863
0.05
230.
0287
0.05
640.
0516
0.20
50.
0361
(0.0
911)
(0.0
534)
(0.0
852)
(0.1
08)
(0.0
763)
(0.0
272)
(0.0
733)
(0.0
780)
(0.1
30)
(0.1
32)
Nex
t-da
yco
vera
ge×
-0.1
020.
0430
0.06
26-0
.046
9-0
.032
6-0
.004
050.
0399
0.07
16-0
.318
*0.
0699
Pale
stin
ian
atta
ck(0
.095
6)(0
.084
4)(0
.097
9)(0
.149
)(0
.106
)(0
.040
8)(0
.096
6)(0
.094
7)(0
.169
)(0
.172
)St
ory
appe
ars
noto
nth
esa
me
-0.0
729
-0.0
101
-0.5
24**
*-0
.420
***
-0.2
92**
*-0
.017
4-0
.284
***
0.07
04-0
.006
61-0
.062
6da
yan
dno
tthe
day
afte
r(0
.062
0)(0
.035
1)(0
.054
7)(0
.078
2)(0
.061
7)(0
.026
3)(0
.058
7)(0
.057
0)(0
.117
)(0
.095
4)St
ory
abou
tapa
rtic
ular
atta
ck0.
0885
0.10
2**
0.07
29*
0.08
67-0
.015
8-0
.016
80.
0629
0.18
5***
0.38
9***
-0.0
911
(0.0
642)
(0.0
463)
(0.0
398)
(0.0
714)
(0.0
684)
(0.0
237)
(0.0
536)
(0.0
506)
(0.1
19)
(0.0
789)
Stor
yab
outP
ales
tinia
nat
tack
0.12
1**
0.07
04**
0.21
1***
0.11
00.
0598
0.01
690.
252*
**0.
220*
**0.
357*
**0.
0763
(0.0
508)
(0.0
334)
(0.0
355)
(0.0
813)
(0.0
498)
(0.0
129)
(0.0
463)
(0.0
630)
(0.0
938)
(0.0
636)
Obs
erva
tions
582
582
582
582
582
582
582
582
582
582
R-s
quar
ed0.
039
0.12
90.
349
0.17
70.
068
0.01
50.
182
0.07
50.
126
0.01
5N
ote:
The
tabl
epr
esen
tsth
ere
gres
sion
resu
ltsfo
rall
rem
aini
ngm
easu
res
ofco
nten
ttha
twer
eno
trep
orte
din
Tabl
e8.
The
spec
ifica
tions
used
are
exac
tlyth
esa
me.
All
depe
nden
tva
riab
les
are
dum
mie
sin
dica
ting
apo
sitiv
ean
swer
,with
the
exce
ptio
nof
q25,
whi
chha
sa
rang
eof
[-3;
+3]
and
q26,
with
valu
esra
ngin
gfr
om0
to3.
***
p<0.
01,*
*p<
0.05
,*
p<0.
1.T
hem
ean
resp
onse
sto
the
ques
tions
for
sam
ple
ofst
orie
sab
outa
part
icul
arIs
rael
iatta
ckth
atto
okpl
ace
onth
esa
me
day
orth
eda
ybe
fore
and
that
dono
tmen
tion
Pale
stin
ian
atta
cks
are
pres
ente
din
the
last
row
ofPa
nelA
.The
mea
nre
spon
ses
toth
equ
estio
nsfo
rthe
entir
epo
pula
tion
ofvi
deos
ispr
esen
ted
inTa
ble
A.3
inth
eon
line
appe
ndix
.
50

FIGURE A.1: FRONT-PAGE PRESS COVERAGE OF
UNPOPULAR GOVERNMENT ACTIONS AT THE TIME OF IMPORTANT SPORTS EVENTS
Example 1: Beijing Olympics and Russia-Georgia war
Example 2: FIFA World cup and Israeli attack on Gaza
Example 3: FIFA World cup and “Save the Thief” Decree
51
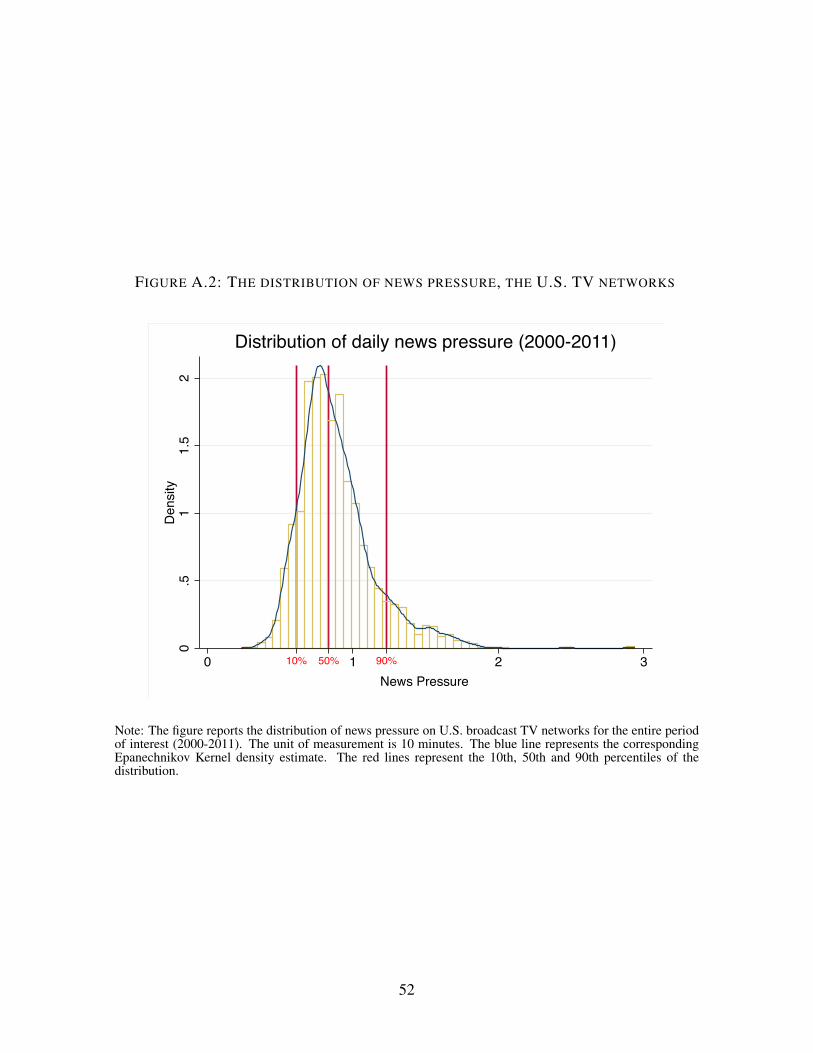
FIGURE A.2: THE DISTRIBUTION OF NEWS PRESSURE, THE U.S. TV NETWORKS
0.5
11.
52
Den
sity
0 1 2 350%10% 90%
News Pressure
Distribution of daily news pressure (2000-2011)
Note: The figure reports the distribution of news pressure on U.S. broadcast TV networks for the entire periodof interest (2000-2011). The unit of measurement is 10 minutes. The blue line represents the correspondingEpanechnikov Kernel density estimate. The red lines represent the 10th, 50th and 90th percentiles of thedistribution.
52
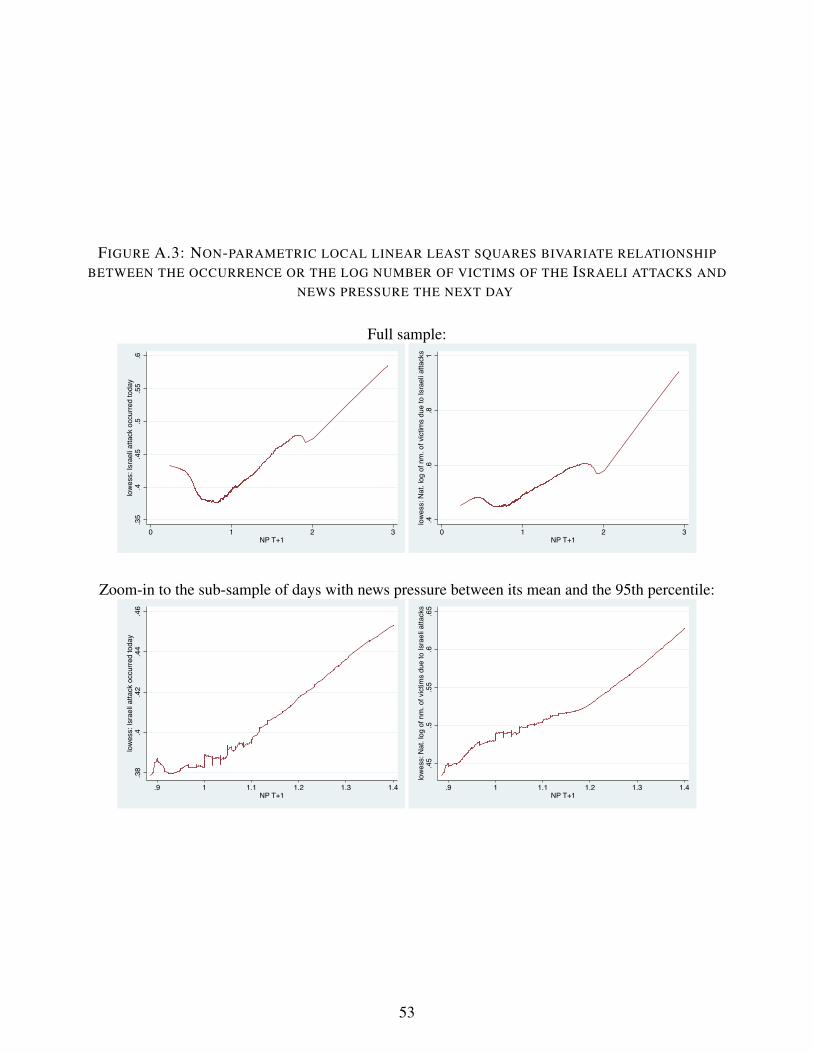
FIGURE A.3: NON-PARAMETRIC LOCAL LINEAR LEAST SQUARES BIVARIATE RELATIONSHIP
BETWEEN THE OCCURRENCE OR THE LOG NUMBER OF VICTIMS OF THE ISRAELI ATTACKS AND
NEWS PRESSURE THE NEXT DAY
Full sample:
.35
.4.4
5.5
.55
.6lo
wes
s: Is
rael
i atta
ck o
ccur
red
toda
y
0 1 2 3NP T+1
.4.6
.81
low
ess:
Nat
. log
of n
m. o
f vic
tims
due
to Is
rael
i atta
cks
0 1 2 3NP T+1
Zoom-in to the sub-sample of days with news pressure between its mean and the 95th percentile:
.38
.4.4
2.4
4.4
6lo
wes
s: Is
rael
i atta
ck o
ccur
red
toda
y
.9 1 1.1 1.2 1.3 1.4NP T+1
.45
.5.5
5.6
.65
low
ess:
Nat
. log
of n
m. o
f vic
tims
due
to Is
rael
i atta
cks
.9 1 1.1 1.2 1.3 1.4NP T+1
53
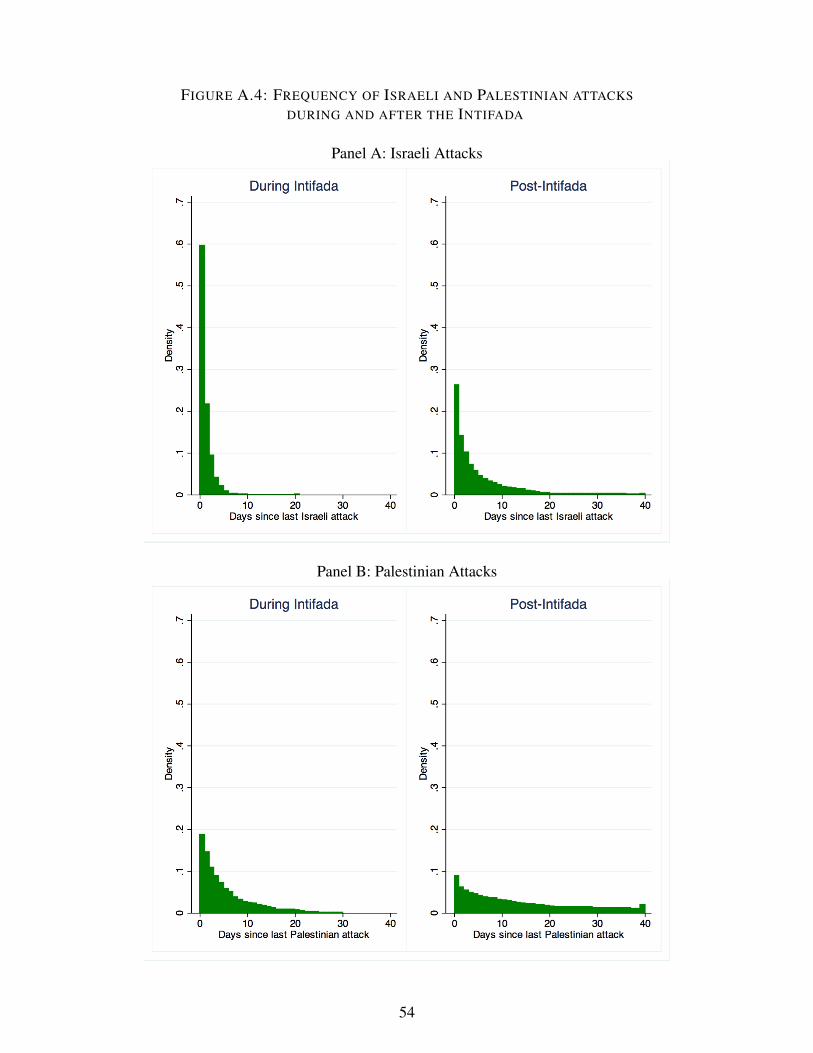
FIGURE A.4: FREQUENCY OF ISRAELI AND PALESTINIAN ATTACKS
DURING AND AFTER THE INTIFADA
Panel A: Israeli Attacks
Panel B: Palestinian Attacks
54