section 1 introduction - lockheedmartin.co.uk · on behalf of lockheed martin corporation ......
TRANSCRIPT

7903 TETRA TECH • LOCKHEED MARTIN MIDDLE RIVER COMPLEX •2012 ADDITIONAL BLOCK E SOIL INVESTIGATION REPORT PAGE 1-1
Section 1
Introduction
On behalf of Lockheed Martin Corporation (Lockheed Martin), Tetra Tech Inc. (Tetra Tech) has
prepared the following report documenting a 2012 additional investigation to further identify and
evaluate the horizontal and vertical extent of polychlorinated biphenyls (PCBs), polycyclic
aromatic hydrocarbons (PAHs), volatile organic compounds (VOCs), petroleum hydrocarbons,
and metals in Block E soil at the Lockheed Martin Middle River Complex (MRC) in Baltimore
County, Middle River, Maryland (Figure 1-1). Chlorinated volatile organic compounds
(e.g., trichloroethene [TCE] and trichloroethene degradation products) detected in groundwater
in the eastern portion of Block E are being addressed under separate studies. Evaluation of
Block E soil data indicate widespread detections of polychlorinated biphenyls at levels greater
than the U.S. Environmental Protection Agency’s (USEPA’s) most-protective recommended soil
cleanup level of one milligram per kilogram (mg/kg) (USEPA, 1990 and 2005), with higher
concentrations found in some soil borings both within and outside of the former Building D
footprint.
Prior data indicate elevated concentrations of polychlorinated biphenyls in the southwestern
portion of the former Building D, with the highest polychlorinated biphenyl concentrations of
19,000 and 24,000 milligrams per kilogram at depths between seven and 12 feet below grade.
Volatile organic compounds in this area appear to be commingled with the polychlorinated
biphenyl contamination. Polychlorinated biphenyls are also found at the locations of former
cleaning and plating rooms where lubricating or cutting oils may have been used, and south of
the former Building D in the area of a former fuel storage tank.
Polycyclic aromatic hydrocarbons have also been detected in storm-drain sediments and in
surface soil and subsurface soil (e.g., greater than 10 feet deep) at the site. Volatile organic
compounds and metals have likewise been detected in soil at levels exceeding risk screening

7903 TETRA TECH • LOCKHEED MARTIN MIDDLE RIVER COMPLEX •2012 ADDITIONAL BLOCK E SOIL INVESTIGATION REPORT PAGE 1-2
criteria. However, polychlorinated biphenyls are most widespread in Block E, and account for
most potential risk to human health from contaminants at the site.
The federal Toxic Substances Control Act (TSCA) requires that the extent of site contamination
is identified to evaluate remedial alternatives. The primary objective of this Block E
investigation is to better identify and evaluate the horizontal and vertical extent of
polychlorinated biphenyls, polycyclic aromatic hydrocarbons, volatile organic compounds,
petroleum hydrocarbons, and metals in soils. These data will be used in an updated human health
risk assessment and in remedy selection. A secondary objective is to better understand the
existing concrete slab underlying the former Building D, and its possible influence on impacted
soils and their possible migration pathways.
A concurrent radiological survey and sampling program was undertaken at Block E during the
sampling described herein. Objectives were to assess worker safety and identify whether
radioactive constituents remain from past activities at a former nuclear laboratory that once
operated in the basement of Building D. The methods and results of the Block E radiological
program are included in Appendix A.
The 2012 Block E program entailed the following activities:
performed high-resolution, subsurface, electrical resistivity imaging, focusing within thesouthwest quadrant of the former Building D that covered approximately 600 feet by270 feet, with a 1.5-meter electrode, 60-foot grid-spacing, and obtaining 18 images to amaximum depth of 55 feet below grade
collected concrete surface samples at 40 locations from the former Building D concreteslab to evaluate current risk to site workers from exposure to polychlorinated biphenyls.Six concrete samples were also analyzed for asbestos for waste characterization purposes.
advanced shallow soil borings at 28 locations to four feet below grade to furtherinvestigate polychlorinated biphenyls and polycyclic aromatic hydrocarbons in soil alongthe periphery of the former Building D foundation. Metals were also sampled at seven ofthese locations.
advanced deep soil borings at six locations (based on the geophysical survey results) todepths of 40–50 feet below grade to further characterize polychlorinated biphenyls,polycyclic aromatic hydrocarbons, volatile organic compounds, total petroleumhydrocarbons, and metals in soil in areas near the former waste disposal area and formertransformer room

7903 TETRA TECH • LOCKHEED MARTIN MIDDLE RIVER COMPLEX •2012 ADDITIONAL BLOCK E SOIL INVESTIGATION REPORT PAGE 1-3
collected 77 samples from concrete, surface, and shallow soil, including background soiland concrete samples, and analyzed for isotopic uranium and thorium (Appendix A)
collected shallow groundwater samples from soil borings for chemical analyses and field-parameter measurements
collected groundwater levels from Block E wells
performed laboratory chemical analyses and chemical-data validation of soil samples
additionally, reviewed historical maps and figures to gain insight into the constructionand locations of underground utilities at former Building D, and to assess historicaloperations that may have led to the release of the identified contaminants of concern(COC).
This report is organized as follows:
Section 2Site Background: Briefly describes site history, subsurface conditions, andprevious investigations.
Section 3Investigation Approach and Methodology: Describes the investigation’s technicalapproach and field methodologies.
Section 4Results: Discusses the data evaluation and results for the 2012 investigation andthe site-wide distributions of primary site contaminants.
Section 5Block E Southwestern Area Conceptual Site Model for PolychlorinatedBiphenyls: Develops a conceptual site model describing site conditions, past operations, andpotential pathways to evaluate the current distribution of polychlorinated biphenyls in thesouthwestern portion of Block E
Section 6Summary: Summarizes the investigation findings.
Section 7References: Cites references used in compiling this report.

[_
Middle River
Frog Mortar Creek
Stansbury CreekDark Head
Cove
Martin State Airport
Eastern Boulevard
Cow Pen Creek
Middle River Complex
0 50 10025
Miles
Source: Google Earth Pro, 2008
!(Baltimore
!(
Middle River
±DATE MODIFIED: CREATED BY:
4/28/11 MP
Lockheed Martin Middle River ComplexMiddle River, Maryland
FIGURE 1-1
MIDDLE RIVER COMPLEX
LOCATION MAP
±
0 4,200 8,400Feet
Map Document: (K:\GProject\middle_river\Maps\MiddleRiver_MRC_Location Map_042811.mxd)4/28/2011 -- 11:09:59 AM

7903 TETRA TECH • LOCKHEED MARTIN MIDDLE RIVER COMPLEX •2012 ADDITIONAL BLOCK E SOIL INVESTIGATION REPORT PAGE 2-1
Section 2
Site Background
2.1 MIDDLE RIVER COMPLEX BACKGROUND
2.1.1 Location
The Middle River Complex (MRC), part of the Chesapeake Industrial Park, is at 2323 Eastern
Boulevard in Middle River, Maryland, approximately 11.5 miles northeast of downtown
Baltimore. The MRC covers approximately 161 acres and is comprised of 12 main buildings, an
active industrial area and yard, perimeter parking lots, an athletic field, a vacant concrete lot, a
trailer and parts storage lot, and numerous grassy spaces along the perimeter (Figure 2-1). The
MRC is bounded by Eastern Boulevard (Maryland Route 150) to the north, Dark Head Cove to
the south, Cow Pen Creek to the west, and Martin State Airport to the east. As shown in
Figure 2-1, the property is currently divided into eight tax parcels (Tax Blocks A, B, and D
through I).
2.1.2 History and Operations
In 1929, Glenn L. Martin Company, a Lockheed Martin Corporation (Lockheed Martin)
predecessor entity, acquired a large parcel of undeveloped land in Middle River, Maryland, to
manufacture aircraft for the United States government and commercial clients. In the early
1960s, Glenn L. Martin Company merged with American-Marietta Company to form Martin
Marietta Corporation. Around 1975, the adjacent eastern airport (Martin State Airport), totaling
approximately 750 acres, was transferred to the State of Maryland. In the mid-1990s, Martin
Marietta merged with Lockheed Corporation to form Lockheed Martin Corporation, specializing
in equipment fabrication and testing for the United States government and commercial clients.
Shortly after the merger, General Electric Company acquired most of Lockheed Martin’s
aeronautical business in Middle River and its subsidiary, MRA Systems, Inc., and began
operating on site as Middle River Aircraft Systems (MRAS).
7903 TETRA TECH • LOCKHEED MARTIN MIDDLE RIVER COMPLEX •2012 ADDITIONAL BLOCK E SOIL INVESTIGATION REPORT PAGE 2-2
Lockheed Martin subsidiary LMC Properties, Inc., (LMCPI) is the present owner of the site.
LMCPI site activities include facility and building management and maintenance. Two principal
tenants occupy the site: MRAS and Mission Systems & Sensors—Ships & Aviation Systems
(MS2—S&AS). MRAS designs, manufactures, fabricates, tests, overhauls, repairs, and
maintains aeronautical structures, parts, and components for military and commercial
applications. MS2—S&AS, a division of Lockheed Martin Corporation, designs systems for sea
and airborne applications.
2.1.3 Surrounding Land Use
The MRC is an industrial facility surrounded primarily by commercial, industrial, and residential
establishments (see Figure 2-1). Six facilities adjacent to the MRC comprise the remaining
portion of the Chesapeake Industrial Park. These include Tilley Chemical Company, Inc. (a food
and pharmaceutical chemical distributor), North American Electric, Inc. (an industrial and
commercial electrical contractor), Johnson and Towers (a heavy-duty automotive and boat repair
and maintenance company), Poly Seal Corp. (a flexible-packaging producer), Exxon (a gasoline
filling station and convenience store), and the Middle River Post Office. Residential
developments are on the opposite shores of Cow Pen Creek, Dark Head Cove, and Dark Head
Creek, and north of Eastern Boulevard (Route 150).
2.1.4 Physiography
Tax Block E lies in the Western Shore of the Coastal Plain physiographic province. Coastal Plain
topography is generally characterized by low relief. The MRC’s topography slopes gently from
approximately 32 feet above sea level down to sea level. The topography slopes from Eastern
Boulevard to the southwest and south toward Cow Pen Creek and Dark Head Cove.
2.1.5 Soils
Soils underlying the MRC have been mapped by the United States Department of Agriculture
(USDA) Soil Conservation Service as Mattapex-Urban Land Complex and Sassafras-Urban
Land Complex. Mattapex-Urban Land soils consist of deep, well-drained, silty soils, the original
texture of which has been disturbed, graded over, or otherwise altered before construction.
Sassafras-Urban Land soils consist of deep, well-drained, sandy soils, the original texture of
which has been disturbed, graded over, or otherwise altered before construction (USDA, 1993).
7903 TETRA TECH • LOCKHEED MARTIN MIDDLE RIVER COMPLEX •2012 ADDITIONAL BLOCK E SOIL INVESTIGATION REPORT PAGE 2-3
MRC site assessments, however, indicate that soils in many areas of the site contain very high
clay and silt content, with poor surface drainage.
2.1.6 Hydrology
The MRC is at the junction of Cow Pen Creek and Dark Head Cove (see Figure 2-1). Both of
these surface water bodies discharge into Dark Head Creek, a tributary to Middle River, which is
a tributary to Chesapeake Bay. The MRC is approximately 3.24 miles (17,100 feet) upstream of
Chesapeake Bay.
The MRC has no surface water bodies on site. Excluding areas immediately adjacent to Cow Pen
Creek and Dark Head Cove, surface-water runoff discharges from the facility via storm drains.
Lockheed Martin maintains a National Pollutant Discharge Elimination System (NPDES) permit
(state discharge permit No. 00-DP-0298, NPDES No. MD0002852) issued by the Maryland
Department of the Environment (MDE) Industrial Discharge Permits Division, Water
Management Administration. The permit covers storm water discharge from the entire property,
rather than from individual tenants.
2.1.7 Geology
Geologic mapping of Baltimore County shows that the MRC is underlain by the Potomac Group,
a Cretaceous Age interbedded gravel, sand, silt, and clay unit ranging from zero to 800 feet thick.
The Potomac Group is composed of three units: the Raritan and Patapsco Formations, the
Arundel Clay, and the Patuxent Formation. The Raritan and Patapsco Formations range up to
400 feet thick and are composed of a gray, brown, and red variegated silt and clay unit with
lenses of sand and few gravels. The Arundel Clay is composed of dark gray and maroon
lignitic-clays ranging from 25 to 200 feet thick. The Patuxent Formation is described as a white
or light gray to orange brown, moderately sorted sand unit with quartz gravels, silts, and clays up
to 250 feet thick.
Lithologic logging of the soils beneath the MRC has identified a very heterogeneous
stratigraphy. Figure 2-2 shows the locations of geologic cross-sections constructed for the MRC.
Figures 2-3 through 2-5 are generalized geologic cross-sections showing the materials
encountered during the drilling of the MRC wells, including four deep wells (MW-93D,
MW-94D, MW-95D, and MW-96D).
7903 TETRA TECH • LOCKHEED MARTIN MIDDLE RIVER COMPLEX •2012 ADDITIONAL BLOCK E SOIL INVESTIGATION REPORT PAGE 2-4
Overall, the investigation results indicate complex arrangements of predominantly clay, silty
clay, silt, and clayey silt, with smaller, more permeable zones of silty sand and sand. Thick
sequences of low permeability clay, silty clay, clayey silt, and silt are found in the northern
two-thirds of the MRC. These clayey and silty materials extend from MW-3 to the area between
MW-60 and MW-94D.
As shown in Figure 2-3, the lithologic data for MW-93D, MW-94D, and MW-96D indicate clay
up to 50 feet thick underlying the surficial aquifer at 15 to 60 feet below mean sea level (msl) at
well MW-93D, and 60 to 110 feet below msl at MW-94D and MW-96D. Below this clay zone is
a series of thinner alternating layers of sand and clay. Seventy-three feet of continuous clay were
encountered at MW-93D, beginning at an elevation of 164 feet below msl and ending at an
elevation of approximately 237 feet below msl.
Directly overlying the 73 feet of clay is seven feet of sand, followed by 11 feet of overlying clay
and sand layers (clay thickness totaling eight feet) from 146 to 157 feet below msl. Below the
73-feet-thick clay layer is 14 feet of silty and clayey fine sand, followed by 15 feet of clay from
251 to 266 feet below msl. The thickness of the deep clay and interlayer sand/silt (123 feet) is
consistent with the Arundel Formation’s thickness (50 to 125 feet) in this area, as reported by
Chapelle (1985) and Vroblesky and Fleck (1991). However, the basal altitude of the clay (at
266 feet below msl) is somewhat lower than the altitude of 200 feet below msl reported by these
two sources.
In the northern portion of the site (Figure 2-3), clay is encountered in the first 25 feet at
MW-93D, thickening to approximately 40 feet to the south at well MW-57 near Building C.
Boring logs indicate that this thick upper zone of clayey material terminates to the south along an
east–west line formed roughly by MW-27, MW-25, and MW-22. Interbedded sands, silty sands,
sandy silts, and silts are encountered south of Buildings A, B, and C (Figure 2-2). Several feet of
sandy and silty materials overlie the shallow clay at MW-55 and MW-57 (Figure 2-3). These
sandy and silty materials thicken to the south/southeast in the area of MW-60, MW-27, MW-79,
and MW-34. The sandy materials are approximately 50 to 60 feet thick in the area from MW-27
to MW-34 and overlie a lower clay confining-unit at 55 to 60 feet below msl.
7903 TETRA TECH • LOCKHEED MARTIN MIDDLE RIVER COMPLEX •2012 ADDITIONAL BLOCK E SOIL INVESTIGATION REPORT PAGE 2-5
In the southwestern portion of the MRC (Figures 2-4 and 2-5), silty sands and sandy silts are
encountered in the upper several feet of subsurface soil in the area of wells MW-12 to MW-56,
to the northeast. A lower sandy unit at 50 feet below msl at MW-14 appears to be contiguous
with sand encountered at MW-12 and MW-95D to the southwest. The upper silty sand unit and
the lower sand unit are separated by approximately 30 to 35 feet of clay and/or silt.
Figure 2-4 also indicates geologic sequences at well MW-95D similar to those of MW-93D.
Similar to MW-93D, the lithology at MW-95D shows primarily clay from the ground surface to
50 feet below msl, followed by a thick sand zone (split by clay and silt layers) from
approximately 60 feet below msl to approximately 140 feet below msl. At MW-95D, relatively
continuous clay is encountered at approximately 150 to 226 feet below msl. However, a
14-feet-thick sand layer was encountered in MW-95D from approximately
190 to 204 feet below msl. Thick clay layers are above and below the sand units monitored by
the deep wells at all MRC deep-well locations. The sand zones monitored by the deep wells are
therefore considered hydraulically confined.
2.1.8 Hydrogeology
Sand and gravel zones in the unconsolidated surficial deposits, when present, may form an
unconfined or water table aquifer system (Bennett and Meyer, 1952). The water table at the
MRC generally conforms to the land surface, with the highest water levels in the interior land
areas and the lowest levels at approximately the surface water elevations along the shoreline. The
Patuxent Formation is the most important water-bearing formation in the Baltimore area.
Industrial wells in the southeastern part of the area, specifically Curtis Bay and Sparrows Point,
yield from 500 to 900 gallons per minute (gpm). Transmissivities and storage coefficients in
confined portions of the aquifer in these industrialized areas average about 50,000 gallons per
day per foot (g/d/ft) and 0.00026 (unitless), respectively.
The Patapsco Formation is also an important water-bearing formation in industrialized Baltimore,
where it is separated by clay into a lower and upper aquifer. The lower aquifer yields as much as
500 to 750-gpm to industrial wells, with an estimated transmissivity of 25,000 g/d/ft (Bennett and
Meyer, 1952). The upper aquifer yields quantities of water similar to industrial wells, and likely
has a higher overall transmissivity because it is thicker than the lower aquifer.

7903 TETRA TECH • LOCKHEED MARTIN MIDDLE RIVER COMPLEX •2012 ADDITIONAL BLOCK E SOIL INVESTIGATION REPORT PAGE 2-6
Groundwater at MRC is encountered at depths ranging from less than one foot to nearly
18 feet below ground surface (bgs). To the southeast, groundwater preferentially flows to the
southeast within sandy strata, which extend from MW-55 and MW-57, toward the thicker sandy
material at MW-27 and MW-37. Approximately 65 to 70 feet of saturated sandy material lies
above the lower confining-clay in this area.
The lower portion of the aquifer in the area of MW-34 and MW-37 is divided by silt and silty
clay at 20 to 30 feet below msl. Deeper groundwater may be under hydraulically confined
conditions in this area. To the southwest, shallow groundwater flows through the sandy and silty
materials that extend from MW-21 to MW-12 and Cow Pen Creek. Approximately 13 to 18 feet
of saturated sandy material is in this area.
Single-well permeability tests (slug tests) were conducted in 2005 in 28 wells selected to
represent variability across the site. The average hydraulic conductivity (i.e., soil permeability)
reported for the shallow wells is low, ranging from 0.0027 feet per day (ft/d) at MW-57 to
1.25 ft/d at MW-66A. The arithmetic-average hydraulic conductivity for the shallow wells is
0.22 ft/d. These results are consistent with published permeabilities of sand and silt mixtures
(Spitz and Moreno, 1996; Halford and Kuniansky, 2002) reported for these locations. Lower
hydraulic conductivities were reported for shallow wells to the south (MW-55A through
MW-62A) and west (MW-52A through MW-54A, and MW-64A).
Except for MW-27B, hydraulic conductivity values for the intermediate wells are more
consistent than those of the shallow wells, with an arithmetic average of 0.48 ft/d and a
geometric mean of 0.22 ft/d. The intermediate-well permeabilities are consistent with lower
values for clean sand or typical values of sand and silt mixtures. Hydraulic conductivities for the
deep wells (except for well MW-37C) range from 0.35 to 9.16 ft/d. The average
hydraulic-conductivity of the deeper wells (3.82 ft/d) is approximately 10 times the average
hydraulic conductivity for the shallow and intermediate zones. The geometric-mean hydraulic
conductivity for deep wells is 0.89 ft/d; if the low permeability at MW-37C is eliminated as an
outlier, the geometric-mean hydraulic conductivity is 3.02 ft/d.
7903 TETRA TECH • LOCKHEED MARTIN MIDDLE RIVER COMPLEX •2012 ADDITIONAL BLOCK E SOIL INVESTIGATION REPORT PAGE 2-7
2.2 BLOCK E SITE CHARACTERISTICS
2.2.1 History and Operations
The MRC has been used historically to design, develop, assemble, and test aircraft and missile
launching systems. Block E (15.97 acres), in the southern portion of the MRC (Figure 2-1), is the
site of former Building D. It was built in the early 1940s for final assembly of aircraft frames and
demolished between 1970 and 1974 according to available records. The building had an
assembly floor (first floor) and a basement (current concrete slab) and occupied approximately
400,000 square feet. Figure 2-6 shows former Building D as it existed in 1944.
Historical engineering maps obtained from files at the MRC show the former basement areas
were used for welding, extrusion milling, engine preparation, and assembly (Figure 2-7). Former
elevators and former heater rooms are shown along the interior northern, eastern, and southern
perimeter areas and former electrical transformer rooms are shown along the interior northern
and southern building perimeter areas. As shown in the engineering maps, the northwestern and
southwestern portions of the basement housed several nuclear-related offices and laboratories.
The maps also show cleaning, plating, and finishing work areas along the southern interior wall
near the building’s center, and waste disposal and radioisotope outbuildings in the southwestern
corner of Building D.
Former Building D occupied approximately half of Block E. The building foundation remains and
appears to be composed of relatively intact concrete slabs (Figure 2-7). Ceramic tiles overlie the
concrete foundation in areas corresponding to the former cafeteria, cleaning/plating, and finishing
rooms.
The area occupied by former Building D has not been redeveloped since the building was
demolished. No records have been found regarding when the demolition of Building D occurred.
Evidence suggests that Building D was demolished sometime between 1970 and 1974. Building D
was present in a 1970 aerial photograph but not in a 1974 aerial photograph. Nuclear Regulatory
Commission records indicate that the pre-decontamination and post-contamination survey of the
Building D was performed in 1970 to support the facility decontamination license application.
Portions of the former Building D area currently store lowboy trailers and airplane carcasses
belonging to the Martin State Airport air museum. A shed to store sand and road salt is in the
7903 TETRA TECH • LOCKHEED MARTIN MIDDLE RIVER COMPLEX •2012 ADDITIONAL BLOCK E SOIL INVESTIGATION REPORT PAGE 2-8
northwestern corner of the former Building D footprint. A 500,000-gallon aboveground storage tank
(AST) and pump-house are in the southeastern corner of Block E. The tank stores water as a backup
supply for the MRC fire suppression system. Tilley Chemical Company stores tractor-trailers on the
concrete apron in the southwestern corner of Block E.
2.2.2 Block E Recognized Environmental Conditions andContaminants of Concern
Three recognized environmental conditions (RECs) identified in the Phase I environmental site
assessment (ESA) are in Block E: REC #1 (former Building D), REC #2 (product pipeline), and
REC #3 (former 500,000-gallon AST and associated tanks). The product pipeline (REC #2) is a
1,815-foot long, two-inch-diameter pipe running underground from a former 500,000-gallon diesel
fuel oil AST (REC #3) to the MRC power plant in Block I. The former 500,000-gallon fuel AST
and associated tanks of REC #3 were on a grassy shoulder in the southeastern portion of Block E,
directly west of the current water AST and pump house (Figure 2-7). The 500,000-gallon fuel AST
was surrounded by a shallow, grassy, earthen berm.
A human health risk assessment (HHRA) for Block E soil (Tetra Tech, 2012a) identified
polychlorinated biphenyls (PCBs), polycyclic aromatic hydrocarbons (PAHs), and the volatile
organic compounds (VOCs) 1,2,3-trichlorobenzene (123-TCB), 1,2,4-trichlorobenzene
(124-TCB), and 1,4-dichlorobenzene (14-DCB) as primary contaminants of concern (COC) for
Block E soil. Arsenic (As) and hexavalent chromium (CrVI) were also identified as COC, but
arsenic concentrations were considered to represent background concentrations and account for
less overall risk than the other COC. Groundwater along the eastern portion of Block E also
contains chlorinated VOCs (i.e., the degreasing solvent trichloroethene [TCE], and breakdown
products dichloroethenes and vinyl chloride [VC]) at concentrations above Maryland
groundwater standards.
2.3 SUMMARY OF BLOCK E INVESTIGATIONS
Earlier Block E environmental investigations date from 2003 and include record reviews,
discussions with MRC personnel, geophysical surveys, and chemical analyses of soil, concrete,
storm sewer sediment, and groundwater samples. An HHRA, a subsurface utility
cross-connection (UCC) study, and an interim remedial measure (IRM) removal action for the
storm sewer have been completed. The results of these environmental studies and the HHRA
7903 TETRA TECH • LOCKHEED MARTIN MIDDLE RIVER COMPLEX •2012 ADDITIONAL BLOCK E SOIL INVESTIGATION REPORT PAGE 2-9
indicate that several constituents are in soil, concrete, sediment, and groundwater at Block E at
concentrations exceeding human-health risk-based levels. The HHRA found that the primary
COC in Block E include:
PCBs in concrete
PCBs, PAHs, VOCs, and metals in soil and storm sewer sediment
VOCs (TCE and TCE-degradation products) in groundwater
VOCs in groundwater in the eastern portion of Block E are being addressed under separate
studies, so this report does not include tasks to investigate VOCs in groundwater at Block E.
Although not a COC in groundwater, Aroclor-1254 (a PCB) was detected in 2011 in a
groundwater sample from well MW-43A at a concentration of 0.24-micrograms per liter (µg/L),
which is below the Maryland groundwater standard of 0.5 µg/L. PCBs were not detected in the
groundwater sample collected from well MW-43A in 2012.
Block E studies to date include:
Phase I Environmental Site Assessment (ESA) (Earth Tech, Inc., 2003)
Phase II Site Investigation of Exterior Areas (Tetra Tech, Inc. [Tetra Tech], 2004a)
Radiological Survey, Building D (REC #1) (Tetra Tech, 2004b)
Site-Wide Phase II Investigation (Tetra Tech, 2005)
Phase II Soil Investigation (included in Tetra Tech, 2006)
Site Characterization (Tetra Tech, 2006)
Additional Field Investigation (Tetra Tech, 2011)
Supplemental Soil and Storm Drain Sediment Characterization (Tetra Tech, 2010)
Data Gap Investigation (Tetra Tech, 2011)
Human Health Risk Assessment for Blocks D, E, F, G, and H Soils (Tetra Tech, 2012a)
Additional Block E Soil Characterization Report (Tetra Tech, 2012b)
Human Health Risk Assessment Update for Block E Soils (Tetra Tech, 2012c)
Utility Cross-Connection Report (Tetra Tech, 2012d)

7903 TETRA TECH • LOCKHEED MARTIN MIDDLE RIVER COMPLEX •2012 ADDITIONAL BLOCK E SOIL INVESTIGATION REPORT PAGE 2-10
Block E Storm Drain System Interim Remedial Measures Final Site Remediation Report(Tetra Tech, 2012f)
Injection Pilot Test Report (Tetra Tech, 2012g)
Block E and G Pre-Design Soil Sampling Investigation Report (Tetra Tech, 2012h)
Concrete and soil samples were also collected from Block E in 2012 and analyzed for radiation
and radionuclides. Results of that study will be presented in a separate report. Details of the
studies listed above are provided in the following sections. Details are also provided in tabular
form in chronological order (Table 2-1).
2.3.1 Phase I Environmental Site Assessment (Winter 2003)
Earth Tech, Inc. (Earth Tech) conducted a Phase I ESA of the MRC in February 2003
(Earth Tech, 2003). It consisted of a historical review of the MRC (i.e., a review of MRC
documents, aerial photographs, and city directories), a review of federal, state, and local agency
databases, interviews with MRC personnel, and a site visit. The Phase I ESA identified 13 RECs
at the MRC, including the three RECs in Block E (REC #1, REC #2, and REC #3). The Phase I
ESA also recommended further investigation into the MRC’s historical activities to identify other
potential environmental concerns.
2.3.2 Phase II Site Investigation of Exterior Areas (Fall/Winter 2003)
Tetra Tech conducted a Phase II investigation in autumn 2003 consisting of soil and groundwater
sampling and analysis and a geophysical survey of seven of the 13 Phase I ESA RECs (Tetra
Tech, 2004a). The objective of the Phase II investigation was to determine baseline conditions by
identifying and evaluating contaminants of potential concern (COPC) in the underlying
environmental media. Six soil borings (SB-1 through SB-6) were advanced within the footprint
of former Building D to determine baseline conditions at REC #1. The depths of these borings
ranged from 10 to 24 feet below grade. Two soil samples were collected from each boring (at
five and 10 feet below grade) and analyzed for VOCs, semivolatile organic compounds
(SVOCs), total petroleum hydrocarbon (TPH)-diesel-range organics (DRO), TPH-gasoline-range
organics (GRO), PCBs, and metals.
To assess the product pipeline and any possible releases from the pipeline, 10 soil borings
(SB-9 through SB-18) were advanced along its entire length (not including the section in a
7903 TETRA TECH • LOCKHEED MARTIN MIDDLE RIVER COMPLEX •2012 ADDITIONAL BLOCK E SOIL INVESTIGATION REPORT PAGE 2-11
concrete utility trench). A soil sample was collected from five feet below grade at each soil
boring. All samples were analyzed for benzene, toluene, ethyl benzene, and xylenes (BTEX),
naphthalene, and TPH-DRO.
Three soil borings (SB-19 through SB-21) were advanced at REC #3 during the 2003
investigation. Soil borings SB-19 and SB-21 were advanced within the footprint of the
500,000-gallon AST, and SB-20 was advanced within the footprint of the 500-gallon
underground storage tanks (UST). Two soil samples (five and 10 feet below grade) were
collected from each boring and analyzed for BTEX, naphthalene, and TPH-DRO.
VOCs, PAHs (expressed as a benzo(a)pyrene equivalent [BaPEq]), TPH-GRO, and various
metals were detected in soil samples collected in 2003. Arsenic and benzene were the only
compounds detected at concentrations exceeding Maryland Department of the Environment
(MDE) screening levels. The results of the 2003 investigation, including figures of sampling
locations, are in the Final Report Phase II Site Investigation of Exterior Areas, Volumes I and II
(Tetra Tech, 2004a). PCBs were not detected in excess of the one-milligram per
kilogram (mg/kg) screening level in any of the samples collected for the 2003 investigation.
2.3.3 Radiological Survey of Former Building D (REC #1) (Winter 2004)
A radiological survey of REC #1 (former Building D) in March 2004 (Tetra Tech, 2004b) sought
to determine if radiological activities possibly conducted in Building D had affected the
underlying environmental media. The survey focused on the remaining former Building D
foundation slab where suspected nuclear activities (possibly involving uranium, plutonium, and
strontium, as well as other isotopes) may have occurred. A cobalt-60 source was also located in
the wet lab. The radiological survey covered two areas where isotopes were known to have been
used, based on information from MRC personnel who had been present during such operations in
the late 1950s–1960s. The primary area was in the southwestern portion of the building, along
the southern exterior wall; the secondary area was immediately north of the first area, along the
western exterior wall of former Building D.
The radiological survey used alpha and beta monitors and a gamma-radiation survey instrument,
which was deemed appropriate for detecting the suspected radioisotopes of concern. The work
began with a survey of a 10-foot by 10-foot area near the center of the former Building D

7903 TETRA TECH • LOCKHEED MARTIN MIDDLE RIVER COMPLEX •2012 ADDITIONAL BLOCK E SOIL INVESTIGATION REPORT PAGE 2-12
foundation using a beta/gamma monitor to verify background radiation levels. After these levels
were established, 11 areas of the building foundation were surveyed, in the areas of reported
radionuclide use in the southwestern and western sections of the building.
Walkover gamma surveys were performed over most of the former Building D floor surface to
identify any areas where radiation levels may exceed background levels. Alpha and beta
floor-monitor measurements revealed no areas with readings significantly above background;
however, three areas had gamma readings above background. None of the elevated levels appear
likely to have presented an exposure risk to a full-time worker. Two areas were in places where
portions of the concrete slab had either been removed or had deteriorated to the point where
grass was growing. The third area was above brick tiles on top of the foundation slab. Two of
these three areas did not appear to be associated with a particular source or activity.
Elevated readings in the third area may be the result of naturally occurring radiation common to
building material, such as brick tiles. These areas were sampled for purposes of laboratory
analysis as part of the site-wide Phase II investigation. The results of the radiological survey and
soil sample radiological analyses are in the Radiological Survey Report for Former Building D
(Tetra Tech, 2004b).
2.3.4 Site-Wide Phase II Investigation (2004)
All 13 RECs were investigated during the site-wide Phase II investigation, including geophysical
surveys of five areas, plus soil and groundwater sampling. The 2004 Block E investigation was
limited to soil and groundwater sampling. Eight surface soil samples and two subsurface soil
samples were collected from the former Building D footprint and analyzed for VOCs, SVOCs,
PCBs, perchlorate, total and dissolved metals, and TPH-DRO and TPH-GRO. Six of the surface
soil samples (SB-1A through SB-6A) were collected in the same areas where soil borings had
been advanced in the 2003 Phase II investigation.
Two new borings (SB-35 and SB-36) were advanced within the footprints of the clean plating
shop (SB-35) and the finishing shop (SB-36). Samples were obtained from the surface and
between four to five feet below grade at these two new locations. Six radiological surface-media
samples were collected from the three gamma anomalies identified during the radiological
survey (SB-41 through SB-43) and submitted for gamma spectroscopy analysis. The only
7903 TETRA TECH • LOCKHEED MARTIN MIDDLE RIVER COMPLEX •2012 ADDITIONAL BLOCK E SOIL INVESTIGATION REPORT PAGE 2-13
radiological parameters detected in the soil boring samples from the former Building D footprint
were naturally occurring metal nuclides such as cesium-137 (0.145 picocuries per gram [pCi/g]
in SB-41) and actinium-228 (at concentrations of 0.95 and 1.02 pCi/g in SB-43 and SB-42,
respectively).
Several VOCs, PAHs, TPH-DRO, TPH-GRO, PCBs (specifically Aroclor-1260), and metals
were detected in REC #1 soil samples collected in the 2004 investigation. The only chemicals
exceeding MDE soil screening levels were PCBs, TPH-DRO, and chromium in surface soils, and
arsenic in subsurface soils. Chromium slightly exceeded its MDE anticipated typical
concentration (ATC) (28 micrograms per kilogram [µg/kg]) in surface soil samples, but not in
subsurface samples; this most likely represents background conditions rather than impacts from
former activities at what is now an REC. Sampling locations where PCBs exceeded the 1 mg/kg
screening level are shown in Figure 2-8. The results of the aforementioned sample analyses and
sampling location figures are in the Final Data Report, Site-Wide Phase II Investigation
(Tetra Tech, 2005).
2.3.5 Phase II Soil Investigation (Summer 2005)
To further delineate the elevated levels of PCBs detected in 2004, SB-4A was re-sampled from
one to two feet below grade in 2005. Four new borings (SB-232 through SB-235) were advanced
approximately 60 feet from SB-4A. Two samples (from zero- to one-foot and
one-foot to two-feet below grade) were collected from each boring; these samples were analyzed
for PCBs and found to contain the common PCBs Aroclor-1242 and Aroclor-1260. Sampling
locations and the results of this investigation are in the Site Characterization Report (Tetra
Tech, 2006). Sampling locations with PCB concentrations exceeding the 1 mg/kg screening level
are shown in Figure 2-8.
2.3.6 Site Characterization Report (May 2006)
The Site Characterization Report (Tetra Tech, 2006) summarizes the data collected for all
environmental media through 2005, including the Phase II Soil Investigation results discussed in
the preceding section. The study compared the chemical results detected in soil samples against
natural background concentrations. It also includes a human health risk assessment (HHRA) that
identified potential human health effects posed by exposure to site chemicals under a number of
7903 TETRA TECH • LOCKHEED MARTIN MIDDLE RIVER COMPLEX •2012 ADDITIONAL BLOCK E SOIL INVESTIGATION REPORT PAGE 2-14
current and hypothetical land use scenarios. Results of the site-specific HHRA helped determine
which COPC are the principal contributors to potential human health risk and should thus be
considered contaminants of concern (COC). After comparison to natural background
concentrations in the HHRA, arsenic (identified as a COPC in Block E and Parking Lot No. 3
soil) was not retained as a COC. PAHs (expressed as BaPEq), PCBs, and TPH-DRO and
TPH-GRO in surface and subsurface soils were identified as COC for Block E.
2.3.7 Additional Field Investigation (Fall 2007)
An additional field investigation in fall 2007 sought to confirm previous results and delineate
areas of concern in Block E. Initially, 20 surface samples (SB-345 through SB-364) were
collected in a grid pattern around SB-4A to evaluate the extent of PCB impacts. All samples were
collected from the slab joints and cracks of the former Building D concrete slab and analyzed for
PCBs. Twenty-one soil borings (SB-500 through SB-520) were advanced across the former
Building D footprint to a maximum depth of 12 feet below grade. The concrete is approximately
eight inches thick and contains reinforcing steel. Most of the soil samples were collected after
coring through the concrete slab. These samples were analyzed for PCBs, VOCs, SVOCs, metals
(including iron, manganese, and mercury), and for TPH-DRO and TPH-GRO.
An additional 20 surface soil samples (SB-521 through SB-540) were obtained from around five
storm sewer manholes south of former Building D. Storm sewer piping runs parallel to the
former building, with manholes 175 feet apart. Four soil samples were collected around each
manhole and analyzed for PCBs.
PCB concentrations were greater than the risk-based screening level (1 mg/kg) in 52 of 61 soil
samples collected from zero to 10 feet below grade; most of the samples containing exceedances
were collected from surface soils. Aroclor-1260 was the only PCB detected, at concentrations
ranging from non-detect to a maximum of 1,800 mg/kg in the surface soil sample from location
SB-353. Aroclor-1260 was also elevated in soil samples collected between the concrete floor
slabs in the area of former Building D.
BaPEq concentrations in soil samples ranged from non-detect to a maximum of 7,600 µg/kg at
SB-503. BaPEq concentrations above its screening level (150 µg/kg) were detected in most soil
samples. Thirty of 60 exceedances were calculated from analytical results with elevated detection
7903 TETRA TECH • LOCKHEED MARTIN MIDDLE RIVER COMPLEX •2012 ADDITIONAL BLOCK E SOIL INVESTIGATION REPORT PAGE 2-15
limits. In those cases, one-half the detection limit (of each constituent associated with an elevated
detection limit) was used as proxy in the calculation, resulting in an approximation that may or
may not represent a true exceedance. Twenty samples exceeding screening levels were collected
in and around REC #1, REC #2, and REC #3.
None of the other constituents, including metals, was detected in site soils above screening
levels, except TPH, which exceeded its screening level (230 mg/kg) at one location
(SB-503-0001) with a concentration of 650 mg/kg. Sampling locations with PCB exceedances
above the 1 mg/kg screening level are shown in Figure 2-8. Sampling locations and the results of
this investigation are in the Block E Data Summary Report (Tetra Tech, 2011).
2.3.8 Supplemental Soil and Storm Drain Sediment CharacterizationReport (Fall 2008)
The 2008 supplemental soil and storm drain sediment characterization study (Tetra Tech, 2010)
focused on defining the extent of PCB impacts in Tax Block E and Parking Lot No. 3 soil and
associated storm sewer sediment, based on the areas identified in the Site Characterization
Report (Tetra Tech, 2006). Forty soil borings were advanced in REC #1 using direct push
technology (DPT) in areas where the horizontal extent of PCB impacts had not been completely
bounded, and the vertical extent of PCB impacts below the shallow sampling depth
(i.e., 1–2 feet below grade) was unknown. Thirty-one borings were advanced during the first
phase (SB-541 through SB-571) and nine during the second phase (SB-541A, SB-543A,
SB-544A, SB-546A, SB-550A, SB-555A, SB-561A, SB-568A and SB-570A). One-hundred
sixty-one soil samples, including duplicates, were collected from the soil borings and analyzed
for PCBs at a fixed-base laboratory.
The chemical analytical results confirmed the presence of PCBs (including Aroclor-1016, -1254,
and -1260) in 58 soil samples. Aroclor-1260 concentrations range from non-detect to a maximum
of 300 mg/kg (SB-569-0-0.5). Aroclor-1260 was detected in surface soil samples from across the
former Building D site wherever samples were collected. Fifteen soil samples exceeded the
screening level at that time. PCB concentrations for several deeper-depth samples, including
SB-555A-12 (0.71 mg/kg), SB-555A-14 (0.038 mg/kg), and SB-570A-10 (0.034 mg/kg), did not
exceed the screening level; however, a PCB exceedance was seen in SB-555A-12. PCB
concentrations exceeding the 1 mg/kg screening level are shown in Figure 2-8.
7903 TETRA TECH • LOCKHEED MARTIN MIDDLE RIVER COMPLEX •2012 ADDITIONAL BLOCK E SOIL INVESTIGATION REPORT PAGE 2-16
2.3.9 Data Gap Investigation (Fall 2010)
The Block E Data Summary Report (Tetra Tech, 2011) summarizes the 2010 data gap soil
investigation, which sampled and analyzed concrete and soil to determine the vertical and lateral
extent of PCB concentrations above the screening level. Thirty soil borings (E-SB-818 through
E-SB-847) were advanced in areas of Block E requiring additional delineation to determine the
horizontal and vertical extent of contamination. In addition to these borings, the detection of free
product at soil boring E-SB-833 led to additional delineation of the area through advancement of
14 additional soil borings (E-SB-833A through E-SB-833N), moving outward from the original
boring location (E-SB-833), to characterize soils in the subsurface.
All soil and concrete samples (241 plus 13 duplicates) were analyzed for PCBs. Twenty-one
samples were also analyzed for PAHs. Soil boring E-SB-828 was sampled (at nine and 11 feet
below grade) for TPH-DRO and -GRO. Boring E-SB-833 was sampled at nine feet below grade
for VOCs, SVOCs, inorganic metals, CrVI, and TPH-DRO and TPH-GRO. Soil and concrete
samples collected around E-SB-833 were analyzed for PCBs; soil samples were also analyzed
for VOCs and PAHs. Samples collected from six of these 14 borings were analyzed for
TPH-DRO and TPH-GRO, and one sample was analyzed only for TPH-GRO (E-SB-833B). A
water sample collected from the electric manhole adjacent to E-SB-833 was analyzed for VOCs,
PCBs, TPH-GRO, and TPH-DRO.
Evaluation of soil data for the data gap investigation indicates that PCB concentrations range
from non-detect to less than 1 mg/kg in most soil borings, with the following exceptions found in
E-SB-827, E-SB-833, and E-SB-835:
E-SB-827: maximum PCB concentration of 260 mg/kg detected at nine feet below grade
E-SB-833: free product observed at nine feet below grade during soil sampling.Analytical data indicate PCBs at seven to 11 feet below grade. The maximum PCBconcentration (24,000 mg/kg) was detected at nine feet below grade. PCB concentrationsreduced to 61 mg/kg at 11 feet below grade. Low PCB concentrations (below 1 mg/kg)were detected in the associated concrete samples.
E-SB-835: a PCB concentration of 3.5 mg/kg was detected at nine to 11 feet below grade

7903 TETRA TECH • LOCKHEED MARTIN MIDDLE RIVER COMPLEX •2012 ADDITIONAL BLOCK E SOIL INVESTIGATION REPORT PAGE 2-17
Trichlorobenzene (9,600,000 µg/kg), 1,2-dichlorobenzene (120,000 µg/kg), 14-DCB
(130,000 µg/kg) and TPH-DRO (28,000 mg/kg) were also detected in soil boring E-SB-833 at
9 feet below grade.
Data for the 14 additional soil borings around E-SB-833, covering an area with an approximate
60-foot radius, confirm the presence of PCBs. PCB concentrations range from non-detect to a
maximum of 2,000 mg/kg at soil boring E-SB-833A (10 feet below grade), which is
approximately 20 feet southwest of E-SB-833. These data indicate that the vertical extent is still
unknown at this location. The highest concentrations of PCBs in the additional soil borings in the
E-SB-833 area were as follows:
E-SB-833E (360 mg/kg at two feet below grade)
E-SB-833I (350 mg/kg at 10 feet below grade)
E-SB-833K (970 mg/kg at six feet below grade)
E-SB-833L (700 mg/kg at two feet below grade)
E-SB-833L (700 mg/kg at eight feet below grade)
Dichloro- and trichloro-benzenes were also detected in multiple soil samples in the E-SB-833
series soils (A though N). The concrete sample from E-SB-833F exhibited the highest PCB
concentration of 1,600 mg/kg. PCB concentrations exceeding the 1 mg/kg screening level are
shown in Figure 2-8.
2.3.10 Human Health Risk Assessment for Soil (Spring 2011)
An HHRA was completed in early 2011 for soil at Block E, as well as for other MRC tax blocks
(Tetra Tech, 2012a). This HHRA updated the risk evaluations in the May 2006 Site
Characterization Report (Tetra Tech, 2006) and is based on the significant volume of
environmental data collected from 2007–2010 to further characterize the nature and extent of
impacts to soil in Block E. The HHRA objective was to identify chemical contaminants of
concern (COC) that may pose risks to human health, and to determine if the detected chemical
concentrations in soil at Block E pose a significant threat to potential human receptors under
current and/or future land uses. No full-time workers currently work at Block E.
7903 TETRA TECH • LOCKHEED MARTIN MIDDLE RIVER COMPLEX •2012 ADDITIONAL BLOCK E SOIL INVESTIGATION REPORT PAGE 2-18
Potential risks to human receptors were estimated on the assumption that no actions will be taken
to control contaminant releases. Primary guidance sources used to prepare the risk assessment
include the MDE Cleanup Standards for Soil and Groundwater (MDE, 2008) and Voluntary
Cleanup Program Guidance (MDE, 2006). Current guidance and reports published by the United
States Environmental Protection Agency (USEPA) and USEPA Region 3 were also considered in
preparing the risk assessment.
The current and potential/hypothetical future land uses evaluated suggest the following potential
receptors could be exposed to impacted soils at the MRC:
construction workers
industrial workers
commercial land-use receptors
child, adolescent, and adult recreational users
future child, adolescent, and adult residents
Cancer and non-cancer risk estimates were calculated for these receptors using reasonable
maximum-exposure assumptions and assuming that human exposure to soils may occur via
incidental ingestion, dermal contact, and inhalation exposure routes. Cancer risk estimates were
presented in terms of incremental lifetime-cancer risks; the non-cancer risks were presented in
terms of hazard indices. Cancer estimates were interpreted using the MDE cancer risk
benchmark (1×10⁻⁵, or a one-in-100,000 probability of developing cancer) for cumulative risk,
and the USEPA target cancer risk range (1×10⁻⁴ to 1×10⁻⁶, or a one-in-10,000 to a
one-in-a-million probability of developing cancer); non-cancer risks were evaluated using a
hazard index (HI) value of 1.0 (adverse non-cancer health effects are not anticipated when the
estimated HI is equal to or less than 1). The following COC were identified for surface and
subsurface soils in Block E, based on a comparison of the cancer and non-cancer risk estimates
to the MDE risk benchmarks:
7903 TETRA TECH • LOCKHEED MARTIN MIDDLE RIVER COMPLEX •2012 ADDITIONAL BLOCK E SOIL INVESTIGATION REPORT PAGE 2-19
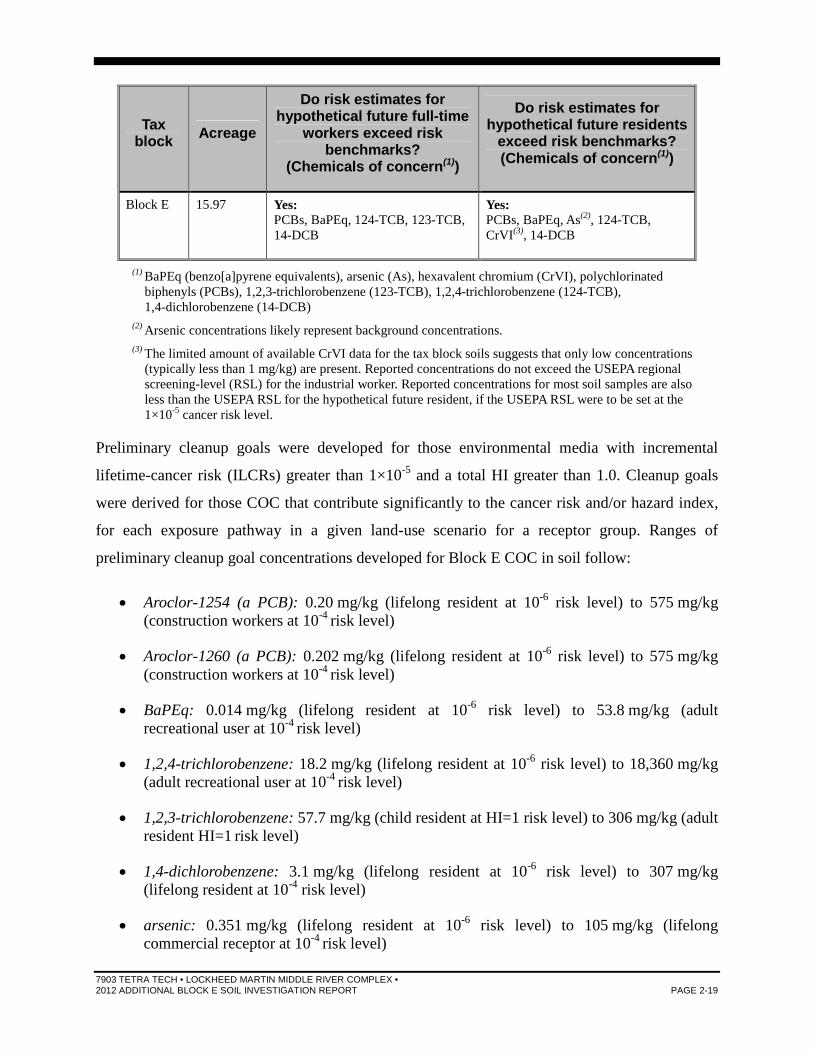
Taxblock
Acreage
Do risk estimates forhypothetical future full-time
workers exceed riskbenchmarks?
(Chemicals of concern(1))
Do risk estimates forhypothetical future residents
exceed risk benchmarks?(Chemicals of concern(1))
Block E 15.97 Yes:PCBs, BaPEq, 124-TCB, 123-TCB,14-DCB
Yes:PCBs, BaPEq, As(2), 124-TCB,CrVI(3), 14-DCB
(1) BaPEq (benzo[a]pyrene equivalents), arsenic (As), hexavalent chromium (CrVI), polychlorinatedbiphenyls (PCBs), 1,2,3-trichlorobenzene (123-TCB), 1,2,4-trichlorobenzene (124-TCB),1,4-dichlorobenzene (14-DCB)
(2) Arsenic concentrations likely represent background concentrations.
(3) The limited amount of available CrVI data for the tax block soils suggests that only low concentrations(typically less than 1 mg/kg) are present. Reported concentrations do not exceed the USEPA regionalscreening-level (RSL) for the industrial worker. Reported concentrations for most soil samples are alsoless than the USEPA RSL for the hypothetical future resident, if the USEPA RSL were to be set at the1×10-5 cancer risk level.
Preliminary cleanup goals were developed for those environmental media with incremental
lifetime-cancer risk (ILCRs) greater than 1×10⁻⁵ and a total HI greater than 1.0. Cleanup goals
were derived for those COC that contribute significantly to the cancer risk and/or hazard index,
for each exposure pathway in a given land-use scenario for a receptor group. Ranges of
preliminary cleanup goal concentrations developed for Block E COC in soil follow:
Aroclor-1254 (a PCB): 0.20 mg/kg (lifelong resident at 10-6 risk level) to 575 mg/kg(construction workers at 10-4 risk level)
Aroclor-1260 (a PCB): 0.202 mg/kg (lifelong resident at 10-6 risk level) to 575 mg/kg(construction workers at 10-4 risk level)
BaPEq: 0.014 mg/kg (lifelong resident at 10-6 risk level) to 53.8 mg/kg (adultrecreational user at 10-4 risk level)
1,2,4-trichlorobenzene: 18.2 mg/kg (lifelong resident at 10-6 risk level) to 18,360 mg/kg(adult recreational user at 10-4 risk level)
1,2,3-trichlorobenzene: 57.7 mg/kg (child resident at HI=1 risk level) to 306 mg/kg (adultresident HI=1 risk level)
1,4-dichlorobenzene: 3.1 mg/kg (lifelong resident at 10-6 risk level) to 307 mg/kg(lifelong resident at 10-4 risk level)
arsenic: 0.351 mg/kg (lifelong resident at 10-6 risk level) to 105 mg/kg (lifelongcommercial receptor at 10-4 risk level)
7903 TETRA TECH • LOCKHEED MARTIN MIDDLE RIVER COMPLEX •2012 ADDITIONAL BLOCK E SOIL INVESTIGATION REPORT PAGE 2-20
CrVI: 0.129 mg/kg (lifelong resident at 10-6 risk level) to 565 mg/kg (adolescent residentat HI=1 risk level)
Uncertainty in risk characterization resulted from assumptions made regarding additivity of
effects from exposure to multiple COC via various exposure routes. High uncertainty exists
when summing non-carcinogenic risks for several substances across different exposure
pathways. The assumption of additivity was considered because in most cases it represents a
conservative estimate of risk. The risk characterization does not consider antagonistic or
synergistic effects. Little or no information was available to determine the potential for
antagonism or synergism among the COPC. The likelihood of over- or under-predicting risks
could not be defined because chemical-specific interactions could not be predicted; however, the
methodology used is based on current USEPA guidance.
2.3.11 Additional Soil Investigation (July–August 2011)
The 2011 additional soil investigation sought to further characterize PCB in soils at the
southwest portion of Block E and provide data to complete a risk assessment for site worker
exposure. One-hundred-nine samples (80 during the first phase and 29 during the second phase)
were analyzed for PCBs. Figure 2-9 presents the composite PCB results for the surface and
subsurface soil investigations for 2011. Sampling locations and the results of this investigation
are included in the Additional Block E Soil Characterization Report (Tetra Tech, 2012b).
Overall, PCB concentrations greater than the screening level were detected in 39 of 106 samples
(37 samples and two duplicate samples). Aroclor-1254 and Aroclor-1260 are the only two PCBs
detected, with detected concentrations ranging from trace (0.0084 mg/kg) to a maximum of
19,000 mg/kg, in the eight- to 12-foot soil-sampling interval at soil boring E-SB-853, which is
within the area of a former transformer room. The highest concentration collected at a surface
soil location was 3,300 mg/kg at E-SB-852-01, which is adjacent to the former transformer room
and the former waste disposal area.
2.3.11.1 Initial Phase—July 2011
On-site screening was conducted using RaPID® Assay test kits. The test-kit results indicate
concentrations less than the screening criterion in at least one of the three deepest samples
collected from each boring. One exception is soil boring E-SB-853, where PCBs were detected
7903 TETRA TECH • LOCKHEED MARTIN MIDDLE RIVER COMPLEX •2012 ADDITIONAL BLOCK E SOIL INVESTIGATION REPORT PAGE 2-21
in the deepest sample at a test kit concentration of 1.6 mg/kg, which is slightly greater than the
screening threshold of 1 mg/kg. The deepest sample for this boring was analyzed for PCBs by
the laboratory, but a field decision was made not to continue sampling at this location because
the test-kit concentration was just slightly greater than the screening threshold. The laboratory
concentration of 1.5 mg/kg for E-SB-853-28-30 confirmed that the deep-sample PCB
concentration only slightly exceeded the screening criterion.
During the initial-phase sampling, 80 soil samples from 12 soil borings were analyzed for PCBs
by the laboratory. Laboratory results for the initial-phase soil samples indicate that PCB
concentrations exceeded the PCB screening criterion (1 mg/kg) in 20 soil samples. The
laboratory-detected PCB concentrations range from 0.0084 to 19,000 mg/kg (E-SB-853-8-12).
The mean PCB concentration of all samples collected during the July 2011 sampling event is
308 mg/kg.
Soil boring E-SB-853, the location of the highest PCB concentration, is approximately 30 feet
southwest of E-SB-833E and 20 feet south of E-SB-833F. The three highest concentrations of
PCBs detected in soil borings were as follows:
E-SB-852 (3,300 mg/kg at one foot below grade)
E-SB-853 (19,000 mg/kg at 12 feet below grade)
E-SB-853 (780 mg/kg at 16 feet below grade)
Evaluation of the July 2011 data led to the determination that the southern boundary of the
known PCB–impacted area needed further delineation, and that additional surface soil PCB data
were required to complete a risk assessment for worker exposure in this area.
2.3.11.2 Follow-on Phase—August 2011
Twenty-nine samples (23 soil, three concrete, and three duplicate samples) were collected from
15 locations and analyzed for PCBs during this investigation. PCBs were consistently detected in
all Block E surface soil samples, with 19 soil samples exceeding the PCB screening criterion of
1 mg/kg. The detected PCB concentrations range from 0.084 to 1,100 mg/kg (E-SB-864-0.0-0.5).
The mean of all samples collected in August 2011 is 152 mg/kg.
7903 TETRA TECH • LOCKHEED MARTIN MIDDLE RIVER COMPLEX •2012 ADDITIONAL BLOCK E SOIL INVESTIGATION REPORT PAGE 2-22
Soil boring E-SB-864 is approximately 60 feet east of E-SB-853 and 50 feet southeast of
E-SB-833K. The highest detected concentrations of PCBs in the follow-on phase of the
investigation (August 2011 samples) were as follows:
E-SB-862 (880 mg/kg at 0.5 feet below grade)
E-SB-864 (1,100 mg/kg at 0.5 feet below grade)
Three concrete samples were also collected. PCBs were detected in one of the three samples at a
concentration of 0.58 mg/kg (E-SB-874-CS).
2.3.12 Human Health Risk Assessment Update (Fall 2011)
An HHRA update was completed in 2011 for soil at several sub-areas of Block E (Tetra
Tech, 2012c). The HHRA was an update to the risk evaluations presented in the 2011 Human
Health Risk Assessment of Soils Blocks D, E, F, G, & H (Tetra Tech, 2012a). The HHRA update
is based on the environmental data in Tetra Tech (2012a) and additional Block E soil-chemical
data collected during the summer of 2011 (Tetra Tech, 2012b). The HHRA update was conducted
to determine if chemical concentrations detected in soil at three different areas in Block E pose a
significant threat to potential human receptors (i.e., industrial workers, lawn mowing personnel)
under the following current conditions:
current industrial workers at the Tilley Chemical Company who park trucks in thesouthwest area of Block E (referred to as the Tilley Chemical Company Area)
current volunteer workers that access the area used to store aircraft parts in the northeastarea of Block E (Museum Area)
current personnel that cut grass-covered portions of Block E (Grassy Area)
Potential risks to human receptors were estimated on the assumption that no actions will be taken
to control contaminant releases. Primary guidance sources used to prepare the HHRA include the
MDE Cleanup Standards for Soil and Groundwater (MDE, 2008) and Voluntary Cleanup
Program Guidance (MDE, 2006). Current guidance and reports published by USEPA and
USEPA Region 3 were also considered in preparing the risk assessment.
Current land uses suggest the following receptors could potentially be exposed to contaminated
soils at the MRC:
7903 TETRA TECH • LOCKHEED MARTIN MIDDLE RIVER COMPLEX •2012 ADDITIONAL BLOCK E SOIL INVESTIGATION REPORT PAGE 2-23
workers (specifically, Tilley Chemical Company employees parking trucks, museumworkers)
personnel that cut grass
Consequently, cancer and non-cancer risk estimates were calculated for these receptors using
reasonable maximum-exposure assumptions, and assuming that human exposure may occur via
incidental ingestion, dermal contact, and inhalation exposure-routes.
Cancer-risk estimates are presented in terms of incremental lifetime-cancer-risks;
non-cancer-risk estimates are presented in terms of hazard indices. Potential cancer effects were
interpreted using the MDE cancer risk benchmark (1×10⁻⁵, or a one-in-100,000 probability of
developing cancer) for cumulative risk, and the USEPA’s target cancer risk range (1×10⁻⁴ to
1×10⁻⁶). Non-cancer risks were evaluated using an HI value of 1.0 (adverse non-cancer health
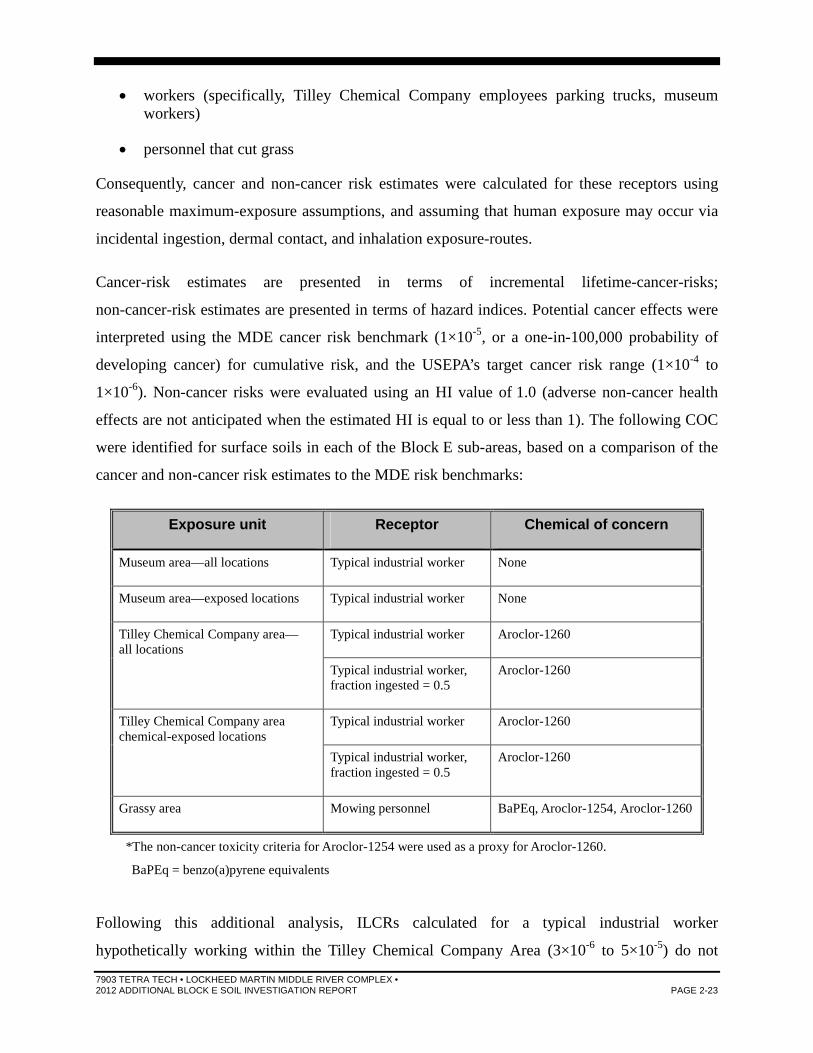
effects are not anticipated when the estimated HI is equal to or less than 1). The following COC
were identified for surface soils in each of the Block E sub-areas, based on a comparison of the
cancer and non-cancer risk estimates to the MDE risk benchmarks:
Exposure unit Receptor Chemical of concern
Museum area—all locations Typical industrial worker None
Museum area—exposed locations Typical industrial worker None
Tilley Chemical Company area—all locations
Typical industrial worker Aroclor-1260
Typical industrial worker,fraction ingested = 0.5
Aroclor-1260
Tilley Chemical Company areachemical-exposed locations
Typical industrial worker Aroclor-1260
Typical industrial worker,fraction ingested = 0.5
Aroclor-1260
Grassy area Mowing personnel BaPEq, Aroclor-1254, Aroclor-1260
*The non-cancer toxicity criteria for Aroclor-1254 were used as a proxy for Aroclor-1260.
BaPEq = benzo(a)pyrene equivalents
Following this additional analysis, ILCRs calculated for a typical industrial worker
hypothetically working within the Tilley Chemical Company Area (3×10⁻⁶ to 5×10⁻⁵) do not
7903 TETRA TECH • LOCKHEED MARTIN MIDDLE RIVER COMPLEX •2012 ADDITIONAL BLOCK E SOIL INVESTIGATION REPORT PAGE 2-24
exceed the USEPA target risk range (1×10⁻⁴ to 1×10⁻⁶); risk estimates calculated based on the
most likely exposures incurred by current Tilley Chemical Company Area workers (3×10⁻⁶ to
5×10⁻⁶) also do not exceed the MDE target cancer risk level (1×10⁻⁵). HI for these workers do not
exceed 1. The incremental lifetime cancer risk for the lawn mower (2×10⁻⁵) does not exceed the
USEPA target cancer risk range, but does exceed the MDE target risk level. The HI for the lawn
mower does not exceed 1.
The HHRA update includes the following cleanup goals for the lawn mower operator:
Aroclor-1254 (a PCB): 19.3 mg/kg (10-6 risk level) to 1930 mg/kg (10-4 risk level)
Aroclor-1260 (a PCB): 19.3 mg/kg (10-6 risk level) to 1930 mg/kg (10-4 risk level)
BaPEq: 5.6 mg/kg (10-6 risk level) to 555 mg/kg (10-4 risk level)
Cleanup goals were previously calculated for other typical Block E industrial workers in the
HHRA for Tax Blocks D, E, F, G, and H (Tetra Tech, 2012a).
2.3.13 Utility Cross-Connection Study (Summer 2011)
A utility cross-connection (UCC) investigation (Tetra Tech, 2012d) was completed in 2011 for
the area in Block E identified for potential in situ groundwater bioremediation in the draft
Groundwater Response Action Plan (Tetra Tech, 2012e). The UCC investigation included only
the southeastern portion of Block E, in the area around the existing 500,000-gallon water tank
and REC #3. The objective of this program was to identify utilities within the footprint of the
groundwater remedy system currently proposed for installation in 2013. The results of the utility
cross-connection investigation were used to design a pilot-scale groundwater-injection tracer test
and the full-scale groundwater remedial system design.
The UCC investigation included reviews of historical drawings, employee interviews, site
reconnaissance, geophysical surveys, field and closed-circuit television (CCTV) inspections of
storm drains, and professional land surveying to locate, record, and map subsurface utilities that
may act as preferential migration pathways for groundwater contaminants or bioremediation
substrates that may be injected into groundwater to remedy VOCs. Historical and current utility
records, site reconnaissance, and geophysical surveys indicate numerous underground utilities in
the Block E study area. In interviews, current MRC employees did not recall any utilities that
7903 TETRA TECH • LOCKHEED MARTIN MIDDLE RIVER COMPLEX •2012 ADDITIONAL BLOCK E SOIL INVESTIGATION REPORT PAGE 2-25
were not marked on the current MRC utility drawing. Underground utilities include electrical
lines, telecommunication lines, domestic and fire water lines, and storm drains. Known utilities
and geophysical anomalies were marked in the field. These locations were professionally
surveyed to provide location coordinates and elevations, and to provide detailed maps of the
utilities for future remedial designs. Closed-circuit television was used to inspect and digitally
record accessible underground structures.
Underground utilities described in historical documents for the Block E study area include a
storm drain line, a former #2 fuel pipeline (two-inch diameter) that ran along the Block E fence
line, a 10-inch-diameter fire water line (now abandoned) running along the southern perimeter of
former Building D, and two fire water lines that connected the existing AST to a former fire
pump in the southeastern corner of the former Building D basement. Several drains are in the
basement floor of former Building D; these are shown in historical documents as connecting to
the storm drain system south of the former Building D foundation.
An unknown linear geophysical anomaly was detected along the median of Chesapeake Park
Plaza. The anomaly runs from the western edge of the survey area, crosses underneath the
roadway, and terminates at a concrete block in the southeastern corner of Block E. An additional
geophysical anomaly was detected in the area of a former aboveground fuel storage tank west of
the current aboveground water tank. Block E study area storm-drain systems consist of groups of
steel-grated brick catch basins, manholes, and concrete underground piping that discharge to
Dark Head Cove via Outfalls 06 and Outfall 08.
Several sections of large pipe were characterized as having root intrusion, and several contain
small longitudinal cracks near joints. Medium pipe offsets were observed in a line connecting a
catch basin to a manhole. Groundwater seepage was observed in the pipe upstream of a catch
basin north of the water tank.
Storm drain lines exist in the proposed injection area of Block E, but they are shallow, with
typical structure depths slightly less than three feet to nearly five feet below grade (maximum
depth of 4.7 feet below grade). The deepest catch basins, located in the Chesapeake Park median
east of Block E, are approximately 7.6 feet deep. Historical groundwater level data in the
7903 TETRA TECH • LOCKHEED MARTIN MIDDLE RIVER COMPLEX •2012 ADDITIONAL BLOCK E SOIL INVESTIGATION REPORT PAGE 2-26
Block E study area indicate that groundwater levels fluctuate seasonally and respond to droughts
and moderate to heavy precipitation events.
Groundwater depths range from approximately one foot to slightly over eight feet below grade in
the central and southern portions of Block E, and 10–15 feet below grade in the northern portion
of Block E. Groundwater depths in the central and southern portions of the site, and the presence
of cracks and joint separations, suggest that storm drains in the Block E study area could
potentially intercept the upper surface of the groundwater table. As part of the Block E
inspections, groundwater was observed flowing into a joint separation north of the water tank.
Groundwater inflow encrustations were observed in the deepest pipes running in the median of
Chesapeake Park Plaza.
2.3.14 Block E Storm-Drain Interim Remedial Measures (Fall 2011)
A storm-drain interim-response measure (IRM) was completed at Block E in autumn 2011 (Tetra
Tech, 2012f). The IRM removed sediment and debris from the drainage system piping and
manholes, provided sediment controls, and repaired or replaced inlets and manholes. The IRM
was intended to minimize the transport of contaminated storm-drain sediments to off-site
locations and to allow free drainage of the Block E area. The IRM was not designed to achieve
preliminary sediment cleanup goals, but rather to remove the more mobile sediment that could
migrate off-site from the drainage system. The IRM was an initial step in the more
comprehensive remediation of contaminated sediments planned for the Dark Head Cove area.
Any inlets, manholes, or pipe sections of the storm drain system that were damaged beyond
repair or blocked and inaccessible were generally left as found. A Maryland-licensed land
surveyor conducted a pre-construction survey to record topographic and as-built features of the
planned and potential areas of disturbance around the Block E storm drain system. Following
completion of all fieldwork, a post-construction survey documented that the site had been
restored to a condition as close as practical to its original pre-construction state.
Three additional catch basins were identified in the northeast corner of Block E during a site
walk-through in July 2011, before implementation of the Block E storm drain system IRM. Two
buried manholes (MH-8 and MH-9) were also found near the southeast corner of the former
Building D foundation during the IRM. These manholes have grated-steel covers and previously
7903 TETRA TECH • LOCKHEED MARTIN MIDDLE RIVER COMPLEX •2012 ADDITIONAL BLOCK E SOIL INVESTIGATION REPORT PAGE 2-27
acted as catch basins for local runoff. Manhole MH-9 was raised to grade and a new cover placed
over the manhole opening. Manhole MH-9 is filled with rocks, which partially obstruct flow
from the upstream pipe. However, large rocks used for backfill allow some water to flow through
manhole MH-9 to the downstream catch basin and piping. MH-8 could not be cleaned or filmed
because the piping was filled with water due to the rocks obstructing the connection from MH-9.
Cleaning the storm sewer system involved inserting a jet nozzle into the downstream structure
and propelling it toward the upstream structure. As the nozzle was pulled back, liquid and solid
material was vacuumed into a jet-vacuum truck. Hand removal of debris was necessary at some
locations due to the large size or heavy weight of the debris in these structures.
If lines were damaged or filled with material such that cleaning was not possible, those segments
were left as found and cleaning proceeded to the next line segment or outfall system. Jet-vacuum
truck contents were transferred to roll offs or fractionation tanks located on a containment pad.
The storm drain lines were cleaned to restore a minimum of 95% of their original flow capacity.
Concrete debris affixed to the storm drain pipes could not be removed with the industry standard
conventional cleaning equipment employed. Concrete affixed to pipes was mainly observed on
an east–west line of the Outfall 06 storm drain system.
After a pipe segment had been cleaned, the mobile CCTV truck was positioned at the upstream
structure and a robotic crawler camera equipped with a multi-angle lens was inserted into the
drainage pipe to video inspect the downstream structure. All observations were recorded on a
hard drive, and an audio commentary accompanied the video inspection.
Repairs using brick, concrete, grout, and cast iron frames and covers were performed as cleaning
of the Block E storm drain system progressed. Crushed stone backfill and concrete or vegetative
surface finishes were used as needed to return the structure/location to its original or better
condition. Upon completion of the IRM, all disturbed areas were restored to approximately
pre-existing grades. Seed and topsoil were distributed across all disturbed vegetated areas. Land
surveys, photographs, and a post-cleaning video survey of the Block E drainage pipes document
site restoration activities. Sediment controls, including silt fences and hay bales, were then
installed around catch basins and manholes to minimize sediment reentering cleaned drain lines.
7903 TETRA TECH • LOCKHEED MARTIN MIDDLE RIVER COMPLEX •2012 ADDITIONAL BLOCK E SOIL INVESTIGATION REPORT PAGE 2-28
2.3.15 Pilot Injection Program (Fall 2011)
An injection pilot test was performed in November 2011 in the southeastern portion of Block E
in the area of the 500,000-gallon water tank to determine key design parameters for a full-scale
bioremediation system for the eastern TCE plume (Tetra Tech, 2012g). The test layout consisted
of an injection well screened at a depth interval of 15–35 feet and three monitoring well clusters
approximately five feet, 10 feet, and 15 feet from the injection well. Each monitoring well cluster
consisted of two monitoring points: a deep interval (25–35 feet) and a shallow interval
(10–20 feet).
Three separate 24-hour injection tests were performed at Block E: (1) a low-rate test
(approximately 0.3 gallon per minute); (2) an intermediate-rate test (approximately 0.5 gallon per
minute); and (3) a high-rate test (approximately one gallon per minute). Each test was performed
by injecting an aqueous sodium-bromide tracer solution into the injection well and monitoring
injection effects in nearby monitoring well clusters and from nearby storm drain catch basins.
Changes in hydraulic head and bromide tracer detections were used to evaluate the injections’
radii of influence.
During the high-rate test, the water level in the injection well was only approximately five feet
above the static level (approximately three feet below ground surface). The bromide tracer was
detected in all Block E deeper monitoring wells monitored for the test. In contrast, no bromide
tracer was detected in any shallow Block E well monitored for the test. This confirms that the
deeper interval in Block E is more permeable as compared to the shallow portion of the
formation, and that a degree of hydraulic isolation occurs between the shallow and deeper zones.
Following the high-rate injection test, an elevated bromide concentration (1.7 mg/L versus
0.1 mg/L baseline) was detected in the Block E catch basin MH-10/IL-3, north and hydraulically
upgradient of the test area. For design purposes, we have assumed that bromide traveled from the
injection well to catch basin MH-10/IL-3, perhaps via a preferential pathway. Detection of
bromide in the storm sewer system during the pilot test demands that particular care be taken in
the design and implementation of the full-scale bioremediation system to be installed in Block E.
7903 TETRA TECH • LOCKHEED MARTIN MIDDLE RIVER COMPLEX •2012 ADDITIONAL BLOCK E SOIL INVESTIGATION REPORT PAGE 2-29
2.3.16 Blocks E and G Pre-Design Soil Sampling Investigation(Summer 2012)
A soil investigation (Tetra Tech, 2012h) was conducted in June 2012 to support the design of the
Block E groundwater treatment system. The pre-design soil sampling program consisted of
collecting and chemically analyzing soil samples from the ground surface to 10 feet below grade
at 25 locations in and around the footprint of the planned groundwater remediation system at
Block E. The locations of the pre-design soil borings are shown in Figure 2-10. The purpose of
this investigation of the Block E area was to refine the limits of impacted soil at the planned
treatment area and to determine cut lines for excavation and proper disposal of any soils
removed. Samples were analyzed for PCBs, PAHs, and TPH-DRO/GRO. Ten samples were
analyzed for CrVI, metals, and pesticides.
The pre-design investigation delineated PCBs in soils at the planned Block E groundwater
treatment system area. The maximum pre-design sample PCB concentration in Block E was
320 mg/kg, detected in boring E-SB-890 at a depth of zero to two feet below grade
(Figure 2-10). PCB concentrations decreased to 3 mg/kg at a depth of 2–4 feet in the same boring.
Boring E-SB-890 was advanced in the location of a former 500,000-gallon diesel fuel tank. Most
of the PCB concentrations detected above the remediation goal of 1 mg/kg are limited to the top
two feet of soil in and around the 500,000-gallon water tank in the southwest corner of Block E.
BaPEq concentrations in the pre-design soil samples range from less than 3.5 µg/kg to a
maximum of 2,104 µg/kg in sample E-SB-897-0–2. The residential screening level of 140 µg/kg
was exceeded in seven samples. Most of the BaPEq exceedances were in the grass covered area
surrounding the water tank, and were collected in the 0–2 foot interval. An exception is sample
E-SB-906-6–10, which was collected north of the water tank at a depth of six to 10 feet below
grade.
TPH-DRO was detected in eight samples (plus one duplicate) from three soil borings (E-SB-890,
E-SB-905 and E-SB-906), and at various depths. Several samples had concentrations in excess of
the residential screening level of 230 mg/kg. The highest concentrations of TPH-DRO in the
pre-design samples (15,000 and 4,800 mg/kg) were observed beneath the basement floor of
former Building D (samples E-SB-905-6–10 and E-SB-906-6–10), at a depth of six to 10 feet
below grade.
7903 TETRA TECH • LOCKHEED MARTIN MIDDLE RIVER COMPLEX •2012 ADDITIONAL BLOCK E SOIL INVESTIGATION REPORT PAGE 2-30
CrVI and pesticide concentrations in Block E soil samples were below their respective
residential screening levels in the 10 samples analyzed. Metals such as arsenic and vanadium
were detected in soils collected from 10 sampling locations. However, none of these metals
exceeded their residential screening levels.
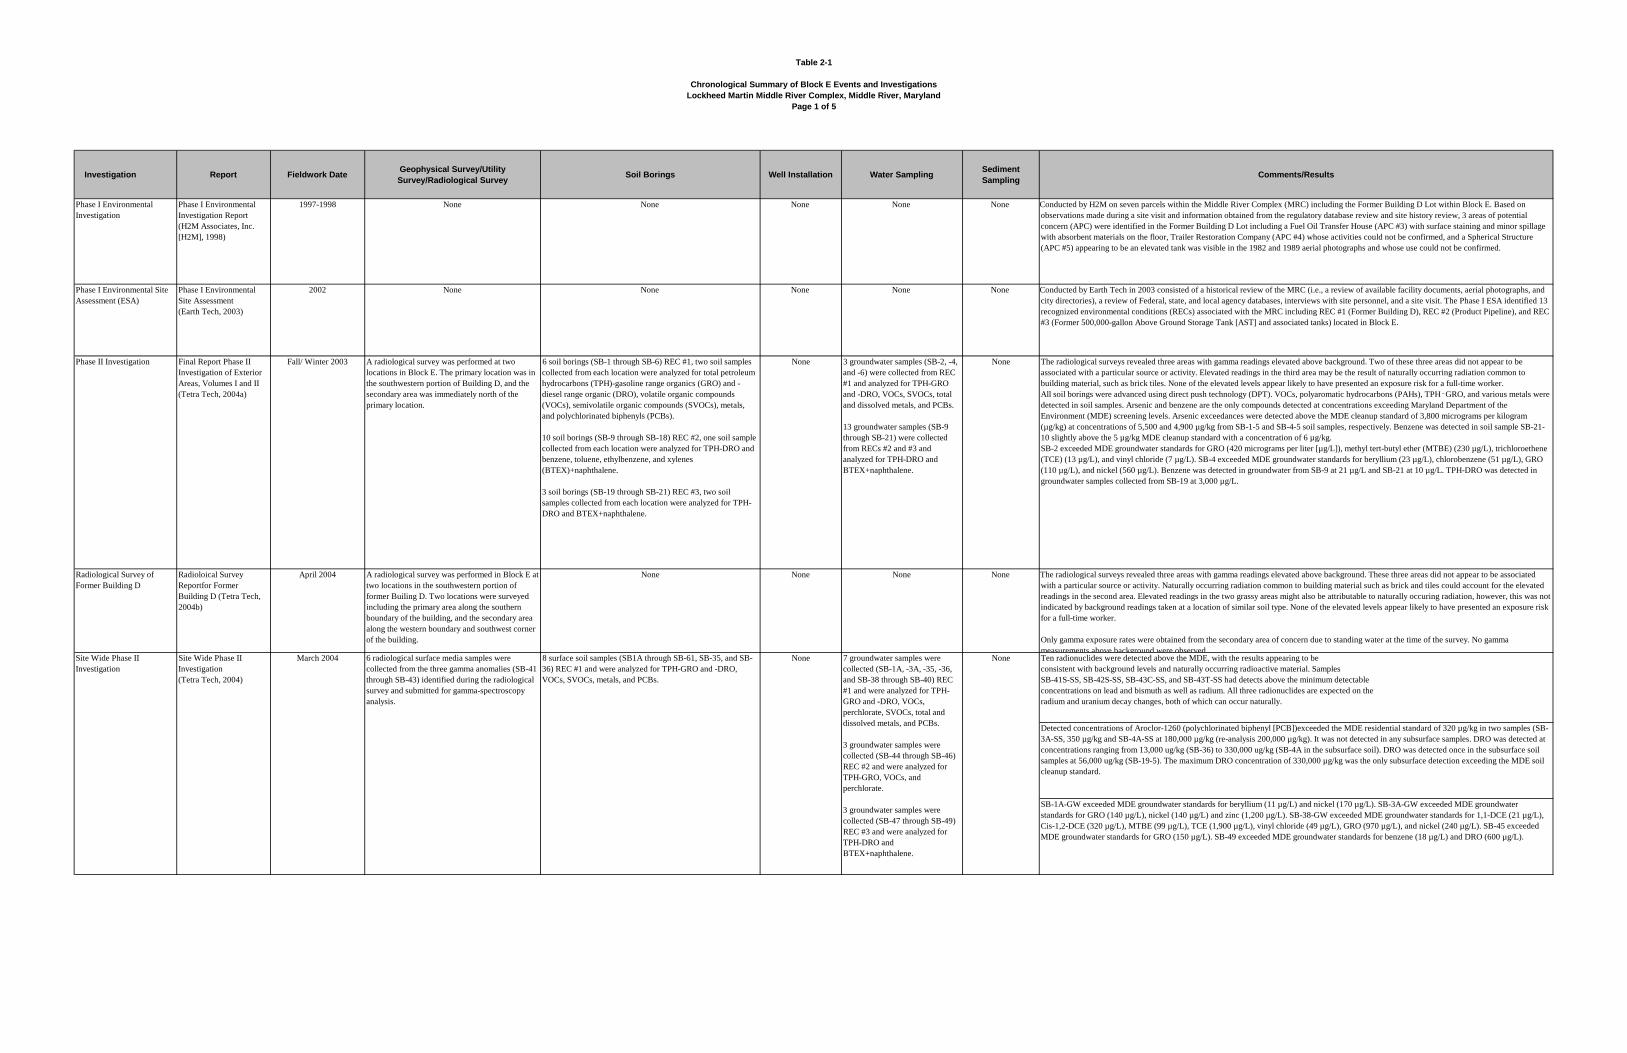
Table 2-1
Chronological Summary of Block E Events and Investigations
Lockheed Martin Middle River Complex, Middle River, Maryland
Page 1 of 5
Investigation Report Fieldwork DateGeophysical Survey/Utility
Survey/Radiological SurveySoil Borings Well Installation Water Sampling
Sediment
SamplingComments/Results
Phase I Environmental
Investigation
Phase I Environmental
Investigation Report
(H2M Associates, Inc.
[H2M], 1998)
1997-1998 None None None None None Conducted by H2M on seven parcels within the Middle River Complex (MRC) including the Former Building D Lot within Block E. Based on
observations made during a site visit and information obtained from the regulatory database review and site history review, 3 areas of potential
concern (APC) were identified in the Former Building D Lot including a Fuel Oil Transfer House (APC #3) with surface staining and minor spillage
with absorbent materials on the floor, Trailer Restoration Company (APC #4) whose activities could not be confirmed, and a Spherical Structure
(APC #5) appearing to be an elevated tank was visible in the 1982 and 1989 aerial photographs and whose use could not be confirmed.
Phase I Environmental Site
Assessment (ESA)
Phase I Environmental
Site Assessment
(Earth Tech, 2003)
2002 None None None None None Conducted by Earth Tech in 2003 consisted of a historical review of the MRC (i.e., a review of available facility documents, aerial photographs, and
city directories), a review of Federal, state, and local agency databases, interviews with site personnel, and a site visit. The Phase I ESA identified 13
recognized environmental conditions (RECs) associated with the MRC including REC #1 (Former Building D), REC #2 (Product Pipeline), and REC
#3 (Former 500,000-gallon Above Ground Storage Tank [AST] and associated tanks) located in Block E.
Radiological Survey of
Former Building D
Radioloical Survey
Reportfor Former
Building D (Tetra Tech,
2004b)
April 2004 A radiological survey was performed in Block E at
two locations in the southwestern portion of
former Builing D. Two locations were surveyed
including the primary area along the southern
boundary of the building, and the secondary area
along the western boundary and southwest corner
of the building.
None None None None The radiological surveys revealed three areas with gamma readings elevated above background. These three areas did not appear to be associated
with a particular source or activity. Naturally occurring radiation common to building material such as brick and tiles could account for the elevated
readings in the second area. Elevated readings in the two grassy areas might also be attributable to naturally occuring radiation, however, this was not
indicated by background readings taken at a location of similar soil type. None of the elevated levels appear likely to have presented an exposure risk
for a full-time worker.
Only gamma exposure rates were obtained from the secondary area of concern due to standing water at the time of the survey. No gamma
measurements above background were observed.Ten radionuclides were detected above the MDE, with the results appearing to be
consistent with background levels and naturally occurring radioactive material. Samples
SB-41S-SS, SB-42S-SS, SB-43C-SS, and SB-43T-SS had detects above the minimum detectable
concentrations on lead and bismuth as well as radium. All three radionuclides are expected on the
radium and uranium decay changes, both of which can occur naturally.
Detected concentrations of Aroclor-1260 (polychlorinated biphenyl [PCB])exceeded the MDE residential standard of 320 µg/kg in two samples (SB-
3A-SS, 350 µg/kg and SB-4A-SS at 180,000 µg/kg (re-analysis 200,000 µg/kg). It was not detected in any subsurface samples. DRO was detected at
concentrations ranging from 13,000 ug/kg (SB-36) to 330,000 ug/kg (SB-4A in the subsurface soil). DRO was detected once in the subsurface soil
samples at 56,000 ug/kg (SB-19-5). The maximum DRO concentration of 330,000 µg/kg was the only subsurface detection exceeding the MDE soil
cleanup standard.
SB-1A-GW exceeded MDE groundwater standards for beryllium (11 µg/L) and nickel (170 µg/L). SB-3A-GW exceeded MDE groundwater
standards for GRO (140 µg/L), nickel (140 µg/L) and zinc (1,200 µg/L). SB-38-GW exceeded MDE groundwater standards for 1,1-DCE (21 µg/L),
Cis-1,2-DCE (320 µg/L), MTBE (99 µg/L), TCE (1,900 µg/L), vinyl chloride (49 µg/L), GRO (970 µg/L), and nickel (240 µg/L). SB-45 exceeded
MDE groundwater standards for GRO (150 µg/L). SB-49 exceeded MDE groundwater standards for benzene (18 µg/L) and DRO (600 µg/L).
Phase II Investigation
6 radiological surface media samples were
collected from the three gamma anomalies (SB-41
through SB-43) identified during the radiological
survey and submitted for gamma-spectroscopy
analysis.
March 2004Site Wide Phase II
Investigation
(Tetra Tech, 2004)
Site Wide Phase II
Investigation
Fall/ Winter 2003Final Report Phase II
Investigation of Exterior
Areas, Volumes I and II
(Tetra Tech, 2004a)
None3 groundwater samples (SB-2, -4,
and -6) were collected from REC
#1 and analyzed for TPH-GRO
and -DRO, VOCs, SVOCs, total
and dissolved metals, and PCBs.
13 groundwater samples (SB-9
through SB-21) were collected
from RECs #2 and #3 and
analyzed for TPH-DRO and
BTEX+naphthalene.
None6 soil borings (SB-1 through SB-6) REC #1, two soil samples
collected from each location were analyzed for total petroleum
hydrocarbons (TPH)-gasoline range organics (GRO) and -
diesel range organic (DRO), volatile organic compounds
(VOCs), semivolatile organic compounds (SVOCs), metals,
and polychlorinated biphenyls (PCBs).
10 soil borings (SB-9 through SB-18) REC #2, one soil sample
collected from each location were analyzed for TPH-DRO and
benzene, toluene, ethylbenzene, and xylenes
(BTEX)+naphthalene.
3 soil borings (SB-19 through SB-21) REC #3, two soil
samples collected from each location were analyzed for TPH-
DRO and BTEX+naphthalene.
A radiological survey was performed at two
locations in Block E. The primary location was in
the southwestern portion of Building D, and the
secondary area was immediately north of the
primary location.
The radiological surveys revealed three areas with gamma readings elevated above background. Two of these three areas did not appear to be
associated with a particular source or activity. Elevated readings in the third area may be the result of naturally occurring radiation common to
building material, such as brick tiles. None of the elevated levels appear likely to have presented an exposure risk for a full-time worker.
All soil borings were advanced using direct push technology (DPT). VOCs, polyaromatic hydrocarbons (PAHs), TPH‑GRO, and various metals were
detected in soil samples. Arsenic and benzene are the only compounds detected at concentrations exceeding Maryland Department of the
Environment (MDE) screening levels. Arsenic exceedances were detected above the MDE cleanup standard of 3,800 micrograms per kilogram
(µg/kg) at concentrations of 5,500 and 4,900 µg/kg from SB-1-5 and SB-4-5 soil samples, respectively. Benzene was detected in soil sample SB-21-
10 slightly above the 5 µg/kg MDE cleanup standard with a concentration of 6 µg/kg.
SB-2 exceeded MDE groundwater standards for GRO (420 micrograms per liter [µg/L]), methyl tert-butyl ether (MTBE) (230 µg/L), trichloroethene
(TCE) (13 µg/L), and vinyl chloride (7 µg/L). SB-4 exceeded MDE groundwater standards for beryllium (23 µg/L), chlorobenzene (51 µg/L), GRO
(110 µg/L), and nickel (560 µg/L). Benzene was detected in groundwater from SB-9 at 21 µg/L and SB-21 at 10 µg/L. TPH-DRO was detected in
groundwater samples collected from SB-19 at 3,000 µg/L.
None7 groundwater samples were
collected (SB-1A, -3A, -35, -36,
and SB-38 through SB-40) REC
#1 and were analyzed for TPH-
GRO and -DRO, VOCs,
perchlorate, SVOCs, total and
dissolved metals, and PCBs.
3 groundwater samples were
collected (SB-44 through SB-46)
REC #2 and were analyzed for
TPH-GRO, VOCs, and
perchlorate.
3 groundwater samples were
collected (SB-47 through SB-49)
REC #3 and were analyzed for
TPH-DRO and
BTEX+naphthalene.
None8 surface soil samples (SB1A through SB-61, SB-35, and SB-
36) REC #1 and were analyzed for TPH-GRO and -DRO,
VOCs, SVOCs, metals, and PCBs.
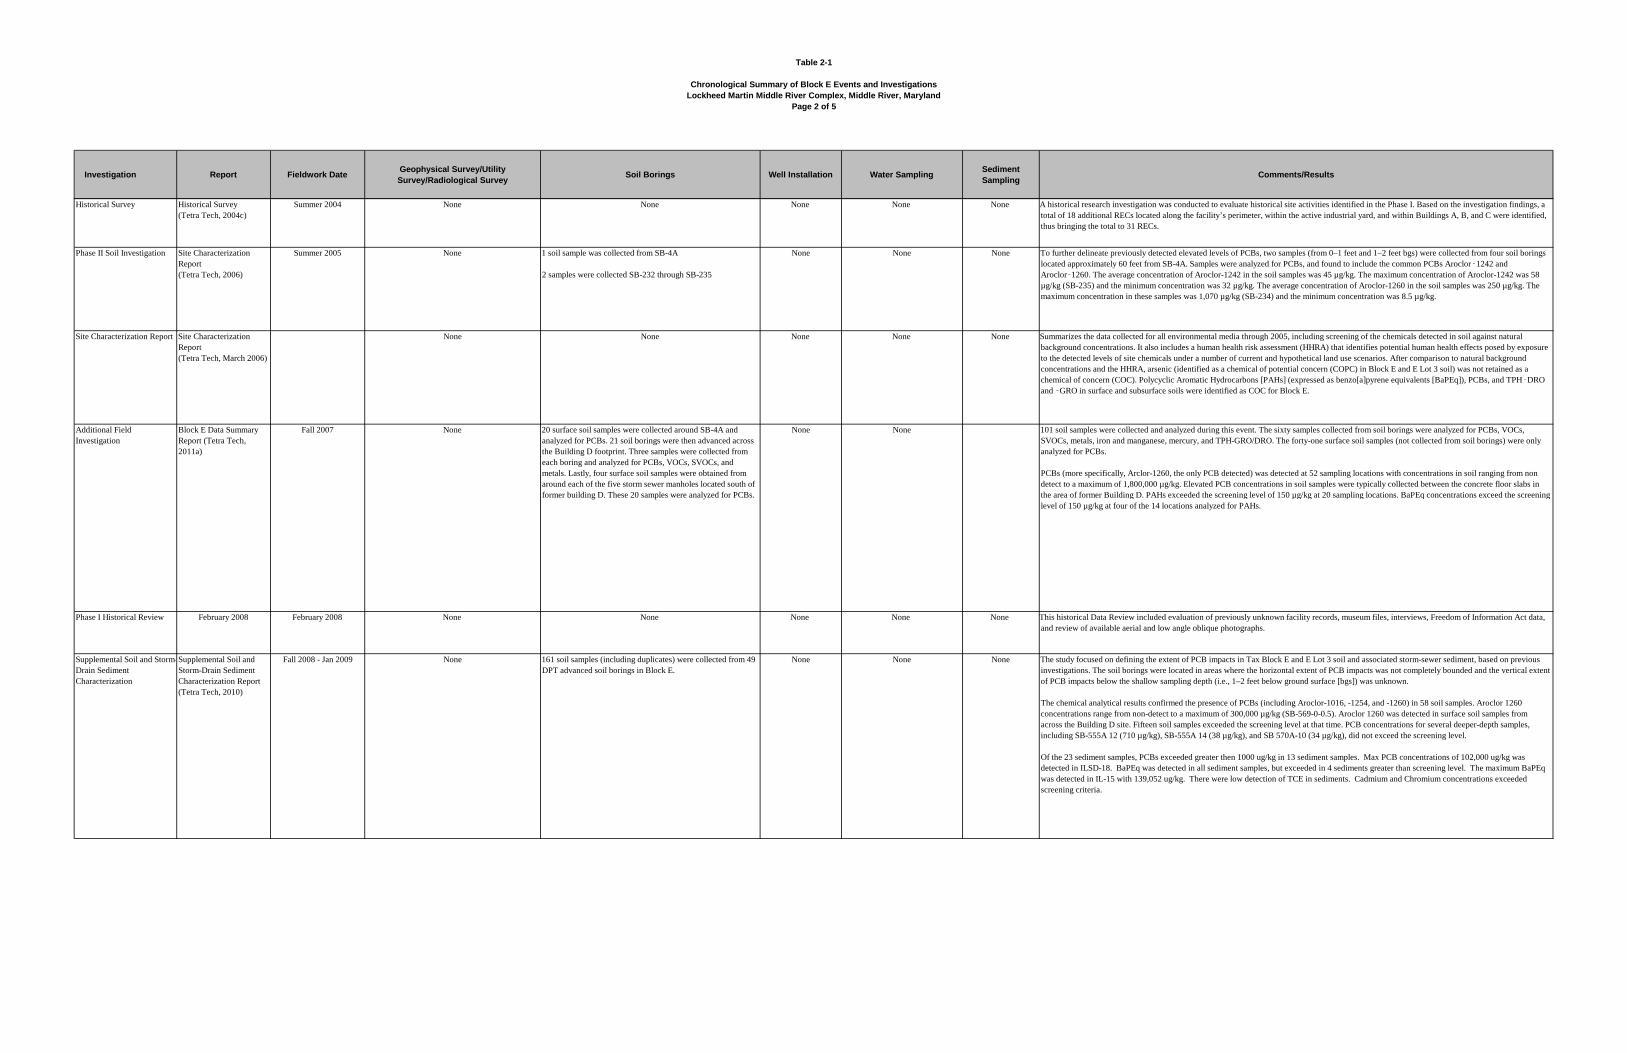
Table 2-1
Chronological Summary of Block E Events and Investigations
Lockheed Martin Middle River Complex, Middle River, Maryland
Page 2 of 5
Investigation Report Fieldwork DateGeophysical Survey/Utility
Survey/Radiological SurveySoil Borings Well Installation Water Sampling
Sediment
SamplingComments/Results
Historical Survey Historical Survey
(Tetra Tech, 2004c)
Summer 2004 None None None None None A historical research investigation was conducted to evaluate historical site activities identified in the Phase I. Based on the investigation findings, a
total of 18 additional RECs located along the facility’s perimeter, within the active industrial yard, and within Buildings A, B, and C were identified,
thus bringing the total to 31 RECs.
Phase II Soil Investigation Site Characterization
Report
(Tetra Tech, 2006)
Summer 2005 None 1 soil sample was collected from SB-4A
2 samples were collected SB-232 through SB-235
None None None To further delineate previously detected elevated levels of PCBs, two samples (from 0–1 feet and 1–2 feet bgs) were collected from four soil borings
located approximately 60 feet from SB-4A. Samples were analyzed for PCBs, and found to include the common PCBs Aroclor‑1242 and
Aroclor‑1260. The average concentration of Aroclor-1242 in the soil samples was 45 µg/kg. The maximum concentration of Aroclor-1242 was 58
µg/kg (SB-235) and the minimum concentration was 32 µg/kg. The average concentration of Aroclor-1260 in the soil samples was 250 µg/kg. The
maximum concentration in these samples was 1,070 µg/kg (SB-234) and the minimum concentration was 8.5 µg/kg.
Site Characterization Report Site Characterization
Report
(Tetra Tech, March 2006)
None None None None None Summarizes the data collected for all environmental media through 2005, including screening of the chemicals detected in soil against natural
background concentrations. It also includes a human health risk assessment (HHRA) that identifies potential human health effects posed by exposure
to the detected levels of site chemicals under a number of current and hypothetical land use scenarios. After comparison to natural background
concentrations and the HHRA, arsenic (identified as a chemical of potential concern (COPC) in Block E and E Lot 3 soil) was not retained as a
chemical of concern (COC). Polycyclic Aromatic Hydrocarbons [PAHs] (expressed as benzo[a]pyrene equivalents [BaPEq]), PCBs, and TPH‑DRO
and ‑GRO in surface and subsurface soils were identified as COC for Block E.
Additional Field
Investigation
Block E Data Summary
Report (Tetra Tech,
2011a)
Fall 2007 None 20 surface soil samples were collected around SB-4A and
analyzed for PCBs. 21 soil borings were then advanced across
the Building D footprint. Three samples were collected from
each boring and analyzed for PCBs, VOCs, SVOCs, and
metals. Lastly, four surface soil samples were obtained from
around each of the five storm sewer manholes located south of
former building D. These 20 samples were analyzed for PCBs.
None None 101 soil samples were collected and analyzed during this event. The sixty samples collected from soil borings were analyzed for PCBs, VOCs,
SVOCs, metals, iron and manganese, mercury, and TPH-GRO/DRO. The forty-one surface soil samples (not collected from soil borings) were only
analyzed for PCBs.
PCBs (more specifically, Arclor-1260, the only PCB detected) was detected at 52 sampling locations with concentrations in soil ranging from non
detect to a maximum of 1,800,000 µg/kg. Elevated PCB concentrations in soil samples were typically collected between the concrete floor slabs in
the area of former Building D. PAHs exceeded the screening level of 150 µg/kg at 20 sampling locations. BaPEq concentrations exceed the screening
level of 150 µg/kg at four of the 14 locations analyzed for PAHs.
Phase I Historical Review February 2008 February 2008 None None None None None This historical Data Review included evaluation of previously unknown facility records, museum files, interviews, Freedom of Information Act data,
and review of available aerial and low angle oblique photographs.
Supplemental Soil and Storm-
Drain Sediment
Characterization
Supplemental Soil and
Storm-Drain Sediment
Characterization Report
(Tetra Tech, 2010)
Fall 2008 - Jan 2009 None 161 soil samples (including duplicates) were collected from 49
DPT advanced soil borings in Block E.
None None None The study focused on defining the extent of PCB impacts in Tax Block E and E Lot 3 soil and associated storm-sewer sediment, based on previous
investigations. The soil borings were located in areas where the horizontal extent of PCB impacts was not completely bounded and the vertical extent
of PCB impacts below the shallow sampling depth (i.e., 1–2 feet below ground surface [bgs]) was unknown.
The chemical analytical results confirmed the presence of PCBs (including Aroclor-1016, -1254, and -1260) in 58 soil samples. Aroclor 1260
concentrations range from non-detect to a maximum of 300,000 µg/kg (SB-569-0-0.5). Aroclor 1260 was detected in surface soil samples from
across the Building D site. Fifteen soil samples exceeded the screening level at that time. PCB concentrations for several deeper-depth samples,
including SB-555A 12 (710 µg/kg), SB-555A 14 (38 µg/kg), and SB 570A-10 (34 µg/kg), did not exceed the screening level.
Of the 23 sediment samples, PCBs exceeded greater then 1000 ug/kg in 13 sediment samples. Max PCB concentrations of 102,000 ug/kg was
detected in ILSD-18. BaPEq was detected in all sediment samples, but exceeded in 4 sediments greater than screening level. The maximum BaPEq
was detected in IL-15 with 139,052 ug/kg. There were low detection of TCE in sediments. Cadmium and Chromium concentrations exceeded
screening criteria.

Table 2-1
Chronological Summary of Block E Events and Investigations
Lockheed Martin Middle River Complex, Middle River, Maryland
Page 3 of 5
Investigation Report Fieldwork DateGeophysical Survey/Utility
Survey/Radiological SurveySoil Borings Well Installation Water Sampling
Sediment
SamplingComments/Results
To delineate the areas of concern in Block E, this DPT soil characterization was executed to define the lateral and vertical (as defined by
groundwater) boundaries of COCs as defined in the Site Characterization Report. Soil boring E-SB-833 at 9 feet bgs contains VOCs, semivolatile
organic compounds (SVOCs), PCBs, inorganics, and TPH-DRO and -GRO. Exceedances include PCBs, arsenic, iron, and TPH-DRO. These
extremely high concentrations led to advancement of 14 additional soil borings, E-SB-833A through E-SB-833N in this area.
Evaluation of the data collected in 2010 verifies the presence of PAHs, PCBs, and TPH-DRO and -GRO in the soils in 36 of the 44 soil borings,
including the 14 soil borings associated with E-SB-833. BaPEq concentrations exceed the screening level of 150 micrograms per kilogram at four of
the 14 locations analyzed for PAHs. PCBs concentrations typically ranged from non-detect to less than 1,000 micrograms per kilogram with six
exceptions ranging from 3,500 to 24,000,000 micrograms per kilogram at the initial boring locations in subsurface soils.
The additional 14 soil borings around E-SB-833 confirmed areas of PCB impacts with sample results ranging from non detectable to a maximum of
2,000,000 µg/kg (E SB 833A-10). Although most of the concrete samples had low PCB concentrations (below 1,000 µg/kg), one concrete sample
(from E-SB-833F) detected maximum PCBs 1,600,000 µg/kg. Dichloro and trichloro benzenes were also detected in multiple soil samples in the E-
SB-833 series soils (A through N). PAHs (reported in terms of BaPEq) exceeded the screening level of 150 µg/kg in seven of the 59 E-SB-833 series
soils analyzed, distributed among four of the 14 soil borings. BaPEq concentrations range from non detectable to 1,788 µg/kg (at E-SB-833K-02).
TPH-DRO exceeded screening levels in soil boring E-SB-828 at 9 feet bgs, E-SB-833 at 9 feet bgs, in the electric manhole water sample (adjacent to
E-SB-833), and between 2 and 10 feet bgs at several of the E-SB-833 series borings (E-SB-833A, E-SB-833BE, E-SB-833I, E-SB-833K, and E-SB-
833L). Results by the manhole also indicate TPH-GRO.
Human Health Risk
Assessment for Block D, E,
F, G, and H Soils
Tetra Tech, (2012a) An HHRA was completed in early 2011 for soil at Block E as well as other tax blocks at the MRC. This HHRA was an update to the risk
evaluations in the May 2006 Site Characterization Report (Tetra Tech, 2006b).The objective of the HHRA was to identify chemical contaminants
of concern (CoC) that may pose risks to human health, and to determine if the detected chemical concentrations in soil at Block E pose a significant
threat to potential human receptors under current and/or future land uses.
Cancer and non cancer risk estimates were calculated for construction workers, industrial workers, commercial land-use receptors, and current and
future child, adolescent, and adult recreational user receptors using reasonable maximum exposure assumptions and assuming that human exposure
may occur via incidental ingestion, dermal contact, and inhalation exposure routes.
Polychlorinated biphenyls (PCBs), benzo(a)pyrene equivalents (BaPEq, 1,2,3,-trichlorobenzene (123-TCB), 1,2,4,-trichlorobenzene (124-TCB),
and 1,4-dichlorobenzene (1,4-DCB) had risk estimated exceeding risk benchmarks for hypothetical future full-time workers.
Polychlorinated biphenyls (PCBs), benzo(a)pyrene equivalents (BaPEq), 1,2,4,-trichlorobenzene (124-TCB), hexavalent chromium (CrVI), and 1,4-
dichlorobenzene (1,4-DCB) had risk estimated exceeding risk benchmarks for hypothetical future residents.
Additional Block E
Characterization
Tetra Tech (2012b) July and August 2011 None Initial phase: July 2011- 93 soil samples were collected from
12 soil borings in Block E in four foot increments to 30 feet
bgs.
Follow-on Phase: August 2011- Follow-up sampling included 2
surface soil samples collected from each of 13 locations (at one
location only one sample was collected) to two feet bgs along
with 3 concrete samples to 0.1 feet bgs. All samples were
analyzed for PCBs. Thus a total of 25 surface soils and 3
concrete samples were collected.
None None None Of the soil samples collected from borings advanced to 32 feet, 22 samples exceeded the MDE residential screening criteria, 18 of which also exceed
the non-residential screening criteria. Additional samples were collected from borings advanced to two feet bgs to further define the extent of PCB
impacts. 22 of the 26 soil samples collected from borings advanced to 2 feet exceeded the MDE residential screening criteria, 19 of which also
exceed the non-residential screening criteria. Only one of the concrete samples exceeded the MDE residential screening criteria.
Based on analysis of July 2011 preliminary data, the average concentration for soil samples with detectable levels of PCBs in the soil borings
advanced to 32 feet was 719,566 µg/kg. The maximum concentration in these samples was 19,000,000 µg/kg (E-SB-853-12) and the minimum
concentration was 1.3 µg/kg (E-SB-850-04).
The follow-up sampling in August 2011 was focused on surface soils and 3 concrete samples. The average concentration for surface soil samples
with detectable levels of PCBs in the soil borings advanced to two feet was 163,390 µg/kg. The maximum concentration in these samples was
1,100,000 µg/kg (E-SB-864-SB-0.0-0.5) and the minimum concentration was 1.3 µg/kg (E-SB-866-SB-0.5-2.0).
Validated data collected during the following environmental investigations were used to assess risks to potential human receptors:
• Phase II site investigation (fall/winter 2003)
• Site wide Phase II investigation (2004)
• Phase II soil investigation (summer 2005)
• Additional soil characterization (fall 2007)
• Supplemental soil and storm-drain-sediment characterization (Block E fall 2008)
• Final soil delineation (Blocks D, F, G, and H fall 2009)
• Data gap investigation (fall 2010)
2010 Data Gap Investigation Block E Data Summary
Report (Tetra Tech,
2011a)
Summer and Fall 2010 None Eight samples were collected in two-foot intervals at each of 30
soil borings. Concrete samples were collected from 14 of these
30 boring locations. Soil and concrete samples were analyzed
for PCBs with 21 soil samples also being analyzed for PAHs.
Additional concrete samples and soil samples at two-foot
increments were collected from each of 14 borings advanced
around E-SB-833. The soil and concrete samples were
analyzed for PCBs. All soil samples were also analyzed for
VOCs, and PAHs. In addition, soil samples from six of the 14
locations were also analyzed for TPH-GRO/DRO (one only
analyzed for TPH-GRO).
None One water sample was collected
from the electric manhole adjacent
to E-SB-833 and analyzed for
VOCs, PCBs, and TPH-
GRO/DRO
None

Table 2-1
Chronological Summary of Block E Events and Investigations
Lockheed Martin Middle River Complex, Middle River, Maryland
Page 4 of 5
Investigation Report Fieldwork DateGeophysical Survey/Utility
Survey/Radiological SurveySoil Borings Well Installation Water Sampling
Sediment
SamplingComments/Results
Human Health Risk
Assessment Update for
Block E Soils
Tetra Tech (2011c) Cleanup goals were developed for those environmental media with incremental lifetime cancer risk (ILCRs) greater than 1×10 5 and a total hazard
index (HI) greater than 1.0. Cleanup goals were derived for those contaminants of concern (COC) that contribute significantly to the cancer risk
and/or hazard index for each exposure pathway in a given land use scenario for a receptor group. Cleanup goals were calculated for Industrial
workers in the Tilley Chemical Company Area and lawn mower operators as those for Block E industrial workers had already been calculated in the
HHRA for Tax Blocks D, E, F, G, and H.
Industrial workers in the Tilley Chemical Company Area had ILCRs exceeding USEPA’s target-risk range for some scenarios and MDE’s target level
for all scenarios except when the inhalation only exposure route was evaluated. HIs for industrial workers in the Tilley Chemical Company area
exceed 1 in most scenarios; however, HIs for Scenarios 5 and 6 and for the inhalation only evaluation do not exceed 1. The inhalation exposure route
is the most likely exposure route for current receptors, and worker exposure via ingestion and dermal contact is currently highly unlikely.
ILCRs for the lawn mower operator do not exceed USEPA’s target risk range. The lawn mower operator ILCR for the reasonable maximum exposure
(RME) exceeds MDE’s target level, but the ILCR for the central tendency exposure (CTE) is less than MDE’s target level. The HI for the lawn
mower operator exceeds the target level of 1 for the RME but is less than 1 for the CTE. Given the very limited potential for lawn mower operator
contact with surface soils, the CTE scenario is most likely (versus the RME scenario) reflective of current exposures incurred by the receptor.
Utility Cross-Connection
Investigation Report
Tetra Tech (2012d) Summer 2011 Geophysical surveys consisting of a pipe- and
cable-locator survey and mark‑out, and an
electromagnetic (EM) survey survey were
performed in June 2011 to locate and mark the
horizontal boundaries of underground utilities and
piping Block E. The utility and EM surveys were
used to locate subsurface anomalies possibly
associated with buried objects and utilities, such
as catch basins, drains, sumps, pits, piping,
manholes, etc.
None None This investigation used several
techniques to locate, record, and
map subsurface utilities that may
act as preferential pathways for
groundwater contaminants.
None In 2011, a utility cross‑connection (UCC) investigation was completed for the southeastern portion of Block E area to design a pilot‑scale
groundwater-injection tracer test and the full‑scale groundwater remedial-system design. The UCC investigation included reviews of historical
drawings, employee interviews, site reconnaissance, geophysical surveys, field and closed-circuit television (CCTV) inspections of storm-drains and
professional land surveying to locate, record, and map subsurface utilities that may act as preferential migration pathways for groundwater
contaminants or bioremediation substrates that may be used to remedy VOCs in groundwater.
Historical and current utility records, site reconnaissance, and geophysical surveys indicate numerous underground utilities, an unknown linear
geophysical-anomaly, and an unknown area geophysical-anomaly in the Block E study area. Underground utilities include electrical lines,
telecommunication lines, domestic- and fire‑water lines, a former fuel pipeline, and storm drains.
Block E Storm Drain System
Interim Remedial Measures
Final Site Remediation
Report
Tetra Tech (2012f) Summer and Fall 2011 None None None None None A storm drain IRM removed sediment and debris from the drainage system piping and manholes, provided sediment controls, and repaired or
replaced inlets and manholes at Block E in the fall of 2011 to minimize the transport of contaminated sediments in the storm drain system to off‑site
locations and to allow free drainage of the Block E area.
Injection Pilot Test Tetra Tech (2012g) Fall 2011 Yes. To locate potential underground utilities for
well installation
None Installed injection well
and observation wells
for bromide injection
test in Block E
Sampling for bromide in
groundwater in wells and
surface water in catch basins
None An injection pilot test was performed in the southeastern portion of Block E in the area of the 500,000-gallon water tank to determine key design
parameters for a full scale bioremediation system for the eastern TCE plume. The test layout consisted of an injection well screened at a depth
interval of 15–35 feet and three monitoring well clusters approximately five feet, 10 feet, and 15 feet from the injection well. Each monitoring well
cluster consisted of two monitoring points: a deep interval (25–35 feet) and a shallow interval (10–20 feet).
Three separate 24 hour injection tests were performed at Block E: (1) a low rate test (approximately 0.3 gallon per minute); (2) an intermediate rate
test (approximately 0.5 gallon per minute); and (3) a high rate test (approximately 1 gallon per minute). Each test was performed by injecting an
aqueous sodium bromide tracer solution into the injection well and monitoring injection effects in nearby monitoring well clusters and from nearby
storm drain catch basins. Changes in hydraulic head and bromide tracer detections were used to evaluate the injections’ radii of influence.
During the high rate test, the water level in the injection well was only approximately five feet above the static level (approximately three feet below
ground surface). The bromide tracer was detected in all Block E deeper monitoring wells monitored for the test. In contrast, no bromide tracer was
detected in any shallow Block E well monitored for the test. Because of the detection of bromide in the storm sewer system during the pilot test,
particular care was recommended during the design and implementation of the full scale bioremediation system to be installed in Block E.
Validated data collected during the following environmental investigations were used to assess risks to potential human receptors:
• site wide Phase II investigation (2004)
• additional soil characterization (fall 2007)
• supplemental soil and storm-drain-sediment characterization (Block E fall 2008)
• data-gap investigation (fall 2010)
• additional investigation (summer 2011)

Table 2-1
Chronological Summary of Block E Events and Investigations
Lockheed Martin Middle River Complex, Middle River, Maryland
Page 5 of 5
Investigation Report Fieldwork DateGeophysical Survey/Utility
Survey/Radiological SurveySoil Borings Well Installation Water Sampling
Sediment
SamplingComments/Results
Block E and G Pre-Design
Soil Sampling Investigation
Tetra Tech (2012h) Summer 2012 Yes. To locate potential underground utilities for
soil borings.
Twenty-five soil borings were advanced at 25 locations at
Block E. Most of the soil borings were advanced to a
maximum depth of ten feet using DP. Three borings in Block E
(E‑SB‑894, E‑SB‑898, and E‑SB‑902) were advanced to a
depth of 15 feet below grade to confirm that the deepest
sample from each boring was collected in the groundwater
table. Three samples were collected from soil boring and
checmially analyzed for various analytes. The analysis include
PCBs, PAHS, TPH-GRO/DRO, metals, hexavalent chromium
and pesticides.
None None None The 2012 investigation verified the continued presence of polychlorinated biphenyls (PCBs) in soils at Block E. The maximum PCB concentration
was 320 mg/kg, detected in boring E-SB-890 at 0 to 2 feet; concentrations decreased to 3 mg/kg at a depth of 2-4 feet in the same boring. Boring E-
SB-890 was advanced in the location of a former 500,000-gallon diesel fuel tank. Most of the PCB detections are confined to top two feet of soil in
and around the 500,000-gallon water tank in the southwest corner of Block E.
Polycyclic aromatic hydrocarbons (PAHs), expressed as benzo(a)pyrene equivalents (BaPEq), are also considered a primary risk driver in Block E
soils. BaPEq concentrations ranged from less than 3.5 µg/kg to a maximum of 2,104 µg/kg n sample E-SB-897-0-2. The residential screening
criterion of 140 µg/kg was exceeded in seven samples. Most of the BaPEq exceedances were located in the grass covered area surrounding the water
tank, and were collected in the 0-2 feet interval. An exception is sample E-SB-906-6-10, which was collected from a location north of the water tank
at a depth of 6-10 feet below grade.
Total petroleum hydrocarbons-diesel range organics (TPH-DRO) were detected in eight samples from three soil borings (E-SB-890, E-SB-905 and E-
SB-906), and at various depths. Several samples had concentrations that exceeded the residential screening criteria of 230 mg/kg. The highest
concentrations of TPH-DRO (15,000 and 4,800 mg/kg) were observed in samples collected from beneath the basement floor in former Building D
(samples E-SB-905-6-10 and E‑SB‑906-6-10), at a depth of 6-10 feet.
The hexavalent chromium and pesticide concentrations in Block E soil samples were below their respective residential criteria in the ten samples
analyzed.
Metals such as arsenic and vanadium were detected in soils collected from 10 samples. However, none of these metals exceeded their residential
criterion.

JOHNSONAND
TOWERS
CHESAPEAKE PLAZA
ANNEXBUILDING
VERTICALASSEMBLYBUILDING
PARKING LOT NO. 4
ATHLETICFIELD
PARKING LOT NO. 5
BUILDING "G"
BUILDING "A"
BUILDING "B"
BUILDING "C"
FORMER AERO PYHSICSLAB/ WIND TUNNEL
TEST BUILDING
FORMERBOAT HOUSE
FORMERRAMP STORAGE
BUILDING
FORMERTRAININGSCHOOL
SEVEN 1,000-GAL. AVIATION FUELUSTs ABANDONED IN-PLACE
FORMERHYDRAULIC AND FIELD
TEST BUILDING
NORTHAMERICANELECTRIC
FORMERSEWAGE
TREATMENTPLANT
CHESAPEAKE PARK PLAZA
FORMER BUILDING "D"
500,000-GAL.WATER TANK
FORMER 500-GAL. UST
FORMER 500,000-GAL.DIESEL FUEL AST
FIRE PUMP BUILDING WITH275-GAL DIESEL FUEL AST
TRANSFER SHED
WATERFRONT LOT
BUILDING "M"
PROGRAM
BUILDING
CHESAPEAKE PARK PLAZA
BUILDING "L"
PARKING LOT NO. 3
TILLEY CHEMICALCOMPANY
DROP HAMMERBUILDING
ACTIVE FIRING RANGE
DIESTORAGE
MAINTENANCEGARAGE
HAZARDOUS WASTESTORAGE BUILDING
CONSERVATIONBUILDING
FLAMECUT
FIRECOATBUILDING
FOUR #2 FUEL OIL USTsABANDONED IN-PLACE
POWERHOUSE
DRUMSTORAGEFACILITY
BUILDING "P"
PARKING LOT NO. 2
PARKING LOT NO. 1
AMTRAK RAILROAD
EASTERN BOULEVARD
MARTINBLVD.
Town ofMiddle River
DARK HEAD C
OVE
COW PEN CREEK
Martin State Airport
MAINTENANCE OFFICEAND SHOP
ENG. DEV.
LAB BLDG.
DARK HEAD COVE ROAD
PARKING LOT NO. 6
GATE "A"
EXXON GASSTATION
POST OFFICE
BLOCK 'I'
BLOCK 'B'
BLOCK 'E'
BLOCK 'G'
BLOCK 'D'
BLOCK 'F'
BLOCK 'A'
BLOCK 'H'
BLOCK 'A'
FIGURE 2-1
MIDDLE RIVER COMPLEXSITE LAYOUT AND TAX BLOCKS
DATE MODIFIED: CREATED BY:11/30/11 MP
±
Lockheed Martin Middle River ComplexMiddle River, Maryland
0 300 600150 Feet
Map Document: (K:\GProject\middle_river\Maps\Tax Blocks_30Nov11.mxd)11/30/2011 -- 6:20:16 PM
LEGEND
STRUCTURE
RAILROAD TRACKS
MIDDLE RIVER COMPLEXTAX BLOCK BOUNDARY
WILS
ON
POINT
ROAD

&;
&;
&; &;
&;
&;
&;
&;
+U
+U+U
+U+U
+U+U
+U+U +U+U
+U+U
+U
+U
+U +U
+U
+U
+U+U
+U
+U
+U
+U
+U+U
+U+U+U+U
+U+U+U
+U
+U
+U
+U+U
+U+U +U+U
+U
+U
+U+U+U+U
+U+U
+U+U
+U
+U+U+U+U
+U
+U+U
+U+U
+U+U
+U+U
+U
+U
+U +U
+U +U
+U
+U
+U+U+U
+U
+U+U
+U
+U+U
+U +U
+U+U
+U
+U+U
+U
+U
+U +U
+U +U
+U+U
+U+U
+U+U
+U+U+U+U+U+U+U
+U
+U+U
+U
+U
+U
+U+U
+U+U
+U
+U
+U
+U
+U+U
+U+U
+U+U
+U
+U+U+U
+U+U
+U
+U
+U
+U
+U
+U+U
+U
+U+U
+U
+U
+U
+U+U
+U
+U
+U
+U
+U
+U
+U+U+U
+U+U
+U+U+U
+U+U
+U+U
+U
+U
+U+U
+U
+U+U
+U+U
+U+U
+U
+U
+U
+U
+U
+U
Dark H
ead C
ove
Cow Pen Creek
EASTERN BOULEVARD
ATHLETIC
FIELD
LOT 4
LOT 5
LOT 1
LOT 2
LOT 3
ANNEX
BUILDING
VLS
LABOR
ATOR
Y
BUILD
ING
BUILDING
A
BUILDING
B
BUILDING
C
CHESAPEAKE PARK PLAZA
WI LS
ON
PO
INT
RO
AD
LOT D
LOT 6
MRC-MW87AB
MRC-MW86AB
MRC-MW92C
MRC-MW91A-B
MRC-MW94D
MRC-MW96D
MRC-OW6S-I
MRC-OW4S-I
MRC-OW3S-D
MRC-OW2S-D
MRC-OW1S-D
EXT-MW04
EXT-MW06
MRC-PZ02A-B
MRC-PZ01A-BMRC-MW44A
MRC-MW07AMRC-MW80A-B
MRC-MW76A-B
MRC-MW75A
MRC-MW74A-B MRC-MW73A-B
MRC-MW72A-B
MRC-MW71A-B
MRC-MW70A-B
MRC-MW69A-B
MRC-MW68AMRC-MW67A
MRC-MW66AMRC-MW65A
MRC-MW64A
MRC-MW63A
MRC-MW62A
MRC-MW61A
MRC-MW59AMRC-MW58A
MRC-MW57A
MRC-MW56A
MRC-MW55A
MRC-MW54A
MRC-MW53A
MRC-MW52A
MRC-MW51AMRC-MW50A
MRC-MW49A
MRC-MW48A
MRC-MW47A
MRC-MW46AMRC-MW45A
MRC-MW43A
MRC-MW42A
MRC-MW41A
MRC-MW40A
MRC-MW39A
MRC-MW38A-B
MRC-MW37B-C
MRC-MW37A
MRC-MW36A
MRC-MW35AMRC-MW34A-C
MRC-MW33A
MRC-MW32A
MRC-MW31A
MRC-MW30A
MRC-MW29A
MRC-MW28A MRC-MW27A-C
MRC-MW26A
MRC-MW25A
MRC-MW24A
MRC-MW23A
MRC-MW22AMRC-MW21A-B
MRC-MW20AMRC-MW19A
MRC-MW18A
MRC-MW16A
MRC-MW15A
MRC-MW13AMRC-MW12A
MRC-MW11A
MRC-MW10A
MRC-MW09A
MRC-MW08A
MRC-MW06A
MRC-MW05A
MRC-MW04A
MRC-MW03A
MRC-MW02AMRC-MW01A
MRC-MW14A-C
MRC-MW60A-B MRC-81A-B
MRC-MW17A
MRC-OW5S
MRC-MW12BMRC-MW12C
MRC-OF02A-C
MRC-MW62C
MRC-MW78B
MRC-MW11C
MRC-OF03A-C
MRC-OF09A-C
MRC-OF01
MRC-OF04A-C
MRC-OF08A-D
MRC-OF06A-C
MRC-OF05A-C
MRC-OF07
MRC-MW79B
MRC-MW89
MRC-MW15B
MRC-MW58B
MRC-MW53B
MRC-MW08B
MRC-MW77A
MRC-MW98A-B
EXT-MW03
MRC-MW104A-B
MRC-MW112A-B
MRC-MW22B
MRC-MW101A-B
MRC-MW102A-B
MRC-MW111A-BMRC-MW99A-B
MRC-MW100A-B
MRC-MW107B/C
MRC-MW106B/CMRC-MW43B
MRC-MW108B/C
MRC-MW110A-B
MRC-MW97A-B MRC-MW54B
MRC-MW103A-B
MRC-MW96A-B
MRC-MW109A-B
MRC-MW105A-B
MRC-MW90B
MRC-MW85A
MRC-MW84A
MRC-MW83A
MRC-MW74C
MRC-MW82A
MRC-MW88A-B
MRC-MW95D
MRC-MW93D
A
C A'
B'
B
C'
FIGURE 2-2
GEOLOGIC CROSS-SECTIONLOCATIONS
DATE MODIFIED: CREATED BY:6/22/12 MP
±
Lockheed Martin Middle River ComplexMiddle River, Maryland
LEGEND
0 300 600150 Feet
MARTIN STATE AIRPORT
STANSBURY MANOR APARTMENTS
WILSON POINTPARK
HAWTHORNEPARK
COMMUNITY(RESIDENTIAL)
Map Document: (K:\GProject\middle_river\Maps\Geologic Cross Section Locations_Aug 2010_revised062212.mxd) 6/22/2012 -- 11:02:06 AM
DEEP GROUNDWATER MONITORING WELL
SURFACE WATER
GROUNDWATER MONITORING WELL
U
U
TRANSECT
ABANDONED GROUNDWATER MONITORINGWELL&;

MW03 MW93D
MW55A MW57C
MW60 MW26A
MW94D MW27 MW79BMW31A MW34
MW72B MW73
MW96D
A'A
North Southeast
ProbableArundel Formation
ProbableArundel Formation
P:\
GIS
\MID
DL
E_
RIV
ER
\MA
PD
OC
S\M
XD
\CR
OS
S_
SE
CT
ION
_A
A_
LIT
HO
LO
GY
.MX
D
9/3
/10
KM
FIGURE 2-3
GEOLOGIC CROSS-SECTION A-A'
DATE MODIFIED: CREATED BY:9/7/10 K. MOORE
LEGEND
Lockheed Martin Middle River ComplexMiddle River, Maryland
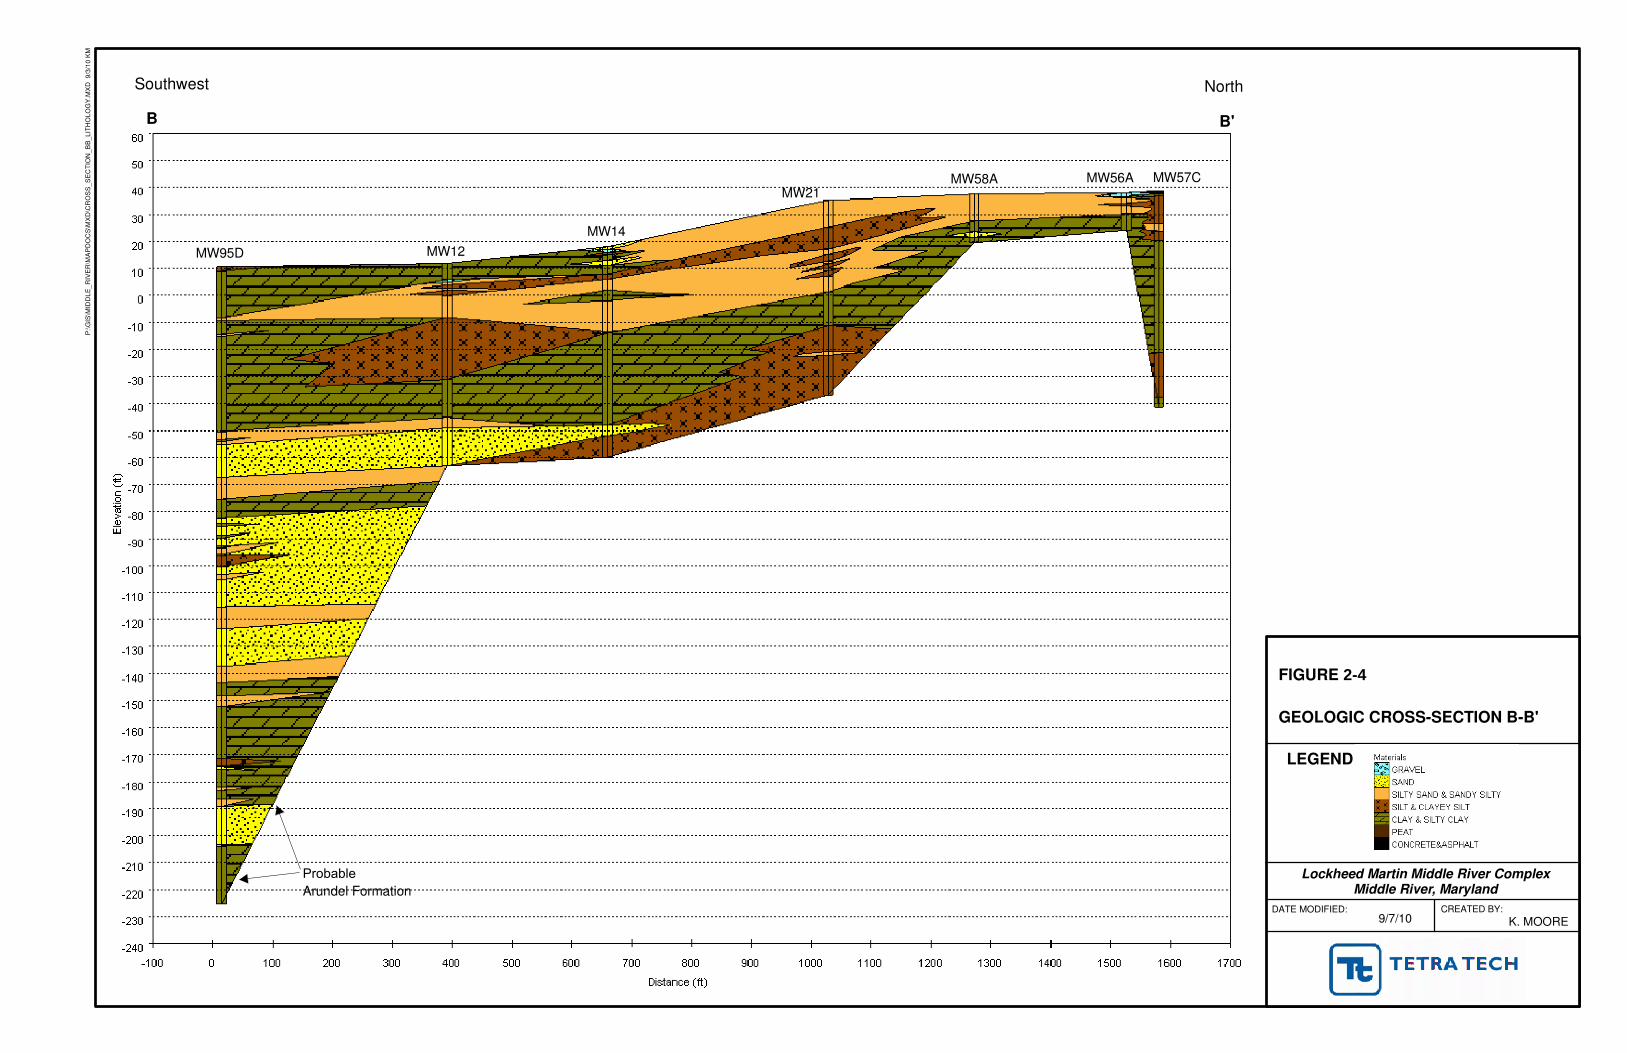
MW95D MW12
MW14
MW21MW58A MW56A MW57C
B'B
Southwest North
Probable Arundel Formation
P:\
GIS
\MID
DL
E_
RIV
ER
\MA
PD
OC
S\M
XD
\CR
OS
S_
SE
CT
ION
_B
B_
LIT
HO
LO
GY
.MX
D
9/3
/10
KM
FIGURE 2-4
GEOLOGIC CROSS-SECTION B-B'
DATE MODIFIED: CREATED BY:9/7/10 K. MOORE
LEGEND
Lockheed Martin Middle River ComplexMiddle River, Maryland

MW10A
MW15A
MW80 MW21 MW22AMW25A
MW94D MW27MW28A
MW29A
C'C
West East
Probable Arundel Formation
P:\
GIS
\MID
DL
E_
RIV
ER
\MA
PD
OC
S\M
XD
\CR
OS
S_
SE
CT
ION
_C
C_
LIT
HO
LO
GY
.MX
D
9/3
/10
KM
FIGURE 2-5
GEOLOGIC CROSS-SECTION C-C'
DATE MODIFIED: CREATED BY:9/7/10 K. MOORE
LEGEND
Lockheed Martin Middle River ComplexMiddle River, Maryland

FIGURE NUMBER
SCALE
DATE
AS NOTED
K:\GProject\middle_river\graphics\Block E former D building.cdr
4/24/12REV
FILE
0
2-6
AERIAL PHOTOGRAPH OFFORMER BUILDING D- 1944
LOCKHEED MARTIN, MIDDLE RIVER COMPLEXMIDDLE RIVER, MARYLAND

!P
"/
"/
"/
"/
"/
"/
"/
"/"/
"/
"/
"/"/
"/
!P
!P
!P
!P
"/
"/
"/
!@
G!.
G!.G!.
!P
!P
gO
gO
gO
!P
"/
"/
"/
"/
"/
"/"/
"/
"/
gO
"/
!P
"/
"/
"/
"/
DARK HEAD COVE
FORMER BUILDING "D" 500,000 GALWATER TANK
REC #3
FORMER500-GALUST
REC #2
REC #1FIRE PUMP BUILDINGWITH 275-GAL DIESELFUEL AST TRANSFERSHED
FORMER 500,000-GALDIESEL FUEL AST
FORMER BERM
HistoricalConnection
Former FireWater Lines(Abandoned)
Former Fuel Line
Outfall 05
Outfall 08
Outfall 06
CHESAPEAKE PARK PLAZA
DRUM STORAGEFACILITY
TILLEYCHEMICALCOMPANY
BLOCK 'E'
BLOCK 'F'
BLOCK 'I'
BLOCK 'D'
Nuclear Lab
Cafeteria
PlatingDepartment
FinishingDepartment
HeaterRoom
HeaterRoom
HeaterRoom
HeaterRoom
HeaterRoom
Toilet Room
Toilet Room
HeaterRoom
HeaterRoom
ToiletRoom
ToiletRoom
ToiletRoom
ToiletRoom
ToiletRoom
TransformerRoom
TransformerRoom
Toilet Room
Toilet Room
Toilet Room
ToiletRoom
Toilet Room
Waste Disposal
TransformerRoom
TransformerRoom
Toilet Room
HeaterRoom
Toilet Room
Toilet Room
Elevator
Elevator
Elevator
Elevator
Elevator
ElevatorUndergroundAir Duct
FirePumps
Electrical ServiceManhole
Electrical ServiceManhole
Electrical ServiceManholes
Electrical ServiceManhole
Electrical ServiceManhole
UndergroundAir Duct
RadioisotopeBuilding
Building "N"
ElectricalSubstation
Utility Room
Nuclear Engineering
VanguardHeliarc
P6MSpot Weld
Prep
MiscSpot Weld
Prep
NuclearLab
ExtrusionMilling
ExtrusionMilling
Spot Weld 526Stock Room
Paint Paint
PrintOffice DR
W
Col
lat R
m.
Tran
s
P5MDoor
YoderH.A.
P6MSurface Subs
EnginePrep
P6MSub Assy.
P6M-1
P5M-2Arbor
INSP
.
Nose andTanks Heliarc Spot
Weld
Spares
TrainingSchool
Prod
S.P.P5M2
sidepanel
radiorack
Prod
P6M-1Sub. Assy.
P6M-1Sub. Assy.
Nuclear Lab
P6MHeliarc
Panels andLeading Edge
Sub. Assy.
Stan
dard
Con
.
Mai
nt.
P5M-2BulkheadSub Assy.
P5M-2Crown
Sub Assy.
P5M
-2
Cont
rols
P5M
-2
Aile
rons
NuclearEngineering
Mr. Nagey
DATE MODIFIED: CREATED BY:9/27/12 LR
±
Lockheed Martin Middle River ComplexMiddle River, Maryland
0 50 10025 Feet
Map Document: (K:\GProject\middle_river\Maps\Proposed DPT\Block E Utilities and Historical Operation Areas_revised 1 16 12.mxd)9/27/2012 -- 2:00:22 PM
FIGURE 2-7
FACTORY LAYOUT OF FORMERBUILDING D BASEMENT
(Source date: January 1957)
LEGENDUNDERGROUND SANITARY SEWER *
FUEL OIL LINE *
SUMP DRAIN *
UNDERGROUND AIR SEPARATORDRIP WASTE *UNDERGROUND AIR SEPARATORDRIP WASTE (INFERRED FROM DRAWING) *
G!. HYDRANT
"/ STORMWATER INLET
!@ ELECTRIC MANHOLE
!P MHSD (MANHOLE SEDIMENT)
gO STORMWATER OUTFALL
DRAIN CLEANOUTS *
DRAIN LINES *
X NEW FENCE
D EXISTING FENCE
BUILDING FOOTPRINT
FIRE WATER LINE *
STORM SEWER
PARCELS
UST = UNDERGROUND STORAGE TANKAST = ABOVE GROUND STORAGE TANKREC = RECOGNIZED ENVIRONMENTAL CONCERN
* Obtained from historical plans and drawings

gg
ggggggggg
gg
gg
gg
gg
gg
g g g g g g g g g g g g g g g
g
g
gg
gg
gg
g
gg
gg
gg
gg
gg
g
gg
g
gg
gg
gg
gg
g
gg
gg
gg
gg
gg
g g g g
g g
gg
g
g g g g g g g
gg
gg
gg
gg
gg
gg
gg
gg
gg
gg
gg
gg
gg
gg
gg
g
gg
g
D
D
D
D
D
D
D
D
D
D
D
D
D
D
D
D
D
D
D
D
D
D
D
D
D
D
D
D
D
D
D
D
D
DD
D
D
D
D DD
D
D
D
D
D
D
D
D
D
D
D
D
D
D
D
D
D D
D
D
D
D
D
D
D
D
D
D
D
D
D
D
DD
D
D
D
D
D
DD
D
D
D
D
D
D
D
D
DD
D
D
D
D
D
D
D
D
D
D
D
D
D
D
!P
"/
"/
"/
"/
"/
"/
"/
"/"/
"/
"/
"/"/
"/
!P
!P
!P
!P
"/
"/
"/
!@
G!.
G!.G!.
!P
!P
gO
gO
gO
!P
"/
"/
"/
"/
"/
"/"/
"/
"/
gO
"/
!P
"/
"/
"/
"/
!(
!( !(
!( !(
!(
!(
!(
!(!(
!( !(
!(
!(!(
!( !( !( !(
!(!(
!(
!(
!(
!(
!(
!(!(
!(
!(
!(
!(
!(
!(!(
!(
!(
!(
!(
!(
!(
!(
!(
!(
!(
!(
!(
!(
!(
!(
!(
!(
!(
!(
!(
!(
!(
!(
!(
!(
!(
!(
!(!(
!(!(
!(!(
!(
!(
!(
!(
!(
!(
!(
!(
!(
!(
!(
!(
!(
!(
!(
!(
!(
!(
!(
!(
!(
!(
!(
!(
!(
!(
!(
!(
!(
!(
!(
!(
!(
!(
!(
!(
!(
!(
!(
!(
!(
!(
!(!(!(!(
!(!(!(!(
!(!(!(!(
!(!(!(!(
!(!(!(!(
!(
!( !(
!( !(
!(
!(
!(
!(!(
!( !(
!(
!(!(
!( !( !( !(
!(!(
!(
!(
!(
!(
!(
!(!(
!(
!(
!(
!(
!(
!(
!(!(
!(
!(!(
!(
!?
!?
!?
!?
!?
!? !?
!?
!?
!?
!?
!?
!? !?
!?
!? !?
!?
!?
!?
!?
!?
!?
!?!?
!?
!?
!?
!?
!?!?
!? !?!?
!?!?!?
!?
!?
!?
!?
!?
!?
!?
DARK HEAD COVE
DRUM STORAGEFACILITY
FORMER BUILDING "D"500,000 GALWATER TANK
TILLEY CHEMICALCOMPANY
REC #3
FORMER500-GALUST
REC #2
REC #1
FIRE PUMP BUILDINGWITH 275-GAL DIESELFUEL AST TRANSFERSHED
FORMER 500,000-GALDIESEL FUEL AST
BLOCK 'E'
BLOCK 'F'
BLOCK 'I'BLOCK 'D'
SB-555 A
SB-561 A
SB-541 A
SB-550 A
SB-544 A
SB-543 A
SB-570 A
SB-568 A
SB- 569
SB- 567
SB- 566
SB- 565
SB- 564
SB- 563
SB- 562
SB- 560
SB- 559
SB- 558
SB- 557
SB- 556
SB- 554
SB- 553SB- 552
SB- 551
SB- 550
SB- 549
SB- 548SB- 547
SB- 546
SB- 545SB- 544
SB- 543
SB- 542
SB- 541SB- 571
SB-345
SB-9
SB-2
SB-1
SB-6A
SB-3A
SB-36
SB-35
SB-2A
SB-1A
SB-19
SB-18
SB-17
SB-16
SB-15
SB-14
SB-13
SB-12
SB-11
SB-10SB-233
SB-232
SB-3
SB-5A
SB-21
SB-20
SB-235
SB-42
SB-41
SB-43
SB-515BaPEq 948 (0 - 1')BaPEq 924 (4 - 6')BaPEq 908 (8 - 10')
SB-346PCB 1.7 (0 - 1')
SB-350PCB 55 (0 - 1') SB-347
PCB 7.1 (0 - 1')
SB-516BaPEq 587 (0 - 1')
SS-537PCB 10 (0-0.5')
SS-540PCB 1.8 (0-0.5')
SS-538PCB 4.5 (0-0.5')
SS-539PCB 18 (0-0.5')
SB-519BaPEq 863 (0 - 1')BaPEq 878 (4-6')BaPEq 878 (8-10')
SS-534PCB 49 (0-0.5')
SS-535PCB 6 (0-0.5')
SS-536PCB 77 (0-0.5')
SB-356PCB 25 (0 - 1')
SB-504PCB 1.2 (0 - 1')BaPEq 486 (0 - 1')PCB 11 (4 - 6')BaPEq 2167 (4 - 6')PCB 2.3 (8 - 10')BaPEq 477 (8 - 10')
SS-532PCB 2.1 (0-0.5')
SB-502PCB 1.2 (0 - 1')BaPEq 5574 (0 - 1')PCB 49 (4 - 6')BaPEq 412 (4 - 6')PCB 65 (8 - 10')BaPEq 8782 (8 - 10')
SS-527PCB 62 (0-0.5')
SS-526PCB 82 (0-0.5')
SB-360PCB 27 (0 - 1')
SB-359PCB 3.7 (0 - 1')
SS-524PCB 52 (0-0.5')
SS-522PCB 3.4 (0-0.5')
SS-523PCB 2.1 (0-0.5')
SS-521PCB 3.1 (0-0.5')
SS-528PCB 34 (0-0.5')
SS-525PCB 54 (0-0.5')
SB-361PCB 140 (0 - 1')
SB-362PCB 5 (0 - 1')
SB-363PCB 24 (0 - 1')
SB-364PCB 12 (0 - 1')
SB-512BaPEq 398 (0 - 1')BaPEq 878 (4 - 6')BaPEq 510 (8 - 10')BaPEq 456 (8 - 10' D)
SB-358PCB 27 (0 - 1')
SB-357PCB 12 (0 - 1')
SB-355PCB 96 (0 - 1')
SB-354PCB 400 (0 - 1')
SB-353PCB 1800 (0 - 1')
SB-352PCB 19 (0 - 1')
SB-351PCB 21 (0 - 1')
SB-500BaPEq 542 (0-1')BaPEq 855 (4-6')BaPEq 924 (8-10')
SB-507BaPEq 440 (0 - 1')BaPEq 948 (4 - 6')BaPEq 878 (8 - 10')
SB-508BaPEq 878 (0 - 1')BaPEq 901 (4 - 6')BaPEq 901 (4 - 6 D')BaPEq 924 (8 - 10')
SB-509BaPEq 878 (0 - 1')BaPEq 878 (4 - 6')BaPEq 878 (8 - 10')
SB-510BaPEq 401 (0 - 1')BaPEq 878 (4 - 6')BaPEq 426 (8 - 10')BaPEq 419 (8 - 10 D')
SB-511BaPEq 825 (4 - 6')BaPEq 948 (8 - 10')
SB-513BaPEq 864 (0 - 1')BaPEq 863 (4 - 6')BaPEq 901 (8 - 10')
SB-514BaPEq 878 (0 - 1')BaPEq 924 (4 - 6')BaPEq 901 (8 - 10')BaPEq 901 (8 - 10' D)
SB-518BaPEq 924 (0 - 1')BaPEq 924 (4 - 6')BaPEq 994 (8 - 10')
SB-520BaPEq 456 (0 - 1')BaPEq 924 (4 - 6')BaPEq 846 (8 - 10')
E-SB-828DRO 1500 (9')
E-SB-827PCB 2.5 (7')PCB 260 (9')PCB 15 (13' DI)
E-SB-841PCB 25 (SS)
E-SB-839PCB 41 (SS)
E-SB-845PCB 37 (SS)
SB-506BaPEq 878 (0 - 1')BaPEq 878 (0 - 1' D)BaPEq 878 (4 - 6')BaPEq 971 (8 - 10')
SB-505PCB 99 (0 - 1')BaPEq 827 (0 - 1')BaPEq 878 (4 - 6')BaPEq 464 (8 - 10')
E-SB-844PCB 2.3 (SS)
SB-503PCB 1.7 (0 - 1')BaPEq 10999 (0 - 1')BaPEq 890 (0 - 1' D)TPH 650 (0-1')BaPEq 434 (4 - 6')BaPEq 901 (8 - 10')
E-SB-821
E-SB-818
E-SB-822
E-SB-819
E-SB-820
E-SB-823
E-SB-825
E-SB-824
SB-349PCB 24 (0 - 1')
SB-517BaPEq 390 (0 - 1')BaPEq 924 (4 - 6')BaPEq 440 (8 - 10')
E-SB-826
E-SB-832
E-SB-834
E-SB-829
E-SB-836
E-SB-840
E-SB-830
E-SB-837
E-SB-831
E-SB-843E-SB-842
E-SB-846
E-SB-838
E-SB-847
SB- 558PCB 1.6 (0-0.5')
E-SB-835PCB 3.5 (9')
SS-533PCB 53 (0-0.5')
SB- 568PCB 81 (0-0.5')PCB 11 (0.5-1')
SS-530PCB 690 (0-0.5')
SS-531PCB 190 (0-0.5')
SS-529PCB 1500 (0-0.5')
SB-501PCB 58 (0 - 1')BaPEq 8695 (0 - 1')PCB 5.8 (4 - 6')BaPEq 855 (4 - 6')PCB 24 (8 - 10')BaPEq 901 (8 - 10')
SB-348PCB 34 (0 - 1')
SB-4DRO 230 (5')
SB-4APCB 180 (0-0.5')DRO 330 (0-0.5')
SB-234PCB 1.07 (0-0.5')SB- 566
PCB 1.2 (0-0.5')
SB-5BaPEq 288 (0-0.5')
SB-546 APCB 9.6 (0-0.5')
SB-6BaPEq 286 (0-0.5')BaPEq 182 (5')
SB- 570PCB 6.8 (0-0.5')
SB- 561PCB 3.4 (0.5-1')PCB 4 (2')PCB 11 (4')
SB- 555PCB 17 (0-0.5')PCB 3.8 (0.5-1')PCB 3.8 (2')PCB 7.8 (4')
DATE MODIFIED: CREATED BY:04/23/12 MP
±
Lockheed Martin Middle River ComplexMiddle River, Maryland
0 75 15037.5 Feet
Map Document: (K:\GProject\middle_river\Maps\Proposed DPT\Block E Historic Exceedances_091611_revised042312.mxd) 4/23/2012 -- 11:36:46 AM
FIGURE 2-8
HISTORICAL EXCEEDANCES OF PCBAND BAPEQ SCREENING LEVELSTHROUGH 2010BLOCK E
SCREENING LEVEL FOR PCBs IS 1.0 mg/kgSCREENING LEVEL FOR BaPEq IS 150 ug/kgSCREENING LEVEL FOR TPH-GRO AND DRO IS 230 mg/kg
PCB,TPH-GRO and DRO results are in units of milligrams per kilogram (mg/kg)BaPEq results are in units of micrograms per kilogram (ug/kg)(8-10' D) = DuplicateE-SB-833E (CS) = Concrete SampleE-SB-827-13' DI = Dilution SampleE-SB-839 (SS) = Surface SoilJ- Positive result is considered estimated as a result of technical non-compliance
LEGEND!? 2010 SOIL SAMPLE LOCATION
!( PREVIOUS SOIL SAMPLE LOCATION
G!. HYDRANT
"/ STORMWATER INLET
!@ ELECTRIC MANHOLE
!P MHSD
gO STORMWATER OUTFALL
DRAIN CLEANOUTS
DRAIN CLEANOUT PIPES
FIRE WATER LINE
STORM SEWER
ELECTRIC
GAS
SANITARY
DOMESTIC WATER
TELEPHONE
g g GEOPHYSICAL SURVEY ANOMALY
BASEMAP REVISIONS
CONDENSATE
STEAM
ELECTRIC SUBSTATION
PARCELS
BUILDING FOOTPRINT
REC BOUNDARY
gg
gg
gg
g
gg
gg
gg
g
D
D
D
D
D
!(
!(
!(
!(!(
!(
!(
!(
!(
!(
!(
!(
!(
!?
!?
!?!?
!?
!?
!?!?
!?
!?
!?
!?
!?
!?
!?
E-SB-833MPCB 1.3 (2')
E-SB-833NBaPEq 294 (6')
E-SB-833IPCB 220 (8')DRO 460 (DI) (8')PCB 350 (10')BaPEq 198 (10')
E-SB-833BPCB 1.7 (2')
E-SB-833DRO 28000 (9')PCB 24000 (9')PCB 61 (11')
E-SB-833KPCB 3.1 (CS)PCB 680 (2')BaPEq 1788 (2')DRO 1400 (2')PCB 970 (6')DRO 310 (6')PCB 35 (8')PCB 270 (10')BaPEq 163 (10')DRO 590 (10')
E-SB-833LPCB 4.5 (6')PCB 700 (8')DRO 450 (8')
E-SB-833EPCB 1.1 (CS)PCB 360 (2')DRO 640 (2')PCB 180 (6')DRO 1900 (DI) (6')PCB 27 (10')
E-SB-833FPCB 1600 (CS)PCB 25 (2')PCB 2.3 (6')PCB 1 (10')
E-SB-833APCB 1.4 (CS)BaPEq 323 (2')DRO 8900 (2')PCB 510 (6')BaPEq 461 (6')PCB 2000 (10')BaPEq 462 (10')
E-SB-833JPCB 3 (2')
SB-550
E-SB-833C
E-SB-833D
SB-349
SB-234
SB-348
E-SB-833G
E-SB-833H
SB-350
SB-349PCB 24 (0 - 1')
SB-348PCB 34 (0 - 1')
0 30 60 Feet

"/
!P
!P
!P
!P
"/
"/
"/
!@
!P
gO
!P
"/
!P
"/
"/
"/
D
D
D
D
D
D
D
D
D
D
D
D
D
D
D
D
D
D
D
D
D
D
D
D
D
D
D
D
D
D
D
D
D
D
D
D
D
D
D
D
D
D
D
D
D
D
D
D
D
D
D
D
D
D
D
D
D
D
D
D
D
D
D
D
D
D
D
D
D
D
D
D
D
D
DD
D
D
D
D
D
D
D
D
D
D
!(
!(
!(
!(
!(
!(
!(
!( !(
!(
!(
!(
!(
!(
!(
!(
!(
!(!(
!(!(
!(
!(!(
!(
!(
!(
!(
!(
!(
!(
!(
!(
!( !(
!(!(
!(
!(
!(
!(
!(!(
!(
!(
!(
!( !( !( !(
!(
!(
!(
!(
!(
!(!(
!(
!(
!(
!(
!(
!(
!(
!(
!(
!(
!(
!(
!(
!(
!(
!(
!(
!(
!(
!(
!(
!(
!(
!(
!(!(
!(!(
!(!(
!(
!(
!(
!(
!(
!(
!(
!(
!(
!(
!(
!(
!(
!(
!(
!(
!(
!(
!(
!(
!(
!(
!(
!(
!(
!(
!(
!(
!(
!(
!(
!(
!(
!(
!(
!(
!(!(!(!(
!(!(!(!(
!(!(!(!(
!(!(!(!(
!(
!( !(
!(!(
!(
!(
!(
!(
!(!(
!(
!(
!(
!( !( !( !(
!(
!(
!(
!(
!(
!(!(
!(
!(
!(
!(
!(
!(
!(
!(
!(
!.
!.
!.!.
!.
!.
!.
!.
!.
!.
!.
!.
!.
!.
!.
!.!.
!.
!.
!.
!.!.
!.
!.
!.
!.
!.
WATERFRONT LOT
FORMER 5000-GALDIESEL FUEL AST
REC #2
REC #3
REC #1 FIREWATER LINE
BLOCK 'E'
BLOCK 'F'
FORMER500-GAL
UST
SB-565
E-SB-821
E-SB-826
E-SB-828
E-SB-829
E-SB-830
E-SB-832
E-SB-834E-SB-835
E-SB-836
E-SB-839
E-SB-840
E-SB-841
E-SB-842
E-SB-844
E-SB-845
E-SB-837
E-SB-831
E-SB-827
E-SB-833N
E-SB-833M
E-SB-833J
E-SB-833I
E-SB-833A
E-SB-833BE-SB-833C
E-SB-833D
E-SB-833E
E-SB-833F
E-SB-833G
E-SB-833H
E-SB-833
E-SB-833L
E-SB-833K
SB-541A SB-542
SB-551
SB-550A
SB-4A
SB-552
SB-564
SB-559
SB-567
SB-558
SB-563
SB-568
SB-568A
SB-557
SB-553
SB-543A
SB-547
SB-546A
SB-546
SB-545
SB-548
SB-569
SB-561A
SB-561
SB-556
SB-543
SB-544
SB-234
SB-554
SB-550
SB-549
SB-6
SB-5
SB-4
SB-505
SB-6A
SB-9
SB-36
SB-35
SB-1A
SB-16
SB-15
SB-14
SB-13
SB-11
SB-10
SB-235
SB-233
SB-232
SB-17
SB-12
SB-41
SB-43
SB-566
SB-5A
SB-540SB-539SB-538
SB-536 SB-535
SB-532
SB-531SB-530
SB-527
SB-526
SB-519
SB-518
SB-516
SB-515
SB-513
SB-508
SB-507
SB-506SB-504
SB-502
SB-501
SB-364
SB-363
SB-362
SB-360
SB-359
SB-358
SB-357
SB-356
SB-355
SB-354
SB-353
SB-352
SB-351
SB-346
SB-345
SB-537
SB-534SB-533
SB-529
SB-525
SB-520SB-517
SB-503
SB-361
SB-350
SB-348
SB-347
SB-349
SB-560
E-SB-848PCB 200 (8')
E-SB-852PCB 3,300 (1')PCB 120 (12')PCB 17 (16')PCB 15 (19')PCB 2.9 (24')PCB 1.2 (28')PCB 9.3 (30')
E-SB-853PCB 4.3 (8')PCB 19,000 (12')PCB 780 (16')PCB 12 (20')PCB 270 (24')PCB 4.3 (28')PCB 1.5 (28.5')
E-SB-854PCB 9.1 (0 - 2.5')PCB 470 (8')PCB 2 (12') E-SB-855
PCB 680 (12')PCB 16 (16')
E-SB-856
E-SB-860PCB 5.9 (0 - 0.5')
E-SB-861PCB 400 J (0 - 0.5')PCB 680 J (0 - 0.5')(D)
E-SB-862PCB 880 (0 - 0.5')PCB 18 K (0.5 - 2')
E-SB-863PCB 1.6 J (0- 0.5')
E-SB-864PCB 1,100 (0 - 0.5')PCB 2.2 J (0 - 2')
E-SB-865PCB 17 K (0 - 0.5')
E-SB-866PCB 1.9 (0 - 0.5')
E-SB-867PCB 7.7 L (0 - 0.5')
E-SB-868PCB 110 J (0 - 0.5')PCB 450 (0 - 0.5')(D)
E-SB-869PCB 170 (0 - 0.5')PCB 1.6 (0.5 - 2')
E-SB-870PCB 480 K (0 - 0.5')PCB 3.1 (0.5 - 2')
E-SB-871PCB 75 (0 - 0.5')PCB 3.7 J (0.5 - 2')E-SB-874
E-SB-849
E-SB-850
E-SB-872
E-SB-873
E-SB-857
E-SB-859
E-SB-858E-SB-851
DATE MODIFIED: CREATED BY:11/11/11 MP
±
Lockheed Martin Middle River ComplexMiddle River, Maryland
0 30 6015 Feet
Map Document: (K:\GProject\middle_river\Maps\Proposed DPT\Block E 2011 Sample Locations Exceedances_PCB revised 11 03 11.mxd)11/11/2011 -- 2:31:33 PM
FIGURE 2-9
PCB RESULTS IN BLOCK E SOILSAMPLES EXCEEDING THE RESIDENTIALUSE SCREENING LEVEL - JULY ANDAUGUST 2011
D
D
D
D
D
D
D
D
D
DD
D
DD
D
DD
D
D
D
D
D
D
D
DD
DD
DD
DD
DD
DD
D
D
D
D
D
D
D
D
Area Shown
DARK HEAD COVE
BLOCK 'I'
BLOCK 'E'
BLOCK 'F'
BLOCK 'G'
BLOCK 'D'
RESIDENTIAL SCREENING LEVEL FOR PCBsIS 1 mg/kgPCB results are in units of milligrams per kilogram (mg/kg)E-SB-833E (CS) = Concrete Sample(D) = DuplicateJ- Positive result is considered estimated as a result of technical non-complianceK- Positive result is considered to be biased high as a result of technical non-complianceL- Positive result is considered to be biased low as a result of technical non-compliance
LEGEND!. JULY 2011 SOIL SAMPLE LOCATION!. AUGUST 2011 SOIL SAMPLE LOCATION!( PREVIOUS SOIL SAMPLE LOCATION
G!. HYDRANT
"/ STORMWATER INLET!@ ELECTRIC MANHOLE!P MHSD
gO STORMWATER OUTFALL
DRAIN CLEANOUTSDRAIN LINESFIRE WATER LINE(ABANDONED)STORM SEWERELECTRICGASSANITARYDOMESTIC WATERTELEPHONEBASEMAP REVISIONSCONDENSATESTEAMELECTRIC SUBSTATIONPARCELSBUILDING FOOTPRINTREC BOUNDARY
?
Soil Boring No.
Analyte Concentration (Depth: feet below grade)
Sample Tag Key:
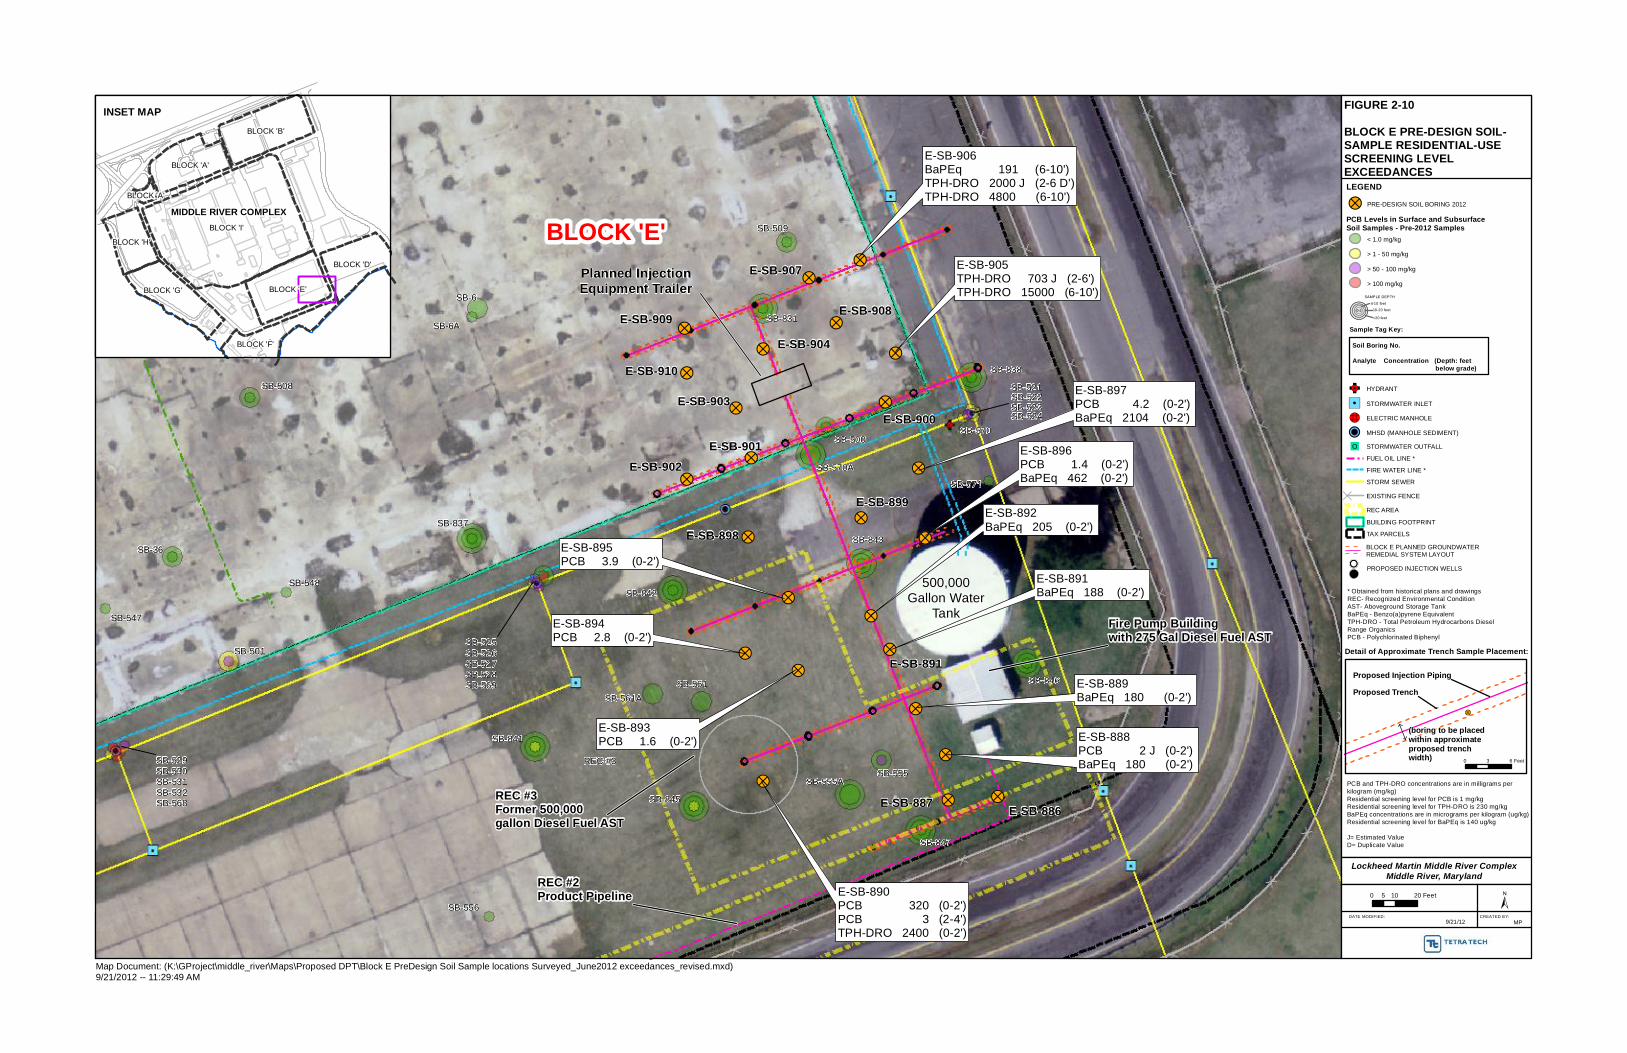
!?!?
!?
!?
!?
!?
!?
!?!?
!?
!?
!?
!?
!?
!?
!?
!?
!?
!? !?
!?!?
!?!?
!?
500,000Gallon Water
Tank
REC #2Product Pipeline
REC #3Former 500,000gallon Diesel Fuel AST
Fire Pump Buildingwith 275 Gal Diesel Fuel AST
BLOCK 'E'
SB-556
SB-524SB-523SB-522SB-521
SB-842
SB-843
SB-846
SB-847
SB-571
SB-830
SB-831
SB-837
SB-838
SB-841
SB-845
SB-500
SB-501
SB-508
SB-509
SB-511
SB-548
SB-555
SB-570
SB-36
SB-6A
SB-6
REC #3
SB-555A
SB-570A
SB-529SB-530SB-531SB-532SB-568
SB-547
SB-561ASB-561
SB-525SB-526SB-527SB-528SB-569
E-SB-886E-SB-887
E-SB-888PCB 2 J (0-2')BaPEq 180 (0-2')
E-SB-891
E-SB-898
E-SB-899
E-SB-900
E-SB-902E-SB-901
E-SB-903
E-SB-904
E-SB-907
E-SB-908E-SB-909
E-SB-910
Planned InjectionEquipment Trailer
E-SB-889BaPEq 180 (0-2')
E-SB-890PCB 320 (0-2')PCB 3 (2-4')TPH-DRO 2400 (0-2')
E-SB-891BaPEq 188 (0-2')
E-SB-892BaPEq 205 (0-2')
E-SB-893PCB 1.6 (0-2')
E-SB-894PCB 2.8 (0-2')
E-SB-895PCB 3.9 (0-2')
E-SB-896PCB 1.4 (0-2')BaPEq 462 (0-2')
E-SB-897PCB 4.2 (0-2')BaPEq 2104 (0-2')
E-SB-906BaPEq 191 (6-10')TPH-DRO 2000 J (2-6 D')TPH-DRO 4800 (6-10')
E-SB-905TPH-DRO 703 J (2-6')TPH-DRO 15000 (6-10')
Map Document: (K:\GProject\middle_river\Maps\Proposed DPT\Block E PreDesign Soil Sample locations Surveyed_June2012 exceedances_revised.mxd)9/21/2012 -- 11:29:49 AM
MIDDLE RIVER COMPLEX
INSET MAP
BLOCK 'I'
BLOCK 'B'
BLOCK 'E'BLOCK 'G'
BLOCK 'A'
BLOCK 'D'
BLOCK 'F'
BLOCK 'H'
BLOCK 'A'
FIGURE 2-10
BLOCK E PRE-DESIGN SOIL-SAMPLE RESIDENTIAL-USESCREENING LEVELEXCEEDANCES
* Obtained from historical plans and drawingsREC- Recognized Environmental ConditionAST- Aboveground Storage TankBaPEq - Benzo(a)pyrene EquivalentTPH-DRO - Total Petroleum Hydrocarbons DieselRange OrganicsPCB - Polychlorinated Biphenyl
!?
Proposed Trench
Proposed Injection Piping
(boring to be placedwithin approximateproposed trenchwidth)
Detail of Approximate Trench Sample Placement:
DATE MODIFIED: CREATED BY:9/21/12 MP
±
Lockheed Martin Middle River ComplexMiddle River, Maryland
0 10 205 Feet
0 3 6 Feet
PCB and TPH-DRO concentrations are in milligrams perkilogram (mg/kg)Residential screening level for PCB is 1 mg/kgResidential screening level for TPH-DRO is 230 mg/kgBaPEq concentrations are in micrograms per kilogram (ug/kg)Residential screening level for BaPEq is 140 ug/kg
J= Estimated ValueD= Duplicate Value
!(!(!(!( >20 feet
0-4 10-20 feet
4-10 feet
SAMPLE DEPTH
LEGEND
!? PRE-DESIGN SOIL BORING 2012
PCB Levels in Surface and SubsurfaceSoil Samples - Pre-2012 Samples
< 1.0 mg/kg
> 1 - 50 mg/kg
> 50 - 100 mg/kg
> 100 mg/kg
BLOCK E PLANNED GROUNDWATERREMEDIAL SYSTEM LAYOUT
!P PROPOSED INJECTION WELLS
G!. HYDRANT
"/ STORMWATER INLET
!@ ELECTRIC MANHOLE
!P MHSD (MANHOLE SEDIMENT)
gO STORMWATER OUTFALL
FUEL OIL LINE *
FIRE WATER LINE *
STORM SEWER
D EXISTING FENCE
REC AREA
BUILDING FOOTPRINT
TAX PARCELS
Soil Boring No.
Analyte Concentration (Depth: feet below grade)
Sample Tag Key:

7903 TETRA TECH • LOCKHEED MARTIN MIDDLE RIVER COMPLEX •2012 ADDITIONAL BLOCK E SOIL INVESTIGATION REPORT PAGE 3-1
Section 3
Investigation Approachand Methodology
The primary objectives of the 2012 Block E investigation were to review historical data and
collect additional soil-chemical data to better identify and evaluate the horizontal and vertical
extent of polychlorinated biphenyls (PCBs), polycyclic aromatic hydrocarbons (PAHs), volatile
organic compounds (VOCs), total petroleum hydrocarbon (TPH)-gasoline range organics
(GRO), TPH-diesel range organics (DRO), and metals (including hexavalent chromium [CrVI])
in soils. These data were obtained to complete an updated human health risk assessment
(HHRA) and to aid remedy selection. An additional objective is to better understand the
foundation of the existing concrete slab underlying the former Building D, which will be used to
evaluate impacted soils and their potential migration pathways.
The investigation objectives were to be achieved through a phased approach using the data from
this first phase (Phase I) to guide a second phase (Phase II) of the work. This report only presents
details of the Phase I activities, which includes a limited geophysical survey of the former
Building D basement, additional sampling of the concrete slabs for PCBs, and sampling of soil
and groundwater around the periphery of former Building D and at a possible PCB source area in
the southwestern area of Block E. The 2012 Block E program entailed the following activities:
mobilized/demobilized equipment and staff, including obtaining site access, utilityclearance, and permitting
performed high-resolution surface/subsurface electrical-resistivity imaging (ERI)focusing within the southwest quadrant of the former Building D, which coveredapproximately 600 feet by 270 feet, using a 1.5-meter electrode 60-foot-grid spacing, andobtained 18 images to a maximum depth of 55 feet below grade. The survey wasconducted in an area of elevated PCB concentrations in the surface and subsurface soil.
collected concrete surface samples at 40 locations from the former Building D concreteslab to evaluate current risk to site workers from PCBs. Six concrete samples were alsoanalyzed for asbestos for waste characterization purposes.

7903 TETRA TECH • LOCKHEED MARTIN MIDDLE RIVER COMPLEX •2012 ADDITIONAL BLOCK E SOIL INVESTIGATION REPORT PAGE 3-2
advanced shallow soil borings at 28 locations to a depth of four feet below grade tofurther investigate PCBs, PAHs, metals, and CrVI in soil along the periphery of theformer Building D foundation
advanced deep soil borings at six locations (based on results of the ERI survey) to40–50 feet below grade to further characterize PCBs, PAHs, VOCs, TPH, and metals insoil in areas near the former waste disposal area and former transformer room
selected concrete and soil samples from the concrete, peripheral, and deep borings weresent for radiological analyses (see Appendix A)
collected shallow groundwater samples from soil borings for chemical analyses andmeasurements of field parameters
collected groundwater levels from Block E wells
collected, stored, and characterized investigation-derived waste (IDW). IDW wasdisposed of at a Lockheed Martin Corporation (Lockheed Martin)-approved off-sitetreatment and disposal facility.
performed laboratory chemical analyses and chemical-data validation of soil samples
reviewed historical maps and figures to gain insight into the construction and locations ofunderground utilities at the former Building D, and to assess historical operations thatmay have led to the release of the identified contaminants of concern (COC). Thehistorical review is not discussed in this section but its findings are incorporated into thesite discussions in Section 4.
3.1 MOBILIZATION/DEMOBILIZATION
Tetra Tech, Inc. (Tetra Tech) procured the required subcontractors and began mobilization in
June 2012. Mobilization included:
coordinating with Lockheed Martin Middle River Complex (MRC) personnel
obtaining utility clearance in the geophysical survey area and soil boring locations usinga private firm (as described in Section 3.2)
mobilizing subcontractors, equipment, personnel, and materials to the site
implementing a site-specific health and safety plan (HASP)
arranging a decontamination area
Demobilization activities include:
demobilizing equipment and materials from the site
7903 TETRA TECH • LOCKHEED MARTIN MIDDLE RIVER COMPLEX •2012 ADDITIONAL BLOCK E SOIL INVESTIGATION REPORT PAGE 3-3
performing general site cleanup and trash removal at work completion
repairing landscaping, ground, and other surfaces as necessary at work completion
managing IDW (as described in Section 3.10)
The Tetra Tech field operations leader coordinated the mobilization and demobilization,
including inventorying equipment to ensure its availability, purchasing and leasing equipment as
required, and staging equipment for efficient loading and transport to and from the site after each
activity.
Appropriate Tetra Tech personnel familiarized themselves with the site-specific HASP and the
respective safe work permits. Tetra Tech held mandatory health and safety tailgate meetings for
all workers involved, including subcontractors, before each day’s field events. All personnel
working on-site received site-specific safety training from the Lockheed Martin safety manager.
Subsequent to this training, subcontractors were issued a security pass allowing site access.
Tetra Tech coordinated access to Block E work areas through Lockheed Martin and obtained
utility clearances for the areas of the proposed soil borings, including completing the dig
authorization form and risk-handling checklist and following EO-28 requirements governing
intrusive fieldwork. This also includes notifying Miss Utility, the underground utility-location
center, reviewing facility utility maps (including the site plan) (TAI, October 2002), and
engaging a private utility-locating contractor (Enviroscan, Inc.). Miss Utility personnel generally
will not mark utilities on private property, so Enviroscan, Inc. was employed to clear subsurface
sampling locations. Tetra Tech met directly on-site with Miss Utility and Enviroscan personnel to
review proposed sampling locations, provide utility clearance personnel with accurate maps, and
discuss any potential issues related to subsurface utilities.
Enviroscan, Inc. conducted geophysical surveys to mark all underground utility lines within a
30-foot radius of each proposed soil boring. A combination of electromagnetic
resistivity/conductivity, line locating, and ground-penetrating radar (GPR) ensured that all
proposed sampling locations would avoid underground utilities. Borings requiring relocation
because of conflicts with existing subsurface obstructions were positioned as close as possible to
their original locations. Refer to Appendix B for the Enviroscan utility clearance report.
7903 TETRA TECH • LOCKHEED MARTIN MIDDLE RIVER COMPLEX •2012 ADDITIONAL BLOCK E SOIL INVESTIGATION REPORT PAGE 3-4
3.2 SUBSURFACE ELECTRICAL RESISTIVITY IMAGING
High-resolution ERI surveys were used at the southwestern portion of Block E to assess the
complex subsurface structure beneath the Building D foundation that includes concrete, fill,
underground utilities, potential voids, heterogeneous geology, and soil contamination. The ERI
survey was conducted by Aestus, LLC, a geophysical survey firm based in Loveland, Colorado.
Aestus was selected based on their prior experience identifying subsurface utilities, geologic
lithology, residual pockets of light non-aqueous phase liquids (LNAPLs)/dense non-aqueous
phase liquids (DNAPLs), and the extent of dissolved-phase contamination using ERI. The survey
was performed along multiple survey alignments focusing on the areas around the former waste
disposal area and former transformer room and the grassy area south of former Building D, in an
area where high concentrations of PCBs have been detected in soil, and where PCB-containing
DNAPL was observed during a recent subsurface investigation.
Figure 3-1 presents the locations of the ERI survey transects. The survey results were used to
produce two-dimensional and quasi-three-dimensional, color-shaded images of subsurface
electrical resistivity and conductivity that illustrate the presence or absence of subsurface
anomalies such as subsurface utilities, LNAPL, and DNAPL. The series of two-dimensional
images were combined to visualize the subsurface electrical resistivity of the site in three
dimensions.
Aestus compiled the ERI survey results in a report included here as Appendix C. It details methods,
compiles and tabulates results, and provides interpretations and conclusions regarding the
subsurface utilities, geology, and distribution and possible source of identified contaminants. The
ERI methodology is therefore not repeated in this section. To help interpret the ERI results, soil
samples were collected from four soil borings and analyzed for PCBs, PAHs, TPH, and metals.
3.3 CONCRETE SAMPLING
Forty concrete surface samples were collected from the former Building D concrete flooring
(including the former Building D footprint and the concrete slab south of the former Building D
footprint along the Chesapeake Park Plaza roadway) to evaluate current risk to site workers.
Concrete surface samples were collected by drilling a hole approximately ½-inch deep into the

7903 TETRA TECH • LOCKHEED MARTIN MIDDLE RIVER COMPLEX •2012 ADDITIONAL BLOCK E SOIL INVESTIGATION REPORT PAGE 3-5
concrete surface using a one-inch-diameter carbide drill-bit to generate approximately 10 grams
of powder (USEPA, 2005).
Figure 3-2 presents the locations of concrete surface samples, and Table 3-1 presents the
rationales for the sampling locations, sample analyses conducted, and analytical methods used.
Concrete samples were sent to the laboratory for PCBs analysis. Additionally, six of the samples
from SB-934, SB-944, SB-949, SB-950, SB-953, and SB-961 were sent for asbestos analysis.
3.4 SOIL SAMPLING
The sampling program advanced 28 shallow soil borings along the periphery of the former
Building D footprint in areas of limited or no previous sampling. Additionally, six deep soil
borings were advanced in areas near the former waste disposal area and former transformer
room. Two borings were designed as step-out sampling locations, to further delineate
constituents in soil in the area of high PCB concentrations and previously observed oily product.
Four borings were advanced in areas of the ERI survey to provide confirmation data for the ERI
results. Figures 3-3 and 3-4 show the locations of the peripheral and deep soil borings,
respectively. Tables 3-2 and 3-3 present the rationales developed for the sampling locations.
Table 3-4 lists the methods used for the chemical analyses.
3.4.1 Peripheral Shallow Soil Sampling
Shallow soil borings were advanced, using direct-push technology (DPT), to approximately
four feet below grade by a Maryland-licensed driller. Continuous soil samples (DPT macrocores)
were collected in each boring for lithologic description and field screening using a
1.5-inch-diameter stainless-steel MacroCore™ sampler fitted with a disposable liner. The probe
sampler was advanced and the retrieved soil inspected by a qualified Tetra Tech field geologist
for lithologic characteristics, staining, discolorations, and odors. Soil was categorized using the
Modified Burmister system. Additionally, the soil was screened in the field for volatile organic
compounds (VOCs) using a photoionization detector (PID), and for alpha, beta, and gamma
radiation using dual-phosphate and scintillation probes.
All pertinent information, including boring location, soil/lithology description, sample
designation and depth, PID readings, sample collection time, etc., was recorded on boring-log
forms and soil-sample log sheets. Boreholes were backfilled with granular bentonite to within

7903 TETRA TECH • LOCKHEED MARTIN MIDDLE RIVER COMPLEX •2012 ADDITIONAL BLOCK E SOIL INVESTIGATION REPORT PAGE 3-6
0.5-foot of the ground surface, hydrated, and then filled to grade with like material (i.e., soil,
gravel, or concrete). The logs for the shallow borings are included in Appendix D. Results of the
radiation screening are in Appendix A.
After lithologic logging and field screening, soil from the designated sampling intervals was
collected and immediately placed in the appropriate sample containers and handled as described
in Section 3.5. In general, discrete soil samples were collected from four intervals in each boring;
thus, four samples were collected from each soil boring at 0–0.5 feet (except where concrete was
present), 0.5–2 feet (or, proceeding from the bottom of concrete downward to two feet), 2–3 feet,
and 3–4 feet below grade. At locations with a concrete or paved surface, the sampling depth was
recorded in feet below the top of the concrete or paved surface. Sampling depths and the number
of samples collected were modified based on soil recovery and observations made during sample
collection. Sample record sheets are provided in Appendix E.
The laboratory was instructed via written chain of custody forms to analyze the upper two
samples, and to hold the analyses of the other two samples pending results of the upper two
samples (or hold the deepest sample if only three soil samples were collected, as in the case of
locations with concrete samples [e.g., E-SB-970]). The lower samples were analyzed for PCBs
only if PCBs were detected in the upper samples at concentrations greater than 1 mg/kg.
Similarly, the lower samples were analyzed for PAHs only if PAHs were detected in the upper
samples at concentrations greater than 0.14 mg/kg.
3.4.2 Deep Soil Sampling
Six deep soil borings were advanced in the southeastern portion of Block E to further delineate
the extent of PCBs and to provide subsurface data to evaluate the ERI survey results. The
locations of the deep borings are shown in Figure 3-2. Deep soil borings E-SB-983 and
E-SB-984 were advanced to delineate COC south and east of high PCB concentrations detected
in the southeastern portion of Block E. Soil Boring E-SB-983 was in the former waste disposal
area shown on historical Building D drawings. This boring was also south–southeast of previous
boring E-SB-852, which had a PCB concentration of 3,300 mg/kg at one foot and 120 mg/kg at
8–12 feet below grade. Soil boring E-SB-984 was northwest of previous soil boring E-SB-853,
where PCB concentrations were detected at 19,000 mg/kg (8–12 feet) and 780 mg/kg
7903 TETRA TECH • LOCKHEED MARTIN MIDDLE RIVER COMPLEX •2012 ADDITIONAL BLOCK E SOIL INVESTIGATION REPORT PAGE 3-7
(12–16 feet), and PCBs were detected above the site screening level (1 mg/kg) at concentrations
ranging from 1.5–27 mg/kg at 20–28 feet below grade.
Recommendations in the geophysical survey report led to advancement of four confirmation
borings (E-CB-2, E-CB-11A, E-CB-11B, and E-CB-13) to provide lithologic and chemical data
for areas of anomalous ERI readings. Borings E-CB-11A and E-CB-11B were advanced in areas
of high subsurface conductivities. Borings E-CB-2 and E-CB-13 were advanced in areas of high
resistivities.
Generally, soil samples for chemical analyses were collected continuously at two-foot intervals
from the top of each boring to 20 feet, and at four-foot intervals from 20 feet to the bottom of
each of the six borings. The RotoSonic method involved using a six-inch by eight-inch drill
rod/override-casing set-up (with temporary casing) to advance drilling to the target depth. The
override casing is designed to seal the upper portions of the soil column, thereby precluding the
downward movement of contamination from the shallow to deeper intervals during drilling. Soil
borings were advanced to depths ranging from 40 feet at E-SB-983, E-SB-984, and E-CB-11B to
50 feet at E-CB-11A and E-CB-2. Boring E-CB-13 was advanced to a depth of 46 feet below
grade.
Soil was cored continuously using a 10-foot core-barrel. The retrieved soil was inspected by a
qualified Tetra Tech field geologist for lithologic characteristics, staining, discolorations, and
odors. Soil was categorized using the Modified Burmister system. Additionally, the soil was
screened in the field for VOCs using a PID, and for alpha, beta, and gamma radiation using dual
phosphate and scintillation probes. All pertinent information, including boring location,
soil/lithology description, sample designation and depth, PID readings, sample collection time,
etc., was recorded on boring-log forms and soil-sample log sheets. After sonic drilling, the
boreholes were backfilled to within 0.5-foot of the ground surface using bentonite-cement grout,
and then filled to grade with like material (i.e., soil, gravel, or concrete). The logs for the deep
boring are in Appendix D. Results of the radiation screening are in Appendix A.
3.5 GROUNDWATER LEVELS AND SAMPLING
Groundwater levels and water quality parameters were collected from 32 groundwater
monitoring wells, 10 storm-sewer catch basins and manholes, and four concrete boreholes to

7903 TETRA TECH • LOCKHEED MARTIN MIDDLE RIVER COMPLEX •2012 ADDITIONAL BLOCK E SOIL INVESTIGATION REPORT PAGE 3-8
provide a concurrent set of groundwater data for evaluating the ERI survey results. Water quality
parameters of pH, specific conductance, salinity, temperature, and depth to water were measured
and recorded for the study. Water quality measurements could not be obtained at catch basin
CB-2 due to insufficient water volume in the catch basin. A grab groundwater sample was
collected from boring E-SB-976 (boring depth of five feet) to evaluate contaminants of concern
(COC) in shallow groundwater near the former waste disposal area.
3.6 SAMPLE NOMENCLATURE
Each concrete and soil sample was identified with a unique sample designation. The sample
designation includes information for the tax block parcel (“E” for Block E), then “SB” for soil
boring, followed by the boring number (e.g., 979). The letters “CB” for confirmation boring were
used for the four borings installed to assess the ERI survey results. For concrete samples, the soil
boring location was followed by the letters “CS” to designate it as a “concrete sample.” Sample
designations for both concrete and soil samples include ending digits that represent the top and
bottom depths of the sampling interval. For example, E-SB-979-2-3 would be a sample from
boring location 979 in Block E, collected at a depth of 2–3 feet below grade.
3.7 SAMPLE HANDLING
Sample jars collected were labeled and placed on ice pending delivery to the analytical
laboratory. Sample labels include a unique sample designation, the date and time the sample was
collected, name of the person(s) collecting the sample, and the specific analyses requested from
the laboratory (see Section 3.9). Samples were submitted to the analytical laboratories for
analyses of PCBs, PAHs, VOCs, TPH-GRO, TPH-DRO, metals, and asbestos. Sample handling
for radiological samples is discussed in Appendix A.
Samples were handled according to field-related considerations concerning the selection of
containers and preservatives, allowable holding times, and the analyses requested. Proper chain
of custody procedures were followed throughout all phases of sample collection and handling to
ensure the evidentiary integrity of sample containers. These protocols demonstrate that the
samples have been handled and transferred in a manner that minimizes as well as detects
possible tampering or cross-contamination.
7903 TETRA TECH • LOCKHEED MARTIN MIDDLE RIVER COMPLEX •2012 ADDITIONAL BLOCK E SOIL INVESTIGATION REPORT PAGE 3-9
Signatures were required to release sample containers from the laboratory. Samples were
accepted under signature either by the sampler(s), or by an individual responsible for maintaining
custody, until the sample containers were transferred to the sampler(s). Transport containers
returned to the laboratory were sealed with strapping tape and a tamper-proof custody seal. The
custody seal includes the signature of the individual releasing the transport container, along with
the date and time.
3.8 DOCUMENTATION
A master site logbook was maintained as an overall record of field activities for the Block E
project. Defining soil characteristics and visual indicators of possible contamination (such as
staining and/or soil discoloration) were logged for each boring. The soil-boring logs are in
Appendix D.
Sample documentation consists of the completed chain-of-custody reports and matrix-specific
sample log sheets. All pertinent information, including soil boring location, sample designation
and depth, and sample collection date and time, was recorded on a soil-sample log sheet.
Sampling log sheets are also in Appendix E.
The chain-of-custody report is a standardized form documenting such pertinent sample
information as sample identification and type, matrix, date and time of collection, preservation,
and analysis requested. These procedures and documentation ensure both a complete record and
the integrity of sample acquisition. Chain-of-custody forms are in Appendix F as part of the data
validation reports.
3.9 LABORATORY ANALYSES
For the 2012 additional investigation, more than 300 samples were shipped to TestAmerica Inc.
in North Canton, Ohio. Samples were analyzed by TestAmerica for PCBs and subsets of soil
samples were analyzed for PAHs, VOCs, TPH-GRO, TPH-DRO, and metals using the methods
listed in Table 3-4. Samples for asbestos were analyzed by EHS Laboratories of Richmond,
Virginia. Seventy-seven samples were also collected for radiological analyses (Appendix A).
Field-duplicate samples were not collected during this investigation. Table 3-5 lists the samples
collected and analyses performed for each sample, including radiological analyses.

7903 TETRA TECH • LOCKHEED MARTIN MIDDLE RIVER COMPLEX •2012 ADDITIONAL BLOCK E SOIL INVESTIGATION REPORT PAGE 3-10
3.10 SURVEYING
Boring locations and the ERI transect lines were surveyed by a Tetra Tech survey team under the
direction of a Maryland-licensed professional land surveyor. The survey team used global
positioning system (GPS) technology with sub-meter accuracy to locate and provide horizontal
and vertical coordinates for each boring and survey line. Coordinates for the soil borings and
survey lines are in the survey report” included as Appendix G.
3.11 EQUIPMENT DECONTAMINATION
An equipment decontamination area was established at the perimeter of the restricted work zone
to prepare and break down sampling equipment and to contain rinsing solution until it could be
properly disposed of. Small, reusable equipment and supplies (i.e., DPT rods, augers, scoops,
etc.) were decontaminated before and after each use, as follows:
Alconox® and potable-water wash
potable-water rinse
thorough rinsing and wetting the equipment with reagent-grade isopropanol
analyte-free water rinse
air drying
3.12 WASTE MANAGEMENT
Investigation-derived waste (IDW) consisted of soil cuttings, concrete, decontamination-rinsate
water, and personal protective equipment (PPE) generated during Block E sampling. PPE IDW
was disposed of as general refuse. Soil cuttings, concrete fragments, and decontamination water
were collected and stored in United States Department of Transportation (USDOT)-approved
55-gallon drums. Wastes were then characterized and disposed of in accordance with
applicable state and federal regulations. The IDW was removed from the facility and properly
disposed of at a Lockheed Martin-approved disposal facility in accordance with federal, state,
and local regulations. Waste characterization and disposal documentation is provided in
Appendix J.
3.13 DATA VALIDATION
Data validation involves having a party independent of the analytical laboratory review the
laboratory data to ensure that specific criteria were met. These criteria are concerned with
7903 TETRA TECH • LOCKHEED MARTIN MIDDLE RIVER COMPLEX •2012 ADDITIONAL BLOCK E SOIL INVESTIGATION REPORT PAGE 3-11
specifications that are not sample-dependent; they specify performance requirements that should
be fully under a laboratory’s control. For organic data analyses, specific validation areas include
blanks, performance-evaluation-standard materials, and instrument-performance checks. For
inorganic data analyses, specific validation areas include blanks, calibration standards,
calibration-verification standards, laboratory control standards, and interference-check standards.
Chemical data were supplied by the laboratory as hard-copy reports and electronic databases.
After the sampling was completed, the chemical data were validated to assess their reliability and
accuracy, in accordance with established United States Environmental Protection Agency
(USEPA) protocols. This review was based on the USEPA Region 3 guidelines (USEPA, 1993
and 1994) and the specifics of the analytical method employed. Data validation reports with COC
are in Appendix F.
Collectively, these data are acceptable for their intended use, except for data that have been
qualified as unreliable. For this validation, the following data qualifiers (i.e., flags) were applied
to the chemical results presented in this report:
B The analyte was not detected substantially above the level reported in the laboratoryor field blank (i.e., the result is considered an artifact of the laboratory analysis and isnot considered a site contaminant).
U Not detected. The analyte is considered not detected at the reported value.
J The analyte is considered present in the sample. However, the value is estimated andmay not be accurate or precise.
L The analyte is considered present in the sample. However, the value is biased low andthe actual value is expected to be higher than the reported value.
NJ The analyte has been tentatively identified. This qualifier indicates presumptiveevidence of a compound. Special methods may be required to confirm its presence orabsence in future sampling efforts.
UJ The analyte was not detected. However, the quantitation or detection limit may beinaccurate or imprecise.
UL The analyte was not detected. However, the quantitation or detection limit is likelygreater than the reported value.
UR The result is considered qualitatively or quantitatively unreliable. Only the results(i.e., non-detected results) for 2-butanone, tertiary butyl alcohol, and vinyl acetatewere flagged with “UR” data qualifiers.
7903 TETRA TECH • LOCKHEED MARTIN MIDDLE RIVER COMPLEX •2012 ADDITIONAL BLOCK E SOIL INVESTIGATION REPORT PAGE 3-12
The “J” and “L” qualifiers appear in the chemical results tables and the figures in Section 4. All
flags appear in Appendices F and H.
Common laboratory or field contaminants occasionally may be detected in the samples. The
analysis of quality control blanks and other internal laboratory blanks (e.g., method blanks, etc.)
are used to determine the significance of the analytical results versus possible laboratory or field
contaminants. Common laboratory contaminants for VOCs include acetone, methylene chloride,
and 2-butanone. According to USEPA national functional laboratory guidelines, any compound
detected in both the sample and an associated blank must be qualified (i.e., flagged with a “B”)
when the sample concentration is less than five times the concentration detected in the blank.
For the common laboratory contaminants (listed above), results were qualified with a “B” flag
when the sample concentration was less than 10 times the blank concentration. In addition to the
common laboratory blanks listed above, in many instances several TPH and common metals
were reported as blank contamination. Qualified results are presented in the chemical tables in
Section 4 and Appendices F and H.
3.14 DATA MANAGEMENT
Laboratory data handling procedures met the requirements set forth in the laboratory subcontract.
All analytical and field data are maintained in the project files. The project files contain copies of
the chain of custody form, sampling log forms, sampling location maps, and data quality-
assurance documentation.
3.14.1 Data Tracking and Control
A “cradle to grave” sample tracking system was used from the beginning to the end of the
sampling event. The field operations leader coordinated sample tracking before field
mobilization. Sample jar labels were handwritten in the field. Labels were reviewed to ensure
their accuracy and adherence to work plan requirements. The project manager’s (PM) assistant
coordinated with the analytical laboratory to ensure that they were aware of the number and type
of samples and analyses to expect.
When field sampling was underway, the field operations leader forwarded the chain of custody
forms to the PM’s assistant and the laboratory for each day that samples were collected. The
7903 TETRA TECH • LOCKHEED MARTIN MIDDLE RIVER COMPLEX •2012 ADDITIONAL BLOCK E SOIL INVESTIGATION REPORT PAGE 3-13
PM’s assistant confirmed that the chain of custody form provided the information required by the
work plan. This allowed early detection of errors made in the field so adjustments could be made
while the field team was mobilized. The laboratory submitted an electronic deliverable for the
sample delivery groups. When all electronic deliverables were received from the laboratory, the
PM’s assistant confirmed that the laboratory performed all analyses requested.
3.14.2 Sampling Information
Data from field measurements were recorded using the appropriate log sheets as per Tetra Tech,
Inc. (Tetra Tech) standard operating procedures. Reduction of field data entailed summarizing
and presenting these data in tabular form. Reduction of laboratory data entailed manipulation of
raw data-instrument output into reportable results. Laboratory data were verified by the group
supervisor and then by the laboratory’s quality control/documentation department.
3.14.3 Project Data Compilation
The analytical laboratory generated an Adobe Acrobat® portable document format (PDF) file of
the analytical data packages, as well as an electronic database deliverable. The electronic
database was checked against the PDF file provided by the laboratory and updated as required,
based on data qualifier flags applied during data validation. Data generated during
implementation of the sampling and analysis plan were incorporated into the MRC
environmental geographic information system (GIS) database. All data (such as units of measure
and chemical nomenclature) were checked to maintain consistency with the project database.
3.14.4 Geographical Information System
The data management system for this effort consists of a relational database and GIS to manage
environmental information pertaining to MRC. The relational database stores chemical,
geological, hydrogeological, and other environmental data collected for the MRC environmental
investigations. The GIS is built from the relational database and contains subsets of the larger
data pool. Using the GIS, environmental data were posted onto base maps to represent the
information graphically for this report.

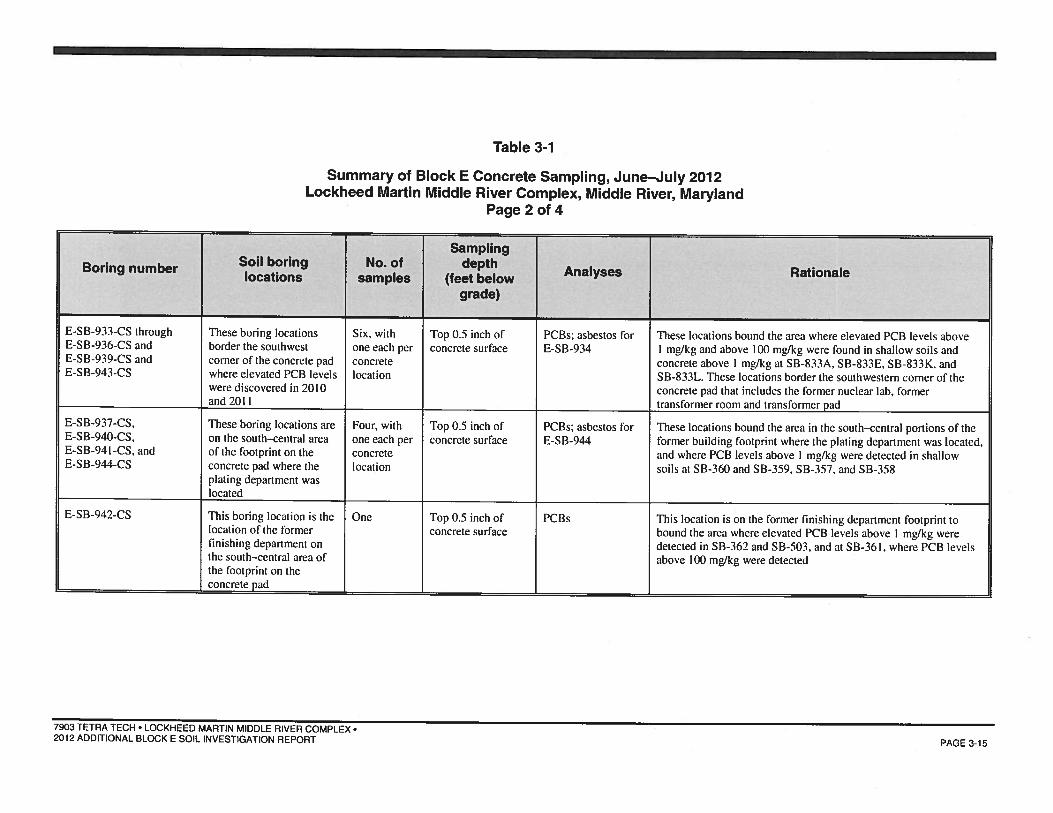
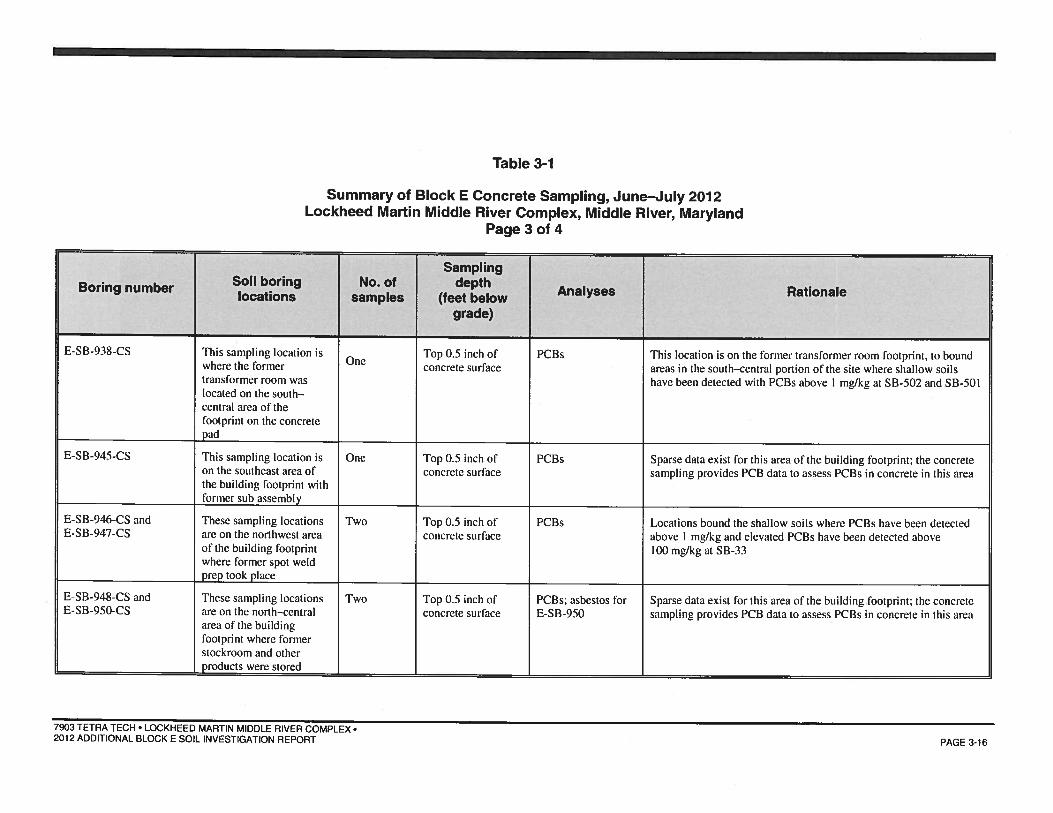

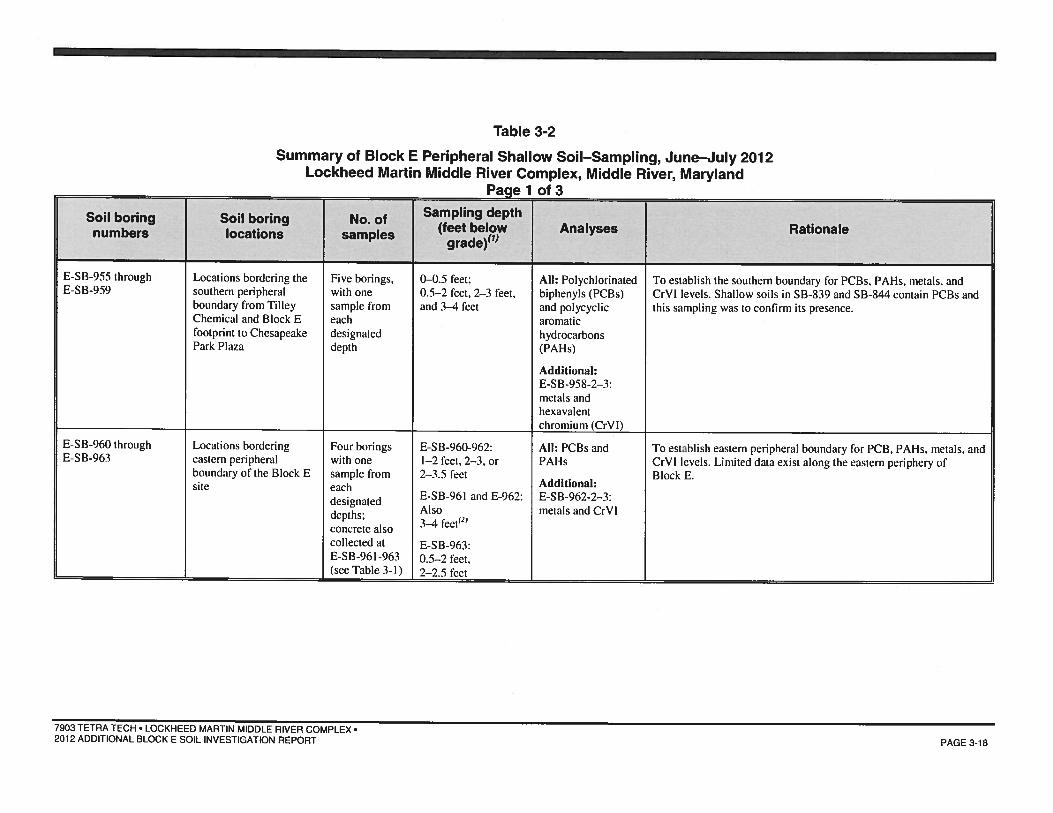
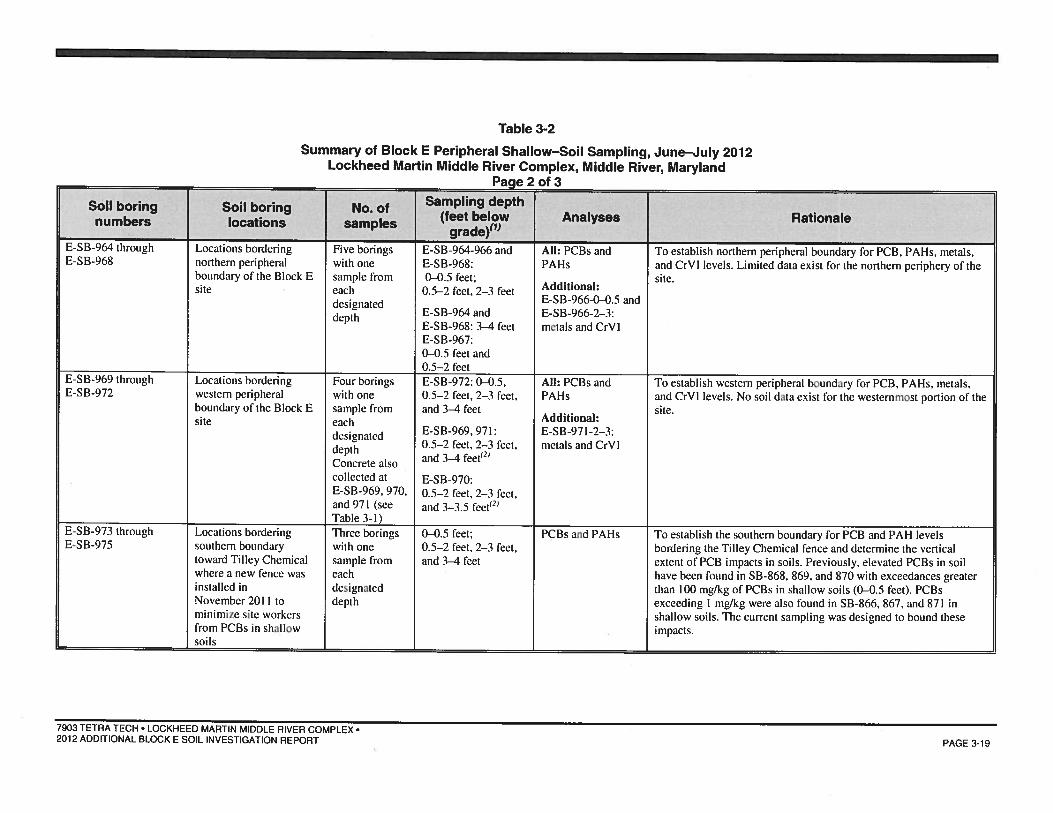

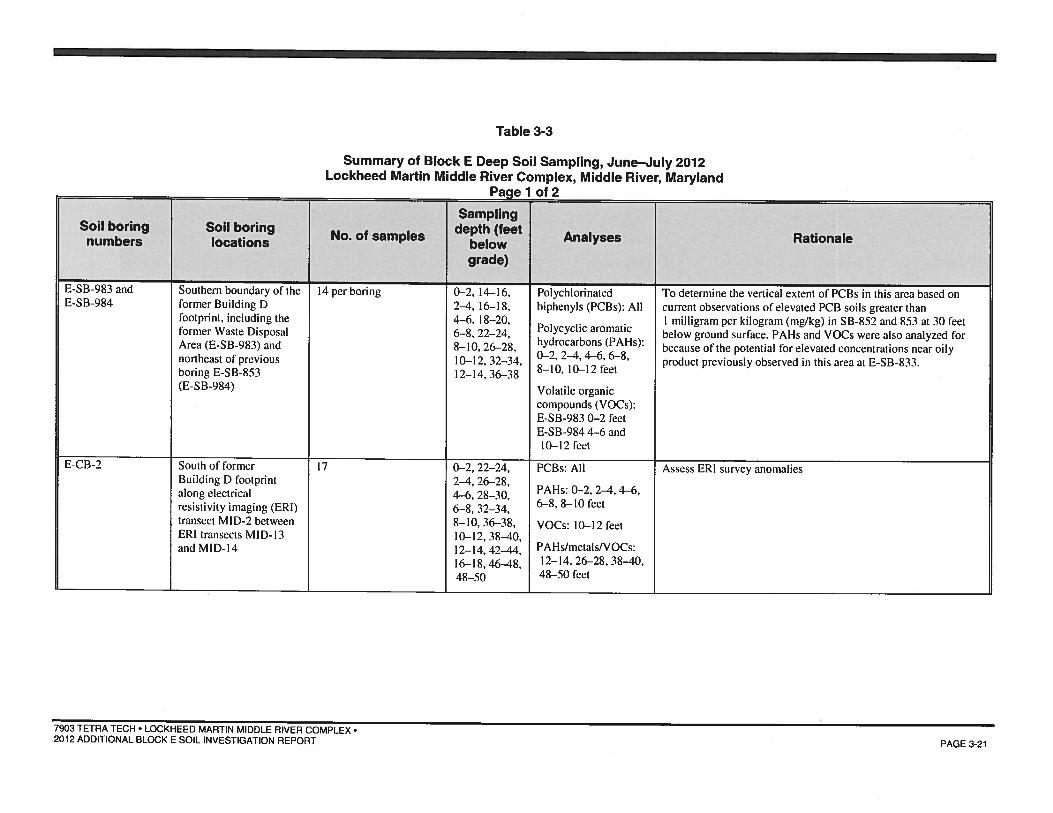
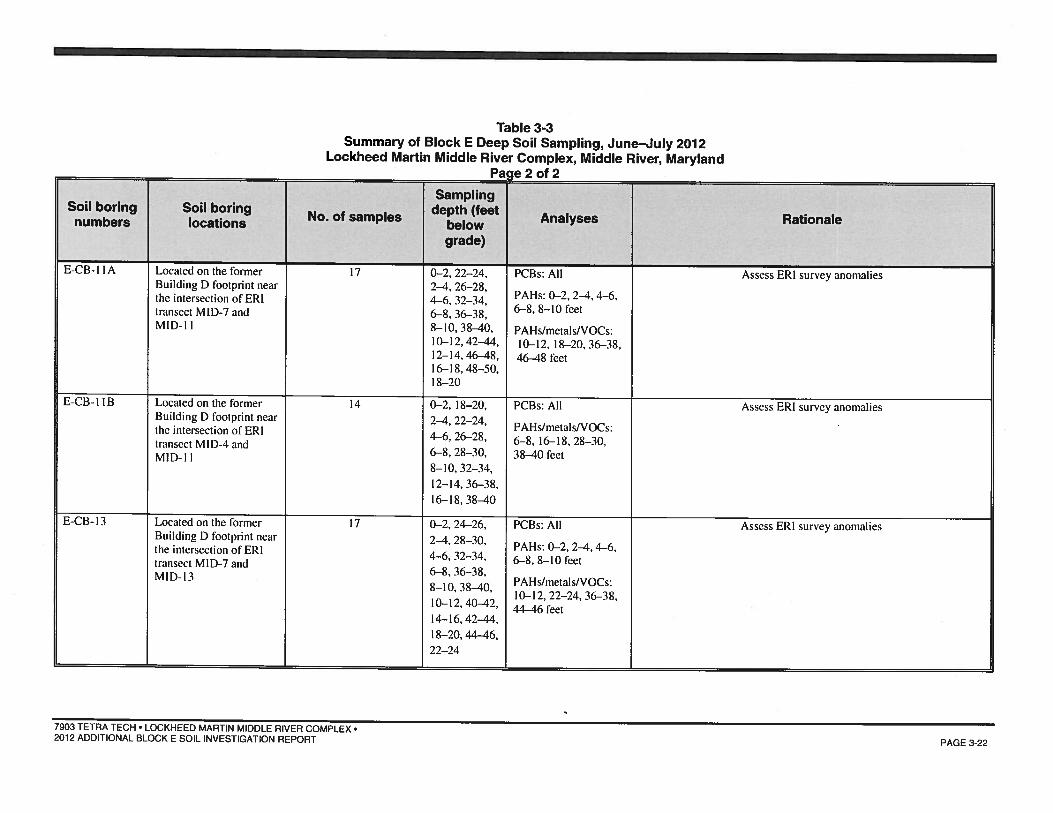
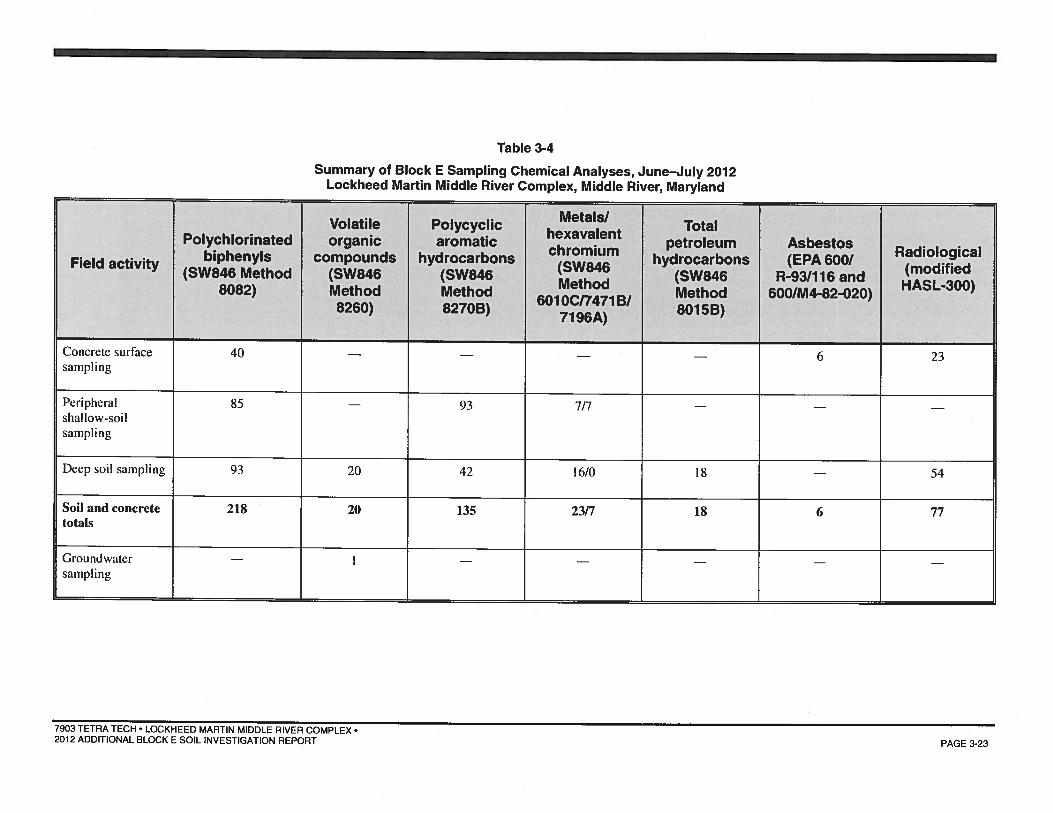
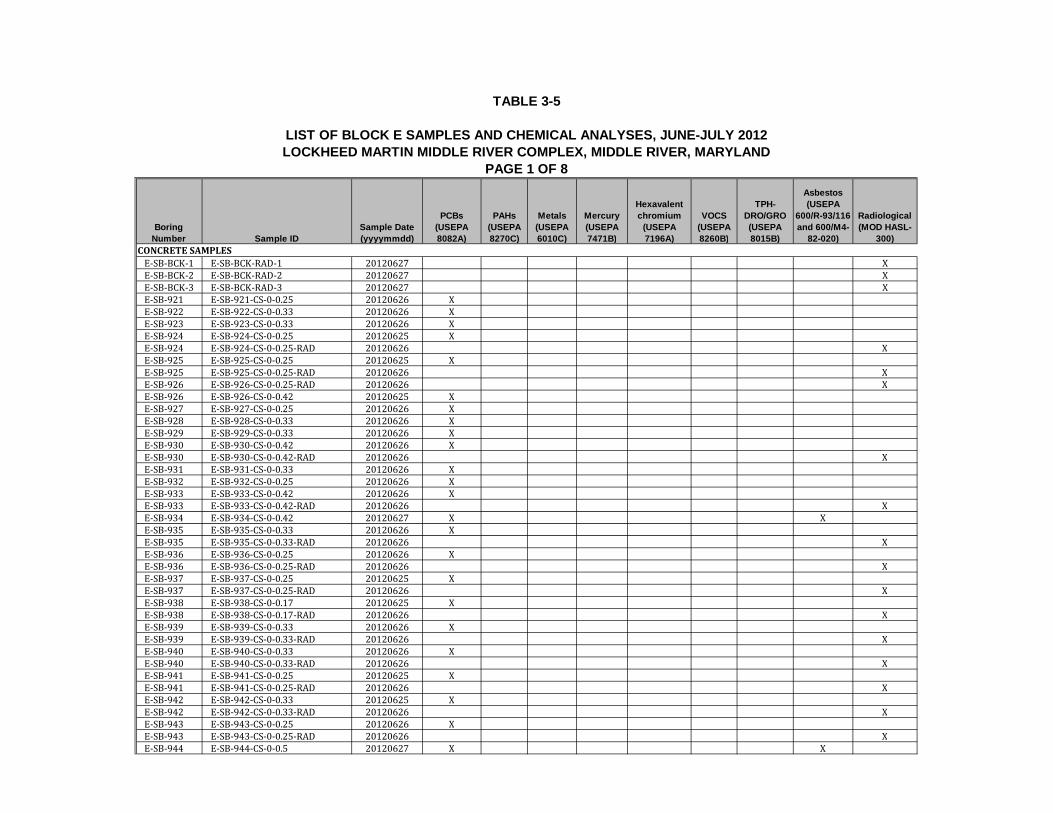
TABLE 3-5
LIST OF BLOCK E SAMPLES AND CHEMICAL ANALYSES, JUNE-JULY 2012
LOCKHEED MARTIN MIDDLE RIVER COMPLEX, MIDDLE RIVER, MARYLAND
PAGE 1 OF 8
Boring
Number Sample ID
Sample Date
(yyyymmdd)
PCBs
(USEPA
8082A)
PAHs
(USEPA
8270C)
Metals
(USEPA
6010C)
Mercury
(USEPA
7471B)
Hexavalent
chromium
(USEPA
7196A)
VOCS
(USEPA
8260B)
TPH-
DRO/GRO
(USEPA
8015B)
Asbestos
(USEPA
600/R-93/116
and 600/M4-
82-020)
Radiological
(MOD HASL-
300)
E-SB-BCK-1 E-SB-BCK-RAD-1 20120627 XE-SB-BCK-2 E-SB-BCK-RAD-2 20120627 XE-SB-BCK-3 E-SB-BCK-RAD-3 20120627 XE-SB-921 E-SB-921-CS-0-0.25 20120626 XE-SB-922 E-SB-922-CS-0-0.33 20120626 XE-SB-923 E-SB-923-CS-0-0.33 20120626 XE-SB-924 E-SB-924-CS-0-0.25 20120625 XE-SB-924 E-SB-924-CS-0-0.25-RAD 20120626 XE-SB-925 E-SB-925-CS-0-0.25 20120625 XE-SB-925 E-SB-925-CS-0-0.25-RAD 20120626 XE-SB-926 E-SB-926-CS-0-0.25-RAD 20120626 XE-SB-926 E-SB-926-CS-0-0.42 20120625 XE-SB-927 E-SB-927-CS-0-0.25 20120626 XE-SB-928 E-SB-928-CS-0-0.33 20120626 XE-SB-929 E-SB-929-CS-0-0.33 20120626 XE-SB-930 E-SB-930-CS-0-0.42 20120626 XE-SB-930 E-SB-930-CS-0-0.42-RAD 20120626 XE-SB-931 E-SB-931-CS-0-0.33 20120626 XE-SB-932 E-SB-932-CS-0-0.25 20120626 XE-SB-933 E-SB-933-CS-0-0.42 20120626 XE-SB-933 E-SB-933-CS-0-0.42-RAD 20120626 XE-SB-934 E-SB-934-CS-0-0.42 20120627 X XE-SB-935 E-SB-935-CS-0-0.33 20120626 XE-SB-935 E-SB-935-CS-0-0.33-RAD 20120626 XE-SB-936 E-SB-936-CS-0-0.25 20120626 XE-SB-936 E-SB-936-CS-0-0.25-RAD 20120626 XE-SB-937 E-SB-937-CS-0-0.25 20120625 XE-SB-937 E-SB-937-CS-0-0.25-RAD 20120626 XE-SB-938 E-SB-938-CS-0-0.17 20120625 XE-SB-938 E-SB-938-CS-0-0.17-RAD 20120626 XE-SB-939 E-SB-939-CS-0-0.33 20120626 XE-SB-939 E-SB-939-CS-0-0.33-RAD 20120626 XE-SB-940 E-SB-940-CS-0-0.33 20120626 XE-SB-940 E-SB-940-CS-0-0.33-RAD 20120626 XE-SB-941 E-SB-941-CS-0-0.25 20120625 XE-SB-941 E-SB-941-CS-0-0.25-RAD 20120626 XE-SB-942 E-SB-942-CS-0-0.33 20120625 XE-SB-942 E-SB-942-CS-0-0.33-RAD 20120626 XE-SB-943 E-SB-943-CS-0-0.25 20120626 XE-SB-943 E-SB-943-CS-0-0.25-RAD 20120626 XE-SB-944 E-SB-944-CS-0-0.5 20120627 X X
CONCRETE SAMPLES

TABLE 3-5
LIST OF BLOCK E SAMPLES AND CHEMICAL ANALYSES, JUNE-JULY 2012
LOCKHEED MARTIN MIDDLE RIVER COMPLEX, MIDDLE RIVER, MARYLAND
PAGE 2 OF 8
Boring
Number Sample ID
Sample Date
(yyyymmdd)
PCBs
(USEPA
8082A)
PAHs
(USEPA
8270C)
Metals
(USEPA
6010C)
Mercury
(USEPA
7471B)
Hexavalent
chromium
(USEPA
7196A)
VOCS
(USEPA
8260B)
TPH-
DRO/GRO
(USEPA
8015B)
Asbestos
(USEPA
600/R-93/116
and 600/M4-
82-020)
Radiological
(MOD HASL-
300)
E-SB-945 E-SB-945-CS-0-0.5 20120628 XE-SB-946 E-SB-946-CS-0-0.33 20120626 XE-SB-946 E-SB-946-CS-0-0.33-RAD 20120626 XE-SB-947 E-SB-947-CS-0-0.25 20120626 XE-SB-947 E-SB-947-CS-0-0.25-RAD 20120626 XE-SB-948 E-SB-948-CS-0-0.25 20120625 XE-SB-948 E-SB-948-CS-0-0.25-RAD 20120626 XE-SB-949 E-SB-949-CS-0-0.5 20120627 X XE-SB-950 E-SB-950-CS-0-0.5 20120627 X XE-SB-951 E-SB-951-CS-0-0.33 20120626 XE-SB-951 E-SB-951-CS-0-0.33-RAD 20120626 XE-SB-952 E-SB-952-CS-0-0.33 20120625 XE-SB-952 E-SB-952-CS-0-0.33-RAD 20120626 XE-SB-953 E-SB-953-CS-0-0.42 20120627 X XE-SB-954 E-SB-954-CS-0-0.25 20120625 XE-SB-954 E-SB-954-CS-0-0.25-RAD 20120626 XE-SB-961 E-SB-961-CS-0-0.5 20120627 X XE-SB-962 E-SB-962-CS-0-0.42 20120628 XE-SB-963 E-SB-963-CS-0-0.5 20120627 XE-SB-969 E-SB-969-CS-0-0.5 20120627 XE-SB-970 E-SB-970-CS-0-0.5 20120627 XE-SB-971 E-SB-971-CS-0-0.5 20120627 XTotal 40 6 23
D-SB-887 D-SB-887-BCK-RAD 20120629 X
D-SB-888 D-SB-888-BCK-RAD 20120629 X
D-SB-889 D-SB-889-BCK-RAD 20120629 X
D-SB-890 D-SB-890-BCK-RAD 20120629 X
D-SB-891 D-SB-891-BCK-RAD 20120629 X
D-SB-892 D-SB-892-BCK-RAD 20120629 X
D-SB-893 D-SB-893-BCK-RAD 20120629 X
E-SB-955 E-SB-955-0-0.5 20120629 X XE-SB-955 E-SB-955-0.5-2 20120629 X XE-SB-955 E-SB-955-0.5-2-RAD 20120629 XE-SB-955 E-SB-955-2-3 20120629 X XE-SB-955 E-SB-955-2-3-RAD 20120629 XE-SB-955 E-SB-955-3-4 20120629 X XE-SB-956 E-SB-956-0-0.5 20120628 X XE-SB-956 E-SB-956-0.5-2 20120628 X XE-SB-956 E-SB-956-2-3 20120628 X XE-SB-956 E-SB-956-3-4 20120628 X X
SHALLOW PERIPHERAL SOIL BORING SAMPLES(1)

TABLE 3-5
LIST OF BLOCK E SAMPLES AND CHEMICAL ANALYSES, JUNE-JULY 2012
LOCKHEED MARTIN MIDDLE RIVER COMPLEX, MIDDLE RIVER, MARYLAND
PAGE 3 OF 8
Boring
Number Sample ID
Sample Date
(yyyymmdd)
PCBs
(USEPA
8082A)
PAHs
(USEPA
8270C)
Metals
(USEPA
6010C)
Mercury
(USEPA
7471B)
Hexavalent
chromium
(USEPA
7196A)
VOCS
(USEPA
8260B)
TPH-
DRO/GRO
(USEPA
8015B)
Asbestos
(USEPA
600/R-93/116
and 600/M4-
82-020)
Radiological
(MOD HASL-
300)
E-SB-957 E-SB-957-0-0.5 20120628 X XE-SB-957 E-SB-957-0.5-2 20120628 X XE-SB-957 E-SB-957-2-3 20120628 X XE-SB-957 E-SB-957-3-4 20120628 X XE-SB-958 E-SB-958-0-0.5 20120628 X XE-SB-958 E-SB-958-0.5-2 20120628 X XE-SB-958 E-SB-958-0.5-2-RAD 20120628 XE-SB-958 E-SB-958-2-3 20120628 X X X X XE-SB-958 E-SB-958-3-4 20120628 X XE-SB-959 E-SB-959-0-0.5 20120628 X XE-SB-959 E-SB-959-0.5-2 20120628 X XE-SB-959 E-SB-959-2-3 20120628 XE-SB-959 E-SB-959-3-4 20120628 XE-SB-960 E-SB-960-1-2 20120628 X XE-SB-960 E-SB-960-1-2-RAD 20120628 XE-SB-960 E-SB-960-2-3.5 20120628 X XE-SB-961 E-SB-961-1-2 20120628 X XE-SB-961 E-SB-961-1-2-RAD 20120628 XE-SB-961 E-SB-961-2-3 20120628 X XE-SB-961 E-SB-961-2-3-RAD 20120628 XE-SB-962 E-SB-962-1-2 20120628 X XE-SB-962 E-SB-962-1-2-RAD 20120628 XE-SB-962 E-SB-962-2-3 20120628 X X X X XE-SB-963 S-SB-963-0.5-2 20120627 X XE-SB-963 E-SB-963-0.5-2.0-RAD 20120627 XE-SB-963 S-SB-963-2-2.5 20120627 X XE-SB-963 E-SB-963-2-2.5-RAD 20120627 XE-SB-964 S-SB-964-0-0.5 20120627 X XE-SB-964 S-SB-964-0.5-2 20120627 X XE-SB-964 E-SB-964-1.5-2.0-RAD 20120627 XE-SB-964 S-SB-964-2-3 20120627 XE-SB-964 S-SB-964-3-4 20120627 XE-SB-965 E-SB-965-0-0.5 20120627 X XE-SB-965 E-SB-965-0.5-2 20120627 X XE-SB-965 E-SB-965-0.5-2.0-RAD 20120627 XE-SB-965 S-SB-965-2-3 20120627 XE-SB-966 E-SB-966-0-0.5 20120627 X X X X XE-SB-966 E-SB-966-0-1-RAD 20120627 XE-SB-966 E-SB-966-0.5-2 20120627 X XE-SB-966 E-SB-966-2-3 20120627 X X X XE-SB-967 E-SB-967-0-0.5 20120627 X XE-SB-967 E-SB-967-0.5-2 20120627 X X
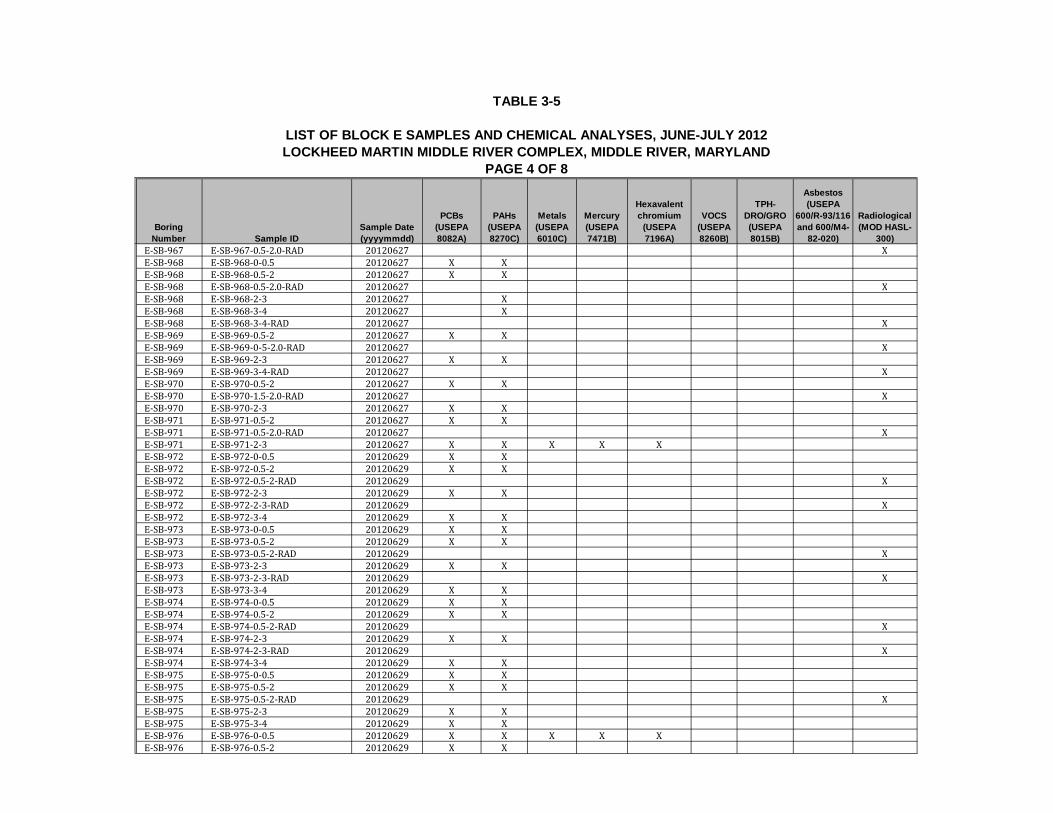
TABLE 3-5
LIST OF BLOCK E SAMPLES AND CHEMICAL ANALYSES, JUNE-JULY 2012
LOCKHEED MARTIN MIDDLE RIVER COMPLEX, MIDDLE RIVER, MARYLAND
PAGE 4 OF 8
Boring
Number Sample ID
Sample Date
(yyyymmdd)
PCBs
(USEPA
8082A)
PAHs
(USEPA
8270C)
Metals
(USEPA
6010C)
Mercury
(USEPA
7471B)
Hexavalent
chromium
(USEPA
7196A)
VOCS
(USEPA
8260B)
TPH-
DRO/GRO
(USEPA
8015B)
Asbestos
(USEPA
600/R-93/116
and 600/M4-
82-020)
Radiological
(MOD HASL-
300)
E-SB-967 E-SB-967-0.5-2.0-RAD 20120627 XE-SB-968 E-SB-968-0-0.5 20120627 X XE-SB-968 E-SB-968-0.5-2 20120627 X XE-SB-968 E-SB-968-0.5-2.0-RAD 20120627 XE-SB-968 E-SB-968-2-3 20120627 XE-SB-968 E-SB-968-3-4 20120627 XE-SB-968 E-SB-968-3-4-RAD 20120627 XE-SB-969 E-SB-969-0.5-2 20120627 X XE-SB-969 E-SB-969-0-5-2.0-RAD 20120627 XE-SB-969 E-SB-969-2-3 20120627 X XE-SB-969 E-SB-969-3-4-RAD 20120627 XE-SB-970 E-SB-970-0.5-2 20120627 X XE-SB-970 E-SB-970-1.5-2.0-RAD 20120627 XE-SB-970 E-SB-970-2-3 20120627 X XE-SB-971 E-SB-971-0.5-2 20120627 X XE-SB-971 E-SB-971-0.5-2.0-RAD 20120627 XE-SB-971 E-SB-971-2-3 20120627 X X X X XE-SB-972 E-SB-972-0-0.5 20120629 X XE-SB-972 E-SB-972-0.5-2 20120629 X XE-SB-972 E-SB-972-0.5-2-RAD 20120629 XE-SB-972 E-SB-972-2-3 20120629 X XE-SB-972 E-SB-972-2-3-RAD 20120629 XE-SB-972 E-SB-972-3-4 20120629 X XE-SB-973 E-SB-973-0-0.5 20120629 X XE-SB-973 E-SB-973-0.5-2 20120629 X XE-SB-973 E-SB-973-0.5-2-RAD 20120629 XE-SB-973 E-SB-973-2-3 20120629 X XE-SB-973 E-SB-973-2-3-RAD 20120629 XE-SB-973 E-SB-973-3-4 20120629 X XE-SB-974 E-SB-974-0-0.5 20120629 X XE-SB-974 E-SB-974-0.5-2 20120629 X XE-SB-974 E-SB-974-0.5-2-RAD 20120629 XE-SB-974 E-SB-974-2-3 20120629 X XE-SB-974 E-SB-974-2-3-RAD 20120629 XE-SB-974 E-SB-974-3-4 20120629 X XE-SB-975 E-SB-975-0-0.5 20120629 X XE-SB-975 E-SB-975-0.5-2 20120629 X XE-SB-975 E-SB-975-0.5-2-RAD 20120629 XE-SB-975 E-SB-975-2-3 20120629 X XE-SB-975 E-SB-975-3-4 20120629 X XE-SB-976 E-SB-976-0-0.5 20120629 X X X X XE-SB-976 E-SB-976-0.5-2 20120629 X X

TABLE 3-5
LIST OF BLOCK E SAMPLES AND CHEMICAL ANALYSES, JUNE-JULY 2012
LOCKHEED MARTIN MIDDLE RIVER COMPLEX, MIDDLE RIVER, MARYLAND
PAGE 5 OF 8
Boring
Number Sample ID
Sample Date
(yyyymmdd)
PCBs
(USEPA
8082A)
PAHs
(USEPA
8270C)
Metals
(USEPA
6010C)
Mercury
(USEPA
7471B)
Hexavalent
chromium
(USEPA
7196A)
VOCS
(USEPA
8260B)
TPH-
DRO/GRO
(USEPA
8015B)
Asbestos
(USEPA
600/R-93/116
and 600/M4-
82-020)
Radiological
(MOD HASL-
300)
E-SB-976 E-SB-976-0.5-2-RAD 20120629 XE-SB-976 E-SB-976-2-3 20120629 X XE-SB-976 E-SB-976-2-3-RAD 20120629 XE-SB-976 E-SB-976-3-4 20120629 X X X X XE-SB-977 E-SB-977-0-0.5 20120629 X XE-SB-977 E-SB-977-0.5-2 20120629 X XE-SB-977 E-SB-977-0.5-2-RAD 20120629 XE-SB-977 E-SB-977-2-3 20120629 X XE-SB-977 E-SB-977-3-4 20120629 X XE-SB-978 E-SB-978-0-0.5 20120629 X XE-SB-978 E-SB-978-0.5-2 20120629 X XE-SB-978 E-SB-978-0.5-2-RAD 20120629 XE-SB-978 E-SB-978-2-2.5 20120629 X XE-SB-979 E-SB-979-0-0.5 20120628 X XE-SB-979 E-SB-979-0.5-2 20120628 X XE-SB-979 E-SB-979-0.5-2-RAD 20120628 XE-SB-979 E-SB-979-2-3 20120628 X XE-SB-979 E-SB-979-3-4 20120628 X XE-SB-980 E-SB-980-0-0.5 20120628 X XE-SB-980 E-SB-980-0.5-2 20120628 X XE-SB-980 E-SB-980-0.5-2-RAD 20120628 XE-SB-980 E-SB-980-2-3 20120628 X XE-SB-980 E-SB-980-3-4 20120628 X XE-SB-981 E-SB-981-0-0.5 20120628 X XE-SB-981 E-SB-981-0.5-2 20120628 X XE-SB-981 E-SB-981-0.5-2-RAD 20120628 XE-SB-981 E-SB-981-2-3 20120628 X XE-SB-981 E-SB-981-2-3-RAD 20120628 XE-SB-981 E-SB-981-3-3.5 20120628 X XE-SB-982 E-SB-982-0-0.5 20120628 X XE-SB-982 E-SB-982-0.5-2 20120628 X XE-SB-982 E-SB-982-0.5-2-RAD 20120628 XE-SB-982 E-SB-982-2-3 20120628 X XE-SB-982 E-SB-982-3-4 20120628 X X
DEEP SOIL BORING SAMPLESE-CB-2 E-CB-2-0-2 20120719 X XE-CB-2 E-CB-2-0-2-RAD 20120719 XE-CB-2 E-CB-2-2-4 20120719 X XE-CB-2 E-CB-2-2-4-RAD 20120719 XE-CB-2 E-CB-2-4-6 20120719 X XE-CB-2 E-CB-2-6-8 20120719 X XE-CB-2 E-CB-2-8-10 20120719 X X

TABLE 3-5
LIST OF BLOCK E SAMPLES AND CHEMICAL ANALYSES, JUNE-JULY 2012
LOCKHEED MARTIN MIDDLE RIVER COMPLEX, MIDDLE RIVER, MARYLAND
PAGE 6 OF 8
Boring
Number Sample ID
Sample Date
(yyyymmdd)
PCBs
(USEPA
8082A)
PAHs
(USEPA
8270C)
Metals
(USEPA
6010C)
Mercury
(USEPA
7471B)
Hexavalent
chromium
(USEPA
7196A)
VOCS
(USEPA
8260B)
TPH-
DRO/GRO
(USEPA
8015B)
Asbestos
(USEPA
600/R-93/116
and 600/M4-
82-020)
Radiological
(MOD HASL-
300)
E-CB-2 E-CB-2-10-12 20120719 X XE-CB-2 E-CB-2-12-14 20120719 X X X X X XE-CB-2 E-CB-2-16-18 20120719 XE-CB-2 E-CB-2-22-24 20120719 XE-CB-2 E-CB-2-26-28 20120719 X X X X X XE-CB-2 E-CB-2-28-30 20120719 XE-CB-2 E-CB-2-32-34 20120719 XE-CB-2 E-CB-2-36-38 20120719 XE-CB-2 E-CB-2-38-40 20120719 X X X X X XE-CB-2 E-CB-2-42-44 20120719 XE-CB-2 E-CB-2-46-48 20120719 XE-CB-2 E-CB-2-48-50 20120719 X X X X X XE-CB-11A E-CB-11A-0-2 20120720 X XE-CB-11A E-CB-11A-0-2-RAD 20120720 XE-CB-11A E-CB-11A-2-4 20120720 X XE-CB-11A E-CB-11A-2-4-RAD 20120720 XE-CB-11A E-CB-11A-4-6 20120720 X XE-CB-11A E-CB-11A-6-8 20120720 X XE-CB-11A E-CB-11A-8-10 20120720 X XE-CB-11A E-CB-11A-10-12 20120720 X X X X X XE-CB-11A E-CB-11A-12-14 20120720 XE-CB-11A E-CB-11A-16-18 20120720 XE-CB-11A E-CB-11A-18-20 20120720 X X X X X XE-CB-11A E-CB-11A-22-24 20120720 XE-CB-11A E-CB-11A-26-28 20120720 XE-CB-11A E-CB-11A-32-34 20120720 XE-CB-11A E-CB-11A-36-38 20120720 X X X X X XE-CB-11A E-CB-11A-38-40 20120720 XE-CB-11A E-CB-11A-42-44 20120720 XE-CB-11A E-CB-11A-46-48 20120720 X X X X X XE-CB-11A E-CB-11A-48-50 20120720 XE-CB-11B E-CB-11B-0-2 20120719 XE-CB-11B E-CB-11B-0-2-RAD 20120719 XE-CB-11B E-CB-11B-2-4 20120719 XE-CB-11B E-CB-11B-2-4-RAD 20120719 XE-CB-11B E-CB-11B-4-6 20120719 XE-CB-11B E-CB-11B-6-8 20120719 X X X X X XE-CB-11B E-CB-11B-8-10 20120719 XE-CB-11B E-CB-11B-12-14 20120719 XE-CB-11B E-CB-11B-16-18 20120719 X X X X X XE-CB-11B E-CB-11B-18-20 20120719 XE-CB-11B E-CB-11B-22-24 20120719 X

TABLE 3-5
LIST OF BLOCK E SAMPLES AND CHEMICAL ANALYSES, JUNE-JULY 2012
LOCKHEED MARTIN MIDDLE RIVER COMPLEX, MIDDLE RIVER, MARYLAND
PAGE 7 OF 8
Boring
Number Sample ID
Sample Date
(yyyymmdd)
PCBs
(USEPA
8082A)
PAHs
(USEPA
8270C)
Metals
(USEPA
6010C)
Mercury
(USEPA
7471B)
Hexavalent
chromium
(USEPA
7196A)
VOCS
(USEPA
8260B)
TPH-
DRO/GRO
(USEPA
8015B)
Asbestos
(USEPA
600/R-93/116
and 600/M4-
82-020)
Radiological
(MOD HASL-
300)
E-CB-11B E-CB-11B-26-28 20120719 XE-CB-11B E-CB-11B-28-30 20120719 X X X X X XE-CB-11B E-CB-11B-32-34 20120719 XE-CB-11B E-CB-11B-36-38 20120719 XE-CB-11B E-CB-11B-38-40 20120719 X X X X X XE-CB-13 E-CB-13-0-2 20120720 X XE-CB-13 E-CB-13-0-2-RAD 20120720 XE-CB-13 E-CB-13-2-4 20120720 X XE-CB-13 E-CB-13-2-4-RAD 20120720 XE-CB-13 E-CB-13-4-6 20120720 X XE-CB-13 E-CB-13-6-8 20120720 X XE-CB-13 E-CB-13-8-10 20120720 X XE-CB-13 E-CB-13-10-12 20120720 X X X X X XE-CB-13 E-CB-13-14-16 20120720 XE-CB-13 E-CB-13-18-20 20120720 XE-CB-13 E-CB-13-22-24 20120720 X X X X X XE-CB-13 E-CB-13-24-26 20120720 XE-CB-13 E-CB-13-28-30 20120720 XE-CB-13 E-CB-13-32-34 20120720 XE-CB-13 E-CB-13-36-38 20120720 X X X X X XE-CB-13 E-CB-13-38-40 20120720 XE-CB-13 E-CB-13-40-42 20120720 XE-CB-13 E-CB-13-42-44 20120720 XE-CB-13 E-CB-13-44-46 20120720 X X X X X XE-SB-983 E-SB-983-0-2 20120719 X X XE-SB-983 E-SB-983-0-2-RAD 20120719 XE-SB-983 E-SB-983-2-4 20120719 X XE-SB-983 E-SB-983-2-4-RAD 20120719 XE-SB-983 E-SB-983-4-6 20120719 X XE-SB-983 E-SB-983-6-8 20120719 X XE-SB-983 E-SB-983-8-10 20120719 X XE-SB-983 E-SB-983-10-12 20120719 XE-SB-983 E-SB-983-12-14 20120719 XE-SB-983 E-SB-983-14-16 20120719 XE-SB-983 E-SB-983-16-18 20120719 XE-SB-983 E-SB-983-18-20 20120719 XE-SB-983 E-SB-983-22-24 20120719 XE-SB-983 E-SB-983-26-28 20120719 XE-SB-983 E-SB-983-32-34 20120719 XE-SB-983 E-SB-983-36-38 20120719 XE-SB-984 E-SB-984-0-2 20120724 X XE-SB-984 E-SB-984-0-2-RAD 20120724 X

TABLE 3-5
LIST OF BLOCK E SAMPLES AND CHEMICAL ANALYSES, JUNE-JULY 2012
LOCKHEED MARTIN MIDDLE RIVER COMPLEX, MIDDLE RIVER, MARYLAND
PAGE 8 OF 8
Boring
Number Sample ID
Sample Date
(yyyymmdd)
PCBs
(USEPA
8082A)
PAHs
(USEPA
8270C)
Metals
(USEPA
6010C)
Mercury
(USEPA
7471B)
Hexavalent
chromium
(USEPA
7196A)
VOCS
(USEPA
8260B)
TPH-
DRO/GRO
(USEPA
8015B)
Asbestos
(USEPA
600/R-93/116
and 600/M4-
82-020)
Radiological
(MOD HASL-
300)
E-SB-984 E-SB-984-2-4 20120724 X XE-SB-984 E-SB-984-2-4-RAD 20120724 X
E-SB-984 E-SB-984-4-6 20120724 X X X XE-SB-984 E-SB-984-6-8 20120724 X XE-SB-984 E-SB-984-8-10 20120724 X XE-SB-984 E-SB-984-10-12 20120724 X X X XE-SB-984 E-SB-984-12-14 20120724 XE-SB-984 E-SB-984-14-16 20120724 XE-SB-984 E-SB-984-16-18 20120724 XE-SB-984 E-SB-984-18-20 20120724 XE-SB-984 E-SB-984-22-24 20120724 XE-SB-984 E-SB-984-26-28 20120724 XE-SB-984 E-SB-984-32-34 20120724 XE-SB-984 E-SB-984-36-38 20120724 XTotal 178 135 23 23 7 20 18 0 54
1 Samples were also collected at depths of 3-4 feet at E-SB-961, E-SB-962, E-SB-969 and E-SB-971 and 3-3.5 feet at E-SB-970, but were not analyzedin accordance with the work plan because the analyte concentrations for the above sample were less than the project screening levels.
CB - confirmation boring PAHs - polycyclic aromatic hydrocarbons TPH - total petroleum hydrocarbonsCS - concrete sample PCBs - polychlorinated biphenyls USEPA - U.S. Environmental Protection AgencyDRO - diesel-range organics RAD - radiological yyyymmdd - year month dayGRO - gasoline-range organics SB - soil boring

This page intentionally left blank.
7903 TETRA TECH • LOCKHEED MARTIN MIDDLE RIVER COMPLEX •2012 ADDITIONAL BLOCK E SOIL INVESTIGATION REPORT PAGE 4-1
Section 4
Results
The following section presents the results of the June–July 2012 Block E additional soil
investigation. The study includes a geophysical survey of the southeastern portion of Block E to
identify potential subsurface geophysical anomalies and features, and additional concrete, soil
and groundwater sampling and chemical analyses. The results of these investigation tasks are
described in the following sections.
4.1 GEOPHYSICAL SURVEY
This section summarizes the finding of the electrical resistivity imaging (ERI) study. A full report
detailing the findings of the ERI survey is in Appendix C. The survey confirms the presence of a
metallic water pipeline running through the study site. The electrical signal for the structure is
indicated as purple-shaded conductive anomalies in several transections. The pipeline is shown
running from the southwestern corner to the northeastern boundary of the survey area in a line
parallel to survey lines MID-4, MID-5, and MID-6. Building footers and, with one exception,
significant sub-slab voids were not detected when advancing stainless-steel electrodes below the
slab or in the ERI data.
Small voids ranging from approximately two to six inches deep were detected at several
locations when the steel probes were advanced below the concrete slabs. A nine-foot deep void
was detected after advancing a 10-foot long steel rod in the area shown in historical drawings as
an elevator location. Vertical high-conductivity signatures indicate possible locations of pilings
in the survey area. A review of historical building structural drawings shows building footers at
depths ranging from 4.5 to 5.2 feet below grade in the survey area; deeper pilings were installed
north and east of the survey area. Strong and consistent correlations between resistivity readings
and lithology are not apparent in the ERI results.
Four soil borings CB-2, CB-11A, CB-11B, and CB-13 were advanced in areas of ERI anomalies.
Soil samples were collected continuously to depths of 40 to 50 feet using RotoSonic drilling

7903 TETRA TECH • LOCKHEED MARTIN MIDDLE RIVER COMPLEX •2012 ADDITIONAL BLOCK E SOIL INVESTIGATION REPORT PAGE 4-2
methods. The potential presence of ERI anomalies (i.e., subsurface areas of either high
conductivity or high resistivity) led to collection of soil samples for chemical analyses to provide
soil-chemical data to be evaluated along with the occurrence of the ERI anomalies. CB-2 and
CB-11A were advanced in areas of high resistivity and CB-11B and CB-13 were advanced in
areas of high conductivity. Only low concentrations of target analytes were detected in these
borings, at limited depth.
Low concentrations of polycyclic aromatic hydrocarbons (PAHs) (resistive constituents) were
detected in shallow soil samples collected from CB-2 (0–2 feet), CB-11A (4–12 feet), and CB-13
(4–6 feet). Slightly elevated concentrations of several metals (conductive constituents) were
detected in shallow and intermediate-depth soil samples at CB-11B (6–8 feet) and CB-11A
(18–20 feet) (see Tables 4-7 and 4-8 and discussions below). At SB-984, contaminant
concentrations above regulatory standards are coincident with resistive anomalies detected in this
area. Elsewhere, strong correlations between chemical constituents (e.g., PCBs, PAHs, or metals)
and high conductivity or high resistivity could not be established with the ERI survey.
4.2 GROUNDWATER LEVELS
Groundwater levels and elevations and measured field parameters for the study are in Table 4-1.
Groundwater elevations obtained from the groundwater level measurements were plotted to
provide a groundwater-elevation contour map in Figure 4-1. Groundwater elevations are shown
for the upper surficial aquifer “A” wells in Block E. Figure 4-1 shows that during the period of
the ERI survey, groundwater flow was from the area of higher groundwater elevations in the
northwest to Dark Head Cove to the southeast.
4.3 CONCRETE, SOIL, AND GROUNDWATER SAMPLING,JUNE–JULY 2012
This investigation primarily sought to further characterize polychlorinated biphenyls (PCBs) and
PAHs in soil at the southwestern portion and the periphery of Block E, and to provide data for
other chemicals to update a risk assessment. Two-hundred-eighteen concrete and soil samples
were analyzed for PCBs and 135 soil samples were analyzed for PAHs. Selected samples were
also analyzed for volatile organic compounds (VOCs), total petroleum hydrocarbons
(TPH)-gasoline range organics (GRO), TPH-diesel range organics (DRO), metals (including

7903 TETRA TECH • LOCKHEED MARTIN MIDDLE RIVER COMPLEX •2012 ADDITIONAL BLOCK E SOIL INVESTIGATION REPORT PAGE 4-3
hexavalent chromium [CrVI]) in soils, and six concrete samples were analyzed for asbestos.
Samples analyzed for radiological parameters are discussed in Appendix A. As discussed in
Section 3, the analytical results from the laboratory underwent Level IV data-validation
procedures in accordance with U.S. Environmental Protection Agency (USEPA) Region 3
protocols to ensure that the laboratory data generated are valid and adequate for the project
objectives.
This section presents the results of the chemical analyses of site concrete, soil, and a single
groundwater sample relative to human health risk-based screening standards. Human health
screening was completed for this investigation because human health risks are considered the
primary drivers for implementing additional studies and remedial actions. The screening is
intended to gauge the degree of observed soil and groundwater impacts in relation to regulatory
standards and potential adverse effects on human health or the environment, and to evaluate the
need for further sampling or remedial action. Therefore, regulatory risk-based standards are used
whenever possible.
Residential standards are used to provide a relative evaluation for hypothetical future property
use. Non-residential or industrial screening of the results was conducted because the site is
restricted and the facility is likely to remain an industrial or commercial property for the
indefinite future. Therefore, non-residential or industrial standards are considered more
applicable for current and likely future uses of the property.
USEPA recommends PCB remediation goals of one milligram per kilogram (mg/kg)
concentration for residential land use, and 10–25 mg/kg concentration for industrial land use
(USEPA, 1990). Therefore, the recommended PCB residential remediation goal of 1 mg/kg and
industrial goal of 10 mg/kg were selected as PCB screening-criteria for this investigation. The
Block E human-health risk assessment (HHRA) formulated preliminary remediation goals for
PAHs as benzo(a)pyrene equivalents (BaPEq) (Tetra Tech, 2012a). The BaPEq residential
remediation goal is 0.140 mg/kg and its industrial remediation goal of 2.90 mg/kg were
developed as part of the HHRA (Tetra Tech, 2012a; Table 6-2) and subsequently selected as
BaPEq screening-criteria for this investigation. Site-specific background levels for the Middle
River Complex (MRC) were also developed for arsenic (12 mg/kg) and vanadium (91 mg/kg) in
soil in a subsequent response action plan for Block B soil (Tetra Tech, 2010). These two site-

7903 TETRA TECH • LOCKHEED MARTIN MIDDLE RIVER COMPLEX •2012 ADDITIONAL BLOCK E SOIL INVESTIGATION REPORT PAGE 4-4
specific background concentrations were approved for the MRC by Maryland Department of the
Environment (MDE) These background concentrations are used as residential and
non-residential screening criteria for this study.
For other constituents, MDE chemical-specific soil and groundwater standards (MDE, 2008)
were used to evaluate concentrations of constituents detected in soil and groundwater. MDE uses
these standards to screen sites, and they are useful benchmarks for evaluating site data and
potential cleanup goals. For soil, the results of the field investigation were compared to MDE
residential and non-residential land use standards for constituents without site-specific
remediation goals discussed previously.
Two types of tables summarizing the chemical analytical results are in the following sections. In
the first table, statistical summaries detail the number of detections, minimum and maximum
concentrations, and average concentrations for each analyte detected. The second table is a
complete list of concentrations detected in soil with data validation qualifiers for the samples
collected during this investigation. Shaded cells in these second tables represent constituents for
which concentrations exceed the screening level. Data tables presenting all sampling analytical
results, along with laboratory reporting limits or method-detection limits, are in Appendix H. The
asbestos analyses report is also in Appendix H. Data validation reports are in Appendix F.
4.3.1 Concrete Samples
Analytical results for the 40 concrete samples collected at Block E in June 2012 are in Tables 4-2
and 4-3 and in Figure 4-2. The tables and figure show that PCBs were detected at 23 sampling
locations with detected concentrations of total PCBs (t-PCBs) ranging from 0.021 mg/kg at
E-SB-962 (along the eastern boundary of Block E) to 12 mg/kg at E-SB-947 (in the west–central
part of the former Building D concrete slabs). Of the 23 detections, only three sampling locations
exceed the screening level of 1 mg/kg.
The three sampling locations exceeding the screening level are E-SB-947 (12 mg/kg), E-SB-942
(5.8 mg/kg), and E-SB-938 (1.2 mg/kg). Borings E-SB-942 and E-938 are along the southern
edge of the concrete slabs in the areas of the former finishing department (E-SB-942) and former
transformer room (E-SB-938). The t-PCB concentration at boring E-932 (0.97 mg/kg), in the
tractor-trailer storage area, is slightly below the screening level of 1 mg/kg. Aroclor-1260 is the

7903 TETRA TECH • LOCKHEED MARTIN MIDDLE RIVER COMPLEX •2012 ADDITIONAL BLOCK E SOIL INVESTIGATION REPORT PAGE 4-5
primary PCB detected in the 2012 samples; Aroclor-1248 was detected in only one sample
(E-SB-948).
Except for the area of boring E-SB-947 (in the west–central portion of the concrete slabs), these
results confirm previous findings that PCB concentrations exceed the screening level primarily
along the southern edge of the concrete. In the eastern and northern portions of the slabs, PCB
concentrations are generally below the residential standard of 1 mg/kg.
Sampling results at borings E-SB-933, E-SB-934, E-SB-935, E-SB-939, and E-SB-943 also
provide boundaries of PCB concentrations that are less than the screening level to the east and
west of where elevated PCBs levels were detected in concrete at borings E-SB-833, E-SB-833E,
and E-SB-833K, in the southwestern portion of the concrete slabs.
Concrete samples from borings E-SB-934, E-SB-944, E-SB-949, E-SB-950, E-SB-953, and
E-SB-961 were also analyzed for asbestos. Asbestos was not detected in any of these samples.
(See the asbestos report in Appendix H).
4.3.2 Peripheral Soil Samples
Soil samples were collected from 28 shallow soil borings (E-SB-955 through E-SB-982) to
maximum depths of 2.5 to four feet below grade. As mentioned in Section 3, deeper samples at
the shallow soil borings were analyzed for PCBs and PAHs only if the upper sample result did
not exceed the residential screening levels for those analytes. Therefore, the actual number of
samples analyzed may vary from those actually collected in the field (as shown in Table 3-2) to
those analyzed (Tables 3-4 and 3-5). The following sections briefly discuss the PCB, PAHs,
TPH-GRO, TPH-DRO, and metals results for the 2012 peripheral soil samples. Statistical
summaries of detected concentrations in the peripheral soil samples are in Table 4-4; detected
concentrations are in Table 4-5.
4.3.2.1 Polychlorinated Biphenyls
Eighty-five soil samples from 28 peripheral soil borings were analyzed for PCBs by the
laboratory. PCBs were detected in 48 of 85 samples: Aroclor-1260 was detected in 47 samples
(one of the 47 samples also contained Aroclor-1248), and Aroclor-1242 was detected in one
sample. Aroclor-PCB concentrations range from 0.020 mg/kg at sampling location E-SB-977 (at
7903 TETRA TECH • LOCKHEED MARTIN MIDDLE RIVER COMPLEX •2012 ADDITIONAL BLOCK E SOIL INVESTIGATION REPORT PAGE 4-6
a depth of two to three feet) to 800 mg/kg at sampling location E-SB-980 (at a depth of zero to
six inches). PCB concentrations exceed the residential screening level of 1 mg/kg in 24 samples,
and exceed the industrial screening level of 10 mg/kg in 14 samples.
Total PCBs detected in soil samples are shown in Figure 4-3. The highest t-PCB concentration
detected in a peripheral soil sample is 800 mg/kg (E-SB-980-0–0.5), collected from a location
adjacent to the former electrical substation and transformer room in the south–central portion of
Block E. The highest t-PCB concentrations detected in the 2012 peripheral soil samples are as
follows:
E-SB-980 (800 mg/kg at 0–0.5 foot) E-SB-957 (39 mg/kg at 0–0.5 foot)
E-SB-981 (720 mg/kg at 0.5–2 feet) E-SB-976 (35 mg/kg at 0–0.5 foot)
E-SB-974 (320 mg/kg at 0–0.5 foot) E-SB-977 (27 mg/kg at 0–0.5 foot)
E-SB-978 (136 mg/kg at 0–0.5 foot) E-SB-956 (22 mg/kg at 0–0.5 foot)
E-SB-981 (110 mg/kg at 0–0.5 foot) E-SB-958 (22 mg/kg at 0.5–2 feet)
E-SB-975 (87 mg/kg at 0–0.5 foot) E-SB-978 (16 mg/kg at 0.5–2 feet)
E-SB-979 (55 mg/kg at 0–0.5 foot)
The highest t-PCB concentrations shown above are in shallow soil at depths of 0–0.5 foot and
0.5–2 feet. PCBs were typically not detected below two feet, or if they were detected, their
concentrations were less than the residential screening level. Except for boring E-SB-967, near
the former electrical transformer and heating room in the northwestern portion of Block E, the
2012 results confirm previous findings that t-PCB concentrations are, for the most part, below
the residential screening level in the northern and eastern portions of Block E, and that screening
level exceedances occur in samples collected from the southern edge of the concrete slabs
(borings E-SB-973 through E-SB-982) to the southern boundary of Block E (borings E-SB-955
through E-SB-958).
4.3.2.2 Benzo(a)pyrene Equivalent
Ninety-three soil samples from 28 peripheral soil borings were analyzed for PAHs by the
laboratory. Benzo(a)pyrene equivalent (BaPEq) concentrations were computed for each sample
7903 TETRA TECH • LOCKHEED MARTIN MIDDLE RIVER COMPLEX •2012 ADDITIONAL BLOCK E SOIL INVESTIGATION REPORT PAGE 4-7
using the PAH results. PAHs were detected in 63 of 93 samples, in concentrations ranging from
0.0045 mg/kg (E-SB-977-0.5–2) to 45.37 mg/kg (E-SB-974-0–0.5).
BaPEq concentrations exceeding screening levels are shown in Table 4-6 and Figure 4-4. BaPEq
concentrations exceed the residential screening level (0.140 mg/kg) in 30 samples, and exceed
the industrial screening level (2.90 mg/kg) in 12 samples. The highest BaPEq concentration is
45.37 mg/kg at E-SB-974-0-0.5, which is south of the former Building D concrete slabs, between
the former waste disposal area and the concrete pad area used to store Tilley Chemical trailers.
The highest BaPEq concentrations (all of which are industrial screening-level exceedances) and
most of the residential screening-level exceedances are found in shallow soil, at depths of
0–0.5 foot or 0.5 to two feet. Five residential screening-level exceedances were detected in
samples collected below two feet. The 2012 results confirm previous findings that BaPEq
concentrations are, for the most part, below the industrial screening level in the northern and
eastern portions of Block E, and concentrations exceed screening levels from the southern edge
of the concrete slabs (borings E-SB-973 through E-SB-982) to the southern boundary of Block E
(borings E-SB-955 through E-SB-957 and E-SB-959). Exceptions that exceed the industrial
screening level in the northern portion of Block E include surface soil (0–0.5 foot) at borings
E-SB-964, E-SB-965, and E-SB-967, near a former heater room, the former cafeteria, and a
former electrical transformer and heating room.
4.3.2.3 Metals
The laboratory analyzed seven soil samples for metals and CrVI. Eighteen metals, including
CrVI, were detected in at least one sample. However, concentrations of all metals are below
non-residential screening levels, and exceedances of the residential levels occurred infrequently.
Metal concentrations exceed residential screening levels in two samples: E-SB-976-0–0.5 and
E-SB-966-2–3. In E-SB-976-0–0.5, concentrations of antimony, chromium, lead, and mercury
exceed their respective residential screening levels. Antimony at 6.2 mg/kg exceeds its screening
level (3.1 mg/kg) by a factor of two, but chromium, lead, and mercury only exceed their
residential screening levels by 4–30% (e.g., lead at 450 mg/kg, with a residential screening level
of 400 mg/kg, exceeds its residential screening level by 12.5%). Thallium at E-SB-966-2–3
(0.65 mg/kg) slightly exceeds its residential screening level (0.55 mg/kg), but is below its non-
residential screening level (7.2 mg/kg).

7903 TETRA TECH • LOCKHEED MARTIN MIDDLE RIVER COMPLEX •2012 ADDITIONAL BLOCK E SOIL INVESTIGATION REPORT PAGE 4-8
4.3.3 Deep Boring Soil Samples
Soil samples were collected from six deep soil borings (E-SB-983, E-SB-984, E-CB-2,
E-CB-11A, E-CB-11B, and E-CB-13) to maximum depths of 50 feet below grade. The following
sections briefly discuss the PCB, PAHs, TPH-GRO, TPH-DRO, and metals results for the 2012
deep-boring soil samples. Statistical summaries of detected concentrations in the deep soil
samples are in Table 4-7; detected concentrations are in Table 4-8.
4.3.3.1 Polychlorinated Biphenyls
The laboratory analyzed 93 soil samples from six soil borings for PCBs. PCBs were detected in
17 samples, 11 of which were from one boring (E-SB-984). Concentrations range from
0.032 mg/kg (E-SB-984-26–28) to 1,700 mg/kg (E-SB-984-4–6). PCB concentrations exceed the
residential screening level (1 mg/kg) in four samples, three of which also exceed the industrial
screening level (10 mg/kg).
Figure 4-3 shows total PCB concentrations in the deep soil samples. This highest t-PCB
concentration for a deep soil sample is 1,700 mg/kg, collected at the 4–6 foot interval at
E-SB-984, which is near a former electrical transformer room in the southwestern portion of
Block E. High PCB concentrations are expected at boring E-SB-984 because it is near previous
soil boring E-SB-853, where high PCB concentrations of 19,000 mg/kg and 780 mg/kg were
detected at depth (8–12 feet and 12–16 feet, respectively). PCB exceedances of the residential
screening level (1 mg/kg) were also detected in E-SB-853 at 24–28.5 feet below grade, at
concentrations ranging from 1.5 to 4.3 mg/kg.
Concentrations of t-PCBs exceeding residential and industrial screening levels in the deep-soil
boring samples are as follows:
E-SB-984 (1,700 mg/kg at 4–6 feet) E-SB-984 (480 mg/kg at 10–12 feet)
E-SB-984 (120 mg/kg at 12–14 feet) E-SB-984 (10 mg/kg at 14–16 feet)
T-PCB concentrations for soil samples collected from 16 to 28 feet at E-SB-984 are less than the
residential screening level (1 mg/kg). PCBs were not detected in E-SB-984 samples collected
below 28 feet, at 32–38 feet below grade. PCBs were either not detected, or were detected at
7903 TETRA TECH • LOCKHEED MARTIN MIDDLE RIVER COMPLEX •2012 ADDITIONAL BLOCK E SOIL INVESTIGATION REPORT PAGE 4-9
concentrations (0.034–0.160 mg/kg) below the residential screening level (1 mg/kg) in the
remaining five soil borings (see Figure 4-3).
4.3.3.2 Benzo(a)pyrene Equivalent
PAHs were detected in six of 42 soil samples collected from deep soil borings and analyzed for
PAHs. PAH results were used to calculate BaPEq concentrations (see the human health risk
assessment [Tetra Tech, 2012a] for details on methodology and BaPEq calculation). BaPEq
concentrations range from 0.0066 mg/kg (E-CB-13-4–6) to 0.188 mg/kg (E-SB-983-0–2), and
are as follows:
E-SB-983 (0.188 mg/kg at 0–2 feet)—exceeds residential level of 0.14 mg/kg
E-CB-11A (0.079 mg/kg at 4–6 feet)—below residential level
E-CB-11A (0.020 mg/kg at 8–10 feet)—below residential level
E-SB-983 (0.018 mg/kg at 4–6 feet)—below residential level
E-CB-2 (0.009 mg/kg at 0–2 feet)—below residential level
E-CB-13 (0.007 mg/kg at 4–6 feet)—below residential level
BaPEq concentrations exceeding screening levels in deep boring samples are shown in Table 4-8
and Figure 4-4. BaPEq concentrations do not exceed the industrial screening level of 2.90 mg/kg
in any deep boring sample, and BaPEq exceeds the residential screening level of 0.140 mg/kg in
only one sample (E-SB-983-0–2, 0.188 mg/kg). Boring E-SB-983 is south of former Building D
and adjacent to the former waste disposal area. In this boring, the BaPEq concentration in the
deeper soil sample (4–6 feet) was 0.0184 mg/kg, which is 10 times lower than the 0–2 foot
sample concentration, and well below the residential screening level.
4.3.3.3 Petroleum Hydrocarbons
Eighteen samples were analyzed for TPH-GRO and TPH-DRO. As shown in the Tables 4-7 and
4-8 and Figure 4-5, TPH-GRO was detected in one sample (E-CB-2-12–14) at 12–14 feet and
TPH-DRO was detected in one sample (E-CB-11A-10–12) at 10–12 feet. Both detected TPH
concentrations are less than screening criteria. Nine TPH-DRO sampling results were flagged
with a “B” data qualifier, indicating that TPH-DRO appeared in laboratory control blanks but its
7903 TETRA TECH • LOCKHEED MARTIN MIDDLE RIVER COMPLEX •2012 ADDITIONAL BLOCK E SOIL INVESTIGATION REPORT PAGE 4-10
presence in these samples is likely due to laboratory contamination. One TPH-GRO result (sample
E-SB-984-10–12) was flagged with a “UR” qualifier, indicating that it is not considered reliable.
4.3.3.4 Volatile Organic Compounds
Twenty soil samples from the deep borings were analyzed for VOCs. Most VOCs were detected
in shallow soil samples from boring E-SB-984. This boring is in an area near a former electrical
transformer room in the southwestern portion of Block E, and contains PCBs above 100 mg/kg at
four to 14 feet below grade. As shown in Table 4-8, 1,2,3-trichlorobenzene (123-TCB) was
detected at 47,000-micrograms per kilogram (µg/kg) at a depth of 10–12 feet, and at
69,000 µg/kg in the four- to six-foot interval, exceeding its residential screening level
(2,900 µg/kg). 1,2,4-Trichlorobenzene (124-TCB) exceeds both its residential (38,000 µg/kg)
and non-residential (175,000 µg/kg) screening levels with concentrations of 210,000 µg/kg and
310,000 µg/kg at the same depths (10–12 feet and 4–6 feet, respectively). Both TCB
concentrations are approximately 47% higher in the 4–6-foot sample than they are in the
10–12 foot sample.
Lower concentrations of other common Block E VOCs such as dichlorobenzene (DCB) isomers
(200–3,700 µg/kg), tetrachloroethene (530–710 µg/kg), trichloroethene (TCE) (340 µg/kg),
naphthalene (470–770 µg/kg), ethylbenzene (180 µg/kg), and xylenes (260–370 µg/kg) were in
one or both of these samples. Deeper samples collected from boring E-SB-984 were not analyzed
for VOCs because field-screening measurements did not indicate high concentrations of VOCs at
depth. Lower concentrations of the TCB and DCB isomers and TCE were detected in samples
collected from 10–14 feet in boring E-CB-2, located southeast of E-SB-984 and the former waste
disposal area at Block E.
4.3.3.5 Metals
The laboratory analyzed 16 soil samples for metals. Fourteen metals were detected in one or
more samples, and nine of these were detected in all samples. Chromium exceeds its residential
screening level (23 mg/kg) in samples E-CB-11A-18-20 (44 mg/kg) and E-CB-11B-6-8
(24 mg/kg).

7903 TETRA TECH • LOCKHEED MARTIN MIDDLE RIVER COMPLEX •2012 ADDITIONAL BLOCK E SOIL INVESTIGATION REPORT PAGE 4-11
4.4 GROUNDWATER SAMPLING
The results for the single groundwater sample collected from boring E-SB-976 are shown in
Table 4-9. VOCs detected in soil samples were also detected in this shallow groundwater sample.
The VOCs 124-TCB, 1,2-dichlorobenzene, 1,3-dichlorobenzene, 1,4-dichlorobenzene (14-DCB),
chlorobenzene, tetrachloroethene, TCE, and trichlorofluoromethane were all detected in this
sample. Fluorodichloromethane was tentatively identified in the sample. Concentrations of
1,3-dichlorobenzene, tetrachloroethene, and TCE exceed Maryland groundwater standards in this
sample.
4.5 POLYCHLORINATED BIPHENYLS
Figure 4-6 presents the PCB results for all concrete and soil samples collected, including the
2012 results. In Figure 4-6, concentrations exceeding the PCB screening level of 1 mg/kg are
represented by yellow, purple, and red for the sample dots. The interior dot represents the result
for the sample collected at greater than or equal to (≥) 0–2 feet below grade, and the outer
concentric rings represent the results for progressively deeper intervals of ≥2–4 feet, ≥4–10 feet,
≥10–20 feet, and >20 feet, respectively. Figure 4-6 shows three main areas where PCB
concentrations in soil exceed the screening level of 1 mg/kg. These areas are (1) the eastern
storm-drain manholes and REC #3—the former 500,000-gallon aboveground storage tank (AST)
and associated tanks; (2) former milling/plating/finishing area and south–central former
transformer room; and (3) the former waste disposal area and southwestern former transformer
room. PCB sampling results for these three areas are discussed in the following sections.
4.5.1 Eastern Storm Drain Manholes and REC #3—Former 500,000-GallonAST and Associated Tanks
PCB exceedances were found in small clusters of samples in the area of two storm-drain
manholes and REC #3 (the former 500,000-gallon AST and associated tanks) (Figure 4-6). The
PCB exceedances are at soil borings SB-521 through SB-528, and SB-570 (adjacent to two
storm-drain manholes), and in the grass field in the area of the former 500,000-gallon fuel AST
and berm at soil borings SB-505, SB-555, SB-841, SB-844, SB-845, SB-888, SB-890, SB-893
through SB-897, SB-957, and SB-958. PCB exceedances in this area are limited to the first
four feet of soil. All surface-soil sampling locations with exceedances have a deeper soil sample
from the same location, indicating that PCB concentrations in deeper soils are less than the
7903 TETRA TECH • LOCKHEED MARTIN MIDDLE RIVER COMPLEX •2012 ADDITIONAL BLOCK E SOIL INVESTIGATION REPORT PAGE 4-12
screening criterion of 1 mg/kg (i.e., one or more green rings representing the sampling results
collected at ≥4–10 feet and/or ≥10–20 feet). Figure 4-6 shows that PCB concentrations for
subsurface soil samples at SB-837 and SB-570A are less than the screening level to depths of
30 feet.
4.5.2 Former Milling/Plating/Finishing Area and South–CentralFormer Transformer Room
PCB exceedances were identified in the south–central portion of former Building D in a
rectangular area that includes areas formerly used for milling, plating, and finishing operations
and a former electrical transformer room (Figure 4-6). The area also includes concrete aprons
south of these former operations that include soil borings SB-504, SB-558, SB-839, and SB-956.
This rectangular area, encompassed by soil borings SB-357, SB-364, SB-529, and SB-533, is the
area of the former plating and finishing departments and eastern portion of the former milling
department. SB-501 is in the area of a former electrical transformer room and substation. Two
sampling clusters in this area (samples SB-533 through SB536 and SB-567; SB-529 through
SB-532 and SB-568) are located around two storm-drain manholes currently at the site. Most
PCB exceedances in this area are limited to the first four feet of soil. However, PCB exceedances
were detected in soil 4–10 feet deep at SB-501, SB-502, SB-504, and SB-835 in this area.
4.5.3 Former Waste Disposal Area and Southwestern FormerTransformer Room
PCB exceedances were identified in the western and southwestern portion of Block E. The
exceedances range as far north and east as soil boring SB-353 and as far south and west as soil
boring SB-973. These borings are in the area of the former nuclear laboratory, former electrical
transformer room, and former waste disposal area. In this area, PCB-containing oil was observed
in samples collected from SB-833. SB-833 had a PCB concentration of 24,000 mg/kg, and other
high concentrations of PCBs were detected in samples near SB-833. The high PCB concentration
detected at E-SB-853 (19,000 mg/kg at 8–12 feet) in the area of the former transformer room
indicates that PCB dielectric fluid may have penetrated to a depth of 12 feet. This is supported by
the detection of dichlorobenzenes in prior sampling, and observations of oil and strong odors
during sampling. The high concentration of PCBs in the concrete samples from SB-833F,
SB-833F, and SB-833L also indicates that surface releases may be partially responsible for the
subsurface PCBs.
7903 TETRA TECH • LOCKHEED MARTIN MIDDLE RIVER COMPLEX •2012 ADDITIONAL BLOCK E SOIL INVESTIGATION REPORT PAGE 4-13
The results for soil boring E-SB-853 and E-SB-852 indicate that PCBs may extend to a depth of
30 feet below grade in the area of the former electrical transformer room at concentrations
exceeding the residential screening level of 1 mg/kg. However, results from surrounding deep soil
borings (i.e., excluding borings E-SB-853 and E-SB-854) indicate that concentrations above the
residential and industrial screening levels in deep soil are limited. Exceedances are only found in
soil samples collected at depths of 16 feet or less.
At SB-984, northeast of SB-853, PCBs exceed the residential screening level at varying depths
down to a maximum depth of 16 feet (10 mg/kg in the 14–16 foot sample). PCBs were
0.25 mg/kg or less in SB-984 samples collected from 16–28 feet, and were not detected in
samples collected deeper than 28 feet. As shown in Figures 4-9 and 4-14, PCBs at depth at
SB-852/853 have also been bounded to the east by SB-854 and SB-855 and to the west by
CB-11B. SB-852/853 have also been bounded to the south by SB-983 and SB-856, and to the
north by SB-849 and CB-11A and CB-13. These sampling results demonstrate that PCBs at
concentrations exceeding the residential and industrial screening criteria extend into the drainage
area south of the former Building D footprint. However, PCB concentrations associated with the
concrete slab and underlying soil south of this drainage area are less than the screening criterion,
based on previous soil results at SB-564, SB-559, and SB-560, and concrete sampling results at
SB-928, SB-867, SB-930, SB-869, SB-932, SB-923, and SB-922.
4.6 BENZO(A)PYRENE EQUIVALENTS
BaPEq results for all samples collected to date are shown in Figure 4-7. BaPEq concentrations
are plotted in Figure 4-7 using both residential and non-residential risk-based soil
screening-levels developed in the HHRA. The distribution of shallow BaPEq across the site is
similar to that of PCBs, except for the southwestern portion of Block E. Similar to PCBs at
Block E, BaPEq exceedances are found in shallow soil in several samples in the area of a storm
drain at REC #3 (the former 500,000-gallon AST and associated tanks) and in the grass area
adjacent to the 500,000-gallon water AST. BaPEq exceedances also occur in shallow soil beneath
the concrete slab in the area of the former plating and finishing departments and in the eastern
portion of the former milling department.
In many of the samples collected beneath the concrete slabs, PAHs used to calculate BaPEq were
not detected because the detection limits are greater than the residential level of 0.14 mg/kg, and,
7903 TETRA TECH • LOCKHEED MARTIN MIDDLE RIVER COMPLEX •2012 ADDITIONAL BLOCK E SOIL INVESTIGATION REPORT PAGE 4-14
in a few instances, greater than the industrial level of 2.9 mg/kg. These samples are shown as
white circles or circles with black hatching in Figure 4-7. BaPEq concentrations in several soil
samples collected in grass areas in the northern and southern peripheries of Building D exceed
the industrial level of 2.90 mg/kg. BaPEq infrequently exceeds the residential and industrial
screening levels in samples collected from beneath the concrete slabs in the former waste
disposal area and former transformer room. BaPEq exceedances in this area are limited to
shallow soil only.
4.7 TOTAL PETROLEUM HYDROCARBONS
TPH results for all samples collected to date are shown in Figure 4-8. TPH concentrations are
plotted using Maryland residential and non-residential soil cleanup standards. Exceedances of
TPH cleanup standards are limited mainly to samples collected (a) beneath the concrete slabs in
the southwestern portion of Block E at the former waste disposal area and former transformer
room (several SB-833-series samples and SB-984), (b) northeast of this area at SB-828,
(c) beneath the concrete slabs in the eastern portion of Block E (SB-905 and SB-906), (d) in
shallow soil at one location at the former 500,000-gallon fuel UST (SB-890), and (e) in shallow
soil at the southern end of the finishing department (SB-503).
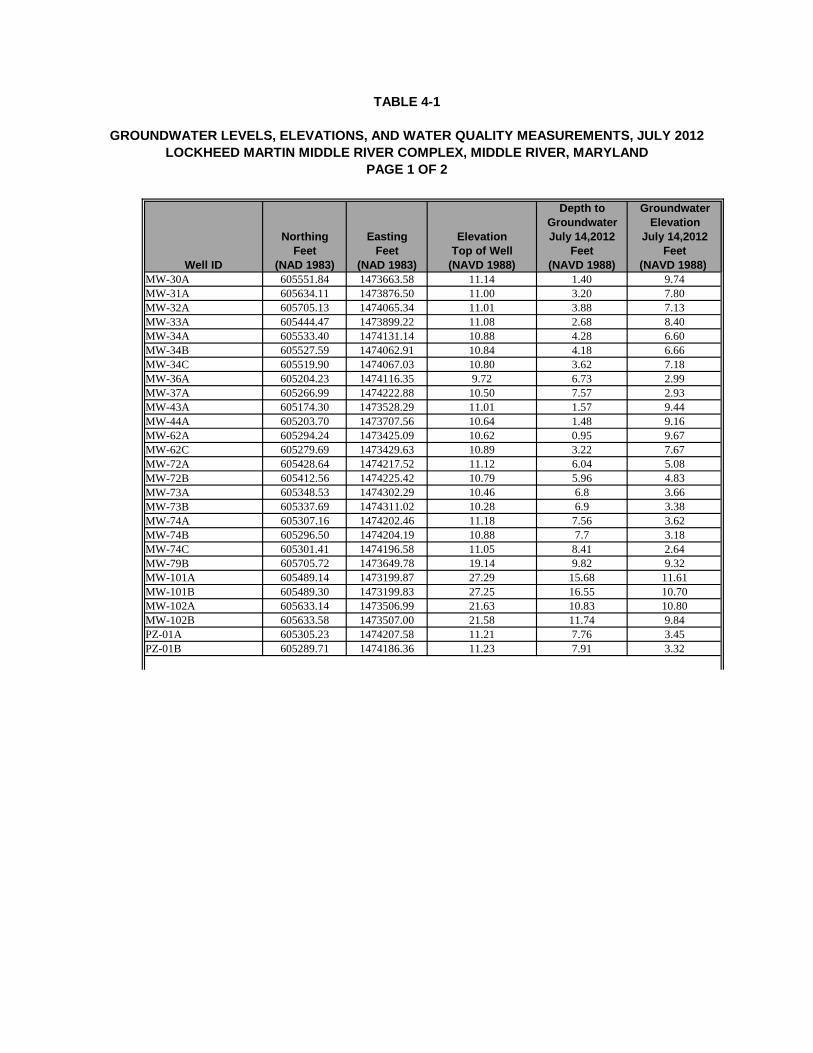
TABLE 4-1
GROUNDWATER LEVELS, ELEVATIONS, AND WATER QUALITY MEASUREMENTS, JULY 2012
LOCKHEED MARTIN MIDDLE RIVER COMPLEX, MIDDLE RIVER, MARYLAND
PAGE 1 OF 2
Depth to Groundwater
Groundwater Elevation
Northing Easting Elevation July 14,2012 July 14,2012
Feet Feet Top of Well Feet Feet
Well ID (NAD 1983) (NAD 1983) (NAVD 1988) (NAVD 1988) (NAVD 1988)
MW-30A 605551.84 1473663.58 11.14 1.40 9.74
MW-31A 605634.11 1473876.50 11.00 3.20 7.80
MW-32A 605705.13 1474065.34 11.01 3.88 7.13
MW-33A 605444.47 1473899.22 11.08 2.68 8.40
MW-34A 605533.40 1474131.14 10.88 4.28 6.60
MW-34B 605527.59 1474062.91 10.84 4.18 6.66
MW-34C 605519.90 1474067.03 10.80 3.62 7.18
MW-36A 605204.23 1474116.35 9.72 6.73 2.99
MW-37A 605266.99 1474222.88 10.50 7.57 2.93
MW-43A 605174.30 1473528.29 11.01 1.57 9.44
MW-44A 605203.70 1473707.56 10.64 1.48 9.16
MW-62A 605294.24 1473425.09 10.62 0.95 9.67
MW-62C 605279.69 1473429.63 10.89 3.22 7.67
MW-72A 605428.64 1474217.52 11.12 6.04 5.08
MW-72B 605412.56 1474225.42 10.79 5.96 4.83
MW-73A 605348.53 1474302.29 10.46 6.8 3.66
MW-73B 605337.69 1474311.02 10.28 6.9 3.38
MW-74A 605307.16 1474202.46 11.18 7.56 3.62
MW-74B 605296.50 1474204.19 10.88 7.7 3.18
MW-74C 605301.41 1474196.58 11.05 8.41 2.64
MW-79B 605705.72 1473649.78 19.14 9.82 9.32
MW-101A 605489.14 1473199.87 27.29 15.68 11.61
MW-101B 605489.30 1473199.83 27.25 16.55 10.70
MW-102A 605633.14 1473506.99 21.63 10.83 10.80
MW-102B 605633.58 1473507.00 21.58 11.74 9.84
PZ-01A 605305.23 1474207.58 11.21 7.76 3.45
PZ-01B 605289.71 1474186.36 11.23 7.91 3.32
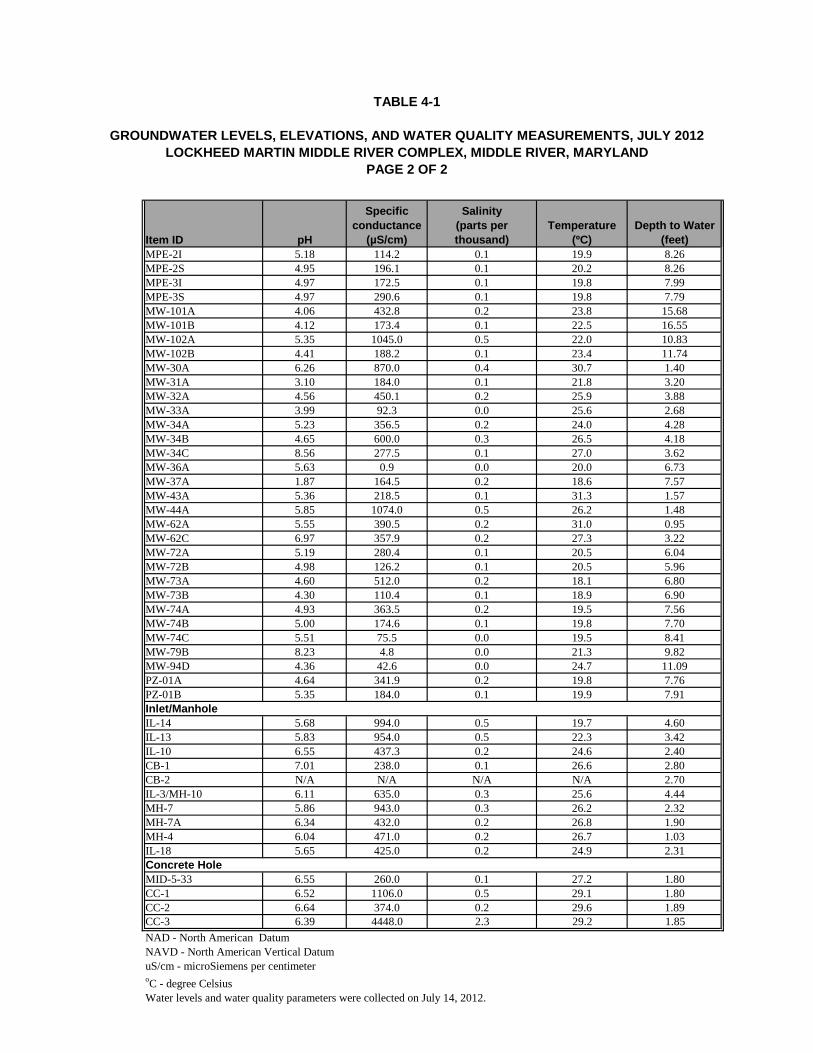
TABLE 4-1
GROUNDWATER LEVELS, ELEVATIONS, AND WATER QUALITY MEASUREMENTS, JULY 2012
LOCKHEED MARTIN MIDDLE RIVER COMPLEX, MIDDLE RIVER, MARYLAND
PAGE 2 OF 2
Item ID pH
Specific
conductance
(µS/cm)
Salinity
(parts per
thousand)
Temperature
(ºC)
Depth to Water
(feet)
MPE-2I 5.18 114.2 0.1 19.9 8.26
MPE-2S 4.95 196.1 0.1 20.2 8.26
MPE-3I 4.97 172.5 0.1 19.8 7.99
MPE-3S 4.97 290.6 0.1 19.8 7.79
MW-101A 4.06 432.8 0.2 23.8 15.68
MW-101B 4.12 173.4 0.1 22.5 16.55
MW-102A 5.35 1045.0 0.5 22.0 10.83
MW-102B 4.41 188.2 0.1 23.4 11.74
MW-30A 6.26 870.0 0.4 30.7 1.40
MW-31A 3.10 184.0 0.1 21.8 3.20
MW-32A 4.56 450.1 0.2 25.9 3.88
MW-33A 3.99 92.3 0.0 25.6 2.68
MW-34A 5.23 356.5 0.2 24.0 4.28
MW-34B 4.65 600.0 0.3 26.5 4.18
MW-34C 8.56 277.5 0.1 27.0 3.62
MW-36A 5.63 0.9 0.0 20.0 6.73
MW-37A 1.87 164.5 0.2 18.6 7.57
MW-43A 5.36 218.5 0.1 31.3 1.57
MW-44A 5.85 1074.0 0.5 26.2 1.48
MW-62A 5.55 390.5 0.2 31.0 0.95
MW-62C 6.97 357.9 0.2 27.3 3.22
MW-72A 5.19 280.4 0.1 20.5 6.04
MW-72B 4.98 126.2 0.1 20.5 5.96
MW-73A 4.60 512.0 0.2 18.1 6.80
MW-73B 4.30 110.4 0.1 18.9 6.90
MW-74A 4.93 363.5 0.2 19.5 7.56
MW-74B 5.00 174.6 0.1 19.8 7.70
MW-74C 5.51 75.5 0.0 19.5 8.41
MW-79B 8.23 4.8 0.0 21.3 9.82
MW-94D 4.36 42.6 0.0 24.7 11.09
PZ-01A 4.64 341.9 0.2 19.8 7.76
PZ-01B 5.35 184.0 0.1 19.9 7.91
IL-14 5.68 994.0 0.5 19.7 4.60
IL-13 5.83 954.0 0.5 22.3 3.42
IL-10 6.55 437.3 0.2 24.6 2.40
CB-1 7.01 238.0 0.1 26.6 2.80
CB-2 N/A N/A N/A N/A 2.70
IL-3/MH-10 6.11 635.0 0.3 25.6 4.44
MH-7 5.86 943.0 0.3 26.2 2.32
MH-7A 6.34 432.0 0.2 26.8 1.90
MH-4 6.04 471.0 0.2 26.7 1.03
IL-18 5.65 425.0 0.2 24.9 2.31
MID-5-33 6.55 260.0 0.1 27.2 1.80
CC-1 6.52 1106.0 0.5 29.1 1.80
CC-2 6.64 374.0 0.2 29.6 1.89CC-3 6.39 4448.0 2.3 29.2 1.85
NAD - North American Datum
NAVD - North American Vertical Datum
uS/cm - microSiemens per centimeteroC - degree Celsius
Water levels and water quality parameters were collected on July 14, 2012.
Inlet/Manhole
Concrete Hole

TABLE 4-2
STATISTICAL SUMMARY OF BLOCK E CONCRETE PCB ANALYSES, JUNE-JULY 2012
LOCKHEED MARTIN MIDDLE RIVER COMPLEX, MIDDLE RIVER, MARYLAND
Frequency Mininum Maximum Mininum Maximum Sample of Mean of Mean of Standard
Chemical of Detection Non Non Detected Detected Maximum All Positive Deviation
Number Percent Detected Detected Detected Samples Detects
Polychlorinated Biphenyls (mg/kg)
TOTAL AROCLOR 23/40 58 0.013 1.1 0.021 12 E-SB-947-CS-0-0.25 0.543 0.945 2.079
AROCLOR-1260 23/40 58 0.017 0.09 0.021 J 12 E-SB-947-CS-0-0.25 0.545 0.939 2.078
AROCLOR-1248 1/40 3 0.017 0.87 0.13 0.13 E-SB-948-CS-0-0.25 0.028
AROCLOR-1016 0/40 0 0.021 1.1 0.031
AROCLOR-1221 0/40 0 0.016 0.82 0.024
AROCLOR-1232 0/40 0 0.014 0.72 0.021
AROCLOR-1242 0/40 0 0.013 0.67 0.019
AROCLOR-1254 0/40 0 0.017 0.87 0.025
Footnotes:
For non-detects, 1/2 sample quantitation limit was used as a proxy concentration.
1/2 the detection limit was used for B qualified data.
J - estimated concentration
mg/kg - milligrams per kilogram
CS - concrete sample
Associated Samples
E-SB-921-CS-0-0.25 E-SB-931-CS-0-0.33 E-SB-941-CS-0-0.25 E-SB-951-CS-0-0.33
E-SB-922-CS-0-0.33 E-SB-932-CS-0-0.25 E-SB-942-CS-0-0.33 E-SB-952-CS-0-0.33E-SB-923-CS-0-0.33 E-SB-933-CS-0-0.42 E-SB-943-CS-0-0.25 E-SB-953-CS-0-0.42E-SB-924-CS-0-0.25 E-SB-934-CS-0-0.42 E-SB-944-CS-0-0.5 E-SB-954-CS-0-0.25E-SB-925-CS-0-0.25 E-SB-935-CS-0-0.33 E-SB-945-CS-0-0.5 E-SB-961-CS-0-0.5E-SB-926-CS-0-0.42 E-SB-936-CS-0-0.25 E-SB-946-CS-0-0.33 E-SB-962-CS-0-0.42E-SB-927-CS-0-0.25 E-SB-937-CS-0-0.25 E-SB-947-CS-0-0.25 E-SB-963-CS-0-0.5E-SB-928-CS-0-0.33 E-SB-938-CS-0-0.17 E-SB-948-CS-0-0.25 E-SB-969-CS-0-0.5E-SB-929-CS-0-0.33 E-SB-939-CS-0-0.33 E-SB-949-CS-0-0.5 E-SB-970-CS-0-0.5E-SB-930-CS-0-0.42 E-SB-940-CS-0-0.33 E-SB-950-CS-0-0.5 E-SB-971-CS-0-0.5
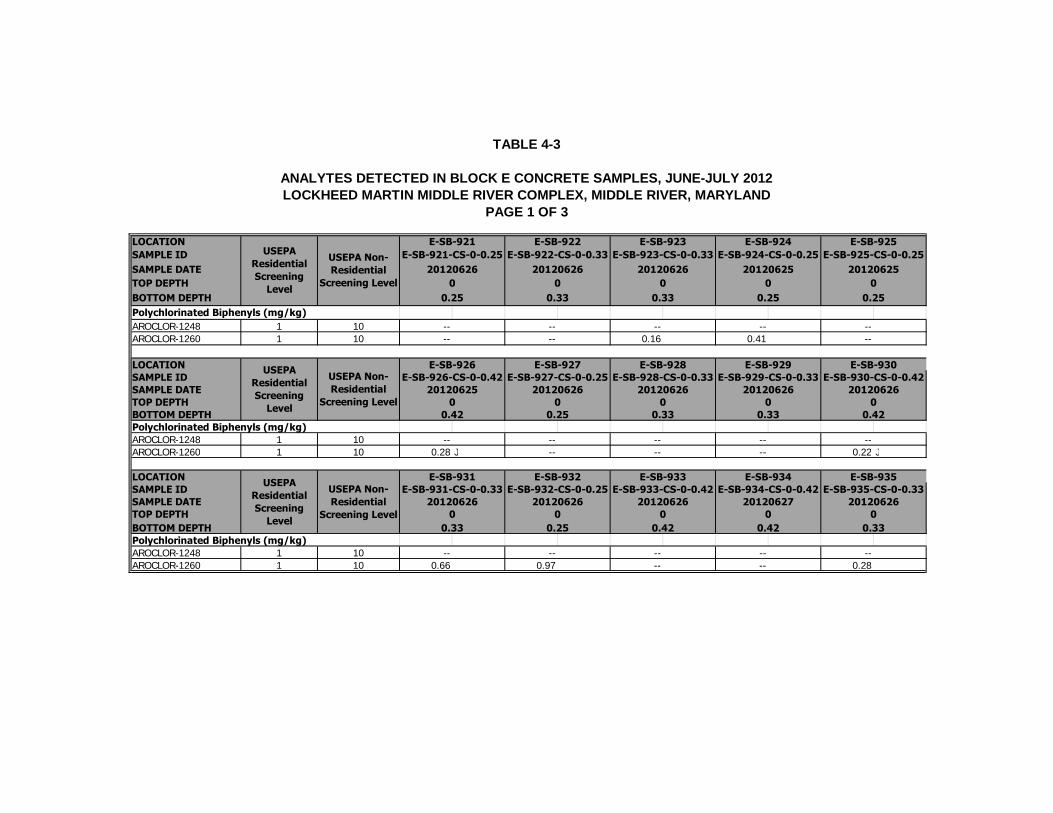
TABLE 4-3
ANALYTES DETECTED IN BLOCK E CONCRETE SAMPLES, JUNE-JULY 2012
LOCKHEED MARTIN MIDDLE RIVER COMPLEX, MIDDLE RIVER, MARYLAND
PAGE 1 OF 3
LOCATION
SAMPLE ID
SAMPLE DATE
TOP DEPTH
BOTTOM DEPTH
AROCLOR-1248 1 10 -- -- -- -- --
AROCLOR-1260 1 10 -- -- 0.16 0.41 --
LOCATION
SAMPLE ID
SAMPLE DATE
TOP DEPTH
BOTTOM DEPTH
AROCLOR-1248 1 10 -- -- -- -- --
AROCLOR-1260 1 10 0.28 J -- -- -- 0.22 J
LOCATION
SAMPLE ID
SAMPLE DATE
TOP DEPTH
BOTTOM DEPTH
AROCLOR-1248 1 10 -- -- -- -- --
AROCLOR-1260 1 10 0.66 0.97 -- -- 0.28
20120626 20120626 20120626 20120625 20120625
Polychlorinated Biphenyls (mg/kg)
E-SB-921 E-SB-922 E-SB-923 E-SB-924 E-SB-925
E-SB-921-CS-0-0.25 E-SB-922-CS-0-0.33 E-SB-923-CS-0-0.33 E-SB-924-CS-0-0.25 E-SB-925-CS-0-0.25
0 0 0 0 0
0.25 0.33 0.33 0.25 0.25
E-SB-930
E-SB-930-CS-0-0.42
E-SB-926 E-SB-927 E-SB-928 E-SB-929
E-SB-926-CS-0-0.42 E-SB-927-CS-0-0.25 E-SB-928-CS-0-0.33 E-SB-929-CS-0-0.33
20120626 20120626
0 0 0 0 0
20120625 20120626 20120626
0.42 0.25 0.33 0.33 0.42
E-SB-931 E-SB-932 E-SB-933 E-SB-934 E-SB-935
E-SB-931-CS-0-0.33 E-SB-932-CS-0-0.25 E-SB-933-CS-0-0.42 E-SB-934-CS-0-0.42 E-SB-935-CS-0-0.33
20120626 20120626 20120626 20120627 20120626
0 0 0 0 0
0.33 0.25 0.42 0.42 0.33
USEPA
Residential
Screening
Level
USEPA Non-
Residential
Screening Level
USEPA
Residential
Screening
Level
USEPA Non-
Residential
Screening Level
USEPA
Residential
Screening
Level
USEPA Non-
Residential
Screening Level
Polychlorinated Biphenyls (mg/kg)
Polychlorinated Biphenyls (mg/kg)

TABLE 4-3
ANALYTES DETECTED IN BLOCK E CONCRETE SAMPLES, JUNE-JULY 2012
LOCKHEED MARTIN MIDDLE RIVER COMPLEX, MIDDLE RIVER, MARYLAND
PAGE 2 OF 3
LOCATION
SAMPLE ID
SAMPLE DATE
TOP DEPTH
BOTTOM DEPTH
AROCLOR-1248 1 10
AROCLOR-1260 1 10
LOCATION
SAMPLE ID
SAMPLE DATE
TOP DEPTH
BOTTOM DEPTH
AROCLOR-1248 1 10
AROCLOR-1260 1 10
LOCATION
SAMPLE ID
SAMPLE DATE
TOP DEPTH
BOTTOM DEPTH
AROCLOR-1248 1 10
AROCLOR-1260 1 10
Polychlorinated Biphenyls (mg/kg)
USEPA
Residential
Screening
Level
USEPA Non-
Residential
Screening Level
USEPA
Residential
Screening
Level
USEPA Non-
Residential
Screening Level
USEPA
Residential
Screening
Level
USEPA Non-
Residential
Screening Level
Polychlorinated Biphenyls (mg/kg)
Polychlorinated Biphenyls (mg/kg)
-- -- -- -- --
0.023 J 0.025 J 1.2 0.23 J 0.14
-- -- -- -- --
0.052 5.8 0.13 -- 0.028 J
-- -- 0.13 -- --
-- 12 0.22 -- --
E-SB-940E-SB-936 E-SB-937 E-SB-938 E-SB-939
E-SB-938-CS-0-0.17 E-SB-939-CS-0-0.33 E-SB-940-CS-0-0.33E-SB-936-CS-0-0.25 E-SB-937-CS-0-0.25
2012062620120626 20120625 20120625 20120626
0 0 0 0 0
0.25 0.25 0.17 0.33 0.33
E-SB-941 E-SB-942 E-SB-943 E-SB-944 E-SB-945
E-SB-941-CS-0-0.25 E-SB-942-CS-0-0.33 E-SB-943-CS-0-0.25 E-SB-944-CS-0-0.5 E-SB-945-CS-0-0.5
20120625 20120625 20120626 20120627 20120628
0 0 0 0 0
0.25 0.33 0.25 0.5 0.5
E-SB-946 E-SB-947 E-SB-948 E-SB-949 E-SB-950
E-SB-946-CS-0-0.33 E-SB-947-CS-0-0.25 E-SB-948-CS-0-0.25 E-SB-949-CS-0-0.5 E-SB-950-CS-0-0.5
20120626 20120626 20120625 20120627 20120627
0 0 0 0
0.33 0.25 0.25 0.5 0.5
0
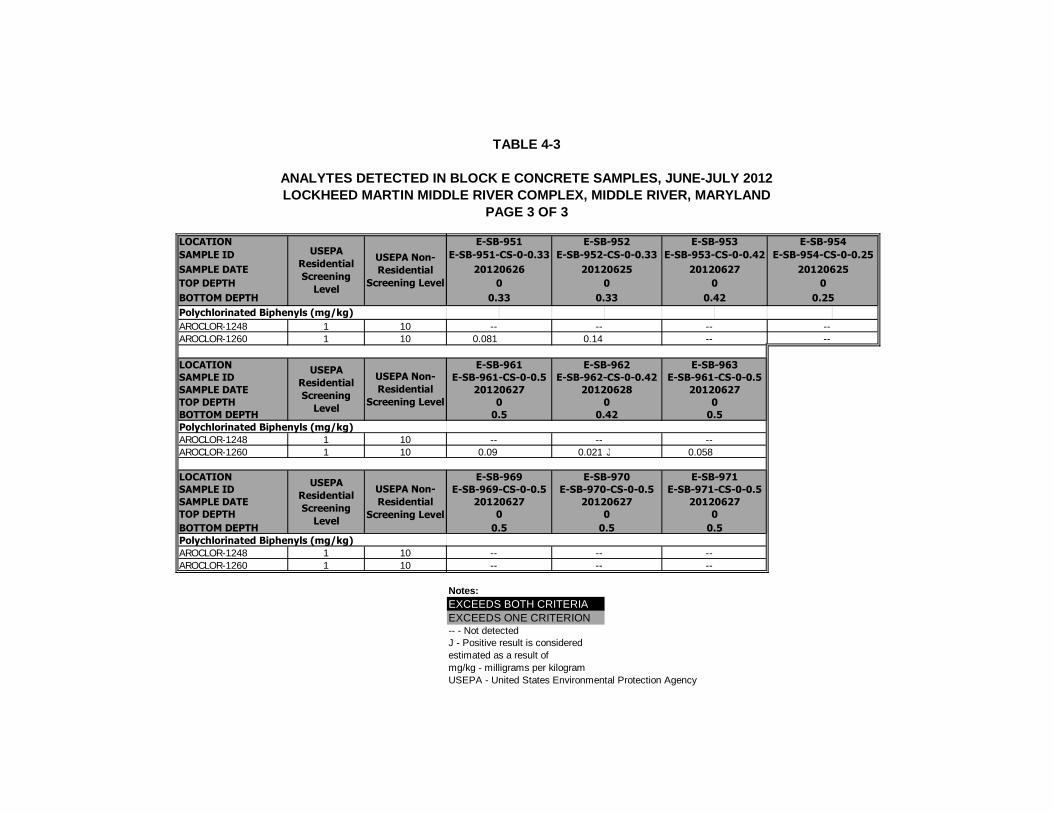
TABLE 4-3
ANALYTES DETECTED IN BLOCK E CONCRETE SAMPLES, JUNE-JULY 2012
LOCKHEED MARTIN MIDDLE RIVER COMPLEX, MIDDLE RIVER, MARYLAND
PAGE 3 OF 3
LOCATION
SAMPLE ID
SAMPLE DATE
TOP DEPTH
BOTTOM DEPTH
AROCLOR-1248 1 10
AROCLOR-1260 1 10
LOCATION
SAMPLE ID
SAMPLE DATE
TOP DEPTH
BOTTOM DEPTH
AROCLOR-1248 1 10
AROCLOR-1260 1 10
LOCATION
SAMPLE ID
SAMPLE DATE
TOP DEPTH
BOTTOM DEPTH
AROCLOR-1248 1 10
AROCLOR-1260 1 10
Polychlorinated Biphenyls (mg/kg)
USEPA
Residential
Screening
Level
USEPA Non-
Residential
Screening Level
USEPA
Residential
Screening
Level
USEPA Non-
Residential
Screening Level
USEPA
Residential
Screening
Level
USEPA Non-
Residential
Screening Level
Polychlorinated Biphenyls (mg/kg)
Polychlorinated Biphenyls (mg/kg)
-- -- -- --
0.081 0.14 -- --
-- -- --
0.09 0.021 J 0.058
-- -- --
-- -- --
Notes:
EXCEEDS BOTH CRITERIA
EXCEEDS ONE CRITERION-- - Not detected
mg/kg - milligrams per kilogram
USEPA - United States Environmental Protection Agency
20120628
0
0.42
E-SB-962
E-SB-962-CS-0-0.42
E-SB-951 E-SB-952 E-SB-953 E-SB-954
E-SB-952-CS-0-0.33 E-SB-953-CS-0-0.42 E-SB-954-CS-0-0.25E-SB-951-CS-0-0.33
20120625 20120627 2012062520120626
0 0 00
0.33 0.42 0.250.33
E-SB-961
E-SB-961-CS-0-0.5
20120627
0
0.5
E-SB-963
E-SB-961-CS-0-0.5
20120627
0
0.5
0
0.5
E-SB-970
E-SB-970-CS-0-0.5
20120627
0
0.5
E-SB-971
E-SB-971-CS-0-0.5
20120627
0
0.5
E-SB-969
E-SB-969-CS-0-0.5
20120627
J - Positive result is considered
estimated as a result of
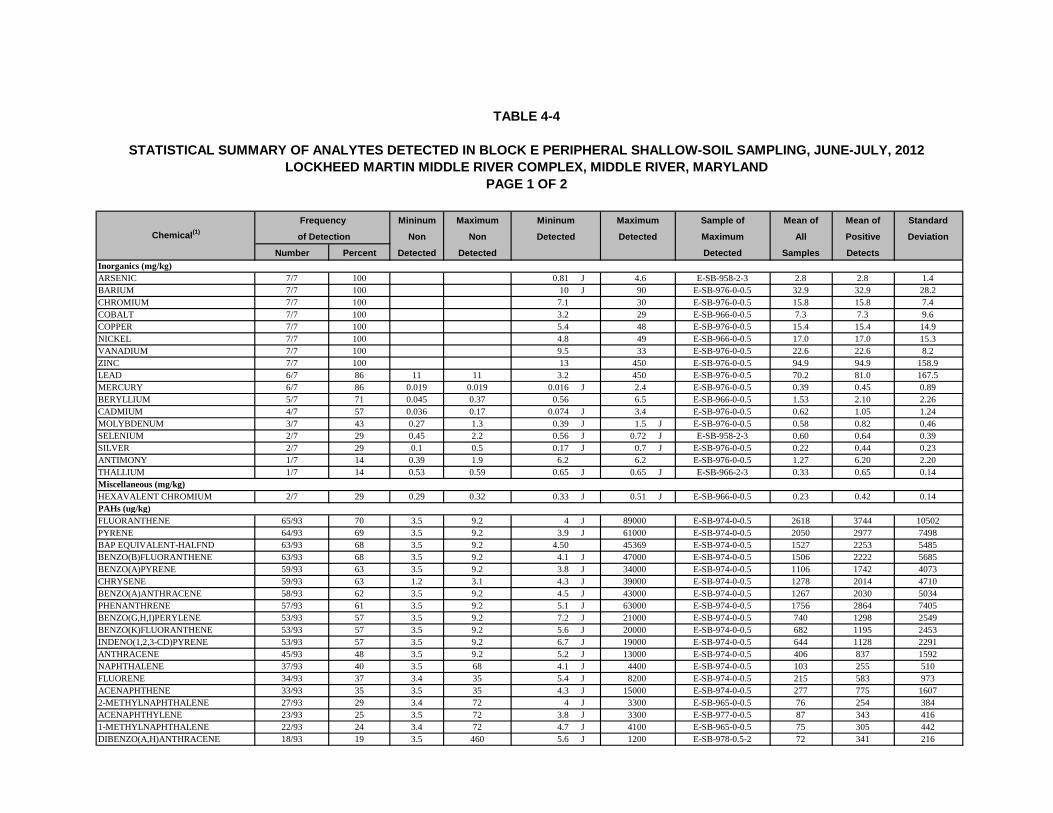
TABLE 4-4
STATISTICAL SUMMARY OF ANALYTES DETECTED IN BLOCK E PERIPHERAL SHALLOW-SOIL SAMPLING, JUNE-JULY, 2012
LOCKHEED MARTIN MIDDLE RIVER COMPLEX, MIDDLE RIVER, MARYLAND
PAGE 1 OF 2
Frequency Mininum Maximum Mininum Maximum Sample of Mean of Mean of Standard
Chemical(1)of Detection Non Non Detected Detected Maximum All Positive Deviation
Number Percent Detected Detected Detected Samples Detects
Inorganics (mg/kg)
ARSENIC 7/7 100 0.81 J 4.6 E-SB-958-2-3 2.8 2.8 1.4
BARIUM 7/7 100 10 J 90 E-SB-976-0-0.5 32.9 32.9 28.2
CHROMIUM 7/7 100 7.1 30 E-SB-976-0-0.5 15.8 15.8 7.4
COBALT 7/7 100 3.2 29 E-SB-966-0-0.5 7.3 7.3 9.6
COPPER 7/7 100 5.4 48 E-SB-976-0-0.5 15.4 15.4 14.9
NICKEL 7/7 100 4.8 49 E-SB-966-0-0.5 17.0 17.0 15.3
VANADIUM 7/7 100 9.5 33 E-SB-976-0-0.5 22.6 22.6 8.2
ZINC 7/7 100 13 450 E-SB-976-0-0.5 94.9 94.9 158.9
LEAD 6/7 86 11 11 3.2 450 E-SB-976-0-0.5 70.2 81.0 167.5
MERCURY 6/7 86 0.019 0.019 0.016 J 2.4 E-SB-976-0-0.5 0.39 0.45 0.89
BERYLLIUM 5/7 71 0.045 0.37 0.56 6.5 E-SB-966-0-0.5 1.53 2.10 2.26
CADMIUM 4/7 57 0.036 0.17 0.074 J 3.4 E-SB-976-0-0.5 0.62 1.05 1.24
MOLYBDENUM 3/7 43 0.27 1.3 0.39 J 1.5 J E-SB-976-0-0.5 0.58 0.82 0.46
SELENIUM 2/7 29 0.45 2.2 0.56 J 0.72 J E-SB-958-2-3 0.60 0.64 0.39
SILVER 2/7 29 0.1 0.5 0.17 J 0.7 J E-SB-976-0-0.5 0.22 0.44 0.23
ANTIMONY 1/7 14 0.39 1.9 6.2 6.2 E-SB-976-0-0.5 1.27 6.20 2.20
THALLIUM 1/7 14 0.53 0.59 0.65 J 0.65 J E-SB-966-2-3 0.33 0.65 0.14
Miscellaneous (mg/kg)
HEXAVALENT CHROMIUM 2/7 29 0.29 0.32 0.33 J 0.51 J E-SB-966-0-0.5 0.23 0.42 0.14
PAHs (ug/kg)
FLUORANTHENE 65/93 70 3.5 9.2 4 J 89000 E-SB-974-0-0.5 2618 3744 10502
PYRENE 64/93 69 3.5 9.2 3.9 J 61000 E-SB-974-0-0.5 2050 2977 7498
BAP EQUIVALENT-HALFND 63/93 68 3.5 9.2 4.50 45369 E-SB-974-0-0.5 1527 2253 5485
BENZO(B)FLUORANTHENE 63/93 68 3.5 9.2 4.1 J 47000 E-SB-974-0-0.5 1506 2222 5685
BENZO(A)PYRENE 59/93 63 3.5 9.2 3.8 J 34000 E-SB-974-0-0.5 1106 1742 4073
CHRYSENE 59/93 63 1.2 3.1 4.3 J 39000 E-SB-974-0-0.5 1278 2014 4710
BENZO(A)ANTHRACENE 58/93 62 3.5 9.2 4.5 J 43000 E-SB-974-0-0.5 1267 2030 5034
PHENANTHRENE 57/93 61 3.5 9.2 5.1 J 63000 E-SB-974-0-0.5 1756 2864 7405
BENZO(G,H,I)PERYLENE 53/93 57 3.5 9.2 7.2 J 21000 E-SB-974-0-0.5 740 1298 2549
BENZO(K)FLUORANTHENE 53/93 57 3.5 9.2 5.6 J 20000 E-SB-974-0-0.5 682 1195 2453
INDENO(1,2,3-CD)PYRENE 53/93 57 3.5 9.2 6.7 J 19000 E-SB-974-0-0.5 644 1128 2291
ANTHRACENE 45/93 48 3.5 9.2 5.2 J 13000 E-SB-974-0-0.5 406 837 1592
NAPHTHALENE 37/93 40 3.5 68 4.1 J 4400 E-SB-974-0-0.5 103 255 510
FLUORENE 34/93 37 3.4 35 5.4 J 8200 E-SB-974-0-0.5 215 583 973
ACENAPHTHENE 33/93 35 3.5 35 4.3 J 15000 E-SB-974-0-0.5 277 775 1607
2-METHYLNAPHTHALENE 27/93 29 3.4 72 4 J 3300 E-SB-965-0-0.5 76 254 384
ACENAPHTHYLENE 23/93 25 3.5 72 3.8 J 3300 E-SB-977-0-0.5 87 343 416
1-METHYLNAPHTHALENE 22/93 24 3.4 72 4.7 J 4100 E-SB-965-0-0.5 75 305 442
DIBENZO(A,H)ANTHRACENE 18/93 19 3.5 460 5.6 J 1200 E-SB-978-0.5-2 72 341 216

TABLE 4-4
STATISTICAL SUMMARY OF ANALYTES DETECTED IN BLOCK E PERIPHERAL SHALLOW-SOIL SAMPLING, JUNE-JULY, 2012
LOCKHEED MARTIN MIDDLE RIVER COMPLEX, MIDDLE RIVER, MARYLAND
PAGE 2 OF 2
Frequency Mininum Maximum Mininum Maximum Sample of Mean of Mean of Standard
Chemical(1)of Detection Non Non Detected Detected Maximum All Positive Deviation
Number Percent Detected Detected Detected Samples Detects
PCBs (mg/kg)
AROCLOR-1260 47/85 55 17 0.09 0.021 J 800 E-SB-980-0-0.5 26.6 48.4 117
AROCLOR-1242 1/85 1 13 27 0.02 J 0.020 J E-SB-977-2-3 0.647 0.020 2.2
AROCLOR-1248 1/85 1 17 36 39 39 E-SB-978-0-0.5 1.230 39 4.9
1 Chemicals not detected in any of the samples are not shown on this table.J = Positive result estimated due to quality control noncompliance.mg/kg - milligrams per kilogram
ug/kg - micrograms per kilogram
For non-detects, 1/2 sample quantitation limit was used as a proxy concentration.
1/2 the detection limit was used for B qualified data.
Associated Samples
E-SB-955-0-0.5 20120629 S-SB-963-2-2.5 20120627 E-SB-973-0-0.5 20120629 E-SB-980-0-0.5 20120628
E-SB-955-0.5-2 20120629 S-SB-964-0-0.5 20120627 E-SB-973-0.5-2 20120629 E-SB-980-0.5-2 20120628
E-SB-955-2-3 20120629 S-SB-964-0.5-2 20120627 E-SB-973-2-3 20120629 E-SB-980-2-3 20120628
E-SB-955-3-4 20120629 S-SB-964-2-3 20120627 E-SB-973-3-4 20120629 E-SB-980-3-4 20120628
E-SB-956-0-0.5 20120628 S-SB-964-3-4 20120627 E-SB-974-0-0.5 20120629 E-SB-981-0-0.5 20120628
E-SB-956-0.5-2 20120628 E-SB-965-0-0.5 20120627 E-SB-974-0.5-2 20120629 E-SB-981-0.5-2 20120628
E-SB-956-2-3 20120628 S-SB-965-2-3 20120627 E-SB-974-2-3 20120629 E-SB-981-2-3 20120628
E-SB-956-3-4 20120628 E-SB-965-0.5-2 20120627 E-SB-974-3-4 20120629 E-SB-981-3-3.5 20120628
E-SB-957-0-0.5 20120628 E-SB-966-0-0.5 20120627 E-SB-975-0-0.5 20120629 E-SB-982-0-0.5 20120628
E-SB-957-0.5-2 20120628 E-SB-966-0.5-2 20120627 E-SB-975-0.5-2 20120629 E-SB-982-0.5-2 20120628
E-SB-957-2-3 20120628 E-SB-966-2-3 20120627 E-SB-975-2-3 20120629 E-SB-982-2-3 20120628
E-SB-957-3-4 20120628 E-SB-967-0-0.5 20120627 E-SB-975-3-4 20120629 E-SB-982-3-4 20120628
E-SB-958-0-0.5 20120628 E-SB-967-0.5-2 20120627 E-SB-976-0-0.5 20120629
E-SB-958-0.5-2 20120628 E-SB-968-0-0.5 20120627 E-SB-976-0.5-2 20120629
E-SB-958-2-3 20120628 E-SB-968-0.5-2 20120627 E-SB-976-2-3 20120629
E-SB-958-3-4 20120628 E-SB-968-2-3 20120627 E-SB-976-3-4 20120629
E-SB-959-0-0.5 20120628 E-SB-968-3-4 20120627 E-SB-977-0-0.5 20120629
E-SB-959-0.5-2 20120628 E-SB-969-0.5-2 20120627 E-SB-977-0.5-2 20120629
E-SB-959-2-3 20120628 E-SB-969-2-3 20120627 E-SB-977-2-3 20120629
E-SB-959-3-4 20120628 E-SB-970-0.5-2 20120627 E-SB-977-3-4 20120629
E-SB-960-1-2 20120628 E-SB-970-2-3 20120627 E-SB-978-0-0.5 20120629
E-SB-960-2-3.5 20120628 E-SB-971-0.5-2 20120627 E-SB-978-0.5-2 20120629
E-SB-961-1-2 20120628 E-SB-971-2-3 20120627 E-SB-978-2-2.5 20120629
E-SB-961-2-3 20120628 E-SB-972-0-0.5 20120629 E-SB-979-0-0.5 20120628
E-SB-962-1-2 20120628 E-SB-972-0.5-2 20120629 E-SB-979-0.5-2 20120628
E-SB-962-2-3 20120628 E-SB-972-2-3 20120629 E-SB-979-2-3 20120628
S-SB-963-0.5-2 20120627 E-SB-972-3-4 20120629 E-SB-979-3-4 20120628

TABLE 4-5
ANALYTES DETECTED IN BLOCK E PERIPHERAL SHALLOW SOIL-SAMPLES, JUNE-JULY 2012
LOCKHEED MARTIN MIDDLE RIVER COMPLEX, MIDDLE RIVER, MARYLAND
PAGE 1 OF 14
SAMPLE ID Non-
SAMPLE DATE Residential Residential
TOP DEPTH (FEET BELOW GRADE) Screening Screening
BOTTOM DEPTH (FEET BELOW GRADE) Levels Levels
METALS (MG/KG)
ANTIMONY 3.1 41 NA NA NA NA NA NA NA
ARSENIC 12(1) 12(1) NA NA NA NA NA NA NA
BARIUM 1600 20000 NA NA NA NA NA NA NA
BERYLLIUM 16 200 NA NA NA NA NA NA NA
CADMIUM 3.9 51 NA NA NA NA NA NA NA
CHROMIUM 23 310 NA NA NA NA NA NA NA
COBALT NA NA NA NA NA NA NA NA NA
COPPER 310 4100 NA NA NA NA NA NA NA
LEAD 400 1000 NA NA NA NA NA NA NA
MERCURY 2.3 31 NA NA NA NA NA NA NA
MOLYBDENUM NA NA NA NA NA NA NA NA NA
NICKEL 160 2000 NA NA NA NA NA NA NA
SELENIUM 39 510 NA NA NA NA NA NA NA
SILVER 39 510 NA NA NA NA NA NA NA
THALLIUM 0.55 7.2 NA NA NA NA NA NA NA
VANADIUM 91(1) 91(1) NA NA NA NA NA NA NA
ZINC 2300 31000 NA NA NA NA NA NA NA
HEXAVALENT CHROMIUM 23 310 NA NA NA NA NA NA NA
PCBS (UG/KG)AROCLOR-1242 1000 10000 -- -- -- -- -- -- --AROCLOR-1248 1000 10000 -- -- -- -- -- -- --AROCLOR-1260 1000 10000 7100 540 -- -- 22000 130 29 J
1-METHYLNAPHTHALENE NA NA 11 -- -- -- 37 -- --2-METHYLNAPHTHALENE NA NA 12 -- -- -- 48 -- 7.9
ACENAPHTHENE 470000 6100000 48 8.9 -- -- 280 -- 18
ACENAPHTHYLENE 470000 6100000 25 -- -- -- -- -- --
ANTHRACENE 2300000 31000000 97 14 -- -- 520 7.9 8.4 L
BAP EQUIVALENT-HALFND 140 2900 754.94 76.195 -- -- 1212.7 29.122 27.165
BENZO(A)ANTHRACENE 220 3900 510 J 62 -- -- 950 20 21 L
BENZO(A)PYRENE 22 390 490 56 -- -- 830 21 19
BENZO(B)FLUORANTHENE 220 3900 820 83 -- -- 1000 29 26
BENZO(G,H,I)PERYLENE 230000 3100000 350 40 -- -- 470 14 16
BENZO(K)FLUORANTHENE 2200 39000 440 38 -- -- 560 10 14
CHRYSENE 22000 390000 540 J 65 -- -- 1100 22 25 L
DIBENZO(A,H)ANTHRACENE 22 390 95 -- -- -- 130 -- --
FLUORANTHENE 310000 4100000 1100 120 -- -- 2200 34 45 L
FLUORENE 310000 4100000 41 8.8 -- -- 250 -- 18
INDENO(1,2,3-CD)PYRENE 220 3900 320 35 -- -- 510 12 14
NAPHTHALENE 160000 2000000 16 4.1 J -- -- 63 -- 37
PHENANTHRENE 2300000 31000000 560 73 -- -- 2000 30 53 L
PYRENE 230000 3100000 800 J 95 -- -- 1600 30 35 L
POLYCYCLIC AROMATIC HYDROCARBONS (UG/KG)
MISCELLANEOUS PARAMETERS (MG/KG)
E-SB-956-2-3E-SB-955-0.5-2E-SB-955-0-0.5 E-SB-955-2-3 E-SB-955-3-4 E-SB-956-0.5-2E-SB-956-0-0.5
2012062920120629 20120629 20120629 2012062820120628 20120628
20.50 2 3 0.50
320.5 3 4 20.5

TABLE 4-5
ANALYTES DETECTED IN BLOCK E PERIPHERAL SHALLOW SOIL-SAMPLES, JUNE-JULY 2012
LOCKHEED MARTIN MIDDLE RIVER COMPLEX, MIDDLE RIVER, MARYLAND
PAGE 2 OF 14
SAMPLE ID Non-
SAMPLE DATE Residential Residential
TOP DEPTH (FEET BELOW GRADE) Screening Screening
BOTTOM DEPTH (FEET BELOW GRADE) Levels Levels
METALS (MG/KG)
ANTIMONY 3.1 41
ARSENIC 12(1) 12(1)
BARIUM 1600 20000
BERYLLIUM 16 200
CADMIUM 3.9 51
CHROMIUM 23 310COBALT NA NA
COPPER 310 4100
LEAD 400 1000
MERCURY 2.3 31MOLYBDENUM NA NA
NICKEL 160 2000
SELENIUM 39 510
SILVER 39 510
THALLIUM 0.55 7.2
VANADIUM 91(1) 91(1)
ZINC 2300 31000
HEXAVALENT CHROMIUM 23 310PCBS (UG/KG)AROCLOR-1242 1000 10000AROCLOR-1248 1000 10000AROCLOR-1260 1000 10000
1-METHYLNAPHTHALENE NA NA2-METHYLNAPHTHALENE NA NA
ACENAPHTHENE 470000 6100000
ACENAPHTHYLENE 470000 6100000
ANTHRACENE 2300000 31000000BAP EQUIVALENT-HALFND 140 2900
BENZO(A)ANTHRACENE 220 3900
BENZO(A)PYRENE 22 390
BENZO(B)FLUORANTHENE 220 3900
BENZO(G,H,I)PERYLENE 230000 3100000
BENZO(K)FLUORANTHENE 2200 39000
CHRYSENE 22000 390000
DIBENZO(A,H)ANTHRACENE 22 390
FLUORANTHENE 310000 4100000
FLUORENE 310000 4100000
INDENO(1,2,3-CD)PYRENE 220 3900
NAPHTHALENE 160000 2000000
PHENANTHRENE 2300000 31000000
PYRENE 230000 3100000
POLYCYCLIC AROMATIC HYDROCARBONS (UG/KG)
MISCELLANEOUS PARAMETERS (MG/KG)
NA NA NA NA NA NA NA
NA NA NA NA NA NA NA
NA NA NA NA NA NA NA
NA NA NA NA NA NA NA
NA NA NA NA NA NA NA
NA NA NA NA NA NA NA
NA NA NA NA NA NA NANA NA NA NA NA NA NA
NA NA NA NA NA NA NA
NA NA NA NA NA NA NA
NA NA NA NA NA NA NANA NA NA NA NA NA NA
NA NA NA NA NA NA NA
NA NA NA NA NA NA NA
NA NA NA NA NA NA NA
NA NA NA NA NA NA NA
NA NA NA NA NA NA NA
NA NA NA NA NA NA NA
-- -- -- -- -- -- ---- -- -- -- -- -- ---- 39000 2200 320 23 J 15000 22000
8.4 49 -- -- -- -- --15 63 -- -- -- -- --7.7 170 -- -- -- -- --
-- 90 -- -- -- -- --
8 L 390 -- -- -- -- --
29.63 3466.9 34.96 10.8476 -- 46.522 38.41626 L 2300 24 -- -- 28 22
20 2400 26 7.5 -- 34 28
34 3400 30 11 -- 51 39
18 1800 19 -- -- 26 27
15 1400 18 -- -- 23 23
30 L 2900 30 9.1 L -- 42 36
-- 330 -- -- -- -- --
42 L 4900 46 12 L -- 51 45
8.4 150 -- -- -- -- --
16 1500 15 -- -- 26 23
17 110 -- -- -- -- 7.4
37 L 2200 22 -- -- 24 24
37 L 4300 41 13 L -- 44 41
E-SB-956-3-4 E-SB-957-0.5-2E-SB-957-0-0.5 E-SB-957-2-3 E-SB-957-3-4 E-SB-958-0.5-2E-SB-958-0-0.5
20120628 2012062820120628 20120628 20120628 2012062820120628
3 0.50 2 3 0.50
4 3 4 20.520.5

TABLE 4-5
ANALYTES DETECTED IN BLOCK E PERIPHERAL SHALLOW SOIL-SAMPLES, JUNE-JULY 2012
LOCKHEED MARTIN MIDDLE RIVER COMPLEX, MIDDLE RIVER, MARYLAND
PAGE 3 OF 14
SAMPLE ID Non-
SAMPLE DATE Residential Residential
TOP DEPTH (FEET BELOW GRADE) Screening Screening
BOTTOM DEPTH (FEET BELOW GRADE) Levels Levels
METALS (MG/KG)
ANTIMONY 3.1 41
ARSENIC 12(1) 12(1)
BARIUM 1600 20000
BERYLLIUM 16 200
CADMIUM 3.9 51
CHROMIUM 23 310COBALT NA NA
COPPER 310 4100
LEAD 400 1000
MERCURY 2.3 31MOLYBDENUM NA NA
NICKEL 160 2000
SELENIUM 39 510
SILVER 39 510
THALLIUM 0.55 7.2
VANADIUM 91(1) 91(1)
ZINC 2300 31000
HEXAVALENT CHROMIUM 23 310PCBS (UG/KG)AROCLOR-1242 1000 10000AROCLOR-1248 1000 10000AROCLOR-1260 1000 10000
1-METHYLNAPHTHALENE NA NA2-METHYLNAPHTHALENE NA NA
ACENAPHTHENE 470000 6100000
ACENAPHTHYLENE 470000 6100000
ANTHRACENE 2300000 31000000BAP EQUIVALENT-HALFND 140 2900
BENZO(A)ANTHRACENE 220 3900
BENZO(A)PYRENE 22 390
BENZO(B)FLUORANTHENE 220 3900
BENZO(G,H,I)PERYLENE 230000 3100000
BENZO(K)FLUORANTHENE 2200 39000
CHRYSENE 22000 390000
DIBENZO(A,H)ANTHRACENE 22 390
FLUORANTHENE 310000 4100000
FLUORENE 310000 4100000
INDENO(1,2,3-CD)PYRENE 220 3900
NAPHTHALENE 160000 2000000
PHENANTHRENE 2300000 31000000
PYRENE 230000 3100000
POLYCYCLIC AROMATIC HYDROCARBONS (UG/KG)
MISCELLANEOUS PARAMETERS (MG/KG)
-- NA NA NA NA NA NA
4.6 NA NA NA NA NA NA
35 J NA NA NA NA NA NA
0.56 NA NA NA NA NA NA
0.074 J NA NA NA NA NA NA
17 NA NA NA NA NA NA
3.2 NA NA NA NA NA NA6.9 NA NA NA NA NA NA
8.1 NA NA NA NA NA NA
0.027 J NA NA NA NA NA NA
0.58 J NA NA NA NA NA NA6.3 NA NA NA NA NA NA
0.72 J NA NA NA NA NA NA
-- NA NA NA NA NA NA
-- NA NA NA NA NA NA
26 J NA NA NA NA NA NA
24 NA NA NA NA NA NA
-- NA NA NA NA NA NA
-- -- -- -- NA NA ---- -- -- -- NA NA --
3000 290 740 29 J NA NA --
-- -- -- -- -- -- 11-- -- -- -- -- -- 18-- -- 8.2 -- -- -- 5.2 J
-- -- 10 -- -- -- --
12 L -- 24 -- -- -- 5.2 J
62.418 -- 236.2 -- 10.1694 -- 20.39654 L -- 170 -- 6.2 J -- 17
46 -- 160 -- 6.6 J -- 14
58 -- 240 -- 10 -- 18
36 -- 140 -- -- -- 12
31 -- 100 -- -- -- 12
58 L -- 200 -- 6.9 J -- 16
-- -- 23 -- -- -- --
93 L -- 290 -- 12 -- 29
-- -- -- -- -- -- 5.5 J
30 -- 110 -- -- -- 9.6
-- -- 9.6 -- -- -- 25
54 L -- 130 -- 5.1 J -- 25
80 L -- 290 -- 11 L -- 23
E-SB-958-2-3 E-SB-958-3-4 E-SB-959-0.5-2E-SB-959-0-0.5 E-SB-959-2-3 E-SB-959-3-4 E-SB-960-1-2
20120628 20120628 2012062820120628 20120628 20120628 20120628
2 3 0.50 2 3 1
3 4 20.5 3 4 2
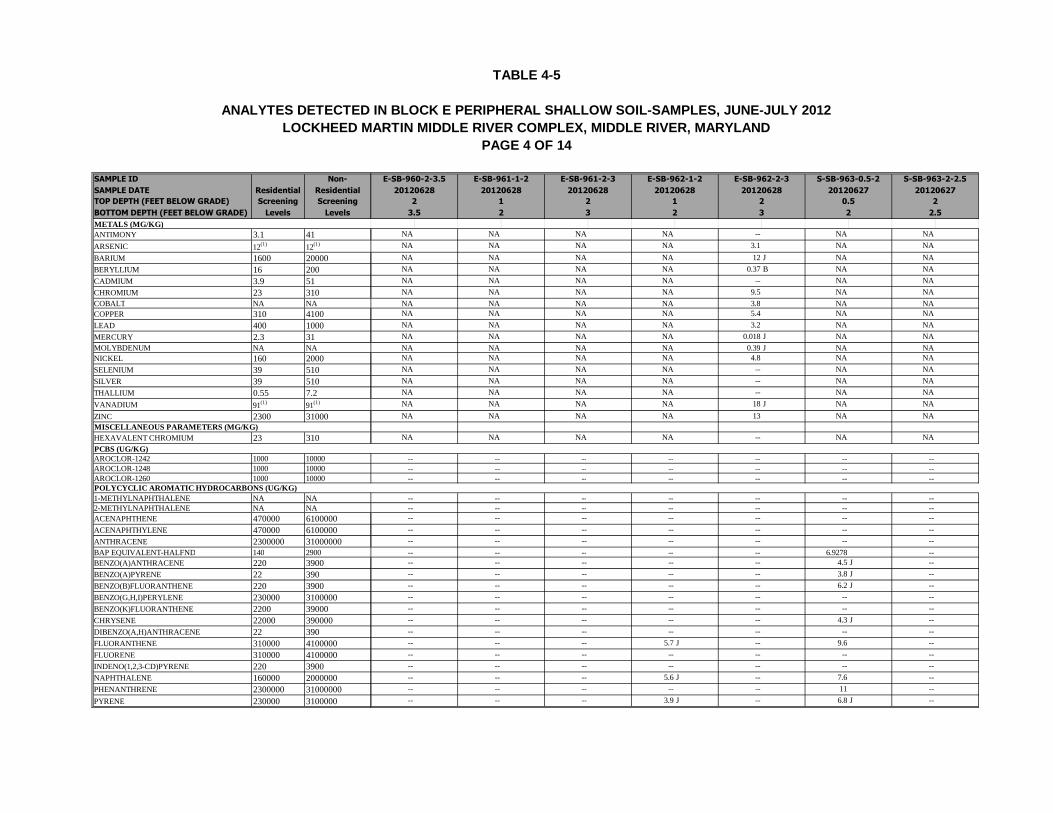
TABLE 4-5
ANALYTES DETECTED IN BLOCK E PERIPHERAL SHALLOW SOIL-SAMPLES, JUNE-JULY 2012
LOCKHEED MARTIN MIDDLE RIVER COMPLEX, MIDDLE RIVER, MARYLAND
PAGE 4 OF 14
SAMPLE ID Non-
SAMPLE DATE Residential Residential
TOP DEPTH (FEET BELOW GRADE) Screening Screening
BOTTOM DEPTH (FEET BELOW GRADE) Levels Levels
METALS (MG/KG)
ANTIMONY 3.1 41
ARSENIC 12(1) 12(1)
BARIUM 1600 20000
BERYLLIUM 16 200
CADMIUM 3.9 51
CHROMIUM 23 310COBALT NA NA
COPPER 310 4100
LEAD 400 1000
MERCURY 2.3 31MOLYBDENUM NA NA
NICKEL 160 2000
SELENIUM 39 510
SILVER 39 510
THALLIUM 0.55 7.2
VANADIUM 91(1) 91(1)
ZINC 2300 31000
HEXAVALENT CHROMIUM 23 310PCBS (UG/KG)AROCLOR-1242 1000 10000AROCLOR-1248 1000 10000AROCLOR-1260 1000 10000
1-METHYLNAPHTHALENE NA NA2-METHYLNAPHTHALENE NA NA
ACENAPHTHENE 470000 6100000
ACENAPHTHYLENE 470000 6100000
ANTHRACENE 2300000 31000000BAP EQUIVALENT-HALFND 140 2900
BENZO(A)ANTHRACENE 220 3900
BENZO(A)PYRENE 22 390
BENZO(B)FLUORANTHENE 220 3900
BENZO(G,H,I)PERYLENE 230000 3100000
BENZO(K)FLUORANTHENE 2200 39000
CHRYSENE 22000 390000
DIBENZO(A,H)ANTHRACENE 22 390
FLUORANTHENE 310000 4100000
FLUORENE 310000 4100000
INDENO(1,2,3-CD)PYRENE 220 3900
NAPHTHALENE 160000 2000000
PHENANTHRENE 2300000 31000000
PYRENE 230000 3100000
POLYCYCLIC AROMATIC HYDROCARBONS (UG/KG)
MISCELLANEOUS PARAMETERS (MG/KG)
NA NA NA NA -- NA NA
NA NA NA NA 3.1 NA NA
NA NA NA NA 12 J NA NA
NA NA NA NA 0.37 B NA NA
NA NA NA NA -- NA NA
NA NA NA NA 9.5 NA NA
NA NA NA NA 3.8 NA NANA NA NA NA 5.4 NA NA
NA NA NA NA 3.2 NA NA
NA NA NA NA 0.018 J NA NA
NA NA NA NA 0.39 J NA NANA NA NA NA 4.8 NA NA
NA NA NA NA -- NA NA
NA NA NA NA -- NA NA
NA NA NA NA -- NA NA
NA NA NA NA 18 J NA NA
NA NA NA NA 13 NA NA
NA NA NA NA -- NA NA
-- -- -- -- -- -- ---- -- -- -- -- -- ---- -- -- -- -- -- --
-- -- -- -- -- -- ---- -- -- -- -- -- ---- -- -- -- -- -- --
-- -- -- -- -- -- --
-- -- -- -- -- -- --
-- -- -- -- -- 6.9278 ---- -- -- -- -- 4.5 J --
-- -- -- -- -- 3.8 J --
-- -- -- -- -- 6.2 J --
-- -- -- -- -- -- --
-- -- -- -- -- -- --
-- -- -- -- -- 4.3 J --
-- -- -- -- -- -- --
-- -- -- 5.7 J -- 9.6 --
-- -- -- -- -- -- --
-- -- -- -- -- -- --
-- -- -- 5.6 J -- 7.6 --
-- -- -- -- -- 11 --
-- -- -- 3.9 J -- 6.8 J --
E-SB-960-2-3.5 E-SB-961-1-2 E-SB-961-2-3 E-SB-962-1-2 E-SB-962-2-3 S-SB-963-0.5-2 S-SB-963-2-2.5
20120628 20120628 20120628 20120628 20120628 20120627 20120627
2 1 2 1 2 0.5 2
3.5 2 3 2 3 2 2.5
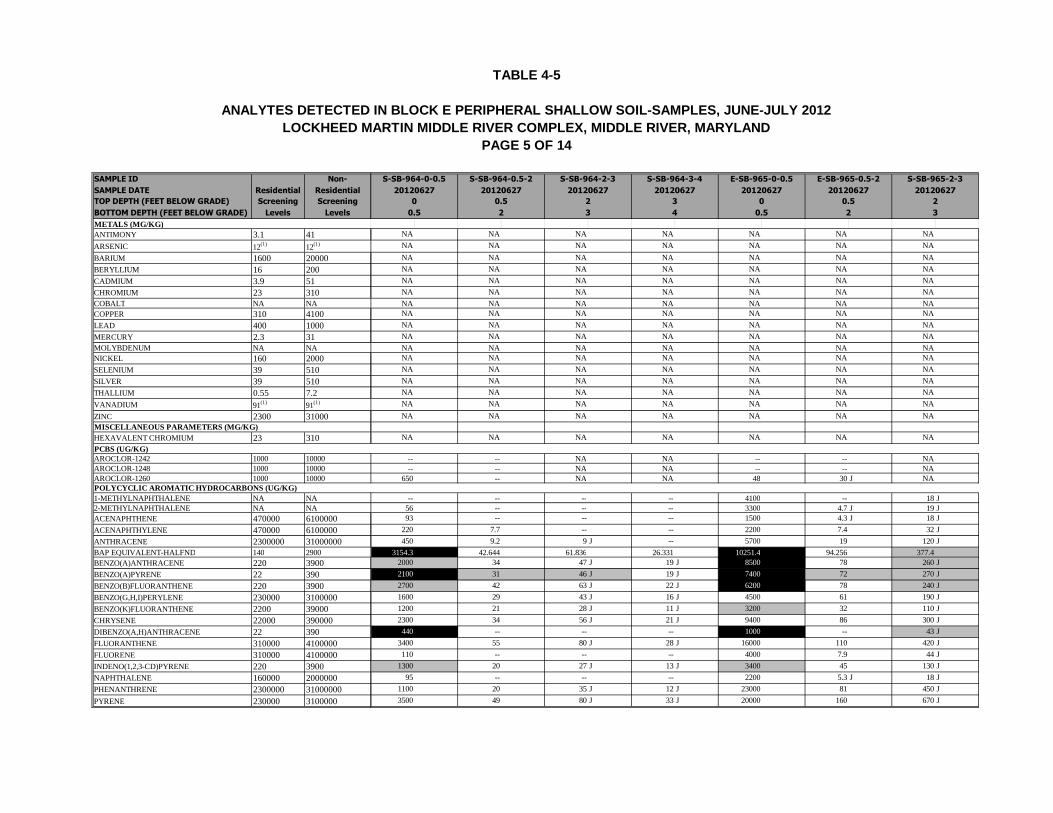
TABLE 4-5
ANALYTES DETECTED IN BLOCK E PERIPHERAL SHALLOW SOIL-SAMPLES, JUNE-JULY 2012
LOCKHEED MARTIN MIDDLE RIVER COMPLEX, MIDDLE RIVER, MARYLAND
PAGE 5 OF 14
SAMPLE ID Non-
SAMPLE DATE Residential Residential
TOP DEPTH (FEET BELOW GRADE) Screening Screening
BOTTOM DEPTH (FEET BELOW GRADE) Levels Levels
METALS (MG/KG)
ANTIMONY 3.1 41
ARSENIC 12(1) 12(1)
BARIUM 1600 20000
BERYLLIUM 16 200
CADMIUM 3.9 51
CHROMIUM 23 310COBALT NA NA
COPPER 310 4100
LEAD 400 1000
MERCURY 2.3 31MOLYBDENUM NA NA
NICKEL 160 2000
SELENIUM 39 510
SILVER 39 510
THALLIUM 0.55 7.2
VANADIUM 91(1) 91(1)
ZINC 2300 31000
HEXAVALENT CHROMIUM 23 310PCBS (UG/KG)AROCLOR-1242 1000 10000AROCLOR-1248 1000 10000AROCLOR-1260 1000 10000
1-METHYLNAPHTHALENE NA NA2-METHYLNAPHTHALENE NA NA
ACENAPHTHENE 470000 6100000
ACENAPHTHYLENE 470000 6100000
ANTHRACENE 2300000 31000000BAP EQUIVALENT-HALFND 140 2900
BENZO(A)ANTHRACENE 220 3900
BENZO(A)PYRENE 22 390
BENZO(B)FLUORANTHENE 220 3900
BENZO(G,H,I)PERYLENE 230000 3100000
BENZO(K)FLUORANTHENE 2200 39000
CHRYSENE 22000 390000
DIBENZO(A,H)ANTHRACENE 22 390
FLUORANTHENE 310000 4100000
FLUORENE 310000 4100000
INDENO(1,2,3-CD)PYRENE 220 3900
NAPHTHALENE 160000 2000000
PHENANTHRENE 2300000 31000000
PYRENE 230000 3100000
POLYCYCLIC AROMATIC HYDROCARBONS (UG/KG)
MISCELLANEOUS PARAMETERS (MG/KG)
NA NA NA NA NA NA NA
NA NA NA NA NA NA NA
NA NA NA NA NA NA NA
NA NA NA NA NA NA NA
NA NA NA NA NA NA NA
NA NA NA NA NA NA NA
NA NA NA NA NA NA NANA NA NA NA NA NA NA
NA NA NA NA NA NA NA
NA NA NA NA NA NA NA
NA NA NA NA NA NA NANA NA NA NA NA NA NA
NA NA NA NA NA NA NA
NA NA NA NA NA NA NA
NA NA NA NA NA NA NA
NA NA NA NA NA NA NA
NA NA NA NA NA NA NA
NA NA NA NA NA NA NA
-- -- NA NA -- -- NA-- -- NA NA -- -- NA
650 -- NA NA 48 30 J NA
-- -- -- -- 4100 -- 18 J56 -- -- -- 3300 4.7 J 19 J93 -- -- -- 1500 4.3 J 18 J
220 7.7 -- -- 2200 7.4 32 J
450 9.2 9 J -- 5700 19 120 J
3154.3 42.644 61.836 26.331 10251.4 94.256 377.42000 34 47 J 19 J 8500 78 260 J
2100 31 46 J 19 J 7400 72 270 J
2700 42 63 J 22 J 6200 78 240 J
1600 29 43 J 16 J 4500 61 190 J
1200 21 28 J 11 J 3200 32 110 J
2300 34 56 J 21 J 9400 86 300 J
440 -- -- -- 1000 -- 43 J
3400 55 80 J 28 J 16000 110 420 J
110 -- -- -- 4000 7.9 44 J
1300 20 27 J 13 J 3400 45 130 J
95 -- -- -- 2200 5.3 J 18 J
1100 20 35 J 12 J 23000 81 450 J
3500 49 80 J 33 J 20000 160 670 J
S-SB-964-0.5-2S-SB-964-0-0.5 S-SB-964-2-3 S-SB-964-3-4 E-SB-965-0.5-2E-SB-965-0-0.5 S-SB-965-2-3
2012062720120627 20120627 20120627 2012062720120627 20120627
0.50 2 3 0.50 2
20.5 3 4 20.5 3
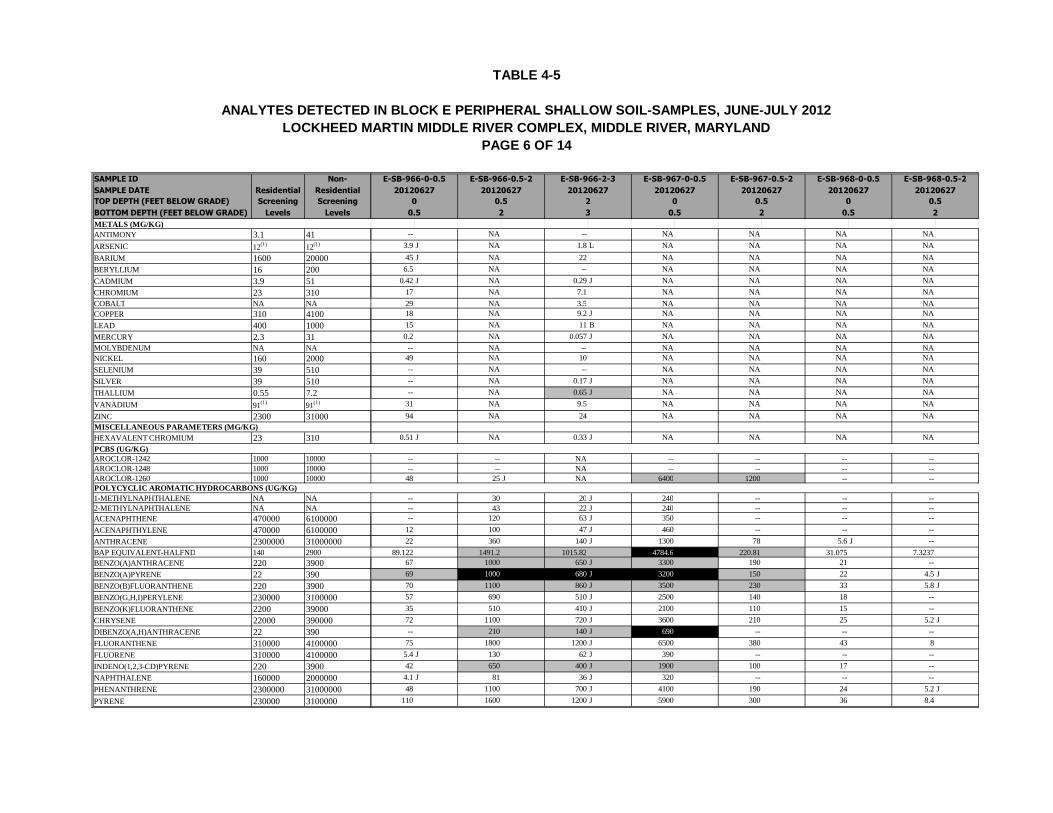
TABLE 4-5
ANALYTES DETECTED IN BLOCK E PERIPHERAL SHALLOW SOIL-SAMPLES, JUNE-JULY 2012
LOCKHEED MARTIN MIDDLE RIVER COMPLEX, MIDDLE RIVER, MARYLAND
PAGE 6 OF 14
SAMPLE ID Non-
SAMPLE DATE Residential Residential
TOP DEPTH (FEET BELOW GRADE) Screening Screening
BOTTOM DEPTH (FEET BELOW GRADE) Levels Levels
METALS (MG/KG)
ANTIMONY 3.1 41
ARSENIC 12(1) 12(1)
BARIUM 1600 20000
BERYLLIUM 16 200
CADMIUM 3.9 51
CHROMIUM 23 310COBALT NA NA
COPPER 310 4100
LEAD 400 1000
MERCURY 2.3 31MOLYBDENUM NA NA
NICKEL 160 2000
SELENIUM 39 510
SILVER 39 510
THALLIUM 0.55 7.2
VANADIUM 91(1) 91(1)
ZINC 2300 31000
HEXAVALENT CHROMIUM 23 310PCBS (UG/KG)AROCLOR-1242 1000 10000AROCLOR-1248 1000 10000AROCLOR-1260 1000 10000
1-METHYLNAPHTHALENE NA NA2-METHYLNAPHTHALENE NA NA
ACENAPHTHENE 470000 6100000
ACENAPHTHYLENE 470000 6100000
ANTHRACENE 2300000 31000000BAP EQUIVALENT-HALFND 140 2900
BENZO(A)ANTHRACENE 220 3900
BENZO(A)PYRENE 22 390
BENZO(B)FLUORANTHENE 220 3900
BENZO(G,H,I)PERYLENE 230000 3100000
BENZO(K)FLUORANTHENE 2200 39000
CHRYSENE 22000 390000
DIBENZO(A,H)ANTHRACENE 22 390
FLUORANTHENE 310000 4100000
FLUORENE 310000 4100000
INDENO(1,2,3-CD)PYRENE 220 3900
NAPHTHALENE 160000 2000000
PHENANTHRENE 2300000 31000000
PYRENE 230000 3100000
POLYCYCLIC AROMATIC HYDROCARBONS (UG/KG)
MISCELLANEOUS PARAMETERS (MG/KG)
-- NA -- NA NA NA NA
3.9 J NA 1.8 L NA NA NA NA
45 J NA 22 NA NA NA NA
6.5 NA -- NA NA NA NA
0.42 J NA 0.29 J NA NA NA NA
17 NA 7.1 NA NA NA NA
29 NA 3.5 NA NA NA NA18 NA 9.2 J NA NA NA NA
15 NA 11 B NA NA NA NA
0.2 NA 0.057 J NA NA NA NA
-- NA -- NA NA NA NA49 NA 10 NA NA NA NA
-- NA -- NA NA NA NA
-- NA 0.17 J NA NA NA NA
-- NA 0.65 J NA NA NA NA
31 NA 9.5 NA NA NA NA
94 NA 24 NA NA NA NA
0.51 J NA 0.33 J NA NA NA NA
-- -- NA -- -- -- ---- -- NA -- -- -- --
48 25 J NA 6400 1200 -- --
-- 30 20 J 240 -- -- ---- 43 22 J 240 -- -- ---- 120 63 J 350 -- -- --
12 100 47 J 460 -- -- --
22 360 140 J 1300 78 5.6 J --
89.122 1491.2 1015.82 4784.6 220.81 31.075 7.323767 1000 650 J 3300 190 21 --
69 1000 680 J 3200 150 22 4.5 J
70 1100 860 J 3500 230 33 5.8 J
57 690 510 J 2500 140 18 --
35 510 410 J 2100 110 15 --
72 1100 720 J 3600 210 25 5.2 J
-- 210 140 J 690 -- -- --
75 1800 1200 J 6500 380 43 8
5.4 J 130 62 J 390 -- -- --
42 650 400 J 1900 100 17 --
4.1 J 81 36 J 320 -- -- --
48 1100 700 J 4100 190 24 5.2 J
110 1600 1200 J 5900 300 36 8.4
E-SB-966-0.5-2E-SB-966-0-0.5 E-SB-966-2-3 E-SB-967-0.5-2E-SB-967-0-0.5 E-SB-968-0.5-2E-SB-968-0-0.5
2012062720120627 20120627 2012062720120627 2012062720120627
0.50 2 0.50 0.50
20.5 3 20.5 20.5
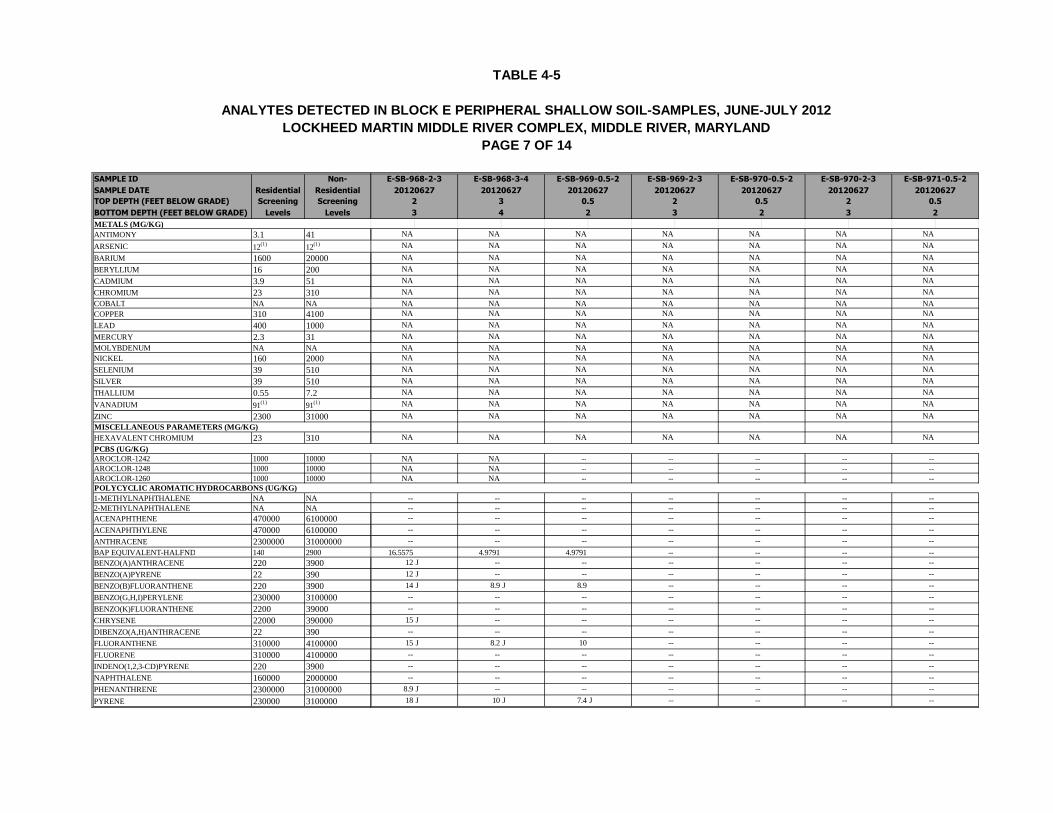
TABLE 4-5
ANALYTES DETECTED IN BLOCK E PERIPHERAL SHALLOW SOIL-SAMPLES, JUNE-JULY 2012
LOCKHEED MARTIN MIDDLE RIVER COMPLEX, MIDDLE RIVER, MARYLAND
PAGE 7 OF 14
SAMPLE ID Non-
SAMPLE DATE Residential Residential
TOP DEPTH (FEET BELOW GRADE) Screening Screening
BOTTOM DEPTH (FEET BELOW GRADE) Levels Levels
METALS (MG/KG)
ANTIMONY 3.1 41
ARSENIC 12(1) 12(1)
BARIUM 1600 20000
BERYLLIUM 16 200
CADMIUM 3.9 51
CHROMIUM 23 310COBALT NA NA
COPPER 310 4100
LEAD 400 1000
MERCURY 2.3 31MOLYBDENUM NA NA
NICKEL 160 2000
SELENIUM 39 510
SILVER 39 510
THALLIUM 0.55 7.2
VANADIUM 91(1) 91(1)
ZINC 2300 31000
HEXAVALENT CHROMIUM 23 310PCBS (UG/KG)AROCLOR-1242 1000 10000AROCLOR-1248 1000 10000AROCLOR-1260 1000 10000
1-METHYLNAPHTHALENE NA NA2-METHYLNAPHTHALENE NA NA
ACENAPHTHENE 470000 6100000
ACENAPHTHYLENE 470000 6100000
ANTHRACENE 2300000 31000000BAP EQUIVALENT-HALFND 140 2900
BENZO(A)ANTHRACENE 220 3900
BENZO(A)PYRENE 22 390
BENZO(B)FLUORANTHENE 220 3900
BENZO(G,H,I)PERYLENE 230000 3100000
BENZO(K)FLUORANTHENE 2200 39000
CHRYSENE 22000 390000
DIBENZO(A,H)ANTHRACENE 22 390
FLUORANTHENE 310000 4100000
FLUORENE 310000 4100000
INDENO(1,2,3-CD)PYRENE 220 3900
NAPHTHALENE 160000 2000000
PHENANTHRENE 2300000 31000000
PYRENE 230000 3100000
POLYCYCLIC AROMATIC HYDROCARBONS (UG/KG)
MISCELLANEOUS PARAMETERS (MG/KG)
NA NA NA NA NA NA NA
NA NA NA NA NA NA NA
NA NA NA NA NA NA NA
NA NA NA NA NA NA NA
NA NA NA NA NA NA NA
NA NA NA NA NA NA NA
NA NA NA NA NA NA NANA NA NA NA NA NA NA
NA NA NA NA NA NA NA
NA NA NA NA NA NA NA
NA NA NA NA NA NA NANA NA NA NA NA NA NA
NA NA NA NA NA NA NA
NA NA NA NA NA NA NA
NA NA NA NA NA NA NA
NA NA NA NA NA NA NA
NA NA NA NA NA NA NA
NA NA NA NA NA NA NA
NA NA -- -- -- -- --NA NA -- -- -- -- --NA NA -- -- -- -- --
-- -- -- -- -- -- ---- -- -- -- -- -- ---- -- -- -- -- -- --
-- -- -- -- -- -- --
-- -- -- -- -- -- --
16.5575 4.9791 4.9791 -- -- -- --12 J -- -- -- -- -- --
12 J -- -- -- -- -- --
14 J 8.9 J 8.9 -- -- -- --
-- -- -- -- -- -- --
-- -- -- -- -- -- --
15 J -- -- -- -- -- --
-- -- -- -- -- -- --
15 J 8.2 J 10 -- -- -- --
-- -- -- -- -- -- --
-- -- -- -- -- -- --
-- -- -- -- -- -- --
8.9 J -- -- -- -- -- --
18 J 10 J 7.4 J -- -- -- --
E-SB-968-2-3 E-SB-968-3-4 E-SB-969-0.5-2 E-SB-969-2-3 E-SB-970-0.5-2 E-SB-970-2-3 E-SB-971-0.5-2
20120627 20120627 20120627 20120627 20120627 20120627 20120627
2 3 0.5 2 0.5 2 0.5
3 4 2 3 2 3 2
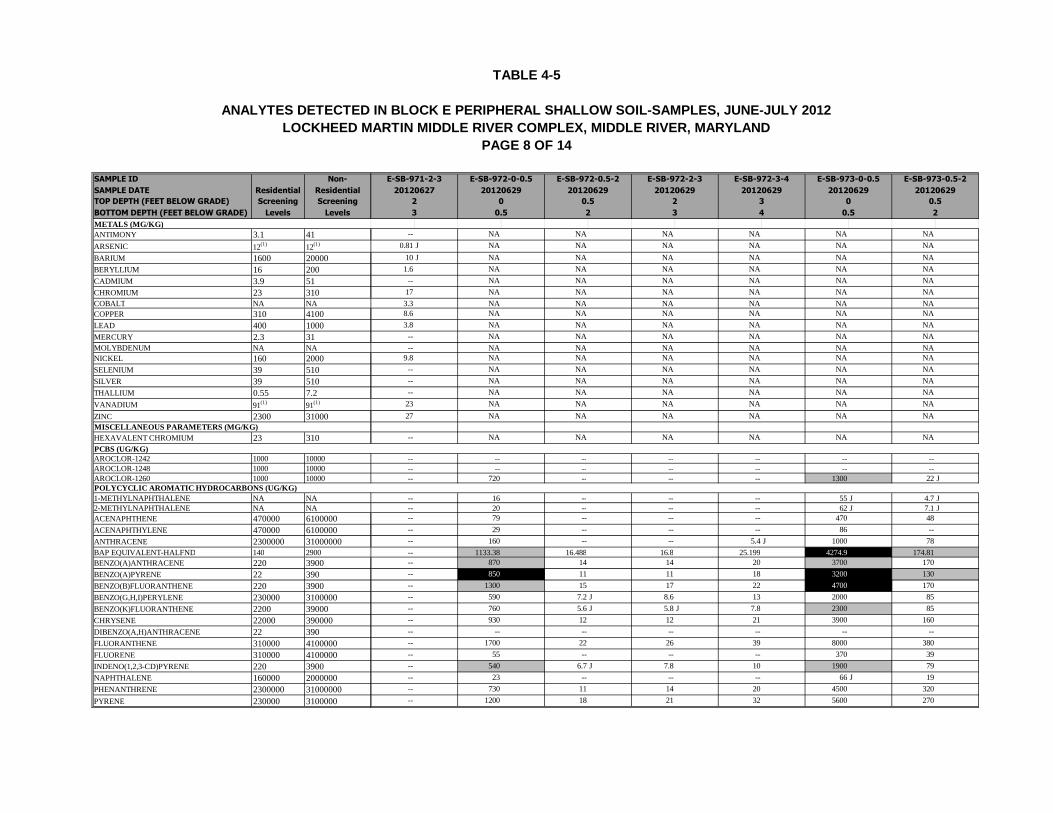
TABLE 4-5
ANALYTES DETECTED IN BLOCK E PERIPHERAL SHALLOW SOIL-SAMPLES, JUNE-JULY 2012
LOCKHEED MARTIN MIDDLE RIVER COMPLEX, MIDDLE RIVER, MARYLAND
PAGE 8 OF 14
SAMPLE ID Non-
SAMPLE DATE Residential Residential
TOP DEPTH (FEET BELOW GRADE) Screening Screening
BOTTOM DEPTH (FEET BELOW GRADE) Levels Levels
METALS (MG/KG)
ANTIMONY 3.1 41
ARSENIC 12(1) 12(1)
BARIUM 1600 20000
BERYLLIUM 16 200
CADMIUM 3.9 51
CHROMIUM 23 310COBALT NA NA
COPPER 310 4100
LEAD 400 1000
MERCURY 2.3 31MOLYBDENUM NA NA
NICKEL 160 2000
SELENIUM 39 510
SILVER 39 510
THALLIUM 0.55 7.2
VANADIUM 91(1) 91(1)
ZINC 2300 31000
HEXAVALENT CHROMIUM 23 310PCBS (UG/KG)AROCLOR-1242 1000 10000AROCLOR-1248 1000 10000AROCLOR-1260 1000 10000
1-METHYLNAPHTHALENE NA NA2-METHYLNAPHTHALENE NA NA
ACENAPHTHENE 470000 6100000
ACENAPHTHYLENE 470000 6100000
ANTHRACENE 2300000 31000000BAP EQUIVALENT-HALFND 140 2900
BENZO(A)ANTHRACENE 220 3900
BENZO(A)PYRENE 22 390
BENZO(B)FLUORANTHENE 220 3900
BENZO(G,H,I)PERYLENE 230000 3100000
BENZO(K)FLUORANTHENE 2200 39000
CHRYSENE 22000 390000
DIBENZO(A,H)ANTHRACENE 22 390
FLUORANTHENE 310000 4100000
FLUORENE 310000 4100000
INDENO(1,2,3-CD)PYRENE 220 3900
NAPHTHALENE 160000 2000000
PHENANTHRENE 2300000 31000000
PYRENE 230000 3100000
POLYCYCLIC AROMATIC HYDROCARBONS (UG/KG)
MISCELLANEOUS PARAMETERS (MG/KG)
-- NA NA NA NA NA NA
0.81 J NA NA NA NA NA NA
10 J NA NA NA NA NA NA
1.6 NA NA NA NA NA NA
-- NA NA NA NA NA NA
17 NA NA NA NA NA NA
3.3 NA NA NA NA NA NA8.6 NA NA NA NA NA NA
3.8 NA NA NA NA NA NA
-- NA NA NA NA NA NA
-- NA NA NA NA NA NA9.8 NA NA NA NA NA NA
-- NA NA NA NA NA NA
-- NA NA NA NA NA NA
-- NA NA NA NA NA NA
23 NA NA NA NA NA NA
27 NA NA NA NA NA NA
-- NA NA NA NA NA NA
-- -- -- -- -- -- ---- -- -- -- -- -- ---- 720 -- -- -- 1300 22 J
-- 16 -- -- -- 55 J 4.7 J-- 20 -- -- -- 62 J 7.1 J-- 79 -- -- -- 470 48
-- 29 -- -- -- 86 --
-- 160 -- -- 5.4 J 1000 78
-- 1133.38 16.488 16.8 25.199 4274.9 174.81-- 870 14 14 20 3700 170
-- 850 11 11 18 3200 130
-- 1300 15 17 22 4700 170
-- 590 7.2 J 8.6 13 2000 85
-- 760 5.6 J 5.8 J 7.8 2300 85
-- 930 12 12 21 3900 160
-- -- -- -- -- -- --
-- 1700 22 26 39 8000 380
-- 55 -- -- -- 370 39
-- 540 6.7 J 7.8 10 1900 79
-- 23 -- -- -- 66 J 19
-- 730 11 14 20 4500 320
-- 1200 18 21 32 5600 270
E-SB-971-2-3 E-SB-972-0.5-2E-SB-972-0-0.5 E-SB-972-2-3 E-SB-972-3-4 E-SB-973-0.5-2E-SB-973-0-0.5
20120627 2012062920120629 20120629 20120629 2012062920120629
2 0.50 2 3 0.50
3 20.5 3 4 20.5
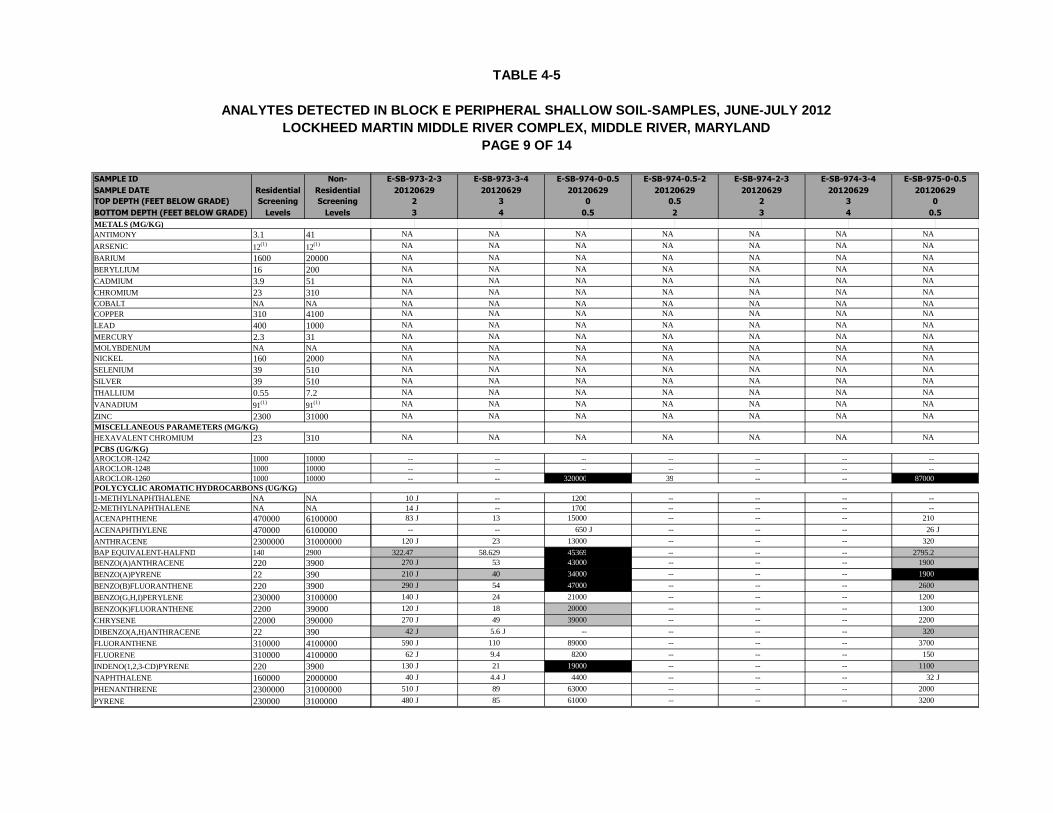
TABLE 4-5
ANALYTES DETECTED IN BLOCK E PERIPHERAL SHALLOW SOIL-SAMPLES, JUNE-JULY 2012
LOCKHEED MARTIN MIDDLE RIVER COMPLEX, MIDDLE RIVER, MARYLAND
PAGE 9 OF 14
SAMPLE ID Non-
SAMPLE DATE Residential Residential
TOP DEPTH (FEET BELOW GRADE) Screening Screening
BOTTOM DEPTH (FEET BELOW GRADE) Levels Levels
METALS (MG/KG)
ANTIMONY 3.1 41
ARSENIC 12(1) 12(1)
BARIUM 1600 20000
BERYLLIUM 16 200
CADMIUM 3.9 51
CHROMIUM 23 310COBALT NA NA
COPPER 310 4100
LEAD 400 1000
MERCURY 2.3 31MOLYBDENUM NA NA
NICKEL 160 2000
SELENIUM 39 510
SILVER 39 510
THALLIUM 0.55 7.2
VANADIUM 91(1) 91(1)
ZINC 2300 31000
HEXAVALENT CHROMIUM 23 310PCBS (UG/KG)AROCLOR-1242 1000 10000AROCLOR-1248 1000 10000AROCLOR-1260 1000 10000
1-METHYLNAPHTHALENE NA NA2-METHYLNAPHTHALENE NA NA
ACENAPHTHENE 470000 6100000
ACENAPHTHYLENE 470000 6100000
ANTHRACENE 2300000 31000000BAP EQUIVALENT-HALFND 140 2900
BENZO(A)ANTHRACENE 220 3900
BENZO(A)PYRENE 22 390
BENZO(B)FLUORANTHENE 220 3900
BENZO(G,H,I)PERYLENE 230000 3100000
BENZO(K)FLUORANTHENE 2200 39000
CHRYSENE 22000 390000
DIBENZO(A,H)ANTHRACENE 22 390
FLUORANTHENE 310000 4100000
FLUORENE 310000 4100000
INDENO(1,2,3-CD)PYRENE 220 3900
NAPHTHALENE 160000 2000000
PHENANTHRENE 2300000 31000000
PYRENE 230000 3100000
POLYCYCLIC AROMATIC HYDROCARBONS (UG/KG)
MISCELLANEOUS PARAMETERS (MG/KG)
NA NA NA NA NA NA NA
NA NA NA NA NA NA NA
NA NA NA NA NA NA NA
NA NA NA NA NA NA NA
NA NA NA NA NA NA NA
NA NA NA NA NA NA NA
NA NA NA NA NA NA NANA NA NA NA NA NA NA
NA NA NA NA NA NA NA
NA NA NA NA NA NA NA
NA NA NA NA NA NA NANA NA NA NA NA NA NA
NA NA NA NA NA NA NA
NA NA NA NA NA NA NA
NA NA NA NA NA NA NA
NA NA NA NA NA NA NA
NA NA NA NA NA NA NA
NA NA NA NA NA NA NA
-- -- -- -- -- -- ---- -- -- -- -- -- ---- -- 320000 39 -- -- 87000
10 J -- 1200 -- -- -- --14 J -- 1700 -- -- -- --83 J 13 15000 -- -- -- 210
-- -- 650 J -- -- -- 26 J
120 J 23 13000 -- -- -- 320
322.47 58.629 45369 -- -- -- 2795.2270 J 53 43000 -- -- -- 1900
210 J 40 34000 -- -- -- 1900
290 J 54 47000 -- -- -- 2600
140 J 24 21000 -- -- -- 1200
120 J 18 20000 -- -- -- 1300
270 J 49 39000 -- -- -- 2200
42 J 5.6 J -- -- -- -- 320
590 J 110 89000 -- -- -- 3700
62 J 9.4 8200 -- -- -- 150
130 J 21 19000 -- -- -- 1100
40 J 4.4 J 4400 -- -- -- 32 J
510 J 89 63000 -- -- -- 2000
480 J 85 61000 -- -- -- 3200
E-SB-973-2-3 E-SB-973-3-4 E-SB-974-0.5-2E-SB-974-0-0.5 E-SB-974-2-3 E-SB-974-3-4 E-SB-975-0-0.5
20120629 20120629 2012062920120629 20120629 20120629 20120629
2 3 0.50 2 3 0
3 4 20.5 3 4 0.5

TABLE 4-5
ANALYTES DETECTED IN BLOCK E PERIPHERAL SHALLOW SOIL-SAMPLES, JUNE-JULY 2012
LOCKHEED MARTIN MIDDLE RIVER COMPLEX, MIDDLE RIVER, MARYLAND
PAGE 10 OF 14
SAMPLE ID Non-
SAMPLE DATE Residential Residential
TOP DEPTH (FEET BELOW GRADE) Screening Screening
BOTTOM DEPTH (FEET BELOW GRADE) Levels Levels
METALS (MG/KG)
ANTIMONY 3.1 41
ARSENIC 12(1) 12(1)
BARIUM 1600 20000
BERYLLIUM 16 200
CADMIUM 3.9 51
CHROMIUM 23 310COBALT NA NA
COPPER 310 4100
LEAD 400 1000
MERCURY 2.3 31MOLYBDENUM NA NA
NICKEL 160 2000
SELENIUM 39 510
SILVER 39 510
THALLIUM 0.55 7.2
VANADIUM 91(1) 91(1)
ZINC 2300 31000
HEXAVALENT CHROMIUM 23 310PCBS (UG/KG)AROCLOR-1242 1000 10000AROCLOR-1248 1000 10000AROCLOR-1260 1000 10000
1-METHYLNAPHTHALENE NA NA2-METHYLNAPHTHALENE NA NA
ACENAPHTHENE 470000 6100000
ACENAPHTHYLENE 470000 6100000
ANTHRACENE 2300000 31000000BAP EQUIVALENT-HALFND 140 2900
BENZO(A)ANTHRACENE 220 3900
BENZO(A)PYRENE 22 390
BENZO(B)FLUORANTHENE 220 3900
BENZO(G,H,I)PERYLENE 230000 3100000
BENZO(K)FLUORANTHENE 2200 39000
CHRYSENE 22000 390000
DIBENZO(A,H)ANTHRACENE 22 390
FLUORANTHENE 310000 4100000
FLUORENE 310000 4100000
INDENO(1,2,3-CD)PYRENE 220 3900
NAPHTHALENE 160000 2000000
PHENANTHRENE 2300000 31000000
PYRENE 230000 3100000
POLYCYCLIC AROMATIC HYDROCARBONS (UG/KG)
MISCELLANEOUS PARAMETERS (MG/KG)
NA NA NA 6.2 NA NA --
NA NA NA 3.6 NA NA 1.5 J
NA NA NA 90 NA NA 16 J
NA NA NA 0.64 NA NA 1.2
NA NA NA 3.4 NA NA --
NA NA NA 30 NA NA 13
NA NA NA 4.4 NA NA 4NA NA NA 48 NA NA 12
NA NA NA 450 NA NA 6 L
NA NA NA 2.4 NA NA 0.016 J
NA NA NA 1.5 J NA NA --NA NA NA 21 NA NA 18
NA NA NA 0.56 J NA NA --
NA NA NA 0.7 J NA NA --
NA NA NA -- NA NA --
NA NA NA 33 NA NA 18
NA NA NA 450 NA NA 32
NA NA NA -- NA NA --
-- -- -- -- -- -- ---- -- -- -- -- -- --
7600 -- -- 35000 210 -- --
-- -- 57 260 J -- -- ---- 72 140 320 J 4 J -- ---- -- 170 3900 48 -- --
-- -- -- 390 3.8 J -- --
6.1 J 45 98 5400 58 -- --
53.679 115.891 246.15 21539 250.21 8.2246 --31 100 170 19000 J 210 6 J --
39 82 150 16000 190 4.9 J --
64 84 210 25000 250 6.1 J --
45 54 86 10000 120 -- --
19 60 97 11000 120 -- --
39 91 180 19000 J 210 5.6 J --
-- -- 45 -- -- -- --
53 170 360 42000 430 9.9 4 J
-- 39 170 2400 29 -- --
28 53 120 9200 110 -- --
-- 59 210 620 8.6 -- --
27 170 220 24000 270 6.4 J --
44 140 280 29000 J 330 8 --
E-SB-975-0.5-2 E-SB-975-2-3 E-SB-975-3-4 E-SB-976-0.5-2E-SB-976-0-0.5 E-SB-976-2-3 E-SB-976-3-4
20120629 20120629 20120629 2012062920120629 20120629 20120629
3 0.50 2 30.5 2
2 3 4 20.5 3 4
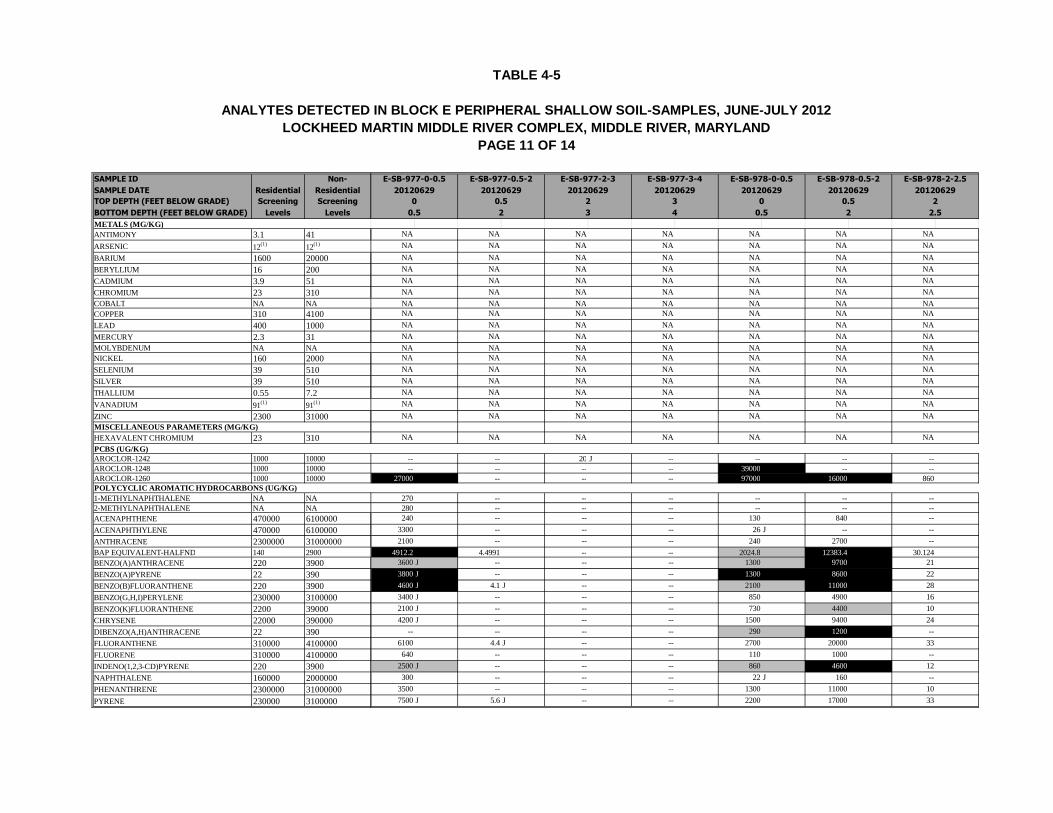
TABLE 4-5
ANALYTES DETECTED IN BLOCK E PERIPHERAL SHALLOW SOIL-SAMPLES, JUNE-JULY 2012
LOCKHEED MARTIN MIDDLE RIVER COMPLEX, MIDDLE RIVER, MARYLAND
PAGE 11 OF 14
SAMPLE ID Non-
SAMPLE DATE Residential Residential
TOP DEPTH (FEET BELOW GRADE) Screening Screening
BOTTOM DEPTH (FEET BELOW GRADE) Levels Levels
METALS (MG/KG)
ANTIMONY 3.1 41
ARSENIC 12(1) 12(1)
BARIUM 1600 20000
BERYLLIUM 16 200
CADMIUM 3.9 51
CHROMIUM 23 310COBALT NA NA
COPPER 310 4100
LEAD 400 1000
MERCURY 2.3 31MOLYBDENUM NA NA
NICKEL 160 2000
SELENIUM 39 510
SILVER 39 510
THALLIUM 0.55 7.2
VANADIUM 91(1) 91(1)
ZINC 2300 31000
HEXAVALENT CHROMIUM 23 310PCBS (UG/KG)AROCLOR-1242 1000 10000AROCLOR-1248 1000 10000AROCLOR-1260 1000 10000
1-METHYLNAPHTHALENE NA NA2-METHYLNAPHTHALENE NA NA
ACENAPHTHENE 470000 6100000
ACENAPHTHYLENE 470000 6100000
ANTHRACENE 2300000 31000000BAP EQUIVALENT-HALFND 140 2900
BENZO(A)ANTHRACENE 220 3900
BENZO(A)PYRENE 22 390
BENZO(B)FLUORANTHENE 220 3900
BENZO(G,H,I)PERYLENE 230000 3100000
BENZO(K)FLUORANTHENE 2200 39000
CHRYSENE 22000 390000
DIBENZO(A,H)ANTHRACENE 22 390
FLUORANTHENE 310000 4100000
FLUORENE 310000 4100000
INDENO(1,2,3-CD)PYRENE 220 3900
NAPHTHALENE 160000 2000000
PHENANTHRENE 2300000 31000000
PYRENE 230000 3100000
POLYCYCLIC AROMATIC HYDROCARBONS (UG/KG)
MISCELLANEOUS PARAMETERS (MG/KG)
NA NA NA NA NA NA NA
NA NA NA NA NA NA NA
NA NA NA NA NA NA NA
NA NA NA NA NA NA NA
NA NA NA NA NA NA NA
NA NA NA NA NA NA NA
NA NA NA NA NA NA NANA NA NA NA NA NA NA
NA NA NA NA NA NA NA
NA NA NA NA NA NA NA
NA NA NA NA NA NA NANA NA NA NA NA NA NA
NA NA NA NA NA NA NA
NA NA NA NA NA NA NA
NA NA NA NA NA NA NA
NA NA NA NA NA NA NA
NA NA NA NA NA NA NA
NA NA NA NA NA NA NA
-- -- 20 J -- -- -- ---- -- -- -- 39000 -- --
27000 -- -- -- 97000 16000 860
270 -- -- -- -- -- --280 -- -- -- -- -- --240 -- -- -- 130 840 --
3300 -- -- -- 26 J -- --
2100 -- -- -- 240 2700 --
4912.2 4.4991 -- -- 2024.8 12383.4 30.1243600 J -- -- -- 1300 9700 21
3800 J -- -- -- 1300 8600 22
4600 J 4.1 J -- -- 2100 11000 28
3400 J -- -- -- 850 4900 16
2100 J -- -- -- 730 4400 10
4200 J -- -- -- 1500 9400 24
-- -- -- -- 290 1200 --
6100 4.4 J -- -- 2700 20000 33
640 -- -- -- 110 1000 --
2500 J -- -- -- 860 4600 12
300 -- -- -- 22 J 160 --
3500 -- -- -- 1300 11000 10
7500 J 5.6 J -- -- 2200 17000 33
E-SB-977-0.5-2E-SB-977-0-0.5 E-SB-977-2-3 E-SB-977-3-4 E-SB-978-0.5-2E-SB-978-0-0.5 E-SB-978-2-2.5
2012062920120629 20120629 20120629 2012062920120629 20120629
0.50 2 3 0.50 2
20.5 3 4 20.5 2.5
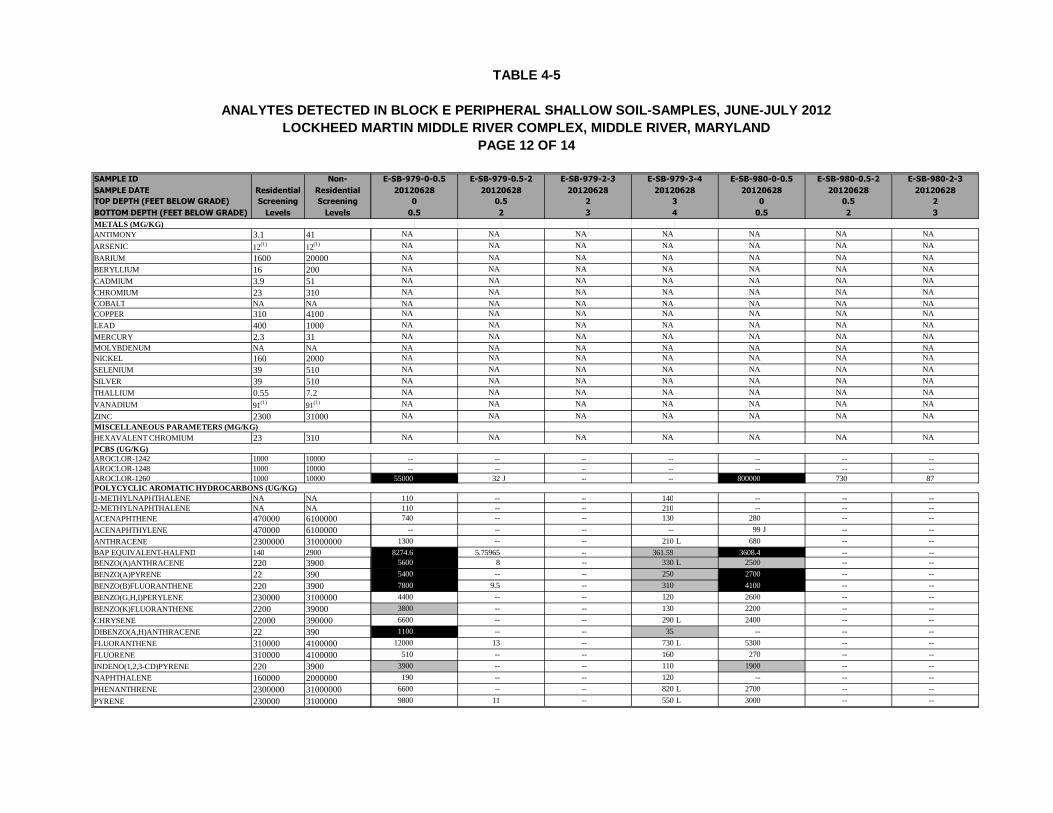
TABLE 4-5
ANALYTES DETECTED IN BLOCK E PERIPHERAL SHALLOW SOIL-SAMPLES, JUNE-JULY 2012
LOCKHEED MARTIN MIDDLE RIVER COMPLEX, MIDDLE RIVER, MARYLAND
PAGE 12 OF 14
SAMPLE ID Non-
SAMPLE DATE Residential Residential
TOP DEPTH (FEET BELOW GRADE) Screening Screening
BOTTOM DEPTH (FEET BELOW GRADE) Levels Levels
METALS (MG/KG)
ANTIMONY 3.1 41
ARSENIC 12(1) 12(1)
BARIUM 1600 20000
BERYLLIUM 16 200
CADMIUM 3.9 51
CHROMIUM 23 310COBALT NA NA
COPPER 310 4100
LEAD 400 1000
MERCURY 2.3 31MOLYBDENUM NA NA
NICKEL 160 2000
SELENIUM 39 510
SILVER 39 510
THALLIUM 0.55 7.2
VANADIUM 91(1) 91(1)
ZINC 2300 31000
HEXAVALENT CHROMIUM 23 310PCBS (UG/KG)AROCLOR-1242 1000 10000AROCLOR-1248 1000 10000AROCLOR-1260 1000 10000
1-METHYLNAPHTHALENE NA NA2-METHYLNAPHTHALENE NA NA
ACENAPHTHENE 470000 6100000
ACENAPHTHYLENE 470000 6100000
ANTHRACENE 2300000 31000000BAP EQUIVALENT-HALFND 140 2900
BENZO(A)ANTHRACENE 220 3900
BENZO(A)PYRENE 22 390
BENZO(B)FLUORANTHENE 220 3900
BENZO(G,H,I)PERYLENE 230000 3100000
BENZO(K)FLUORANTHENE 2200 39000
CHRYSENE 22000 390000
DIBENZO(A,H)ANTHRACENE 22 390
FLUORANTHENE 310000 4100000
FLUORENE 310000 4100000
INDENO(1,2,3-CD)PYRENE 220 3900
NAPHTHALENE 160000 2000000
PHENANTHRENE 2300000 31000000
PYRENE 230000 3100000
POLYCYCLIC AROMATIC HYDROCARBONS (UG/KG)
MISCELLANEOUS PARAMETERS (MG/KG)
NA NA NA NA NA NA NA
NA NA NA NA NA NA NA
NA NA NA NA NA NA NA
NA NA NA NA NA NA NA
NA NA NA NA NA NA NA
NA NA NA NA NA NA NA
NA NA NA NA NA NA NANA NA NA NA NA NA NA
NA NA NA NA NA NA NA
NA NA NA NA NA NA NA
NA NA NA NA NA NA NANA NA NA NA NA NA NA
NA NA NA NA NA NA NA
NA NA NA NA NA NA NA
NA NA NA NA NA NA NA
NA NA NA NA NA NA NA
NA NA NA NA NA NA NA
NA NA NA NA NA NA NA
-- -- -- -- -- -- ---- -- -- -- -- -- --
55000 32 J -- -- 800000 730 87
110 -- -- 140 -- -- --110 -- -- 210 -- -- --740 -- -- 130 280 -- --
-- -- -- -- 99 J -- --
1300 -- -- 210 L 680 -- --
8274.6 5.75965 -- 361.59 3608.4 -- --5600 8 -- 330 L 2500 -- --
5400 -- -- 250 2700 -- --
7800 9.5 -- 310 4100 -- --
4400 -- -- 120 2600 -- --
3800 -- -- 130 2200 -- --
6600 -- -- 290 L 2400 -- --
1100 -- -- 35 -- -- --
12000 13 -- 730 L 5300 -- --
510 -- -- 160 270 -- --
3900 -- -- 110 1900 -- --
190 -- -- 120 -- -- --
6600 -- -- 820 L 2700 -- --
9800 11 -- 550 L 3000 -- --
E-SB-979-0.5-2E-SB-979-0-0.5 E-SB-979-2-3 E-SB-979-3-4
20120628 20120628 2012062820120628
2 30.50
420.5 3
2012062820120628 20120628
E-SB-980-0.5-2E-SB-980-0-0.5 E-SB-980-2-3
2
20.5 3
0.50
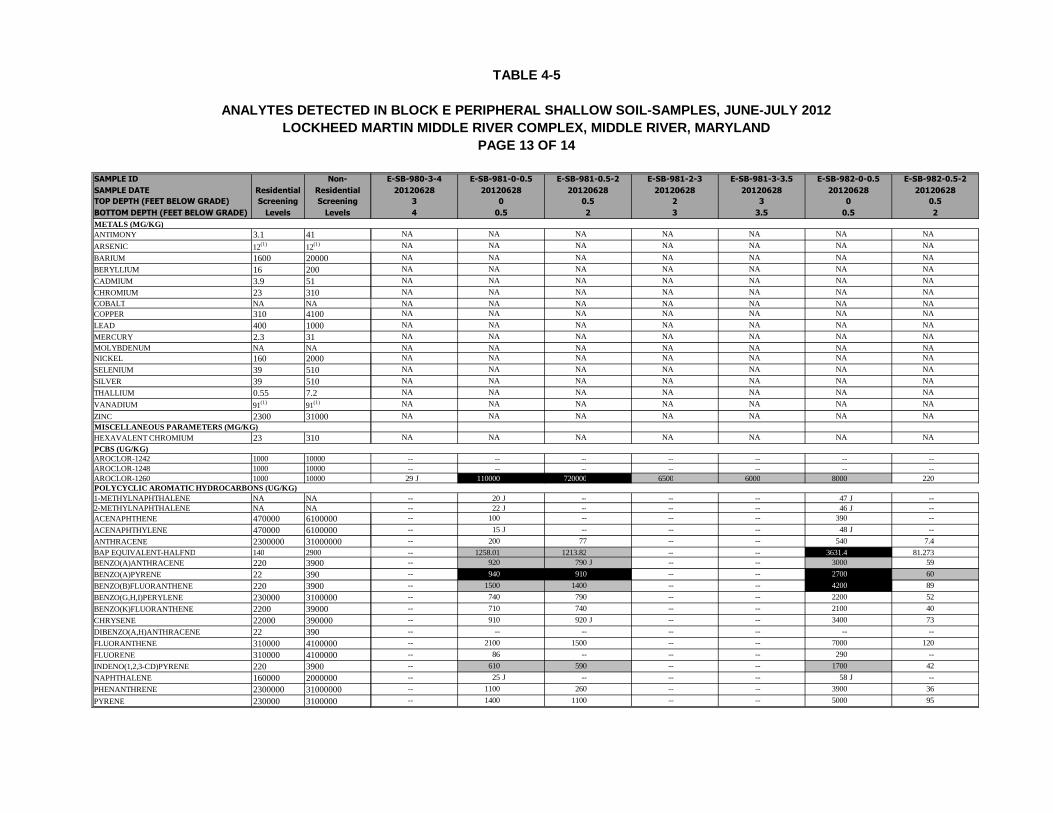
TABLE 4-5
ANALYTES DETECTED IN BLOCK E PERIPHERAL SHALLOW SOIL-SAMPLES, JUNE-JULY 2012
LOCKHEED MARTIN MIDDLE RIVER COMPLEX, MIDDLE RIVER, MARYLAND
PAGE 13 OF 14
SAMPLE ID Non-
SAMPLE DATE Residential Residential
TOP DEPTH (FEET BELOW GRADE) Screening Screening
BOTTOM DEPTH (FEET BELOW GRADE) Levels Levels
METALS (MG/KG)
ANTIMONY 3.1 41
ARSENIC 12(1) 12(1)
BARIUM 1600 20000
BERYLLIUM 16 200
CADMIUM 3.9 51
CHROMIUM 23 310COBALT NA NA
COPPER 310 4100
LEAD 400 1000
MERCURY 2.3 31MOLYBDENUM NA NA
NICKEL 160 2000
SELENIUM 39 510
SILVER 39 510
THALLIUM 0.55 7.2
VANADIUM 91(1) 91(1)
ZINC 2300 31000
HEXAVALENT CHROMIUM 23 310PCBS (UG/KG)AROCLOR-1242 1000 10000AROCLOR-1248 1000 10000AROCLOR-1260 1000 10000
1-METHYLNAPHTHALENE NA NA2-METHYLNAPHTHALENE NA NA
ACENAPHTHENE 470000 6100000
ACENAPHTHYLENE 470000 6100000
ANTHRACENE 2300000 31000000BAP EQUIVALENT-HALFND 140 2900
BENZO(A)ANTHRACENE 220 3900
BENZO(A)PYRENE 22 390
BENZO(B)FLUORANTHENE 220 3900
BENZO(G,H,I)PERYLENE 230000 3100000
BENZO(K)FLUORANTHENE 2200 39000
CHRYSENE 22000 390000
DIBENZO(A,H)ANTHRACENE 22 390
FLUORANTHENE 310000 4100000
FLUORENE 310000 4100000
INDENO(1,2,3-CD)PYRENE 220 3900
NAPHTHALENE 160000 2000000
PHENANTHRENE 2300000 31000000
PYRENE 230000 3100000
POLYCYCLIC AROMATIC HYDROCARBONS (UG/KG)
MISCELLANEOUS PARAMETERS (MG/KG)
NA NA NA NA NA NA NA
NA NA NA NA NA NA NA
NA NA NA NA NA NA NA
NA NA NA NA NA NA NA
NA NA NA NA NA NA NA
NA NA NA NA NA NA NA
NA NA NA NA NA NA NANA NA NA NA NA NA NA
NA NA NA NA NA NA NA
NA NA NA NA NA NA NA
NA NA NA NA NA NA NANA NA NA NA NA NA NA
NA NA NA NA NA NA NA
NA NA NA NA NA NA NA
NA NA NA NA NA NA NA
NA NA NA NA NA NA NA
NA NA NA NA NA NA NA
NA NA NA NA NA NA NA
-- -- -- -- -- -- ---- -- -- -- -- -- --
29 J 110000 720000 6500 6000 8000 220
-- 20 J -- -- -- 47 J ---- 22 J -- -- -- 46 J ---- 100 -- -- -- 390 --
-- 15 J -- -- -- 48 J --
-- 200 77 -- -- 540 7.4
-- 1258.01 1213.82 -- -- 3631.4 81.273-- 920 790 J -- -- 3000 59
-- 940 910 -- -- 2700 60
-- 1500 1400 -- -- 4200 89
-- 740 790 -- -- 2200 52
-- 710 740 -- -- 2100 40
-- 910 920 J -- -- 3400 73
-- -- -- -- -- -- --
-- 2100 1500 -- -- 7000 120
-- 86 -- -- -- 290 --
-- 610 590 -- -- 1700 42
-- 25 J -- -- -- 58 J --
-- 1100 260 -- -- 3900 36
-- 1400 1100 -- -- 5000 95
E-SB-981-0.5-2E-SB-981-0-0.5 E-SB-981-2-3
20120628 20120628
E-SB-980-3-4
20120628
3 0.5
E-SB-981-3-3.5 E-SB-982-0.5-2E-SB-982-0-0.5
3 0.50 2
20120628 20120628 20120628 20120628
4 20.5 3 3.5 20.5
0
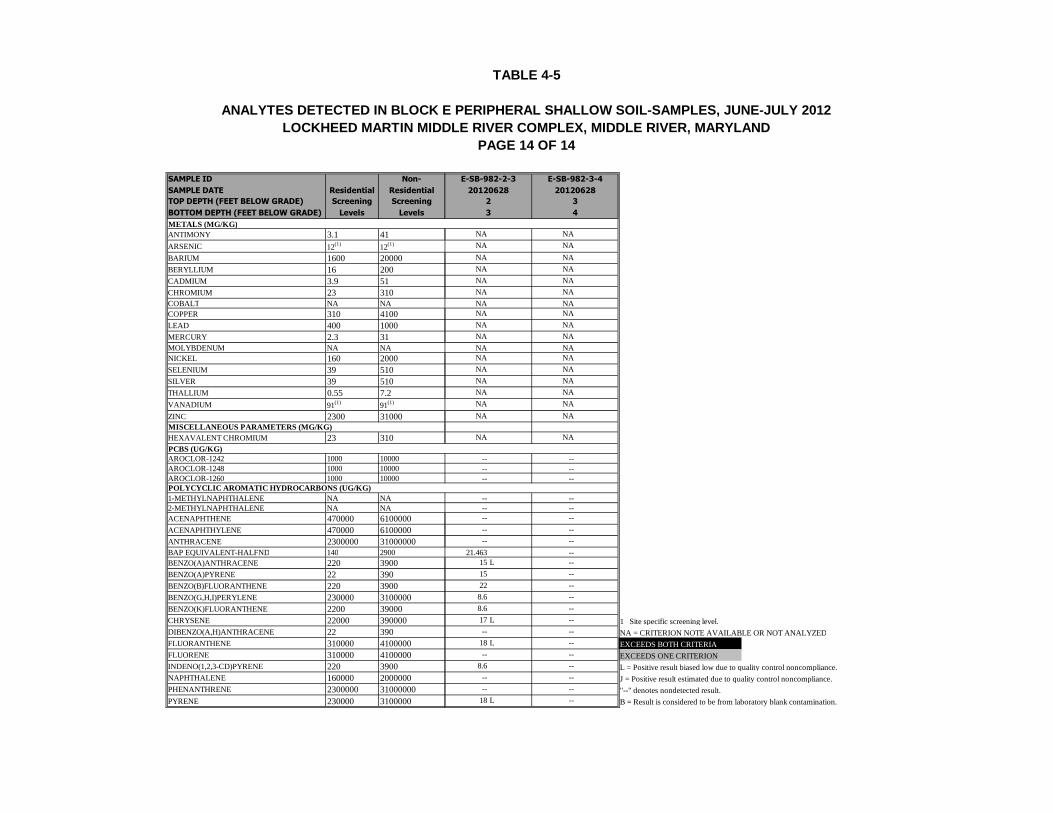
TABLE 4-5
ANALYTES DETECTED IN BLOCK E PERIPHERAL SHALLOW SOIL-SAMPLES, JUNE-JULY 2012
LOCKHEED MARTIN MIDDLE RIVER COMPLEX, MIDDLE RIVER, MARYLAND
PAGE 14 OF 14
SAMPLE ID Non-
SAMPLE DATE Residential Residential
TOP DEPTH (FEET BELOW GRADE) Screening Screening
BOTTOM DEPTH (FEET BELOW GRADE) Levels Levels
METALS (MG/KG)
ANTIMONY 3.1 41
ARSENIC 12(1) 12(1)
BARIUM 1600 20000
BERYLLIUM 16 200
CADMIUM 3.9 51
CHROMIUM 23 310COBALT NA NA
COPPER 310 4100
LEAD 400 1000
MERCURY 2.3 31MOLYBDENUM NA NA
NICKEL 160 2000
SELENIUM 39 510
SILVER 39 510
THALLIUM 0.55 7.2
VANADIUM 91(1) 91(1)
ZINC 2300 31000
HEXAVALENT CHROMIUM 23 310PCBS (UG/KG)AROCLOR-1242 1000 10000AROCLOR-1248 1000 10000AROCLOR-1260 1000 10000
1-METHYLNAPHTHALENE NA NA2-METHYLNAPHTHALENE NA NA
ACENAPHTHENE 470000 6100000
ACENAPHTHYLENE 470000 6100000
ANTHRACENE 2300000 31000000BAP EQUIVALENT-HALFND 140 2900
BENZO(A)ANTHRACENE 220 3900
BENZO(A)PYRENE 22 390
BENZO(B)FLUORANTHENE 220 3900
BENZO(G,H,I)PERYLENE 230000 3100000
BENZO(K)FLUORANTHENE 2200 39000
CHRYSENE 22000 390000
DIBENZO(A,H)ANTHRACENE 22 390
FLUORANTHENE 310000 4100000
FLUORENE 310000 4100000
INDENO(1,2,3-CD)PYRENE 220 3900
NAPHTHALENE 160000 2000000
PHENANTHRENE 2300000 31000000
PYRENE 230000 3100000
POLYCYCLIC AROMATIC HYDROCARBONS (UG/KG)
MISCELLANEOUS PARAMETERS (MG/KG)
NA NA
NA NA
NA NA
NA NA
NA NA
NA NA
NA NANA NA
NA NA
NA NA
NA NANA NA
NA NA
NA NA
NA NA
NA NA
NA NA
NA NA
-- ---- ---- --
-- ---- ---- --
-- --
-- --
21.463 --15 L --
15 --
22 --
8.6 --
8.6 --
17 L -- 1 Site specific screening level.-- -- NA = CRITERION NOTE AVAILABLE OR NOT ANALYZED
18 L -- EXCEEDS BOTH CRITERIA-- -- EXCEEDS ONE CRITERION
8.6 -- L = Positive result biased low due to quality control noncompliance.-- -- J = Positive result estimated due to quality control noncompliance.-- -- "--" denotes nondetected result.
18 L -- B = Result is considered to be from laboratory blank contamination.
E-SB-982-3-4
20120628
E-SB-982-2-3
20120628
3
43
2
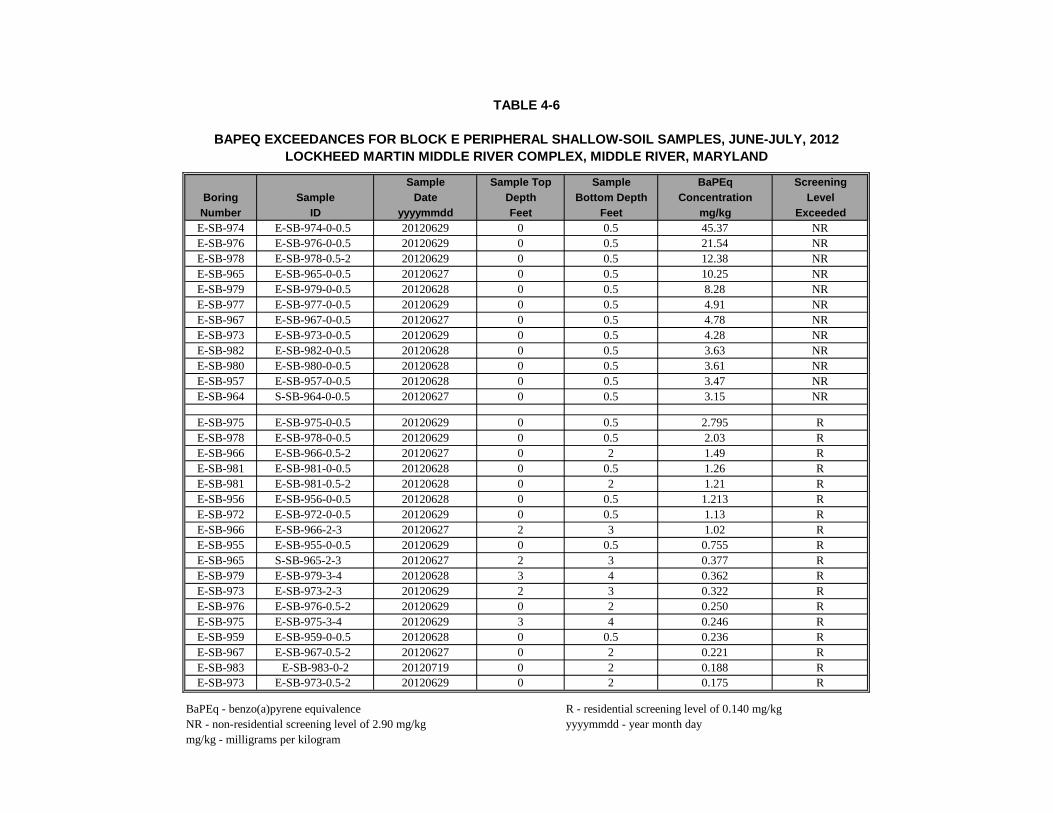
TABLE 4-6
BAPEQ EXCEEDANCES FOR BLOCK E PERIPHERAL SHALLOW-SOIL SAMPLES, JUNE-JULY, 2012
LOCKHEED MARTIN MIDDLE RIVER COMPLEX, MIDDLE RIVER, MARYLAND
Sample Sample Top Sample BaPEq Screening
Boring Sample Date Depth Bottom Depth Concentration Level
Number ID yyyymmdd Feet Feet mg/kg Exceeded
E-SB-974 E-SB-974-0-0.5 20120629 0 0.5 45.37 NR
E-SB-976 E-SB-976-0-0.5 20120629 0 0.5 21.54 NR
E-SB-978 E-SB-978-0.5-2 20120629 0 0.5 12.38 NR
E-SB-965 E-SB-965-0-0.5 20120627 0 0.5 10.25 NR
E-SB-979 E-SB-979-0-0.5 20120628 0 0.5 8.28 NR
E-SB-977 E-SB-977-0-0.5 20120629 0 0.5 4.91 NR
E-SB-967 E-SB-967-0-0.5 20120627 0 0.5 4.78 NR
E-SB-973 E-SB-973-0-0.5 20120629 0 0.5 4.28 NR
E-SB-982 E-SB-982-0-0.5 20120628 0 0.5 3.63 NR
E-SB-980 E-SB-980-0-0.5 20120628 0 0.5 3.61 NR
E-SB-957 E-SB-957-0-0.5 20120628 0 0.5 3.47 NR
E-SB-964 S-SB-964-0-0.5 20120627 0 0.5 3.15 NR
E-SB-975 E-SB-975-0-0.5 20120629 0 0.5 2.795 R
E-SB-978 E-SB-978-0-0.5 20120629 0 0.5 2.03 R
E-SB-966 E-SB-966-0.5-2 20120627 0 2 1.49 R
E-SB-981 E-SB-981-0-0.5 20120628 0 0.5 1.26 R
E-SB-981 E-SB-981-0.5-2 20120628 0 2 1.21 R
E-SB-956 E-SB-956-0-0.5 20120628 0 0.5 1.213 R
E-SB-972 E-SB-972-0-0.5 20120629 0 0.5 1.13 R
E-SB-966 E-SB-966-2-3 20120627 2 3 1.02 R
E-SB-955 E-SB-955-0-0.5 20120629 0 0.5 0.755 R
E-SB-965 S-SB-965-2-3 20120627 2 3 0.377 R
E-SB-979 E-SB-979-3-4 20120628 3 4 0.362 R
E-SB-973 E-SB-973-2-3 20120629 2 3 0.322 R
E-SB-976 E-SB-976-0.5-2 20120629 0 2 0.250 R
E-SB-975 E-SB-975-3-4 20120629 3 4 0.246 R
E-SB-959 E-SB-959-0-0.5 20120628 0 0.5 0.236 R
E-SB-967 E-SB-967-0.5-2 20120627 0 2 0.221 R
E-SB-983 E-SB-983-0-2 20120719 0 2 0.188 R
E-SB-973 E-SB-973-0.5-2 20120629 0 2 0.175 R
BaPEq - benzo(a)pyrene equivalence R - residential screening level of 0.140 mg/kg
NR - non-residential screening level of 2.90 mg/kg yyyymmdd - year month day
mg/kg - milligrams per kilogram
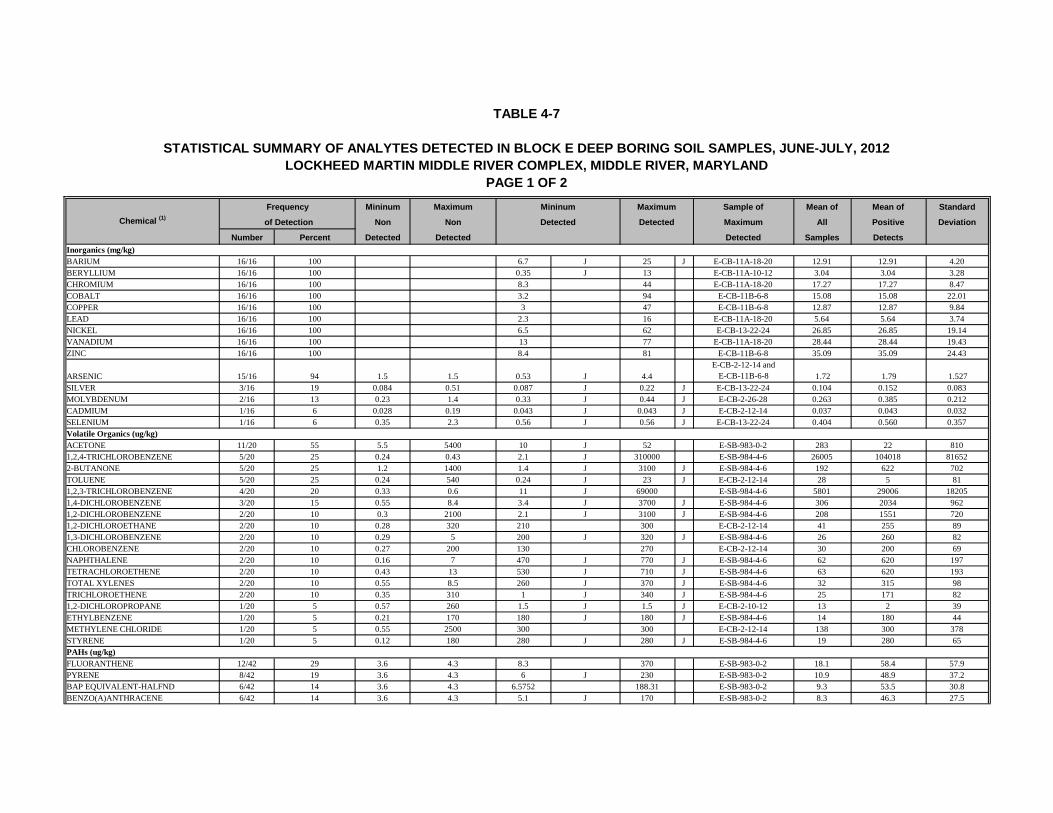
TABLE 4-7
STATISTICAL SUMMARY OF ANALYTES DETECTED IN BLOCK E DEEP BORING SOIL SAMPLES, JUNE-JULY, 2012
LOCKHEED MARTIN MIDDLE RIVER COMPLEX, MIDDLE RIVER, MARYLAND
PAGE 1 OF 2
Frequency Mininum Maximum Mininum Maximum Sample of Mean of Mean of Standard
Chemical (1)of Detection Non Non Detected Detected Maximum All Positive Deviation
Number Percent Detected Detected Detected Samples Detects
Inorganics (mg/kg)
BARIUM 16/16 100 6.7 J 25 J E-CB-11A-18-20 12.91 12.91 4.20
BERYLLIUM 16/16 100 0.35 J 13 E-CB-11A-10-12 3.04 3.04 3.28
CHROMIUM 16/16 100 8.3 44 E-CB-11A-18-20 17.27 17.27 8.47
COBALT 16/16 100 3.2 94 E-CB-11B-6-8 15.08 15.08 22.01
COPPER 16/16 100 3 47 E-CB-11B-6-8 12.87 12.87 9.84
LEAD 16/16 100 2.3 16 E-CB-11A-18-20 5.64 5.64 3.74
NICKEL 16/16 100 6.5 62 E-CB-13-22-24 26.85 26.85 19.14
VANADIUM 16/16 100 13 77 E-CB-11A-18-20 28.44 28.44 19.43
ZINC 16/16 100 8.4 81 E-CB-11B-6-8 35.09 35.09 24.43
ARSENIC 15/16 94 1.5 1.5 0.53 J 4.4
E-CB-2-12-14 and
E-CB-11B-6-8 1.72 1.79 1.527
SILVER 3/16 19 0.084 0.51 0.087 J 0.22 J E-CB-13-22-24 0.104 0.152 0.083
MOLYBDENUM 2/16 13 0.23 1.4 0.33 J 0.44 J E-CB-2-26-28 0.263 0.385 0.212
CADMIUM 1/16 6 0.028 0.19 0.043 J 0.043 J E-CB-2-12-14 0.037 0.043 0.032
SELENIUM 1/16 6 0.35 2.3 0.56 J 0.56 J E-CB-13-22-24 0.404 0.560 0.357
Volatile Organics (ug/kg)
ACETONE 11/20 55 5.5 5400 10 J 52 E-SB-983-0-2 283 22 810
1,2,4-TRICHLOROBENZENE 5/20 25 0.24 0.43 2.1 J 310000 E-SB-984-4-6 26005 104018 81652
2-BUTANONE 5/20 25 1.2 1400 1.4 J 3100 J E-SB-984-4-6 192 622 702
TOLUENE 5/20 25 0.24 540 0.24 J 23 J E-CB-2-12-14 28 5 81
1,2,3-TRICHLOROBENZENE 4/20 20 0.33 0.6 11 J 69000 E-SB-984-4-6 5801 29006 18205
1,4-DICHLOROBENZENE 3/20 15 0.55 8.4 3.4 J 3700 J E-SB-984-4-6 306 2034 962
1,2-DICHLOROBENZENE 2/20 10 0.3 2100 2.1 J 3100 J E-SB-984-4-6 208 1551 720
1,2-DICHLOROETHANE 2/20 10 0.28 320 210 300 E-CB-2-12-14 41 255 89
1,3-DICHLOROBENZENE 2/20 10 0.29 5 200 J 320 J E-SB-984-4-6 26 260 82
CHLOROBENZENE 2/20 10 0.27 200 130 270 E-CB-2-12-14 30 200 69
NAPHTHALENE 2/20 10 0.16 7 470 J 770 J E-SB-984-4-6 62 620 197
TETRACHLOROETHENE 2/20 10 0.43 13 530 J 710 J E-SB-984-4-6 63 620 193
TOTAL XYLENES 2/20 10 0.55 8.5 260 J 370 J E-SB-984-4-6 32 315 98
TRICHLOROETHENE 2/20 10 0.35 310 1 J 340 J E-SB-984-4-6 25 171 82
1,2-DICHLOROPROPANE 1/20 5 0.57 260 1.5 J 1.5 J E-CB-2-10-12 13 2 39
ETHYLBENZENE 1/20 5 0.21 170 180 J 180 J E-SB-984-4-6 14 180 44
METHYLENE CHLORIDE 1/20 5 0.55 2500 300 300 E-CB-2-12-14 138 300 378
STYRENE 1/20 5 0.12 180 280 J 280 J E-SB-984-4-6 19 280 65
PAHs (ug/kg)
FLUORANTHENE 12/42 29 3.6 4.3 8.3 370 E-SB-983-0-2 18.1 58.4 57.9
PYRENE 8/42 19 3.6 4.3 6 J 230 E-SB-983-0-2 10.9 48.9 37.2
BAP EQUIVALENT-HALFND 6/42 14 3.6 4.3 6.5752 188.31 E-SB-983-0-2 9.3 53.5 30.8
BENZO(A)ANTHRACENE 6/42 14 3.6 4.3 5.1 J 170 E-SB-983-0-2 8.3 46.3 27.5

TABLE 4-7
STATISTICAL SUMMARY OF ANALYTES DETECTED IN BLOCK E DEEP BORING SOIL SAMPLES, JUNE-JULY, 2012
LOCKHEED MARTIN MIDDLE RIVER COMPLEX, MIDDLE RIVER, MARYLAND
PAGE 2 OF 2
Frequency Mininum Maximum Mininum Maximum Sample of Mean of Mean of Standard
Chemical (1)of Detection Non Non Detected Detected Maximum All Positive Deviation
Number Percent Detected Detected Detected Samples Detects
BENZO(B)FLUORANTHENE 6/42 14 3.6 4.3 5.4 J 190 E-SB-983-0-2 9.4 53.7 31.6
CHRYSENE 6/42 14 1.2 1.4 5.7 J 160 E-SB-983-0-2 7.4 48.0 27.4
INDENO(1,2,3-CD)PYRENE 6/42 14 3.6 4.3 11 92 E-SB-983-0-2 6.3 32.7 15.2
BENZO(A)PYRENE 5/42 12 3.6 4.3 4.3 J 140 E-SB-983-0-2 7.1 45.1 22.7
BENZO(G,H,I)PERYLENE 5/42 12 3.6 4.3 4.8 J 93 E-SB-983-0-2 5.8 34.0 15.9
PHENANTHRENE 5/42 12 3.6 4.3 12 160 E-SB-983-0-2 7.1 45.2 24.6
BENZO(K)FLUORANTHENE 4/42 10 3.6 4.3 7.7 J 100 E-SB-983-0-2 5.7 41.2 16.4
ANTHRACENE 2/42 5 3.6 4.3 9.2 33 E-SB-983-0-2 2.9 21.1 4.9
NAPHTHALENE 2/42 5 3.6 4.3 4.7 J 18 E-CB-2-38-40 2.4 11.4 2.5
ACENAPHTHENE 1/42 2 3.6 4.3 15 15 E-SB-983-0-2 2.3 15.0 2.0
FLUORENE 1/42 2 3.6 4.3 9.5 9.5 E-SB-983-0-2 2.1 9.5 1.2
PCBs (ug/kg)
AROCLOR-1260 17/93 18 19 25 32 J 1700000 E-SB-984-4-6 24884 136086 182891
Petroleum Hydrocarbons
TPH-GRO (C06-C10) (ug/kg) 1/18 6 50 UJ 20000 U 180 180 E-CB-2-12-14 623 180 2417
TPH-DRO (C10-C32) (mg/kg) 1/18 6 10 UJ 1000 B 11 J 11 J E-CB-11A-10-12 55 11 141
1 Chemicals not detected in any of the samples are not shown on this table.
B = Result considered to be from laboratory blank contamination.
J = Positive result estimated due to quality control noncompliance.
UJ = Analyte not detected. Detection limit is estimated due to technical noncompliance.
mg/kg - milligrams per kilogram
ug/kg - micrograms per kilogram
Footnotes:
For non-detects, 1/2 sample quantitation limit was used as a proxy concentration.
1/2 the detection limit was used for B qualified data.
Associated Samples
E-CB-11A-0-2 20120720 E-CB-13-0-2 20120720 E-CB-11B-0-2 20120719 E-CB-2-0-2 20120719 E-SB-983-0-2 20120719 E-SB-984-0-2 20120724
E-CB-11A-2-4 20120720 E-CB-13-2-4 20120720 E-CB-11B-2-4 20120719 E-CB-2-2-4 20120719 E-SB-983-2-4 20120719 E-SB-984-2-4 20120724
E-CB-11A-4-6 20120720 E-CB-13-4-6 20120720 E-CB-11B-4-6 20120719 E-CB-2-4-6 20120719 E-SB-983-4-6 20120719 E-SB-984-4-6 20120724
E-CB-11A-6-8 20120720 E-CB-13-6-8 20120720 E-CB-11B-6-8 20120719 E-CB-2-6-8 20120719 E-SB-983-6-8 20120719 E-SB-984-6-8 20120724
E-CB-11A-8-10 20120720 E-CB-13-8-10 20120720 E-CB-11B-8-10 20120719 E-CB-2-8-10 20120719 E-SB-983-8-10 20120719 E-SB-984-8-10 20120724
E-CB-11A-10-12 20120720 E-CB-13-10-12 20120720 E-CB-11B-12-14 20120719 E-CB-2-10-12 20120719 E-SB-983-10-12 20120719 E-SB-984-10-12 20120724
E-CB-11A-12-14 20120720 E-CB-13-14-16 20120720 E-CB-11B-16-18 20120719 E-CB-2-12-14 20120719 E-SB-983-12-14 20120719 E-SB-984-12-14 20120724
E-CB-11A-16-18 20120720 E-CB-13-18-20 20120720 E-CB-11B-18-20 20120719 E-CB-2-16-18 20120719 E-SB-983-14-16 20120719 E-SB-984-14-16 20120724
E-CB-11A-18-20 20120720 E-CB-13-22-24 20120720 E-CB-11B-22-24 20120719 E-CB-2-22-24 20120719 E-SB-983-16-18 20120719 E-SB-984-16-18 20120724
E-CB-11A-22-24 20120720 E-CB-13-24-26 20120720 E-CB-11B-26-28 20120719 E-CB-2-26-28 20120719 E-SB-983-18-20 20120719 E-SB-984-18-20 20120724
E-CB-11A-26-28 20120720 E-CB-13-28-30 20120720 E-CB-11B-28-30 20120719 E-CB-2-28-30 20120719 E-SB-983-22-24 20120719 E-SB-984-22-24 20120724
E-CB-11A-32-34 20120720 E-CB-13-32-34 20120720 E-CB-11B-32-34 20120719 E-CB-2-32-34 20120719 E-SB-983-26-28 20120719 E-SB-984-26-28 20120724
E-CB-11A-36-38 20120720 E-CB-13-36-38 20120720 E-CB-11B-36-38 20120719 E-CB-2-36-38 20120719 E-SB-983-32-34 20120719 E-SB-984-32-34 20120724
E-CB-11A-38-40 20120720 E-CB-13-38-40 20120720 E-CB-11B-38-40 20120719 E-CB-2-38-40 20120719 E-SB-983-36-38 20120719 E-SB-984-36-38 20120724
E-CB-11A-42-44 20120720 E-CB-13-40-42 20120720 E-CB-2-42-44 20120719
E-CB-11A-46-48 20120720 E-CB-13-42-44 20120720 E-CB-2-46-48 20120719
E-CB-11A-48-50 20120720 E-CB-13-44-46 20120720 E-CB-2-48-50 20120719

TABLE 4-8
ANALYTES DETECTED IN BLOCK E DEEP BORING SOIL SAMPLES, JUNE-JULY 2012
LOCKHEED MARTIN MIDDLE RIVER COMPLEX, MIDDLE RIVER, MARYLAND
PAGE 1 OF 32
SAMPLE ID Non-
SAMPLE DATE Residential Residential
TOP DEPTH (FEET BELOW GRADE) Screening Screening
BOTTOM DEPTH (FEET BELOW GRADE) Levels Levels
METALS (MG/KG)
ARSENIC 12(1)
12(1) NA NA NA NA NA NA
BARIUM 1600 20000 NA NA NA NA NA NA
BERYLLIUM 16 200 NA NA NA NA NA NA
CADMIUM 3.9 51 NA NA NA NA NA NA
CHROMIUM 23 310 NA NA NA NA NA NA
COBALT NA NA NA NA NA NA NA NA
COPPER 310 4100 NA NA NA NA NA NA
LEAD 400 1000 NA NA NA NA NA NA
MOLYBDENUM NA NA NA NA NA NA NA NA
NICKEL 160 2000 NA NA NA NA NA NA
SELENIUM 39 510 NA NA NA NA NA NA
SILVER 39 510 NA NA NA NA NA NA
VANADIUM 91(1)
91(1) NA NA NA NA NA NA
ZINC 2300 31000 NA NA NA NA NA NA
PCBS (UG/KG)AROCLOR-1260 1000 10000 70 -- -- -- -- --
TPH-DRO 230 620 NA NA NA NA NA NA
TPH-GRO 230000 620000 NA NA NA NA NA NA
ACENAPHTHENE 470000 6100000 -- -- -- -- -- NA
ANTHRACENE 2300000 31000000 -- -- -- -- -- NA
BAP EQUIVALENT-HALFND 140(1)
2900(1) 9.2772 -- -- -- -- NA
BENZO(A)ANTHRACENE 220 3900 5.5 J -- -- -- -- NA
BENZO(A)PYRENE 22 390 4.3 J -- -- -- -- NA
BENZO(B)FLUORANTHENE 220 3900 7 J -- -- -- -- NA
BENZO(G,H,I)PERYLENE 230000 3100000 4.8 J -- -- -- -- NA
BENZO(K)FLUORANTHENE 2200 39000 -- -- -- -- -- NA
CHRYSENE 22000 390000 7.2 J -- -- -- -- NA
FLUORANTHENE 310000 4100000 31 -- -- -- -- NA
FLUORENE 310000 4100000 -- -- -- -- -- NA
INDENO(1,2,3-CD)PYRENE 220 3900 17 -- -- -- -- NA
NAPHTHALENE 160000 2000000 -- -- -- -- -- NA
PHENANTHRENE 2300000 31000000 12 -- -- -- -- NA
PYRENE 230000 3100000 8 J -- -- -- -- NA
POLYCYCLIC AROMATIC HYDROCARBONS (UG/KG)
PETROLEUM HYDROCARBONS (UG/KG)
PETROLEUM HYDROCARBONS (MG/KG)
E-CB-2-0-2 E-CB-2-10-12E-CB-2-4-6 E-CB-2-6-8E-CB-2-2-4 E-CB-2-8-10
20120719 201207192012071920120719 20120719 20120719
0 102 4 6 8
2 1264 8 10

TABLE 4-8
ANALYTES DETECTED IN BLOCK E DEEP BORING SOIL SAMPLES, JUNE-JULY 2012
LOCKHEED MARTIN MIDDLE RIVER COMPLEX, MIDDLE RIVER, MARYLAND
PAGE 2 OF 32
SAMPLE ID Non-
SAMPLE DATE Residential Residential
TOP DEPTH (FEET BELOW GRADE) Screening Screening
BOTTOM DEPTH (FEET BELOW GRADE) Levels Levels
E-CB-2-0-2 E-CB-2-10-12E-CB-2-4-6 E-CB-2-6-8E-CB-2-2-4 E-CB-2-8-10
20120719 201207192012071920120719 20120719 20120719
0 102 4 6 8
2 1264 8 10
VOLATILES (UG/KG)1,2,3-TRICHLOROBENZENE 29000 NA NA NA NA NA NA 13
1,2,4-TRICHLOROBENZENE 38000 175000 NA NA NA NA NA 51
1,2-DICHLOROBENZENE 700000 9200000 NA NA NA NA NA 2.1 J
1,2-DICHLOROETHANE 7000 31000 NA NA NA NA NA 210
1,2-DICHLOROPROPANE 9400 42000 NA NA NA NA NA 1.5 J
1,3-DICHLOROBENZENE 23000 310000 NA NA NA NA NA --
1,4-DICHLOROBENZENE 31000 NA NA NA NA NA NA 3.4 J
1-BUTANOL NA NA NA NA NA NA NA NA
2-BUTANONE 4700000 61000000 NA NA NA NA NA --
ACETONE 7000000 92000000 NA NA NA NA NA --
CHLOROBENZENE 160000 2000000 NA NA NA NA NA 130
CYCLOHEXANONE NA NA NA NA NA NA NA NA
DIETHYL ETHER NA NA NA NA NA NA NA NA
ETHYLBENZENE 780000 10000000 NA NA NA NA NA --
HEXANE NA NA NA NA NA NA NA NA
METHYL ACETATE NA NA NA NA NA NA NA NA
METHYLENE CHLORIDE 85000 380000 NA NA NA NA NA --
NAPHTHALENE 160000 2000000 NA NA NA NA NA --
STYRENE 1600000 20000000 NA NA NA NA NA --
TETRACHLOROETHENE 1200 5300 NA NA NA NA NA --
TOLUENE 630000 8200000 NA NA NA NA NA --
TOTAL XYLENES 1600000 20000000 NA NA NA NA NA --
TRANS-1,4-DICHLORO-2-BUTENE NA NA NA NA NA NA NA NA
TRICHLOROETHENE 1600 7200 NA NA NA NA NA 1 J

TABLE 4-8
ANALYTES DETECTED IN BLOCK E DEEP BORING SOIL SAMPLES, JUNE-JULY 2012
LOCKHEED MARTIN MIDDLE RIVER COMPLEX, MIDDLE RIVER, MARYLAND
PAGE 3 OF 32
SAMPLE ID Non-
SAMPLE DATE Residential Residential
TOP DEPTH (FEET BELOW GRADE) Screening Screening
BOTTOM DEPTH (FEET BELOW GRADE) Levels Levels
METALS (MG/KG)
ARSENIC 12(1)
12(1)
BARIUM 1600 20000
BERYLLIUM 16 200
CADMIUM 3.9 51
CHROMIUM 23 310
COBALT NA NA
COPPER 310 4100
LEAD 400 1000
MOLYBDENUM NA NA
NICKEL 160 2000
SELENIUM 39 510
SILVER 39 510
VANADIUM 91(1)
91(1)
ZINC 2300 31000PCBS (UG/KG)AROCLOR-1260 1000 10000
TPH-DRO 230 620
TPH-GRO 230000 620000
ACENAPHTHENE 470000 6100000
ANTHRACENE 2300000 31000000
BAP EQUIVALENT-HALFND 140(1)
2900(1)
BENZO(A)ANTHRACENE 220 3900
BENZO(A)PYRENE 22 390
BENZO(B)FLUORANTHENE 220 3900
BENZO(G,H,I)PERYLENE 230000 3100000
BENZO(K)FLUORANTHENE 2200 39000
CHRYSENE 22000 390000
FLUORANTHENE 310000 4100000
FLUORENE 310000 4100000
INDENO(1,2,3-CD)PYRENE 220 3900
NAPHTHALENE 160000 2000000
PHENANTHRENE 2300000 31000000
PYRENE 230000 3100000
POLYCYCLIC AROMATIC HYDROCARBONS (UG/KG)
PETROLEUM HYDROCARBONS (UG/KG)
PETROLEUM HYDROCARBONS (MG/KG)
4.4 NA NA 0.53 J NA NA
13 J NA NA 12 J NA NA
2.7 NA NA 1 NA NA
0.043 J NA NA -- NA NA
19 NA NA 17 NA NA
14 NA NA 4 NA NA
12 NA NA 3 NA NA
6.1 NA NA 2.8 NA NA
-- NA NA 0.44 J NA NA
39 NA NA 13 NA NA
-- NA NA -- NA NA
0.15 J NA NA 0.087 J NA NA
29 NA NA 13 NA NA
44 NA NA 8.4 NA NA
-- -- -- -- -- --
13 B NA NA 14 B NA NA
180 NA NA -- NA NA
-- NA NA -- NA NA
-- NA NA -- NA NA
-- NA NA -- NA NA
-- NA NA -- NA NA
-- NA NA -- NA NA
-- NA NA -- NA NA
-- NA NA -- NA NA
-- NA NA -- NA NA
-- NA NA -- NA NA
-- NA NA -- NA NA
-- NA NA -- NA NA
-- NA NA -- NA NA
-- NA NA -- NA NA
-- NA NA -- NA NA
-- NA NA -- NA NA
E-CB-2-12-14 E-CB-2-16-18 E-CB-2-22-24 E-CB-2-26-28 E-CB-2-28-30 E-CB-2-32-34
20120719 20120719 20120719 20120719 20120719 20120719
12 16 26 28 3222
14 18 24 28 30 34

TABLE 4-8
ANALYTES DETECTED IN BLOCK E DEEP BORING SOIL SAMPLES, JUNE-JULY 2012
LOCKHEED MARTIN MIDDLE RIVER COMPLEX, MIDDLE RIVER, MARYLAND
PAGE 4 OF 32
SAMPLE ID Non-
SAMPLE DATE Residential Residential
TOP DEPTH (FEET BELOW GRADE) Screening Screening
BOTTOM DEPTH (FEET BELOW GRADE) Levels Levels
VOLATILES (UG/KG)1,2,3-TRICHLOROBENZENE 29000 NA
1,2,4-TRICHLOROBENZENE 38000 175000
1,2-DICHLOROBENZENE 700000 9200000
1,2-DICHLOROETHANE 7000 31000
1,2-DICHLOROPROPANE 9400 42000
1,3-DICHLOROBENZENE 23000 3100001,4-DICHLOROBENZENE 31000 NA
1-BUTANOL NA NA
2-BUTANONE 4700000 61000000
ACETONE 7000000 92000000
CHLOROBENZENE 160000 2000000CYCLOHEXANONE NA NA
DIETHYL ETHER NA NA
ETHYLBENZENE 780000 10000000HEXANE NA NA
METHYL ACETATE NA NA
METHYLENE CHLORIDE 85000 380000
NAPHTHALENE 160000 2000000
STYRENE 1600000 20000000
TETRACHLOROETHENE 1200 5300
TOLUENE 630000 8200000
TOTAL XYLENES 1600000 20000000TRANS-1,4-DICHLORO-2-BUTENE NA NA
TRICHLOROETHENE 1600 7200
E-CB-2-12-14 E-CB-2-16-18 E-CB-2-22-24 E-CB-2-26-28 E-CB-2-28-30 E-CB-2-32-34
20120719 20120719 20120719 20120719 20120719 20120719
12 16 26 28 3222
14 18 24 28 30 34
11 J NA NA -- NA NA
37 J NA NA -- NA NA
-- NA NA -- NA NA
300 NA NA -- NA NA
-- NA NA -- NA NA
-- NA NA -- NA NA
-- NA NA -- NA NA
2100 NJ NA NA NA NA NA
-- NA NA -- NA NA
-- NA NA -- NA NA
270 NA NA -- NA NA
NA NA NA NA NA NA
NA NA NA NA NA NA
-- NA NA -- NA NA
NA NA NA NA NA NA
NA NA NA NA NA NA
300 NA NA -- NA NA
-- NA NA -- NA NA
-- NA NA -- NA NA
-- NA NA -- NA NA
23 J NA NA -- NA NA
-- NA NA -- NA NA
NA NA NA NA NA NA
-- NA NA -- NA NA

TABLE 4-8
ANALYTES DETECTED IN BLOCK E DEEP BORING SOIL SAMPLES, JUNE-JULY 2012
LOCKHEED MARTIN MIDDLE RIVER COMPLEX, MIDDLE RIVER, MARYLAND
PAGE 5 OF 32
SAMPLE ID Non-
SAMPLE DATE Residential Residential
TOP DEPTH (FEET BELOW GRADE) Screening Screening
BOTTOM DEPTH (FEET BELOW GRADE) Levels Levels
METALS (MG/KG)
ARSENIC 12(1)
12(1)
BARIUM 1600 20000
BERYLLIUM 16 200
CADMIUM 3.9 51
CHROMIUM 23 310
COBALT NA NA
COPPER 310 4100
LEAD 400 1000
MOLYBDENUM NA NA
NICKEL 160 2000
SELENIUM 39 510
SILVER 39 510
VANADIUM 91(1)
91(1)
ZINC 2300 31000PCBS (UG/KG)AROCLOR-1260 1000 10000
TPH-DRO 230 620
TPH-GRO 230000 620000
ACENAPHTHENE 470000 6100000
ANTHRACENE 2300000 31000000
BAP EQUIVALENT-HALFND 140(1)
2900(1)
BENZO(A)ANTHRACENE 220 3900
BENZO(A)PYRENE 22 390
BENZO(B)FLUORANTHENE 220 3900
BENZO(G,H,I)PERYLENE 230000 3100000
BENZO(K)FLUORANTHENE 2200 39000
CHRYSENE 22000 390000
FLUORANTHENE 310000 4100000
FLUORENE 310000 4100000
INDENO(1,2,3-CD)PYRENE 220 3900
NAPHTHALENE 160000 2000000
PHENANTHRENE 2300000 31000000
PYRENE 230000 3100000
POLYCYCLIC AROMATIC HYDROCARBONS (UG/KG)
PETROLEUM HYDROCARBONS (UG/KG)
PETROLEUM HYDROCARBONS (MG/KG)
NA 0.78 J NA NA 0.55 J NA
NA 7.6 J NA NA 6.7 J NA
NA 0.68 NA NA 0.35 J NA
NA -- NA NA -- NA
NA 10 NA NA 13 NA
NA 4.3 NA NA 3.2 NA
NA 6.6 NA NA 3.9 NA
NA 2.3 NA NA 2.4 NA
NA -- NA NA -- NA
NA 10 NA NA 6.5 NA
NA -- NA NA -- NA
NA -- NA NA -- NA
NA 15 NA NA 14 NA
NA 14 NA NA 10 NA
-- -- -- -- -- --
NA 15 B NA NA 17 B NA
NA -- NA NA -- NA
NA -- NA NA -- --
NA -- NA NA -- --
NA -- NA NA -- --
NA -- NA NA -- --
NA -- NA NA -- --
NA -- NA NA -- --
NA -- NA NA -- --
NA -- NA NA -- --
NA -- NA NA -- --
NA -- NA NA -- --
NA -- NA NA -- --
NA -- NA NA -- --
NA 18 NA NA -- --
NA -- NA NA -- --
NA -- NA NA -- --
E-CB-11A-0-2
0
E-CB-2-46-48 E-CB-2-48-50E-CB-2-36-38 E-CB-2-38-40 E-CB-2-42-44
2012072020120719 2012071920120719 20120719 20120719
36 38 42 46 48
248 5038 40 44

TABLE 4-8
ANALYTES DETECTED IN BLOCK E DEEP BORING SOIL SAMPLES, JUNE-JULY 2012
LOCKHEED MARTIN MIDDLE RIVER COMPLEX, MIDDLE RIVER, MARYLAND
PAGE 6 OF 32
SAMPLE ID Non-
SAMPLE DATE Residential Residential
TOP DEPTH (FEET BELOW GRADE) Screening Screening
BOTTOM DEPTH (FEET BELOW GRADE) Levels Levels
VOLATILES (UG/KG)1,2,3-TRICHLOROBENZENE 29000 NA
1,2,4-TRICHLOROBENZENE 38000 175000
1,2-DICHLOROBENZENE 700000 9200000
1,2-DICHLOROETHANE 7000 31000
1,2-DICHLOROPROPANE 9400 42000
1,3-DICHLOROBENZENE 23000 3100001,4-DICHLOROBENZENE 31000 NA
1-BUTANOL NA NA
2-BUTANONE 4700000 61000000
ACETONE 7000000 92000000
CHLOROBENZENE 160000 2000000CYCLOHEXANONE NA NA
DIETHYL ETHER NA NA
ETHYLBENZENE 780000 10000000HEXANE NA NA
METHYL ACETATE NA NA
METHYLENE CHLORIDE 85000 380000
NAPHTHALENE 160000 2000000
STYRENE 1600000 20000000
TETRACHLOROETHENE 1200 5300
TOLUENE 630000 8200000
TOTAL XYLENES 1600000 20000000TRANS-1,4-DICHLORO-2-BUTENE NA NA
TRICHLOROETHENE 1600 7200
E-CB-11A-0-2
0
E-CB-2-46-48 E-CB-2-48-50E-CB-2-36-38 E-CB-2-38-40 E-CB-2-42-44
2012072020120719 2012071920120719 20120719 20120719
36 38 42 46 48
248 5038 40 44
NA -- NA NA -- NA
NA -- NA NA -- NA
NA -- NA NA -- NA
NA -- NA NA -- NA
NA -- NA NA -- NA
NA -- NA NA -- NA
NA -- NA NA -- NA
NA NA NA NA NA NA
NA -- NA NA 1.4 J NA
NA -- NA NA 24 NA
NA -- NA NA -- NA
NA NA NA NA NA NA
NA NA NA NA NA NA
NA -- NA NA -- NA
NA NA NA NA NA NA
NA NA NA NA NA NA
NA -- NA NA -- NA
NA -- NA NA -- NA
NA -- NA NA -- NA
NA -- NA NA -- NA
NA -- NA NA -- NA
NA -- NA NA -- NA
NA NA NA NA NA NA
NA -- NA NA -- NA
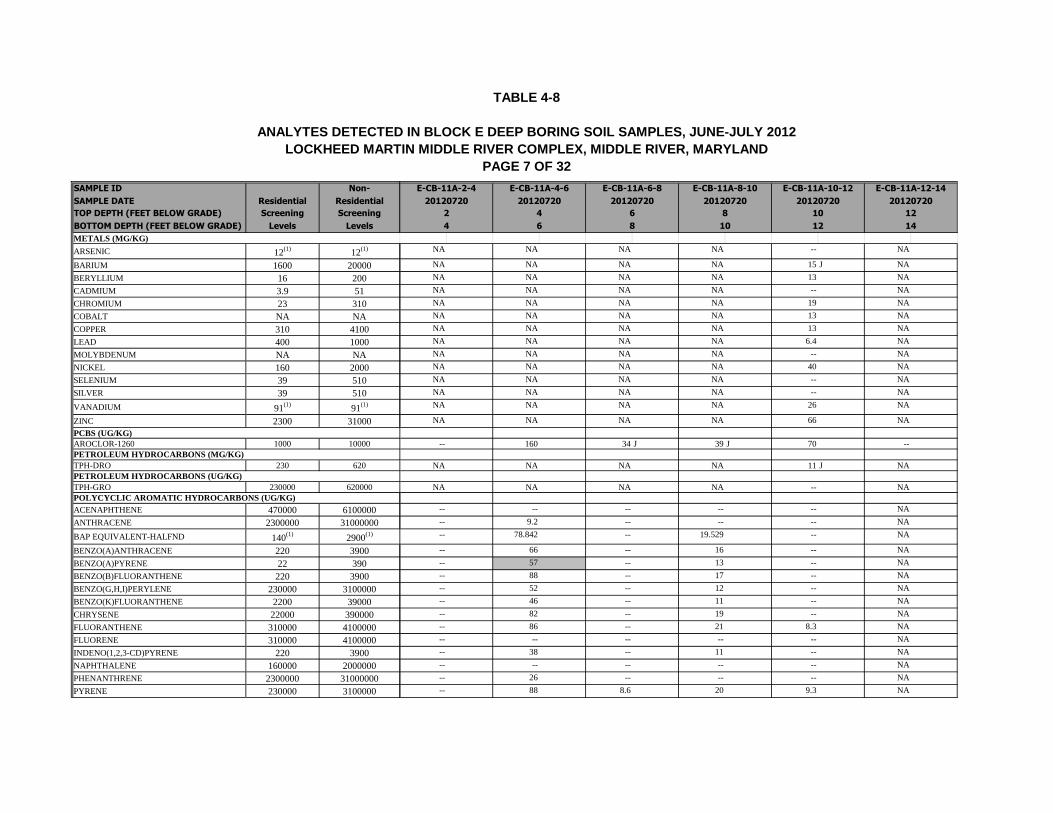
TABLE 4-8
ANALYTES DETECTED IN BLOCK E DEEP BORING SOIL SAMPLES, JUNE-JULY 2012
LOCKHEED MARTIN MIDDLE RIVER COMPLEX, MIDDLE RIVER, MARYLAND
PAGE 7 OF 32
SAMPLE ID Non-
SAMPLE DATE Residential Residential
TOP DEPTH (FEET BELOW GRADE) Screening Screening
BOTTOM DEPTH (FEET BELOW GRADE) Levels Levels
METALS (MG/KG)
ARSENIC 12(1)
12(1)
BARIUM 1600 20000
BERYLLIUM 16 200
CADMIUM 3.9 51
CHROMIUM 23 310
COBALT NA NA
COPPER 310 4100
LEAD 400 1000
MOLYBDENUM NA NA
NICKEL 160 2000
SELENIUM 39 510
SILVER 39 510
VANADIUM 91(1)
91(1)
ZINC 2300 31000PCBS (UG/KG)AROCLOR-1260 1000 10000
TPH-DRO 230 620
TPH-GRO 230000 620000
ACENAPHTHENE 470000 6100000
ANTHRACENE 2300000 31000000
BAP EQUIVALENT-HALFND 140(1)
2900(1)
BENZO(A)ANTHRACENE 220 3900
BENZO(A)PYRENE 22 390
BENZO(B)FLUORANTHENE 220 3900
BENZO(G,H,I)PERYLENE 230000 3100000
BENZO(K)FLUORANTHENE 2200 39000
CHRYSENE 22000 390000
FLUORANTHENE 310000 4100000
FLUORENE 310000 4100000
INDENO(1,2,3-CD)PYRENE 220 3900
NAPHTHALENE 160000 2000000
PHENANTHRENE 2300000 31000000
PYRENE 230000 3100000
POLYCYCLIC AROMATIC HYDROCARBONS (UG/KG)
PETROLEUM HYDROCARBONS (UG/KG)
PETROLEUM HYDROCARBONS (MG/KG)
NA NA NA NA -- NA
NA NA NA NA 15 J NA
NA NA NA NA 13 NA
NA NA NA NA -- NA
NA NA NA NA 19 NA
NA NA NA NA 13 NA
NA NA NA NA 13 NA
NA NA NA NA 6.4 NA
NA NA NA NA -- NA
NA NA NA NA 40 NA
NA NA NA NA -- NA
NA NA NA NA -- NA
NA NA NA NA 26 NA
NA NA NA NA 66 NA
-- 160 34 J 39 J 70 --
NA NA NA NA 11 J NA
NA NA NA NA -- NA
-- -- -- -- -- NA
-- 9.2 -- -- -- NA
-- 78.842 -- 19.529 -- NA
-- 66 -- 16 -- NA
-- 57 -- 13 -- NA
-- 88 -- 17 -- NA
-- 52 -- 12 -- NA
-- 46 -- 11 -- NA
-- 82 -- 19 -- NA
-- 86 -- 21 8.3 NA
-- -- -- -- -- NA
-- 38 -- 11 -- NA
-- -- -- -- -- NA
-- 26 -- -- -- NA
-- 88 8.6 20 9.3 NA
E-CB-11A-10-12 E-CB-11A-12-14E-CB-11A-2-4 E-CB-11A-4-6 E-CB-11A-6-8 E-CB-11A-8-10
20120720 20120720 2012072020120720 20120720 20120720
2 4 10 1286
12 144 6 8 10

TABLE 4-8
ANALYTES DETECTED IN BLOCK E DEEP BORING SOIL SAMPLES, JUNE-JULY 2012
LOCKHEED MARTIN MIDDLE RIVER COMPLEX, MIDDLE RIVER, MARYLAND
PAGE 8 OF 32
SAMPLE ID Non-
SAMPLE DATE Residential Residential
TOP DEPTH (FEET BELOW GRADE) Screening Screening
BOTTOM DEPTH (FEET BELOW GRADE) Levels Levels
VOLATILES (UG/KG)1,2,3-TRICHLOROBENZENE 29000 NA
1,2,4-TRICHLOROBENZENE 38000 175000
1,2-DICHLOROBENZENE 700000 9200000
1,2-DICHLOROETHANE 7000 31000
1,2-DICHLOROPROPANE 9400 42000
1,3-DICHLOROBENZENE 23000 3100001,4-DICHLOROBENZENE 31000 NA
1-BUTANOL NA NA
2-BUTANONE 4700000 61000000
ACETONE 7000000 92000000
CHLOROBENZENE 160000 2000000CYCLOHEXANONE NA NA
DIETHYL ETHER NA NA
ETHYLBENZENE 780000 10000000HEXANE NA NA
METHYL ACETATE NA NA
METHYLENE CHLORIDE 85000 380000
NAPHTHALENE 160000 2000000
STYRENE 1600000 20000000
TETRACHLOROETHENE 1200 5300
TOLUENE 630000 8200000
TOTAL XYLENES 1600000 20000000TRANS-1,4-DICHLORO-2-BUTENE NA NA
TRICHLOROETHENE 1600 7200
E-CB-11A-10-12 E-CB-11A-12-14E-CB-11A-2-4 E-CB-11A-4-6 E-CB-11A-6-8 E-CB-11A-8-10
20120720 20120720 2012072020120720 20120720 20120720
2 4 10 1286
12 144 6 8 10
NA NA NA NA -- NA
NA NA NA NA -- NA
NA NA NA NA -- NA
NA NA NA NA -- NA
NA NA NA NA -- NA
NA NA NA NA -- NA
NA NA NA NA -- NA
NA NA NA NA NA NA
NA NA NA NA -- NA
NA NA NA NA 10 J NA
NA NA NA NA -- NA
NA NA NA NA NA NA
NA NA NA NA NA NA
NA NA NA NA -- NA
NA NA NA NA NA NA
NA NA NA NA NA NA
NA NA NA NA -- NA
NA NA NA NA -- NA
NA NA NA NA -- NA
NA NA NA NA -- NA
NA NA NA NA -- NA
NA NA NA NA -- NA
NA NA NA NA NA NA
NA NA NA NA -- NA

TABLE 4-8
ANALYTES DETECTED IN BLOCK E DEEP BORING SOIL SAMPLES, JUNE-JULY 2012
LOCKHEED MARTIN MIDDLE RIVER COMPLEX, MIDDLE RIVER, MARYLAND
PAGE 9 OF 32
SAMPLE ID Non-
SAMPLE DATE Residential Residential
TOP DEPTH (FEET BELOW GRADE) Screening Screening
BOTTOM DEPTH (FEET BELOW GRADE) Levels Levels
METALS (MG/KG)
ARSENIC 12(1)
12(1)
BARIUM 1600 20000
BERYLLIUM 16 200
CADMIUM 3.9 51
CHROMIUM 23 310
COBALT NA NA
COPPER 310 4100
LEAD 400 1000
MOLYBDENUM NA NA
NICKEL 160 2000
SELENIUM 39 510
SILVER 39 510
VANADIUM 91(1)
91(1)
ZINC 2300 31000PCBS (UG/KG)AROCLOR-1260 1000 10000
TPH-DRO 230 620
TPH-GRO 230000 620000
ACENAPHTHENE 470000 6100000
ANTHRACENE 2300000 31000000
BAP EQUIVALENT-HALFND 140(1)
2900(1)
BENZO(A)ANTHRACENE 220 3900
BENZO(A)PYRENE 22 390
BENZO(B)FLUORANTHENE 220 3900
BENZO(G,H,I)PERYLENE 230000 3100000
BENZO(K)FLUORANTHENE 2200 39000
CHRYSENE 22000 390000
FLUORANTHENE 310000 4100000
FLUORENE 310000 4100000
INDENO(1,2,3-CD)PYRENE 220 3900
NAPHTHALENE 160000 2000000
PHENANTHRENE 2300000 31000000
PYRENE 230000 3100000
POLYCYCLIC AROMATIC HYDROCARBONS (UG/KG)
PETROLEUM HYDROCARBONS (UG/KG)
PETROLEUM HYDROCARBONS (MG/KG)
NA 4.3 J NA NA NA 1.7 L
NA 25 J NA NA NA 11 J
NA 5.3 NA NA NA 2.2
NA -- NA NA NA --
NA 44 NA NA NA 15
NA 25 NA NA NA 8.9
NA 14 NA NA NA 8.2
NA 16 NA NA NA 5.2
NA -- NA NA NA --
NA 60 NA NA NA 23
NA -- NA NA NA --
NA -- NA NA NA --
NA 77 NA NA NA 22
NA 59 NA NA NA 30
-- -- -- -- -- --
NA -- NA NA NA --
NA -- NA NA NA --
NA -- NA NA NA --
NA -- NA NA NA --
NA -- NA NA NA --
NA -- NA NA NA --
NA -- NA NA NA --
NA -- NA NA NA --
NA -- NA NA NA --
NA -- NA NA NA --
NA -- NA NA NA --
NA -- NA NA NA --
NA -- NA NA NA --
NA -- NA NA NA --
NA -- NA NA NA --
NA -- NA NA NA --
NA -- NA NA NA --
E-CB-11A-16-18 E-CB-11A-18-20 E-CB-11A-32-34 E-CB-11A-36-38E-CB-11A-22-24 E-CB-11A-26-28
20120720 20120720 20120720 20120720 2012072020120720
26 3216 18 22 36
18 20 24 28 34 38

TABLE 4-8
ANALYTES DETECTED IN BLOCK E DEEP BORING SOIL SAMPLES, JUNE-JULY 2012
LOCKHEED MARTIN MIDDLE RIVER COMPLEX, MIDDLE RIVER, MARYLAND
PAGE 10 OF 32
SAMPLE ID Non-
SAMPLE DATE Residential Residential
TOP DEPTH (FEET BELOW GRADE) Screening Screening
BOTTOM DEPTH (FEET BELOW GRADE) Levels Levels
VOLATILES (UG/KG)1,2,3-TRICHLOROBENZENE 29000 NA
1,2,4-TRICHLOROBENZENE 38000 175000
1,2-DICHLOROBENZENE 700000 9200000
1,2-DICHLOROETHANE 7000 31000
1,2-DICHLOROPROPANE 9400 42000
1,3-DICHLOROBENZENE 23000 3100001,4-DICHLOROBENZENE 31000 NA
1-BUTANOL NA NA
2-BUTANONE 4700000 61000000
ACETONE 7000000 92000000
CHLOROBENZENE 160000 2000000CYCLOHEXANONE NA NA
DIETHYL ETHER NA NA
ETHYLBENZENE 780000 10000000HEXANE NA NA
METHYL ACETATE NA NA
METHYLENE CHLORIDE 85000 380000
NAPHTHALENE 160000 2000000
STYRENE 1600000 20000000
TETRACHLOROETHENE 1200 5300
TOLUENE 630000 8200000
TOTAL XYLENES 1600000 20000000TRANS-1,4-DICHLORO-2-BUTENE NA NA
TRICHLOROETHENE 1600 7200
E-CB-11A-16-18 E-CB-11A-18-20 E-CB-11A-32-34 E-CB-11A-36-38E-CB-11A-22-24 E-CB-11A-26-28
20120720 20120720 20120720 20120720 2012072020120720
26 3216 18 22 36
18 20 24 28 34 38
NA -- NA NA NA --
NA -- NA NA NA --
NA -- NA NA NA --
NA -- NA NA NA --
NA -- NA NA NA --
NA -- NA NA NA --
NA -- NA NA NA --
NA NA NA NA NA NA
NA -- NA NA NA --
NA 13 J NA NA NA 21
NA -- NA NA NA --
NA NA NA NA NA NA
NA NA NA NA NA NA
NA -- NA NA NA --
NA NA NA NA NA NA
NA NA NA NA NA NA
NA -- NA NA NA --
NA -- NA NA NA --
NA -- NA NA NA --
NA -- NA NA NA --
NA -- NA NA NA 0.4 J
NA -- NA NA NA --
NA NA NA NA NA NA
NA -- NA NA NA --

TABLE 4-8
ANALYTES DETECTED IN BLOCK E DEEP BORING SOIL SAMPLES, JUNE-JULY 2012
LOCKHEED MARTIN MIDDLE RIVER COMPLEX, MIDDLE RIVER, MARYLAND
PAGE 11 OF 32
SAMPLE ID Non-
SAMPLE DATE Residential Residential
TOP DEPTH (FEET BELOW GRADE) Screening Screening
BOTTOM DEPTH (FEET BELOW GRADE) Levels Levels
METALS (MG/KG)
ARSENIC 12(1)
12(1)
BARIUM 1600 20000
BERYLLIUM 16 200
CADMIUM 3.9 51
CHROMIUM 23 310
COBALT NA NA
COPPER 310 4100
LEAD 400 1000
MOLYBDENUM NA NA
NICKEL 160 2000
SELENIUM 39 510
SILVER 39 510
VANADIUM 91(1)
91(1)
ZINC 2300 31000PCBS (UG/KG)AROCLOR-1260 1000 10000
TPH-DRO 230 620
TPH-GRO 230000 620000
ACENAPHTHENE 470000 6100000
ANTHRACENE 2300000 31000000
BAP EQUIVALENT-HALFND 140(1)
2900(1)
BENZO(A)ANTHRACENE 220 3900
BENZO(A)PYRENE 22 390
BENZO(B)FLUORANTHENE 220 3900
BENZO(G,H,I)PERYLENE 230000 3100000
BENZO(K)FLUORANTHENE 2200 39000
CHRYSENE 22000 390000
FLUORANTHENE 310000 4100000
FLUORENE 310000 4100000
INDENO(1,2,3-CD)PYRENE 220 3900
NAPHTHALENE 160000 2000000
PHENANTHRENE 2300000 31000000
PYRENE 230000 3100000
POLYCYCLIC AROMATIC HYDROCARBONS (UG/KG)
PETROLEUM HYDROCARBONS (UG/KG)
PETROLEUM HYDROCARBONS (MG/KG)
NA NA 1.5 L NA NA NA
NA NA 14 J NA NA NA
NA NA 2.5 NA NA NA
NA NA -- NA NA NA
NA NA 15 NA NA NA
NA NA 8.7 NA NA NA
NA NA 15 NA NA NA
NA NA 5.7 NA NA NA
NA NA 0.33 J NA NA NA
NA NA 19 NA NA NA
NA NA -- NA NA NA
NA NA -- NA NA NA
NA NA 21 NA NA NA
NA NA 32 NA NA NA
-- -- -- -- -- --
NA NA -- NA NA NA
NA NA -- NA NA NA
NA NA -- NA NA NA
NA NA -- NA NA NA
NA NA -- NA NA NA
NA NA -- NA NA NA
NA NA -- NA NA NA
NA NA -- NA NA NA
NA NA -- NA NA NA
NA NA -- NA NA NA
NA NA -- NA NA NA
NA NA -- NA NA NA
NA NA -- NA NA NA
NA NA -- NA NA NA
NA NA -- NA NA NA
NA NA -- NA NA NA
NA NA -- NA NA NA
E-CB-11A-42-44 E-CB-11A-46-48 E-CB-11A-48-50 E-CB-11B-2-4E-CB-11B-0-2E-CB-11A-38-40
2012071920120720 20120720 2012071920120720 20120720
46 48 0 238 42
44 448 50 240

TABLE 4-8
ANALYTES DETECTED IN BLOCK E DEEP BORING SOIL SAMPLES, JUNE-JULY 2012
LOCKHEED MARTIN MIDDLE RIVER COMPLEX, MIDDLE RIVER, MARYLAND
PAGE 12 OF 32
SAMPLE ID Non-
SAMPLE DATE Residential Residential
TOP DEPTH (FEET BELOW GRADE) Screening Screening
BOTTOM DEPTH (FEET BELOW GRADE) Levels Levels
VOLATILES (UG/KG)1,2,3-TRICHLOROBENZENE 29000 NA
1,2,4-TRICHLOROBENZENE 38000 175000
1,2-DICHLOROBENZENE 700000 9200000
1,2-DICHLOROETHANE 7000 31000
1,2-DICHLOROPROPANE 9400 42000
1,3-DICHLOROBENZENE 23000 3100001,4-DICHLOROBENZENE 31000 NA
1-BUTANOL NA NA
2-BUTANONE 4700000 61000000
ACETONE 7000000 92000000
CHLOROBENZENE 160000 2000000CYCLOHEXANONE NA NA
DIETHYL ETHER NA NA
ETHYLBENZENE 780000 10000000HEXANE NA NA
METHYL ACETATE NA NA
METHYLENE CHLORIDE 85000 380000
NAPHTHALENE 160000 2000000
STYRENE 1600000 20000000
TETRACHLOROETHENE 1200 5300
TOLUENE 630000 8200000
TOTAL XYLENES 1600000 20000000TRANS-1,4-DICHLORO-2-BUTENE NA NA
TRICHLOROETHENE 1600 7200
E-CB-11A-42-44 E-CB-11A-46-48 E-CB-11A-48-50 E-CB-11B-2-4E-CB-11B-0-2E-CB-11A-38-40
2012071920120720 20120720 2012071920120720 20120720
46 48 0 238 42
44 448 50 240
NA NA -- NA NA NA
NA NA -- NA NA NA
NA NA -- NA NA NA
NA NA -- NA NA NA
NA NA -- NA NA NA
NA NA -- NA NA NA
NA NA -- NA NA NA
NA NA NA NA NA NA
NA NA -- NA NA NA
NA NA 24 NA NA NA
NA NA -- NA NA NA
NA NA NA NA NA NA
NA NA NA NA NA NA
NA NA -- NA NA NA
NA NA NA NA NA NA
NA NA NA NA NA NA
NA NA -- NA NA NA
NA NA -- NA NA NA
NA NA -- NA NA NA
NA NA -- NA NA NA
NA NA 0.35 J NA NA NA
NA NA -- NA NA NA
NA NA NA NA NA NA
NA NA -- NA NA NA

TABLE 4-8
ANALYTES DETECTED IN BLOCK E DEEP BORING SOIL SAMPLES, JUNE-JULY 2012
LOCKHEED MARTIN MIDDLE RIVER COMPLEX, MIDDLE RIVER, MARYLAND
PAGE 13 OF 32
SAMPLE ID Non-
SAMPLE DATE Residential Residential
TOP DEPTH (FEET BELOW GRADE) Screening Screening
BOTTOM DEPTH (FEET BELOW GRADE) Levels Levels
METALS (MG/KG)
ARSENIC 12(1)
12(1)
BARIUM 1600 20000
BERYLLIUM 16 200
CADMIUM 3.9 51
CHROMIUM 23 310
COBALT NA NA
COPPER 310 4100
LEAD 400 1000
MOLYBDENUM NA NA
NICKEL 160 2000
SELENIUM 39 510
SILVER 39 510
VANADIUM 91(1)
91(1)
ZINC 2300 31000PCBS (UG/KG)AROCLOR-1260 1000 10000
TPH-DRO 230 620
TPH-GRO 230000 620000
ACENAPHTHENE 470000 6100000
ANTHRACENE 2300000 31000000
BAP EQUIVALENT-HALFND 140(1)
2900(1)
BENZO(A)ANTHRACENE 220 3900
BENZO(A)PYRENE 22 390
BENZO(B)FLUORANTHENE 220 3900
BENZO(G,H,I)PERYLENE 230000 3100000
BENZO(K)FLUORANTHENE 2200 39000
CHRYSENE 22000 390000
FLUORANTHENE 310000 4100000
FLUORENE 310000 4100000
INDENO(1,2,3-CD)PYRENE 220 3900
NAPHTHALENE 160000 2000000
PHENANTHRENE 2300000 31000000
PYRENE 230000 3100000
POLYCYCLIC AROMATIC HYDROCARBONS (UG/KG)
PETROLEUM HYDROCARBONS (UG/KG)
PETROLEUM HYDROCARBONS (MG/KG)
NA 4.4 J NA NA 0.62 J NA
NA 16 J NA NA 14 J NA
NA 7 NA NA 2.1 NA
NA -- NA NA -- NA
NA 24 NA NA 14 NA
NA 94 NA NA 17 NA
NA 47 NA NA 14 NA
NA 10 NA NA 3.8 NA
NA -- NA NA -- NA
NA 58 NA NA 26 NA
NA -- NA NA -- NA
NA -- NA NA -- NA
NA 51 NA NA 17 NA
NA 81 NA NA 52 NA
-- -- -- -- -- --
NA 19 B NA NA 17 B NA
NA -- NA NA -- NA
NA -- NA NA -- NA
NA -- NA NA -- NA
NA -- NA NA -- NA
NA -- NA NA -- NA
NA -- NA NA -- NA
NA -- NA NA -- NA
NA -- NA NA -- NA
NA -- NA NA -- NA
NA -- NA NA -- NA
NA -- NA NA -- NA
NA -- NA NA -- NA
NA -- NA NA -- NA
NA -- NA NA -- NA
NA -- NA NA -- NA
NA -- NA NA -- NA
E-CB-11B-12-14 E-CB-11B-16-18 E-CB-11B-18-20E-CB-11B-4-6 E-CB-11B-6-8 E-CB-11B-8-10
2012071920120719 20120719 2012071920120719 20120719
12 1686 184
6 14 18 208 10
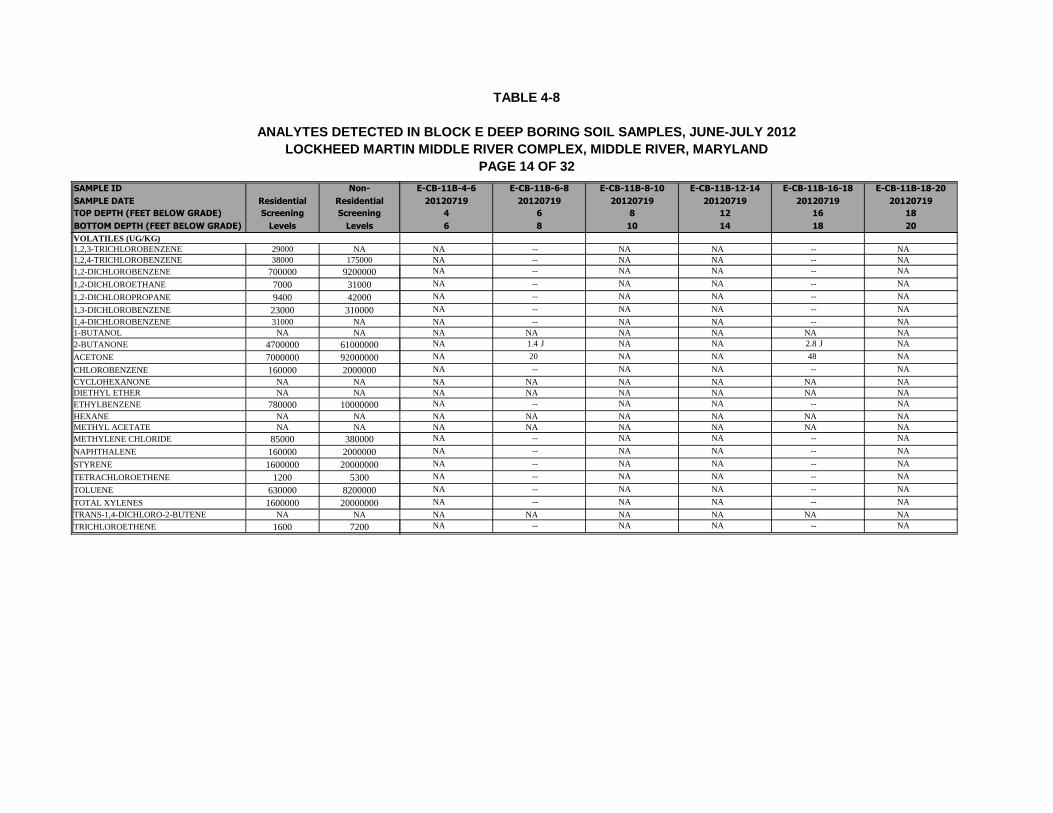
TABLE 4-8
ANALYTES DETECTED IN BLOCK E DEEP BORING SOIL SAMPLES, JUNE-JULY 2012
LOCKHEED MARTIN MIDDLE RIVER COMPLEX, MIDDLE RIVER, MARYLAND
PAGE 14 OF 32
SAMPLE ID Non-
SAMPLE DATE Residential Residential
TOP DEPTH (FEET BELOW GRADE) Screening Screening
BOTTOM DEPTH (FEET BELOW GRADE) Levels Levels
VOLATILES (UG/KG)1,2,3-TRICHLOROBENZENE 29000 NA
1,2,4-TRICHLOROBENZENE 38000 175000
1,2-DICHLOROBENZENE 700000 9200000
1,2-DICHLOROETHANE 7000 31000
1,2-DICHLOROPROPANE 9400 42000
1,3-DICHLOROBENZENE 23000 3100001,4-DICHLOROBENZENE 31000 NA
1-BUTANOL NA NA
2-BUTANONE 4700000 61000000
ACETONE 7000000 92000000
CHLOROBENZENE 160000 2000000CYCLOHEXANONE NA NA
DIETHYL ETHER NA NA
ETHYLBENZENE 780000 10000000HEXANE NA NA
METHYL ACETATE NA NA
METHYLENE CHLORIDE 85000 380000
NAPHTHALENE 160000 2000000
STYRENE 1600000 20000000
TETRACHLOROETHENE 1200 5300
TOLUENE 630000 8200000
TOTAL XYLENES 1600000 20000000TRANS-1,4-DICHLORO-2-BUTENE NA NA
TRICHLOROETHENE 1600 7200
E-CB-11B-12-14 E-CB-11B-16-18 E-CB-11B-18-20E-CB-11B-4-6 E-CB-11B-6-8 E-CB-11B-8-10
2012071920120719 20120719 2012071920120719 20120719
12 1686 184
6 14 18 208 10
NA -- NA NA -- NA
NA -- NA NA -- NA
NA -- NA NA -- NA
NA -- NA NA -- NA
NA -- NA NA -- NA
NA -- NA NA -- NA
NA -- NA NA -- NA
NA NA NA NA NA NA
NA 1.4 J NA NA 2.8 J NA
NA 20 NA NA 48 NA
NA -- NA NA -- NA
NA NA NA NA NA NA
NA NA NA NA NA NA
NA -- NA NA -- NA
NA NA NA NA NA NA
NA NA NA NA NA NA
NA -- NA NA -- NA
NA -- NA NA -- NA
NA -- NA NA -- NA
NA -- NA NA -- NA
NA -- NA NA -- NA
NA -- NA NA -- NA
NA NA NA NA NA NA
NA -- NA NA -- NA

TABLE 4-8
ANALYTES DETECTED IN BLOCK E DEEP BORING SOIL SAMPLES, JUNE-JULY 2012
LOCKHEED MARTIN MIDDLE RIVER COMPLEX, MIDDLE RIVER, MARYLAND
PAGE 15 OF 32
SAMPLE ID Non-
SAMPLE DATE Residential Residential
TOP DEPTH (FEET BELOW GRADE) Screening Screening
BOTTOM DEPTH (FEET BELOW GRADE) Levels Levels
METALS (MG/KG)
ARSENIC 12(1)
12(1)
BARIUM 1600 20000
BERYLLIUM 16 200
CADMIUM 3.9 51
CHROMIUM 23 310
COBALT NA NA
COPPER 310 4100
LEAD 400 1000
MOLYBDENUM NA NA
NICKEL 160 2000
SELENIUM 39 510
SILVER 39 510
VANADIUM 91(1)
91(1)
ZINC 2300 31000PCBS (UG/KG)AROCLOR-1260 1000 10000
TPH-DRO 230 620
TPH-GRO 230000 620000
ACENAPHTHENE 470000 6100000
ANTHRACENE 2300000 31000000
BAP EQUIVALENT-HALFND 140(1)
2900(1)
BENZO(A)ANTHRACENE 220 3900
BENZO(A)PYRENE 22 390
BENZO(B)FLUORANTHENE 220 3900
BENZO(G,H,I)PERYLENE 230000 3100000
BENZO(K)FLUORANTHENE 2200 39000
CHRYSENE 22000 390000
FLUORANTHENE 310000 4100000
FLUORENE 310000 4100000
INDENO(1,2,3-CD)PYRENE 220 3900
NAPHTHALENE 160000 2000000
PHENANTHRENE 2300000 31000000
PYRENE 230000 3100000
POLYCYCLIC AROMATIC HYDROCARBONS (UG/KG)
PETROLEUM HYDROCARBONS (UG/KG)
PETROLEUM HYDROCARBONS (MG/KG)
NA NA 1.1 J NA NA 0.55 J
NA NA 13 J NA NA 8.2 J
NA NA 1.7 NA NA 0.7
NA NA -- NA NA --
NA NA 16 NA NA 8.3
NA NA 9.3 NA NA 3.3
NA NA 11 NA NA 12
NA NA 3.2 NA NA 3.2
NA NA -- NA NA --
NA NA 24 NA NA 8.2
NA NA -- NA NA --
NA NA -- NA NA --
NA NA 20 NA NA 17
NA NA 21 NA NA 12
-- -- -- -- -- --
NA NA 18 B NA NA --
NA NA -- NA NA --
NA NA -- NA NA --
NA NA -- NA NA --
NA NA -- NA NA --
NA NA -- NA NA --
NA NA -- NA NA --
NA NA -- NA NA --
NA NA -- NA NA --
NA NA -- NA NA --
NA NA -- NA NA --
NA NA -- NA NA --
NA NA -- NA NA --
NA NA -- NA NA --
NA NA -- NA NA --
NA NA -- NA NA --
NA NA -- NA NA --
E-CB-11B-26-28 E-CB-11B-28-30 E-CB-11B-32-34 E-CB-11B-36-38 E-CB-11B-38-40E-CB-11B-22-24
20120719 20120719 20120719 20120719 20120719 20120719
36 3828 3222 26
24 28 30 34 38 40

TABLE 4-8
ANALYTES DETECTED IN BLOCK E DEEP BORING SOIL SAMPLES, JUNE-JULY 2012
LOCKHEED MARTIN MIDDLE RIVER COMPLEX, MIDDLE RIVER, MARYLAND
PAGE 16 OF 32
SAMPLE ID Non-
SAMPLE DATE Residential Residential
TOP DEPTH (FEET BELOW GRADE) Screening Screening
BOTTOM DEPTH (FEET BELOW GRADE) Levels Levels
VOLATILES (UG/KG)1,2,3-TRICHLOROBENZENE 29000 NA
1,2,4-TRICHLOROBENZENE 38000 175000
1,2-DICHLOROBENZENE 700000 9200000
1,2-DICHLOROETHANE 7000 31000
1,2-DICHLOROPROPANE 9400 42000
1,3-DICHLOROBENZENE 23000 3100001,4-DICHLOROBENZENE 31000 NA
1-BUTANOL NA NA
2-BUTANONE 4700000 61000000
ACETONE 7000000 92000000
CHLOROBENZENE 160000 2000000CYCLOHEXANONE NA NA
DIETHYL ETHER NA NA
ETHYLBENZENE 780000 10000000HEXANE NA NA
METHYL ACETATE NA NA
METHYLENE CHLORIDE 85000 380000
NAPHTHALENE 160000 2000000
STYRENE 1600000 20000000
TETRACHLOROETHENE 1200 5300
TOLUENE 630000 8200000
TOTAL XYLENES 1600000 20000000TRANS-1,4-DICHLORO-2-BUTENE NA NA
TRICHLOROETHENE 1600 7200
E-CB-11B-26-28 E-CB-11B-28-30 E-CB-11B-32-34 E-CB-11B-36-38 E-CB-11B-38-40E-CB-11B-22-24
20120719 20120719 20120719 20120719 20120719 20120719
36 3828 3222 26
24 28 30 34 38 40
NA NA -- NA NA --
NA NA -- NA NA --
NA NA -- NA NA --
NA NA -- NA NA --
NA NA -- NA NA --
NA NA -- NA NA --
NA NA -- NA NA --
NA NA NA NA NA NA
NA NA -- NA NA --
NA NA -- NA NA 13 J
NA NA -- NA NA --
NA NA NA NA NA NA
NA NA NA NA NA NA
NA NA -- NA NA --
NA NA NA NA NA NA
NA NA NA NA NA NA
NA NA -- NA NA --
NA NA -- NA NA --
NA NA -- NA NA --
NA NA -- NA NA --
NA NA -- NA NA --
NA NA -- NA NA --
NA NA NA NA NA NA
NA NA -- NA NA --
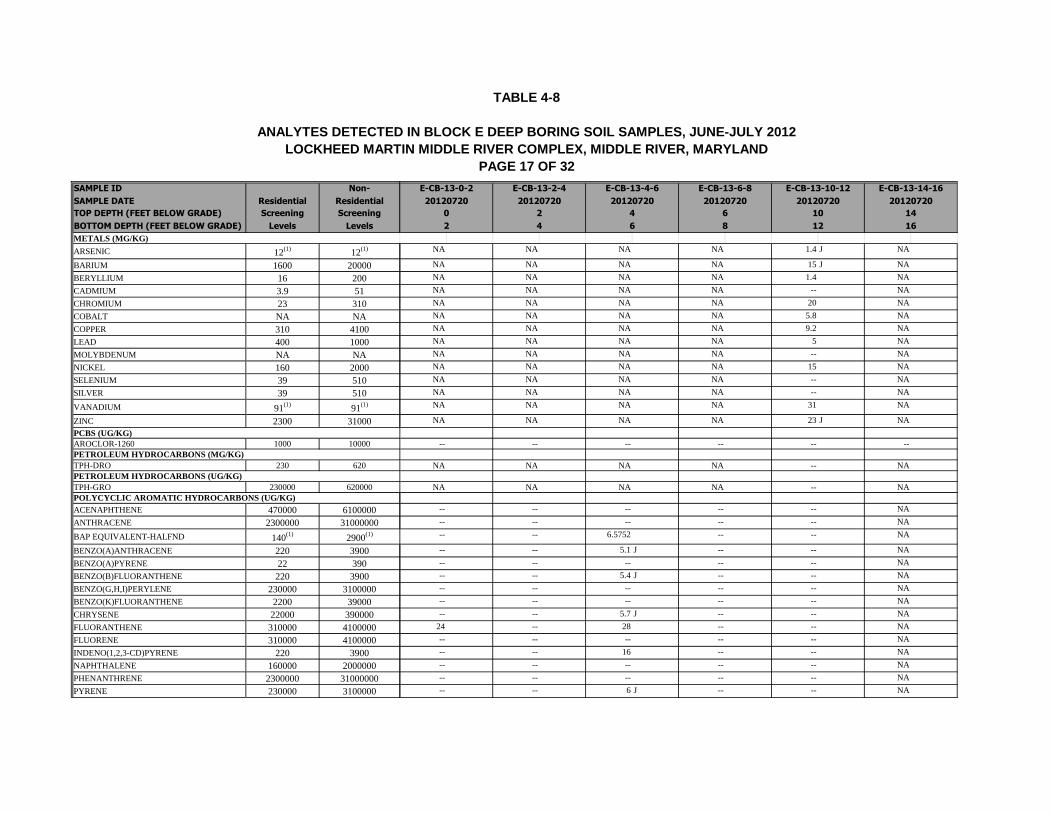
TABLE 4-8
ANALYTES DETECTED IN BLOCK E DEEP BORING SOIL SAMPLES, JUNE-JULY 2012
LOCKHEED MARTIN MIDDLE RIVER COMPLEX, MIDDLE RIVER, MARYLAND
PAGE 17 OF 32
SAMPLE ID Non-
SAMPLE DATE Residential Residential
TOP DEPTH (FEET BELOW GRADE) Screening Screening
BOTTOM DEPTH (FEET BELOW GRADE) Levels Levels
METALS (MG/KG)
ARSENIC 12(1)
12(1)
BARIUM 1600 20000
BERYLLIUM 16 200
CADMIUM 3.9 51
CHROMIUM 23 310
COBALT NA NA
COPPER 310 4100
LEAD 400 1000
MOLYBDENUM NA NA
NICKEL 160 2000
SELENIUM 39 510
SILVER 39 510
VANADIUM 91(1)
91(1)
ZINC 2300 31000PCBS (UG/KG)AROCLOR-1260 1000 10000
TPH-DRO 230 620
TPH-GRO 230000 620000
ACENAPHTHENE 470000 6100000
ANTHRACENE 2300000 31000000
BAP EQUIVALENT-HALFND 140(1)
2900(1)
BENZO(A)ANTHRACENE 220 3900
BENZO(A)PYRENE 22 390
BENZO(B)FLUORANTHENE 220 3900
BENZO(G,H,I)PERYLENE 230000 3100000
BENZO(K)FLUORANTHENE 2200 39000
CHRYSENE 22000 390000
FLUORANTHENE 310000 4100000
FLUORENE 310000 4100000
INDENO(1,2,3-CD)PYRENE 220 3900
NAPHTHALENE 160000 2000000
PHENANTHRENE 2300000 31000000
PYRENE 230000 3100000
POLYCYCLIC AROMATIC HYDROCARBONS (UG/KG)
PETROLEUM HYDROCARBONS (UG/KG)
PETROLEUM HYDROCARBONS (MG/KG)
NA NA NA NA 1.4 J NA
NA NA NA NA 15 J NA
NA NA NA NA 1.4 NA
NA NA NA NA -- NA
NA NA NA NA 20 NA
NA NA NA NA 5.8 NA
NA NA NA NA 9.2 NA
NA NA NA NA 5 NA
NA NA NA NA -- NA
NA NA NA NA 15 NA
NA NA NA NA -- NA
NA NA NA NA -- NA
NA NA NA NA 31 NA
NA NA NA NA 23 J NA
-- -- -- -- -- --
NA NA NA NA -- NA
NA NA NA NA -- NA
-- -- -- -- -- NA
-- -- -- -- -- NA
-- -- 6.5752 -- -- NA
-- -- 5.1 J -- -- NA
-- -- -- -- -- NA
-- -- 5.4 J -- -- NA
-- -- -- -- -- NA
-- -- -- -- -- NA
-- -- 5.7 J -- -- NA
24 -- 28 -- -- NA
-- -- -- -- -- NA
-- -- 16 -- -- NA
-- -- -- -- -- NA
-- -- -- -- -- NA
-- -- 6 J -- -- NA
E-CB-13-2-4E-CB-13-0-2 E-CB-13-4-6 E-CB-13-6-8 E-CB-13-10-12 E-CB-13-14-16
20120720 2012072020120720 201207202012072020120720
2 10 144 60
12 166 842

TABLE 4-8
ANALYTES DETECTED IN BLOCK E DEEP BORING SOIL SAMPLES, JUNE-JULY 2012
LOCKHEED MARTIN MIDDLE RIVER COMPLEX, MIDDLE RIVER, MARYLAND
PAGE 18 OF 32
SAMPLE ID Non-
SAMPLE DATE Residential Residential
TOP DEPTH (FEET BELOW GRADE) Screening Screening
BOTTOM DEPTH (FEET BELOW GRADE) Levels Levels
VOLATILES (UG/KG)1,2,3-TRICHLOROBENZENE 29000 NA
1,2,4-TRICHLOROBENZENE 38000 175000
1,2-DICHLOROBENZENE 700000 9200000
1,2-DICHLOROETHANE 7000 31000
1,2-DICHLOROPROPANE 9400 42000
1,3-DICHLOROBENZENE 23000 3100001,4-DICHLOROBENZENE 31000 NA
1-BUTANOL NA NA
2-BUTANONE 4700000 61000000
ACETONE 7000000 92000000
CHLOROBENZENE 160000 2000000CYCLOHEXANONE NA NA
DIETHYL ETHER NA NA
ETHYLBENZENE 780000 10000000HEXANE NA NA
METHYL ACETATE NA NA
METHYLENE CHLORIDE 85000 380000
NAPHTHALENE 160000 2000000
STYRENE 1600000 20000000
TETRACHLOROETHENE 1200 5300
TOLUENE 630000 8200000
TOTAL XYLENES 1600000 20000000TRANS-1,4-DICHLORO-2-BUTENE NA NA
TRICHLOROETHENE 1600 7200
E-CB-13-2-4E-CB-13-0-2 E-CB-13-4-6 E-CB-13-6-8 E-CB-13-10-12 E-CB-13-14-16
20120720 2012072020120720 201207202012072020120720
2 10 144 60
12 166 842
NA NA NA NA 0.5 B NA
NA NA NA NA 2.1 J NA
NA NA NA NA -- NA
NA NA NA NA -- NA
NA NA NA NA -- NA
NA NA NA NA -- NA
NA NA NA NA -- NA
NA NA NA NA NA NA
NA NA NA NA -- NA
NA NA NA NA 11 J NA
NA NA NA NA -- NA
NA NA NA NA NA NA
NA NA NA NA NA NA
NA NA NA NA -- NA
NA NA NA NA NA NA
NA NA NA NA NA NA
NA NA NA NA -- NA
NA NA NA NA -- NA
NA NA NA NA -- NA
NA NA NA NA -- NA
NA NA NA NA 0.24 J NA
NA NA NA NA -- NA
NA NA NA NA NA NA
NA NA NA NA -- NA

TABLE 4-8
ANALYTES DETECTED IN BLOCK E DEEP BORING SOIL SAMPLES, JUNE-JULY 2012
LOCKHEED MARTIN MIDDLE RIVER COMPLEX, MIDDLE RIVER, MARYLAND
PAGE 19 OF 32
SAMPLE ID Non-
SAMPLE DATE Residential Residential
TOP DEPTH (FEET BELOW GRADE) Screening Screening
BOTTOM DEPTH (FEET BELOW GRADE) Levels Levels
METALS (MG/KG)
ARSENIC 12(1)
12(1)
BARIUM 1600 20000
BERYLLIUM 16 200
CADMIUM 3.9 51
CHROMIUM 23 310
COBALT NA NA
COPPER 310 4100
LEAD 400 1000
MOLYBDENUM NA NA
NICKEL 160 2000
SELENIUM 39 510
SILVER 39 510
VANADIUM 91(1)
91(1)
ZINC 2300 31000PCBS (UG/KG)AROCLOR-1260 1000 10000
TPH-DRO 230 620
TPH-GRO 230000 620000
ACENAPHTHENE 470000 6100000
ANTHRACENE 2300000 31000000
BAP EQUIVALENT-HALFND 140(1)
2900(1)
BENZO(A)ANTHRACENE 220 3900
BENZO(A)PYRENE 22 390
BENZO(B)FLUORANTHENE 220 3900
BENZO(G,H,I)PERYLENE 230000 3100000
BENZO(K)FLUORANTHENE 2200 39000
CHRYSENE 22000 390000
FLUORANTHENE 310000 4100000
FLUORENE 310000 4100000
INDENO(1,2,3-CD)PYRENE 220 3900
NAPHTHALENE 160000 2000000
PHENANTHRENE 2300000 31000000
PYRENE 230000 3100000
POLYCYCLIC AROMATIC HYDROCARBONS (UG/KG)
PETROLEUM HYDROCARBONS (UG/KG)
PETROLEUM HYDROCARBONS (MG/KG)
NA 3.7 NA NA NA NA
NA 13 J NA NA NA NA
NA 5.5 NA NA NA NA
NA -- NA NA NA NA
NA 22 NA NA NA NA
NA 20 NA NA NA NA
NA 16 NA NA NA NA
NA 11 NA NA NA NA
NA -- NA NA NA NA
NA 62 NA NA NA NA
NA 0.56 J NA NA NA NA
NA 0.22 J NA NA NA NA
NA 67 NA NA NA NA
NA 75 NA NA NA NA
-- -- -- -- -- --
NA -- NA NA NA NA
NA -- NA NA NA NA
NA -- -- NA NA NA
NA -- -- NA NA NA
NA -- -- NA NA NA
NA -- -- NA NA NA
NA -- -- NA NA NA
NA -- -- NA NA NA
NA -- -- NA NA NA
NA -- -- NA NA NA
NA -- -- NA NA NA
NA -- -- NA NA NA
NA -- -- NA NA NA
NA -- -- NA NA NA
NA -- -- NA NA NA
NA -- -- NA NA NA
NA -- -- NA NA NA
E-CB-13-8-10 E-CB-13-24-26 E-CB-13-28-30 E-CB-13-32-34E-CB-13-18-20 E-CB-13-22-24
20120720 20120720 20120720 2012072020120720 20120720
818 22 24 28 32
20 24 26 3010 34
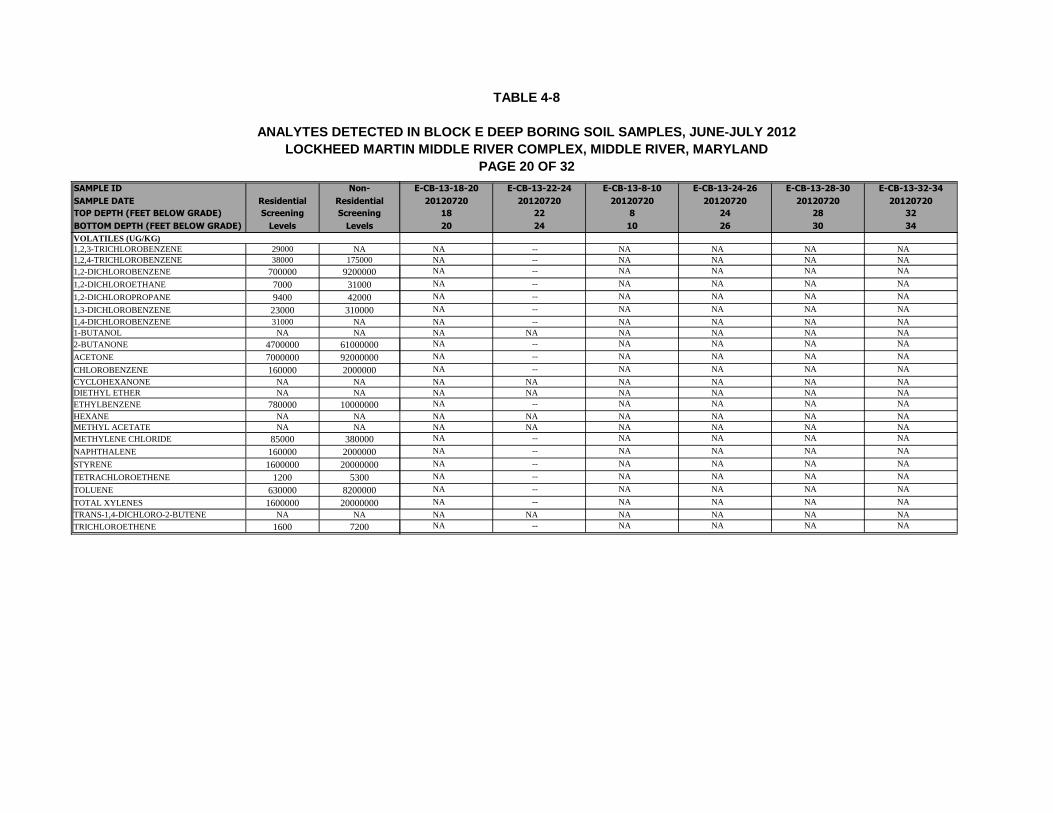
TABLE 4-8
ANALYTES DETECTED IN BLOCK E DEEP BORING SOIL SAMPLES, JUNE-JULY 2012
LOCKHEED MARTIN MIDDLE RIVER COMPLEX, MIDDLE RIVER, MARYLAND
PAGE 20 OF 32
SAMPLE ID Non-
SAMPLE DATE Residential Residential
TOP DEPTH (FEET BELOW GRADE) Screening Screening
BOTTOM DEPTH (FEET BELOW GRADE) Levels Levels
VOLATILES (UG/KG)1,2,3-TRICHLOROBENZENE 29000 NA
1,2,4-TRICHLOROBENZENE 38000 175000
1,2-DICHLOROBENZENE 700000 9200000
1,2-DICHLOROETHANE 7000 31000
1,2-DICHLOROPROPANE 9400 42000
1,3-DICHLOROBENZENE 23000 3100001,4-DICHLOROBENZENE 31000 NA
1-BUTANOL NA NA
2-BUTANONE 4700000 61000000
ACETONE 7000000 92000000
CHLOROBENZENE 160000 2000000CYCLOHEXANONE NA NA
DIETHYL ETHER NA NA
ETHYLBENZENE 780000 10000000HEXANE NA NA
METHYL ACETATE NA NA
METHYLENE CHLORIDE 85000 380000
NAPHTHALENE 160000 2000000
STYRENE 1600000 20000000
TETRACHLOROETHENE 1200 5300
TOLUENE 630000 8200000
TOTAL XYLENES 1600000 20000000TRANS-1,4-DICHLORO-2-BUTENE NA NA
TRICHLOROETHENE 1600 7200
E-CB-13-8-10 E-CB-13-24-26 E-CB-13-28-30 E-CB-13-32-34E-CB-13-18-20 E-CB-13-22-24
20120720 20120720 20120720 2012072020120720 20120720
818 22 24 28 32
20 24 26 3010 34
NA -- NA NA NA NA
NA -- NA NA NA NA
NA -- NA NA NA NA
NA -- NA NA NA NA
NA -- NA NA NA NA
NA -- NA NA NA NA
NA -- NA NA NA NA
NA NA NA NA NA NA
NA -- NA NA NA NA
NA -- NA NA NA NA
NA -- NA NA NA NA
NA NA NA NA NA NA
NA NA NA NA NA NA
NA -- NA NA NA NA
NA NA NA NA NA NA
NA NA NA NA NA NA
NA -- NA NA NA NA
NA -- NA NA NA NA
NA -- NA NA NA NA
NA -- NA NA NA NA
NA -- NA NA NA NA
NA -- NA NA NA NA
NA NA NA NA NA NA
NA -- NA NA NA NA
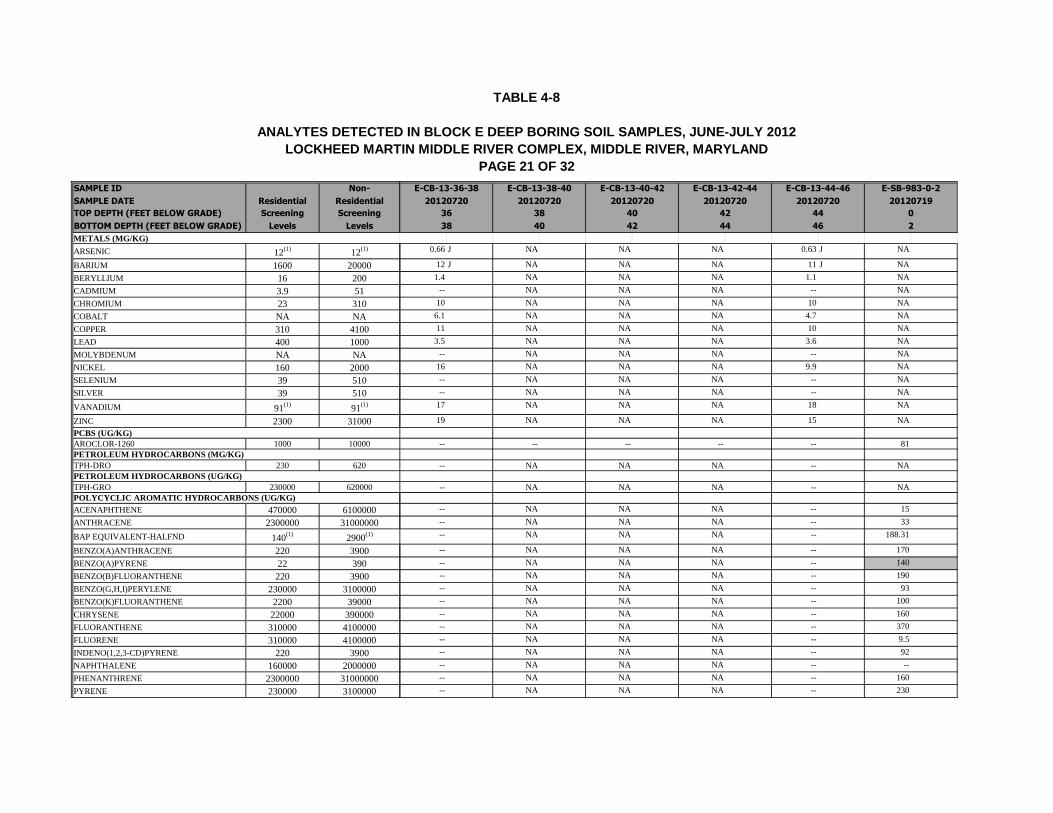
TABLE 4-8
ANALYTES DETECTED IN BLOCK E DEEP BORING SOIL SAMPLES, JUNE-JULY 2012
LOCKHEED MARTIN MIDDLE RIVER COMPLEX, MIDDLE RIVER, MARYLAND
PAGE 21 OF 32
SAMPLE ID Non-
SAMPLE DATE Residential Residential
TOP DEPTH (FEET BELOW GRADE) Screening Screening
BOTTOM DEPTH (FEET BELOW GRADE) Levels Levels
METALS (MG/KG)
ARSENIC 12(1)
12(1)
BARIUM 1600 20000
BERYLLIUM 16 200
CADMIUM 3.9 51
CHROMIUM 23 310
COBALT NA NA
COPPER 310 4100
LEAD 400 1000
MOLYBDENUM NA NA
NICKEL 160 2000
SELENIUM 39 510
SILVER 39 510
VANADIUM 91(1)
91(1)
ZINC 2300 31000PCBS (UG/KG)AROCLOR-1260 1000 10000
TPH-DRO 230 620
TPH-GRO 230000 620000
ACENAPHTHENE 470000 6100000
ANTHRACENE 2300000 31000000
BAP EQUIVALENT-HALFND 140(1)
2900(1)
BENZO(A)ANTHRACENE 220 3900
BENZO(A)PYRENE 22 390
BENZO(B)FLUORANTHENE 220 3900
BENZO(G,H,I)PERYLENE 230000 3100000
BENZO(K)FLUORANTHENE 2200 39000
CHRYSENE 22000 390000
FLUORANTHENE 310000 4100000
FLUORENE 310000 4100000
INDENO(1,2,3-CD)PYRENE 220 3900
NAPHTHALENE 160000 2000000
PHENANTHRENE 2300000 31000000
PYRENE 230000 3100000
POLYCYCLIC AROMATIC HYDROCARBONS (UG/KG)
PETROLEUM HYDROCARBONS (UG/KG)
PETROLEUM HYDROCARBONS (MG/KG)
0.66 J NA NA NA 0.63 J NA
12 J NA NA NA 11 J NA
1.4 NA NA NA 1.1 NA
-- NA NA NA -- NA
10 NA NA NA 10 NA
6.1 NA NA NA 4.7 NA
11 NA NA NA 10 NA
3.5 NA NA NA 3.6 NA
-- NA NA NA -- NA
16 NA NA NA 9.9 NA
-- NA NA NA -- NA
-- NA NA NA -- NA
17 NA NA NA 18 NA
19 NA NA NA 15 NA
-- -- -- -- -- 81
-- NA NA NA -- NA
-- NA NA NA -- NA
-- NA NA NA -- 15
-- NA NA NA -- 33
-- NA NA NA -- 188.31
-- NA NA NA -- 170
-- NA NA NA -- 140
-- NA NA NA -- 190
-- NA NA NA -- 93
-- NA NA NA -- 100
-- NA NA NA -- 160
-- NA NA NA -- 370
-- NA NA NA -- 9.5
-- NA NA NA -- 92
-- NA NA NA -- --
-- NA NA NA -- 160
-- NA NA NA -- 230
E-CB-13-42-44 E-CB-13-44-46E-CB-13-36-38 E-CB-13-38-40 E-CB-13-40-42 E-SB-983-0-2
20120720 2012071920120720 20120720 20120720 20120720
4238 40 44 036
46 238 40 42 44

TABLE 4-8
ANALYTES DETECTED IN BLOCK E DEEP BORING SOIL SAMPLES, JUNE-JULY 2012
LOCKHEED MARTIN MIDDLE RIVER COMPLEX, MIDDLE RIVER, MARYLAND
PAGE 22 OF 32
SAMPLE ID Non-
SAMPLE DATE Residential Residential
TOP DEPTH (FEET BELOW GRADE) Screening Screening
BOTTOM DEPTH (FEET BELOW GRADE) Levels Levels
VOLATILES (UG/KG)1,2,3-TRICHLOROBENZENE 29000 NA
1,2,4-TRICHLOROBENZENE 38000 175000
1,2-DICHLOROBENZENE 700000 9200000
1,2-DICHLOROETHANE 7000 31000
1,2-DICHLOROPROPANE 9400 42000
1,3-DICHLOROBENZENE 23000 3100001,4-DICHLOROBENZENE 31000 NA
1-BUTANOL NA NA
2-BUTANONE 4700000 61000000
ACETONE 7000000 92000000
CHLOROBENZENE 160000 2000000CYCLOHEXANONE NA NA
DIETHYL ETHER NA NA
ETHYLBENZENE 780000 10000000HEXANE NA NA
METHYL ACETATE NA NA
METHYLENE CHLORIDE 85000 380000
NAPHTHALENE 160000 2000000
STYRENE 1600000 20000000
TETRACHLOROETHENE 1200 5300
TOLUENE 630000 8200000
TOTAL XYLENES 1600000 20000000TRANS-1,4-DICHLORO-2-BUTENE NA NA
TRICHLOROETHENE 1600 7200
E-CB-13-42-44 E-CB-13-44-46E-CB-13-36-38 E-CB-13-38-40 E-CB-13-40-42 E-SB-983-0-2
20120720 2012071920120720 20120720 20120720 20120720
4238 40 44 036
46 238 40 42 44
-- NA NA NA -- --
-- NA NA NA -- --
-- NA NA NA -- --
-- NA NA NA -- --
-- NA NA NA -- --
-- NA NA NA -- --
-- NA NA NA -- --
NA NA NA NA NA NA
-- NA NA NA -- 1.9 J
11 J NA NA NA -- 52
-- NA NA NA -- --
NA NA NA NA NA NA
NA NA NA NA NA NA
-- NA NA NA -- --
NA NA NA NA NA NA
NA NA NA NA NA NA
-- NA NA NA -- --
-- NA NA NA -- --
-- NA NA NA -- --
-- NA NA NA -- --
-- NA NA NA 0.37 J --
-- NA NA NA -- --
NA NA NA NA NA NA
-- NA NA NA -- --

TABLE 4-8
ANALYTES DETECTED IN BLOCK E DEEP BORING SOIL SAMPLES, JUNE-JULY 2012
LOCKHEED MARTIN MIDDLE RIVER COMPLEX, MIDDLE RIVER, MARYLAND
PAGE 23 OF 32
SAMPLE ID Non-
SAMPLE DATE Residential Residential
TOP DEPTH (FEET BELOW GRADE) Screening Screening
BOTTOM DEPTH (FEET BELOW GRADE) Levels Levels
METALS (MG/KG)
ARSENIC 12(1)
12(1)
BARIUM 1600 20000
BERYLLIUM 16 200
CADMIUM 3.9 51
CHROMIUM 23 310
COBALT NA NA
COPPER 310 4100
LEAD 400 1000
MOLYBDENUM NA NA
NICKEL 160 2000
SELENIUM 39 510
SILVER 39 510
VANADIUM 91(1)
91(1)
ZINC 2300 31000PCBS (UG/KG)AROCLOR-1260 1000 10000
TPH-DRO 230 620
TPH-GRO 230000 620000
ACENAPHTHENE 470000 6100000
ANTHRACENE 2300000 31000000
BAP EQUIVALENT-HALFND 140(1)
2900(1)
BENZO(A)ANTHRACENE 220 3900
BENZO(A)PYRENE 22 390
BENZO(B)FLUORANTHENE 220 3900
BENZO(G,H,I)PERYLENE 230000 3100000
BENZO(K)FLUORANTHENE 2200 39000
CHRYSENE 22000 390000
FLUORANTHENE 310000 4100000
FLUORENE 310000 4100000
INDENO(1,2,3-CD)PYRENE 220 3900
NAPHTHALENE 160000 2000000
PHENANTHRENE 2300000 31000000
PYRENE 230000 3100000
POLYCYCLIC AROMATIC HYDROCARBONS (UG/KG)
PETROLEUM HYDROCARBONS (UG/KG)
PETROLEUM HYDROCARBONS (MG/KG)
NA NA NA NA NA NA
NA NA NA NA NA NA
NA NA NA NA NA NA
NA NA NA NA NA NA
NA NA NA NA NA NA
NA NA NA NA NA NA
NA NA NA NA NA NA
NA NA NA NA NA NA
NA NA NA NA NA NA
NA NA NA NA NA NA
NA NA NA NA NA NA
NA NA NA NA NA NA
NA NA NA NA NA NA
NA NA NA NA NA NA
-- -- -- -- -- --
NA NA NA NA NA NA
NA NA NA NA NA NA
-- -- -- -- NA NA
-- -- -- -- NA NA
-- 18.441 -- -- NA NA
-- 15 -- -- NA NA
-- 11 -- -- NA NA
-- 15 -- -- NA NA
-- 8.1 J -- -- NA NA
-- 7.7 J -- -- NA NA
-- 14 -- -- NA NA
22 49 22 21 NA NA
-- -- -- -- NA NA
-- 22 -- -- NA NA
4.7 J -- -- -- NA NA
-- 13 -- -- NA NA
-- 21 -- -- NA NA
E-SB-983-2-4 E-SB-983-10-12 E-SB-983-12-14E-SB-983-4-6 E-SB-983-6-8 E-SB-983-8-10
20120719 20120719 2012071920120719 2012071920120719
2 10 124 6 8
4 6 12 148 10

TABLE 4-8
ANALYTES DETECTED IN BLOCK E DEEP BORING SOIL SAMPLES, JUNE-JULY 2012
LOCKHEED MARTIN MIDDLE RIVER COMPLEX, MIDDLE RIVER, MARYLAND
PAGE 24 OF 32
SAMPLE ID Non-
SAMPLE DATE Residential Residential
TOP DEPTH (FEET BELOW GRADE) Screening Screening
BOTTOM DEPTH (FEET BELOW GRADE) Levels Levels
VOLATILES (UG/KG)1,2,3-TRICHLOROBENZENE 29000 NA
1,2,4-TRICHLOROBENZENE 38000 175000
1,2-DICHLOROBENZENE 700000 9200000
1,2-DICHLOROETHANE 7000 31000
1,2-DICHLOROPROPANE 9400 42000
1,3-DICHLOROBENZENE 23000 3100001,4-DICHLOROBENZENE 31000 NA
1-BUTANOL NA NA
2-BUTANONE 4700000 61000000
ACETONE 7000000 92000000
CHLOROBENZENE 160000 2000000CYCLOHEXANONE NA NA
DIETHYL ETHER NA NA
ETHYLBENZENE 780000 10000000HEXANE NA NA
METHYL ACETATE NA NA
METHYLENE CHLORIDE 85000 380000
NAPHTHALENE 160000 2000000
STYRENE 1600000 20000000
TETRACHLOROETHENE 1200 5300
TOLUENE 630000 8200000
TOTAL XYLENES 1600000 20000000TRANS-1,4-DICHLORO-2-BUTENE NA NA
TRICHLOROETHENE 1600 7200
E-SB-983-2-4 E-SB-983-10-12 E-SB-983-12-14E-SB-983-4-6 E-SB-983-6-8 E-SB-983-8-10
20120719 20120719 2012071920120719 2012071920120719
2 10 124 6 8
4 6 12 148 10
NA NA NA NA NA NA
NA NA NA NA NA NA
NA NA NA NA NA NA
NA NA NA NA NA NA
NA NA NA NA NA NA
NA NA NA NA NA NA
NA NA NA NA NA NA
NA NA NA NA NA NA
NA NA NA NA NA NA
NA NA NA NA NA NA
NA NA NA NA NA NA
NA NA NA NA NA NA
NA NA NA NA NA NA
NA NA NA NA NA NA
NA NA NA NA NA NA
NA NA NA NA NA NA
NA NA NA NA NA NA
NA NA NA NA NA NA
NA NA NA NA NA NA
NA NA NA NA NA NA
NA NA NA NA NA NA
NA NA NA NA NA NA
NA NA NA NA NA NA
NA NA NA NA NA NA
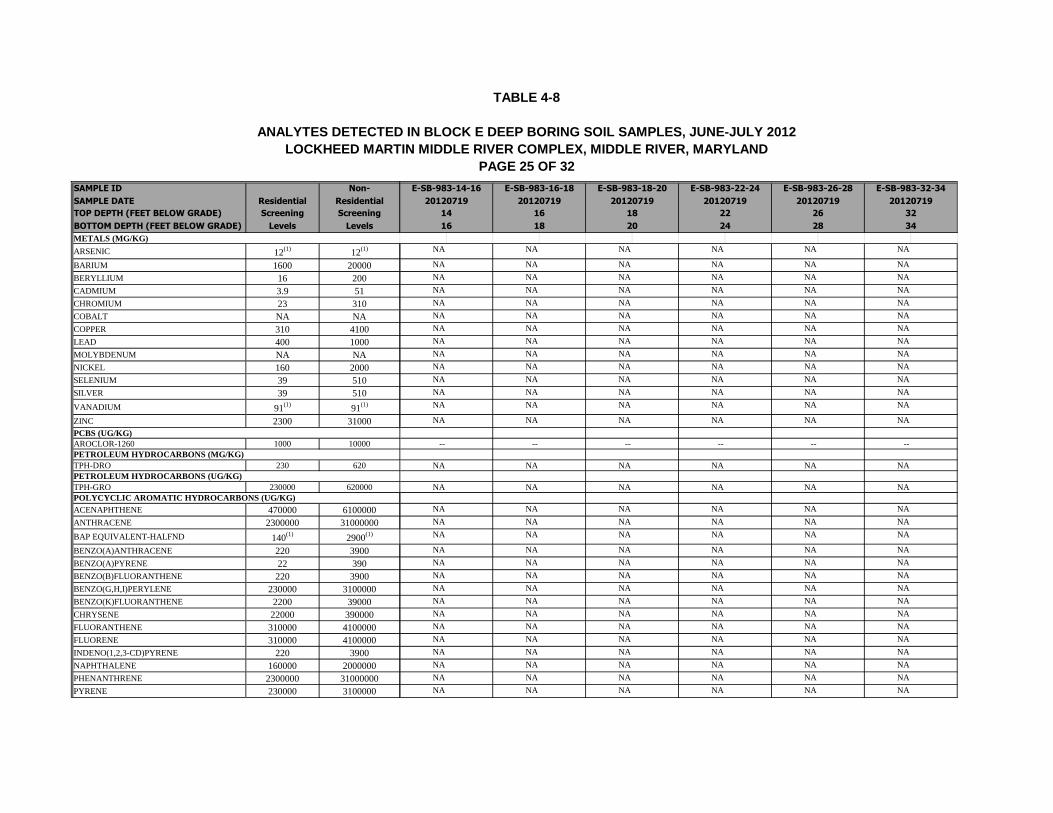
TABLE 4-8
ANALYTES DETECTED IN BLOCK E DEEP BORING SOIL SAMPLES, JUNE-JULY 2012
LOCKHEED MARTIN MIDDLE RIVER COMPLEX, MIDDLE RIVER, MARYLAND
PAGE 25 OF 32
SAMPLE ID Non-
SAMPLE DATE Residential Residential
TOP DEPTH (FEET BELOW GRADE) Screening Screening
BOTTOM DEPTH (FEET BELOW GRADE) Levels Levels
METALS (MG/KG)
ARSENIC 12(1)
12(1)
BARIUM 1600 20000
BERYLLIUM 16 200
CADMIUM 3.9 51
CHROMIUM 23 310
COBALT NA NA
COPPER 310 4100
LEAD 400 1000
MOLYBDENUM NA NA
NICKEL 160 2000
SELENIUM 39 510
SILVER 39 510
VANADIUM 91(1)
91(1)
ZINC 2300 31000PCBS (UG/KG)AROCLOR-1260 1000 10000
TPH-DRO 230 620
TPH-GRO 230000 620000
ACENAPHTHENE 470000 6100000
ANTHRACENE 2300000 31000000
BAP EQUIVALENT-HALFND 140(1)
2900(1)
BENZO(A)ANTHRACENE 220 3900
BENZO(A)PYRENE 22 390
BENZO(B)FLUORANTHENE 220 3900
BENZO(G,H,I)PERYLENE 230000 3100000
BENZO(K)FLUORANTHENE 2200 39000
CHRYSENE 22000 390000
FLUORANTHENE 310000 4100000
FLUORENE 310000 4100000
INDENO(1,2,3-CD)PYRENE 220 3900
NAPHTHALENE 160000 2000000
PHENANTHRENE 2300000 31000000
PYRENE 230000 3100000
POLYCYCLIC AROMATIC HYDROCARBONS (UG/KG)
PETROLEUM HYDROCARBONS (UG/KG)
PETROLEUM HYDROCARBONS (MG/KG)
NA NA NA NA NA NA
NA NA NA NA NA NA
NA NA NA NA NA NA
NA NA NA NA NA NA
NA NA NA NA NA NA
NA NA NA NA NA NA
NA NA NA NA NA NA
NA NA NA NA NA NA
NA NA NA NA NA NA
NA NA NA NA NA NA
NA NA NA NA NA NA
NA NA NA NA NA NA
NA NA NA NA NA NA
NA NA NA NA NA NA
-- -- -- -- -- --
NA NA NA NA NA NA
NA NA NA NA NA NA
NA NA NA NA NA NA
NA NA NA NA NA NA
NA NA NA NA NA NA
NA NA NA NA NA NA
NA NA NA NA NA NA
NA NA NA NA NA NA
NA NA NA NA NA NA
NA NA NA NA NA NA
NA NA NA NA NA NA
NA NA NA NA NA NA
NA NA NA NA NA NA
NA NA NA NA NA NA
NA NA NA NA NA NA
NA NA NA NA NA NA
NA NA NA NA NA NA
E-SB-983-22-24 E-SB-983-26-28E-SB-983-14-16 E-SB-983-32-34E-SB-983-16-18 E-SB-983-18-20
20120719 2012071920120719 20120719 20120719 20120719
16 18 2614 3222
28 3416 18 20 24

TABLE 4-8
ANALYTES DETECTED IN BLOCK E DEEP BORING SOIL SAMPLES, JUNE-JULY 2012
LOCKHEED MARTIN MIDDLE RIVER COMPLEX, MIDDLE RIVER, MARYLAND
PAGE 26 OF 32
SAMPLE ID Non-
SAMPLE DATE Residential Residential
TOP DEPTH (FEET BELOW GRADE) Screening Screening
BOTTOM DEPTH (FEET BELOW GRADE) Levels Levels
VOLATILES (UG/KG)1,2,3-TRICHLOROBENZENE 29000 NA
1,2,4-TRICHLOROBENZENE 38000 175000
1,2-DICHLOROBENZENE 700000 9200000
1,2-DICHLOROETHANE 7000 31000
1,2-DICHLOROPROPANE 9400 42000
1,3-DICHLOROBENZENE 23000 3100001,4-DICHLOROBENZENE 31000 NA
1-BUTANOL NA NA
2-BUTANONE 4700000 61000000
ACETONE 7000000 92000000
CHLOROBENZENE 160000 2000000CYCLOHEXANONE NA NA
DIETHYL ETHER NA NA
ETHYLBENZENE 780000 10000000HEXANE NA NA
METHYL ACETATE NA NA
METHYLENE CHLORIDE 85000 380000
NAPHTHALENE 160000 2000000
STYRENE 1600000 20000000
TETRACHLOROETHENE 1200 5300
TOLUENE 630000 8200000
TOTAL XYLENES 1600000 20000000TRANS-1,4-DICHLORO-2-BUTENE NA NA
TRICHLOROETHENE 1600 7200
E-SB-983-22-24 E-SB-983-26-28E-SB-983-14-16 E-SB-983-32-34E-SB-983-16-18 E-SB-983-18-20
20120719 2012071920120719 20120719 20120719 20120719
16 18 2614 3222
28 3416 18 20 24
NA NA NA NA NA NA
NA NA NA NA NA NA
NA NA NA NA NA NA
NA NA NA NA NA NA
NA NA NA NA NA NA
NA NA NA NA NA NA
NA NA NA NA NA NA
NA NA NA NA NA NA
NA NA NA NA NA NA
NA NA NA NA NA NA
NA NA NA NA NA NA
NA NA NA NA NA NA
NA NA NA NA NA NA
NA NA NA NA NA NA
NA NA NA NA NA NA
NA NA NA NA NA NA
NA NA NA NA NA NA
NA NA NA NA NA NA
NA NA NA NA NA NA
NA NA NA NA NA NA
NA NA NA NA NA NA
NA NA NA NA NA NA
NA NA NA NA NA NA
NA NA NA NA NA NA

TABLE 4-8
ANALYTES DETECTED IN BLOCK E DEEP BORING SOIL SAMPLES, JUNE-JULY 2012
LOCKHEED MARTIN MIDDLE RIVER COMPLEX, MIDDLE RIVER, MARYLAND
PAGE 27 OF 32
SAMPLE ID Non-
SAMPLE DATE Residential Residential
TOP DEPTH (FEET BELOW GRADE) Screening Screening
BOTTOM DEPTH (FEET BELOW GRADE) Levels Levels
METALS (MG/KG)
ARSENIC 12(1)
12(1)
BARIUM 1600 20000
BERYLLIUM 16 200
CADMIUM 3.9 51
CHROMIUM 23 310
COBALT NA NA
COPPER 310 4100
LEAD 400 1000
MOLYBDENUM NA NA
NICKEL 160 2000
SELENIUM 39 510
SILVER 39 510
VANADIUM 91(1)
91(1)
ZINC 2300 31000PCBS (UG/KG)AROCLOR-1260 1000 10000
TPH-DRO 230 620
TPH-GRO 230000 620000
ACENAPHTHENE 470000 6100000
ANTHRACENE 2300000 31000000
BAP EQUIVALENT-HALFND 140(1)
2900(1)
BENZO(A)ANTHRACENE 220 3900
BENZO(A)PYRENE 22 390
BENZO(B)FLUORANTHENE 220 3900
BENZO(G,H,I)PERYLENE 230000 3100000
BENZO(K)FLUORANTHENE 2200 39000
CHRYSENE 22000 390000
FLUORANTHENE 310000 4100000
FLUORENE 310000 4100000
INDENO(1,2,3-CD)PYRENE 220 3900
NAPHTHALENE 160000 2000000
PHENANTHRENE 2300000 31000000
PYRENE 230000 3100000
POLYCYCLIC AROMATIC HYDROCARBONS (UG/KG)
PETROLEUM HYDROCARBONS (UG/KG)
PETROLEUM HYDROCARBONS (MG/KG)
NA NA NA NA NA NA
NA NA NA NA NA NA
NA NA NA NA NA NA
NA NA NA NA NA NA
NA NA NA NA NA NA
NA NA NA NA NA NA
NA NA NA NA NA NA
NA NA NA NA NA NA
NA NA NA NA NA NA
NA NA NA NA NA NA
NA NA NA NA NA NA
NA NA NA NA NA NA
NA NA NA NA NA NA
NA NA NA NA NA NA
-- 920 860 1700000 340 400
NA NA NA 750 B NA NA
NA NA NA -- NA NA
NA -- -- -- -- --
NA -- -- -- -- --
NA -- -- -- -- --
NA -- -- -- -- --
NA -- -- -- -- --
NA -- -- -- -- --
NA -- -- -- -- --
NA -- -- -- -- --
NA -- -- -- -- --
NA -- -- 18 -- --
NA -- -- -- -- --
NA -- -- -- -- --
NA -- -- -- -- --
NA -- -- 15 -- --
NA -- -- -- -- --
E-SB-983-36-38 E-SB-984-0-2 E-SB-984-2-4 E-SB-984-4-6 E-SB-984-6-8 E-SB-984-8-10
20120719 20120724 20120724 20120724 2012072420120724
4 6 82036
38 42 6 8 10

TABLE 4-8
ANALYTES DETECTED IN BLOCK E DEEP BORING SOIL SAMPLES, JUNE-JULY 2012
LOCKHEED MARTIN MIDDLE RIVER COMPLEX, MIDDLE RIVER, MARYLAND
PAGE 28 OF 32
SAMPLE ID Non-
SAMPLE DATE Residential Residential
TOP DEPTH (FEET BELOW GRADE) Screening Screening
BOTTOM DEPTH (FEET BELOW GRADE) Levels Levels
VOLATILES (UG/KG)1,2,3-TRICHLOROBENZENE 29000 NA
1,2,4-TRICHLOROBENZENE 38000 175000
1,2-DICHLOROBENZENE 700000 9200000
1,2-DICHLOROETHANE 7000 31000
1,2-DICHLOROPROPANE 9400 42000
1,3-DICHLOROBENZENE 23000 3100001,4-DICHLOROBENZENE 31000 NA
1-BUTANOL NA NA
2-BUTANONE 4700000 61000000
ACETONE 7000000 92000000
CHLOROBENZENE 160000 2000000CYCLOHEXANONE NA NA
DIETHYL ETHER NA NA
ETHYLBENZENE 780000 10000000HEXANE NA NA
METHYL ACETATE NA NA
METHYLENE CHLORIDE 85000 380000
NAPHTHALENE 160000 2000000
STYRENE 1600000 20000000
TETRACHLOROETHENE 1200 5300
TOLUENE 630000 8200000
TOTAL XYLENES 1600000 20000000TRANS-1,4-DICHLORO-2-BUTENE NA NA
TRICHLOROETHENE 1600 7200
E-SB-983-36-38 E-SB-984-0-2 E-SB-984-2-4 E-SB-984-4-6 E-SB-984-6-8 E-SB-984-8-10
20120719 20120724 20120724 20120724 2012072420120724
4 6 82036
38 42 6 8 10
NA NA NA 69000 NA NA
NA NA NA 310000 NA NA
NA NA NA 3100 J NA NA
NA NA NA -- NA NA
NA NA NA -- NA NA
NA NA NA 320 J NA NA
NA NA NA 3700 J NA NA
NA NA NA NA NA NA
NA NA NA 3100 J NA NA
NA NA NA -- NA NA
NA NA NA -- NA NA
NA NA NA 16000 NJ NA NA
NA NA NA 640 NJ NA NA
NA NA NA 180 J NA NA
NA NA NA 1100 NJ NA NA
NA NA NA 780 NJ NA NA
NA NA NA -- NA NA
NA NA NA 770 J NA NA
NA NA NA 280 J NA NA
NA NA NA 710 J NA NA
NA NA NA -- NA NA
NA NA NA 370 J NA NA
NA NA NA 1300 NJ NA NA
NA NA NA 340 J NA NA

TABLE 4-8
ANALYTES DETECTED IN BLOCK E DEEP BORING SOIL SAMPLES, JUNE-JULY 2012
LOCKHEED MARTIN MIDDLE RIVER COMPLEX, MIDDLE RIVER, MARYLAND
PAGE 29 OF 32
SAMPLE ID Non-
SAMPLE DATE Residential Residential
TOP DEPTH (FEET BELOW GRADE) Screening Screening
BOTTOM DEPTH (FEET BELOW GRADE) Levels Levels
METALS (MG/KG)
ARSENIC 12(1)
12(1)
BARIUM 1600 20000
BERYLLIUM 16 200
CADMIUM 3.9 51
CHROMIUM 23 310
COBALT NA NA
COPPER 310 4100
LEAD 400 1000
MOLYBDENUM NA NA
NICKEL 160 2000
SELENIUM 39 510
SILVER 39 510
VANADIUM 91(1)
91(1)
ZINC 2300 31000PCBS (UG/KG)AROCLOR-1260 1000 10000
TPH-DRO 230 620
TPH-GRO 230000 620000
ACENAPHTHENE 470000 6100000
ANTHRACENE 2300000 31000000
BAP EQUIVALENT-HALFND 140(1)
2900(1)
BENZO(A)ANTHRACENE 220 3900
BENZO(A)PYRENE 22 390
BENZO(B)FLUORANTHENE 220 3900
BENZO(G,H,I)PERYLENE 230000 3100000
BENZO(K)FLUORANTHENE 2200 39000
CHRYSENE 22000 390000
FLUORANTHENE 310000 4100000
FLUORENE 310000 4100000
INDENO(1,2,3-CD)PYRENE 220 3900
NAPHTHALENE 160000 2000000
PHENANTHRENE 2300000 31000000
PYRENE 230000 3100000
POLYCYCLIC AROMATIC HYDROCARBONS (UG/KG)
PETROLEUM HYDROCARBONS (UG/KG)
PETROLEUM HYDROCARBONS (MG/KG)
NA NA NA NA NA NA
NA NA NA NA NA NA
NA NA NA NA NA NA
NA NA NA NA NA NA
NA NA NA NA NA NA
NA NA NA NA NA NA
NA NA NA NA NA NA
NA NA NA NA NA NA
NA NA NA NA NA NA
NA NA NA NA NA NA
NA NA NA NA NA NA
NA NA NA NA NA NA
NA NA NA NA NA NA
NA NA NA NA NA NA
480000 120000 10000 250 210 --
1000 B NA NA NA NA NA
-- NA NA NA NA NA
-- NA NA NA NA NA
-- NA NA NA NA NA
-- NA NA NA NA NA
-- NA NA NA NA NA
-- NA NA NA NA NA
-- NA NA NA NA NA
-- NA NA NA NA NA
-- NA NA NA NA NA
-- NA NA NA NA NA
-- NA NA NA NA NA
-- NA NA NA NA NA
-- NA NA NA NA NA
-- NA NA NA NA NA
-- NA NA NA NA NA
-- NA NA NA NA NA
E-SB-984-18-20 E-SB-984-22-24E-SB-984-10-12 E-SB-984-12-14 E-SB-984-14-16 E-SB-984-16-18
20120724 20120724 2012072420120724 20120724 20120724
10 12 14 16 18 22
12 14 16 18 20 24
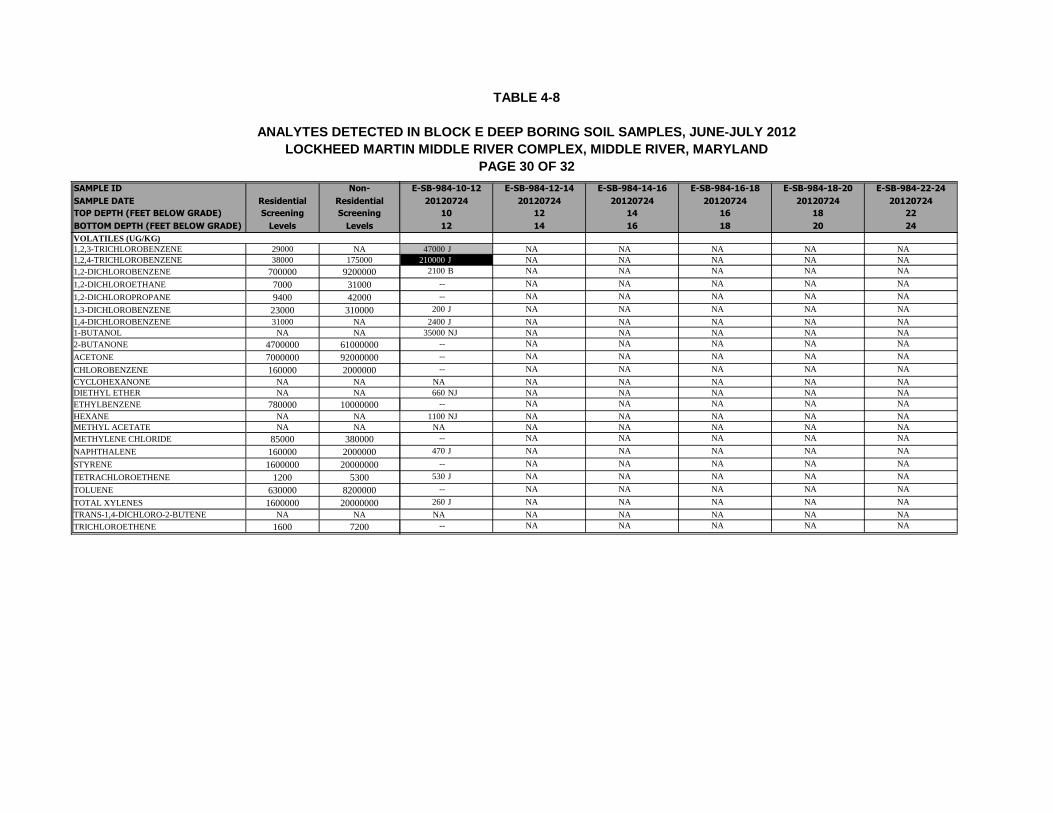
TABLE 4-8
ANALYTES DETECTED IN BLOCK E DEEP BORING SOIL SAMPLES, JUNE-JULY 2012
LOCKHEED MARTIN MIDDLE RIVER COMPLEX, MIDDLE RIVER, MARYLAND
PAGE 30 OF 32
SAMPLE ID Non-
SAMPLE DATE Residential Residential
TOP DEPTH (FEET BELOW GRADE) Screening Screening
BOTTOM DEPTH (FEET BELOW GRADE) Levels Levels
VOLATILES (UG/KG)1,2,3-TRICHLOROBENZENE 29000 NA
1,2,4-TRICHLOROBENZENE 38000 175000
1,2-DICHLOROBENZENE 700000 9200000
1,2-DICHLOROETHANE 7000 31000
1,2-DICHLOROPROPANE 9400 42000
1,3-DICHLOROBENZENE 23000 3100001,4-DICHLOROBENZENE 31000 NA
1-BUTANOL NA NA
2-BUTANONE 4700000 61000000
ACETONE 7000000 92000000
CHLOROBENZENE 160000 2000000CYCLOHEXANONE NA NA
DIETHYL ETHER NA NA
ETHYLBENZENE 780000 10000000HEXANE NA NA
METHYL ACETATE NA NA
METHYLENE CHLORIDE 85000 380000
NAPHTHALENE 160000 2000000
STYRENE 1600000 20000000
TETRACHLOROETHENE 1200 5300
TOLUENE 630000 8200000
TOTAL XYLENES 1600000 20000000TRANS-1,4-DICHLORO-2-BUTENE NA NA
TRICHLOROETHENE 1600 7200
E-SB-984-18-20 E-SB-984-22-24E-SB-984-10-12 E-SB-984-12-14 E-SB-984-14-16 E-SB-984-16-18
20120724 20120724 2012072420120724 20120724 20120724
10 12 14 16 18 22
12 14 16 18 20 24
47000 J NA NA NA NA NA
210000 J NA NA NA NA NA
2100 B NA NA NA NA NA
-- NA NA NA NA NA
-- NA NA NA NA NA
200 J NA NA NA NA NA
2400 J NA NA NA NA NA
35000 NJ NA NA NA NA NA
-- NA NA NA NA NA
-- NA NA NA NA NA
-- NA NA NA NA NA
NA NA NA NA NA NA
660 NJ NA NA NA NA NA
-- NA NA NA NA NA
1100 NJ NA NA NA NA NA
NA NA NA NA NA NA
-- NA NA NA NA NA
470 J NA NA NA NA NA
-- NA NA NA NA NA
530 J NA NA NA NA NA
-- NA NA NA NA NA
260 J NA NA NA NA NA
NA NA NA NA NA NA
-- NA NA NA NA NA
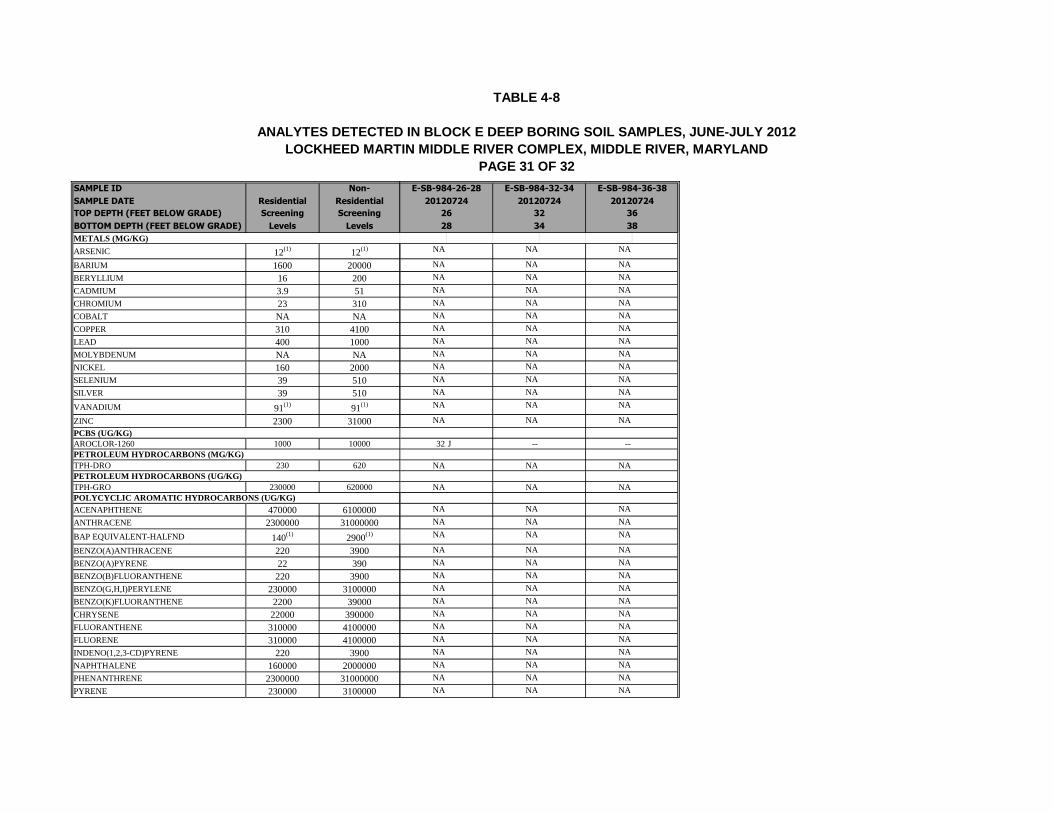
TABLE 4-8
ANALYTES DETECTED IN BLOCK E DEEP BORING SOIL SAMPLES, JUNE-JULY 2012
LOCKHEED MARTIN MIDDLE RIVER COMPLEX, MIDDLE RIVER, MARYLAND
PAGE 31 OF 32
SAMPLE ID Non-
SAMPLE DATE Residential Residential
TOP DEPTH (FEET BELOW GRADE) Screening Screening
BOTTOM DEPTH (FEET BELOW GRADE) Levels Levels
METALS (MG/KG)
ARSENIC 12(1)
12(1)
BARIUM 1600 20000
BERYLLIUM 16 200
CADMIUM 3.9 51
CHROMIUM 23 310
COBALT NA NA
COPPER 310 4100
LEAD 400 1000
MOLYBDENUM NA NA
NICKEL 160 2000
SELENIUM 39 510
SILVER 39 510
VANADIUM 91(1)
91(1)
ZINC 2300 31000PCBS (UG/KG)AROCLOR-1260 1000 10000
TPH-DRO 230 620
TPH-GRO 230000 620000
ACENAPHTHENE 470000 6100000
ANTHRACENE 2300000 31000000
BAP EQUIVALENT-HALFND 140(1)
2900(1)
BENZO(A)ANTHRACENE 220 3900
BENZO(A)PYRENE 22 390
BENZO(B)FLUORANTHENE 220 3900
BENZO(G,H,I)PERYLENE 230000 3100000
BENZO(K)FLUORANTHENE 2200 39000
CHRYSENE 22000 390000
FLUORANTHENE 310000 4100000
FLUORENE 310000 4100000
INDENO(1,2,3-CD)PYRENE 220 3900
NAPHTHALENE 160000 2000000
PHENANTHRENE 2300000 31000000
PYRENE 230000 3100000
POLYCYCLIC AROMATIC HYDROCARBONS (UG/KG)
PETROLEUM HYDROCARBONS (UG/KG)
PETROLEUM HYDROCARBONS (MG/KG)
NA NA NA
NA NA NA
NA NA NA
NA NA NA
NA NA NA
NA NA NA
NA NA NA
NA NA NA
NA NA NA
NA NA NA
NA NA NA
NA NA NA
NA NA NA
NA NA NA
32 J -- --
NA NA NA
NA NA NA
NA NA NA
NA NA NA
NA NA NA
NA NA NA
NA NA NA
NA NA NA
NA NA NA
NA NA NA
NA NA NA
NA NA NA
NA NA NA
NA NA NA
NA NA NA
NA NA NA
NA NA NA
E-SB-984-26-28 E-SB-984-32-34 E-SB-984-36-38
2012072420120724 20120724
32 3626
28 34 38

TABLE 4-8
ANALYTES DETECTED IN BLOCK E DEEP BORING SOIL SAMPLES, JUNE-JULY 2012
LOCKHEED MARTIN MIDDLE RIVER COMPLEX, MIDDLE RIVER, MARYLAND
PAGE 32 OF 32
SAMPLE ID Non-
SAMPLE DATE Residential Residential
TOP DEPTH (FEET BELOW GRADE) Screening Screening
BOTTOM DEPTH (FEET BELOW GRADE) Levels Levels
VOLATILES (UG/KG)1,2,3-TRICHLOROBENZENE 29000 NA
1,2,4-TRICHLOROBENZENE 38000 175000
1,2-DICHLOROBENZENE 700000 9200000
1,2-DICHLOROETHANE 7000 31000
1,2-DICHLOROPROPANE 9400 42000
1,3-DICHLOROBENZENE 23000 3100001,4-DICHLOROBENZENE 31000 NA
1-BUTANOL NA NA
2-BUTANONE 4700000 61000000
ACETONE 7000000 92000000
CHLOROBENZENE 160000 2000000CYCLOHEXANONE NA NA
DIETHYL ETHER NA NA
ETHYLBENZENE 780000 10000000HEXANE NA NA
METHYL ACETATE NA NA
METHYLENE CHLORIDE 85000 380000
NAPHTHALENE 160000 2000000
STYRENE 1600000 20000000
TETRACHLOROETHENE 1200 5300
TOLUENE 630000 8200000
TOTAL XYLENES 1600000 20000000TRANS-1,4-DICHLORO-2-BUTENE NA NA
TRICHLOROETHENE 1600 7200
E-SB-984-26-28 E-SB-984-32-34 E-SB-984-36-38
2012072420120724 20120724
32 3626
28 34 38
NA NA NA
NA NA NA
NA NA NA
NA NA NA
NA NA NA
NA NA NA
NA NA NA
NA NA NA
NA NA NA
NA NA NA
NA NA NA
NA NA NA
NA NA NA
NA NA NA
NA NA NA mg/kg - milligrams per kilogram
NA NA NA ug/kg - micrograms per kilogram
NA NA NA NA = CRITERION NOT AVAILABLE OR NOT ANALYZED
NA NA NA EXCEEDS BOTH CRITERIA
NA NA NA EXCEEDS ONE CRITERION
NA NA NA L = Positive result biased low due to quality control noncompliance.
NA NA NA NJ = Tentatively Identified Compound.
NA NA NA J = Positive result estimated due to quality control noncompliance.
NA NA NA "--" denotes nondetected result.
NA NA NA B = Result is considered to be from laboratory blank contamination.
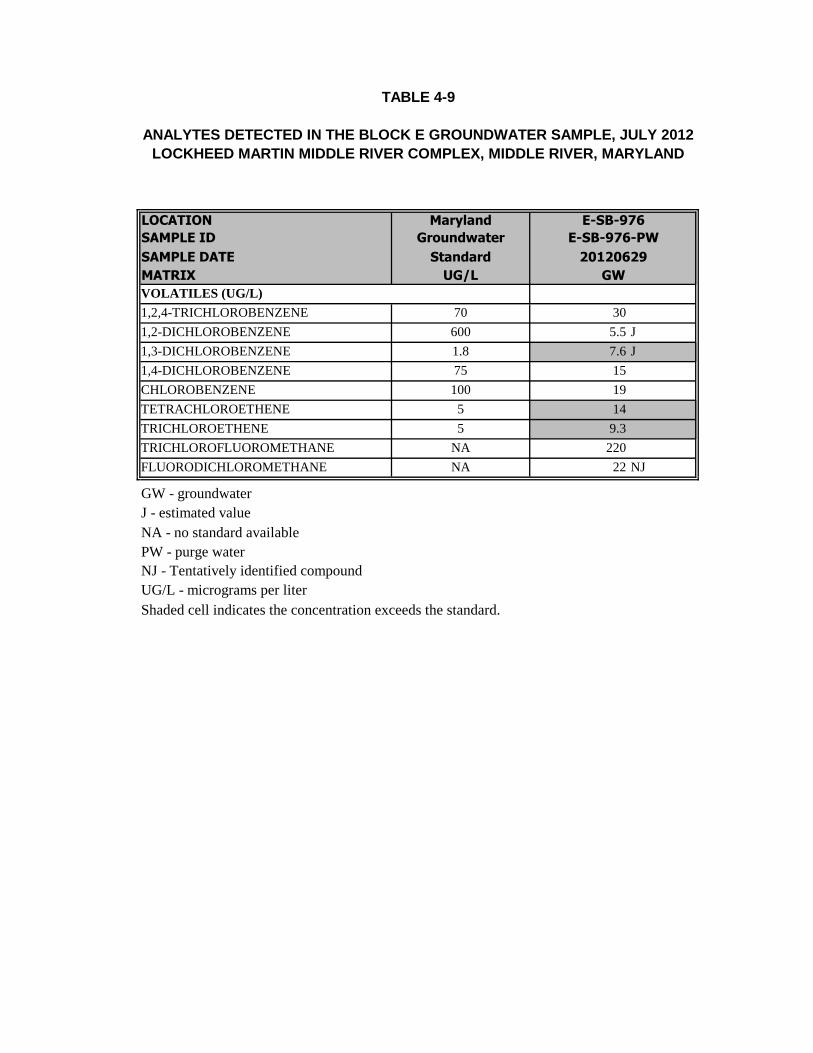
TABLE 4-9
ANALYTES DETECTED IN THE BLOCK E GROUNDWATER SAMPLE, JULY 2012
LOCKHEED MARTIN MIDDLE RIVER COMPLEX, MIDDLE RIVER, MARYLAND
LOCATION Maryland
SAMPLE ID Groundwater
SAMPLE DATE Standard
MATRIX UG/L
VOLATILES (UG/L)
1,2,4-TRICHLOROBENZENE 70 30
1,2-DICHLOROBENZENE 600 5.5 J
1,3-DICHLOROBENZENE 1.8 7.6 J
1,4-DICHLOROBENZENE 75 15
CHLOROBENZENE 100 19
TETRACHLOROETHENE 5 14
TRICHLOROETHENE 5 9.3
TRICHLOROFLUOROMETHANE NA 220
FLUORODICHLOROMETHANE NA 22 NJ
GW - groundwater
J - estimated value
NA - no standard available
PW - purge water
NJ - Tentatively identified compound
UG/L - micrograms per liter
Shaded cell indicates the concentration exceeds the standard.
E-SB-976
E-SB-976-PW
20120629
GW

7903 TETRA TECH • LOCKHEED MARTIN MIDDLE RIVER COMPLEX •2012 ADDITIONAL BLOCK E SOIL INVESTIGATION REPORT PAGE 4-15
Tables 4-1 through 4-9

7903 TETRA TECH • LOCKHEED MARTIN MIDDLE RIVER COMPLEX •2012 ADDITIONAL BLOCK E SOIL INVESTIGATION REPORT PAGE 4-16
Figures 4-1 through 4-8
7903 TETRA TECH • LOCKHEED MARTIN MIDDLE RIVER COMPLEX •2012 ADDITIONAL BLOCK E SOIL INVESTIGATION REPORT PAGE 5-1
Section 5
Block E Southwestern AreaConceptual Site Model
A conceptual site model (CSM) was developed for polychlorinated biphenyl (PCB)
contamination in the southwestern portion of Block E based on known history and operations,
current site conditions, PCB chemical results, and PCB behavior in the environment. From
2003–2012, numerous soil samples have been collected and chemically analyzed to identify
potential soil contaminants at Block E. The Block E soil human health risk assessment (HHRA)
identified PCBs, benzo(a)pyrene equivalent (BaPEq), and the volatile organic compounds
(VOCs) 1,2,3-trichlorobenzene (123-TCB), 1,2,4-trichlorobenzene (124-TCB), and
1,4-dichlorobenzene (14-DCB) as primary contaminants of concern (COC) for Block E soil.
Arsenic and hexavalent chromium (CrVI) were also initially identified as COC, but arsenic
concentrations are considered representative of background concentrations and account for less
overall risk than the other COC.
The soil data suggest that only low concentrations of CrVI (typically less than 1 milligram per
kilogram [mg/kg]) are on site; reported CrVI concentrations do not exceed the risk-based
screening level for the industrial worker. Furthermore, CrVI concentrations reported for most soil
samples are also less than the risk-based screening levels for the hypothetical future resident, if
the levels were set at the 1×10⁻⁵ cancer risk level. PCBs are more widespread in soil at Block E,
account for most of the overall risk to human health, and are at elevated concentrations in the
subsurface at the southwestern portion of Block E. For these reasons, a CSM focusing on PCB
contamination in soil in the southwestern portion of Block E was developed through the
evaluation of site characteristics, known previous site operations, building foundation
construction, site geology, and potential contaminant pathways.

7903 TETRA TECH • LOCKHEED MARTIN MIDDLE RIVER COMPLEX •2012 ADDITIONAL BLOCK E SOIL INVESTIGATION REPORT PAGE 5-2
5.1 BLOCK E FORMER SITE OPERATIONS
As mentioned previously, Building D was built in the early 1940s for final assembly of aircraft
frames and was later demolished sometime between 1970 and 1974. The building had an
assembly floor (first floor) and a basement (current concrete slab) and occupied a total building
footprint of approximately 400,000 square feet. The former basement areas of former Building D
were used for welding, extrusion milling, engine preparation, and assembly (see Figure 2-7).
Former elevators and heater rooms were located along the northern, eastern, and southern
interior building-perimeter areas, and former electrical transformer rooms were located along the
northern and southern interior building-perimeter areas. The northwestern and southwestern
portions of the basement housed several nuclear-related offices and laboratories. Cleaning,
plating, and finishing work areas were along the southern interior wall near the building’s center.
As part of the 2012 electrical resistivity imaging (ERI) survey, a nine-foot deep subsurface void
was found below the concrete slab at the former location of the southern elevator. This void is
approximately 60 feet east of the deep PCB contamination found at soil borings SB-852, SB-854
and SB-833 (see Figure 4-6). Soil samples collected around the former elevator area indicate
only shallow soil PCB contamination; however, deep soil samples have not been collected
adjacent to or beneath the former elevator area. Although this area would not be expected to be
the source for PCBs in the deeper subsurface soil to the west, additional soil sampling here
would be necessary to fully assess this location as a potential contaminant source area.
Several electrical-service manholes were in the interior of the building. Engineering drawings
indicate sump pumps and small-diameter discharge lines that were apparently used to pump out
standing water from the manholes. These pipes ran to the building exterior and are shown as
being connected to the northern and southern storm sewer lines. The drawings show numerous
floor drains and indicate that they are connected to the storm sewer system.
As part of the storm-sewer interim remedial measures (IRM) conducted in 2011, manhole MH-9,
which was previously buried, was partially excavated, repaired, and the top extended to the
ground surface to drain runoff. At the time of this repair, a pipe lateral was observed extending
from the manhole toward the building slab, indicating that floor drains may be connected to the
storm sewer system at Block E. Other portions of the storm sewer system in this area could not
7903 TETRA TECH • LOCKHEED MARTIN MIDDLE RIVER COMPLEX •2012 ADDITIONAL BLOCK E SOIL INVESTIGATION REPORT PAGE 5-3
be accessed during the IRM due to blockages; therefore, closed-circuit television of the storm
sewer could not be conducted to confirm the presence of other floor drain connections.
5.2 BLOCK E CONCRETE SLAB FOUNDATION
The former Building D foundation system is described below. Information on the foundation was
obtained by reviewing existing as-built foundation drawings, including “Plant One—
Building ‘D’ for the Glenn L. Martin Co., Middle River, Baltimore, Maryland,” dated August 22,
1945. Drawings used for the description below include sheets “1-S, Footing Plan—Column and
Footing Schedule,” “2, Foundation Plan,” and “2-S, Wall & Foundation Detail.” These
documents are in Appendix I of this report.
The foundation system for the former Building D is comprised of both typical reinforced-
concrete spread footings and reinforced-concrete pile caps over a multiple round-pile system.
The spread footings and pile caps are spaced at approximately 25 feet-0 inches on-center in both
the east–west and north–south directions. At the exterior of the building, a reinforced-concrete
foundation wall and continuous wall footing are provided between the concrete column/footing
locations. The typical concrete spread footings are generally east of column line 21 and west of
column line 16. The drawings indicate that all of the pile-supported footings lie between column
lines 16 and 21.
The basement slab-on-grade was comprised of eight inches of concrete. The drawings show no
reinforcement details to indicate that the slab-on-grade was reinforced, but reinforcing has been
observed in the field where the concrete has been disturbed. In addition, a reinforced-concrete
retaining wall and associated footing lies at the southwestern corner of the building. This
retaining wall extends approximately 60 feet beyond the face of the main portion of the building.
The general construction of the typical reinforced-concrete spread footings included footings
with dimensions ranging from 5-feet 6-inches by 5-feet 6-inches to 16-feet 6-inches by
20-feet 0-inches. Their respective reinforcing ranged from 13 0.5-inch-diameter bars spanning
both ways to 37 one-inch-diameter bars spanning both ways. Their respective loading conditions,
as indicated in sheet “1-S, Footing Plan—Column and Footing Schedule,” ranged from
150 kilopounds (kips) for the 5-foot 6-inch square footing to 1763 kips for the 16-foot by 20-foot
footing.
7903 TETRA TECH • LOCKHEED MARTIN MIDDLE RIVER COMPLEX •2012 ADDITIONAL BLOCK E SOIL INVESTIGATION REPORT PAGE 5-4
The general construction of the concrete pile caps over concrete piles includes pile caps ranging
from 5-feet 6-inches by 5-feet 6-inches to 13-feet 2-inches by 14-feet 6-inches. Their respective
reinforcing ranges from six one-inch-diameter bars spanning both ways to 29 one-inch-diameter
bars spanning both ways. Their respective loading conditions, as indicated in sheet “1-S, Footing
Plan—Column and Footing Schedule,” ranged from 210 kips for the five-foot-square footing
pile-caps to 1763 kips for the 13-foot by 14-foot footing pile-caps. In addition, the table in the
drawing indicates a pile capacity of 40 tons per pile.
The exact size, length, and composition of the existing round piles could not be determined from
information in the drawings. All concrete associated with the foundation system was to have a
compressive strength of 2,500 pounds per square inch at 28 days.
The footers in the area of former waste disposal area and southwestern former transformer room
where PCBs have been detected in deep soil are shown as fairly shallow, with depths ranging
from 4.5 to 5.2 feet below grade. The drawings indicate that deep piles driven for the foundation
support were installed east of the former waste disposal area and southwestern former
transformer room.
5.3 BLOCK E GEOLOGY AND HYDROGEOLOGY
The Block E area was a wetland before building construction. It was filled with soil to expand
the usable area of the Middle River Complex (MRC) and construct the building and Dark Head
Cove ramp areas to the south. Lithologic logging of soils beneath the MRC (conducted during
extensive site characterization) has identified a very heterogeneous substrate. Underlying soils
are composed primarily of silty sands, fine-grained to medium-grained sands, silty clays, clayey
silts, and plastic clay, with the primary lithology being clay to silty clay. Sand lenses were
encountered, but in general do not appear to be continuous beneath the facility.
Geologic soil logs for wells and soil boring at Block E were used to construct geologic
cross-sections across Block E. Locations of the cross-sections are shown in Figure 5-1.
Cross-sections A–A' and B–B' are shown in Figures 5-2 and 5-3, respectively.
Cross-section A–A' (Figure 5-2) is in the western portion of Block E, extending from well
MW-62C to the northwest to well MW-103 to the southeast. Concrete covers most of the ground

7903 TETRA TECH • LOCKHEED MARTIN MIDDLE RIVER COMPLEX •2012 ADDITIONAL BLOCK E SOIL INVESTIGATION REPORT PAGE 5-5
surface along this cross-section. The cross-section shows a two- to three-foot-thick sand layer
beneath the concrete at soil boring SB-853 and south to well MW-103. Sandy fine-grained gravel
was encountered at these depths at soil boring SB-852, west of SB-853. Samples were not
recovered at depths of 1.5–8 feet at SB-852 and 2–4.5 feet at SB-853, as indicated by white areas
in the figure.
Generally, the subsurface in the western portion of Block E consists of clay, silty clay, and clayey
silt to a depth of 30 feet below grade. Four thin interbeds of silty-sand and sandy-silt are in this
area. At SB-853, silty-sand and sandy-silt layers were observed at depths of 5.5–6 feet,
12.5–13 feet, 19.5–20 feet, and 26–26.5 feet below grade. The silty-sand and sandy-silt layers are
thickest at MW-62C, and pinch out toward the south at SB-853. Only the upper layer of silty-
sand and sandy-silt was observed to the south at well MW-103. A sandy-silt and fine sand layer
was encountered at depths of 50–63 feet below grade at well MW-62C.
Cross-section B–B' (Figure 5-3) is in the southern portion of Block E and extends from soil
boring SB-852 to the west to well MW-105 to the east. This cross-section runs along the
southern interior edge of the former Building D footprint. Concrete covers most of the ground
surface along this cross-section. Generally, the subsurface along the southern portion of Block E
consists of clay, silty clay, and clayey silt to a depth of 30 feet below grade. A thin layer of silty
sand and medium-grained sand occurs at depths of 12–13.5 feet at SB-854 and 9.5–12 feet at
SB-859. However, this material was not found farther east at SB-837 (except that silty clay with
gravel and medium-grained sand are reported at a depth of 9–9.5 feet at SB-837). Voids were
reported in the boring log at depths of 2–11 feet at SB-857 (not shown) northwest of SB-859.
Farther east, a thicker, more extensive silty sand was encountered at depths of 15–30 feet at
MW-72B and 9–29 feet at MW-105.
Groundwater in the Block E area is shallow, with measured groundwater depths ranging from
approximately one foot to slightly more than eight feet below grade in the central and southern
portions of Block E, and 10–15 feet below grade in the northern portion of Block E, as measured
in groundwater monitoring wells. Groundwater levels fluctuate seasonally and respond to
droughts and moderate to heavy precipitation events. Annual groundwater-level data for Block E
wells show that groundwater level fluctuation range from approximately 0.5 to nearly three feet,
and are typically higher in late fall through early spring in response to recharge from meso-scale

7903 TETRA TECH • LOCKHEED MARTIN MIDDLE RIVER COMPLEX •2012 ADDITIONAL BLOCK E SOIL INVESTIGATION REPORT PAGE 5-6
frontal systems (i.e., coastal low-pressure systems) and occasional tropical storms. However,
these levels were measured during discrete annual rounds of groundwater levels; therefore, these
groundwater fluctuations may be greater than indicated, and do not reflect groundwater levels
that were monitored continuously or seasonally at wells. For example, the available data may not
show short-term, transient groundwater-level responses from significant recharge due to a large
precipitation event.
A recent (July 2012) Block E groundwater-elevation contour map was developed for this
investigation for the upper surficial aquifer wells (see Figure 4-1). Groundwater elevation
contours can be used to estimate groundwater flow direction, as groundwater generally is
expected to flow perpendicular to the elevation contours, or what is known as the “groundwater
potentiometric surface.” As illustrated in the July 2012 groundwater-elevation contour map, (see
Figure 4-1), groundwater in Block E flows southeast toward Dark Head Cove.
Local groundwater flow is influenced by several factors, and can deviate from the mapped
surface based on well data in the presence of more-permeable naturally occurring stratigraphic
layers. Groundwater flow may also be altered by manmade features such as more-permeable
gravel or sand envelopes installed around subsurface utilities, leaking or broken subsurface
utilities (e.g., storm sewers or sanitary sewers), or low-permeability features such as subsurface
concrete footers, pilings, or walls that will act to impede or redirect groundwater flow.
Groundwater flow may also be influenced by surface features such as concrete or pavement
(reduced local infiltration and local groundwater recharge); wetlands, ponds, or storm-water
management ponds (increased infiltration and local groundwater recharge); or breaches in
concrete or paved surfaces (increased infiltration and local groundwater recharge). No surface
water bodies cross or emanate from Block E, and no wetlands have been identified in or around
Block E.
5.4 BLOCK E SURFACE WATER
Surface water runoff discharges from Block E via storm drains (see Figure 2-7), except for areas
immediately adjacent to Cow Pen Creek and Dark Head Cove (storm drains and storm drain
outfalls are shown in Figure 2-7 as yellow lines and light blue squares). Historical records show
more than 20 former Building D basement floor-drain lines (see drain cleanouts and drain lines
in Figure 2-7) connected to the storm-drain system, which ultimately discharges to Dark Head

7903 TETRA TECH • LOCKHEED MARTIN MIDDLE RIVER COMPLEX •2012 ADDITIONAL BLOCK E SOIL INVESTIGATION REPORT PAGE 5-7
Cove. Lockheed Martin Corporation maintains a State of Maryland National Pollutant Discharge
Elimination System (NPDES) permit (state discharge permit No.: 00-DP-0298,
NPDES No.: MD0002852), issued by the Maryland Department of the Environment (MDE)
Industrial Discharge Permits Division, Water Management Administration.
These records also show several sanitary sewer and storm drains beneath the floor (thick dashed
black lines in Figure 2-7). Recent field activities have found at least two open storm-drain catch
basins on or adjacent to the former Building D slab. No records indicate whether these lines are
currently open or if they have been sealed or filled as part of building demolition.
5.5 POSSIBLE BLOCK E PCB-RELEASE MECHANISMS ANDTRANSPORT PATHWAYS
Soil data collected from Block E indicate that past activities have released contaminants to the
surrounding environment. MRC site assessments indicate that a large percentage of site soils
contain very high clay and silt content and exhibit poor surface drainage. Several possible
scenarios can explain the PCBs detected in Block E soils. Currently, there are no records or
reports that confirm which mechanism(s) are responsible for the occurrence of PCBs in deep soil
at the southwestern portion of Block E.
Figures 5-4 through 5-6 show the PCB results for the samples along geologic cross-sections
A-A', A'–A (reverse view of A–A' to show PCB results hidden in A–A'), and B–B'. Figures 5-7
and 5-8 are fence diagrams that show closer views of the geology and PCB concentrations in the
area of the highest PCB concentrations (e.g., SB-833 and SB-853), along with results from
nearby 2012 deep borings.
Two of the highest PCB concentrations (19,000-24,000 mg/kg) were detected in soil samples
collected at borings SB-833 and SB-853. As shown in Figure 5-7, boring SB-833 has a thin layer
of silty sand at a depth of 9-10 feet below grade (elevations of 1 to 2 feet) at the sample location
of the elevated PCB concentration of 24,000 mg/kg (sample SB-833-9). Below the sand is clay at
a depth of 10 feet (elevation of 1 foot). At boring SB-853, an elevated PCB concentration of
19,000 mg/kg is present in a sample collected from a depth interval of 10-12 feet (+1 to -1 foot
elevation). At a depth of 12.5 feet at (approximate elevation of -1.5 feet) the silty-clay logged
above this depth changes to stiff, dense, clay with no silts or sands. The clay at 10 feet at SB-833

7903 TETRA TECH • LOCKHEED MARTIN MIDDLE RIVER COMPLEX •2012 ADDITIONAL BLOCK E SOIL INVESTIGATION REPORT PAGE 5-8
and the top of the denser clay at SB-853 at 12.5 feet (logged as containing no silt and sand) is
expected to inhibit PCBs from migrating to the deeper soil at highly elevated concentrations.
This is supported by the relatively lower PCBs concentrations in the next deeper samples
collected at these borings (61 mg/kg at SB-833-11 [11 feet] and 780 mg/kg at SB-853-12-16
[12-16 feet]).
PCB sample results in Figure 5-8 also show the presence of a soil boundary that has limited the
downward movement of elevated concentrations of PCBs to 10-15 feet below grade west-east
from SB-852 (west) to SB-855 (east). A sample collected at nine feet at soil boring SB-853 has
the highest PCB concentration of 19,000 mg/kg in Figure 5-8. At depths of 11.5 feet at SB-852
(approximate elevation of 0.5 feet in Figure 5-8) and 12.5 feet at SB-853 (approximate elevation
of -1.5 feet in Figure 5-8), the silty-clay logged above these depths changes to stiff, dense, clay
with no silts or sands. The top of this dense clay logged as containing no silt and sand (i.e., 11.5
and 12 feet) is expected to inhibit PCBs from migrating to the deeper soil at highly elevated
concentrations, and supported by the distinctly limited and lower PCB concentrations found in
samples collected below these depths (e.g., PCB concentrations at SB-853 reduce from
19,000 mg/kg at nine feet to 780 mg/kg at 11 feet). Similar distinct reductions in PCB
concentrations are found at a depth of 12 feet at a silty-sand and clay interface in SB-984 (where
PCBs reduce from 480 mg/kg to 120 mg/kg at an elevation of -1 foot in the figure), at a depth of
eight feet at SB-854 (where PCBs reduce from 470 mg/kg to 2 mg/kg at an elevation of three
feet), and a depth of 12 feet at SB-855 (where PCBs reduce from 680 mg/kg to 16 mg/kg at an
elevation of -1 foot).
Figures 5-7 and 5-8 also show the approximate boundaries for the PCB residential cleanup level
one mg/kg and the non-residential cleanup level of 10 mg/kg. The figures show that the primary
areas in the southwestern area are similar in size where PCBs exceed the residential and
non-residential cleanup levels. The primary source area extends from SB-833 to the north to
SB-862 to the south (Figure 5-7), and west of SB-852 to east of SB-855 (Figure 5-8). Note that
PCB concentrations above the non-residential cleanup level of 10 mg/kg extend north of SB-833
at SB-833A, SB-833I, and SB-848, but these are not shown on the figures. Results for SB-833I
and SB-848 are shown on Figures 5-4 and 5-5, respectively. Only in the area of soil borings
SB-852 and SB-853 are differences in depths apparent for the PCB residential and
non-residential screening level exceedances. In the area of these borings, the maximum depths

7903 TETRA TECH • LOCKHEED MARTIN MIDDLE RIVER COMPLEX •2012 ADDITIONAL BLOCK E SOIL INVESTIGATION REPORT PAGE 5-9
for non-residential cleanup level exceedances are approximately 20 feet below grade (elevation
of -9 feet) at SB-852, and 24 feet below grade (elevation of -13 feet) at SB-853.
As mentioned previously, dielectric fluids may have leaked or spilled from transformers at the
former transformer room in the southwestern portion of former Building D, possibly during
operations but also possibly during building demolition. PCB-containing wastes may have also
been stored at the former waste disposal area outside of the building. Since oils can penetrate
pores in concrete or travel through cracks or floor joints and degraded seals around features such
as cleanouts, vaults, or other utilities, a leaking or overfilled waste containment vessel or drum
could have resulted in a release that would travel to depth in the upper sandy and silty portions of
the soil column. As shown in Figure 5-8, the 1,000 mg/kg PCB contour line extends from a
shallow sample collected in gravel at SB-852 (PCBs at 3,300 mg/kg) to the nine-foot sample
collected at SB-853 (PCBs at 19,000 mg/kg). Elevated PCB concentrations of 680-800 mg/kg
were also in the shallow samples from SB-861 (not shown) and SB-862 (Figure 5-7). SB-852,
SB-853, SB-861, and SB-862 are located adjacent to each other in the western portion of the
southwestern former transformer room. Although there was poor lithologic sample recovery in
the upper portions of these soil borings SB-852 and SB-853, coarse-grained soils including
gravel and sand were encountered in the first 5-8 feet of these two borings. Gravelly, sandy, and
silty soils or the presence of voids in this shallow zone would not inhibit the downward
migration of dielectric fluids or oils spilled or leaked at the surface. Silty or sandy clays can also
become saturated with oils, particularly if smaller sand seams, macropores, or fissures are
present. Therefore, the origination of PCBs in the former southwestern transformer room may
have been from a surface release in the area of SB-861 and SB-862. Oil product reaching the
subsurface may spread across the top surface of clay layers or clay seams, or travel along
permeable materials installed along underground utility lines. A nine-foot deep void is also in the
area of a former elevator along the southern boundary of former Building D, which could have
provided a subsurface conduit for spilled or leaked PCB materials. Although the elevator area is
not expected to be the source for PCBs in the deeper subsurface soil to the west, additional soil
sampling at the elevator area would be necessary to fully assess this as a potential contaminant
source area. Elevated concentrations of PCBs have also been detected in soil around manholes
and in sediments in manholes and catch basins that are part of the storm drain system running
along the southern edge of the former Building D (see Figure 4-6). In Block E, surface soil

7903 TETRA TECH • LOCKHEED MARTIN MIDDLE RIVER COMPLEX •2012 ADDITIONAL BLOCK E SOIL INVESTIGATION REPORT PAGE 5-10
contaminants have been transported through overland runoff, storm water conveyance, and
erosion. PCBs have been detected in sediment in Dark Head Cove.
PCB-containing oils released to storm drains, catch basins, or sanitary sewer lines can enter the
subsurface soil through structural cracks and separations at pipe joints. The oils can migrate out
to the permeable envelope of gravel placed around the perimeter of these utilities during
construction.
Once released, chemicals may migrate within an environmental medium (e.g., soil) or migrate to
another environmental medium (e.g., air or water). PCBs in concrete and soil could migrate from
both surface and subsurface soil to groundwater through leaching of chemicals in the soil or in
the presence of a solvent. The migration of soil particulates from soil to air is probably
significantly limited, since most of the surface soils in the sub-areas of concern are either paved
or grass covered. Subsurface soil is not currently exposed in any of these sub-areas; however, if
future construction were to bring subsurface soil to the surface, contaminants in subsurface soil
could be transported into the air through wind erosion or through volatile emissions.
At Block E, transport of PCBs through groundwater is unlikely due to the hydrophobic
properties of PCBs; however, PCBs can be mobilized as dissolved constituents in groundwater in
the presence of solvents. Low concentrations of PCBs have been detected in groundwater
samples collected at Block E to date. PCBs have either not been detected in groundwater in
nearby wells, or have been detected only at well MW-43A, at a concentration of 0.24 µg/L in
2011, which is below the MDE groundwater standard of 0.5 µg/L. PCBs were not detected in
any Block E groundwater sample from wells in 2012.

7903 TETRA TECH • LOCKHEED MARTIN MIDDLE RIVER COMPLEX •2012 ADDITIONAL BLOCK E SOIL INVESTIGATION REPORT PAGE 6-1
Section 6
Summary
The 2012 Block E additional field investigation included an electrical resistivity imaging (ERI)
geophysical survey and the collection and chemical analyses of soil and one groundwater sample
to better identify and evaluate the horizontal and vertical extent of polychlorinated biphenyls
(PCBs), polycyclic aromatic hydrocarbons (PAHs), volatile organic compounds (VOCs), total
petroleum hydrocarbon (TPH)-gasoline-range organics (GRO), TPH-diesel-range organics
(DRO), and metals (including hexavalent chromium [CrVI]) in soils, and to obtain data to
complete an updated human health risk assessment (HHRA) and aid remedy selection. A
radiological study was also conducted and is provided separately as Appendix A. This
investigation entailed the following activities:
performed high-resolution, subsurface, electrical resistivity imaging, focusing within thesouthwest quadrant of the former Building D (which covered approximately 600 feet by270 feet) and using a 1.5-meter electrode 60-foot-grid spacing, obtaining 18 images to amaximum depth of 55 feet below grade
collected concrete surface samples at 40 locations associated with the former Building Dconcrete slab to evaluate current risk to site workers from polychlorinated biphenyls. Sixconcrete samples were also analyzed for asbestos, for waste characterization purposes.
advanced shallow soil borings at 28 locations to four feet below grade to furtherinvestigate polychlorinated biphenyls, polycyclic aromatic hydrocarbons, volatile organiccompounds, total petroleum hydrocarbons, and metals in soil along the periphery of theformer Building D foundation
advanced deep-soil borings at six locations (based on results of the geophysical survey)to depths of 40–50 feet below grade to further characterize polychlorinated biphenyls,polycyclic aromatic hydrocarbons, volatile organic compounds, total petroleumhydrocarbons, and metals in soil in areas near the former waste disposal area and formertransformer room
collected seventy-seven samples from concrete and shallow and deep soil, includingbackground samples of soil and concrete, and analyzed for isotopic uranium and thorium(Appendix A)

7903 TETRA TECH • LOCKHEED MARTIN MIDDLE RIVER COMPLEX •2012 ADDITIONAL BLOCK E SOIL INVESTIGATION REPORT PAGE 6-2
collected a shallow groundwater sample from a soil boring for chemical analyses andmeasurements of field parameters
collected groundwater levels for Block E wells
performed laboratory chemical analyses and chemical-data validation of soil samples
additionally, reviewed historical maps and figures to gain insight into the constructionand locations of underground utilities at former Building D, and to assess historicaloperations that may have led to the release of the identified contaminants of concern(COC)
The following summarizes the findings of the 2012 Block E program:
The electrical resistivity survey confirms the presence of a metallic water pipelinerunning through the study site. The pipeline runs from the southwestern corner to thenortheastern boundary of the survey area parallel to survey lines MID-4, MID-5, andMID-6. A nine-foot-deep void was detected after advancing a 10-foot long steel rod in thearea reported to be a former elevator shaft. Strong and consistent correlations betweenresistivity readings and lithology are not apparent in the survey results. Four soil boringswere advanced in areas of geophysical anomalies. Strong correlations between chemicalconstituents and high conductivity or high resistivity could not be established with thissurvey.
Overall, polychlorinated biphenyl concentrations greater than the residential screeninglevel were detected in three concrete samples and 28 soil samples collected inJune–July 2012. Aroclor-1242, Aroclor-1248, and Aroclor-1260 are the only PCBsdetected, with detected concentrations ranging from 0.020 milligrams per kilogram(mg/kg) to a maximum of 1,700 milligrams per kilograms in the 4–6 foot soil-samplinginterval at deep-soil boring E-SB-984, which is in the area of a former electricaltransformer room in the southwestern portion of Block E. The highest polychlorinatedbiphenyl concentration collected at a peripheral soil location was 800 milligrams perkilogram at E-SB-980-0–0.5, which is adjacent to the former electrical substation andtransformer room in the south–central portion of Block E.
The highest benzo(a)pyrene equivalents (BaPEq) concentrations, all of which areindustrial screening level exceedances (12 exceedances), and most residential screeninglevel exceedances are found in shallow soil at depths of 0–0.5 foot or 0.5–2 feet in theJune–July 2012 samples. Five residential screening-level exceedances were detected inthe June–July 2012 samples collected below two feet. The June–July 2012benzo(a)pyrene equivalent results confirm previous findings that benzo(a)pyreneequivalent concentrations are, for the most part, below the industrial screening level inthe northern and eastern portions of Block E, and that benzo(a)pyrene equivalentconcentrations primarily exceed screening levels in samples from the southern edge ofthe concrete slabs to the southern boundary of Block E.
7903 TETRA TECH • LOCKHEED MARTIN MIDDLE RIVER COMPLEX •2012 ADDITIONAL BLOCK E SOIL INVESTIGATION REPORT PAGE 6-3
Seventeen metals and hexavalent chromium (CrVI) were detected in one or moreperipheral samples. However, all metal concentrations are below non-residentialscreening levels, and exceed residential levels infrequently. In deep-boring soil samples,14 metals were detected in one or more samples, and nine metals were detected in allsamples. However, only two samples of chromium exceed the residential screening level,and two samples of vanadium exceed the residential and non-residential screening levels.
Twenty soil samples collected from the June–July 2012 deep borings were analyzed forvolatile organic compounds. Most volatile organic compounds were detected in shallowsoil samples from boring E-SB-984, which is in the area of a former electricaltransformer room in the southwestern portion of Block E. This boring containspolychlorinated biphenyls above 100 milligrams per kilogram at 4–14 feet below grade.Concentrations of 1,2,3-trichlorobenzene (123-TCB) and 1,2,4-trichlorobenzene(124-TCB) exceed the residential or non-residential screening levels in E-SB-984 soilsamples collected at 4–6 and 10–12 feet.
The 2012 and previous polychlorinated biphenyl data show three main areas where
polychlorinated biphenyl concentrations exceed screening levels. The first is the southeastern
area near the 500,000-gallon water tank. The grass field west of the water tank is the former
location of a 500,000-gallon aboveground storage tank (AST) for fuel oil. Two sampling clusters
in this area are located around two storm-drain manholes currently at the site. In the
southwestern portion of this area, polychlorinated biphenyl exceedances are limited to the first
four feet of soil. Polychlorinated biphenyls in this area may be due to minor surface spills of oils
during facility operations, or drainage from the southwestern portion of Block E.
The second area of polychlorinated biphenyl exceedances is in the south–central portion of
former Building D. This area housed the former cleaning, plating, and finishing rooms, a former
electrical transformer room on the basement floor, and an electrical substation outside the
building. Two clusters of elevated-concentration samples in this area are located around two
storm-drain manholes currently at the site. Most polychlorinated biphenyl exceedances are
limited to the first four feet of soil. However, polychlorinated biphenyl exceedances were
detected in soil 4–10 feet deep at four borings in this area. Polychlorinated biphenyls in this area
may be due to surface spills of oils during facility operations, from leaking transformers, released
during the building demolition, or drainage from the southwestern portion of Block E.
The third area of polychlorinated biphenyl exceedances is in the western and southwestern
portion of Block E. These polychlorinated biphenyl exceedances are in the area of the former
nuclear laboratory, former electrical transformer room, and former waste collection area.

7903 TETRA TECH • LOCKHEED MARTIN MIDDLE RIVER COMPLEX •2012 ADDITIONAL BLOCK E SOIL INVESTIGATION REPORT PAGE 6-4
Polychlorinated biphenyls were detected at a concentration of 24,000 mg/kg at nine feet and
19,000 mg/kg at 8–12 feet in the area of the former transformer room. Results from several
additional deep soil borings advanced in this area indicate that polychlorinated biphenyls are in
soil at elevated concentrations (exceeding 100 milligrams per kilogram) at depths up to 16 feet
below grade in the southwestern portion of Block E.
These high concentrations indicate the possibility of residual polychlorinated
biphenyl-containing product at these depths. The high concentrations of polychlorinated
biphenyls in concrete samples from this area also suggest that surface releases may be
responsible for the subsurface polychlorinated biphenyls. The results for two deep soil borings
advanced previously in 2011 (borings E-SB-852 and E-SB-853) indicate that polychlorinated
biphenyls may be at concentrations exceeding the residential screening criterion at a depth of
30 feet below ground surface in the area of the former electrical transformer room and former
nuclear facility waste collection area.
The maximum depth for an industrial screening level exceedance is 24 feet at soil boring
E-SB-853. However, results from surrounding deep-soil borings indicate that concentrations
above the residential and industrial screening levels in deep soil are limited, and exceedances in
surrounding borings (excluding E-SB-852 and E-SB-853) are only in soil samples collected at a
depth of 16 feet or less. The radiological study concluded that workers were not at risk during the
2012 field activities, and such risks would not be expected in future work at Block E. Screening
and radiological analyses of concrete and soil indicate that site cleanup activities to address
radiological hazards are unnecessary at this time. Possible radiological contamination located
within sealed drain pipes should be further analyzed during remedial activities.
7903 TETRA TECH • LOCKHEED MARTIN MIDDLE RIVER COMPLEX •2012 ADDITIONAL BLOCK E SOIL INVESTIGATION REPORT PAGE 7-1
Section 7
References
1. ATSDR (Agency for Toxic Substances and Disease Registry), 1989. Toxicological Profilefor Selected PCBs (Aroclor-1260, -1254, -1242, -1232, -1221, and -1016). U.S.Department of Public Health. Atlanta, Georgia. June.
2. Bennett, R. R. and R. R. Meyer, 1952. “Geology and Groundwater Resources of theBaltimore Area.” Bulletin 4, State of Maryland, Department of Geology, Mines and WaterResources. Baltimore, Maryland.
3. Chapelle, F. M., 1985. “Hydrogeology, Digital Solute-Transport Simulation, andGeochemistry of the Lower Cretaceous Aquifer System near Baltimore, Maryland,”Maryland Geological Survey Report of Investigations No. 43. Maryland GeologicalSurvey. Baltimore, Maryland. 120 pp.
4. DeGrandchamp, R. and M. Barron, 2003. PCB Analysis at Navy Installations. Draftreport for U.S. Navy Environmental Health Center. April.
5. Earth Tech, Inc., 2003. Draft Phase I Environmental Site Assessment, ChesapeakeIndustrial Park. February.
6. Eisler, R., 2000. Handbook of Chemical Risk Assessment: Health Hazards to Humans,Plants, and Animals; Volume 2, Organics. Lewis Publishers. Boca Raton, Florida.
7. Halford, K. J. and E. L. Kuniansky, 2002. “Documentation of Spreadsheets for theAnalysis of Aquifer Test and Slug-Test Data,” U.S. Geological Survey Open File Report02-197. Carson City, Nevada. 51 pp.
8. HSDB (Hazardous Substances Data Bank), 2005. National Library of Medicine, NationalToxicology Program (via TOXNET). Bethesda, Maryland.
9. Lockheed Martin (Lockheed Martin Corporation), 2009. Executive Order-28: “MinimumRequirements for Intrusive Fieldwork Work Plans.”
10. Lockheed Martin (Lockheed Martin Corporation), 2009. Remediation Contractor’sEnergy, Environment, Safety, and Health (EESH) Handbook, Revision 1 (June 10).
11. MDE (Maryland Department of the Environment), 2006. Voluntary Cleanup ProgramGuidance Document from the State of Maryland. Maryland Department of theEnvironment, Environmental Restoration and Redevelopment Program. March.
7903 TETRA TECH • LOCKHEED MARTIN MIDDLE RIVER COMPLEX •2012 ADDITIONAL BLOCK E SOIL INVESTIGATION REPORT PAGE 7-2
12. MDE (Maryland Department of the Environment), 2008. Interim Final Guidance fromthe State of Maryland, Department of the Environment Cleanup Standards for Soil andGroundwater. June.
13. Spitz, K. and J. Moreno, 1996. A Practical Guide to Groundwater and Solute-TransportModeling. John Wiley and Sons, Inc. New York.
14. Tetra Tech, (Tetra Tech, Inc.), 2004a. Final Report Phase II Site Investigation of ExteriorAreas, Volumes I and II, Lockheed Martin Middle River Complex. February.
15. Tetra Tech, (Tetra Tech, Inc.), 2004b. Radiological Survey Report for Former Building D,Lockheed Martin Middle River Complex. April.
16. Tetra Tech, (Tetra Tech, Inc.), 2005. Final Data Report, Site-Wide Phase II Investigation,Middle River Complex. April.
17. Tetra Tech, (Tetra Tech, Inc.), 2006. Site Characterization Report, Revision 1.0, LockheedMartin Middle River Complex. May.
18. Tetra Tech, (Tetra Tech, Inc.), 2010. Final Soil Response Action Plan Block B, LockheedMartin Middle River Complex, 2323 Eastern Boulevard, Middle River, Maryland-Appendix E-Statistical Summary of Pre- and Post-Removal Data. Prepared by Tetra Tech,Inc., Germantown, Maryland for Lockheed Martin Corporation, Bethesda, Maryland.May 10.
19. Tetra Tech, (Tetra Tech, Inc.), 2010. Block E Supplemental Soil and Storm-Drain-Sediment Characterization Report, Lockheed Martin Middle River Complex. October.
20. Tetra Tech, (Tetra Tech, Inc.), 2011. Block E Data Summary Report, Lockheed MartinMiddle River Complex. March.
21. Tetra Tech, (Tetra Tech, Inc.), 2012a. Human Health Risk Assessment for Blocks D, E, F,G, and H Soils, Lockheed Martin Middle River Complex, 2323 Eastern Boulevard,Middle River, Maryland. Prepared by Tetra Tech, Inc., Germantown, Maryland forLockheed Martin Corporation, Bethesda, Maryland. September.
22. Tetra Tech, (Tetra Tech, Inc.), 2012b. Additional Block E Soil Characterization Report,Lockheed Martin Middle River Complex, 2323 Eastern Boulevard, Middle River,Maryland. Prepared by Tetra Tech, Inc., Germantown, Maryland for Lockheed MartinCorporation, Bethesda, Maryland. January.
23. Tetra Tech, (Tetra Tech, Inc.), 2012c. Human Health Risk Assessment Update for Block ESoils, Lockheed Martin Middle River Complex, 2323 Eastern Boulevard, Middle River,Maryland. Prepared by Tetra Tech, Inc., Germantown, Maryland for Lockheed MartinCorporation, Bethesda, Maryland. September.
24. Tetra Tech, (Tetra Tech, Inc.), 2012d. Utility Cross-Connection Investigation Report,Lockheed Martin Middle River Complex, 2323 Eastern Boulevard, Middle River,
7903 TETRA TECH • LOCKHEED MARTIN MIDDLE RIVER COMPLEX •2012 ADDITIONAL BLOCK E SOIL INVESTIGATION REPORT PAGE 7-3
Maryland. Prepared by Tetra Tech, Inc., Germantown, Maryland for Lockheed MartinCorporation, Bethesda, Maryland. January.
25. Tetra Tech, (Tetra Tech, Inc.), 2012e. Draft Groundwater Response Action Plan,Lockheed Martin Middle River Complex, 2323 Eastern Boulevard, Middle River,Maryland. Prepared by Tetra Tech, Inc., Germantown, Maryland for Lockheed MartinCorporation, Bethesda, Maryland. March.
26. Tetra Tech, (Tetra Tech, Inc.), 2012f. Block E Storm Drain Interim Remedial MeasuresFinal Site Remediation Report, Lockheed Martin Middle River Complex, 2323 EasternBoulevard, Middle River, Maryland. Prepared by Tetra Tech, Inc., Germantown,Maryland for Lockheed Martin Corporation, Bethesda, Maryland. February.
27. Tetra Tech, (Tetra Tech, Inc.), 2012g. Injection Pilot-Test Report, Lockheed MartinMiddle River Complex, 2323 Eastern Boulevard, Middle River, Maryland. Prepared byTetra Tech, Inc., Germantown, Maryland for Lockheed Martin Corporation, Bethesda,Maryland. September.
28. Tetra Tech, (Tetra Tech, Inc.), 2012h. Block E and G Pre-Design Soil SamplingInvestigation Report, Lockheed Martin Middle River Complex, 2323 Eastern Boulevard,Middle River, Maryland. Prepared by Tetra Tech, Inc., Germantown, Maryland forLockheed Martin Corporation, Bethesda, Maryland. September.
29. TIA, 2002. “Site Utility Map for Middle River Complex, Middle River, Maryland.”October.
30. USDA (U.S. Department of Agriculture), 1993. Soil Survey of Baltimore County,Maryland. Soil Conservation Service, U.S. Department of Agriculture. September.
31. USEPA (U.S. Environmental Protection Agency), 1985. Chemical, Physical, andBiological Properties of Compounds Present at Hazardous Waste Sites. Office of SolidWaste and Emergency Response. Washington, D.C. September.
32. USEPA (U.S. Environmental Protection Agency), 1990. A Guide on Remedial Actions atSuperfund Sites with PCB Contamination. Document 9355.4-01FS, Office of Solid Wasteand Emergency Response. Washington, D.C. July.
33. USEPA (U.S. Environmental Protection Agency), 1994. Region III Modifications to theNational Functional Guidelines for Organic Data Review. September.
34. USEPA (U.S. Environmental Protection Agency), 2005. Polychlorinated Biphenyl (PCB)Site Revitalization Guidance under the Toxic Substances Control Act (TSCA). November.
35. Vroblesky, D. A. and W. B. Fleck, 1991. “Hydrogeologic Framework of the Coastal Plainof Maryland, Delaware, and the District of Columbia Regional Aquifer SystemAnalysis—Northern Atlantic Coastal Plain.” U.S. Geological Survey professional paper1404-E. U.S. Government Printing Office. Washington, D.C. 45 pp.

7903 TETRA TECH • LOCKHEED MARTIN MIDDLE RIVER COMPLEX •2012 ADDITIONAL BLOCK E SOIL INVESTIGATION REPORT PAGE 7-4
This page intentionally left blank.