section 3 shadow flicker · four (4) ge wind turbines. the proposed wind turbines will all be ge...
TRANSCRIPT

Section 3 Shadow Flicker

RoxWind LLC Small Wind Certification Application 3. Shadow Flicker
3‐1
Shadow Flicker
3.1 State Standards
According to the Small Wind Certification, a Small Scale Wind Energy Development:
ill e desi ned and sited t av id nreas na le adverse shad lic er e ects
Maine currently has no numerical regulatory limits on exposure to shadow flicker. However, in all Maine projects that have considered flicker impact, the Department has used the common industry standard of 30 hours per year as a limit to reduce nuisance complaints.
3.2 Local Standards
The Town of Roxbury has not enacted a separate shadow flicker ordinance.
The Town of Rumford, an adjacent town to Roxbury, has adopted a section on shadow flicker in their wind energy ordinance. The Town of Rumford ordinance interprets “unreasonable adverse shadow flicker“ from a Wind Energy Facility “WEF” to mean:
shad lic er cc rrin r three da s r re in an ne nth that i ann ali ed ld t tal re than t elve h rs lic er er ear he a licati n ill n t e a r ved i the st d esti ates that the d rati n the lic er ill e s ch
that there are re than t elve h rs lic er er ear at an cc ied str ct re l cated n a n Partici atin Parcel I a ter c nstr cti n the vi lates this c nditi n then the ill e in vi lati n this rdinance
While the Project is not located in Rumford, the Applicant’s flicker study, reviewed below, demonstrates that there would be no “unreasonable adverse shadow flicker” as defined by the Town of Rumford from the Project at any occupied structure in Rumford.
3.3 Shadow Flicker Modeling Approach
The predictive shadow flicker modeling was performed by Epsilon and was designed to conform to State standards. The Project is wholly located in the Town of Roxbury’s Mountain District, a oning District determined by the Town to be appropriate for wind energy development. The area surrounding the Project is primarily forested. Within roughly a mile and a half of the turbines, there are approximately forty‐seven (47) structures including eight (8) in Rumford. These structures were verified by leinschmidt (as accessible) and leinschmidt also evaluated visibility of North Twin Mountain from
accessible homes.

RoxWind LLC Small Wind Certification Application 3. Shadow Flicker
3‐2
These structures were used to define the modeled locations surrounding the Project.
For more details about the flicker modeling, see Exhibit 3‐A.
3.4 Shadow Flicker Modeling Results Summary
The shadow flicker modeling results predict that there will be no violations of the State’s or Rumford’s standards referenced in Section 3.1 and 3.2, respectively, of this application.
Of the forty‐seven (47) locations evaluated, only twenty‐six (26) are predicted to experience any shadow flicker from the project. Of the twenty‐six (26) locations where shadow flicker may be experienced, zero (0) of the locations are anticipated to receive more than thirty (30) hours of shadow flicker in a given year. The two locations with the greatest level of predicted shadow flicker annually, locations 8 and 8A, are not expected to have any view of the wind turbines (see Visual Impact Assessment, Exhibit 5‐A) and thus shadow flicker should be limited to occur in the vegetation on the property.
The eight (8) structures identified in the adjacent Town of Rumford are anticipated to receive less than eight (8) hours each annually – with six (6) structures modeled at zero (0) hours of flicker annually and two (2) structures modeled at under eight (8) hours of flicker annually. The modeled shadow flicker from the Project conforms to the Town of Rumford’s bylaw.

3‐A Shadow Flicker Assessment Report

SHADOW FLICKER ASSESSMENT REPORT
RoxWind Project
Town of Roxbury, Maine
Prepared for:
RoxWind LLC
13 Elm Street, Suite 200
Cohasset, MA 02025
Prepared by:
Epsilon Associates, Inc.
3 Mill & Main Place, Suite 250
Maynard, MA 01754
March 6, 2018

4225 RoxWind Flicker Report 180306.doc i Table of Contents
Epsilon Associates, Inc.
TABLE OF CONTENTS
1.0 EXECUTIVE SUMMARY 1-1
2.0 INTRODUCTION 2-1
3.0 SHADOW FLICKER MODELING 3-1 3.1 Modeling Methodology 3-1 3.2 Results 3-5
4.0 CONCLUSIONS 4-1
LIST OF APPENDICES
Appendix A Wind Turbine Coordinates
Appendix B Expected Wind Energy Development Shadow Flicker at Discrete Modeling Points
LIST OF FIGURES
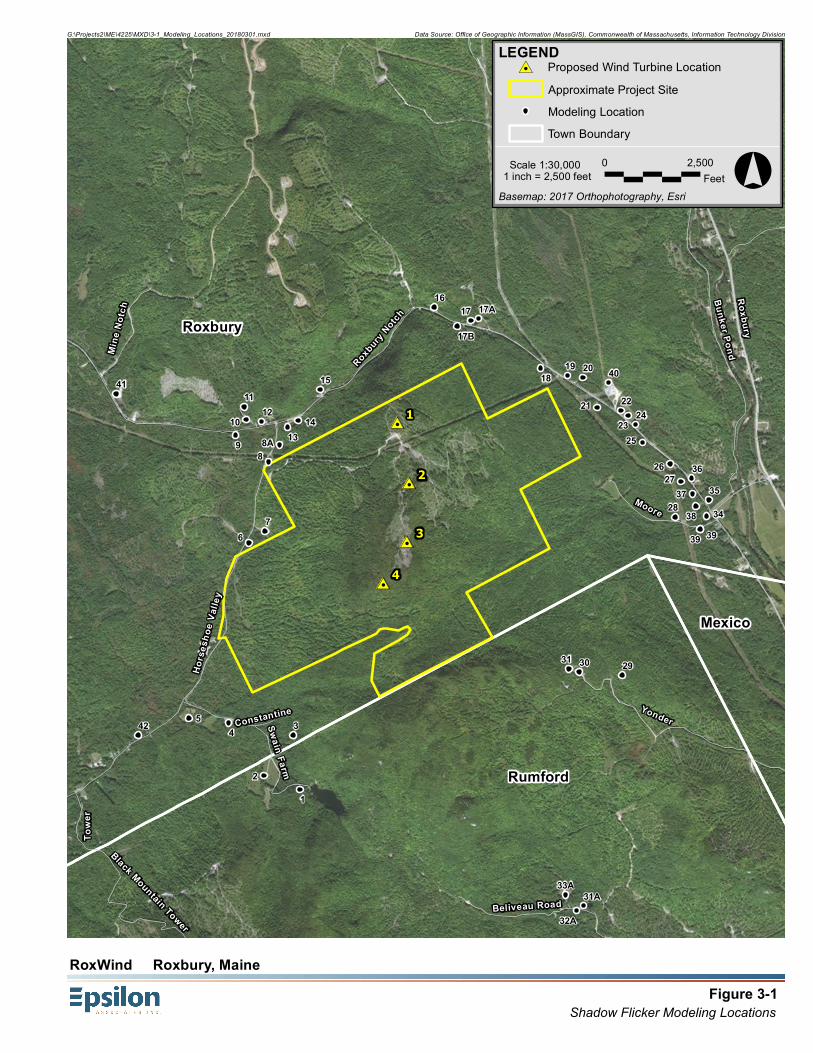
Figure 3-1 Shadow Flicker Modeling Locations 3-4 Figure 3-2 Shadow Flicker Modeling Results 3-7
LIST OF TABLES
Table 3-1 Monthly Percent of Possible Sunshine 3-5 Table 3-2 Operational Hours per Wind Direction Sector 3-5

4225 RoxWind Flicker Report 180306.doc 1-1 Executive Summary
Epsilon Associates, Inc.
1.0 EXECUTIVE SUMMARY
RoxWind (the Project) is a proposed wind energy development (WED) composed of up to
four (4) wind turbines in the Town of Roxbury, Maine. The Project is being developed by
RoxWind LLC who has retained Epsilon Associates, Inc. (Epsilon) to conduct a shadow
flicker assessment for the proposed wind turbines for this Project.
Shadow flicker modeling was conducted for four (4) General Electric (GE) 3.8-130 wind
turbines. The purpose of this analysis is to predict the expected annual durations of wind
turbine shadow flicker at residences in the vicinity of the Project due to the operation of the
proposed wind turbines. There are no federal, state, or local regulations quantitatively
limiting the amount of shadow flicker resulting from the operation of the Project. However,
the predicted shadow flicker at residences can be put into context by comparing the annual
duration to a typical guideline value. In the absence of a definitive regulation, the duration
of shadow flicker is typically compared to a value of 30 hours per year as this is often the
limit identified in wind energy regulations that contain shadow flicker limits. Therefore, the
design goal of the Project is to not exceed the industry guideline of 30 hours per year of
expected shadow flicker at any residence to avoid unreasonable adverse shadow flicker
effects.
The maximum expected annual duration of shadow flicker at a discrete modeling point
(residence) resulting from the operation of the 4 wind turbines is 27 hours, 35 minutes.
Therefore, the Project design goal is met and the Project avoids unreasonable adverse
shadow flicker effects based on the industry guideline. The modeling results are
conservative in that modeling receptors were treated as “greenhouses” and the surrounding
area was assumed to be without vegetation or structures (“bare earth”).

4225 RoxWind Flicker Report 180306.doc 2-1 Introduction
Epsilon Associates, Inc.
2.0 INTRODUCTION
The RoxWind Project to be located in the Town of Roxbury, Maine will consist of up to
four (4) GE wind turbines. The proposed wind turbines will all be GE 3.8-130 units with a
hub height of 85 meters and a rotor diameter of 130 meters.
With respect to wind turbines, shadow flicker can be defined as an intermittent change in
the intensity of light in a given area resulting from the operation of a wind turbine due to its
interaction with the sun. While indoors, an observer experiences repeated changes in the
brightness of the room as shadows cast from the wind turbine blades briefly pass by
windows as the blades rotate. In order for this to occur, the wind turbine must be
operating, the sun must be shining, and the window must be within the shadow region of
the wind turbine, otherwise there is no shadow flicker. A stationary wind turbine only
generates a stationary shadow similar to any other structure.
This report presents the findings of a shadow flicker assessment for the Project. The wind
turbines were modeled with the WindPRO software package using information provided by
RoxWind LLC. The expected annual duration of shadow flicker was calculated at discrete
modeling points (nearby residences) and shadow flicker isolines for the area surrounding
the Project were generated. The results of the modeling are found within this report.

4225 RoxWind Flicker Report 180306.doc 3-1 Shadow Flicker Analysis
Epsilon Associates, Inc.
3.0 SHADOW FLICKER MODELING
3.1 Modeling Methodology
Shadow flicker was modeled using a software package, WindPRO version 3.1.633.
WindPRO is a software suite developed by EMD International A/S and is used for assessing
potential environmental impacts from wind turbines. Using the Shadow module within
WindPRO, worst-case shadow flicker in the area surrounding the wind turbines was
calculated based on data inputs including: location of the wind turbines, location of
discrete receptor points, wind turbine dimensions, flicker calculation limits, and terrain
data. Based on these data, the model was able to incorporate the appropriate sun angle and
maximum daily sunlight for this latitude into the calculations. The resulting worst-case
calculations assume that the sun is always shining during daylight hours and that the wind
turbine is always operating. The WindPRO Shadow module can be refined by
incorporating sunshine probabilities and wind turbine operational estimates by wind
direction over the course of a year. The values produced by this refinement, also known as
the “expected” shadow flicker, are presented in this section.
The proposed wind turbine layout for the Project dated February 8, 2018 was provided by
RoxWind LLC. Locations of the 4 wind turbines are shown in Figure 3-1 and the
coordinates are provided in Appendix A. All wind turbines are proposed to be GE 3.8-130
units with a 130 meter rotor diameter and a hub height of 85 meters. Each wind turbine
has the following characteristics based on the technical data provided by RoxWind LLC:
GE 3.8-130
Rated Power = 3,800 kW
Hub Height = 85 meters
Rotor Diameter = 130 meters
Cut-in Wind Speed = 3 m/s
Cut-out Wind Speed = 34 m/s
Maximum RPM = 12.1 rpm
To-date, there are no federal, state, or local regulations regarding the maximum radial
distance from a wind turbine to which shadow flicker should be analyzed applicable to this
Project. In the United States, shadow flicker is commonly evaluated out to a distance of ten
times the rotor diameter. According to the Massachusetts Model Bylaw for wind energy
facilities, shadow flicker impacts are minimal at and beyond a distance of ten rotor
diameters.1 Defining the shadow flicker calculation area has also been addressed in Europe
where the ten times rotor diameter approach has been accepted in multiple European
1 Massachusetts Department of Energy Resources, “Model As-of-Right Zoning Ordinance or Bylaw:
Allowing Use of Wind Energy Facilities” 2009.

4225 RoxWind Flicker Report 180306.doc 3-2 Shadow Flicker Analysis
Epsilon Associates, Inc.
countries.2 Some jurisdictions conservatively require a larger calculation area. The New
Hampshire Site Evaluation Committee through rulemaking docket 2014-04 adopted rules
on December 15, 2015 outlining application requirements and criteria for energy facilities,
including wind energy facilities. As part of these revised regulations, Site 301.08(a)(2)
requires an evaluation distance of at least 1 mile from a wind turbine.3 Section 16-50j-94,
part (g), of the Regulations of Connecticut State Agencies identifies the components
required in a shadow flicker evaluation report which includes the calculation of shadow
flicker from each proposed wind turbine to any off-site occupied structure within a 1.25
mile radius.4 For this Project, ten times the rotor diameter of the proposed wind turbine
corresponds to a distance of 0.81 miles (1,300 m). Conservatively, this analysis follows the
Connecticut guidance and includes shadow flicker calculations out to 1.25 miles (2,012 m)
from each wind turbine in the model for the proposed layout.
A residence dataset was provided by RoxWind LLC on January 30, 2018. The dataset
included identified residences within 1.5 miles of any of the four wind turbines and were
input to the WindPRO model as discrete points. The 47 residences were each assumed to
have windows facing all directions (“greenhouse” mode) which yields conservative results.
All modeling receptors are identified in Figure 3-1. The model was set to limit calculations
to 2,012 meters from a wind turbine, the equivalent of 1.25 miles. Consequently, shadow
flicker at any of the 47 residences greater than the corresponding limitation distance from a
wind turbine was zero. In addition to modeling discrete points, shadow flicker was
calculated at grid points in the area surrounding the modeled wind turbines to generate
flicker isolines. A 10-meter spacing was used for this grid.
The terrain height contour elevations for the modeling domain were generated from
elevation information derived from the National Elevation Dataset (NED) developed by the
U.S. Geological Survey. Conservatively, obstacles, i.e. buildings and vegetation, were
excluded from the analysis. This is effectively a “bare earth” scenario which is particularly
conservative for the heavily forested area for the Project. When accounted for in the
shadow flicker calculations, such obstacles may significantly mitigate or eliminate the
flicker effect depending on their size, type, and location. In addition, shadow flicker
durations were calculated only when the angle of the sun was at least 3° above the
horizon.
2 Parsons Brinckerhoff, “Update of UK Shadow Flicker Evidence Base” Prepared for Department of Energy
and Climate Change, 2011.
3 State of New Hampshire Site Evaluation Committee Site 300 Rules (2015), available at
http://www.gencourt.state.nh.us/rules/state_agencies/site100-300.html Accessed in January 2018.
4 State of Connecticut CSC Wind Regulations (2014), available at
https://www.cga.ct.gov/aspx/CGARegulations/CGARegulations.aspx?Yr=2014&Reg=2012-054&Amd=E
Accessed in January 2018.

4225 RoxWind Flicker Report 180306.doc 3-3 Shadow Flicker Analysis
Epsilon Associates, Inc.
Monthly sunshine probability values were input for each month from January to December.
These numbers were obtained from a publicly available historical dataset for Portland,
Maine from the National Oceanic and Atmospheric Administration’s (NOAA) National
Centers for Environmental Information (NCEI).5 Table 3-1 shows the percentage of sunshine
hours by month used in the shadow flicker modeling. These values are the percentages that
the sun is expected to be shining during daylight hours.
The number of hours the wind turbines are expected to operate for 12 cardinal wind
directions was input into the model. A preliminary energy production assessment was
provided to Epsilon by RoxWind LLC that contained operational hours per wind direction
sector. These hours are used by WindPRO to estimate the “wind direction” and “operation
time” reduction factors. Based on this dataset, the wind turbines would operate 92% of the
year. Table 3-2 shows the distribution of operational hours for the 12 wind directions.
5 NCEI (formerly NCDC), http://www1.ncdc.noaa.gov/pub/data/ccd-data/pctpos15.txt. Accessed in
February 2018.
#0
#0
#0
#0
2726
25
2423
2221
201918
1716
15
1413
1210
11
8
7
6
54
2
3
1
293031
8A
17B
17A
28
9
31A
32A
33A
34
35
36
37
38
39 39
4041
42
Roxbury
Mexico
Rumford
Roxbury
Notc
h
Constantine
Roxbury
Yonder
Tow
er
Swain Farm
Min
e N
otch
Beliveau Road
Moore
Black Mountain Tower
Hor
sesh
oe V
alle
y
Bunker P
ond
1
2
3
4
Figure 3-1 Shadow Flicker Modeling Locations
RoxWind Roxbury, Maine
G:\Projects2\ME\4225\MXD\3-1_Modeling_Locations_20180301.mxd Data Source: Office of Geographic Information (MassGIS), Commonwealth of Massachusetts, Information Technology Division
Basemap: 2017 Orthophotography, Esri°0 2,500
Feet1 inch = 2,500 feetScale 1:30,000
LEGEND#0 Proposed Wind Turbine Location
Approximate Project Site
o e i Location
Town Boundary

4225 RoxWind Flicker Report 180306.doc 3-5 Shadow Flicker Analysis
Epsilon Associates, Inc.
Table 3-1 Monthly Percent of Possible Sunshine
Month Possible Sunshine
January 57%
February 58%
March 53%
April 55%
May 53%
June 55%
July 62%
August 63%
September 60%
October 58%
November 47%
December 49%
Table 3-2 Operational Hours per Wind Direction Sector
Wind Sector Operational Hours
N 170
NNE 170
ENE 191
E 281
ESE 622
SSE 538
S 472
SSW 504
WSW 518
W 1,312
WNW 2,831
NNW 489
Annual 8,096
3.2 Results
Following the modeling methodology outlined in Section 3.1, WindPRO was used to
calculate shadow flicker at the 47 discrete modeling points (nearby residences) in the
vicinity of the Project and generate shadow flicker isolines based on the grid calculations.

4225 RoxWind Flicker Report 180306.doc 3-6 Shadow Flicker Analysis
Epsilon Associates, Inc.
Table B-1 in Appendix B presents the modeling results for the 47 residences. The predicted
expected annual shadow flicker duration ranged from 0 hours, 0 minutes per year to 27
hours, 35 minutes per year. The maximum expected shadow flicker occurs at location #8A.
Many locations (21) were predicted to experience no shadow flicker. 15 locations were
predicted to experience some shadow flicker but less than 10 hours per year. The
modeling results showed that 11 locations would be expected to have 10 to 30 hours of
shadow flicker per year. No receptors were expected to have over 30 hours of flicker per
year. Figure 3-2 displays the modeled flicker isolines over aerial imagery in relation to
modeled wind turbines and the modeled locations.

#0
#0
#0
#0
2726
25
2423
2221
201918
1716
15
1413
1210
11
8
7
6
54
2
3
1
293031
8A
17B
17A
28
9
31A
32A
33A
34
35
36
37
38
39 39
4041
42
Roxbury
Mexico
Rumford
Roxbury
Notc
h
Constantine
Roxbury
Yonder
Birch Brook
Tow
er
Swain Farm
Min
e N
otch
Beliveau Road
Moore
Black Mountain Tower
Hor
sesh
oe V
alle
y
Bunker Pond
1
2
3
4
Figure 3-2 Shadow Flicker Modeling Results
RoxWind Roxbury, Maine
G:\Projects2\ME\4225\MXD\3-2_Flicker_Results_20180301.mxd Data Source: Office of Geographic Information (MassGIS), Commonwealth of Massachusetts, Information Technology Division
Basemap: 2017 Orthophotography, Esri
LEGEND
Town Boundary
Predicted Shadow Flicker (Expected Hours/Year)
30
50
0
10
100
150
#0 Proposed Wind Turbine Location
Approximate Project Site
o e i Location
°0 2,500Feet1 inch = 2,500 feet
Scale 1:30,000
4225 RoxWind Flicker Report 180306.doc 4-1 Conclusions
Epsilon Associates, Inc.
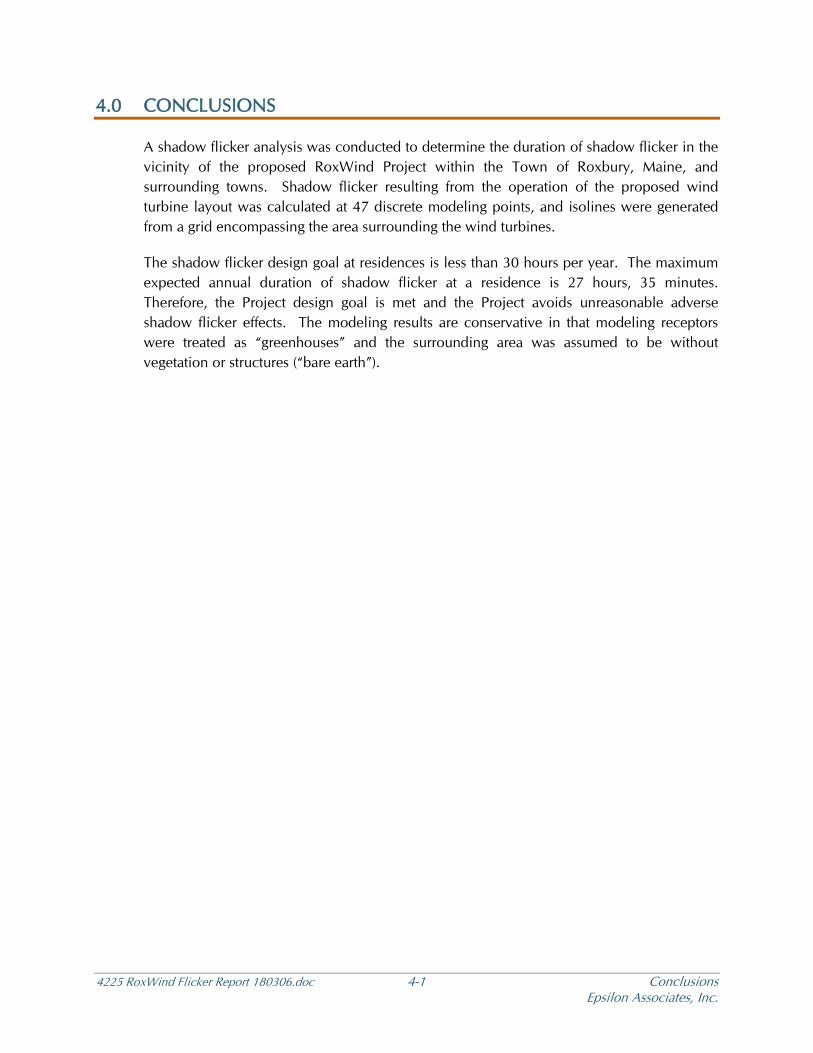
4.0 CONCLUSIONS
A shadow flicker analysis was conducted to determine the duration of shadow flicker in the
vicinity of the proposed RoxWind Project within the Town of Roxbury, Maine, and
surrounding towns. Shadow flicker resulting from the operation of the proposed wind
turbine layout was calculated at 47 discrete modeling points, and isolines were generated
from a grid encompassing the area surrounding the wind turbines.
The shadow flicker design goal at residences is less than 30 hours per year. The maximum
expected annual duration of shadow flicker at a residence is 27 hours, 35 minutes.
Therefore, the Project design goal is met and the Project avoids unreasonable adverse
shadow flicker effects. The modeling results are conservative in that modeling receptors
were treated as “greenhouses” and the surrounding area was assumed to be without
vegetation or structures (“bare earth”).

Appendix A
Wind Turbine Coordinates

Table A-1
X(m)
Y(m)
1 371671.76 4942589.022 371765.42 4942109.333 371748.24 4941642.944 371559.14 4941313.32
Wind Turbine ID
CoordinatesUTM NAD83 Zone 19N
Page 1 of 1

Appendix B
Expected Wind Energy Development Shadow Flicker at Discrete Modeling
Points

X (Easting) Y (Northing) (HH:MM)
1 370904.08 4939668.64 0:00
2 370617.83 4939776.20 0:00
3 370850.79 4940099.90 0:00
4 370337.28 4940200.01 0:00
5 370021.44 4940234.25 0:00
6 370496.85 4941628.36 14:09
7 370627.83 4941722.81 10:15
8 370655.92 4942273.02 25:16
8A 370745.01 4942407.66 27:35
9 370392.60 4942487.28 13:00
10 370478.84 4942613.29 15:32
11 370460.17 4942714.36 12:39
12 370603.42 4942593.67 17:02
13 370806.18 4942551.53 20:51
14 370892.55 4942603.81 21:48
15 371063.77 4942851.09 20:29
16 371973.09 4943505.01 1:41
17 372263.00 4943398.33 6:57
17A 372324.69 4943414.04 5:55
17B 372156.04 4943354.39 9:27
18 372819.01 4943021.33 9:29
19 373033.49 4942960.86 6:48
20 373154.58 4942946.04 5:59
21 373268.87 4942705.38 5:58
22 373458.83 4942683.63 4:59
23 373516.11 4942645.34 3:26
24 373576.15 4942571.36 3:21
25 373631.16 4942426.67 3:26
26 373851.15 4942259.42 0:00
27 373937.13 4942117.86 0:00
28 373892.65 4941835.46 0:00
29 373470.33 4940577.37 0:00
30 373125.81 4940602.51 7:10
31 373042.94 4940628.67 7:37
31A 373160.94 4938740.66 0:00
32A 373104.89 4938704.67 0:00
33A 373017.10 4938828.80 0:00
34 374140.46 4941841.18 0:00
35 374160.81 4941971.70 0:00
36 374023.56 4942143.50 0:00
37 374029.34 4942020.83 0:00
Table B-1
Receptor ID
Coordinates NAD83 UTM Zone 19N
(meters)
Expected Shadow Flicker
Hours per Year
Page 1 of 2

X (Easting) Y (Northing) (HH:MM)
Table B-1
Receptor ID
Coordinates NAD83 UTM Zone 19N
(meters)
Expected Shadow Flicker
Hours per Year
38 374056.02 4941923.20 0:00
39 374089.69 4941739.18 0:00
39 374089.69 4941739.18 0:00
40 373360.55 4942904.27 3:35
41 369440.58 4942817.22 0:00
42 369617.33 4940099.02 0:00
Page 2 of 2