section 3 water reclamation demonstration plant...a 3-1 km2870.sec3.doc 11/9/2007 section 3 water...
TRANSCRIPT

A 3-1
KM2870.sec3.doc 11/9/2007
Section 3 Water Reclamation Demonstration Plant 3.1 General As part of the 2004 CERP Wastewater Reuse Project, the Project Delivery Team (PDT) recommended that the reuse pilot plant processes include nitrification biological aerated filters, denitrification filters, chemical addition for phosphorus removal, membranes (microfiltration or ultrafiltration), and UV disinfection. Although reverse osmosis (RO) was evaluated, it was not recommended due to concerns over concentrate disposal and high incremental costs versus the anticipated water quality improvements with the other treatment processes. Nonetheless, in the WRDP, provisions will be made for a sidestream of the demonstration plant effluent to flow through additional treatment steps (e.g., RO, advanced oxidation, and others) to evaluate additional treatment benefits and concentrate characteristics. The demonstration plant takes into account the existing secondary process at the SDWWTP and the proposed high level disinfection (HLD) facilities.
The WRDP will provide additional treatment of the SDWWTP secondary effluent to further reduce CBOD5, and TSS, to reduce nitrogen and phosphorus levels, to provide disinfection, and to remove selected microconstituents. The facility is designed to produce a constant nominal flow of about 0.23 MGD of highly treated reclaimed water.
An alternate WRDP concept has also been prepared. This facility could produce a nominal flow of approximately 0.07 MGD, which has been reduced to meet current anticipated needs of the toxicity and ecological tank testing. This smaller WRDP capacity is subject to change pending the finalized toxicity and ecological testing plans.
The effluent of the WRDP will be collected for aquatic toxicology and ecological testing, water quality testing, and returned to the head of the SDWWTP. Waste streams will also be conveyed back to the head of the SDWWTP for treatment and disposal. The WRDP consists of the following main components:
Pipe connection to the SDWWTP secondary effluent
Strainer
Biological aerated filters (BAF) for nitrification
Denitrification filters
Ballasted flocculation treatment (BFT) unit with chemical addition
Traditional flocculation with chemical addition (alternate)
Ultrafiltration (UF) submerged membranes

Coastal Wetlands Rehydration Demonstration Project Water Reclamation Demonstration Plant
A
TABLE 3-1
Ultraviolet (UV) light disinfection
Sidestream plant (SSP) including RO and advanced oxidation
SSP and indoor testing facilities building
Temporary facilities
Facility Lift Station
Process schematics of the WRDP and SSP are presented on Figure 3-1.
3.1.1 SDWWTP The SDWWTP is a conventional secondary treatment plant with effluent disposal via deep-well injection. The SDWWTP is currently treating an annual average daily flow (AADF) of approximately 90 MGD. Treatment processes at the facility include screening, grit removal, pure oxygen activated sludge process, secondary clarification, return activated sludge pumping, and standby chlorine disinfection prior to deep-well injection. The biosolids treatment facilities include gravity thickening, anaerobic digesters, dewatering, and composting. A process flow diagram of the existing SDWWTP plant is shown on Figure 3-2.
The physical capacity of the plant is 112.5 MGD AADF, 225 MGD peak hour. This capacity of the plant will be upgraded to 285 MGD peak hour with the construction of the high level disinfection (HLD) facilities to treat annual average and peak flows being injected to deep wells. MDWASD is currently bidding the construction contracts for the HLD facilities, which consists mainly of deep bed filters and disinfection facilities to comply with the Florida Department of Environmental Protection (FDEP) regulations. The flow is anticipated to reach 131 MGD by the year 2025.
The plant currently operates under the National Pollutant Discharge Elimination System (NPDES) Permit No. FLA-042137, which rates the facility at 112.5 MGD AADF. The NPDES Permit No. FLA042137 provides limits for CBOD5, TSS, and pH prior to deep well injection, as outlined in Table 3-1.
Existing SDWWTP Permit Effluent Limits
Maximum Effluent Concentrations Parameter
Annual Average Monthly Average Weekly Average Single Sample
CBOD5 (mg/L) 20 30 45 60
TSS (mg/L) 20 30 45 60
pH - - - 6.0 to 8.5
3-2
KM2870.sec3.doc 11/9/2007

StrainerFeCl3
Backwash Waste to
Facility Lift Station
Static Mixer
Back PulseTank
Drain to Facility Lift
StationProcess/
Backwash Air
Biological Aerated Filters Clearwell
Backwash Waste to
Facility Lift Station
Process Air Backwash
Water
Ballasted Flocculation Treatment Unit
Microsand and Polymer
Backwash Waste to
Facility Lift Station
SDWWTP Secondary
Effluent
Microsand Recirculation
Residual to Facility Lift
Station
To Side Stream Plant
(30-40 GPM)
Ultraviolet DisinfectionUltrafiltration
Membrane Units
CH3OH
To Facility Lift Station
To SDWWTP
Headworks
Facility Lift Station
FIGURE 3-1 CWRDP PROCESS DIAGRAMS
To Indoor Testing
Facility or Sample
Collection Area
Bypass
NOMINAL 0.23 MGD COASTAL WETLANDS REHYDRATION DEMONSTRATION PLANT (CWRDP)
Denitrification Filters
REVERSEOSMOSIS
IONEXCHANGE
GRANULATED ACTIVATED
CARBON
ULTRAVIOLET
FROM MAIN PROCESS
H2O2
OZONE
TO FACILITY LIFTSTATION
SIDE STREAM PLANT (SSP)
OZONE + ULTRA VIOLET
H2O2
ADVANCED OXIDATION PROCESS TRAIN NO. 1
FROM MAIN PROCESS
15 GPM MAX(OPTIONAL)
30 GPM MAX
40 GPM MAX
COMBINATIONS FOR SIDE STREAM PLANTIX + AOPIX + GAC + AOPGAC + AOPRO + AOPRO + GAC + AOPRO + IX + AOP
AOP REFERENCED IN ABOVE COMBINATIONS TO BE THE BEST OF THE THREE AOP TRAINS FOR MICROCONSTITUENT REDUCTION
40 GPM MAX
TO INDOOR TESTING FACILITY OR SAMPLE
COLLECTION AREA OR FACILITY LIFT STATION
ADVANCED OXIDATION PROCESS TRAIN NO. 2
ADVANCED OXIDATION PROCESS TRAIN NO. 3
ABBREVIATIONS/LEGEND
RO REVERSE OSMOSISIX ION EXCHANGEGAC GRANULATED ACTIVATED CARBONAOP ADVANCED OXIDATION PROCESSH2O2 HYDROGEN PEROXIDECH3OH METHANOLFecL3 FERRIC CHLORIDE
Air Scour
10 GPM MAX

A Figure 3-2 SDWWTP Process Schematic

Coastal Wetlands Rehydration Demonstration Project Water Reclamation Demonstration Plant
A
TABLE 3-2
There are no requirements for removal of nitrogen or phosphorus prior to injection well disposal. Effluent disinfection is not normally performed; however, chlorination facilities must be maintained in service and capable of providing basic disinfection in the event of well testing or emergency conditions. The future HLD facilities will need to comply with TSS of 5 mg/L and non detectable fecal coliforms.
Average water quality for the SDWWTP effluent from January 2001 to May 2006 is presented in Table 3-2.
SDWWTP Average Effluent Water Quality (2001-2006)
Parameter Secondary Effluent
CBOD5, mg/L 4.85
TOC, mg/L 11.28
TSS, mg/L 9.89
TDS, mg/L 374
TKN, mg/L 21
Nitrate nitrogen, mg/L 0.25
Ammonia nitrogen, mg/L 17
Total Phosphorus, mg/L 1.52
Alkalinity, mg/L CaCO3 213
Minimum wastewater temperature, oC 23
Maximum wastewater temperature, oC 31
pH 6.67
Chloride, mg/L 83
Sulfate, mg/L 27.11
Fecal coliform #/100 ml 838,600
Conductivity, μmho/cm 773
3.1.2 South Dade Advanced Wastewater Treatment Alternative
(2004 USACE Study) In the final report dated November 9, 2004 titled “Final Report South Dade Advanced Wastewater Treatment Alternative”, several conclusions and recommendations were made by the PDT, experts in the field and other stakeholders. These conclusions were considered in the design of the WRDP. Some of the conclusions and recommendations are provided below:
3-5
KM2870.sec3.doc 11/9/2007

Coastal Wetlands Rehydration Demonstration Project Water Reclamation Demonstration Plant
A
The recommended treatment train for testing in the pilot plant consists of nitrification/denitrification filters followed by chemical addition for phosphorus removal, microfiltration/ultrafiltration membranes and UV disinfection.
Ballasted flocculation treatment has proven to be effective to achieve low concentrations of phosphorus. The technology was also recommended to be tested in the pilot plant.
UV was selected because no disinfection by-products are created and UV does not need post disinfection (i.e. dechlorination) before discharging to surface waters.
The use of UV, though energy intensive, eliminates the formation of toxic compounds known as disinfection by-products, formed due to chlorination, including tri-halomethanes and N-nitrosodimethylamine. Further reduction of microconstituents can be accomplished through the addition/modification of the disinfection process using commercially available/emerging technologies, whether incorporating hydrogen peroxide (H2O2) with UV (at higher UV doses), utilizing ozone (O3) and H2O2, and/or incorporating low pressure biologically active reductive membranes.
A review of literature for various wastewater treatment facilities indicates that activated carbon, (advanced) oxidation processes and membrane filtration are showing promising results for efficient removal of many non-regulated organic compounds during treatment.
To control the monitoring costs for the pilot plant, surrogate chemicals should be selected for monitoring that will represent those constituents, including toxics and microconstituents considered representing the greatest ecological and biological risks. These chemicals should then be monitored during the pilot plant operation using appropriate analytical methods that provide sufficiently low detection limits to verify adequate removal in the pilot plant.
A better understanding is needed of microconstituent removal processes in wastewater treatment and methods to improve their efficiency. The pilot plant should be used to verify that microconstituents, present at parts per billion (ppb) or even parts per trillion (ppt) levels, will be removed to the extent necessary to meet the OFW non-degradation requirements. In the event that the proposed treatment process does not remove microconstituents to the desired level, more information will be needed on the removal efficacy of microconstituents through advanced treatment processes, including membrane filtration, activated carbon filtration, and advanced oxidation.
Based on a literature review for technologies to remove microconstituents, it was concluded that a combination of UV-O3, and RO-carbon filtration should be considered best available technologies for a wide variety of microconstituents.
3-6
KM2870.sec3.doc 11/9/2007

Coastal Wetlands Rehydration Demonstration Project Water Reclamation Demonstration Plant
A
TABLE 3-3
3.2 WRDP Conceptual Design This section covers the design criteria and facility requirements for the nominal 0.23-MGD WRDP and the alternate 0.067 MGD WRDP. The SSP is included in Section 3.3. Process information related to the conceptual design of the SSP is included in Appendix A.
3.2.1 Design Criteria The design flow of the WRDP is 0.23 MGD of highly treated water product, which was based on the smallest available commercial units for the treatment processes and other considerations. To produce 0.23 MGD of product water, approximately 0.3 MGD of feedwater is needed to account for water losses in the strainer and filter backwash water, BFT residuals, and UF membranes backwash/cleaning.
Though the facilities are designed to operate for the design flow, the plant might also be operated at various flows to stress the performance of the treatment technologies. The different flow ranges will be determined during the final design when a demonstration plant protocol and sampling program will be developed.
The design influent concentrations to the WRDP are derived, in large part, from analysis of historical effluent concentrations at the SDWWTP. Appendix A illustrates historical effluent concentrations from 2001 to 2006. Values for calcium, magnesium, and sodium were assumed based on typical secondary effluent characteristics. Table 3-3 summarizes the water quality used as the basis of design for the WRDP.
WRDP Design Flow and Influent Wastewater Characteristics
Parameter Secondary Effluent Design Values
Average influent flow, mgd 0.30
CBOD5, mg/L 20
TOC, mg/L 12
TSS, mg/L 20
TDS, mg/L 450
TKN, mg/L 27
Nitrate nitrogen, mg/L 0
Ammonia nitrogen, mg/L 23
TP, mg/L 2.7
Alkalinity, mg/L CaCO3 200
Minimum wastewater temperature, oC 23
Maximum wastewater temperature, oC 32
Maximum air temperature, oC 34
pH 6.6
3-7
KM2870.sec3.doc 11/9/2007

Coastal Wetlands Rehydration Demonstration Project Water Reclamation Demonstration Plant
A
Continuation Table 3-3 WRDP Design Flow and Influent Wastewater Characteristics
Parameter Secondary Effluent Design Values
Chloride, mg/L 90
Sulfate, mg/L 33
Conductivity, μmho/cm 800
Calcium, mg/L 20
Magnesium, mg/L 5
Sodium, mgL 60
3.2.2 Description of Treatment Processes Secondary effluent from the SDWWTP will be obtained from tapping the pressurized 24–inch diameter line feeding Injection Well No. 7 with a 4-inch diameter line. Secondary effluent will first go through an automatic strainer, and then to biological aerated filters, followed by denitrification filters (with methanol addition) for nitrogen reduction. After the denitrification filters, ferric chloride (FeCl3) will be added to chemically precipitate phosphorus in ballasted flocculation treatment (BFT) units where polymer and microsand will be added to enhance sedimentation performance. The effluent from the BFT units will be sent to UF submerged membranes followed by UV disinfection. The WRDP’s configuration provides pipeline arrangement to by-pass the ballasted flocculation units to evaluate phosphorus removal in the UF membranes. UV disinfection will follow the UF membrane process. Water quality testing will be performed throughout the treatment process. The water not used for the aquatic toxicity or ecological testing will be collected in the facility lift station. The backwash water from the strainers, filters, and UF membranes will be combined with the residual waste stream of the ballasted flocculation units in a facility lift station designed to convey the reject water to the head of the SDWWTP.
3.2.2.1 Connection to SDWWTP At the SDWWTP, secondary treated effluent is transferred to 17 deep injection wells by an effluent pump station. The effluent pump station operates at a discharge pressure between 35 and 80 psi. Based on the site available to locate the WRDP, MDWASD staff proposed to tap into the pressurized line feeding Injection Well No. 7. A 4-inch diameter pipeline will supply secondary effluent to the WRDP. The influent flow will be controlled with a flow meter and flow control valve after the strainer to obtain the desired minimum pressure through the strainer. It is recommended that the pressure at the proposed connection be monitored prior to final design.
The secondary effluent is not normally chlorinated; however, every month for a period of 4 hours, the effluent is chlorinated to comply with injection well testing requirements. Chlorinated feed to the WRDP will destroy the biological life of the nitrification and denitrification units. Therefore, it is recommended that final design of
3-8
KM2870.sec3.doc 11/9/2007
Coastal Wetlands Rehydration Demonstration Project Water Reclamation Demonstration Plant
A
TABLE 3-4
WRDP incorporate measures to monitor the chlorine levels and provide measures for eliminating the possibility of feeding chlorinated water to the WRDP.
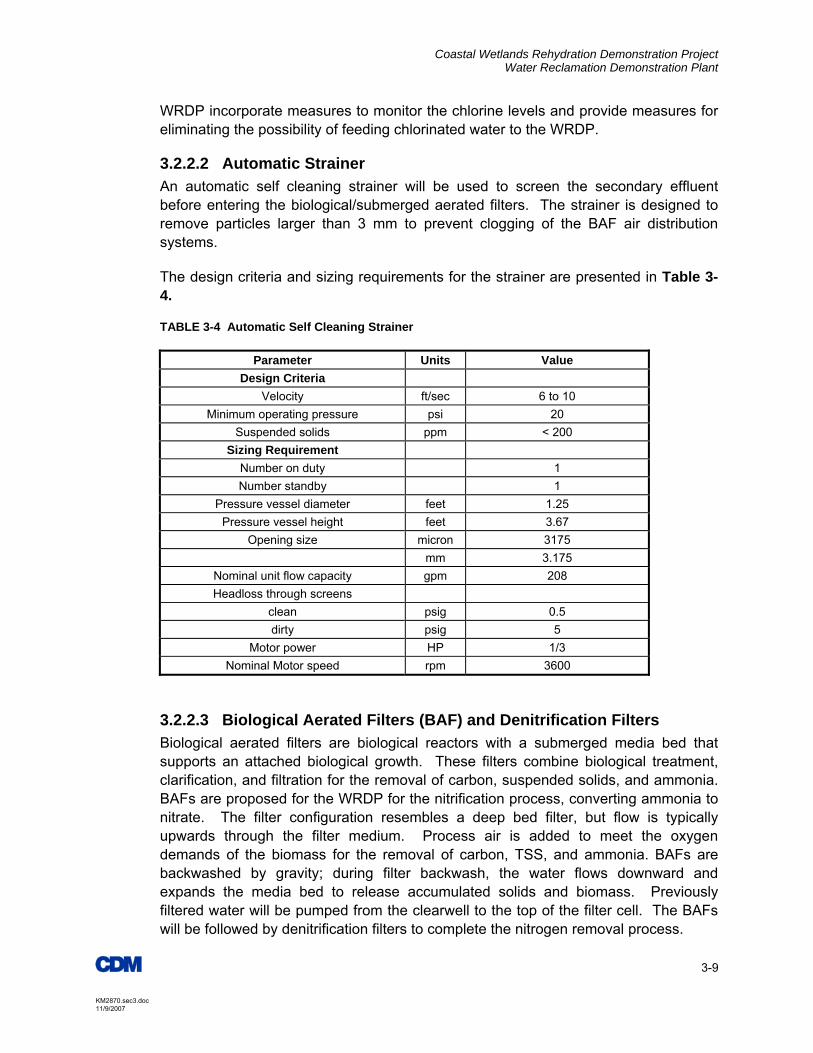
3.2.2.2 Automatic Strainer An automatic self cleaning strainer will be used to screen the secondary effluent before entering the biological/submerged aerated filters. The strainer is designed to remove particles larger than 3 mm to prevent clogging of the BAF air distribution systems.
The design criteria and sizing requirements for the strainer are presented in Table 3-4.
Automatic Self Cleaning Strainer
Parameter Units Value Design Criteria
Velocity ft/sec 6 to 10 Minimum operating pressure psi 20
Suspended solids ppm < 200 Sizing Requirement
Number on duty 1 Number standby 1
Pressure vessel diameter feet 1.25 Pressure vessel height feet 3.67
Opening size micron 3175 mm 3.175
Nominal unit flow capacity gpm 208 Headloss through screens
clean psig 0.5 dirty psig 5
Motor power HP 1/3 Nominal Motor speed rpm 3600
3.2.2.3 Biological Aerated Filters (BAF) and Denitrification Filters Biological aerated filters are biological reactors with a submerged media bed that supports an attached biological growth. These filters combine biological treatment, clarification, and filtration for the removal of carbon, suspended solids, and ammonia. BAFs are proposed for the WRDP for the nitrification process, converting ammonia to nitrate. The filter configuration resembles a deep bed filter, but flow is typically upwards through the filter medium. Process air is added to meet the oxygen demands of the biomass for the removal of carbon, TSS, and ammonia. BAFs are backwashed by gravity; during filter backwash, the water flows downward and expands the media bed to release accumulated solids and biomass. Previously filtered water will be pumped from the clearwell to the top of the filter cell. The BAFs will be followed by denitrification filters to complete the nitrogen removal process.
3-9
KM2870.sec3.doc 11/9/2007

Coastal Wetlands Rehydration Demonstration Project Water Reclamation Demonstration Plant
A
TABLE 3-5
Denitrification filters are deep bed gravity sand filters that are both filters and biological reactors. Flow is downwards through a filter medium that has an effective size of about 3 mm. When influent containing nitrate (produced in the BAFs) and a carbon source (usually methanol from an outside source) are passed through the filter, a biomass of facultative heterotrophic bacteria that grows on and between the sand particles converts nitrate to nitrogen gas. The filter is periodically “bumped” with a pulse of water to remove accumulated gas in the filter bed. The denitrification filters need to be regularly backwashed with a combination of backwash water and air to remove accumulated suspended solids.
The design for the main process line consists of three BAF units, each approximately 7 feet in diameter with approximately 10 feet of media depth. The main process consist of three denitrification filter units, each 6 feet in diameter with approximately 6 feet of media depth. Clearwells will be provided for the backwash supply water storage for the BAF and the denitrification filters downstream of the BAFs. Major equipment includes process blowers, backwash blowers, and backwash pumps for the BAF, methanol system, and backwash blowers and pumps for the denitrification filters. All backwash waste is sent to the SDWWTP by way of the WRDP facility lift station. The design criteria for the BAF and the denitrification filters immediately downstream of the BAFs are summarized in Table 3-5. The facility requirements are summarized in Table 3-6.
BAF and Denitrification Filters Design Criteria
Nitrifying Biological Aerated Filters Units Value BAF Volumetric Loading, NOx lb/d/kcf 57
BAF Volumetric Loading, CBOD5 lb/d/kcf 212 BAF Hydraulic Loading gpm/ ft2 1.68
Media Depth ft 10 Media Specific Surface Area ft2/ft3 250 Backwash Air Requirements icfm/ft2 6
Backwash Water Requirements gpm/ft2 6 Aeration System
Oxygen Demand for Total CBOD lb. O2/lb. CBOD5 removed 1.2
Oxygen Demand for NH4-N lb. O2/lb. N oxidized 4.6 Oxygen Transfer Efficiency (OTE) % 15
Denitrification Filters Nominal Hydraulic Loading Rate (Average Flow) gpm/ft2 2.3
Volumetric Mass Loading lb NO3-N/kcf/day 122 Backwash Air Rate Requirements icfm/ft2 5.0 Backwash Water Requirements gpm/ft2 6.0
Methanol Feed Methanol Ratio CH3OH:N Ratio 3
Methanol Dosage gpd 28
3-10
KM2870.sec3.doc 11/9/2007

Coastal Wetlands Rehydration Demonstration Project Water Reclamation Demonstration Plant
A
TABLE 3-6 Facility Requirements
BAF Units Value
Type Biological Aerated Filter-Upflow
Media Type 2-3 mm Granular Sand
Number of Units 3
Type Vertical, circular. Carbon Steel
Diameter feet 7
Height feet 20
Surface Area per Unit ft2 38.5
Media Depth feet 10
Process Air Compressors
Type Positive Displacement
Number 3 Duty + 1 Standby
Unit Capacity icfm 32 Backwash Air Compressors
Type Positive Displacement Number 1 Duty + 1 Standby
Unit Capacity icfm 200 Backwash Pumps
Type Centrifugal Number 1 Duty + 1 Standby
Unit Capacity 231 Denitrification Filters
Type Deep Bed Granular Media Media Type 2-3 mm Silica Sand
Number of Units 3
Type Vertical, circular. Carbon Steel Diameter feet 6
Height feet 18
Surface Area ft2 28
Media Depth feet 6 Backwash Pumps
Type Centrifugal Number 1 Duty + 1 Standby
Unit Capacity gpm 170 Backwash Air Compressors Units Value
Type Positive Displacement Number 1 Duty + 1 Standby
Unit Capacity icfm 141 Clearwell Tanks
Number 2
Type Vertical, circular. Carbon Steel
Diameter feet 8 Height feet 14
3-11
KM2870.sec3.doc 11/9/2007
Coastal Wetlands Rehydration Demonstration Project Water Reclamation Demonstration Plant
A
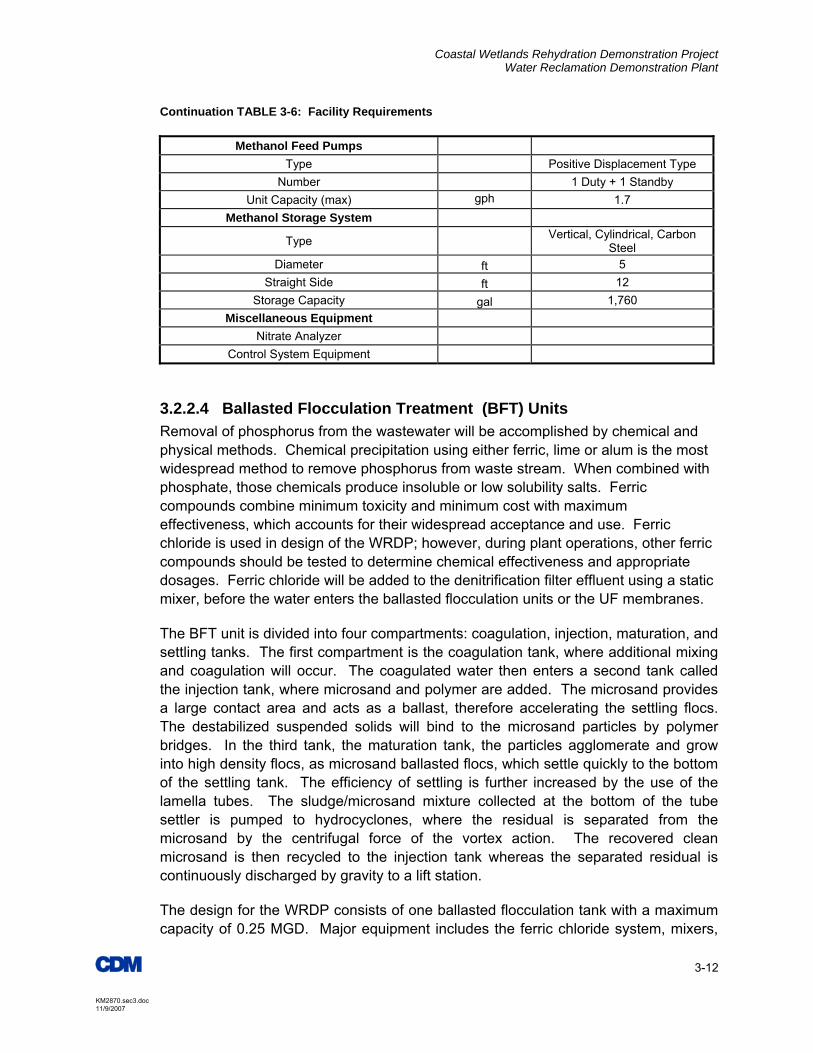
Continuation TABLE 3-6: Facility Requirements
Methanol Feed Pumps Type Positive Displacement Type
Number 1 Duty + 1 Standby Unit Capacity (max) gph 1.7
Methanol Storage System
Type Vertical, Cylindrical, Carbon
Steel Diameter ft 5
Straight Side ft 12 Storage Capacity gal 1,760
Miscellaneous Equipment Nitrate Analyzer
Control System Equipment
3.2.2.4 Ballasted Flocculation Treatment (BFT) Units Removal of phosphorus from the wastewater will be accomplished by chemical and physical methods. Chemical precipitation using either ferric, lime or alum is the most widespread method to remove phosphorus from waste stream. When combined with phosphate, those chemicals produce insoluble or low solubility salts. Ferric compounds combine minimum toxicity and minimum cost with maximum effectiveness, which accounts for their widespread acceptance and use. Ferric chloride is used in design of the WRDP; however, during plant operations, other ferric compounds should be tested to determine chemical effectiveness and appropriate dosages. Ferric chloride will be added to the denitrification filter effluent using a static mixer, before the water enters the ballasted flocculation units or the UF membranes.
The BFT unit is divided into four compartments: coagulation, injection, maturation, and settling tanks. The first compartment is the coagulation tank, where additional mixing and coagulation will occur. The coagulated water then enters a second tank called the injection tank, where microsand and polymer are added. The microsand provides a large contact area and acts as a ballast, therefore accelerating the settling flocs. The destabilized suspended solids will bind to the microsand particles by polymer bridges. In the third tank, the maturation tank, the particles agglomerate and grow into high density flocs, as microsand ballasted flocs, which settle quickly to the bottom of the settling tank. The efficiency of settling is further increased by the use of the lamella tubes. The sludge/microsand mixture collected at the bottom of the tube settler is pumped to hydrocyclones, where the residual is separated from the microsand by the centrifugal force of the vortex action. The recovered clean microsand is then recycled to the injection tank whereas the separated residual is continuously discharged by gravity to a lift station.
The design for the WRDP consists of one ballasted flocculation tank with a maximum capacity of 0.25 MGD. Major equipment includes the ferric chloride system, mixers,
3-12
KM2870.sec3.doc 11/9/2007

Coastal Wetlands Rehydration Demonstration Project Water Reclamation Demonstration Plant
A
TABLE 3-7
sand recirculation pumps, hydrocyclones, and polymer system. The design criteria and facility requirements for ferric chloride system and BFT units are included in Table 3-7 and Table 3-8.
Ballasted Flocculation Design Criteria
Chemical (Ferric Chloride) System Units Value
Ferric chloride dose mg/L 25 Solution concentration % 38.0
Specific gravity 1.43 Ballasted Flocculation Units
Coagulation Tank Hydraulic detention time min 2
Injection Tank Hydraulic detention time min 2
Maturation Tank Hydraulic detention time min 6
Settling Tank Overflow velocity gpm/ft2 16
Additives Polymer dose mg/L 1
Microsand mg/L 1 Residual Production
Estimated residual concentration %TS 0.1 - 0.5 Residual volume %Q 1 -4
3-13
KM2870.sec3.doc 11/9/2007

Coastal Wetlands Rehydration Demonstration Project Water Reclamation Demonstration Plant
A
TABLE 3-8 Facility Requirements
Chemical (Ferric Chloride) System Units Values
Ferric Chloride Metering Pumps
Type Diaphragm Type
Number 1 duty + 1 standby
Unit capacity (max) gph 1.29
Static Mixer
Number of units 1
Unit capacity gpm 174
Pressure psi 1
Ferric Chloride Storage System
Type
Diameter ft 4
Length ft 5
Storage Capacity gal 470
Ballasted Flocculation Units
Type Package Plant
Number of Trains 1
Design Flow per Train MGD 0.25
Overall dimensions (L x W x H) ft 12.67 x 6.67 x 9.33
Total Height to the top of Hydrocyclone ft 15
Coagulation Tank
Number on duty 1
Design Flow /Unit MGD 0.25
Unit mixer power HP 0.5
Length ft 3.36
Width ft 3
Water Depth ft 5.35
Injection Tank
Number on duty 1
Unit Power HP 0.5
Length ft 3.36
Width ft 3
Water Depth ft 5.35
3-14
KM2870.sec3.doc 11/9/2007

Coastal Wetlands Rehydration Demonstration Project Water Reclamation Demonstration Plant
A
Continuation Table 3-8: Facility Requirement
Maturation Tank Units Values
Number on duty 1 Unit mixer power HP 1.5
Length ft 5 Width ft 6
Water Depth ft 5.35
Settling Tank Number on duty 1
Length ft 3.6 Length lamella zone ft 2
Width ft 6 Width lamella zone ft 5.67
Water Depth ft 8.7 Unit rake power HP 0.5
Sand Recirculation System Recirculation Pumps
Type Centrifugal Number 1 duty + 1 standby
Unit capacity gpm 18 TDH ft 49
Motor size HP 3 Hydrocyclones
Number 1 duty + 1 standby Unit capacity gpm 18
Polymer
Type Automatic polymer activation and
feed system, skid mounted packaged assembly
Number 1 duty + 1 standby Polymer Storage
Type 55 gallon drums Number 2
3-15
KM2870.sec3.doc 11/9/2007

Coastal Wetlands Rehydration Demonstration Project Water Reclamation Demonstration Plant
A
3.2.2.5 Ultrafiltration (UF) Membranes Low-pressure membrane treatment systems are broadly categorized by the size of the particles rejected by the membranes. The two main types of low pressure membranes used are the microfiltration (MF) and ultrafiltration (UF). Microfiltration (MF) can be considered as any semi-permeable membrane with pore sizes between 0.1 and 1 micrometers (micron, µm) while UF membranes have pore sizes between 0.002 and 0.01 µm. MF systems will remove nearly all suspended particles including particulates, large colloids, oils, and about 3-6 log removal (99.9 percent – 99.9999 percent) of bacteria. UF membranes have smaller pore sizes than MF membranes, and will provide complete removal of bacteria and protozoan cysts, and 4-6 log removal for virus. Since size exclusion is the primary mechanism to remove contaminants from MF and UF membranes, a higher quality effluent is expected from UF membranes.
The tentatively selected type of membranes in this design is the Submerged Zee Weed 500 UF membranes, which utilize “Outside-In” flow, through a hollow fiber membrane that has nominal and absolute pore sizes of 0.04 and 0.1 microns respectively. The membranes are made from a polyvinyl difluoride (PVDF) material, which has a high resistance to both oxidants and biological foulants. The membranes operate under a vacuum, drawing treated water through the membrane pores into the inside of the hollow fibers. Periodically, filtered water (filtrate) is backwashed through the membrane fibers from “inside-out” while air is introduced at the bottom of the membrane modules to create turbulence along the membrane surface, scouring and cleaning the outside of the membrane fibers. Chemical back pulsing is another cleaning strategy done about once per day to further restore permeability. It involves back pulsing membranes with a chemical like sodium hypochlorite. Finally, recovery cleaning is performed every month and involves in-tank chemical soaking to remove organic and inorganic contaminants from the fibers using sodium hypochlorite and citric acid.
Provisions will be included at the WRDP to feed treated water either from the denitrification filters or the BFT units, after ferric chloride addition, to the UF membranes to evaluate the performance of membranes in removing phosphorus. Potential sand carry-over from the BFT unit to the UF membranes is of some concern, and it is recommended that this issue be investigated further during Phase II design and that required provisions be made during Phase II design.
Treated water is drawn through the membrane pores and enters the inside of the hollow fibers. Water then flows through a permeate pump, which conveys UF treated water to a UV disinfection system and then to the sample collection area for the aquatic toxicology and ecological testing. A portion of the effluent water from the membrane system will be sent to the side stream pilot plant units for further treatment evaluation.
The conceptual design for the WRDP consists of one Z-Box M-52 unit and one M-26 unit, with a total of three trains, each with one Zee Weed 500 cassette. This
3-16
KM2870.sec3.doc 11/9/2007

Coastal Wetlands Rehydration Demonstration Project Water Reclamation Demonstration Plant
A
TABLE 3-9
configuration provides one standby train which would be brought on-line when another train is in a cleaning cycle to maintain a constant flow through the WRDP. The major equipment includes permeate pumps, membrane aeration blowers, and a back pulse tank. The design criteria and facility requirements are detailed in Tables 3-9 and 3-10.
Membrane Design Criteria
Membranes Design Criteria Units Value
Membrane Treatment Units
Membrane Type
Ultrafiltration (UF) Immersed, Hollow-Fiber
Pore Size microns 0.1 Nominal Pore Size microns 0.040
Design Flux gfd 18 - 22 Module Surface Area ft2 250
Number of Modules in Cassette 26 Scour Airflow Requirements scfm/cassette 140-200 Typical Backpulse Cycles minutes 15 to 60
Cleaning Solution Daily Maintenance Clean (NaOCL) mg/L 100
Recovery Clean Frequency days 30.0 Sodium Hypochlorite mg/L 500
Citric Acid mg/L 1,000 TABLE 3-10 Facility Requirements
Membrane Facility Requirements Units Value
Membrane Treatment Units
Number of Units 2
Number of Trains 3
Number of Standby Train 1
Number of Cassettes per Train 1
Total Number of Cassettes 3
Number of Modules per Cassette 26
Total Number of Modules 78
Total Membrane Surface Area ft2 19,500
Design Flux Rate gfd 21.1
M-52 Membrane Tank Dimensions (L X W X H) ft 8 x 6.8 x 7.82 M-26 Membrane Tank Dimensions (L X W X H) ft 7.66 x 3.39 x 7.78
3-17
KM2870.sec3.doc 11/9/2007

Coastal Wetlands Rehydration Demonstration Project Water Reclamation Demonstration Plant
A
Continuation Table 3-10 - Facility Requirements
Membrane Facility Requirements Units Value Nominal capacity per cassette MGD 0.140 Membrane Aeration Blowers
Type Regenerative Number 2 Duty + 1 Standby
Unit Capacity scfm 140 Discharge Pressure psig 3.0
Motor Size HP 6.4 Permeate/Backpulse Pump
Type Centrifugal Number 2 Duty + 1 Standby
Unit capacity gpm 125 TDH ft 10 - 30
Motor Size HP 1.5 Backpulse Tank
Number 2
3.2.2.6 Ultraviolet (UV) Disinfection During the 2004 USACE study, UV disinfection was the recommended technology for the pilot plant since it does not produce regulated disinfection byproducts, eliminates the need of dechlorination, and eliminates the burden of dealing with safety and regulatory issues. In addition, medium-pressure, high intensity lamp in a closed-vessel (in-line) reactor was recommended in the treatment alternative study.
Ultraviolet disinfection systems transfer electromagnetic energy, using mercury vapor lamps, to an organism’s genetic material. UV systems use wavelengths of electromagnetic radiation between 250 and 270 nanometers (nm) to inactivate microorganism and viruses by altering their DNA and RNA. The effectiveness of a UV disinfection system depends on the characteristics of the wastewater, the intensity of UV radiation (dose), the amount of time the microorganism is exposed to the radiation (contact time), and the reactor configuration. Important wastewater characteristics that influence UV disinfection efficiency include the percent transmittance, turbidity, and TSS. These three parameters will affect the penetration capability of UV radiation, where UV disinfection is directly proportional to UV penetration while maintaining a constant UV dose. The UV dose is measured as the product of intensity and exposure time, as milliwatt-seconds per square centimeter (mW-s/cm2).
To meet the Florida high-level disinfection criteria, the Florida Department of Environmental Protection (FDEP) requires that UV designs comply with the 2003 National Water Research Institute (NWRI) guidelines. Resembling a multiple barrier approach, the NWRI has devised a systematic method to UV design where the most treated effluent (e.g. RO) will require the least UV radiation and the least treated (granular filtration) will require the most UV radiation. For the WRDP, sizing of the UV
3-18
KM2870.sec3.doc 11/9/2007

Coastal Wetlands Rehydration Demonstration Project Water Reclamation Demonstration Plant
A
TABLE 3-11
system was based on 65 percent transmissivity and minimum dose of 80 mW-s/cm2
associated with MF/UF membrane effluent.
The design for the WRDP consists of two parallel low pressure UV disinfection units in series. Each unit consists of a stainless steel chamber containing 6 low pressure lamps. The units include an automatic mechanical wiping system quartz sleeve cleaning system, UV monitor, and access hatch. The design criteria and facility requirements for the UV system are detailed in Table 3-11.
UV Design Criteria and Facility Requirements
DESIGN CRITERIA Units Value Bulb type Low pressure
Minimum transmittance % 65
Minimum dose mJ/cm2 80
Disinfection fc/100 ml Non detectable FACILITY REQUIREMENT
Type Low pressure Number of Units 2
Configuration Parallel Number of lamps per unit 6
Total number of lamps 12 Average power per lamp kW 0.33 Maximum Power per Unit kW 2.3
Pipe diameter inch 10
3.2.2.7 Return Flows and Facility Lift Station After the UV system, a portion of the high quality water produced at the 0.23-MG WRDP will be sent to the aquatic toxicology and ecological lab/sample collection area and the remaining flow will be returned to the head of the SDWWTP via the facility lift station.
Return flows refers to flows from the WRDP and Sidestream plants that are sent back to the SDWWTP’s headworks. The return flows from the WRDP include the backwash waste from the strainers, filters, and membranes, in addition to the residual from the ballasted flocculation units. The return flows from the SSP include the effluent from the different sidestream units and their respectively waste streams. These flows will be collected in a lift station to be pumped back to the SDWWTP headworks. Table 3-12 provides a summary of the return flow contributions from the main process. TABLE 3-12 Return Flows to SDWWTP
Parameter Strainer Nitrification/Denitrification Filters
Ballasted Flocculation UF Filter
Flow, MGD 0.015 0.03 0.01 0.012
TSS, mg/L 100 1000 1000 30 TSS, lb/day 13 250 84 3
3-19
KM2870.sec3.doc 11/9/2007

Coastal Wetlands Rehydration Demonstration Project Water Reclamation Demonstration Plant
A
3.2.3 Description of Alternate Main Process Treatment Train In an effort to provide a potential cost and time savings for the WRDP, this alternate treatment train for the main process has been developed. The proposed train would produce a nominal flow of 0.07 MGD, which is the current anticipated flow required for the toxicity and ecological tank testing. As the toxicity and ecological tank testing plan is finalized, this capacity should be re-evaluated. Figure 3-3 represents the flow diagram for this alternate treatment train.
Where as the total phosphorus reduction in the 0.23 MGD plant could be removed using the ballasted flocculation unit or the ultra-filtration membranes, total phosphorus reduction for this alternate would be achieved using traditional flocculation or the ultra-filtration membrane. The elimination of the ballasted flocculation unit from the middle of the treatment process allows the plant capacity to be reduced.
Advantages of using this alternate treatment train or one of similar size include the following:
Cost savings
Units could possibly be used for other proposed pilot studies
Schedule reduction
Disadvantages of using this treatment train include the following:
Flow stream may not be large enough if it is decided that a constructed wetland application needs to be tested
3.3 Sidestream Plant (SSP) Conceptual Design As mentioned earlier, provisions will be made for a 0.06 MGD sidestream of the WRDP demonstration plant effluent to flow through additional advanced treatment units. The technologies to be considered in the evaluation were:
RO membranes
UV disinfection with hydrogen peroxide (H2O2)
Ozone (O3) and/or ozone with H2O2
3-20
KM2870.sec3.doc 11/9/2007

StrainerFeCl3
(Optional)
Backwash Waste to
Facility Lift Station
Backpulse Tank
Drain to Facility Lift
StationProcess/
Backwash Air
Biological Aerated Filters Clearwell
Backwash Waste to
Facility Lift Station
Process Air Backwash
Water
Backwash Waste to
Facility Lift Station
SDWWTP Secondary
Effluent
To Side Stream Plant
(30-40 GPM)
Ultraviolet Disinfection
Ultrafiltration Membrane Units
To Facility Lift Station
To SDWWTP
Headworks
Facility Lift Station
To Indoor Testing
Facility or Sample
Collection Area
Denitrification Filters
Air Scour
Static Mixer
Static Mixer
Flocculation Tank
CH3OH
Polymer
FIGURE 3-3CWRDP ALTERNATE MAIN PROCESS FLOW DIAGRAM
FeCl3
NOMINAL 0.07 MGD COASTAL WETLANDS REHYDRATION DEMONSTRATION PLANT (CWRDP)


Coastal Wetlands Rehydration Demonstration Project Water Reclamation Demonstration Plant
A
Granular Activated Carbon (GAC), and
Ion Exchange (IX)
After considering the recommendations presented in the 2004 technology evaluation report and evaluating the performance of the technologies through literature review, conceptual designs for RO, advance oxidation processes (AOP), GAC, and IX were prepared to provide provisions in the plant to test for various process train options, since there is not a “comprehensive” treatment technology that will remove all the compounds indicated in the OFW water quality goals. The objective of the SSP is to evaluate the performance of the technologies and process train options in reducing microconstituents, total nitrogen, total phosphorus, and N-nitrosodimethylamine (NDMA). The technologies were conceptually designed with the information currently available.
It is important to note that there may be a variety of microconstituents in the wastewater; and therefore monitoring efforts can become impractical. A monitoring program needs to consider surrogate chemicals and selected microconstituents. In final design, a monitoring program will be proposed for the SSP.
The process train options are included on Figure 3-1 and listed below:
IX + AOP
IX + GAC + AOP
GAC + AOP
RO + AOP
RO + GAC + AOP
RO + IX + AOP
The AOPs are comprised of the three combinations listed below:
UV with H2O2
Ozone with H2O2
Ozone and UV
During the initial sidestream monitoring, the best AOP will be selected from a removal/reduction standpoint. The water quality of the best advanced oxidation process will be tested in combination with the other units of the Sidestream plant (e.g. RO, IX, GAC) to determine the best overall treatment train for the SSP.
3-22
KM2870.sec3.doc 11/9/2007

Coastal Wetlands Rehydration Demonstration Project Water Reclamation Demonstration Plant
A
Initial acute aquatic toxicity testing will be performed for the possible combinations of sidestreams listed above (a maximum of six). Any sidestream that does not pass acute toxicity will be eliminated from further study in selecting the best overall SSP process for more extensive toxicity and ecological testing.
Table 3-13 provides a summary of the design criteria, technology objectives, and facility requirements for RO, AOP, IX, and GAC. Appendix A provides equipment manufacturer’s cut sheets and descriptive literature for SSP technologies.
3.4 Water Reclamation Demonstration Project Conceptual Design
This section includes the initial conceptual design work and consists of site layout, hydraulic profile, mass balance, and conceptual drawings.
3.4.1 Site Layout Several locations for the WRDP at the SDWWTP were previously discussed with MDWASD staff and with the HLD engineering consultant. Meeting minutes summarizing these discussions are included in Appendix A. After evaluating the potential options and considering existing piping and utilities, the open green site located between the FPL substation and holding pond No.7 was selected as the location for the WRDP. The area available is approximately 30,800 ft2. This site is close to Injection Well No. 7. A site location plan is included as Figure 3-4.
The WRDP site will include the BAF reactors, denitrification filters, clearwell tanks, BFT unit, membrane system, chemical handling area, RO pilot trailer, lift station, a pre-engineered metal building for the pilot plant facilities and indoor toxicity testing area, a sample preparation trailer, a control/operations facility and an electrical switch gear and motor control center enclosure. The location of the outdoor testing facilities will be determined after the finalization of the aquatic toxicity and ecological testing plans. A sample collection area has been made available for collection any of the WRDP’s effluent to be taken offsite. A site plan depicting the location of the facilities is shown on Figure 3-5. Figure 3-6 presents a schematic of the proposed main process piping for the WRDP.
Access to the site will be provided with roadway extensions off of the existing plant access roads as shown on Figure 3-5. This new road will provide access to the WRDP for plant operation and maintenance personnel as well as for deliveries of chemicals such as ferric chloride, polymer, and methanol.
3-23
KM2870.sec3.doc 11/9/2007

Coastal Wetlands Rehydration Demonstration Project Water Reclamation Demonstration Plant
A
TABLE 3-13 Sidestream Plant Design Criteria and Facility Requirements
Process Units Value Reverse Osmosis (RO)
Treatment objective TP < 0.005, TN < 0.27, lowest possible EDC
and PPCPS
No of skid (trains) 1
Production gpm 30
No. vessels 6
Membrane per vessel 7
Array 4:2
Average flux gfd 12
Nominal production per element gfd 1020
Recovery stages 1 & 2 % 85%
Pressure Vessels
Diameter in 4
Length in 287
Ports - Feed/Concentrate in 1" IPS
Ports - Permeate in 3/4" FPT
Maximum working pressure rating psig 300
Membranes
Manufacturer Hydranautics, Filmtec, Koch or Approved Equal
Number 42
Type low fouling
Nominal diameter in 4
Nomical length in 40
Area per element ft2 82-85
Material poyamide (thin film composite)
Type spiral wound
Design membrane flux average gfd 12
Maximum feed pressure psi 250
Granular Adsorption Carbon (GAC)
Treatment Objective lowest possible EDC and PPCPS
GAC Type Calgon
Flow gpm 15
Number of contactors 2 duty in series
Diameter ft 1.87
Depth ft 2.93
3-24
KM2870.sec3.doc 11/9/2007

Coastal Wetlands Rehydration Demonstration Project Water Reclamation Demonstration Plant
A
Continuation Table 3-13: Sidestream Plant Design Criteria and Facility Requirements
Area ft2 2.7
Hydraulic loading rate gpm/ft2 1.8
Contact time min 4.5
Operating pressure lb/in2 <5
Ion Exchange
Treatment objective Removal of TOC, TN < 0.27
Type (1)Organic Scavenging + (1) Nitrate Removal
Flow gpm 10
Number of units 2 in series
Diameter ft 1.5
Area ft2 1.8
Hydraulic loading rate gpm/ft2 5.7
Depth ft 9.0
Advanced Oxidation Process
Ozone / H2O2
Treatment objective lowest possible EDC and PPCPS
Model (1)HiPOx Cabinet Unit (HCU)
Flow gpm 1 to 5
Ozone concentration mg/L 2 to 40
Ozone capacity lbs/day Upto 20
Maximum H2O2 (5%-35%)dose mg/L 20
Power required at full flow and oxidant dose KW 2.1
UV/H2O2
Treatment objective lowest possible EDC and PPCPS
Model (1)LBX90
Number of lamps 4
Peak flow gpm 20
UV dose at peak flow mJ/cm2 600
H2O2 dosage mg/L 5
UV
Treatment objective NDMA
Model (1)Inline 400 +
Number of lamps 4
UV dosage mJ/cm2 500-750
Maximum power consumption KW 10
3-25
KM2870.sec3.doc 11/9/2007


Coastal Wetlands Rehydration Demonstration Project Water Reclamation Demonstration Plant
A
3.4.2 Hydraulic Profile The header pressure at the point of connection may be sufficient to feed water through the stainer and into the BAF reactors after flow measurement; this tie in pressure and its variability will have to be confirmed during final design. The conceptual design for the WRDP provides gravity flow from the BAF reactors to the UF membranes. The permeate pumps included in the membrane system will convey treated water to the UV disinfection system and then to testing sample collection area, RO process, indoor testing facilities, and to the facility lift station. A preliminary evaluation of the gravity hydraulics for the WRDP was performed. The estimated water surface elevation in each treatment unit for a 0.23 MGD constant flow is shown on Figure 3-7.
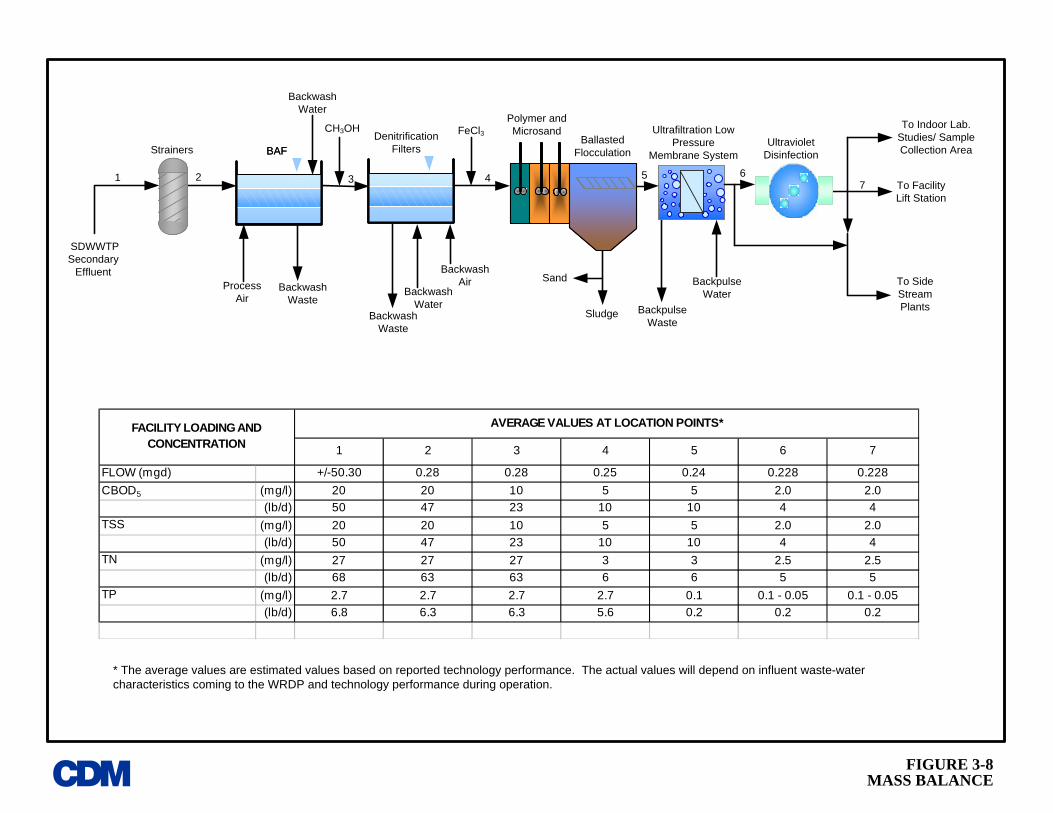
3.4.3 Mass Balance A mass balance was developed for TSS, CBOD5, total nitrogen and total phosphorus loadings for a 0.23 MGD WRDP. A process schematic and the mass balance calculations are presented on Figure 3-8.
3.4.4 Electrical System Design The expected system voltage for the WRDP is 480 volts, 3 phase and based on preliminary equipment sizing. Electrical power for the WRDP can potentially be provided from the electrical power poles on SW 232nd Street, which is on the north side of the SDWWTP. During final design, the location of the electrical feed and additional electrical design will be better defined.
3.4.5 Instrumentation and Process Control The WRDP is composed of several treatment processes such as BAFs, denitrification filters, ballasted flocculation treatment system, UF membranes and UV disinfection, each with their corresponding equipment, such as blowers, pumping systems, cleaning systems, and controls.
These processes will have their own local control panels for automatic control, in addition to the remote monitoring and control. The automatic control will include but will not be limited to filter backwashing sequencing, backwash water pumping, UV disinfection system monitoring, lamp output control, and pump controls.
In addition to each of the local automatic monitoring and control panels, a Main Control Panel (MCP) located in the office/control room trailer is proposed. This panel will be a central monitoring control and data storage center for monitoring and control of the entire process and any related equipment and monitoring devices. The MCP will provide monitoring, control and functionality to assist engineers and staff with the WRDP information including collection and storage of historical data. The proposed MCP will consist of an open-architecture monitoring and control system with programmable logic controllers (PLC) and an industrial computer for process monitoring and control. The MCP will be connected to other local control panels via fiber optic Ethernet network and/or hard wired. Also, all the process monitoring
3-29
KM2870.sec3.doc 11/9/2007

BAF
ProcessAir
Ultraviolet Disinfection
4 67
Polymer and Microsand
Ballasted FlocculationStrainers BAF
Denitrification Filters
CH3OH FeCl3
To Facility Lift Station
Ultrafiltration Low Pressure
Membrane System
1 2 3 5
Backwash Waste
SDWWTP Secondary
Effluent
Backwash Water
Backwash Waste
Backwash Water
Backwash Air
Sludge
Sand
Backpulse Waste
Backpulse Water
To Side Stream Plants
FIGURE 3-8MASS BALANCE
To Indoor Lab. Studies/ Sample Collection Area
1 2 3 4 5 6 7
FLOW (mgd) +/-50.30 0.28 0.28 0.25 0.24 0.228 0.228CBOD5 (mg/l) 20 20 10 5 5 2.0 2.0
(lb/d) 50 47 23 10 10 4 4TSS (mg/l) 20 20 10 5 5 2.0 2.0
(lb/d) 50 47 23 10 10 4 4TN (mg/l) 27 27 27 3 3 2.5 2.5
(lb/d) 68 63 63 6 6 5 5TP (mg/l) 2.7 2.7 2.7 2.7 0.1 0.1 - 0.05 0.1 - 0.05
(lb/d) 6.8 6.3 6.3 5.6 0.2 0.2 0.2
AVERAGE VALUES AT LOCATION POINTS*FACILITY LOADING AND CONCENTRATION
* The average values are estimated values based on reported technology performance. The actual values will depend on influent waste-water characteristics coming to the WRDP and technology performance during operation.

Coastal Wetlands Rehydration Demonstration Project Water Reclamation Demonstration Plant
A
devices will be hard wired directly to the MCP or through a junction cabinet. The industrial computer workstations will run Microsoft Windows operating system and Human Machine Interface (HMI) graphical software for monitoring and control.
Additional software applications, such as historical data management, storage, retrieval, reporting, and other functions will be furnished.
3.5 Project Implementation The design of the WRDP is divided in two phases. Phase I design is presented in this report and includes conceptual design. Phase II includes the preparation of preliminary (30%), detailed (60%) and final design drawings and specifications as well as permits for the construction of the WRDP. The permit application process begins after Phase I with an update review of the permits required for construction of the facilities and will continue in Phase II with the preparation and submittal of permits.
3.6 Estimated Capital Cost Preliminary capital cost estimate has been prepared for each element of the WRDP. The capital cost estimate includes the probable cost of construction for the work described in this report for the nominal 0.23-MGD WRDP and SSP.
The estimated cost of the WRDP is summarized in Table 3-14. The preliminary construction cost summary is based on budget cost estimates for equipment from manufacturer’s representatives and estimates for installation, site work, yard piping, electrical work, and instrumentation and controls. The construction cost estimate also includes considerations for permits, sales tax, bond and insurance, general requirements, contractor overhead and profit, and contingency. The estimated cost of construction is $8.6 million; this cost does not include capital costs for the outdoor testing studies. The total WRDP capital cost, including engineering, legal, and administration services, is estimated to be approximately $10.8 million.
A very preliminary cost for the alternate main process train has been developed based on initial inquiries. It is estimated between $5.5 to $6.5 million for construction. The total WRDP capital cost, including engineering, legal, and administration services, is estimated to be between $7 to $8 million.
3-32
KM2870.sec3.doc 11/9/2007

Coastal Wetlands Rehydration Demonstration Project Water Reclamation Demonstration Plant
A
TABLE 3-14 Capital Cost Estimate for 0.23 MGD WRDP
Description Allowance
Factor Cost Strainer $54,000
Ferric Chloride System $28,280
Biological Aerated Filters $630,000
Denitrification Filters $742,000
Ballasted Flocculation Treatment Unit $740,096
UF Membranes $1,379,000
UV Disinfection $80,192
Reverse Osmosis Pilot Unit $150,000
Sidestream Plant Processes Equipment $577,828
Lift Station $175,000
Clear Well $78,214
Building $153,600
Temporary Field Facilities $33,000
Indoor Laboratory Set Up $200,000
Electrical Enclosure $155,925
Subtotal: $5,177,000
Yard piping 5% $259,000
Mechanical 5% $259,000
Electrical 8% $414,000
Instrumentation and Controls 5% $259,000
Site work 10% $518,000
Subtotal: $6,886,000
General Conditions (mobilization, bonds, insurance, taxes, permits, licenses, overhead, profit, etc.) 25% $1,722,000
Opinion of Probable Construction Cost: $8,608,000
Contingency 10% $861,000
Technical Engineering, Legal and Administration 15% $1,291,000
Opinion of Probable Capital Cost: $10,760,000
Note: ENR CCI (Nov 2007) = 8091.81
3-33
KM2870.sec3.doc 11/9/2007

Coastal Wetlands Rehydration Demonstration Project Water Reclamation Demonstration Plant
A
TABLE 3-15
3.7 Estimated Operation and Maintenance Cost An estimate of the operation and maintenance (O&M) cost for the WRDP has been prepared considering average operating conditions. The estimated annual operating cost is approximately $200,000. This estimate does not include the cost of the indoor and outdoor sampling. The assumptions used in the development of the O&M costs are presented in Table 3-15. The estimates include labor, chemicals, electricity, equipment replacements and repairs.
O&M Assumptions
Description Assumptions/Values
Labor
The estimate includes labor for 2 full-time operators. Salary rates are based on hourly rates posted in Florida Water and
Pollution Control Operators Association and The 2005 NACWA Financial Survey. The hourly rates were increased
by 25 percent to account for benefits.
Electric Power
Power cost, $/kw-hour 0.10
Chemical Cost
Sodium Hypochlorite (10.8%), $/gal (55 gal drum) 4.70
Citric Acid Cost, $/lb 0.71
Polymer Cost, $/lb 2.0
Methanol, $/gal 1.15
Ferric Chloride, $/ton 275
Microsand, $/lb 1.43
Replacement
Membrane replacement, $/module 811
Membrane replacement The replacement cost is obtained assuming that 20 percent of the membranes would need to be replaced in a 5 year period.
UV lamp replacement
Replacement UV parts include lamps, sleeves, rings
expected lamp life is 12,000 hours
UV lamp cost = $199/lamp
Other equipment replacement 1 percent of equipment cost
3-34
KM2870.sec3.doc 11/9/2007

Coastal Wetlands Rehydration Demonstration Project Water Reclamation Demonstration Plant
A
3.8 Project Schedule A conceptual implementation schedule for the 0.23 MGD WRDP is provided on Figure 3-9. Phase II final design and construction should be completed by mid 2011. The demonstration plant and the monitoring program are estimated to operate for 3-5 years, based on information reported by SFWMD and the USACE. Operation of the plant may be longer than this recommended period. Assuming the tasks indicated in the preliminary schedule are met, start-up of WRDP should be in July 2011. This schedule assumes that there will not be a need for a constructed wetland scale ecological assessment after the completion of the small scale ecological testing.
3.9 Regulatory Permits A preliminary list of regulatory permits for the construction and operation of the WRDP are provided below:
Miami-Dade County permitting process which includes seven approvals entities: Building Department, Department of Planning and Zoning, Department of Environmental Resources Management, Public Works Department, Fire Rescue Department, Water and Sewer Department
Florida Department of Environmental Protection Request for Application for a Domestic Wastewater Facility Permit
If it is later determined that the WRDP should discharge to a constructed wetland then a Florida Department of Environmental Protection Request for Approval of Monitoring Plans for Discharge of Domestic Wastewater to Wetlands may be needed.
In 2003, USACE and SFWMD prepared a document entitled “Review of Regulatory Requirement and Coordination” where they provided a summary of the potential regulatory requirements for the construction and operation of the CERP Wastewater Reuse Technology Pilot Project with ultimate discharge to the Biscayne Bay Coastal Wetlands. A copy of this document is included in Appendix B. The regulatory requirements and permits discussed in the 2003 report will be considered in Phase II of the Coastal Wetland Rehydration Demonstration Project. The initial intent is for all the WRDP effluent to be returned to the SDWWTP after water quality, toxicity and ecological testing.
3-35
KM2870.sec3.doc 11/9/2007

ID Task Name Duration Start Finish
1 Stakeholder Input 3036 days 9/24/07 1/15/16
2 Conceptual Plan and Basis of Design 47 days 9/24/07 11/9/07
3 Ecological Technical Advisory Committee Selection 71 days 11/10/07 1/19/08
4 Toxicological/Ecological Peer Review Committee Selection 71 days 11/10/07 1/19/08
5 Consultant Selection(s) 210 days 11/10/07 6/6/08
6 Toxicity and Ecological Testing Plan 240 days 6/7/08 2/1/09
7 Ecological Technical Advisory Review CommitteeAssessment and Recommendations
120 days 6/7/08 10/4/08
8 Comprehensive Literature Review and Plan Design 180 days 6/7/08 12/3/08
9 Peer Review of Toxicity and Ecological Testing Plan 30 days 12/4/08 1/2/09
10 Final Toxicity and Ecological Testing Plan 30 days 1/3/09 2/1/09
11 Baseline Monitoring 2666 days 6/7/08 9/24/15
12 Update of Monitoring Plan 90 days 6/7/08 9/4/08
13 Data Gap Analysis 90 days 6/7/08 9/4/08
14 Continue Existing Water Quality Monitoring Program 2666 days 6/7/08 9/24/15
15 Conduct Supplemental Background Monitoring Program 2666 days 6/7/08 9/24/15
16 Baseline Assessment and Evaluation (Semi/AnnualReview)
2666 days 6/7/08 9/24/15
17 CWRDP Design and Construction 1145 days 6/7/08 7/26/11
25 CWRDP Operation, Testing, and Monitoring 1522 days 7/27/11 9/25/15
26 Pilot Plant Process Performance 1522 days 7/27/11 9/25/15
27 Peer Review Assessment Report 1 day 9/25/11 9/25/11
28 Toxicity Testing Studies 730 days 9/26/11 9/24/13
29 Peer Review Assessment Report 1 day 9/25/13 9/25/13
30 Ecological Testing Studies 1095 days 9/25/12 9/24/15
31 Peer Review Assessment Report 1 day 9/25/15 9/25/15
32 Evaluation of Full Scale Feasibility and Report 233 days 5/28/15 1/15/16
Q2 Q3 Q4 Q1 Q2 Q3 Q4 Q1 Q2 Q3 Q4 Q1 Q2 Q3 Q4 Q1 Q2 Q3 Q4 Q1 Q2 Q3 Q4 Q1 Q2 Q3 Q4 Q1 Q2 Q3 Q4 Q1 Q2 Q3 Q4 Q1 Q2 Q32007 2008 2009 2010 2011 2012 2013 2014 2015 2016
Tasks Subtasks Milestone
COASTAL WETLANDS REHYDRATION DEMONSTRATION PROJECT (CWRDP) CONCEPTUAL IMPLEMENTATION SCHEDULE (11/08/2007)
ANote: CWRDP Conceptual Implementation Schedule assumes constructed wetland phase will not be included in the project.
FIGURE 3-9CWRDP IMPLEMENTATION SCHEDULE