section 4 cargo handling equipment
TRANSCRIPT

Port of Long Beach 115 September 2007
2005 Air Emissions Inventory
SECTION 4 CARGO HANDLING EQUIPMENT This section discusses the Port facilities and the CHE identified through the inventory process. This section also provides a description of the CHE emission estimate methodology and results/findings for this source category. 4.1 Source Description Cargo handling equipment includes equipment used to move cargo (containers, general cargo, and bulk cargo) to and from marine vessels, railcars, and on-road trucks. The equipment typically operates only at marine terminals or at rail yards and is assumed not to operate on public roadways or lands. This inventory includes cargo handling equipment of 25 hp or greater using diesel fuel, gasoline, or alternative fuels. Due to the diversity of cargo, there is a wide range of equipment types. The majority of the equipment can be classified into one of the following equipment types:
Forklift Rubber tired gantry (RTG) crane Side handler Sweeper Top handler Yard tractor Other
The “other” category contains the following list of equipment:
Bulldozer Crane Excavator Loader Reach stacker Skid Steer Loader Truck
Figure 4.1 presents the distribution of the 1,259 pieces of equipment inventoried at the Port for 2005. Out of all the equipment inventoried at all Port facilities for 2005, 51% were yard tractors, 23% were forklifts, nine percent were top handlers, seven percent were RTG cranes, three percent were side handlers and five percent were other equipment.

Port of Long Beach 116 September 2007
2005 Air Emissions Inventory
Figure 4.1: Distribution of 2005 Port CHE by Equipment Type
Forklifts, 295, 23%
Sweepers, 15, 1%
RTG Cranes, 85, 7%
Other, 67, 5%
Side picks, 43, 3%
Top Handlers, 113, 9%
641 Yard Tractors, 51%
4.2 Geographical Delineation The 2005 EI for CHE includes container terminals; dry bulk; break bulk terminals; liquid bulk terminals; an auto terminal and a cruise ship terminal. Figure 4.2 presents the geographic boundary of the CHE EI for the Port of Long Beach.

Port of Long Beach 117 September 2007
2005 Air Emissions Inventory
Figure 4.2: Port of Long Beach Terminals
Following is the list of the terminals by cargo type inventoried in 2005:
Container Terminals:
California United Terminals (CUT) International Transportation Service (ITS) Long Beach Container Terminal (LBCT) Pacific Container Terminal (PCT) SSAT – Pier A SSAT – Pier C Total Terminals International (TTI)

Port of Long Beach 118 September 2007
2005 Air Emissions Inventory
Break-Bulk Terminals:
California United Terminals - Breakbulk Cooper/T. Smith SSAT Bulk – Crescent Terminals Pacific Coast Recycling Fremont Forest Group Weyerhauser Norske Skog Conolly-Pacific
Dry Bulk Terminals:
Koch Carbon G -P Gypsum Metropolitan Stevedore Morton Salt Cemex Mitsubishi Cement National Gypsum Sulex Horizon Lines
Liquid Terminals:
BP/ Arco Chemoil Baker Commodities Petro Diamond Equillon (Shell) Enterprise
Auto Terminals:
Toyota
Passenger Terminals:
Carnival Cruise Terminal

Port of Long Beach 119 September 2007
2005 Air Emissions Inventory
4.3 Data and Information Acquisition All of the terminal’s maintenance or CHE operating staff were contacted to obtain information on CHE specific to their terminal. The population and horsepower of each type of engine were collected by the port after contacting each terminal operator for the calendar year 2005. Information on fuel type used, emission control devices, and annual hours of operation was also collected. Examples of equipment details collected include:
Equipment type Equipment identification number Equipment make and model Engine make and model Rated horsepower Model year Type of fuel used (Diesel, ULSD, Gasoline or Propane) Alternative fuel used, start date (O2 Diesel, emulsified fuel) Fuel consumption (information not readily available) Annual hours of operation (some terminals stared using hour meters) Diesel Oxidation Catalyst (DOC) installed (y or n) Date DOC installed On-road engine installed (y or n) Any other emissions control devices installed
The data was compiled and input into a spreadsheet and checked for completeness. The terminals were re-contacted if additional information was required (detailed equipment inventory is presented in Appendix C). An identification number was assigned to each piece of CHE to maintain confidentiality regarding terminal-specific information on numbers and types of equipment. Table 4.1 summarizes the horsepower, model year, and annual operating hours for each equipment type. It should be noted that this inventory does not contain a comprehensive list of electrical equipment and only include the two electric pallet jacks listed.

Port of Long Beach 120 September 2007
2005 Air Emissions Inventory
Power (horsepower) Model Year Annual Operating HoursEquipment Count Range Average Range Average Range Average
Bulldozer 6 165 - 305 226 1993 - 2005 1999 100 - 2,500 733Crane 10 100 - 439 326 1978 - 2005 1995 0 - 4,000 1,862Excavator 2 362 - 439 401 1997 - 2003 2000 3,000 - 3,500 3,250Forklift 295 40 - 280 126 1961 - 2005 1993 0 - 4,160 710Loader 18 150 - 750 343 1979 - 2002 1991 216 - 2,500 1,172Pallet jack (electric) 2 NA - NA NA NA - NA NA NA - NA NAReach stacker 3 330 - 330 330 1994 - 1998 1995 700 - 1,000 900RTG crane 85 219 - 946 619 1973 - 2005 1995 0 - 3,300 1,964Side pick 43 115 - 240 166 1982 - 2005 1999 0 - 2,500 1,148Skid steer loader 4 30 - 85 48 1990 - 1996 1994 100 - 1,040 595Sweeper 15 30 - 180 105 1982 - 2005 1996 52 - 1,049 502Top handler 113 250 - 330 272 1992 - 2005 2001 10 - 4,114 1,999Tractor 6 110 - 110 110 1996 - 1996 1996 936 - 936 936Truck 16 100 - 210 142 1984 - 2006 1986 5 - 520 69Yard tractor 641 173 - 245 183 1993 - 2005 2001 0 - 5,286 2,186Total 1,259
Table 4.1: CHE Summary by Equipment Type

Port of Long Beach 121 September 2007
2005 Air Emissions Inventory
4.4 Terminal Description and Equipment Types
4.4.1 Container Terminals The POLB is a major port of entry for containerized cargo shipped by OGVs into the U.S. Together with the Port of Los Angeles, the Port of Long Beach serves the Los Angeles Basin, Southern California and other destinations in the continental U.S. In 2005, seven major container terminals at the Port handled the majority of the 6.7 million TEUs26:
Pier E & D: California United Terminals (CUT) Pier G: International Transportation Service (ITS) Pier F: Long Beach Container Terminal (LBCT) Pier J: Pacific Container Terminal (PCT) Pier A: SSAT Pier C: SSAT Pier T: Total Terminals International (TTI)
Operational Characteristics The basic layout of a container terminal consists of: docks where vessels berth; an area alongside the docks for cranes to load/unload a vessel; a container storage area where CHE moves and organizes cargo; gates for trucks that are delivering or picking up containers; and an intermodal rail yard. The operation of a container terminal is dependant upon the amount of land the terminal has to operate on. There are three basic types of operations that can be found in Port container terminals: wheeled, grounded, and a combination of the two which represents how the containers are physically stored and kept on a terminal. The type of operation at any specific terminal is generally dictated by the amount of land available and the number of containers that the terminal processes per year. Most terminals employ a mix of wheeled and grounded operations as land permits. Wheeled operations are generally the most efficient operations as all the containers are kept on chassis and can be moved anywhere on or off the terminal by the use of a yard tractor or HDV. However, wheeled operations have low container per acre densities and thus require significantly more land than grounded operations, which have high container densities. Wheeled operations require high use of yard tractors. Grounded operations are where containers are stored onsite in “stacks”. Stacks can be several containers wide by two to four containers high, thus requiring the use of RTG, top handlers and side handlers to move the containers to/from and within the stacks. RTG cranes are cranes that can move about the stacks and straddle the containers to lift them up and move them around. Top and side handlers are equipment used to pick up the full and empty containers.
26 Container capacity is measured in twenty-foot equivalent units (TEU)
Port of Long Beach 122 September 2007
2005 Air Emissions Inventory
Some containers are used to transport perishable goods such as fruits and meats, and therefore are equipped with a refrigeration unit that has a small diesel generator that can provide power to the cooling system when external power is not available. These refrigerated container units (reefers) were investigated during the course of data collection for this inventory to determine their potential air quality impact from ship to yard to distribution. Through the interviews, it was found that there are no emissions associated with the diesel units on the containers. While on board ships, reefers are powered by the ship’s auxiliary generators, and once ashore, reefers that are stored for any length of time in the terminal are plugged into the utility grid at special slots designated for reefers. A reefer that is removed from an external power source, such as when it is loaded onto a trailer for truck transport, will hold its temperature for approximately eight hours before the diesel generator would need to be operated to power the refrigeration unit. Therefore, it is reasonable to conclude that the containers’ diesel generators are not turned on within the Port boundary or when traveling within the study area because truck travel time within the study area is far less than eight hours.
Yar
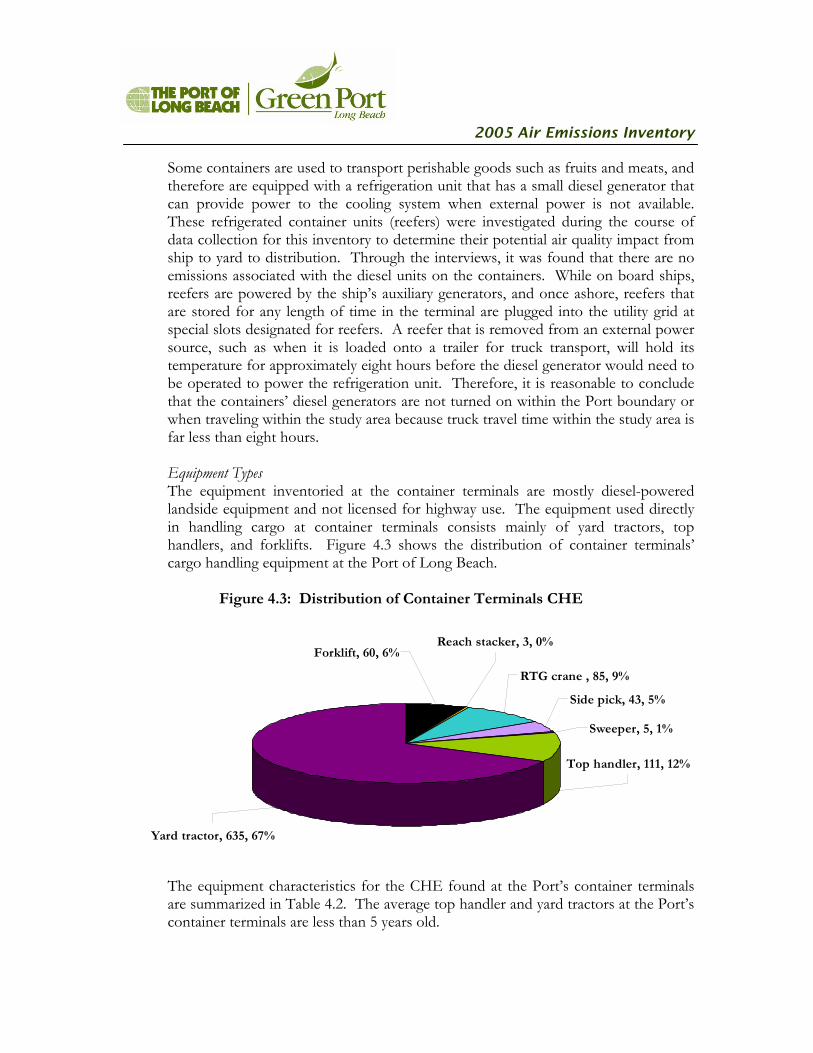
Equipment Types The equipment inventoried at the container terminals are mostly diesel-powered landside equipment and not licensed for highway use. The equipment used directly in handling cargo at container terminals consists mainly of yard tractors, top handlers, and forklifts. Figure 4.3 shows the distribution of container terminals’ cargo handling equipment at the Port of Long Beach.
Figure 4.3: Distribution of Container Terminals CHE
tractor, 635, 67%
Forklift, 60, 6%
Sweeper, 5, 1%
Reach stacker, 3, 0%
RTG crane , 85, 9%
Side pick, 43, 5%
Top handler, 111, 12%
d
The equipment characteristics for the CHE found at the Port’s container terminals are summarized in Table 4.2. The average top handler and yard tractors at the Port’s container terminals are less than 5 years old.

Port of Long Beach 123 September 2007
2005 Air Emissions Inventory
Table 4.2: Equipment Characteristics of Container Terminal Equipment
Container Terminals Power (horsepower) Model Year Annual Operating HoursEquipment Count Range Average Range Average Range Average
Forklift 60 45 - 280 124 1973 - 2005 1992 4 - 3,376 673Reach stacker 3 330 - 330 330 1994 - 1998 1995 700 - 1,000 900RTG crane 85 219 - 946 619 1973 - 2005 1995 0 - 3,300 1,964Side pick 43 115 - 240 166 1982 - 2005 1999 0 - 2,500 1,148Sweeper 5 100 - 180 139 1994 - 2001 1997 365 - 1,049 586Top handler 111 250 - 330 273 1992 - 2005 2001 10 - 4,114 1,999Yard tractor 635 173 - 245 184 1993 - 2005 2001 0 - 5,286 2,203Total 942
Yard tractors The equipment inventory shows that diesel-powered yard tractors, also known as terminal tractors and yard hustlers, accounted for 67% of the CHE used at the container terminals. The typical off-road yard tractor is a close relative of the on-road truck tractor; however, it is typically equipped with an off-road engine and cannot legally be driven on public roads. It is designed for the movement of containers throughout the terminal in both stacked and wheeled operations. A common use of yard tractors is to move containers to and from the ship, move containers within the terminal, and move containers to and from RTGs for placement on or removal from stacks. Yard tractors operate throughout the terminal and spend most of their time loading and unloading containers from ships. They work primarily between the ship and the container stacks (for grounded operations) or to chassis locations (for wheeled operations). Most of the yard tractors identified in the inventory were manufactured by Ottawa, followed by Capacity. At the container terminals, model years for yard tractors ranged from 1973 to 2005, with an average model year of 2001. Engine power ranged from 173 hp to 245 hp, with an average of 184 hp. Annual operating time ranged from zero hours (hrs) to 5,286 hrs, with an average of 2,203 hrs. Figure 4.4 shows a typical Ottawa yard tractor27.
27 http://www.ottawatruck.com.

Port of Long Beach 124 September 2007
2005 Air Emissions Inventory
Figure 4.4: Yard Tractor
RTG Cranes RTG cranes made up nine percent of the equipment inventoried for container terminals. The diesel-powered RTG crane moves containers to and from the container stacks in a grounded operation. The RTG straddles the stacks of containers and has room for a heavy-duty truck/yard tractor to pull under and move containers between the stacks and vehicles. It is also used to consolidate the stacks weekly as containers are added and removed from the terminal. Model years ranged from 1973 to 2005, with an average model year of 1995. Engine power ranged from 219 hp to 946 hp, with an average 619 hp. The annual operating hours ranged from zero to 3,300 hrs, with an average of 1,964 hrs. Some operators may have made decisions to use operational modes not requiring the use of their RTGs, thus resulting in zero operating hours for some of them. Approximately 24% of the RTGs at the Port have Cummins KTA 19 engines. The majority of the RTGs at the Port are manufactured by Paceco, the rest are manufactured by ZPMC. Figure 4.5 shows a Paceco RTG28.
28 http://www.pacecocorp.com.

Port of Long Beach 125 September 2007
2005 Air Emissions Inventory
Figure 4.5: Rubber Tired Gantry Crane
Top Handlers Approximately twelve percent of the equipment inventoried at container terminals was diesel-powered top handlers, also known as top loaders and reach stackers by the terminal operators. Top loaders move, stack and load containers using an overhead telescopic boom. They can be used in place of or in conjunction with RTGs to lift heavy containers within a terminal. Model years ranged from 1992 to 2005, with an average model year of 2001. Engine power ranged from 250 hp to 330 hp, with an average of 273 hp. Annual operating time ranged from 10 hrs to 4,114 hrs, with an average of 2,000 hrs. Ninety percent of the engines in use were identified as Cummins M 11, M 11-C, and QSM 11C, followed by the Volvo TD 2030 ME and TW 1031 VE. Figure 4.6 shows a Taylor top loader29.
29 http://www.taylorbigred.com.

Port of Long Beach 126 September 2007
2005 Air Emissions Inventory
Figure 4.6: Top Handler
Forklifts The container terminals had 60 forklifts, accounting for 6% of the equipment inventoried at container terminals. One third of the forklifts use LPG fuel, the remaining forklifts are diesel-powered. The forklifts at the container facilities may be used for cargo and non-cargo handling activities. The forklifts used at the container terminals had model years ranging from 1973 to 2005, with an average model year of 1992. Forklifts have a wide range of engine makes and models, such as Cummins, Perkins and Mitsubishi. Engine power ranged from 45 hp to 280 hp, with an average of 124 hp. Annual operating hours ranged from 4 hrs to 3,376 hrs, with an average of 673 hrs. Figure 4.7 presents a Mitsubishi forklift30.
Figure 4.7: Forklift
30 http://www.mit-lift.com.

Port of Long Beach 127 September 2007
2005 Air Emissions Inventory
Side loaders Side picks, side handlers and side loaders are the various names of the cargo handling equipment that, in general, move and stack the empty containers within a terminal. Therefore, they have less power as compared to top handlers. Just five percent, or 43, of the equipment inventoried were diesel-powered side handlers. Model years ranged from 1982 to 2005, with an average model year of 1999. Cummins 5.9 is the most prevalent engine for the Port side handlers. Engine power ranged from 115 hp to 240 hp, with an average of 166 hp. Annual operating time ranged from zero hrs to 2,500 hrs, with an average of 1,148 hrs. Figure 4.8 presents a Taylor side loader31.
Figure 4.8: Side Loader
4.4.2 Break Bulk Terminals Break bulk cargo includes steel, lumber, large machinery and other large product cargo. Break bulk terminals receive cargo that is not shipped in containers, so the cargo has to be unloaded from a ship’s hold and then loaded onto trucks on the dock for distribution. Steel products, such as plates or rolls, are placed in a ship’s hold and must be removed individually. Large machinery may also be carried on special “RoRo” (roll-on/roll-off) vessels with large ramps suitable for driving equipment on and off the ship directly via a large ramp that is part of the ship. Lumber and lumber products are often carried by dedicated vessels and barges that are designed to carry their specific cargo. Some vessels that call on break bulk terminals may mix containerized cargo and break bulk cargo and are called “combination” ships, where the break bulk cargo is stored in the below deck holds and containers are stacked on the hatch covers that cover the cargo holds during sailings. In general, the ships that call at break bulk terminals are smaller than the specialized container ships that call at the container terminals.
31 http://www.cal-lift.com.

Port of Long Beach 128 September 2007
2005 Air Emissions Inventory
Due to their weight and characteristics, heavy lift machines are used for handling bulk cargo on the terminal and for loading rail or truck. Cargo is discharged either by the vessel's own ship-to-shore cranes, or by large boom cranes that operate on the dock and are highly mobile so that they can move into position based on the ship’s configuration. Most break bulk cargo leaves the terminals by truck. Seven break bulk and five dry bulk terminals at the port had diesel-powered CHE in 2005 and were included in this inventory:
California United Terminals - Breakbulk Cooper/T. Smith SSAT Bulk – Crescent Terminals Pacific Coast Recycling Fremont Forest Group Weyerhauser Norske Skog Conolly-Pacific
Equipment Types
Loader, 5, 3%
Yard trac
Figure 4.9 presents the distribution of the 200 pieces of equipment at the Port’s break-bulk terminals.
to Figure 4.9: Distribution of Break-Bulk Terminals CHE
r, 6, 3%
Truck, 14, 6% Other, 7, 4%Crane, 9, 5%
Forklift, 159, 79%
The equipment characteristics for the CHE found at the Port’s break bulk terminals are summarized in Table 4.3.
Port of Long Beach 129 September 2007
2005 Air Emissions Inventory
Table 4.3: Equipment Characteristics of Break Bulk Terminal Equipment
Break Bulk Terminals Power (horsepower) Model Year Annual Operating HoursEquipment Count Range Average Range Average Range Average
Bulldozer 3 165 - 305 252 1993 - 1998 1995 100 - 400 267Crane 9 150 - 439 351 1978 - 2005 1995 0 - 4,000 2,011Excavator 2 362 - 439 401 1997 - 2003 2000 3,000 - 3,500 3,250Forklift 159 56 - 272 146 1978 - 2005 1994 0 - 4,160 570Loader 5 200 - 750 466 1979 - 2002 1989 250 - 2,500 1,450Sweeper 2 130 - 135 133 1982 - 1983 1983 52 - 250 151Truck 14 140 - 140 140 1984 - 1984 1984 5 - 5 5Yard tractor 6 173 - 180 176 1996 - 2005 1998 5 - 2,340 394Total 200
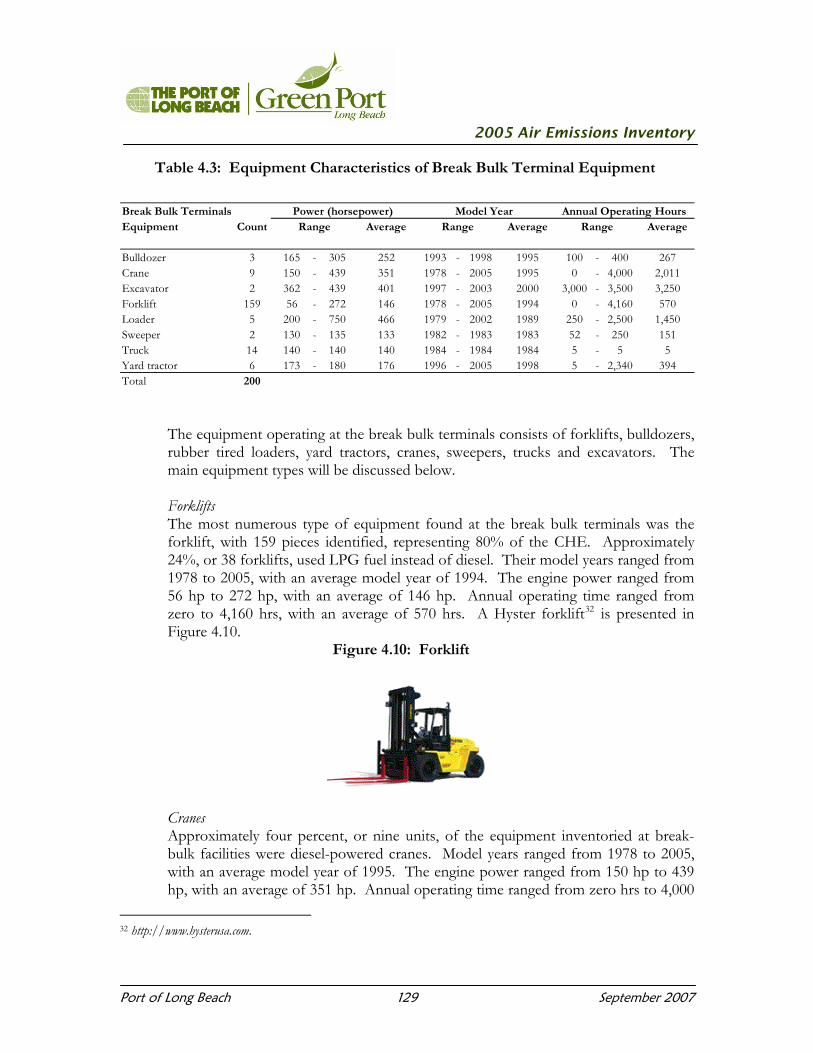
The equipment operating at the break bulk terminals consists of forklifts, bulldozers, rubber tired loaders, yard tractors, cranes, sweepers, trucks and excavators. The main equipment types will be discussed below. Forklifts The most numerous type of equipment found at the break bulk terminals was the forklift, with 159 pieces identified, representing 80% of the CHE. Approximately 24%, or 38 forklifts, used LPG fuel instead of diesel. Their model years ranged from 1978 to 2005, with an average model year of 1994. The engine power ranged from 56 hp to 272 hp, with an average of 146 hp. Annual operating time ranged from zero to 4,160 hrs, with an average of 570 hrs. A Hyster forklift32 is presented in Figure 4.10.
Figure 4.10: Forklift
Cranes Approximately four percent, or nine units, of the equipment inventoried at break-bulk facilities were diesel-powered cranes. Model years ranged from 1978 to 2005, with an average model year of 1995. The engine power ranged from 150 hp to 439 hp, with an average of 351 hp. Annual operating time ranged from zero hrs to 4,000
32 http://www.hysterusa.com.

Port of Long Beach 130 September 2007
2005 Air Emissions Inventory
hrs, with an average of 2,011 hrs. Below is an American 797C boom crawler crane33, a crane model inventoried at POLB.
Figure 4.11: Crane
Trucks Fourteen diesel-powered trucks were inventoried for the break bulk terminals with an average model year of 1984, average horsepower of 140 hp and, annual operating time at a low 5 hours per year.
4.4.3 Dry Bulk Terminals Dry bulk includes cargo that can be processed by bucket loaders, screw loaders, conveyors or suction and that are stored in piles or silos on the terminals. The most common dry bulk cargos at POLB include cement and salt for import, and scrap metal, sulfur and petroleum coke for export. The following dry bulk facilities are included in the 2005 inventory:
Koch Carbon G -P Gypsum Metropolitan Stevedore Morton Salt Cemex Mitsubishi Cement National Gypsum Sulex Horizon Lines
33 http://www.accranes.com/amer797c

Port of Long Beach 131 September 2007
2005 Air Emissions Inventory
Forklift, 48, 63%
Loader, 12, 16%
Sweeper, 7, 9%
Skid steer loader, 4, 5%
Other, 5, 7%
Equipment Types Figure 4.12 presents the distribution of the 76 pieces of equipment at the Port’s dry bulk terminals.
Figure 4.12: Distribution of Dry Bulk Terminals CHE
The equipment characteristics for the CHE found at the Port’s dry bulk terminals are summarized in Table 4.4.
Table 4.4: Equipment Characteristics of Dry Bulk Terminal Equipment
Dry Bulk Terminals Power (horsepower) Model Year Annual Operating HoursEquipment Count Range Average Range Average Range Average
Bulldozer 3 200 - 200 200 1999 - 2005 2003 100 - 2,500 1,200Forklift 48 46 - 200 82 1962 - 2005 1996 100 - 2,100 1,242Loader 12 166 - 375 308 1982 - 2002 1992 216 - 2,000 1,089Skid steer loader 4 30 - 85 48 1990 - 1996 1994 100 - 1,040 595Sweeper 7 30 - 175 65 1990 - 2005 1999 100 - 1,000 481Top handler 2 260 - 260 260 2000 - 2000 2000 2,000 - 2,000 2,000Total 76
Rubber tired loaders Approximately sixteen percent, or twelve units, of the equipment inventoried at dry bulk terminals were diesel-powered rubber tired loaders. Rubber tired loaders are loaders with large rubber tires that make it useful for work in construction sites and rough terrain. Model years ranged from 1982 to 2002, with an average model year of 1992. Engine power ranged from 166 hp to 375 hp, with an average of 308 hp. Annual operating time ranged from 216 hrs to 2,000 hrs, with an average of 1,089 hrs. A Caterpillar rubber tired loader is presented in Figure 4.13.34
34 http://www.caterpillar.com.

Port of Long Beach 132 September 2007
2005 Air Emissions Inventory
Figure 4.13: Rubber Tired Loader
Skid steer loaders Four diesel-powered skid steer loaders were also inventoried for the dry bulk terminals. Skid Steer loaders are small loaders used to move materials. Their small size and maneuverability allows them to operate in tight spaces. The skid steer loaders had model years between 1990 and 1996, with an average model year of 1994. The engine power ranged from 30 hp to 85 hp, with an average 48 hp. Annual operating time ranged from 100 hrs to 1,040 hrs, with an average of 481 hrs. Figure 4.14 shows a typical Komatsu skid steer loader35.
Figure 4.14: Skid Steer Loader
35 http://www.equipmentcentral.com.

Port of Long Beach 133 September 2007
2005 Air Emissions Inventory
Sweepers Seven sweepers were identified at dry bulk terminals. Their model years ranged from 1990 to 2005, with an average model year of 1999. The engine power ranged from 30 hp to 175 hp, with an average 65 hp. Annual operating time ranged from 100 hrs to 1,000 hrs, with an average of 481 hours. Figure 4.15 shows an Elgin sweeper with a 100 hp engine36.
Figure 4.15: Sweeper
4.4.4 Liquid Bulk Terminals Liquid bulk terminals predominantly import petroleum products. Some terminals export refined petroleum to other U.S. West Coast destinations and one small facility imports and exports vegetable oils. The following is a list of liquid terminals at the Port included in the inventory:
BP/ Arco Chemoil Baker Commodities Petro Diamond Equillon (Shell) Enterprise
Compared to other types of terminals, liquid bulk cargo operations use little fuel-powered terminal equipment. All liquid cargo is transported in pipelines to or from the refineries. The pump stations at the terminals operate on electricity that is
36 http://www.elginsweeper.com.

Port of Long Beach 134 September 2007
2005 Air Emissions Inventory
supplied by the utility grid. The emissions from the vessel unloading pumps are not part of the scope of this inventory.
Table 4.5: Equipment Characteristics of Liquid Terminal Equipment
Liquid Terminals Power (horsepower) Model Year Annual Operating HoursEquipment Count Range Average Range Average Range Average
Crane 1 100 100 100 1998 1998 1998 520 520 520Forklift 8 40 120 74 1961 1996 1988 4 624 240Loader 1 150 150 150 1995 1995 1995 780 780 780Truck 2 100 210 155 1989 2006 1998 520 520 520Total 12
Eight forklifts, one crane, one loader and two trucks are included in this equipment inventory at the liquid terminals. Five of the eight forklifts use propane fuel. They are used occasionally to lift heavy loads and piping as needed. The forklift model year ranges from 1961 to 1996, with an average model year of 1988. The engine power ranges from 40 hp to 120 hp, with an average of 74 hp. Annual operating time ranges from 4 hrs to 624 hrs, with an average of 240 hrs.
4.4.5 Auto Terminals The U.S. is a major importer for vehicles and California is a significant market. West Coast ports are a port of entry for many automobiles manufactured in Asia, and for the local market. POLB has one 143.7 acre auto terminal, which mostly serves the local California market. In 2005, the Port handled approximately 400,000 autos through the auto terminal. The autos were mostly imported passenger cars and sport utility vehicles. Loading and unloading of automobiles does not require the use of cargo handling equipment. Being self-propelled, the vehicles are discharged (or loaded) by driving them off (or onto) the vessel. The terminal workers drive the cars to dedicated parking areas on the terminal. The automobiles are parked on the ground. Shipment out of the terminal is by truck or rail.
Table 4.6: Equipment Characteristics of Auto Terminal Equipment
Auto Terminals Power (horsepower) Model Year Annual Operating HoursEquipment Count Range Average Range Average Range Average
Forklift 10 100 - 100 100 1995 - 1995 1995 600 - 600 600Pallet jack (electric) 2 NA - NA NA NA - NA NA 300 - 300 300Sweeper 1 150 - 150 150 1990 - 1990 1990 936 - 936 936Total 13
Port of Long Beach 135 September 2007
2005 Air Emissions Inventory
Seven of the ten forklifts inventoried at the auto terminal use propane fuel and three forklifts are electric. The forklifts are used to move auto parts within the terminal. There are also 2 electric pallet jacks and one diesel-powered sweeper. Although the electrical equipment is included in the equipment count, only the propane forklifts and sweeper are included in the emissions estimate.
4.5 Emission Reduction Technologies Since 2002, several initiatives have taken place at the Port to reduce emissions from cargo handling equipment. The 2005 inventory includes 701 pieces of equipment installed with DOC, 53 new yard tractors with on-road certified engines and new equipment with cleaner off-road engines. In addition, 186 pieces of equipment used emulsified fuel and 115 pieces of equipment used oxygenated (O2) diesel. Table 4.7 is a summary of the emission reduction technologies used on the equipment. It should be noted that some of these technologies may be used in combination with one another. For example, equipment using oxygenated diesel or emulsified fuel may also have on-road engines or DOCs installed.
Table 4.7: Summary of 2005 CHE Emission Reduction Technologies
Equipment Total CHE DOC On-road Emulsified O2 Diesel Propane
Count Installed Engine FuelYard tractor 641 514 53 151 81 0Top handler 113 92 0 10 10 0Side pick 43 42 0 4 8 0RTG 85 11 0 16 12 0Forklift 295 40 0 3 4 122Other 82 2 0 2 0 11Totals 1,259 701 53 186 115 133
Total Count
Of the total 1,259 pieces of equipment inventoried, 133 forklifts have propane engines and 2 other pieces of equipment have gasoline engines. 4.6 Emission Estimation Methodology CARB adopted their CHE Regulation in December of 2005. During the development of the rule, CARB’s staff estimated the emissions of the CHE using a methodology that was different than what was traditionally used in their OFFROAD model. The most significant change from the OFFROAD methodology was the calculation of deterioration rates for CHE equipment. At the time of this CHE emissions inventory development, CARB was not ready to make public the revised CHE emissions inventory calculation tool. In order to

Port of Long Beach 136 September 2007
2005 Air Emissions Inventory
be consistent with CARB’s latest methodology, CARB staff volunteered to estimate the emissions for the cargo handling equipment in operation at the Port The basic equation used to estimate CHE emissions in tons is as follows.
Equation 4.1 E = Pop x EF x HP x LF x Act x FCF
Where:
E = emissions in short tons Pop = population of equipment EF = emission factor, grams of pollutant per horsepower-hour (g/hp-hr) HP = rated horsepower for the equipment LF = load factor (ratio of average load used during normal operations as compared to full load at maximum rated horsepower) Act = equipment activity, hours of use per unit of time FCF = fuel correction factor to reflect changes in fuel properties that have occurred over time
The emission factor (EF) is a function of zero hour (ZH) emission rate for the equipment model year (g/hp-hr) in the absence of any malfunction or tampering of engine components that can change emissions, plus a deterioration rate. The deterioration rate reflects the fact that base emissions of engines change as the equipment is used due to wear of various engine parts or reduced efficiency of emission control devices. The emission factor is calculated as:
Equation 4.2 EF = ZH + (DR x Cumulative Hours)
Where:
ZH = emission rate when the engine is new and there is no component malfunctioning for a given horsepower category and model year DR = deterioration rate (rate of change of emissions as a function of equipment age) Cumulative hours = annual operating hours times age of the equipment

Port of Long Beach 137 September 2007
2005 Air Emissions Inventory
If the equipment has an emission control technology, then the emission factor is calculated as:
Equation 4.3 EF = (ZH x CF) + (DR x Cumulative Hours)
Where:
ZH = emission rate when the engine is new and there is no component malfunctioning for a given horsepower category and model year CF = control factor to reflect changes in emission due to installation of emission reduction technologies or use of alternative fuels not originally included in the emission factors DR = deterioration rate (rate of change of emissions as a function of equipment age) Cumulative hours = annual operating hours times age of the equipment
4.6.1 Emission Factors CARB used the same zero hour (ZH) emission rates as used in the OFFROAD model. The ZH emission rates are a function of fuel, model year and horsepower group as defined in the OFFROAD model. ZH emission rates vary by engine horsepower to reflect the fact that depending upon the size of the engines, different engine technologies are used and thus emission output is different. Basic emission rates vary by model year to reflect change in engine technology due to change in emissions standards. CARB’s ZH emission factors by horsepower and engine year were used for:
diesel engines certified to offroad diesel engine emission standards diesel engines certified to onroad diesel emission standards gasoline engines certified to offroad gasoline emission standards LPG offroad emission factors
Due to the absence of CHE specific emission data, CARB staff used on-road heavy-duty diesel specific deterioration rates used in EMFAC 7G (an older version of the on-road emissions inventory model). Since the release of EMFAC 7G, CARB staff has updated EMFAC including on-road heavy-duty diesel deterioration rates. As far as deterioration rate is concerned, the basic assumption used by CARB staff is that the emissions from diesel powered trucks remain stable in the absence of tampering and mal-maintenance (T&M). In other words, diesel engine emissions do not increase over time if the equipment is well maintained. Changes in emissions (normally increase) with equipment usage occur if the equipment is not maintained properly which causes various engine components affecting emissions to malfunction.
Port of Long Beach 138 September 2007
2005 Air Emissions Inventory
CARB staff estimate deterioration using the so called “Radian Model” which identifies various diesel engine components malfunctions, the frequency of malfunction and the related impact on emissions. Based on this information, staff calculates the change in on-road heavy-duty engine emissions over time. For CHE equipment, CARB staff estimated the emissions increase over the cumulative mileage of the on-road engines and assumed that the emissions for CHE will deteriorate in the similar manner over the equipment’s useful life. This useful life estimate was determined through CHE surveys conducted by CARB staff. The equation for the deterioration rate is:
Equation 4.4
DR = (DF x ZH) / cumulative hours at the end of useful life
Where: DR = deterioration rate (expressed as g/hp-hr2) DF = percent increase in emissions at the end of the useful life (expressed as %) ZH = emission rate when the engine is new and there is no component malfunctioning for a given horsepower category and model year Cumulative hours at the end of useful life = annual operating hours times useful life in years
The Port believes that the use of CARB’s deterioration rates result in an overestimate of CHE emissions. In discussions with terminal operators, the Port determined that the CHE are well maintained compared to on-road heavy-duty trucks. CARB staff needs to further refine their methodology to properly account for the CHE maintenance practices of terminal operators.
4.6.2 Load factor, Useful Life, and Deterioration Rates Load factor is defined as the ratio of average load experienced by the equipment during normal operation as compared to full load at maximum rated horse power. It accounts for the fact that in their normal operations, engines are not used at their maximum horsepower rating. CARB matched the Port CHE to a CARB equivalent equipment type from their cargo handling equipment model and used the corresponding load factors. The load factors used for yard tractors, top handlers and side picks in this 2005 inventory are different than those load factors used in the 2002 baseline emission inventory. In order to be consistent with the cargo handling regulation for CARB’s 2005 inventories, CARB used higher load factors in the Port’s 2005 emission inventory.
Port of Long Beach 139 September 2007
2005 Air Emissions Inventory
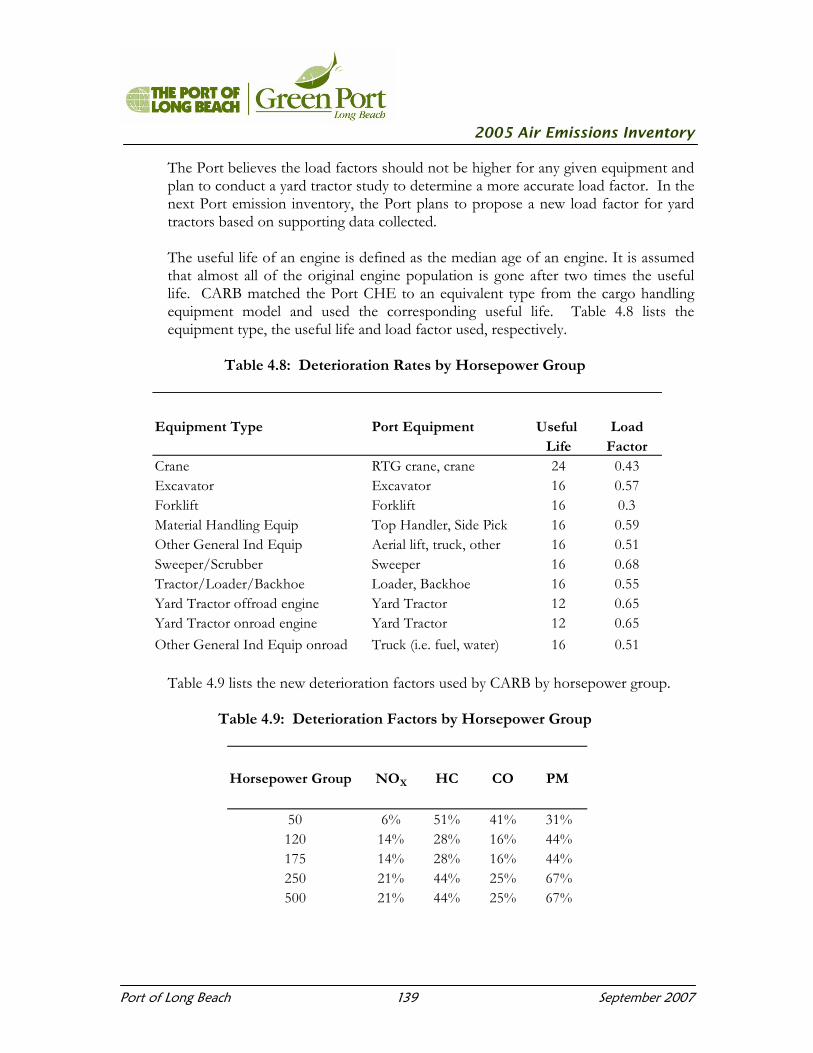
The Port believes the load factors should not be higher for any given equipment and plan to conduct a yard tractor study to determine a more accurate load factor. In the next Port emission inventory, the Port plans to propose a new load factor for yard tractors based on supporting data collected. The useful life of an engine is defined as the median age of an engine. It is assumed that almost all of the original engine population is gone after two times the useful life. CARB matched the Port CHE to an equivalent type from the cargo handling equipment model and used the corresponding useful life. Table 4.8 lists the equipment type, the useful life and load factor used, respectively.
Table 4.8: Deterioration Rates by Horsepower Group
Equipment Type Port Equipment Useful LoadLife Factor
Crane RTG crane, crane 24 0.43Excavator Excavator 16 0.57Forklift Forklift 16 0.3Material Handling Equip Top Handler, Side Pick 16 0.59Other General Ind Equip Aerial lift, truck, other 16 0.51Sweeper/Scrubber Sweeper 16 0.68Tractor/Loader/Backhoe Loader, Backhoe 16 0.55Yard Tractor offroad engine Yard Tractor 12 0.65Yard Tractor onroad engine Yard Tractor 12 0.65Other General Ind Equip onroad Truck (i.e. fuel, water) 16 0.51
Table 4.9 lists the new deterioration factors used by CARB by horsepower group.
Table 4.9: Deterioration Factors by Horsepower Group
Horsepower Group NOX HC CO PM
50 6% 51% 41% 31%120 14% 28% 16% 44%175 14% 28% 16% 44%250 21% 44% 25% 67%500 21% 44% 25% 67%
Port of Long Beach 140 September 2007
2005 Air Emissions Inventory
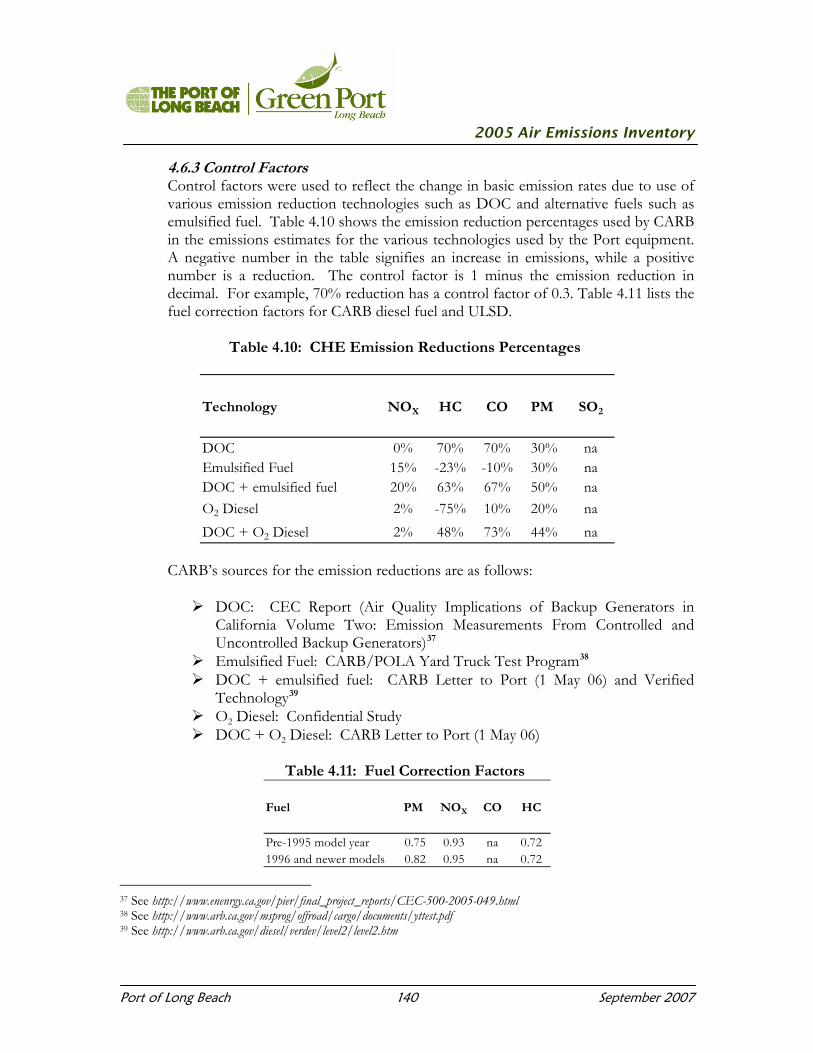
4.6.3 Control Factors Control factors were used to reflect the change in basic emission rates due to use of various emission reduction technologies such as DOC and alternative fuels such as emulsified fuel. Table 4.10 shows the emission reduction percentages used by CARB in the emissions estimates for the various technologies used by the Port equipment. A negative number in the table signifies an increase in emissions, while a positive number is a reduction. The control factor is 1 minus the emission reduction in decimal. For example, 70% reduction has a control factor of 0.3. Table 4.11 lists the fuel correction factors for CARB diesel fuel and ULSD.
Table 4.10: CHE Emission Reductions Percentages
Technology NOX HC CO PM SO2
DOC 0% 70% 70% 30% naEmulsified Fuel 15% -23% -10% 30% naDOC + emulsified fuel 20% 63% 67% 50% naO2 Diesel 2% -75% 10% 20% naDOC + O2 Diesel 2% 48% 73% 44% na
CARB’s sources for the emission reductions are as follows:
DOC: CEC Report (Air Quality Implications of Backup Generators in
California Volume Two: Emission Measurements From Controlled and Uncontrolled Backup Generators)37
Emulsified Fuel: CARB/POLA Yard Truck Test Program38 DOC + emulsified fuel: CARB Letter to Port (1 May 06) and Verified
Technology39 O2 Diesel: Confidential Study DOC + O2 Diesel: CARB Letter to Port (1 May 06)
Table 4.11: Fuel Correction Factors
Fuel PM NOX CO HC
Pre-1995 model year 0.75 0.93 na 0.721996 and newer models 0.82 0.95 na 0.72
37 See http://www.enenrgy.ca.gov/pier/final_project_reports/CEC-500-2005-049.html 38 See http://www.arb.ca.gov/msprog/offroad/cargo/documents/yttest.pdf 39 See http://www.arb.ca.gov/diesel/verdev/level2/level2.htm

Port of Long Beach 141 September 2007
2005 Air Emissions Inventory
0% 10% 20% 30% 40% 50% 60% 70% 80% 90% 100%
PM10
PM2.5
DPM
NOx
SOx
CO
TOG
Container Break Bulk Dry Bulk Cruise Liquid Auto
4.7 Emission Estimates Table 4.12 summarizes the CHE emission estimates in tons per year by terminal type for the pollutants for 2005. The auto terminal emissions include new vehicles at the auto terminal which are driven onto and out of the vessel (see subsection 4.7.5). The emissions are presented in further detail in the remainder of this section by terminal and by equipment type.
Table 4.12: 2005 CHE Emissions for the Port by Terminal Type, tpy
Terminal Type PM10 PM2.5 DPM NOx SOx CO TOG
Auto 0.1 0.1 0.0 2.7 0.0 7.4 0.8Break Bulk 2.9 2.7 2.9 73.9 0.6 26.6 5.5Container 50.8 46.8 50.8 1,603.9 16.2 345.6 81.6Cruise 0.2 0.1 0.1 8.1 0.0 19.4 3.0Dry Bulk 1.6 1.4 1.5 46.2 0.2 49.6 9.3Liquid 0.1 0.1 0.1 1.9 0.0 1.4 0.3Total 55.6 51.1 55.5 1,736.7 17.0 450.0 100.5
Figure 4.16 presents the percentage of cargo handling emissions by terminal type. Approximately 90% of PM, NOx and SOx emissions for the cargo handling equipment at the Port are attributed to the container terminals. Approximately 75% of the CO emissions and 80% of the TOG emissions for Port CHE are attributed to container terminals. Approximately 20 to 25% of the CO and TOG emissions, respectively, are attributed to dry bulk, break bulk and cruise terminals. Auto and liquid terminals have the least amount of emissions for cargo handling equipment at the Port.
Figure 4.16: Percentage of CHE Emissions for the Port by Terminal Type

Port of Long Beach 142 September 2007
2005 Air Emissions Inventory
Table 4.13 present the Port’s CHE emissions by equipment type in tons per year (does not include new automobiles emissions).
Table 4.13: 2005 CHE Port Emissions by Equipment Type, tpy
Equipment Type PM10 PM2.5 DPM NOx SOx CO TOG
RTG Crane, Crane 10.3 9.5 10.3 356.4 3.0 84.8 27.0Forklift 2.1 1.9 2.0 59.8 0.3 70.3 11.9Top Handler, Side Pick 5.8 5.3 5.8 252.8 2.5 27.7 7.0Aerial Lift, Truck, Other 0.2 0.2 0.2 4.6 0.0 1.3 0.4Sweeper 0.2 0.2 0.2 4.7 0.0 2.9 0.6Loader 2.6 2.4 2.5 58.8 0.3 30.3 6.9Yard Tractor 34.5 31.7 34.5 999.1 10.8 229.7 46.5Total 55.6 51.1 55.5 1,736.3 17.0 446.9 100.4
Figure 4.17 presents the percentage of the Port’s cargo handling emissions by equipment type. Approximately 45% to 60% of the Port’s CHE emissions are attributed to yard tractors; 20% to 25% of the Port’s CHE emissions are attributed to RTG cranes and other cranes; 5 to 15% of the Port’s CHE emissions are attributed to top handlers and side picks. Approximately 5% of the PM, NOx and SOx emissions; and 15% of the CO and TOG emissions for the cargo handling equipment at the Port are attributed to forklifts.
Figure 4.17: Percentage of CHE Emissions for the Port by Equipment Type
0% 10% 20% 30% 40% 50% 60% 70% 80% 90% 100%
PM10
PM2.5
DPM
NOx
SOx
CO
TOG
Yard Tractor Crane Top Handler, Side Pick
Loader Forklift Sweeper
Aerial Lift, Truck, Other

Port of Long Beach 143 September 2007
2005 Air Emissions Inventory
4.7.1 Container Terminals Table 4.14 presents the emissions in tons per year for each container terminal.
Table 4.14: 2005 CHE Emissions at Container Terminals, tpy
Terminal ID PM10 PM2.5 DPM NOx SOx CO TOG
LBC010 11.2 10.3 11.2 308.8 3.1 97.2 16.1LBC020 3.3 3.0 3.3 109.3 1.0 19.9 5.9LBC031 8.1 7.5 8.1 279.6 2.7 42.1 10.6LBC032 2.3 2.1 2.3 65.7 0.6 8.9 2.4LBC033 11.2 10.3 11.2 384.2 3.9 64.0 13.6LBC040 2.9 2.7 2.9 155.9 1.8 18.0 7.0LBC050 11.7 10.8 11.7 300.4 3.0 95.5 26.0Total 50.8 46.8 50.8 1,603.9 16.2 345.6 81.6
Table 4.15 presents the emissions in tons per year by equipment type.
Table 4.15: 2005 Container Terminal CHE Emissions by Equipment Type, tpy
Port Equipment PM10 PM2.5 DPM NOx SOx CO TOG
RTG Crane, Crane 9.9 9.0 9.7 342.4 2.8 78.5 25.8Forklift 0.7 0.7 0.7 15.5 0.1 7.9 1.8Top Handler, Side Pick 5.6 5.2 5.6 248.5 2.4 27.0 6.8Sweeper 0.1 0.1 0.1 2.1 0.0 0.7 0.2Yard Tractor 34.5 31.7 34.5 997.8 10.8 228.9 46.4Total 50.8 46.6 50.7 1,606.3 16.2 343.0 80.9
4.7.2 Break-Bulk Terminals Table 4.16 presents the emissions in tons per year for each break-bulk terminal.
Table 4.16: 2005 CHE Emissions at Break-Bulk Terminals, tpy
Terminal ID PM10 PM2.5 DPM NOx SOx CO TOG
LBB010 1.8 1.6 1.8 47.8 0.4 13.5 3.4LBB020 0.2 0.2 0.2 4.5 0.0 1.7 0.3LBB030 0.1 0.1 0.1 2.0 0.0 0.8 0.2LBB040 0.3 0.3 0.3 5.6 0.0 2.9 0.7LBB050 0.0 0.0 0.0 0.1 0.0 0.2 0.0LBB060 0.5 0.4 0.5 11.9 0.2 7.2 0.7LBB070 0.1 0.1 0.1 2.0 0.0 0.4 0.1Total 2.9 2.7 2.9 73.9 0.6 26.6 5.5

Port of Long Beach 144 September 2007
2005 Air Emissions Inventory
Table 4.17 presents the emissions in tons per year by equipment type.
Table 4.17: 2005 Break-Bulk Terminal CHE Emissions by Equipment Type, tpy
Port Equipment PM10 PM2.5 DPM NOx SOx CO TOG
RTG Crane, Crane 0.4 0.4 0.4 16.3 0.2 3.6 0.6Forklift 1.1 1.0 1.1 24.0 0.2 12.3 2.0Top Handler, Side Pick 0.0 0.0 0.0 0.1 0.0 0.0 0.0Aerial Lift, Truck, Other 0.0 0.0 0.0 1.1 0.0 0.3 0.1Sweeper 0.0 0.0 0.0 0.4 0.0 0.2 0.0Loader 1.3 1.2 1.3 30.8 0.2 9.4 2.7Yard Tractor 0.0 0.0 0.0 1.3 0.0 0.8 0.1Total 2.9 2.7 2.9 73.9 0.6 26.6 5.5
4.7.3 Dry Bulk Terminals Table 4.18 presents the emissions in tons per year for each dry-bulk terminal.
Table 4.18: 2005 CHE Emissions at Dry Bulk Terminals, tpy
Terminal ID PM10 PM2.5 DPM NOx SOx CO TOG
LBD010 0.0 0.0 0.0 0.3 0.0 0.0 0.0LBD020 0.0 0.0 0.0 0.9 0.0 0.6 0.1LBD040 1.1 1.0 1.1 19.3 0.1 7.8 2.3LBD050 0.0 0.0 0.0 0.9 0.0 0.3 0.1LBD060 0.0 0.0 0.0 2.5 0.0 1.5 0.3LBD070 0.0 0.0 0.0 0.1 0.0 0.0 0.0LBD080 0.1 0.1 0.1 5.4 0.0 4.0 0.7LBD100 0.0 0.0 0.0 3.6 0.0 5.9 1.0LBD110 0.2 0.2 0.2 13.1 0.0 29.4 4.9Total 1.6 1.4 1.5 46.2 0.2 49.6 9.3
Table 4.19 presents the emissions in tons per year by equipment type.
Table 4.19: 2005 Dry Bulk Terminal CHE Emissions by Equipment Type, tpy
Port Equipment PM10 PM2.5 DPM NOx SOx CO TOG
Forklift 0.2 0.1 0.1 14.3 0.0 37.9 6.1Top Handler, Side Pick 0.1 0.1 0.1 4.3 0.0 0.7 0.3Sweeper 0.0 0.0 0.0 1.3 0.0 1.6 0.3Loader 1.3 1.2 1.3 26.2 0.2 9.3 2.7Total 1.6 1.4 1.5 46.2 0.2 49.6 9.3

Port of Long Beach 145 September 2007
2005 Air Emissions Inventory
4.7.4 Liquid Bulk Terminals Table 4.20 presents the emissions in tons per year for the liquid-bulk terminals.
Table 4.20: 2005 CHE Emissions at Liquid Bulk Terminals, tpy
Terminal ID PM10 PM2.5 DPM NOx SOx CO TOG
LBL010 0.0 0.0 0.0 0.0 0.0 0.0 0.0LBL020 0.0 0.0 0.0 0.3 0.0 0.7 0.1LBL030 0.1 0.0 0.1 0.9 0.0 0.4 0.1LBL040 0.0 0.0 0.0 0.7 0.0 0.3 0.1LBL050 0.0 0.0 0.0 0.0 0.0 0.0 0.0Total 0.1 0.1 0.1 1.9 0.0 1.4 0.3
Table 4.21 presents the emissions in tons per year by equipment type.
Table 4.21: 2005 Liquid Bulk Terminal CHE Emissions by Equipment Type, tpy
Port Equipment PM10 PM2.5 DPM NOx SOx CO TOG
RTG Crane, Crane 0.02 0.01 0.02 0.17 0.00 0.09 0.03Forklift 0.01 0.01 0.01 0.54 0.00 0.92 0.15Aerial Lift, Truck, Other 0.03 0.03 0.03 0.6 0.01 0.2 0.1Loader 0.03 0.02 0.03 0.6 0.004 0.2 0.1Total 0.1 0.1 0.1 1.9 0.0 1.4 0.3
4.7.5 Auto Terminals Emissions for the cargo handling equipment found at auto terminals and emissions from the new automobiles that are driven out of (or onto) the vessels are included in Table 4.22.
Table 4.22: 2005 CHE Emissions at Auto Terminals, tpy
Auto Termina PM10 PM2.5 DPM NOx SOx CO TOG
CHE 0.1 0.0 0.0 2.4 0.0 4.3 0.6New Vehicles 0.0 0.0 0.0 0.3 0.0 3.2 0.2Total 0.1 0.1 0.0 2.7 0.0 7.4 0.8

Port of Long Beach 146 September 2007
2005 Air Emissions Inventory
The evaporative and exhaust emissions for the new vehicles at the auto terminal are based on a total of 370,000 vehicles, out of which 240,500 were gasoline light duty automobiles and 129,500 gasoline light duty trucks. The new vehicles travel an average of 1 mile at 15 miles per hour (mph) from the ship to the parking area for loading unto trucks or rail. The 2005 EMFAC model was used to estimate the emissions. The emissions for the equipment at the auto terminal are listed in Table 4.23.
Table 4.23: 2005 Auto Terminal CHE Emissions by Equipment Type, tpy
Port Equipment PM10 PM2.5 DPM NOx SOx CO TOG
Forklift 0.0 0.0 0.0 1.5 0.0 3.9 0.5Sweeper 0.0 0.0 0.0 0.9 0.0 0.3 0.1Total 0.1 0.0 0.0 2.4 0.0 4.3 0.6
4.7.6 Passenger Terminal Table 4.24 presents the emissions in tons per year for the passenger terminal.
Table 4.24: 2005 CHE Emissions at Cruise Terminals, tpy
Terminal ID PM10 PM2.5 DPM NOx SOx CO TOG
LBB100 0.2 0.1 0.1 8.1 0.0 19.4 3.0
Table 4.25 presents the emissions in tons per year by equipment type.
Table 4.25: 2005 Cruise Terminal CHE Emissions by Equipment Type, tpy
Port Equipment PM10 PM2.5 DPM NOx SOx CO TOG
Forklift 0.1 0.1 0.1 4.0 0.0 7.3 1.3Loader 0.0 0.0 0.0 4.1 0.0 12.1 1.7Total 0.2 0.1 0.1 8.1 0.0 19.4 3.0
Port of Long Beach 147 September 2007
2005 Air Emissions Inventory
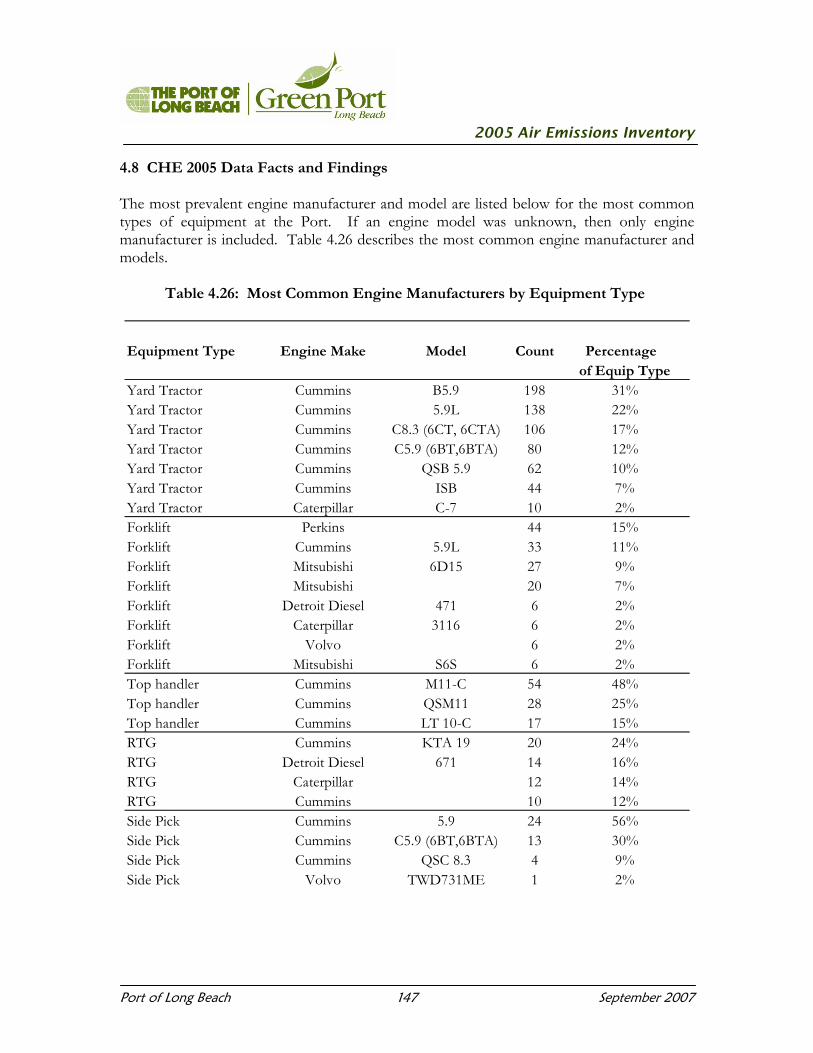
4.8 CHE 2005 Data Facts and Findings The most prevalent engine manufacturer and model are listed below for the most common types of equipment at the Port. If an engine model was unknown, then only engine manufacturer is included. Table 4.26 describes the most common engine manufacturer and models.
Table 4.26: Most Common Engine Manufacturers by Equipment Type
Equipment Type Engine Make Model Count Percentage of Equip Type
Yard Tractor Cummins B5.9 198 31%Yard Tractor Cummins 5.9L 138 22%Yard Tractor Cummins C8.3 (6CT, 6CTA) 106 17%Yard Tractor Cummins C5.9 (6BT,6BTA) 80 12%Yard Tractor Cummins QSB 5.9 62 10%Yard Tractor Cummins ISB 44 7%Yard Tractor Caterpillar C-7 10 2%Forklift Perkins 44 15%Forklift Cummins 5.9L 33 11%Forklift Mitsubishi 6D15 27 9%Forklift Mitsubishi 20 7%Forklift Detroit Diesel 471 6 2%Forklift Caterpillar 3116 6 2%Forklift Volvo 6 2%Forklift Mitsubishi S6S 6 2%Top handler Cummins M11-C 54 48%Top handler Cummins QSM11 28 25%Top handler Cummins LT 10-C 17 15%RTG Cummins KTA 19 20 24%RTG Detroit Diesel 671 14 16%RTG Caterpillar 12 14%RTG Cummins 10 12%Side Pick Cummins 5.9 24 56%Side Pick Cummins C5.9 (6BT,6BTA) 13 30%Side Pick Cummins QSC 8.3 4 9%Side Pick Volvo TWD731ME 1 2%

Port of Long Beach 148 September 2007
2005 Air Emissions Inventory
It should be noted that the average engine model year reflects newer pieces of equipment at the terminals. In 2005, 58% of the equipment at the Port has model year 2000 and above. This is especially true at the container facilities where 66% percent of the equipment is newer than the year 2000. One interesting fact found during interviews with terminal operators is that newer, cleaner, fuel efficient engines are used more than the older equipment (e.g., lower activity hours for the older equipment), thus producing fewer emissions. Table 4.27 has a sum of the pre-1999 model year equipment and the 2000+ model year equipment in 2005.
Table 4.27: 2005 Equipment Year by Terminal Type
Terminal Pre-1999 2000+ Pre-1999 2000+% %
Auto 8 5 62% 38%Break Bulk 129 71 65% 36%Container 323 619 34% 66%Cruise 16 0 100% 0%Dry Bulk 44 32 58% 42%Liquid 11 1 92% 8%Total 531 728 42% 58%
Model Year Model Year
Figure 4.18: Percentage of 2005 Equipment with Pre-1999 and 2000+ Model Year
62%
38%
65%36%
34%66%
100%0%
58%42%
92%8%
0% 20% 40% 60% 80% 100%
Auto
Break Bulk
Container
Cruise
Dry Bulk
Liquid
Pre-1999 2000+

Port of Long Beach 149 September 2007
2005 Air Emissions Inventory
In total, there was a 31% increase in equipment count from 2002 to 2005. The breakdown by equipment type is summarized in Table 4.28.
Table 4.28: CHE Equipment Count Comparison, 2005 vs. 2002
2005 2002 % IncreaseEquipment Count Count In 2005
Forklift 295 236 25%RTG crane 85 80 6%Side pick 43 41 5%Top handler 113 89 27%Yard tractor 641 566 13%Sweeper 15 9 67%Other 67 39 72%Total 1,259 1,060 31%
Figure 4.19: Percentage Increase of 2005 Equipment Count since 2002
25%
6%
5%
27%
13%
67%
72%
0% 10% 20% 30% 40% 50% 60% 70% 80%
Forklift
RTG crane
Side pick
Top handler
Yard tractor
Sweeper
Other

Port of Long Beach 150 September 2007
2005 Air Emissions Inventory
Although the equipment count has increased, the hours of use has decreased for most of the equipment at the Port. This may be due to several factors; such as increased terminal efficiency, less use of equipment if there is a large pool to choose from, and better record-keeping of equipment hours using data loggers. Table 4.29 summarizes the 2005 vs. 2002 activity comparison by equipment and Figure 4.20 illustrates the comparison.
Table 4.29: CHE Equipment Activity Comparison, 2005 vs. 2002
2005 2002 PercentEquipment Hours Hours Change
Avg Avg in 2005Forklift 710 1,055 -49%RTG crane 1,964 1,658 16%Side pick 1,148 1,752 -53%Top handler 1,999 2,830 -42%Yard tractor 2,186 2,319 -6%Sweeper 502 758 -51%
Figure 4.20: Comparison of 2005 CHE with 2002 CHE Activity, hours
0 500 1,000 1,500 2,000 2,500 3,000
Forklift
RTG crane
Side pick
Top handler
Yard tractor
Sweeper
2005 Hours 2002 Hours

Port of Long Beach 151 September 2007
2005 Air Emissions Inventory
The average model year for the main equipment at the Port in 2005 is compared to the 2002 average model year and summarized in Table 4.30.
Table 4.30: CHE Average Equipment Year Comparison, 2005 vs. 2002
2005 2002
Equipment Year YearAvg Avg
Forklift 1993 1988RTG crane 1995 1992Side pick 1999 1997Top handler 2001 1997Yard tractor 2001 1996Sweeper 1996 1994
Figure 4.21: Comparison of 2005 with 2002 Equipment Model Year
1980 1985 1990 1995 2000 2005
Forklift
RTG crane
Side pick
Top handler
Yard tractor
Sweeper
2005 2002
