section 4 india’s economy achieves high growth - meti.go.jp · section 4 india’s economy...
TRANSCRIPT
Section 4 India’s economy achieves high growth Since initiating its economic reform in 1991, India has continued its transition from a closed and
planned economic policy toward a path of liberalization. As a result India has achieved stable economic growth averaging 6.0% annually, gradually enlarging its presence in the world economy. With high growth accompanying a rapid expansion of consumption especially after 2003, India has, following China, attracted considerable attention in Japan. However, India's economic growth displays a different character than that of other East Asian countries such as China which have realized strong economic growth.
This section brings these developments and related issues into focus by comparing the characteristics of India's economic growth with those of other East Asian countries. It then turns to the strengthening relationship between India and East Asian countries other than Japan as India opens its economy to the world and examines efforts aimed at building a mutually beneficial relationship between Japan and India.
1. Characteristics of India’s unique economic growth and related issues The invasion of Kuwait by Iraq in 1990 plunged India into an international balance of payments
crisis which depleted its foreign exchange reserves down to approximately a two week supply due to the impact of the sharp rise in crude oil prices and declining remittances from overseas workers in the Middle East. This event prompted India to initiate economic reforms in 1991 aimed at shifting to a path of liberalization. Specifically, India gradually relaxed domestic industrial regulations and liberalized trade and foreign investment, and thereby achieved high economic growth. This process of growth displayed a character different from that of East Asian countries up to now in that India rapidly expanded its presence in such high technology fields as software and IT services. The following discussion clarifies issues relating to the characteristics of India’s economic growth and its efforts to achieve sustainable growth.
(13) The growing presence of India’s economy in the global economy
Since initiating its economic reforms in 1991, India has generally achieved high economic growth. The country’s nominal GDP in 2005 reached US$785.4 billion, which is 1/17 that of the United States and 1/6 that of Japan. Based on purchasing-power-parity,79 however, India ranks fourth next to the U.S., China, and Japan (Figure 1-4-1).
79 Purchasing-power-parity refers to the exchange rate revaluated based on the “law of one price” that equalize the price of an identical good or service, which allows the comparison based on each currency’s purchasing power. In order to compare nominal GDP, it is converted to US dollars using the nominal exchange rate. However, since the purchasing power of one US dollar varies depending on the country or region, the GDP of countries or regions with strong currencies is over valued. Therefore, GDP based on purchasing-power-parity has been used as much as possible in order to make comparisons based on purchasing power.
132

Figure 1-4-1 Changes in GDP of respective countries (purchasing power base)
0.0
2.0
4.0
6.0
8.0
10.0
12.0
14.0
1975 1978 1981 1984 1987 1990 1993 1996 1999 2002 2005(Year)
(Trillion US$)
US
China
JapanIndia
Germany
UK
Notes: GDP of purchasing power (dollar based) is used.Source: WDI (World Bank).
US
German
IndiaJapan
China
UK
According to United Nations statistics, India’s population stood at 1.13 billion in 2005, accounting
for 17.4% of the world’s population and running second next to China’s 1.31 billion. United Nation’s Median Projection predict that India’s population will grow to 1.447 billion by 2025, exceeding China’s estimated population of 1.445 billion and accounting for 18.1% of world population. Moreover, compared with China’s population, which is rapidly aging under the country’s “one-child policy,” India’s population is aging at a more moderate pace (Figure 1-4-2). This means that the proportion of India’s working population aged 15-64 will expand over the long term, and an abundant workforce will continue to be available, which should enlarge India’s presence.
40
50
60
70
80
1950 1960 1970 1980 1990 2000 2010 2020 2030 2040 2050(Year)
0
5
10
15
20
(100 million people)
India's total population (right axis) India's working-age population (right axis) China India Japan
Japan
China
Notes: 1. Figures used are those for intermediate-level estimates. 2. Working-age population are people between 15 and 64.Source: World Population Prospect (UN).
(%)
India
Projected
Figure 1-4-2 Changes in proportion of working-age population in India, China and Japan
(2) India’s economy achieves growth driven by the service industry The relative contributions of various industries to India’s economic growth reveal that the service
133

industry, including commerce, transportation, finance, social services and services aimed at individuals, are leading the economy (Figure 1-4-3).
9.4
-4
-2
0
2
4
6
8
10
12
1981 1982 1983 1984 1985 1986 1987 1988 1989 1990 1991 1992 1993 1994 1995 1996 1997 1998 1999 2000 2001 2002 2003 2004 2005 2006
(%)
Agriculture Mining Manufacturing
Utilities Construction Commerce, hotels, transport & communications
Financial and insurance services, real estate, B-to-B Services for the community or individual Real GDP growth rate
Notes: 1. Prepared in accordance with India's accounting year (April to the following March). 2. Figures from FY1981 to FY1999 use FY1993 prices, and figures for FY2000 onwards use FY1999 prices.Source: Website of the Reserve Bank of India.
(FY)
Grow
th driven by the service industry
Figure 1-4-3 Changes in real GDP growth rate in India (degree of contribution by industry)
The development of the service industry is also reflected in India’s current balance of accounts. While the trade balance remains in deficit, surpluses continue to grow in the current balance of services. This means that the service industry contributes to India’s economy as a valuable method of acquiring foreign exchange, which compensates for the trade balance deficit (Figure 1-4-4).
Figure 1-4-4 Changes in current account balance of India
-3,000
-2,000
-1,000
0
1,000
2,000
3,000
1990 1992 1994 1996 1998 2000 2002 2004(Year)
(1 billion rupees)
Balance on income
current account transfer
Balance on service
Balance on goods
current account
Source: CEIC Database.
The deficit of balance on goods is continuing, but the deficitis dovered by current account transfers coming from balanceon services and remittance of migrant workers. From2001~03, current account reached a surplus but from2004~05 due to crude oil price runup, there is a deficit again.
A comparison of the industrial structure of India, which has achieved economic growth centered
on the service industry, with that of other Asian countries shows that the proportion accounted for by the mining and manufacturing sector in the economies of China and ASEAN is gradually increasing
134

while the proportion accounted for by agriculture, forestry and fisheries for the most part declines. In contrast, the proportion accounted for by the mining and manufacturing sector in India’s economy remains at the 20% level. The service industry, meanwhile, accounts for more than 50%, which makes India’s industrial structure unique among developing countries (Figure 1-4-5).
0
10
20
30
40
50
60
70
1970
1980
1990
2000
2004
1970
1980
1990
2000
2004
1970
1980
1990
2000
2004
1970
1980
1990
2000
2004
1970
1980
1990
2000
2004
1970
1980
1990
2000
2004
1970
1980
1990
2000
2004
1970
1980
1990
2000
2004
India China Indonesia Malaysia Philippines Thailand Vietnam Japan
(Year)
(%)
Primary industry Secondary industry Tertiary industry
Source: WDI (World Bank).
Although India's manufacturing industry does not reach 30% of the total, on the other hand theshare of the service industry in India exceeds 50%.
Figure 1-4-5 Industrial structure of India, China, ASEAN and Japan
(3) Economic growth led by domestic demand (India’s domestic demand-led economy stands in contrast to China and ASEAN, whose economies are driven by external demand and investment)
An analysis of India’s economic growth by demand category shows that since implementing economic reforms beginning in 1991, exports and total fixed capital formation relative to GDP increased, but in 2004, household consumption accounted for 61% of GDP, marking a shift to growth led by domestic demand (Figure 1-4-6).
This stands in contrast to China, whose exports and total fixed capital formation stood at 37.6% and 38.5% of GDP, indicating that it has achieved growth led by external demand and investment. India’s demand breakdown also stands in contrast to ASEAN, which, as total fixed capital formation stagnated at around 20% due to the impact of the currency and financial crisis, maintained exports at about 40% of GDP, achieving growth led by external demand.
135

0
20
40
60
80
100
120
140
1980
1990
2000
2004
1980
1990
2000
2004
1980
1990
2000
2004
1980
1990
2000
2004
1980
1990
2000
2004
1980
1990
2000
2004
1980
1990
2000
2004
1980
1990
2000
2004
India China Indonesia Malaysia Philippines Thailand Vietnam Japan
(Year)
(%)
Gross fixed capital formation
Household expenditure
Exports
Source: WDI (World Bank).
Figure 1-4-6 Changes in household expenditure, fixed capital formation and exports as a proportion of GDP in India, China, ASEAN and Japan
Although the proportion of GDP accounted for by exports in India does not reach 20%, by 2004 alreadyhousehold consumption accounted for more than 60% of GDP.
Furthermore, in comparison with China and ASEAN4, which aggressively accumulated foreign exchange in the process of achieving economic growth, India’s foreign exchange reserves are low relative to the size of its economy, although the country has increased its acceptance of direct investment as it opens its markets to foreign investment (Figure 1-4-7).
Figure 1-4-7 Changes in direct inward investment compared to nominal GDP of India,China, and ASEAN4
-4
-2
0
2
4
6
8
10
1990 1991 1992 1993 1994 1995 1996 1997 1998 1999 2000 2001 2002 2003 2004 2005
(Year)
(%)China
India
Indonesia
Malaysia
Philippines
Thailand
Source: World Investment Report 2006 (UNCTAD), WDI (World Bank).
(Market expansion with economic growth) With respect to the expansion of the segment of consumers who have supported economic growth
led by domestic demand, the proportion of middle-income earners and up whose yearly household incomes now exceed 90,000 rupees (approximately US$1,850) 80 thanks to economic growth expanded from 9.5% in FY1995 to 28% in FY2001, indicating that the middle class is growing
80 The US dollar-rupee exchange rate was recorded at US$1 = 48.7 rupees on March 29, 2002.
136

(Figure 1-4-8).
0%
10%
20%
30%
40%
50%
60%
70%
80%
90%
100%
1985 1989 1992 1995 1998 2001 (FY)
(%)
Low income class ( to 45,000 rupees) Low to intermediate income class (45,001 to 90,000 rupees)
Intermediate income class (90,001 to 135,000 rupees) Intermediate to higher income class (135,001 to 180,000 rupees)
High income class (180,001 rupees and over)
Source: India Market Demographics Report 2002, The Great Indian Middle Class (NCAER).
Persons with greaterthan an intermediateincome haveexpanded to 28% ofthe population.
9.5%
Figure 1-4-8 Changes in household structure in India by income
A distribution of per-capita monthly consumption expenditures in FY2004 by urban households broken down by industry sector was examined in order to determine which segment is driving the expansion in consumer spending that has accompanied income growth. It shows that the proportion accounted for by households employed in the service sector, especially IT-related industries, and in the manufacturing sector is relatively high, and that workers in these sectors are fueling consumption (Figure 1-4-9).
Figure 1-4-9 Monthly expenditure per household by business category in India
(urban areas<2004>)
0% 20% 40% 60% 80% 100%
Agricultural industry
Mining industry
Manufacturing industry
Electricity, gas, water Industry
Constructing industry
Tradebusiness
Transportation
Service industry
All industries
under 335 335 – 395 395 - 485 485 - 580 580 -675 675 -790 790 -930 930 -1100
1100 – 1380 1380 – 1880 1880 -2540 more than 2540
Source: NSS Report No.515: Employment and Unemployment Situation in India, 2004-05 (Ministry of Statistics andProgramme Implementation).
(unit: rupee)
expenditure is more than 930 rupee
In addition, a breakdown of consumer spending suggests that the consumer market for goods and services, particularly in urban districts, is expanding (Figure 1-4-10).
137

Figure 1-4-10 Changes in monthly spending per capita in India【urban area】
0
200
400
600
800
1,000
1,200
October 1972~September 1973
July 1977~June 1978
January 1983~December 1983
July 1987~June1988 July 1993~June 1994
July 1999~June 2000
July 2004~June 2005
(rupee) 【rural area】
0
200
400
600
800
1,000
1,200
October 1972~September 1973
July 1977~June 1978
January 1983~December 1983
July1987~June1988
July 1993~June 1994
July 1999~June 2000
July 2004~June 2005
(rupee)
Grain Chana Grain alternative Pulse Dairy products Cooking oilEgg, fish, meat Vegetables Fruits, nuts Sugar Salt, spice BeveragesBread, tobacco, alcohol Fuel Clothing Shoes Goods, services Durable items
Source: NSS Report No. 508: Level and Pattern of Consumer Expenditure, 2004-05 (Ministry of Statiscs &Programme Implementation).
Furthermore, the expansion of the consumer market is reflected in increased sales of automobiles
and motorbikes and the recent rapid expansion of cellular phone subscribers in India (Figure 1-4-11 and Figure 1-4-12). Specifically, domestic sales of automobiles in India increased from the 820,000 level in FY2001 to 1.85 million in FY2006, a two-fold increase. India also has one of the world’s leading cellular phone markets. In December 2006, the number of cellular phone subscribers hit the 100 million level, ranking India third after China and the United States.
Figure 1-4-11 Changes in number of automobiles and motorcycles sales in India
0
20
40
60
80
100
120
140
160
180
200
2001 2002 2003 2004 2005 2006
(million units)
0
100
200
300
400
500
600
700
800
900
(year)
(million units)
Commercial vehicle
Passenger vehicle
Motorcycles (right scale)
Source: Website of Society of Indian Automobile Manufacturers.
82
185
Figure 1-4-12 Changes in the number of cellular phone subscribers in India
3 510
22
37
59
105
0
20
40
60
80
100
120
December 2000 December 2001 December 2002 December 2003 December 2004 December 2005 December 2006
(million people)
Source: CEIC Database.
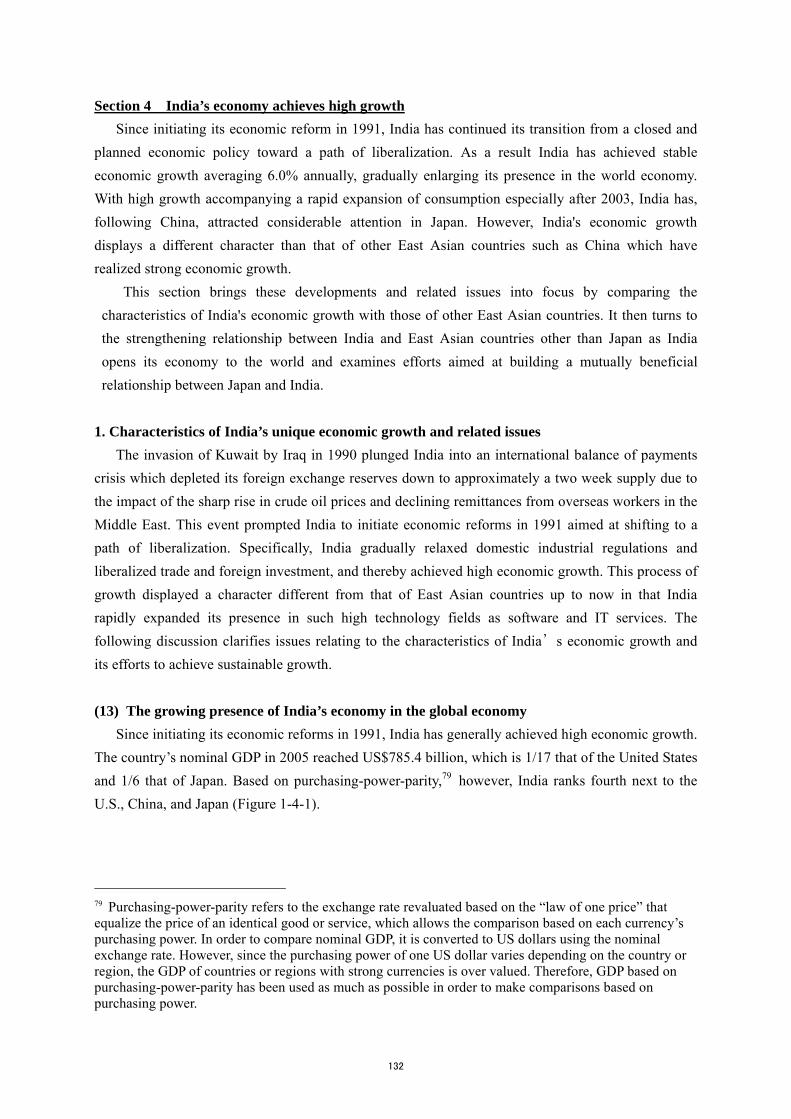
Meanwhile, the percentage of households owning consumer durables is steadily expanding.
However, the ratio of ownership remains low, with about 5% owning cars and 20% color television sets in FY2005, and thus the potential for market expansion is considerable (Figure 1-4-13).
138
0
5
10
15
20
25
30
35
40
45
50
1995-96 2001-02 2005-06 (projected) 2009-10 (projected)
(Year)
(Households)
Automobiles Motorbikes Color televisions Refrigerators White goods
Source: The Great Indian Market, (NCAER).
Figure 1-4-13 Changes in no. of households owning consumer durables in India (per 100 households)
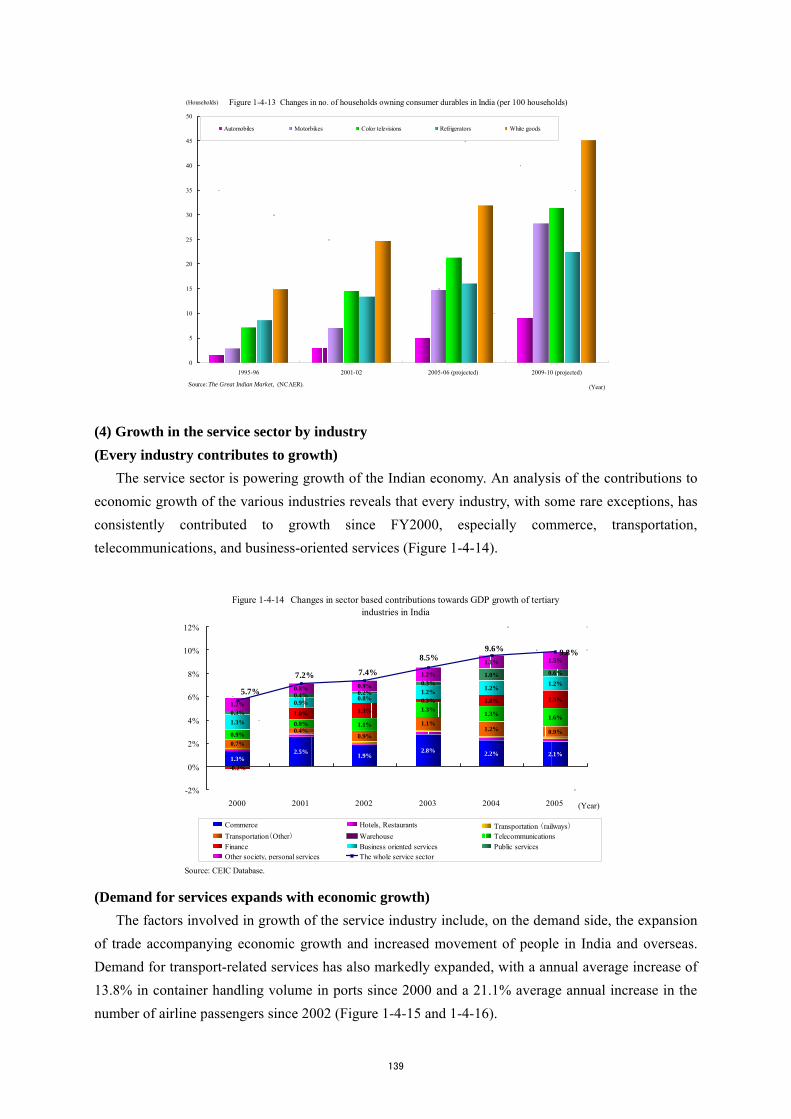
(4) Growth in the service sector by industry (Every industry contributes to growth)
The service sector is powering growth of the Indian economy. An analysis of the contributions to economic growth of the various industries reveals that every industry, with some rare exceptions, has consistently contributed to growth since FY2000, especially commerce, transportation, telecommunications, and business-oriented services (Figure 1-4-14).
Figure 1-4-14 Changes in sector based contributions towards GDP growth of tertiaryindustries in India
1.3%2.5% 1.9%
2.8% 2.2% 2.1%0.7%
0.4%0.9%
1.1%1.2% 0.9%0.9%
0.8% 1.1%
1.3%1.3% 1.6%
-0.2%
1.0% 1.3%0.3% 1.0% 1.5%
1.3%
0.9%0.8%
1.2% 1.2%1.2%
0.3%
0.4% 0.2%0.3%
1.0% 0.6%
1.2%
0.8% 0.9%
1.2%
1.1% 1.5%9.8%
5.7%
7.2% 7.4%
8.5%9.6%
-2%
0%
2%
4%
6%
8%
10%
12%
2000 2001 2002 2003 2004 2005 (Year)
Commerce Hotels, Restaurants Transportation (railways)Transportation(Other) Warehouse TelecommunicationsFinance Business oriented services Public servicesOther society, personal services The whole service sector
Source: CEIC Database.
(Demand for services expands with economic growth) The factors involved in growth of the service industry include, on the demand side, the expansion
of trade accompanying economic growth and increased movement of people in India and overseas. Demand for transport-related services has also markedly expanded, with a annual average increase of 13.8% in container handling volume in ports since 2000 and a 21.1% average annual increase in the number of airline passengers since 2002 (Figure 1-4-15 and 1-4-16).
139

Figure 1-4-15 Changes in India's port container transaction volume
0
500
1,000
1,500
2,000
2,500
3,000
3,500
4,000
4,500
5,000
2000 2001 2002 2003 2004 2005(Year)
(TEU)
0
2
4
6
8
10
12
14
16
18
20(%)container transaction
volumeyear-on-year rate (rightscale)
Note: TEU is the unit for expressing the carrying capactiy of the container vessel. (1 TEU=1 20 feet container).Source: CEIC Database.
Figure 1-4-16 Changes in the number of airline passengers in India
0
10
20
30
40
50
60
70
80
90
100
2002 2003 2004 2005 2006 (Year)
(100 million people)
0
5
10
15
20
25
30
35
40
45
50
(%)
Number of passengers international
Number of passengers domestic
Number of passengers year-on-year rate(right scale)
Source: CEIC Database.
The increased procurement from India principally by major Western countries has seen rapid growth in sales in business process and outsourcing services, such as call centers, and IT-related industries such as the outsourcing of software development. Although IT-related industries recorded 4.5% sales relative to GDP in FY2004, these industries have served as a precious source of foreign exchange, accounting for around one-fourth of exports of goods and services. The expansion of sales in IT-related industries is also contributing to the expansion of demand in the telecommunications field (Figure 1-4-17).
Figure 1-4-17 Changes of sales of IT industries as a proportion of GDP in India
0
150
300
450
600
750
900
1,050
1,200
1,350
1,500
1994 1995 1996 1997 1998 1999 2000 2001 2002 2003 2004(Year)
(in 1 billion rupees)
0.0%
0.5%
1.0%
1.5%
2.0%
2.5%
3.0%
3.5%
4.0%
4.5%
5.0%
Sales of IT industries
Export value of IT-related industries
Sales of IT industries as a proportion of GDP (right scale)
Source: CEIC Database.
In addition, the expansion of corporate demand for services has been accompanied by the
aforementioned increase in household demand for goods and services due to the increase in income, which is contributing to growth in commerce and services for individuals. In recent years, India’s retail industry, which accounts for the majority of small businesses, has seen the establishment of large-scale shopping malls in such major cities as Delhi and Mumbai, heralding the birth of new types of services and offering a picture of the development of the commerce field. (Improved efficiency in the service sector)
Next is a discussion of the contributions such as deregulation that improved supply efficiency
140

brought on by the growth in the service sector, along with the expansion of demand. Dividing growth in the service sector into the capital input, and the labor input and total factor
productivity (TFP) and looking at trends in each reveals that TFP has markedly improved and that progress in deregulation and the accompanying introduction of new types of services are most likely contributing to growth (Figure 1-4-18).
Figure 1-4-18 Analysis of factors affecting service industry growth in India
4.9%
1.1%
1.9% 1.3%
1.6%
3.2%
6.0%
2.5%
7.0%
3.0%
5.2%
1.6%
0.4%1.2%
2.8%
1.6%
3.7% 2.0%
1.2%
1.2%1.3%
8.5%
7.0% 6.5%
8.8% 8.5%9.2%
6.1%
0%
2%
4%
6%
8%
10%
12%
1983-1987 1987-1993 1993-1995 1995-1997 1997-1999 1999-2001 2001-2003Total factor productivity (TFP) Labor input Capital input GDP growth rate
Notes: Due to the limitation of statistics, the labor input of the service industry uses a surrogate variable found by the working age population(15-64) multiplied by the employed ratio.Source: GDP, labor input from Central Statistical Organisation, working age population from WDI (World Bank), Industry based ratio fromNational Sample Survey Report (Ministry of Statistics & Programme Implementation)
(Year)
For example, although the telecommunications field was formerly operated as a state-run corporation, a series of deregulation measures have since been implemented, with participation by private-sector companies allowed in the cellular phone market81 in 1994 and in the Internet market82 in 1998. As of the end of April 2006, 10 private-sector companies, including foreign-affiliated firms, and two state-owned firms were providing services in the cellular phone market. With newly participating companies actively expanding operations, cellular phone service charges have practically been reduced to a level of one cent per one-minute call, causing the monthly increase is user contracts to jump to 6.8 million in November 2006, the largest such increase in the world. As a result, the number of subscribers reached 149.5 million as of the end of 2006. The Indian government is aiming to increase the number of subscribers to 500 million by 2015.
Thanks to deregulation, the proportion of GDP accounted for by the public sector in the service industry has declined year by year, and the decline in the public sector’s proportion of GDP in FY2004 in comparison with FY1993 was more prominent than in primary and secondary industries (Figure 1-4-19). This is the result of the privatization of inefficient state-run companies and the participation of private-sector companies made possible by deregulation. These developments are probably leading to increased efficiency and improved productivity in the service industry.
81 Participation by private-sector companies (maximum of 49% foreign capital) was allowed under the National Telecom Policy 1994 (NTP). Regulations governing foreign participation in telecommunications businesses were subsequently relaxed, and in 2005, the maximum was changed from 49% to 74%. 82 The 1998 Internet Service Provider Policy allowed new participation in the Internet market and abolished monopolies by state-owned companies.
141

Figure 1-4-19 Changes in shares of public sectors by industry in India
60
80
100
120
140
160
180
200
1993 1994 1995 1996 1997 1998 1999 2000 2001 2002 2003 2004 (Year)
(year 1993=100)
Primary industry
SecondaryindustryTertiary industry
Source: Website of statistic bureau of India.
(5) Trends in India’s manufacturing sector (Causes of stagnant growth in the manufacturing sector)
As mentioned previously, India has realized high economic growth despite the low proportion of GDP accounted for by the manufacturing sector compared with other East Asian countries. Some have indicated that this is attributable to the substantial influence of India’s rigid industrialization policy led by the public sector based on import substituting industrialization under the mixed economic system83 which continued until 1991. While large private-sector companies were subject to a rigid and severe license administration under the industrial license system, small scale industries (SSI)84 were not and received preferential treatment including tax breaks, government procurement contracts, and financial advantages. Under the “reserve system,” moreover, only SSIs were designated to produce specified products, and participation by large-scale companies was eliminated. These rigid regulations that gave priority to SSIs distorted growth by large private-sector companies while at the same time undermined the incentives SSIs had to expand production and improve productivity by enabling over-protected SSIs to implement capital investment exceeding the upper limit on capital.
(Growth rate in the manufacturing sector rebounds)
Economic reforms since 1991, including the abolition of the industrial licensing system, liberalization of imports and exports, and relaxation of regulations on foreign participation relating to internal investment, have also enabled the manufacturing industry to increase investment, especially in industries producing consumer durables, and achieve high growth. However, in the latter half of the 1990s, the impact of disappointing domestic sales resulted in excess equipment, and subsequently the growth rate declined (Figure 1-4-20 and 1-4-21).
As mentioned previously, however, the steady expansion of the consumer market and further liberalization in recent years has enabled the manufacturing sector to resume investment since 83 “Mixed economic system” refers to India’s economic system at the time, which the government actively intervene to large extent into the market economy while fundamentally maintaining a market economy. 84 In India, companies that invest less than 10 million rupees in plant and equipment are classified as SSIs.
142

FY2002 and thus to increase production capacity, stimulating the growth rate to rise once again. This has resulted in the emergence of internationally competitive companies in the pharmaceuticals, biotechnology, steel and other industries.
In addition, the Indian government is implementing industry promotion policies aimed at strengthening the manufacturing sector. It has made reference to promoting the establishment of a special automobile parts industrial park and special economic zones (SEZ) in the Automotive Mission Plan 2006-2016 announced in January 2007. It also mentioned an amendment to the Labor Act aimed at realizing flexible employment schemes. Moreover, in March 2007, the government officially announced special preferential treatment measures such as the undertaking of 25% of the total cost of a semiconductor manufacturing project (20% if sited in SEZ) initially over a period of 10 years.
Figure 1-4-20 Changes in growth rate of agriculture, forestry, and fishingindustry, manufacturing industry, and servce industry of India
2.3
1.3
3.33.8 3.7
2.63.13.3
7.6
5.1
6.7
4.6
5.9
7.06.7
8.78.2
7.1
4.9
8.1
3.8
0
1
2
3
4
5
6
7
8
9
10
1971-1975 1976-1980 1981-1985 1986-1990 1991-1996 1996-2000 2001-2005
(Year)
(%)
agriculture, forestry andfisheries industrymanufacturing industry
service industry
Source: CEIC Database.
Figure 1-4-21 Changes in gross capital formation by industry in India
0
50
100
150
200
250
300
350
400
450
500
1999 2000 2001 2002 2003 2004 2005
(Year)
(in 10 billion rupees)
Gross capital formation of primary industry Gross capital formation of secondary industry Gross capital formation of tertiary industry
Source: CEIC Database.
(6) Issues for the sustainable growth This section has presented an overview of India’s high economic growth since implementing
economic reforms. However, there are various issues that must be resolved in order to sustain this high growth. The following is a discussion of three issues: (a) the business environment, (b) poverty and (c) fiscal deficits.
(a) Issues relating to the business environment
In order to achieve further growth in India’s manufacturing and service sectors, it is important to attract foreign-affiliated companies that bring new technologies and management techniques, but India, it is argued, faces various problems concerning its business environment. Inquiring into the specific problems that Japanese companies face, half mention the lack of infrastructure development, while others point to problems with legal systems and labor (Figure 1-4-22).
143

No. ChallengesNo. of
companies Share
1 Incomplete infrastructure 89 50.0%2 Opaque application of legislation 55 30.9%3 Lack of investment information 48 27.0%4 Unease about law and order, public situation 46 25.8%5 Severe competition with other companies 45 25.3%6 Labor issues 43 24.2%7 Opaque application of tax system 39 21.9%8 Underdeveloped supporting industries 33 18.5%9 Lack of legislation 27 15.2%
10 Complex tax system 26 14.6%…
18 Insufficient IP protection 16 9.0%Note: n=178 companies, multiple responses.
Source: FY2006 Survey on Foreign Direct Investment (18th survey) , (JBIC).
Table 1-4-22 Challenges for India's business environment
(Lack of infrastructure development)
Regarding electric power, problems include the high cost of power and the shortage of electric power supply itself. Looking at the gap between electric power supply and demand during peak hours, there has been a trend toward improvement in recent years. However, the rate of shortage in December 2005 reached 10.5% and supply has failed to keep pace with the increase in demand that has accompanied economic growth (Figure 1-4-23). In addition, one of the causes of unstable electric power supply is “transmission loss.” Due to the aging of transmission line networks and other reasons, transmission/distribution loss has reached 30%. An important issue, then, is improving supply capacity and restoring aging facilities (Figure 1-4-24).
Figure 1-4-23 Changes in the gap of supply and demand of electric power
at peak hours in India
11.3%
13.9%
12.4%13.0%
11.8% 12.2%11.2% 11.7%
10.5%
0
10,000
20,000
30,000
40,000
50,000
60,000
70,000
80,000
90,000
100,000
1997 1998 1999 2000 2001 2002 2003 2004 2005(Year)
(MW)
0%
2%
4%
6%
8%
10%
12%
14%
16%
18%
20%Greatest demand for power Electric power supplydeficiency rate
Note: 2005 contains the performance until December.Source: Annual Report 2005-2006 (India Ministry of Power).
Figure 1-4-24 Electricity distribution loss rate in India, China and ASEAN4
0%
5%
10%
15%
20%
25%
30%
1980 1983 1986 1989 1992 1995 1998 2001 (Year)
India
China
Indonesia
Malaysia
Philippines
Thailand
Source: WDI , (World Bank).
Road transport in India is the most widely used means of transportation, carrying about 65% of freight and 80% of passengers.85 With a total distance of 3,316,452 km, India boasts the second most extensive road system in the world. However, the number of lanes is generally small and maintenance
85 National Highway Authority of India Website.
144

is a major problem (Table 1-4-25). The Indian government is taking steps to increase the number of lanes under three projects aimed at linking the major cities: Golden Quadrilateral,86 the North-South Corridor, and the East-West Corridor87. However, the number of lanes remains inadequate to support growing distribution demand.
Type of lane Percentageone way lane 35%two-lanes 55%more than four-lane 10%
Table 1-4-25 Number of lanes in highways of India
(Problems associated with legal systems)
One issue associated with legal systems is the Non Objection Certificate (NOC) regulation. This regulation provides that when a foreign company which has previously merged, formed a technical tie-up, or concluded a trademark agreement with an Indian company establishes a new company in the same sector or when it concludes a new agreement, the consent of the counterparty is required. As a result of an amendment in January 2005, certain improvements were provided for, such as one that stipulates that in the case of a foreign company newly entering the Indian market, NOC does not apply unless a consent clause appears in the agreement. However, some argue that NOC offers no advantages to previously established companies and obstructs business activities by foreign-affiliated companies in India.
Another problem is the rigid legal system pertaining to labor. Specifically, under current Indian labor laws, if a company that employs 100 or more staff closes its business office, it is required to obtain a permit from the state government. This requirement causes concern when a company is considering entering the Indian market because of the difficulty that would be faced when withdrawing from the market, and works to hinder aggressive market entry. (b) Elimination of poverty
In order to expand domestic demand in a sustainable manner, poverty in India must be eliminated. Although India’s poverty rate has steadily declined with economic growth, the poverty rate remains extremely high, with approximately 260 million people, or 26.1% of the population, still in poverty as of FY1999 (Figure 1-4-26).
86 A 5,846km multi-lane expressway project linking the four major cities of Delhi, Kolkata, Chennai and Mumbai. 87 A 7,300 multi-lane expressway project consisting of the North-South Corridor (Srinagar, Kashmir State – Komorin Point, Tamil Nadu State) and the East-West Corridor (Porbandar, Gujarat State – Silchar, Assam State).
145

Figure 1-4-26 Changes in proportion of poverty population in India
2.440312.519572.6129
54.88%
44.48%
35.97%
26.10%
0
0.5
1
1.5
2
2.5
3
3.5
1973 1983 1993 19990
10
20
30
40
50
60
70
Rural areas population in poverty Urban areas population in poverty Rural areas poverty ratio (right axis) Urban areas poverty ratio (right axis) Total poverty ratio (right axis)
(100 million people) (%)
Notes: The definition of population in poverty in India is stipulated thus: the poverty line is described as the per capita monthly consumption volume of persons who reach acertain calorific intake (2,400kcal for urban areas, 2,100 kcal for rural areas). Changes in prices are also taken into account and in FY1973 the poverty line was drawn at 56.76rupees for urban areas and 49.63 rupees in rural areas. In FY1999 the same figures were 454.11 rupees for urban areas and 327.56 rupees for rural areas.Source: Reserve Bank of India website.
(Year)
Although improvements have beenwitnessed, as of 1999, there were still ahigh number of people living in poverty inIndia, amounting to 260 million persons.
In addition, many impoverished people live in farming communities, and the majority of
employed persons in farming villages work in agriculture. The labor productivity of India’s agriculture is low compared with other Asian countries. To eliminate poverty, then, reforms must be implemented in agricultural sectors where efficiency is low in order to raise productivity and improve income (Table 1-4-27).
Per-capitacultivated acreage(ha)
Cultivatd acreageper farmer (ha)
Rates of people infarming business(%)
Self-sufficiencyrates for grain (%)
Grain production(1,000 tons)
Labor productivity(tons/per capita)
Land productivity(tons/ha)
India 0.15 0.29 52.74 92.4 206,570 0.37 1.28China 0.11 0.17 65.46 101.0 399,998 0.47 2.80Japan 0.03 1.01 3.44 24.0 12,184 2.78 2.76South Korea 0.04 0.46 7.72 26.6 7,083 1.94 4.21Thailand 0.25 0.54 47.38 151.4 30,512 1.03 1.92Indonesia 0.10 0.22 42.78 84.2 61,144 0.67 2.98Malaysia 0.08 0.46 16.31 21.9 2,267 0.58 1.26The Philippines 0.07 0.19 38.14 78.7 17,590 0.59 3.09US 0.61 29.12 2.09 118.9 297,121 49.16 1.69
Table 1-4-27 Characteritics of Indian agriculture seen under international comparison (2002)
Note: Labor productivity and land productivity are calculated having the amount of grain production divided by the number of people in farming business or cultivated acreage.It is necessary to note that people in farming business include those engaging in production of non-grain items, such as forestry.
Source:Website of U.N. Food and Agriculture Organization based on White Paper on International Economy and Trade 2006 (METI), World Statistics (Ministry ofInternal Affairs and Communications).
In parallel with efforts to raise the productivity of the agricultural sector, the surplus labor
generated in this process must be absorbed by the service sector and manufacturing sector. However, the changes in number of workers by sector in India up to now indicates that the number of workers in each sector has largely remained constant, and it is considered that an appropriate movement of labor between sectors has not taken place (Figure 1-4-28).
In order to promote movement of labor between sectors, surplus labor must be absorbed through an expansion of the service and manufacturing sectors as mentioned above. At the same time, a flexible labor market must be built, which would be predicated on an overall improvement in educational levels. While one of India’s strengths is a highly educated workforce, the literacy rate of the population overall is low compared with other Asian countries (Figure 1-4-29). Given that Asian countries have promoted movement of labor between sectors as they have improved their educational
146

levels, raising the literacy rate through improvement in education is probably an important element in encouraging movement of labor between sectors in India.
Figure 1-4-28 Changes in ratio of labor force employed by industry in India
【Urban area】
0% 20% 40% 60% 80% 100%
1999
2000
2001
2002
2003
2004
2005
(Year)
Agriculture Mining ManufacturingElecricit y, gas, water ut ility Const ruct ing W holesale/ret ailHotel/Restaurant T ransportat ion/t elecom FinanceReal estate/Business service P ublic service Educat ionMedicine Other societal, personal service Homemaking service
【Rural area】
0% 20% 40% 60% 80% 100%
1999
2000
2001
2002
2003
2004
2005
(Year)
Agriculture Mining ManufacturingElecricity, gas, water ut ility Const ruct ing W holesale/ret ailHotel/Restaurant T ransportat ion/t elecom FinanceReal est at e/Business service P ublic service Educat ionMedicine Other societal, personal service Homemaking service
Source: NSS Report No.515: Employment and Unemployment in India,2004-05 (Minis try of Statis tics and Programme Implementation).
Figure 1-4-29 Changes in literacy rate of India, China, ASEAN4
49.3
61.0
78.3
90.9
79.5
90.4
80.7
88.791.7 92.6 92.6
0
10
20
30
40
50
60
70
80
90
100
1990 2004(Year)
(%)
India
China
Indonesia
Malaysia
The Philippines
Thailand
Note: The data for 1990 Thailand is missing.Source: WDI (World Bank).
Literacy rate imporvementwas seen in India, but it isstill at a low levelcompared to China andASEAN4 countries.
(c) Fiscal deficits
In the course of implementing various policies aimed at developing infrastructure and eliminating poverty, one important source of funding is government public finance, but in India fiscal deficits persist. Although the combined fiscal deficits of the national and state governments have tended downward in recent years, the ratio relative to nominal GDP remains high at 7%, and the balance of debt relative to nominal GDP is also high at 78% (Figure 1-4-30). In order to bear these fiscal deficits, domestic commercial banks are required to maintain a statutory liquidity ratio (SLR) whereby they must allocate 25% of their total deposits to the purchase of public bonds. These fiscal deficits probably lead to restraints on public investment for infrastructure development, and because SLR curbs funding to the private sector, the necessary private sector investment most likely cannot be implemented. As a result, some have pointed out that improvements aimed at further growth of India’s
147

economy are necessary. In response, the Indian government implemented the Fiscal Responsibilities and Budget Management Act in 2004, which aims to reduce the fiscal deficit of the central government to 3% of GDP by FY2007 and eliminate the current account deficit by FY2008.
79%
7%
0%
3%
6%
9%
12%
15%
1980 1983 1986 1989 1992 1995 1998 2001 20040%
20%
40%
60%
80%
100%
Balance of debt (right axis)
Fiscal deficit
(Fiscal Year)Notes: Indian fiscal year (April to following March).Source: Website of Reserve Bank of India.
Figure 1-4-30 Changes in the fiscal deficit and balance of debt for the unified Indian government (national and state governments) as a proportion of nominal GDP
2. East Asian countries deepen ties with India while India opens its markets to foreign participation
As mentioned previously, India is gradually opening its markets to foreign participation through measures such as the liberalization of trade and foreign investment. Amid these efforts, India is moving to strengthen relationships not only with major Western countries but also with East Asian countries such as Singapore, Thailand, South Korea, and China.
(1) Changes in India’s trading partners
It has been mentioned that the ratio of India’s imports and exports relative to nominal GDP is still low compared with other East Asian countries. India is moving to open its markets to foreign participation and is gradually expanding trade volume. While the volume of trade is highest with the United States and the EU15, in recent years the volume of imports from China, ASEAN and other East Asian countries has been expanding (Figure 1-4-31). India imports intermediate goods and finished goods from China and ASEAN, and the volume of both is growing (Figure 1-4-32 and 1-4-33). This probably indicates that India is also being incorporated into the widely expanding production and sales networks of East Asia.
148

Figure 1-4-31 Changes in India's trade value
-1,500
-1,000
-500
0
500
1,000
1,500
1999 2000 2001 2002 2003 2004 2005(Year)
($100 million)
Japan China NIEs ASEAN4 US
EU15 Middle East Other trade balanceSource: World Trade Atlas.
≪export≫
≪import≫
The trade valuein East Asiaexpands
Figure 1-4-32 Changes in China's export volume against India by process
0
20
40
60
80
100
120
1999 2000 2001 2002 2003 2004 2005(Year)
($100 million)
Final goods
IntermediategoodsRaw material
Source: RIETI-TID2006 (RIETI).
Figure 1-4-33 Changes in ASEAN's export volume against India by process
0
20
40
60
80
100
120
1999 2000 2001 2002 2003 2004 (Year)
($100 million)
Final goods
IntermediategoodsRaw materials
Note: ASEAN doesn't include Cambodia, Brunei, Myanmar, and Laos.Source: RIETI-TID2006 (RIETI).
(2) Foreign direct investment in India
The foreign direct investment in India shows that investment entering via Mauritius is growing at an overwhelming rate to capitalize on the benefits of tax treaties between India and Mauritius (Figure 1-4-34). Although the proportion of investment from the U.S., the U.K. and other European countries is large, it is estimated that the amount of investment from East Asian countries will expand, as seen in the rise in investment from Singapore in recent years.
149

Figure 1-4-34 Changes in direct inward investments to India by country
0
100
200
300
400
500
600
2000 2001 2002 2003 2004 2005 2006 (Year)
(billion rupees)
Mauritius US Holland UK Japan Germany Singapore
France Switzerland Sweden Italy South Korea Other
Source: CEIC Database.
(3) Efforts aimed at strengthening the relationship between East Asian countries and India (Efforts by Singapore and Thailand)
Singapore and Thailand are strengthening their relationship with India through FTAs and other agreements. They are also promoting their own growth by functioning as a contact outlet for fast-growing India. Specifically, Thailand implemented a measure to swiftly reduce tariffs in 200488 based on an FTA Framework Agreement concluded in 2003. In addition, Singapore concluded the Comprehensive Economic Cooperation Agreement (CECA) at the end of June 2005, thereby rapidly expanding trade and investment relations with India (Figure 1-4-35 and 1-4-36).
0
10
20
30
40
50
60
2001 2002 2003 2004 2005
(Year)
(US$ 100 million)
0
30
60
90
120
150
180
(100 million rupee)
Exports
Imports
Inward direct investment (right axis)
Note: Export and import figures are as viewed from the Indian side.Source: CEIC Database, Global Trade Atlas.
Figure 1-4-35 Changes in India's trade with Singapore andinward direct investment volume from Singapore
Figure 1-4-36 Changes in India's trade with Thailandand direct inward investment by Thailand
0
2
4
6
8
10
12
14
2001 2002 2003 2004 2005
(Year)
($100 million)
0.0
0.4
0.8
1.2
1.6
2.0
2.4
2.8(billion rupee)
Export
Import
Direct inward investment (rightscale)
Note: The export and import values are those seen from India.Source: CEIC Database, Global Trade Atlas.
(Efforts by South Korea)
South Korea has been working to strengthen its relationship with India. As a result of a summit conference held on October 5, 2004, it adopted a joint South Korea-India declaration covering 30 items and agreed with India to begin work on concluding a comprehensive economic partnership
88 Applying to 82 product categories including television sets and air conditioners since September 1, 2004, this measure implemented a staged elimination of tariffs by September 1, 2006.
150
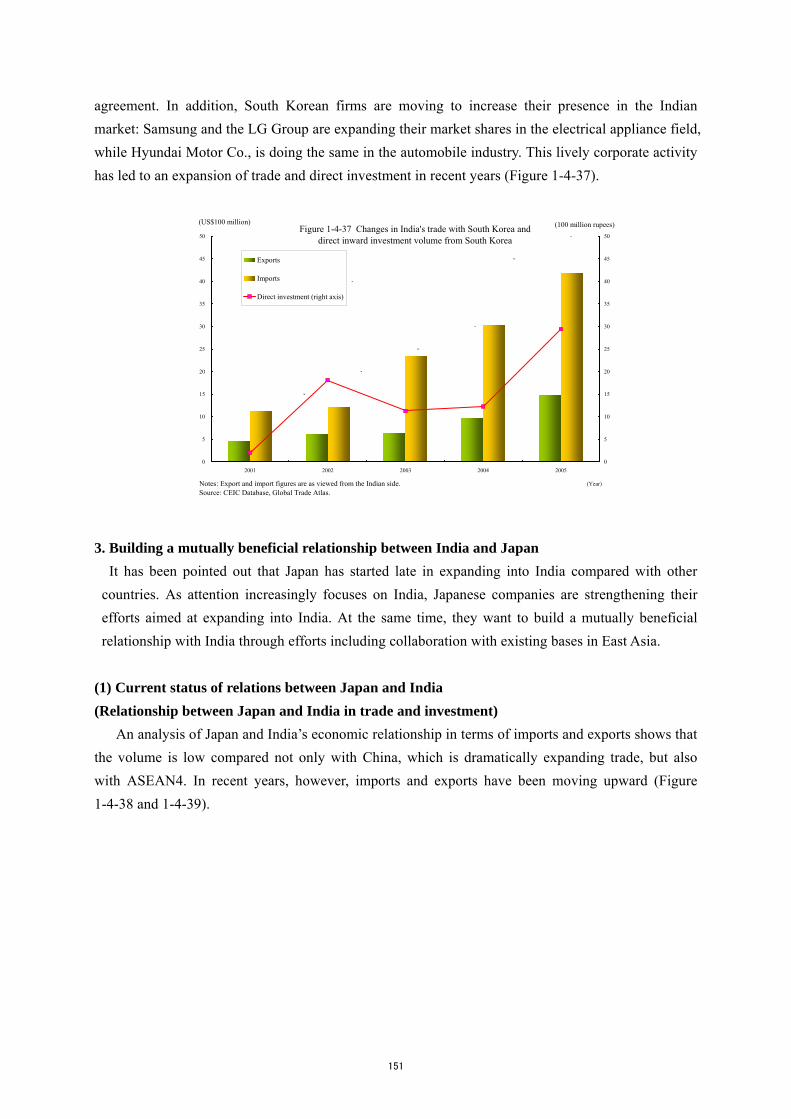
agreement. In addition, South Korean firms are moving to increase their presence in the Indian market: Samsung and the LG Group are expanding their market shares in the electrical appliance field, while Hyundai Motor Co., is doing the same in the automobile industry. This lively corporate activity has led to an expansion of trade and direct investment in recent years (Figure 1-4-37).
Figure 1-4-37 Changes in India's trade with South Korea anddirect inward investment volume from South Korea
0
5
10
15
20
25
30
35
40
45
50
2001 2002 2003 2004 2005
(Year)
(US$100 million)
0
5
10
15
20
25
30
35
40
45
50
(100 million rupees)
Exports
Imports
Direct investment (right axis)
Notes: Export and import figures are as viewed from the Indian side.Source: CEIC Database, Global Trade Atlas.
3. Building a mutually beneficial relationship between India and Japan It has been pointed out that Japan has started late in expanding into India compared with other
countries. As attention increasingly focuses on India, Japanese companies are strengthening their efforts aimed at expanding into India. At the same time, they want to build a mutually beneficial relationship with India through efforts including collaboration with existing bases in East Asia.
(1) Current status of relations between Japan and India (Relationship between Japan and India in trade and investment)
An analysis of Japan and India’s economic relationship in terms of imports and exports shows that the volume is low compared not only with China, which is dramatically expanding trade, but also with ASEAN4. In recent years, however, imports and exports have been moving upward (Figure 1-4-38 and 1-4-39).
151

Figure 1-4-38 Changes of export values from Japan (by country)
0
1
2
3
4
5
6
1998 1999 2000 2001 2002 2003 2004 2005 2006 (Year)
(trillion yen)
0
2
4
6
8
10
12
(trillion yen)
India
Thailand
Malaysia
The Philippines
Indonesia
China (right scale)
Source: Foreign Trade Statistics (Ministry of Finance).
The trade value of India isremaining at a low level, incomparison to the expandingtrade value of China, as well asASEAN4, but recently, there isan increasing trend.
Figure 1-4-39 Changes of import values to Japan (by country)
0
1
2
3
4
5
6
7
8
1998 1999 2000 2001 2002 2003 2004 2005 2006 (Year)
(trillion yen)
0
2
4
6
8
10
12
14
16
(trillion yen)
India
Thailand
Malaysia
The Philippines
Indonesia
China (right scale)
Source: Foreign Trade Statistics (Ministry of Finance). Moreover, Japan’s balance of direct investment in India is still low compared with ASEAN4,
which has long attracted abundant investment, and with China, which is rapidly expanding; however, direct investment has been steadily growing in recent years (Figure 1-4-40). As a result, the number of Japanese companies which have expanded into India was 480 as of February 2007 (Figure 1-4-41). In recent years, transportation equipment has accounted for a major proportion of direct investment. Taking into account the aforementioned growth of the automobile market in India, the expansion of Japanese companies into India centering on the automobile industry is probably growing robustly (Figure 1-4-42).
Figure 1-4-40 Fluctuations in foreign direct investment balance from Japan to India,China, and ASEAN4
3.04.8
5.8 6.3 5.46.9
9.77.5
10.0
13.214.8
16.4
21.0
29.0
14.9
17.9
23.1 22.4 23.024.7
32.5
0
5
10
15
20
25
30
35
1999 2000 2001 2002 2003 2004 2005(Year)
(100 billion yen)
India
China
ASEAN4
Source: Ministry of Finance, International Investment Position (Bank of Japan)
Japan's direct investment to India recentlyincreased but compared to the direct investmentbalance of China and ASEAN4, the value islow.
Figure 1-4-41 Changes in number of Japanese companies entering Indian market
231
276298
328
480
0
50
100
150
200
250
300
350
400
450
500
March 2003 July 2004 April 2005 January 2006 February 2007
(Companies)
Number of companiesentering market
Notes: Information provided by the three consulates in India (Mumbai, Chennai, Kolkata), Japanese Chambers of Trade and Commerce ineach region, and other related organizations, and collated by the Embassy of Japan in India.Source: Website of the Embassy of Japan in India.
152

Figure 1-4-42 Changes in ratio of direct investment from Japan to Indiaby industry type
0%
20%
40%
60%
80%
100%
1989 1990 1991 1992 1993 1994 1995 1996 1997 1998 1999 2000 2001 2002 2003 2004(Year)Electric Transportation Chemical
Food Steel/Non-steel TextileMachinery Other manufacturing industries MiningCommerce Finance and insurance ServiceOther non-manufacturing industries Branch office
Source: Inward and Outward Foreign Direct Investment (Ministry of Finance, Japan)
(Business with India is increasingly attracting interest)
Although Japan’s relationship with India in the area of trade and investment is not as close as it is with China and ASEAN4, with the steady growth of India’s economy in recent years, the interest of Japanese companies in doing business with India is rapidly growing. According to a questionnaire survey by the Japan Bank for International Cooperation, India’s ranking as a promising business location in the medium to long term has moved upward from 6th in FY2002 to 2nd in FY2006 (Table 1-4-43). This increasing interest in India is evident from the abovementioned uptrend in the volume of trade and investment and the growing number of companies expanding into India in recent years.
FY2002 FY2003 FY2004 FY2005 FY2006
1st China China China China China
2nd Thailand Thailand Thailand India India
3rd USA USA India Thailand Vietnam
4th Indonesia Vietnam Vietnam Vietnam Thailand
5th Vietnam India USA USA USA
6th India Indonesia Russia Russia Russia
7th Korea Korea Indonesia Korea Brazil
8th Taiwan Taiwan Korea Indonesia Korea
9th Malaysia Malaysia Taiwan Brazil Indonesia
10th Brazil Russia Malaysia Taiwan Taiwan
Table 1-4-43 Changes in promising markets and business locations in the mid-long term for Japanese companies
Source: FY2006 Survey on Foreign Direct Investment (18th survey) (JBIC).
One example of efforts aimed at expanding into the Indian market is to supply products to India through bases in ASEAN countries such as Singapore and Thailand, which have close relationships with India, taking advantage of the abundant reserves of capital Japanese companies have accumulated. This strategy expands the business network of Japanese companies to East Asia by
153

including India in the China-ASEAN region. A specific example is that of Company A, an electrical equipment manufacturer, which suspended
local production in July 2004 in connection with the sale of television sets in India, and then switched over to exporting from a production base in Thailand. As a result, Company A was able to reduce sales prices by taking advantage of low tariffs using an India-Thailand FTA and avoiding the high cost of domestic distribution in India. Company A also increased sales by selling models that were not produced in India. Such efforts by companies to strategically readjust their business networks should become increasingly important for Japanese companies.
(14) Deepening the relationship between Japan and India (Efforts aimed at developing the environment for deepening the relationship between Japan and India) In order to deepen the relationship between Japan and India and achieve growth in a mutually beneficial arrangement between the two countries, efforts have been launched to develop and improve India’s business environment as part of the Special Economic Partnership Initiative (SEPI) signed in a Japan-India summit held in December 2006. For example, Japan and India will jointly prepare a basic plan to serve as a guideline for the development of a region between the two major economic zones of Delhi and Mumbai (Delhi-Mumbai Major Industrial Corridor). Preparation of the plan will include discussions regarding the necessary infrastructure that must be developed in the future in addition to the large-capacity freight railroad provided for in the plan, based on an understanding of the overall state of infrastructure in the region (Figure 1-4-44).
1. Development of industrial agglomerations with enhanced infrastructure and inland depots (inland logistics bases capable of dealing with bond warehouses and other customs work)
2. Development of port facility on west coast of India.
3. New high-speed freight line between Delhi and Mumbai to link the abovementioned industrial agglomerations and new port facility.
Support for infrastructure projects
Delhi
MumbaiNew port
Haryana
Rajasthan
MaharashtraGujarat
Figure 1-4-44 Delhi-Mumbai Industrial Corridor Project overview
Source: METI.
In addition, the Japanese government began Japan-India EPA negotiations in January 2007 aimed
at deepening the trade and investment relationship between Japan and India, and also called for the initiation of research by East Asian private sector experts, which will take into its purview the aforementioned collaboration by Japanese companies with the bases of China and ASEAN.
154

The above efforts are linked to the further expansion of Japanese companies into India and participation in India through growing international production and distribution networks in East Asia, and as a result they are expected to contribute to India’s economic growth.
(Strengthening the relationship based on the attractiveness of India)
The Indian economy as described above has achieved high growth in recent years through liberalization and by strengthening ties with the world economy and with the economies of the East Asian region. In comparison with China, which has also achieved high growth, the timing of India’s shift onto the path of economic liberalization differed, and as a result, India’s economic indicators are not on par with China’s (Table 1-4-45). In contrast to the Chinese economy, which centers on manufacturing, investment and external demand, India’s economy is driven by the service industry and internal demand, and has the following characteristics: (a) a potentially huge market that has just started to achieve high growth; (b) development of the IT, pharmaceutical and biotechnology technologies on the strength of a large, highly educated workforce; (c) a stable business environment in which certain intellectual property rights are assured under a comparatively developed legal system, although it is known to be complicated and to suffer from administrative problems; and (d) India has close relationships with Europe owing to historical and geographical factors.
In addition, in order that the Japanese economy can achieve sustainable growth, a vigorous Indian economy, which has achieved high growth on the basis of the above characteristics, is essential, quite same as is growth of the economies of China, ASEAN and NIEs. Ties with these economies must be strengthened, which includes the use of the expanding business bases elsewhere in East Asia.
155

Item Unit Period covered India China India/China(%)
Real GDP per capita Dollar 2005 586 1,445 40.6
Human development index World rank 2004 126 81 -
Literacy rate % 2004 61.0 90.9 67.1
Nominal GDP $100 million 2005 7,854 22,288 35.2
Real GDP $100 million 2005 6,419 18,847 34.1
Population million people 2005 11.3 13.1 86.3
% 1979-2005 5.5 9.7 57.1
% 1991-2005 6.0 9.7 61.2
% 2003-2005 8.4 10.0 84.5
GDP share compared to primary industry % 2004 18.8 13.1 -
GDP share compared to secondary industry % 2004 27.5 46.2 -
GDP share compared to tertiary industry % 2004 53.7 40.7 -
gross fixed capital formation compared to nominal GDP対 % 2004 25.5 38.5 -
Household consumption compared to nominal GDP % 2004 61.0 41.7 -
Exports compared to nominal GDP % 2004 18.0 37.6 -
Total trade $100 million 2005 2,080 15,853 13.1
Total exports $100 million 2005 1,108 9,807 11.3
Total imports $100 million 2005 972 6,046 16.1
Direct inward investment from the world (flow) $100 million 2005 66 724 9.1
Direct inward investment from the world (stock) $100 million 2005 452 3,178 14.2
Foreign reserves $100 million 2006 1,701 10,663 16.0
Exchange - 2006 Float system Controlled float -
To Japanese exports $100 million 2005 32 1,084 2.9
To Japanese imports $100 million 2005 35 800 4.4
Direct inward investment from Japan (flow) $100 million 2005 2.7 83.6 3.2
Direct inward investment from Japan (Stock) $100 million 2005 17.9 244.1 7.3
Business environment evaluation World rank 2006 134 93 -
Real GDP growth rate
Grow
th potential
From 1979 to 2005 China has achieved an average high growth rate of 9.7% per year, which highly exceeds the 6% for India after it oriented towards liberalizingits economy in 1999. But after 2003, India has recorded a growth rate of 8.4%, attaining a high growth.
Source: WDI (World Bank), Doing Business , World Investment Report2006 (UNCTAD), World Population Prospect , DOT (IMF), IFS , Website of JETRO Trade,Investment, Balance of Payments Statistics.
Investment
environment
There are various challenges mentioned for China, but many business environment challenges such as infrastructure aspects and complicated and legal structures arementioned for India, expected to be improved. As mentioned above, in order for a persistent growth to take place, upon actively inviting foreign investment,improving such business environments becomes important.
Industrial structure
China has decreased its portions of primary industries, while increasing secondary industry portions. On the other hand, secondary industries in India has remainedat 20%, tertiary industries exceeding 50%. Differing from other developing countries, by drawing tertiary industries, India has achieved growth.
Structure of demand
After India's economic reform, exports and gross fixed capital formation against GDP has increased, but as of 2004 household consumption accounts for 61%achieving an economic growth centering domestic demand. This is a contrast to the high growth achieved in China centering around investment and exports.
Table 1-4-45 Comparing principal economic indicators of China and India
Stage of development
As of 1979, real GDP per capita was nearly the same level, but with the rapid economic growth of China, in 2005 the gap between China's $1445 and India's $586expanded to 3 times as much. India also had a low literacy rate level of 61%, which needs to be improved in order to resolve poverty issues essential for economicgrowth.
Market Size
China's nominal GDP in 2005 was $2.2 trillion, reaching fourth in the world after US, Japan, and Germany, but India was 1/17 of the US, and only 1/6 of Japan.However looking from a purchasing power base, India is reaching a scale following the US, China, and Japan. In addition, the population is first or second in theworld, and the market's attraction for economic growth is growing.
to international relations
India's trade value has firmly increased due to progress towards liberalization, but compared to China it is still at a low level. In addition, direct internal investmentfrom overseas has expanded in China, which has achieved economic growth, but the direct internal investment value of India is still low. For India to achieve a higheconomic growth in the future, new technology, and management methods must be provided from actively inviting foreign investment.
to relations with Japan
The trade and investment relations of Japan and India, in comparison to Japan and China remains at a low level but, due to India's high growth, attention fromJapanese corporations is quickly increasing. Recently, there are increasing trend towards trade and investment values.
156