section 4 performance - aga-reports.com · significant asset sales; executed, according to plan,...
TRANSCRIPT

PERFORMANCE REVIEW
SECTION 4
We provide an overview of our financial, operational and
sustainable development performance over the past financial
year, as well as a summary of our Mineral Resource and
Ore Reserve portfolio and initiatives to extend this portfolio to
ensure long-term optionality.
CFO’s review 60
The year ahead – outlook 66
Financial review 67
Economic value-added statement 72
Regional reviews 73
Five-year statistics by operation 118
Mineral Resource and Ore Reserve – summary 138
Planning for the future 145
Picture: Cuiabá, BrazilINTEGRATED REPORT 2017 59

CFO’S REVIEW
Christine Ramon:
Chief Financial OfficerThe company advanced the restructuring of its South African portfolio, including some significant asset sales; executed, according to plan, the key self-funded brownfields projects to sustainably improve mine lives and margins; and achieved its annual cost, production and capital guidance for the fifth consecutive year.
AngloGold Ashanti continues to make progress on its strategic objectives and has delivered a strong financial and operating performance. The financial results for the year have been impacted by some significant once-off charges and impairments, but cash flows and the balance sheet remain robust.
Total cash costs for the full year of $792/oz were 6% higher than the previous year’s $744/oz, and within the guidance range of $750/oz to $800/oz. Costs were negatively impacted by inflation, stronger local currencies and the expensing of certain capital costs at the South African operations as those operations underwent orderly closure. All-in sustaining costs came in at the bottom end of the guidance range at $1,054/oz, 7% higher than the previous year’s all-in sustaining cost of $986/oz, due to higher planned sustaining capital expenditure levels and the stronger local currencies.
Cash flow from operating activities for the year ended 31 December 2017 declined by 16% when compared to 2016, reflecting tighter margins, working capital lockups, and payments in respect of retrenchment costs in South Africa, offsetting a 1% increase in the gold price received and a 5% increase in gold sales. Free cash flow of $1m for the year, compared to $278m in 2016, was supported by a strong second half performance which delivered free cash flow of $162m. This was, however, impacted by the increase in the lockup of VAT receivables at Kibali and Geita, which was approximately $20m and $50m for the year respectively, and the higher planned capital expenditure. In line with the reinvestment strategy of AngloGold Ashanti, total self-funded capital expenditure of $953m increased by $142m from the previous year (2016: $811m).
Production rises 4% year-on-year to 3.755Moz, above top end of guidance
Total cash costs of $792/oz, in line with full year guidance of between $750 to $800/oz
All-in sustaining costs of $1,054/oz, at lower end of the guidance range
Free cash flow of $125m, before growth capital; impacted by South Africa restructuring costs and VAT lockups in Continental Africa
Dividend of ZAR 70 cents per share (approximately 6 US cents per share) declared, given strong cash flow performance
Adjusted headline earnings of $9m, after retrenchment costs ($71m) and silicosis provision ($46m)
Brownfields projects to improve life and margins, all remain on schedule
New safety benchmarks set: three, fatality-free quarters for first time
Obuasi redevelopment approved on strong return metrics and good government support
SA restructuring progressing well: Moab Khotsong and Kopanang sales closed on 28 February 2018 and TauTona in orderly closure
Strong Ore Reserve-replacement performance, declaration of maiden Ore Reserve in Colombia
Ang loGo ld Ashant i con t inued to make cons iderab le enhancements to the qua l i t y o f i t s por t f o l i o dur ing the year ended 31 December 2017.
Enhancing our portfolio
INTEGRATED REPORT 2017 60

CFO’S REVIEW CONTINUED
Free cash flow for the year, before taking growth capital into account, was $125m versus $394m a year earlier, impacted by 19% higher planned sustaining capital expenditure of $829m compared to the previous year of $695m, South African retrenchment costs paid of $49m and higher cash costs.
The balance sheet reflects strong liquidity comprising $965m available on the $1bn US dollar syndicated RCF at the end of December 2017, $85m undrawn on the $100m US dollar RCFs, A$290m undrawn on the A$500m Australian dollar RCF, approximately R2.95bn available from the South African RCFs and other facilities and cash and cash equivalents of $205m as at the end of December 2017.
We continue to focus our efforts on reducing our taxation exposures, specifically indirect taxes, in all jurisdictions that we operate in. Our transparent group tax policy continues to support a low risk approach in dealing with tax matters across the various jurisdictions in which we operate.
Other pertinent matters include:
• At the end of June 2017, AngloGold Ashanti announced that it would restructure its South African operations to safely return the business to profitability, while mitigating job losses. This included placing TauTona and Savuka into care and maintenance, followed by orderly closure. In October 2017, we announced the sale of the Kopanang mine
and related infrastructure to Heaven-Sent SA Sunshine Investment Company Limited, with one of the conditions being that the majority of existing workers continue to work at the operations. Simultaneously, we announced the conclusion of the sale agreement for the disposal of the Moab Khotsong and Great Noligwa mines and related infrastructure to Harmony Gold Mining Company Limited. All the conditions precedent to these sale contracts were met subsequent to year end and the transactions closed on 28 February 2018.
• Agreement has been reached with the government of Ghana for the redevelopment of Obuasi, subject to ratification by Ghana’s parliament of the relevant fiscal and development agreements. These agreements have been signed by the government and ratification is scheduled during the current parliamentary sitting. The redevelopment will establish Obuasi as a long-life, modern, mechanised underground mining operation, which is a fundamental departure from the previous operating method used at the mine.
• The DRC has recently promulgated a new mining code that makes a number of changes to the operating environment for the DRC’s extractive industries, including those in its mining, and oil and gas sectors. On 8 March 2018, AngloGold Ashanti announced that a meeting had been held between the DRC president and mining industry representatives
to discuss the new mining code prior to its promulgation. The DRC government has agreed to continue discussions with the mining industry representatives, post the promulgation of the new mining code, regarding issues existing in the current agreement and the implementation of the new mining code. AngloGold Ashanti is in full support of Randgold Resources, our partner and the operator in the Kibali joint venture, in its continued engagement with the DRC government.
• The settlement negotiations between the Occupational Lung Disease (OLD) Working Group and class action legal representatives have reached an advanced stage. The OLD Working Group represents African Rainbow Minerals, Anglo American SA, AngloGold Ashanti, Gold Fields, Harmony and Sibanye-Stillwater. The class members are represented by Richard Spoor Inc, Abrahams Kiewietz Inc and the Legal Resources Centre. On 10 January 2018, in response to a request from all parties involved in the appeal to the Supreme Court of Appeal (SCA) in respect of the silicosis and tuberculosis class action litigation, the Registrar of the SCA postponed the hearing date of the appeal until further notice.
Focusing on marginsWe continue to focus our efforts on driving operational excellence and cost efficiency across our business, regardless of the gold
price environment in which we operate and over which we have no control.
Despite stronger currencies and inflationary pressures, our continued focus on meeting production targets, strong cost management and stringent capital discipline, have resulted in the all-in sustaining cost margin increasing from 17% in the second half of 2016, to 19% in the last six months of 2017. This is especially encouraging given the flat gold price and is illustrated in the graph that follows.
For the full year, the all-in sustaining cost margin decreased from 21% to 16%, mainly the result of currency and inflation pressure on cash costs. We, however, continue to pursue efficiencies and productivity and attempt to improve margins on a sustainable basis and will be working hard to ensure that these efforts are reflected in the all-in sustaining cost margin in the coming year.
We will continue to work towards widening these margins, by focusing on the controllable factors, including:
• stringent cost management
• reinvestment in low capital, high return opportunities within our business
• continuing to drive our Operational Excellence Programme, which considers innovative ways to improve efficiencies and productivity at our operations
INTEGRATED REPORT 2017 61
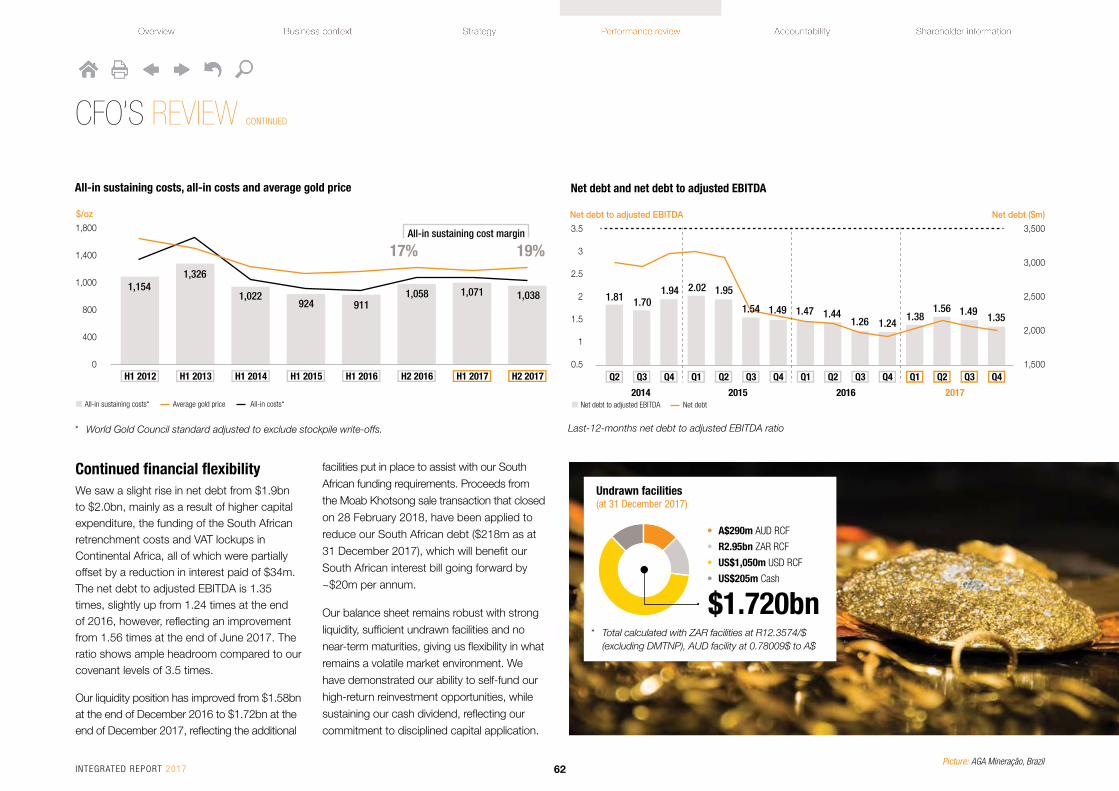
Continued financial flexibilityWe saw a slight rise in net debt from $1.9bn to $2.0bn, mainly as a result of higher capital expenditure, the funding of the South African retrenchment costs and VAT lockups in Continental Africa, all of which were partially offset by a reduction in interest paid of $34m. The net debt to adjusted EBITDA is 1.35 times, slightly up from 1.24 times at the end of 2016, however, reflecting an improvement from 1.56 times at the end of June 2017. The ratio shows ample headroom compared to our covenant levels of 3.5 times.
Our liquidity position has improved from $1.58bn at the end of December 2016 to $1.72bn at the end of December 2017, reflecting the additional
facilities put in place to assist with our South
African funding requirements. Proceeds from
the Moab Khotsong sale transaction that closed
on 28 February 2018, have been applied to
reduce our South African debt ($218m as at
31 December 2017), which will benefit our
South African interest bill going forward by
~$20m per annum.
Our balance sheet remains robust with strong
liquidity, sufficient undrawn facilities and no
near-term maturities, giving us flexibility in what
remains a volatile market environment. We
have demonstrated our ability to self-fund our
high-return reinvestment opportunities, while
sustaining our cash dividend, reflecting our
commitment to disciplined capital application.
CFO’S REVIEW CONTINUED
All-in sustaining costs, all-in costs and average gold price
All-in sustaining costs* Average gold price All-in costs*
H1 2012 H1 2013 H1 2014 H1 2015 H1 2016 H2 2016 H1 2017 H2 2017
1,1541,326
1,022924 911
1,058
17% 19%
1,071
All-in sustaining cost margin
1,038
1,800
1,400
1,000
800
400
0
$/oz
* World Gold Council standard adjusted to exclude stockpile write-offs. Last-12-months net debt to adjusted EBITDA ratio
Net debt and net debt to adjusted EBITDA
Net debt to adjusted EBITDA Net debt
Q2 Q3 Q4 Q2Q1 Q3 Q4 Q2Q1 Q3 Q4 Q2Q1 Q3 Q4
3.5
3
2.5
2
1.5
1
0.5
3,500
3,000
2,500
2,000
1,500
Net debt to adjusted EBITDA Net debt ($m)
2014 2015 2016 2017
1.81 1.701.94 2.02 1.95
1.54 1.49 1.47 1.441.26 1.24
1.381.56 1.49 1.35
Undrawn facilities(at 31 December 2017)
• A$290m AUD RCF
• R2.95bn ZAR RCF
• US$1,050m USD RCF
• US$205m Cash
$1.720bn* Total calculated with ZAR facilities at R12.3574/$
(excluding DMTNP), AUD facility at 0.78009$ to A$
Picture: AGA Mineração, BrazilINTEGRATED REPORT 2017 62
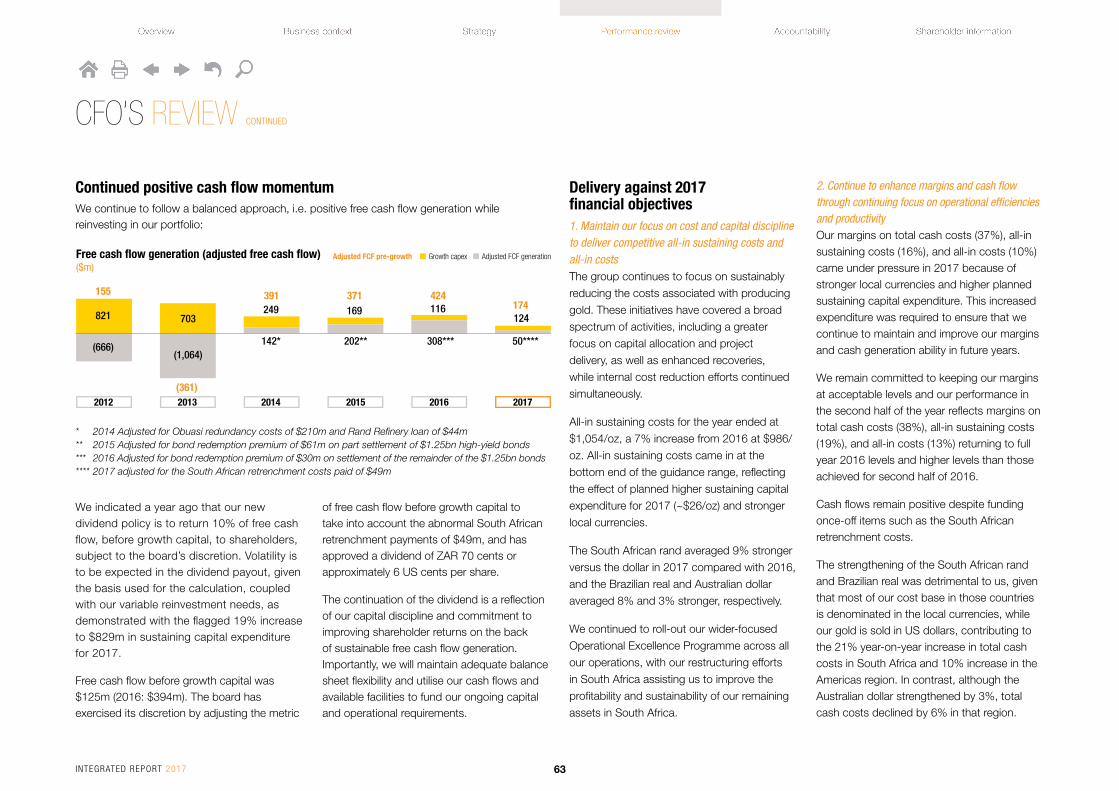
Continued positive cash flow momentumWe continue to follow a balanced approach, i.e. positive free cash flow generation while reinvesting in our portfolio:
CFO’S REVIEW CONTINUED
* 2014 Adjusted for Obuasi redundancy costs of $210m and Rand Refinery loan of $44m** 2015 Adjusted for bond redemption premium of $61m on part settlement of $1.25bn high-yield bonds *** 2016 Adjusted for bond redemption premium of $30m on settlement of the remainder of the $1.25bn bonds**** 2017 adjusted for the South African retrenchment costs paid of $49m
Free cash flow generation (adjusted free cash flow) ($m)
Growth capex Adjusted FCF generationAdjusted FCF pre-growth
20132012 2014 2015 2016 2017
155 391 371 424174
(361)
821 703249 169 116
124
142* 202** 308*** 50****(1,064)
(666)
We indicated a year ago that our new dividend policy is to return 10% of free cash flow, before growth capital, to shareholders, subject to the board’s discretion. Volatility is to be expected in the dividend payout, given the basis used for the calculation, coupled with our variable reinvestment needs, as demonstrated with the flagged 19% increase to $829m in sustaining capital expenditure for 2017.
Free cash flow before growth capital was $125m (2016: $394m). The board has exercised its discretion by adjusting the metric
of free cash flow before growth capital to take into account the abnormal South African retrenchment payments of $49m, and has approved a dividend of ZAR 70 cents or approximately 6 US cents per share.
The continuation of the dividend is a reflection of our capital discipline and commitment to improving shareholder returns on the back of sustainable free cash flow generation. Importantly, we will maintain adequate balance sheet flexibility and utilise our cash flows and available facilities to fund our ongoing capital and operational requirements.
Delivery against 2017 financial objectives1. Maintain our focus on cost and capital discipline to deliver competitive all-in sustaining costs and all-in costsThe group continues to focus on sustainably
reducing the costs associated with producing
gold. These initiatives have covered a broad
spectrum of activities, including a greater
focus on capital allocation and project
delivery, as well as enhanced recoveries,
while internal cost reduction efforts continued
simultaneously.
All-in sustaining costs for the year ended at
$1,054/oz, a 7% increase from 2016 at $986/
oz. All-in sustaining costs came in at the
bottom end of the guidance range, reflecting
the effect of planned higher sustaining capital
expenditure for 2017 (~$26/oz) and stronger
local currencies.
The South African rand averaged 9% stronger
versus the dollar in 2017 compared with 2016,
and the Brazilian real and Australian dollar
averaged 8% and 3% stronger, respectively.
We continued to roll-out our wider-focused
Operational Excellence Programme across all
our operations, with our restructuring efforts
in South Africa assisting us to improve the
profitability and sustainability of our remaining
assets in South Africa.
2. Continue to enhance margins and cash flow through continuing focus on operational efficiencies and productivity Our margins on total cash costs (37%), all-in sustaining costs (16%), and all-in costs (10%) came under pressure in 2017 because of stronger local currencies and higher planned sustaining capital expenditure. This increased expenditure was required to ensure that we continue to maintain and improve our margins and cash generation ability in future years.
We remain committed to keeping our margins at acceptable levels and our performance in the second half of the year reflects margins on total cash costs (38%), all-in sustaining costs (19%), and all-in costs (13%) returning to full year 2016 levels and higher levels than those achieved for second half of 2016.
Cash flows remain positive despite funding once-off items such as the South African retrenchment costs.
The strengthening of the South African rand and Brazilian real was detrimental to us, given that most of our cost base in those countries is denominated in the local currencies, while our gold is sold in US dollars, contributing to the 21% year-on-year increase in total cash costs in South Africa and 10% increase in the Americas region. In contrast, although the Australian dollar strengthened by 3%, total cash costs declined by 6% in that region.
INTEGRATED REPORT 2017 63

CFO’S REVIEW CONTINUED
3. Dividend underpinned by sustainable cash generation Despite the significant headwinds experienced in free cash flow generation, AngloGold Ashanti declared a dividend of ZAR 70 cents per share (~6 US cents per share) for the year under review. Free cash flow before growth capital, remained sufficient to maintain the declaration of a dividend since the introduction of the new dividend policy last year.
Our focus with the substantial restructuring of the South African operations, combined with the South African asset sales, as well as the significant planned sustaining capital expenditure in 2017, has been to be appropriately positioned to maintain the dividend in future years underpinned by sustainable cash generation.
4. Move to a sustainable resolution at ObuasiDuring 2017, significant positive developments at Obuasi resulted in AngloGold Ashanti announcing in February 2018 the advancement of the redevelopment of the Obuasi project. Some of the beneficial developments in 2017 included the improved security situation with the last enclave of illegal miners being evicted from site in April; the lifting of the force majeure; the extension of the Amended Mining Programme entered into with the government of Ghana to April 2018; and the suspension of the international arbitration initiated with the International Centre for Settlement of Investment Disputes (ICSID).
All the above developments paved the way for successful negotiations with the Ghanaian government relating to the Reclamation Security Agreement; a Tax Concession Agreement; a Development Agreement; a Security Agreement; and a Settlement Agreement. These agreements have been signed by the government, with the Tax Concession Agreement and the Development Agreement subject to ratification by Ghana’s parliament, which is scheduled to occur during the current parliamentary sitting.
Mine production for the first 10 years will be focused on the upper ore bodies and is expected to average 350,000oz to 400,000oz at an average head grade of 8.1g/t. Total cash costs are expected to average between $590/oz to $680/oz, while all-in sustaining cost is expected to be between $795/oz to $850/oz. Mine production for the second 10 years increases to 400,000oz to 450,000oz per annum, as the mine deepens into higher grade ore. All-in sustaining cost is then expected to improve to between $750/oz to $800/oz. The project delivers internal real rates of return of between 16% and 23% at real gold prices of between $1,100/oz and $1,240/oz, and is highly leveraged to the gold price. Initial project capital expenditure anticipated over the first 2.5 years is expected to be between $450m to $500m, excluding pre-production capital of $64m.
The redevelopment will establish Obuasi as a long-life, modern, highly mechanised
underground mining operation, replacing the labour-intensive, hand-held operating systems previously used at the mine. The redevelopment will deliver a mine that makes use of automation and controls for better safety, improved operational efficiencies and consistent performance. It envisages a smaller, but more skilled workforce that can operate in a mechanised/automated environment with a strong sense of accountability.
5. Execute on low capital, high return brownfields projects, while continuing to move long term projects up the value curve AngloGold Ashanti’s approach to growth investments and project approvals is based upon a multi-factor model that takes into account how the investment or project will improve our portfolio, financial flexibility, sustainability and long-term optionality. Such investments or projects must generate returns meeting our required hurdle rate of 15% in real US dollar terms.
We continue to execute on our robust brownfields exploration programme at most of our operations in the group as described earlier.
There are a number of capital projects that we continued to focus on during the year, including the Obuasi redevelopment project discussed in the previous section.
At Kibali, the underground materials handling system and ore hoisting via the shaft were
commissioned with ramp up progressing. The paving on the central haulage level was completed during the year, allowing haulage from the ore passes into the underground crushers to the shaft system. In addition, development of declines is continuing. The construction of the third hydropower station at Azambi and the next phase of tailings storage facility is scheduled for completion in 2018.
The Mponeng mine life will be extended through access to deeper, higher-grade ore via the development of a decline below the current secondary shaft, with completion expected around mid-2018. Additional ventilation and water management, and ore handling infrastructure are in the process of being constructed. A feasibility study is being undertaken into the deepening of the secondary shaft to further extend the mine’s life beyond 2026.
The Sadiola sulphides project, which will add sulphide-ore processing capability to the plant, continued to be evaluated. Discussions with the government of Mali continue regarding the project.
At Siguiri, we are investing about $115m over approximately two years to add a hard-rock plant to the current processing infrastructure, providing the ability to develop the significant sulphide-ore potential that exists on the current concession. The company is also building a new power plant at a cost of $43m,
INTEGRATED REPORT 2017 64

CFO’S REVIEW CONTINUED
to provide electricity to the new facility. During 2017, $67m was spent on the project and a total of $145m has been committed to date. The project remains largely on schedule for completion and the final costs are currently being reviewed as all major commitments have now been concluded.
Finally, we announced the declaration of the maiden Ore Reserve for the Gramalote project in Colombia of 63.7Mt @ 0.86 g/t gold comprising contained metal content of 1.8Moz, on an attributable basis. Gramalote represents a long-term option for AngloGold Ashanti, and all avenues to realise value from this important asset remain open. AngloGold Ashanti’s management is currently in discussions with the joint venture partner, B2Gold (49%) on how to further progress the project.
6. Maintain financial flexibility and further reduction in finance costsOur net debt to adjusted EBITDA ratio of 1.35 times reflects a marginal increase to 2016 at 1.24 times. This remains well within our debt covenant level of 3.5 times. Coupled with the successful completion of the South African sales transactions of Moab Khotsong and Kopanang at the end of February 2018 where the proceeds have been utilised to
further reduce our South African debt, we have
successfully maintained financial flexibility and
anticipate a further reduction in our finance
costs in 2018.
Looking ahead to 2018, the key financial and other objectives are to:• Maintain our focus on cost and capital
discipline to deliver competitive all-in sustaining costs and all-in costs
• Continue to enhance margins and cash flows with a focus on operational efficiencies and productivity through Operational Excellence
• Maintain the dividend underpinned by sustainable cash generation
• Seek resolutions for the Tanzanian and DRC regulatory uncertainty
• Progress implementation of the Obuasi redevelopment
• Execute on low-capital, high-return brownfields projects, while continuing to progress long-term projects up the value curve
• Maintain financial flexibility and further reduce finance costs
Acknowledgement I would like to express my appreciation to our committed and diligent finance team across the group who have been proactive in supporting the business to manage costs and capital as well as dealing with working capital and other business challenges associated with the developing market nature of the jurisdictions that we operate in. In addition, we continue to maintain a high standard of governance and compliance to internal controls across the organisation. The quality financial information prepared for our stakeholders is testament to our high calibre financial team whom I applaud. Finally, I look forward to the year ahead with enthusiasm and absolute focus on our strategic objectives with the aim of improving shareholder returns, on a sustainable basis.
Christine RamonChief Financial Officer19 March 2018
INTEGRATED REPORT 2017 65

THE YEAR AHEAD – OUTLOOK
Both production and cost estimates assume neither operational or labour interruptions or power disruptions, nor further changes to asset portfolio and/or operating mines and have not been reviewed by our external auditors. Other unknown or unpredictable factors could also have material adverse effects on our future results and no assurance can be given that any expectations expressed by AngloGold Ashanti will prove to have been correct. Please refer to the Risk Factors section in AngloGold Ashanti’s annual report on Form 20-F for the year ended 31 December 2017, filed with the United States Securities and Exchange Commission.
Guidance 2018Guidance Notes
Production (000oz) 3,325 – 3,450 Includes monthly production of ±30,000oz from Moab Khotsong and Kopanang for a period of three months
Costs All-in sustaining costs ($/oz) 990 – 1,060Assumptions: R12.79/$, $/A$0.78, BRL3.20/$, ARS19.61/$; Brent $62/bl
Total cash costs ($/oz) 770 – 830
Overheads Corporate costs ($m) 70 – 80
Expensed exploration and study costs ($m) 115 – 125 Including equity-accounted joint ventures
Capital expenditure Total ($m) 800 – 920
Sustaining ($m) 600 – 670
Non-sustaining ($m) 200 – 250 Obuasi, Kibali, Siguiri hard-rock project, Mponeng
Depreciation and amortisation ($m) 775
Depreciation and amortisation – included in equity-accounted earnings
($m) 150 Earnings of associates and joint ventures
Interest and finance costs ($m) 140
Other operating expenses ($m) 90 Related primarily to the costs of care and maintenance
INTEGRATED REPORT 2017 66

FINANCIAL REVIEW
Five-year summariesSummarised group financial results – income statement
US dollar million 2017 2016 2015 2014 2013
Gold income 4,356 4,085 4,015 4,952 5,172 Cost of sales (3,582) (3,263) (3,294) (3,972) (3,947)Gain (loss) on non-hedge derivatives and other commodity contracts 10 19 (7) 13 94 Gross profit 784 841 714 993 1,319 Corporate administration, marketing and other expenses (64) (61) (78) (92) (201)Exploration and evaluation costs (114) (133) (132) (142) (250)Other operating expenses (88) (110) (96) (28) (19)Special items (438) (42) (71) (260) (2,951)Operating profit (loss) 80 495 337 471 (2,102)Dividends received – – – – 5 Interest received 15 22 28 24 39 Exchange (loss) gain (11) (88) (17) (7) 14 Finance costs and unwinding of obligations (169) (180) (245) (276) (293)Fair value adjustments on convertible bonds – 9 66 (17) 307 Share of equity-accounted investments’ profit (loss) 22 11 88 (25) (162)Loss (profit) before taxation (63) 269 257 170 (2,192)Taxation (108) (189) (211) (225) 237 (Loss) profit after taxation from continuing operations (171) 80 46 (55) (1,955)Discontinued operations(Loss) profit from discontinued operations – – (116) 16 (245)(Loss) profit for the year (171) 80 (70) (39) (2,200)Allocated as follows:Equity shareholders– Continuing operations (191) 63 31 (74) (1,985)– Discontinued operations – – (116) 16 (245)Non-controlling interests 20 17 15 19 30
(171) 80 (70) (39) (2,200)
7% increase in gold income in 2017 reflects higher gold price received year-on-year on higher production levels
INTEGRATED REPORT 2017 67

FINANCIAL REVIEW CONTINUED
Summarised group financial results – statement of financial position US dollar million 2017 2016 2015 2014 2013
Assets
Tangible and intangible assets 3,880 4,256 4,219 5,088 5,082
Investments 1,645 1,578 1,557 1,553 1,459
Inventories 783 756 736 1,524 1,639
Cash and cash equivalents 205 215 484 468 648
Other assets 706 348 288 501 846
Total assets 7,219 7,153 7,284 9,134 9,674
Equity and liabilities
Total equity 2,704 2,754 2,467 2,871 3,107
Borrowings 2,268 2,178 2,737 3,721 3,891
Provisions 1,064 995 954 1,199 1,115
Deferred taxation 363 496 514 567 579
Other liabilities 820 730 612 776 982
Total equity and liabilities 7,219 7,153 7,284 9,134 9,674
INTEGRATED REPORT 2017 68

FINANCIAL REVIEW CONTINUED
Summarised group financial results – statement of cash flowsUS dollar million 2017 2016 2015 2014 2013
Cash flows from operating activities
Cash generated from operations 1,151 1,302 1,250 1,343 1,307
Dividends received from joint ventures 6 37 57 – 18
Net taxation paid (160) (153) (163) (153) (164)
Net cash inflow from operating activities from continuing operations 997 1,186 1,144 1,190 1,161
Net cash (outflow) inflow from discontinued operations – – (5) 30 85
Net cash inflow from operating activities 997 1,186 1,139 1,220 1,246
Cash flows from investing activities
Capital expenditure (830) (711) (667) (849) (1,431)
Net (payments) proceeds from acquisition and disposal of subsidiaries, associates and joint ventures (27) (1) (12) 42 (466)
Net (payments) proceeds from disposal and acquisition of investments, associate loans, and acquisition and disposal of tangible assets (12) (12) 810 (11) (8)
Interest received 15 14 25 21 23
Decrease (increase) in cash restricted for use (8) 8 (17) 24 (20)
Net cash (outflow) inflow from investing activities from continuing operations (862) (702) 139 (773) (1,902)
Cash outflows from discontinued operations – – (59) (170) (138)
Net cash (outflow) inflow from investing activities (862) (702) 80 (943) (2,040)
Cash flows from financing activities
Net (repayments) proceeds from borrowings 48 (546) (867) (144) 864
Finance costs paid (138) (172) (251) (246) (200)
Dividends paid (58) (15) (5) (17) (62)
Other – (30) (61) (9) (36)
Net cash (outflow) inflow from financing activities from continuing operations (148) (763) (1,184) (416) 566
Cash outflows from discontinued operations – – (2) (5) (6)
Net (outflow) inflow from financing activities (148) (763) (1,186) (421) 560
Net (decrease) increase in cash and cash equivalents (13) (279) 33 (144) (234)
Translation 3 10 (17) (16) (30)
Cash and cash equivalents at beginning of year 215 484 468 628 892
Cash and cash equivalents at end of year (1) 205 215 484 468 628
(1) The cash and cash equivalent balance at 31 December 2013 includes a bank overdraft included in the statement of financial position as part of other liabilities of $20m.
20% drop in finance costs mainly from fully retiring the $1.25bn high yield bonds in August 2016
INTEGRATED REPORT 2017 69
FINANCIAL REVIEW CONTINUED
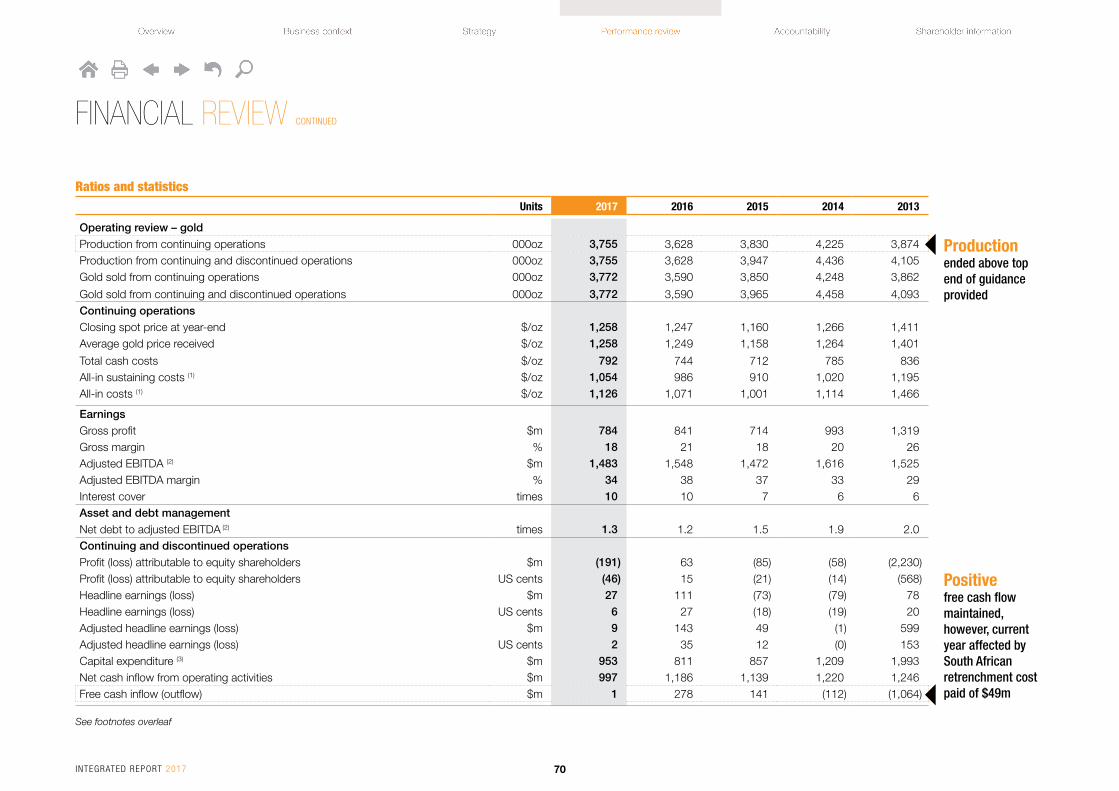
Ratios and statistics Units 2017 2016 2015 2014 2013
Operating review – goldProduction from continuing operations 000oz 3,755 3,628 3,830 4,225 3,874 Production from continuing and discontinued operations 000oz 3,755 3,628 3,947 4,436 4,105 Gold sold from continuing operations 000oz 3,772 3,590 3,850 4,248 3,862
Gold sold from continuing and discontinued operations 000oz 3,772 3,590 3,965 4,458 4,093 Continuing operationsClosing spot price at year-end $/oz 1,258 1,247 1,160 1,266 1,411 Average gold price received $/oz 1,258 1,249 1,158 1,264 1,401
Total cash costs $/oz 792 744 712 785 836 All-in sustaining costs (1) $/oz 1,054 986 910 1,020 1,195 All-in costs (1) $/oz 1,126 1,071 1,001 1,114 1,466
EarningsGross profit $m 784 841 714 993 1,319 Gross margin % 18 21 18 20 26 Adjusted EBITDA (2) $m 1,483 1,548 1,472 1,616 1,525 Adjusted EBITDA margin % 34 38 37 33 29 Interest cover times 10 10 7 6 6 Asset and debt managementNet debt to adjusted EBITDA (2) times 1.3 1.2 1.5 1.9 2.0 Continuing and discontinued operationsProfit (loss) attributable to equity shareholders $m (191) 63 (85) (58) (2,230)Profit (loss) attributable to equity shareholders US cents (46) 15 (21) (14) (568)Headline earnings (loss) $m 27 111 (73) (79) 78 Headline earnings (loss) US cents 6 27 (18) (19) 20 Adjusted headline earnings (loss) $m 9 143 49 (1) 599 Adjusted headline earnings (loss) US cents 2 35 12 (0) 153 Capital expenditure (3) $m 953 811 857 1,209 1,993 Net cash inflow from operating activities $m 997 1,186 1,139 1,220 1,246 Free cash inflow (outflow) $m 1 278 141 (112) (1,064)
See footnotes overleaf
Production ended above top end of guidance provided
Positive free cash flow maintained, however, current year affected by South African retrenchment cost paid of $49m
INTEGRATED REPORT 2017 70

FINANCIAL REVIEW CONTINUED
Units 2017 2016 2015 2014 2013
Asset and debt management
Equity $m 2,704 2,754 2,467 2,871 3,107
Net capital employed $m 5,031 5,101 5,190 6,640 5,519
Net debt $m 2,001 1,916 2,190 3,133 3,105
Net asset value – per share US cents 659 675 609 711 770
Market capitalisation $m 4,178 4,290 2,877 3,515 4,727
Return on net capital employed % 3 6 5 4 12
Net debt to equity % 74 70 89 109 100
Other
Weighted average number of shares million 415 413 410 408 393
Issued shares at year-end million 410 408 405 404 403
Exchange rates
Rand/dollar average 13.30 14.68 12.77 10.83 9.62
Rand/dollar closing 12.36 13.73 15.46 11.57 10.45
Australian dollar/dollar average 1.30 1.35 1.33 1.11 1.03
Australian dollar/dollar closing 1.28 1.39 1.37 1.22 1.12
Brazilian real/dollar average 3.19 3.48 3.33 2.35 2.16
Brazilian real/dollar closing 3.31 3.26 3.90 2.66 2.34
Argentinean peso/dollar average 16.57 14.78 9.26 8.12 5.48
Argentinean peso/dollar closing 18.65 15.89 12.96 8.55 6.52
(1) World Gold Council standard, excludes stockpile write-offs. (2) The adjusted EBITDA calculation is based on the formula included in the revolving credit facility agreements for compliance with the debt covenant formula. (3) Includes attributable share of equity-accounted investments.
Ratios and statistics (continued)
Stronger currencies in South Africa and Brazil negatively impacted costs
INTEGRATED REPORT 2017 71

ECONOMIC VALUE-ADDED STATEMENTFor the year ended 31 December
Gold revenue by region – 2017
• South Africa
• Continental Africa
• Australasia
• Americas
$m1,101
1,895
709
1,104
Value retained per year(%)
16
20
18
20
202013
2014
2015
2016
2017
Breakdown of distribution – 2017
• Employees
• Government
• Community
• Suppliers
• Capital providers
%26
18
6
1
49
ECONOMIC VALUE-ADDED STATEMENTFor the year ended 31 December
Economic value distributed (82%) (1)
Supp
orti
ng b
usin
ess
obje
ctiv
es a
nd m
ater
ial i
ssue
s
Economic value generated (100%)
$m 2017 2016
Total distribution 3,735 3,408
A: Employees 1,002 858
Salaries and wages 966 823
Training and development 36 35
B: Government 659 656
Current tax (5) 176 234
Royalties (3) 114 101
Employee taxes (3) 268 237
Production, property and other taxes (3) 101 84
C: Community (4) 27 23
Social licence to operate
Region specific economic development programmes
D: Suppliers and services 1,839 1,691
Production costs
Corporate expenditure and other overheads
Rehabilitation expenditure
Exploration and evaluation
Audit, governance and assurance
D: Providers of capital 208 180
Finance cost and unwinding of obligations
169 180
Dividends 39 –
$m 2017 2016
Total income 4,558 4,263
Gold sales and by-products (2) 4,510 4,223
Interest received 15 22
Royalties received 18 9
Profit from sale of assets 8 4
Income from investments 7 5
$m 2017 2016
Tax per country (5)
South Africa 1 (2)
Argentina 46 51
Australia 28 24
Brazil 31 50
Ghana 14 13
Guinea 33 31
United States of America (16) (7)
Tanzania 41 72
Other (2) 2
Economic value retained (18%)
Value retained ($m)
Focus on people, safety, and
sustainability
Navigating regulatory and political risk
Managing community
expectations and demonstrating
contribution
Optimise overhead, costs and capital
expenditure
823 855
INPUTS OUTPUT (1) Economic distribution providing human, financial, social, natural and manufactured capital, guided by business objectives and material issues identified through the operating process to ensure sustainable long-term value retention for stakeholders, underpinned by our key behavioural programme operational excellence, implemented at every step of the business from exploration through the entire chain to divestment/disposal.
(2) Gold income increased by 7% as a result of a 1% increase in the gold price received and 5% increase in gold sales.
(3) Employee, production, property and other taxes and royalties reported on a cash basis.
(4) Community and social investments exclude expenditure by equity-accounted joint ventures.
(5) Current taxation includes normal taxation and witholding taxation on dividends paid per jurisdiction in which the group operates.
Across the group, we are due refunds for input tax and fuel duties totalling $252m (2016: $199m; 2015: $195m), including attributable amounts for equity-accounted joint ventures, which have remained outstanding for periods longer than those provided for in the respective statutes
A
B
C
D
INTEGRATED REPORT 2017 72

REGIONAL REVIEWS
SOUTH AFRICAOur South A f r i ca reg ion has undergone ex tens i ve res t ruc tu r ing to ensure i t s l ong- te rm sus ta inab i l i t y
Picture: Mponeng, South AfricaINTEGRATED REPORT 2017 73
REGIONAL REVIEWS CONTINUED
South Africa
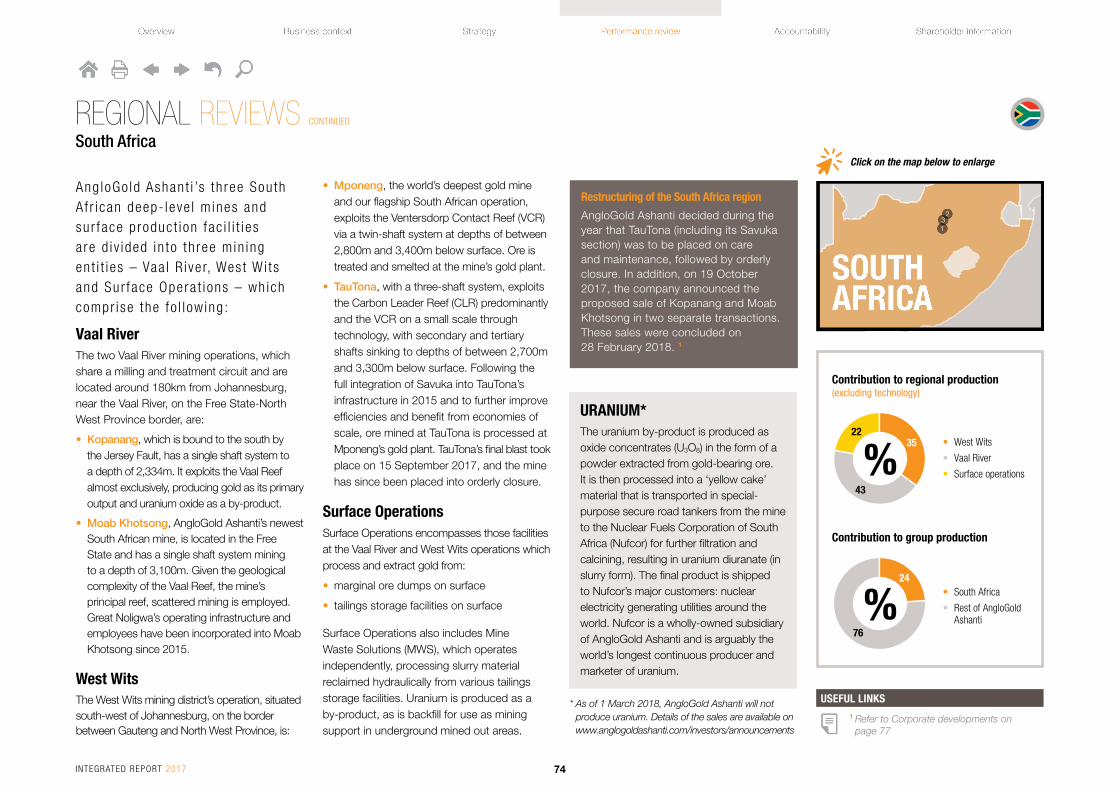
Ang loGo ld Ashant i ’s th ree South A f r i can deep- leve l m ines and sur face p roduc t ion fac i l i t i es a re d i v ided in to th ree min ing en t i t i es – Vaa l R i ve r, Wes t Wi ts and Sur face Opera t ions – wh ich compr ise the fo l l ow ing :
Vaal RiverThe two Vaal River mining operations, which share a milling and treatment circuit and are located around 180km from Johannesburg, near the Vaal River, on the Free State-North West Province border, are:
• Kopanang, which is bound to the south by the Jersey Fault, has a single shaft system to a depth of 2,334m. It exploits the Vaal Reef almost exclusively, producing gold as its primary output and uranium oxide as a by-product.
• Moab Khotsong, AngloGold Ashanti’s newest South African mine, is located in the Free State and has a single shaft system mining to a depth of 3,100m. Given the geological complexity of the Vaal Reef, the mine’s principal reef, scattered mining is employed. Great Noligwa’s operating infrastructure and employees have been incorporated into Moab Khotsong since 2015.
West WitsThe West Wits mining district’s operation, situated south-west of Johannesburg, on the border between Gauteng and North West Province, is:
• Mponeng, the world’s deepest gold mine and our flagship South African operation, exploits the Ventersdorp Contact Reef (VCR) via a twin-shaft system at depths of between 2,800m and 3,400m below surface. Ore is treated and smelted at the mine’s gold plant.
• TauTona, with a three-shaft system, exploits the Carbon Leader Reef (CLR) predominantly and the VCR on a small scale through technology, with secondary and tertiary shafts sinking to depths of between 2,700m and 3,300m below surface. Following the full integration of Savuka into TauTona’s infrastructure in 2015 and to further improve efficiencies and benefit from economies of scale, ore mined at TauTona is processed at Mponeng’s gold plant. TauTona’s final blast took place on 15 September 2017, and the mine has since been placed into orderly closure.
Surface OperationsSurface Operations encompasses those facilities at the Vaal River and West Wits operations which process and extract gold from:
• marginal ore dumps on surface
• tailings storage facilities on surface
Surface Operations also includes Mine Waste Solutions (MWS), which operates independently, processing slurry material reclaimed hydraulically from various tailings storage facilities. Uranium is produced as a by-product, as is backfill for use as mining support in underground mined out areas.
Restructuring of the South Africa region
AngloGold Ashanti decided during the year that TauTona (including its Savuka section) was to be placed on care and maintenance, followed by orderly closure. In addition, on 19 October 2017, the company announced the proposed sale of Kopanang and Moab Khotsong in two separate transactions. These sales were concluded on 28 February 2018. 1
URANIUM*The uranium by-product is produced as oxide concentrates (U3O8) in the form of a powder extracted from gold-bearing ore. It is then processed into a ‘yellow cake’ material that is transported in special-purpose secure road tankers from the mine to the Nuclear Fuels Corporation of South Africa (Nufcor) for further filtration and calcining, resulting in uranium diuranate (in slurry form). The final product is shipped to Nufcor’s major customers: nuclear electricity generating utilities around the world. Nufcor is a wholly-owned subsidiary of AngloGold Ashanti and is arguably the world’s longest continuous producer and marketer of uranium.
Contribution to regional production(excluding technology)
• West Wits
• Vaal River
• Surface operations %35
22
43
Contribution to group production
• South Africa
• Rest of AngloGold Ashanti %
24
76
Click on the map below to enlarge
* As of 1 March 2018, AngloGold Ashanti will not produce uranium. Details of the sales are available on www.anglogoldashanti.com/investors/announcements
USEFUL LINKS1 Refer to Corporate developments on page 77
INTEGRATED REPORT 2017 74

REGIONAL REVIEWS CONTINUED
South Africa
Key statisticsUnits 2017 2016 2015
Operational performance
Tonnes treated/milled Mt 38.9 39.6 36.8
Pay limit (1) oz/t 0.43 0.37 0.39
g/t 15.97 13.81 14.38
Recovered grade (1) oz/t 0.202 0.219 0.225
g/t 6.93 7.51 7.70
Gold production 000oz 903 967 1,004
Total cash costs $/oz 1,085 896 881
Total production costs $/oz 1,247 1,089 1,091
All-in sustaining costs (2) $/oz 1,245 1,081 1,088
Capital expenditure $m 150 182 206
Productivity oz/TEC 3.57 3.56 3.74
Safety
Number of fatalities 7 6 9
AIFR per million hours worked 12.68 12.02 10.81
People
Average no. of employees: total 26,245 28,507 28,325
– Permanent employees 22,738 25,205 25,274
– Contractors 3,507 3,302 3,051
Training and development expenditure $m 28 29 29
See footnotes overleaf
Production(000oz)
1,223
1,004
903
967
1,3022013
2014
2015
2016
2017
Productivity(oz/TEC)
4.40
3.74
3.57
3.56
4.472013
2014
2015
2016
2017
INTEGRATED REPORT 2017 75

REGIONAL REVIEWS CONTINUED
South Africa
Units 2017 2016 2015
Environment
Total water consumption ML 20,503 23,161 25,182
Total water use per tonne treated kL/t 0.527 0.586 0.685
Total energy usage PJ 10.05 10.54 10.65
Total energy usage per tonne treated GJ/t 0.26 0.27 0.29
Total GHG emissions 000t CO2e 2,733 2,864 2,756
Total GHG emissions per tonne treated t CO2e/t 0.070 0.073 0.075
Cyanide used t 10,122 9,672 9,573
No. of reportable environmental incidents 1 0 1
Total rehabilitation liabilities: $m 119 95 95
– restoration $m 18 15 18
– decommissioning $m 101 80 77
Community and government
Community expenditure (3) $m 6 5 6
Payments to government $m 118 106 105
– Taxation $m – – 4
– Withholding tax (royalties, etc.) $m 5 5 5
– Employee taxes and other contributions $m 105 93 89
– Property tax $m 3 4 3
– Other (includes skills development) $m 5 4 4
(1) Refers to underground operations only.(2) Excludes stockpile write-offs.(3) Includes corporate social investment expenditure.
Key statistics (continued)AIFR(per million hours worked)
11.85
10.81
12.68
12.02
12.632013
2014
2015
2016
2017
Total cash costs and all-in sustaining costs($/oz)
1,120849
1,064
1,0851,245
8811,088
8961,081
8502013
2014
2015
2016
2017
Total cash costs All-in sustaining costs
INTEGRATED REPORT 2017 76
Corporate developmentsEarlier in the year, AngloGold Ashanti signalled to stakeholders that it would review its South African mining operations in light of the heavy, and ultimately unsustainable losses being incurred. In June 2017, the company took a decision to restructure the South African assets, to focus on returning the South African business to profitability while mitigating job losses. Some of our older mines in the South Africa region have reached the end of their economic lives, several decades after they started production. These mines face systemic challenges, including the near depletion of their Ore Reserve, increasing mining depths and distance from central infrastructure, declining production profiles, and cost escalations that have continued to outpace both inflation and a subdued gold price. The affected mines are TauTona and Kopanang. Costs at these operations were making it uneconomical to continue mining, with the all-in sustaining costs incurred far exceeding the average gold price.
To safeguard the long-term sustainability of our South African business, after a complex and careful consultation process with all the relevant stakeholders 1, AngloGold Ashanti decided to:
• place on care and maintenance the Kopanang mine, a Vaal River operation, and both TauTona and the Savuka section of the TauTona mine, in the West Wits district. TauTona started mining operations in 1962, with the main shaft sunk in 1957. Savuka had been in operation since 1958, with its operating life already extended 10 years beyond what was originally envisaged. Kopanang produced its first gold 36 years ago
• evaluate the feasibility of integrating elements of TauTona into the neighbouring Mponeng mine.
After the announcement was made outlining our intention to restructure the South African business, unsolicited expressions of interest were received from several parties which ultimately led to the decision to sell Kopanang, the nearby West Gold Plant and related infrastructure to Heaven-Sent SA Sunshine Investment Company Limited (HSC), a Chinese capital management company headquartered in Hong Kong. HSC currently holds a 74% interest in Village Main Reef Limited which owns and operates the Tau Lekoa mine, also located in the Vaal River region. The sale transaction was concluded on 28 February 2018, having fulfilled all conditions precedent.
It was, however, eventually decided in the latter half of the year to place TauTona and Savuka on orderly closure.
Additionally, on 19 October 2017, AngloGold Ashanti announced that it had agreed to the disposal of the Moab Khotsong and Great Noligwa mines and related infrastructure, including the Great Noligwa processing complex, the Vaal River villages and AngloGold Ashanti’s interest in the Margaret Water Company to Harmony Gold Mining Company Limited (Harmony). This transaction was also subject to a number of conditions precedent, all of which were achieved in early 2018. Consequently, the Moab Khotsong and Great Noligwa sale transaction was concluded on 28 February 2018.
Resultantly, as of 1 March 2018, AngloGold Ashanti ceased to have underground mining operations in the Vaal River area. We will retain the long-life MWS tailings retreatment operation, as well as the surface rock-dump reclamation operations that will continue to be treated through the Kopanang gold plant which was also retained by AngloGold Ashanti. These two operations in the Vaal River region together with the long-life Mponeng mine
in the West Wits region will form AngloGold Ashanti’s operating base in South Africa, and are expected to account for about 13% of production in 2018.
Operational performanceProductionThe South African operations produced 903,000oz, a 7% decrease year-on-year as tonnes mined were affected by a poor start up to the year at all operations. Underground yield dropped 8% to 6.93g/t, a result of lower feed grades as well as higher dilution year-on-year. This was mainly due to an increase in waste tonnes at Moab Khotsong, moving away from higher grade areas at Mponeng, and the reclamation of the tailing storage facilities at the West Wits Surface Sources.
The decision to stop the loss-making operations in the third quarter further impacted full-year production. The final blast at TauTona took place on 15 September 2017 and the Section 189 consultation process with employees and their organised labour representatives, continued. At Kopanang, the Section 189 process happened in parallel with the pending disposal of the mine as was announced in October 2017.
REGIONAL REVIEWS CONTINUED
South Africa
USEFUL LINKS
1 Refer to Employee engagement on page 81
INTEGRATED REPORT 2017 77
The work ahead for the region will be mainly to drive productivity and other efficiency improvements in the mining cycle, work routines, compliance and face length generation and recoveries. The South Africa regional management team will also be focused on ensuring all support structures are properly aligned to the new, smaller production base, as they aim to return the region to profitability and positive cash generation.
At West Wits, production was lower than in the previous year at 315,000oz, mainly due to the slow start-up to the year following safety-related stoppages late the previous year. Production at Mponeng decreased year-on-year, mainly as a result of the planned mining of lower-grade areas, face-time constraints with mining occurring further away from shaft stations, as well as three separate seismicity-induced fatal accidents in the second half of the year. The mine’s performance improved towards the end of the second quarter through to the third quarter, due to improved efficiencies. Production highlights were a 4% increase in the mineable face length which allowed for more face-length flexibility. During the year, the average monthly face advance increased from less than 4.9m to more than 5.0m in June, which was maintained for the rest of the year. Mponeng’s yield improved in the last quarter of the year, to an average of 8.54g/t. Unfortunately, safety-related work stoppages
following the fatal accidents in late October and early November contributed to a disappointing decline in production in the last quarter.
At TauTona, severe production challenges, in addition to a depleted Ore Reserve and limited mining flexibility, compounded operational inefficiencies and low productivity, and led to the decision to place the mine into orderly closure. As mining areas moved further away from the main infrastructure towards the lower-grade eastern boundary of the mining lease, and areas with more complex geological structures and greater seismic risks, this resulted in greater inefficiencies and the natural decline in grades.
At the Vaal River operations, production improved by 4% year-on-year to 385,000oz. The main contribution was from Moab Khotsong where efficiencies improved and there were fewer safety-related disruptions, despite dilution and a lower mine call factor. At Kopanang, production remained flat year-on-year, impacted by safety-related interruptions following the fall-of-ground fatal incidents in the fourth quarter. However, volumes mined improved and implementation of the cycle mining strategy showed early signs of success.
Surface Operations’ production was up 3% at 192,000oz for the year. At Mine Waste Solutions, production was 18% higher at
REGIONAL REVIEWS CONTINUED
South Africa
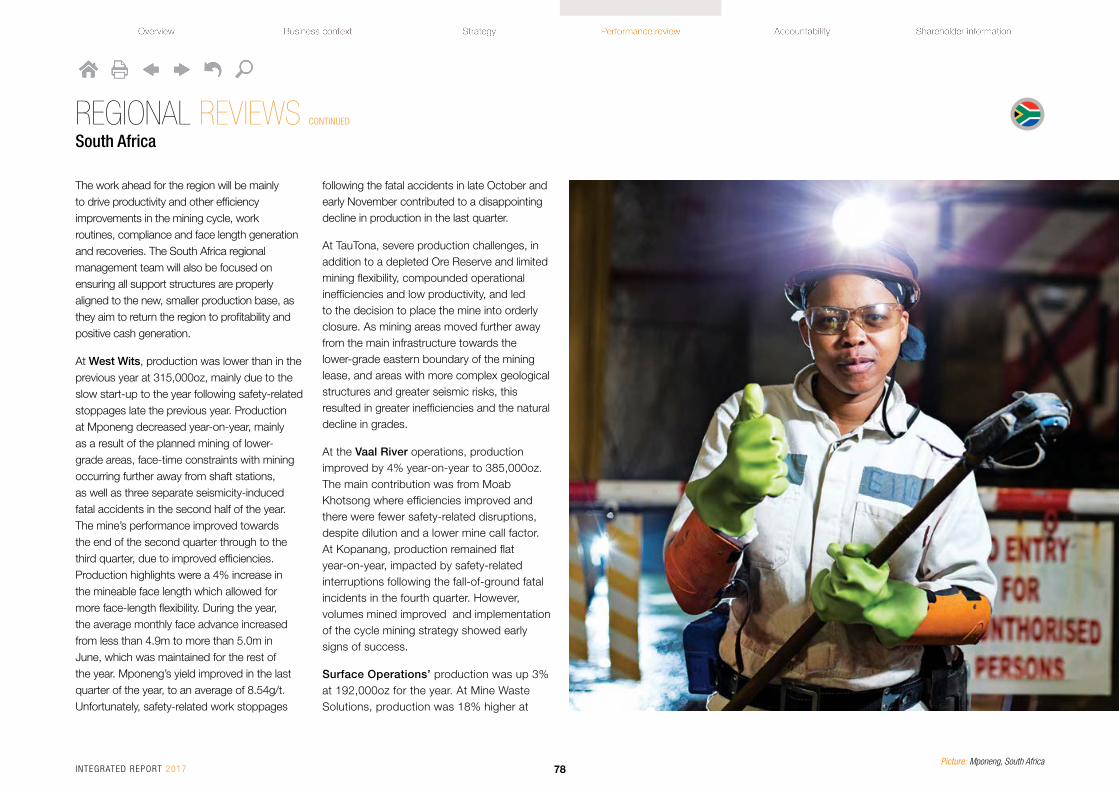
Picture: Mponeng, South AfricaINTEGRATED REPORT 2017 78

109,000oz compared with the same period in 2016, given the improvement in feed grades from the Sulphur Paydam and East tailing storage facilities (TSF), coupled with improved recoveries. The yield increase was as expected as the Sulphur Paydam is normally associated with higher reef values. Production was also boosted by higher volumes of floor cleaning material reclaimed. Gold recovery efforts improved in the last quarter of the year to around 7%, aided by reagent suite optimisation and improved carbon management. Operations at the flotation and uranium circuit remain suspended as investigations into improved water reticulation continue.
Production from hard rock dumps was lower owing to a drop in tonnage throughput, and lower recoveries due to the increased amount of clean-up material which is refractory in nature. The sticky nature of the material processed through the Surface Operations’ plants negatively impacted metallurgical efficiencies. Surface Operations’ production was also affected by the suspension of the Kopanang marginal ore dumps and reduced availability of the mill at the Kopanang gold plant.
CostsAll-in sustaining costs were 15% higher than 2016 at $1,245/oz. Total cash costs for the region increased to $1,085/oz compared with 2016, due to lower production volumes,
inflationary pressures and a 9% stronger rand on average against the dollar. In line with the company’s continued focus on improving efficiencies, a cost savings plan was adopted towards the end of 2016 to realise synergies from shared services among business units. This entailed, among others, the review of all commodity and service contracts to optimise agreements where possible and align related costs.
Growth and improvementMponeng Phases 1 and 2 ProjectMponeng’s mine life extension is initially executed through the Below 120 Level, Phase 1 project. Phase 1 aims to access deeper, higher-grade ore with the development of a decline access below the current secondary shaft. Phase 2, the next stage of the mine life extension, currently under evaluation, involves deepening the secondary shaft to further extend the life of mine.
Completion and full commissioning of Phase 1 is expected during 2018. An additional ventilation hole is being created from decline 3 to 116 level to create more ventilation capacity, along with an ore pass down to 126 level to ease ore handling logistics on 123 level. Completion of the water management infrastructure on 127 level was delayed during the last quarter of the year following flooding of the emergency pump station and pump station panels. The emergency
pump station is still under construction at the bottom of the decline system, with full commissioning expected in the second half of 2018. Construction and commissioning of the ore handling infrastructure to 126 level is expected to be completed by the end of the first half of 2018. The ramp-up to steady state Ore Reserve development is continuing. The revised geological resource model associated with the Ventersdorp Contact Reef is currently under review.
The Phase 2 feasibility study for the Mponeng LOM project has resumed, having been interrupted at the end of May 2017 to allow the geotechnical study to be completed to determine the most appropriate location of the infrastructure relative to tolerable levels of rock stress.
ZaaiplaatsThis project has now been sold together with Moab Khotsong mine, with effect from 1 March 2018.
Update on technology and innovation project
The technology project – which aims to safely mine all the gold, only the gold, all the time – continued to investigate all known rock fragmentation methods, with thermal spalling and other fast rock-breaking alternatives, were tested. Of these, thermal spalling yielded the most promising results for our rock types.
The thermal spalling – or rock-breaking – process consists of four activities – drilling, spalling, cleaning and backfilling. These activities are conducted in parallel, with each activity overlapping.
All aspects of the technology work being conducted have been suspended with the exception of thermal spalling, and test work on high-strength backfill at Mponeng. Thermal spalling trials will continue in 2018.
In support of the Mining Phakisa industry initiative, AngloGold Ashanti will make available any technologies developed, as agreed, for future redeployment and continued development by interested parties associated with the Phakisa process.
Capital expenditureSustaining capital was spent across all sites. Growth capital investment was focused mainly on the Mponeng Phase 1 project, as construction and commissioning of the ore handling infrastructure to 126 level continued. However, total capital expenditure for the region decreased 18% year-on-year as a result of cost curtailments in line with the suspension of operations and restructuring of the South African asset base, which included the expensing of certain capital costs at TauTona and Kopanang, and a delay in starting the Mponeng Phase 2 LOM extension project.
REGIONAL REVIEWS CONTINUED
South Africa
INTEGRATED REPORT 2017 79

Sustainability performanceSafetySafety – our first value – focuses on the well-being of our employees and their protection from hazardous exposure define who we are and how we conduct our business.
AngloGold Ashanti had recorded three consecutive fatality-free quarters for the first time in its history, prior to the first fatality of the year in July 2017. During the course of 2017, the South African ultra-deep mines posted a record 349 fatality-free days. In the West Wits, TauTona achieved a year without a fatality, while Mponeng, for the first time in its history, recorded 2 million fatality-free shifts. In the Vaal River, Moab Khotsong recorded 500,000 fatality-free shifts during November 2017, while Kopanang and Surface Operations achieved one, and two million fatality-free shifts respectively.
The South Africa region received the MineSAFE’s highest award in 2017 for the most improved safety performance. MineSAFE, an industry body, is a collaboration between mining companies, employee bodies and the South African DMR.
This improved safety performance was a result of the progressive implementation of the safety strategy. The main areas of focus of this strategy is to reduce the risk of fatalities by ensuring that every employee understands and continuously manages hazards and associated
REGIONAL REVIEWS CONTINUED
South Africa
Regrettably, the good start to the year was marred by seven fatalities in the second half.
• Three of these fatalities occurred at the Vaal River operations:
Moab Khotsong – Mr Elias Quive was injured in a tramming incident in March and regrettably passed away almost four months after the incident.
Kopanang – Messrs Nkolisi Sibeko and Peter Ngobeni lost their lives in a fall-of-ground incident in October.
• Four seismicity-related fall-of-ground fatal accidents occurred at the West Wits operations in the last quarter of the year, two in October and two in November:
Mponeng – Messrs. Ramabele Sebophe and Tseko Ramokobo succumbed to injuries sustained during two separate incidents while Messrs. Mapheelle Tauoa and Zwelinjane Khubone succumbed to injuries sustained in another working area.
We extend our deepest condolences to the families, friends and colleagues of the departed.
risks and that they comply with set work routines, that critical controls are in place, and that high potential incidents are diligently reported and addressed, while making optimal use of technology to reduce risk profiles.
Picture: Mponeng, South AfricaINTEGRATED REPORT 2017 80

The all-injury frequency rate (AIFR), the broadest measure of workplace safety, was 12.68 for 2017 (2016: 12.02) per million hours worked. Efforts are continuously underway to improve our safety performance in line with the company’s values and safety strategy.
Further mitigation measures were identified post the fatal incidents. In relation to the tramming incident, further engineering controls have been identified, including remote signalling devices for drivers to signal while outside the cabin and also to detect whenever the driver trips and/or stops the locomotive. Following the fall-of-ground incidents, additional controls were identified around the layout and design of excavations in relation to structures as well as an increased focus on, and additional skills at start-up risk assessments. Mitigation measures are in place to avoid any recurrences of these fatal accidents. These are set out in the section People are the Business 1.
Employee engagementEmployee transition frameworkOur employee engagement process in South Africa has mainly made use of the Plenary – a forum at which management and our employees’ organised labour representatives meet to discuss actions to give effect to the employee transition framework. This framework integrates policies, procedures and principles to guide the optimal application of human resources management in a rapidly evolving business and social environment.
Given the South Africa region’s restructuring, explained above, discussions with respect to employees affected by transfers, contracting of certain non-core functions, or by redundancy, are held and managed through these forums. In line with our regulatory obligations in terms of our Social and Labour Plans, we also make use of the joint management and organised labour Future Forum for discussion. Each operating unit has a labour management committee in place to implement the decisions taken at Plenary or in Future Forum sessions.
Restructuring and labour relationsThe South Africa region faced restructuring and downscaling of operations for the better part of the year.
Despite a complex and a sensitive operating environment, the labour relations climate remained stable throughout the year. The participation of all unions in the intensive restructuring process which was undertaken without any strike action, is an indication of the nature of the working relationship between management and unions, as supported by the company’s relationship-based labour relations model.
The initial restructuring process began early in 2017 when a section 189(3) notice was issued in terms of the Labour Relations Act 66 of 1995 (LRA) to terminate the employment of 849 employees, as informed by the 2017 budgetary requirements. The process was facilitated by the Commission of Conciliation Mediation and Arbitration (CCMA). This followed intensive engagement with unions and regulators, in terms of section 52 of
the Mineral and Petroleum Resources Development Act (MPRDA). All parties agreed to reduce the impact of job losses – by means of including voluntary severance packages and transfers – resulting in only 21 employees being dismissed for operational requirements, in accordance with the LRA.
Following the announcement on 28 June 2017 to restructure some of the South African mines, to put some operations on care and maintenance, further engagement was held with employees’ labour representatives, the DMR at national and regional level, local communities (NPOs, NGOs and youth), small, medium and micro enterprises (SMMEs) as well as the local municipalities in host communities and major labour-sending areas. The main purpose of this engagement was to inform stakeholders of developments at our mines and to address matters relating to the transfer of TauTona and Kopanang’s Social and Labour Plan (SLP) obligations, their environmental programmes and mining rights as well as the transfer of some employees to the new owners of the mine.
REGIONAL REVIEWS CONTINUED
South Africa
USEFUL LINKS1 Refer to People are the Business, on
page 36
INTEGRATED REPORT 2017 81

Subsequently, a section 189 process began with notices given to affected employees. This restructuring process was also facilitated by the CCMA, and involved an in-depth consultative process and adherence to all applicable legislation.
One of the conditions precedent in the sale agreement for Kopanang was for the new owners to conclude an agreement with AngloGold Ashanti and employees’ labour representatives to determine the number of existing employees who would continue to work at the operation after the change in ownership comes into effect. This agreement was concluded on 16 November 2017, and resulted in 3,054 employees, of the total workforce of 3,638, or 84% being transferred to the buyer, HSC. AngloGold Ashanti honoured its undertaking to pay accrued severance packages to all affected employees at Kopanang immediately following the conclusion of the sale transaction.
Extensive engagement, discussions and negotiations were held during the year around the planned restructuring. The outcomes of and/or commitments resulting from these engagements are set out alongside:
REGIONAL REVIEWS CONTINUED
South Africa
Stakeholder Engagement/response
Regulator Engagements were held with local, provincial and national government; trade union representatives; host communities and civil society organisations; and small, medium and micro enterprises (SMMEs). The issues covered ranged from the repositioning of AngloGold Ashanti’s South African operations, to the status of our compliance with our mining rights, in particular our mine works, environmental, and SLPs, and the impact of the restructuring on employment in communities.
• A detailed presentation was given during an MPRDA Section 52 investigative process following announcement of the proposed downscaling
• AngloGold Ashanti is committed to meet all relevant SLP commitments
• Planned actions were provided to the regulator with regards to the downscaling and subsequent impacts
• Detailed audit was conducted and site visits held for the top 100 suppliers to assess BEE compliance
• Workshops were conducted with top suppliers to address regulatory requirements for transformation, and punitive measures applied by the BEE Commission.
Community • Given the deteriorating employment climate and the downscaling of operations in the region, enterprise development centers (EDCs) are being established to provide opportunities for youth and SMMEs
• Youth were invited to attend SMME and senior management briefings to aid in understanding the company’s processes and of the opportunities available
• Training and development provided for SMMEs on business plans, market research, statutory business compliance relating to tax regulations and company registration through the EDCs
• Information on how to use the on-line portal were provided through the EDCs
• Feedback given on community portable skills training, as well as the bursary and internship programmes that run annually, including qualifying criteria
• Community engagements were attended by representatives from the DMR, local municipality and the operations to gain an understanding of issues related to the sale of the operations. Key issues discussed were how environmental liabilities would be managed and the model/entity to be developed for the benefit of the communities. These discussions are still underway
• Social and Institutional development proposals from the community were considered, in terms of funding guidelines for NGOs and NPOs, and were presented at community briefings during the year
• Workshops and training provided to NGOs to ensure compliance with the regulations of the Department of Social Development, South African Revenue Services (SARS) and other agencies were also conducted
• Detailed presentations given on company’s progress on how to access procurement opportunities
INTEGRATED REPORT 2017 82

Stakeholder Engagement/response
Local municipalities AngloGold Ashanti has assured stakeholders and the community that all commitments made in its SLPs will be met. Projects relating to educational programmes, infrastructure, enterprise development, community human resource programmes and income-generating projects were delivered to the two new mine owners of the Vaal River operations for implementation
Following the Constitutional Court decision on 1 November 2016, that a dispute regarding the water surcharge levied by Merafong Municipality should be remitted to the High Court, the valuation appeal board ruling in favour of the appeal on the matter by the three mining companies (AngloGold Ashanti, Harmony and Sibanye-Stillwater), referred the matter to the High Court. The court is yet to set the hearing date. In view of the delays in hearing the matter in 2017, it is expected that the matter will be heard in 2018
REGIONAL REVIEWS CONTINUED
South Africa
HealthEmployee wellnessGiven the nature of ultra-deep, hard-rock,
labour-intensive gold mining, the industry
faces a variety of health challenges and
workplace risks that are compounded by
certain diseases prevalent in Southern Africa,
including occupational lung disease and HIV/
AIDS. A high-level assessment (covering
contributory causes, consequences and
critical controls) of health risks in the South
Africa region has been incorporated into the
company’s ‘health risk architecture’. Also see
<SDR> for more information.
The all occupational diseases frequency rate
(AODFR) for 2017 was 12.39 per million hours
worked (2016: 11.8). The increase is attributed
mainly to gradually rising rates of dysbarism/
barotrauma. This is a spectrum pressure-
related injury to the middle ear following rapid descent or ascent in deep level mines.
The AODFR also includes silicosis, occupational tuberculosis (TB), noise-induced hearing loss (NIHL) and all heat-related illnesses. A total of 778 (2016: 823) cases of occupational disease were reported during 2017, of which 54 cases were NIHL; 255 occupational TB; 105 heat illness; 257 barotraumas; and 107 silicosis. New TB and HIV rates remain at their lowest levels in more than a decade. Sick leave rates remain stubbornly high in a working population with a high incidence of chronic diseases. While NIHL rates increased in the past two years, they have now stabilised.
Early NIHL trends are, however, improving due to the use of personalised hearing protection devices, which provide increased
protection for employees exposed to high-risk areas in the workplaces. These devices help dampen or eliminate harmful frequencies. Employees are tested regularly and as a result are aware of their hearing status and causes of hearing loss, if any, through ongoing coaching sessions.
By 2017, new cases of HIV and TB had declined by some 70% over the past decade. New cases of HIV (laboratory confirmed cases) declined from 4.7% in 2005 to 1.3% in 2017, and new TB cases have declined from 3.02% in 2005 to 1.1% in 2017. Much of this sustained success in both TB and HIV can be attributed to integrated health programmes across the business, including effective screening, diagnosis and treatment programmes, improved dust suppression on the mines, effective housing and accommodation
HIV cases declined from
4.7% 1.3%2005 2017
New TB cases declined from
3.02% 1.1%2005 2017
Picture: Mponeng, South AfricaINTEGRATED REPORT 2017 83

strategies in the region, with a drive to provide family accommodation and private rooms instead of shared accommodation, along with a declining dependency on migrant labour.
Incidence rates for these two diseases, which are inextricably linked, have shown sustained and very encouraging improvements over the past 12 years, and rates are now approaching national averages in the country. For more information on the work done to eradicate TB through the Masoyise iTB campaign, see the <SDR>.
Early silicosis cases remain at historically low levels. Dust control measures continued to be effective and our operations exceeded the South African Mine Health and Safety Council’s milestones for dust control. Further details on this are available in the <SDR>.
Total health expenditureIn 2017, about R864 million was spent on health and wellness programmes in the region, of which almost 50% was spent on clinics and hospitals through AngloGold Ashanti Health. The balance was spent on various medical insurance and compensation costs for occupational and non-occupational injuries and illnesses affecting our employees.
Going forward, AngloGold Ashanti has adopted a high-level strategy to outsource health services in a phased approach. The
proposed approach has been presented to organised labour at various employee engagement forums.
In line with restructuring at the South African operations, the planned closure of in-patient services at Western Deep Levels (WDL) hospital – including theatres, intensive care unit and high-care, three wards, and hospital kitchen – was completed by 31 August 2017, with a simultaneous reduction in support services. A total of 184 positions were affected, and all elected to take voluntary severance packages, avoiding the need for forced retrenchments. Iterileng Medical Station in Vaal River was closed. Some patients were transferred to a new, high quality care facility in Welkom for the requisite healthcare. The closures of the Savuka and TauTona medical stations were successfully completed.
Preliminary plans are in place for an integrated health clinic at Mponeng that will include occupational health, primary health, and emergency response services.
Working group on silicosis Settlement negotiations between the Occupational Lung Disease Working Group and the class action’s legal representatives have reached an advanced stage. More detail on the OLD Working Group is provided in Our material concerns and external environment section. 1
EnvironmentEnvironmental risks are fully incorporated in our business risk management process, operational environmental management systems and regulatory obligations around environmental impact. Principal environmental risks in the region relate to groundwater pollution from tailings storage facilities and the risk of mine flooding from abandoned neighbouring mines. The long-term risk of groundwater pollution is largely mitigated by the ongoing reclamation of tailings storage facilities and waste rock dumps and the subsequent rehabilitation of footprints.
In addition to the physical risk of flooding of current operations, there is the financial burden of pumping water from underground and the potential future liabilities. The risk of mine flooding has been mitigated by ongoing pumping of underground water, directly or indirectly at Margaret Shaft and Great Noligwa in the Vaal River and at Covalent and Savuka in West Wits. As disclosed above, our interest in the Margaret Water Company was sold with effect from 28 February 2018. The bulk of the water evacuated in the Vaal River area is used for tailings reclamation by Mine Waste Solutions, which will continue, while the water at Covalent is discharged into a local water catchment to water quality standards, in line with the Department of Water and Sanitation’s directive. AngloGold Ashanti has developed conceptual post-mining water management
REGIONAL REVIEWS CONTINUED
South Africa
USEFUL LINKS1 Refer to Our material concerns and
external environment, on page 26.
plans and we remain confident that underground water could form an important part of the local water supply resource when mining in the area has ceased. We continuously engage with regulators through the Government Task Team (GTT) for Mine Closure and Water Management to ensure that all mining companies collaborate and take accountability for mine flooding and regional mine water management obligations.
The pending regulations on provisions for financial closure, expected to come into effect in February 2019, continued to dominate the focus of mine closure planning in the region. The mining industry, in collaboration with the Chamber of Mines Environmental Policy Committee, continued its efforts to influence development of the regulations and most recent drafts published by the regulator are significantly more amenable to the industry than the initial revision. See Planning for closure.
Operationally, we continued with concurrent rehabilitation efforts on reclaimed tailings footprints, as well as the demolition of redundant infrastructure. For example, demolition work on the East Gold, Acid and Flotation plants in the Vaal River region was near completion by the
INTEGRATED REPORT 2017 84
end of 2017. Initiatives to explore alternative land use and to optimise current land use are ongoing. The region continues to explore commercial agriculture projects for a broad-based livelihood in the area.
Further, as part of the rehabilitation efforts, a prefeasibility study is underway to test the use of reclaimed tailings footprints and impacted land for biofuel production. One of the tailings footprints in the Vaal River has been successfully planted with specifically selected vegetation suitable for biofuel. More than 400ha of previously established phytoremediation projects (Woodlands) in the Vaal River and West Wits areas also continue to be maintained in collaboration with Wits University Enterprise.
Climate changeIn South Africa, the second draft of the proposed Carbon Tax Bill was released in December 2017, and is expected to come into effect from 1 January 2019. It is anticipated that the main exposure to carbon tax will be through the increased cost of electricity purchased from the national utility provider, Eskom. Carbon tax on liquid fossil fuels used in the region will be imposed at source, in addition to current
fuel taxes. Although the initial carbon tax rate proposed is approximately $10/t CO2 -e during the first phase, which ends on 31 December 2022, a series of allowances will reduce the effective rate to between $0.50/t and $4/t.
Employee and community development workEmployee development, training and succession planningIn accordance with the employee transition framework, and as part of the region’s integrated human resources strategy to achieve its business goals during 2017, great emphasis was placed on the training and development of employees and community learners. The region’s technical training centres have all been upgraded with new technology and a more consolidated approach to training adopted for safe and efficient production. All technical training centres underwent external audits in the third quarter, and all received ISO 9001, ISO 14001 and OHSAS 18001 re-accreditation, with zero non-conformances.
The supervisory and managerial leadership training programmes have been revised with programmes such as the Advanced
Managerial Leadership Development Programme, now linked to our integrated talent management and succession planning framework, ensuring that the correct people receive appropriate training, as required. Each general manager manages a business unit talent pool and succession plan. The South Africa region’s Chief Operating Officer has a regional plan aligned with the Chief Executive Officer’s global talent pool. The focus is now on employee retention and development of the skills required for the restructured South Africa region to function optimally.
Home ownership and propertiesAs an expression of our commitment to create a conducive living environment for employees and communities in the areas in which we operate, and in line with our obligations under the Mining Charter 2014, AngloGold Ashanti continues to roll-out the employee home-ownership scheme in the South Africa region. Employees have demonstrated high levels of interest in owning houses, and some employees have already purchased previously company-owned houses. Given the restructuring of operations underway in the region, some concessions were made to enhance affordability.
REGIONAL REVIEWS CONTINUED
South Africa
Picture: Vaal River, South AfricaINTEGRATED REPORT 2017 85

In addition, the local municipality has expressed support for our project to develop vacant land for a housing project that will benefit employees and members of the community in the area. The project is to be developed in partnership with the Merafong City Local Municipality, Gauteng Human Settlements Department and the National Housing Development Agency. AngloGold Ashanti and the Housing Development Agency are currently undertaking administrative and legal processes to initiate the project.
The restructuring of operations in the region also enabled the company to make donations to the National Department of Public Works in support of the community. These include land donated for the satellite Wedela Police Station, with an estimated market value of R385,000, as well as The Orkney Golf Club, with a municipal valuation of R3 million, which was successfully registered as a Section 21 company on behalf of the Orkney Golf Players Association for the benefit of the community and its members.
Enterprise developmentDuring the year, AngloGold Ashanti established enterprise development centres (EDC) in Merafong and Matlosana. These EDCs aim to incubate existing and new SMMEs, thereby creating and sustaining employment opportunities. The centres assist in introducing new enterprises into the area, while also
identifying, developing, enabling and mentoring established and upcoming entrepreneurs. The Matlosana EDC was opened in March 2017, and the Merafong EDC in June 2017. Details on the work done in these centres; as well as efforts undertaken by AngloGold Ashanti to create shared value through socio-economic development in the Eastern Cape labour-sending area are available in the <SDR>.
Regulatory updateRegulatory matters in 2017 focused primarily on negotiations through the Chamber of Mines, related to the reviewed Mining Charter.
The hearing of the Chamber of Mine’s court application on the reviewed Mining Charter, which was set for 19-21 February 2018 was postponed. The reviewed Mining Charter, which became effective in June 2017, only to be suspended by mutual consent between the industry and government pending judicial review, was subsequently withdrawn. Stakeholders agreed to negotiate a new document, with the hopes of addressing significant concerns expressed by the industry, through the Chamber of Mines, organised labour groups, and an array of mining-affected communities.
The court application was postponed on the basis of the Presidency’s commitment
to resolving and to facilitate a process of developing a new Mining Charter by way of negotiations, inclusive of all stakeholders such as government, business, labour and communities in the interests of the industry and the country as a whole.
The newly appointed Minister of Mineral Resources, Gwede Mantashe, has committed to more inclusive engagements to resolve the impasse that followed the Charter’s initial publication. Regarding compliance with the 2010-2014 Charter, AngloGold Ashanti has met and even exceeded certain targets. 1
The overarching legislation governing the mining industry in South Africa is the Mineral and Petroleum Resources Development Act 28 of 2002. The Minerals Petroleum and Resources Development Amendment (MPRDA) Bill was first published in 2012 and an amended Bill was subsequently published in 2013 (“the 2013 Bill”). There are continuing differences of opinion on the constitutionality of some of the Bill’s provisions, a matter that the Chamber of Mines raised during the consultation process. The 2013 Bill was passed by the National Assembly on 12 March 2014, passed by the National Council of Provinces (NCOP) on 27 March 2014, and then sent to the President of the Republic of South Africa (President) for assent. On 16 January 2015, the President referred
the 2013 Bill back to the National Assembly to accommodate his reservations around the constitutionality of the 2013 Bill.
On the overall content of the Bill, we had engagements with the DMR focused on crafting legislation that would promote all aspects of the mining industry, bring as much certainty as is practicable and ultimately bolster investor confidence. On 5 October 2017, the President issued a statement noting that he was still waiting for Parliament to finalise the 2013 Bill. On 21 November 2017, the Chairman of the NCOP select committee on land and mineral resources announced that the NCOP was aiming to conclude its processes on the 2013 Bill in January or February 2018. With the recent changes in government, this process has been delayed. The South African mining industry remains fully committed to transformation undertaken in a manner that sustains and supports the industry, and does not undermine the laudable goals of the MPRDA 2013 Bill, and in order to meet the vision of the government’s National Development Plan.
REGIONAL REVIEWS CONTINUED
South Africa
USEFUL LINKS1 See: www.anglogoldashanti.com/
sustainability/reports/
INTEGRATED REPORT 2017 86

REGIONAL REVIEWS CONTINUED
Continental Africa
CONTINENTAL AFRICAImproved p roduc t ion in the Cont inen ta l A f r i ca reg ion enhanced i t s overa l l con t r ibu t ion to g roup per fo rmance
Picture: Iduapriem, GhanaINTEGRATED REPORT 2017 87
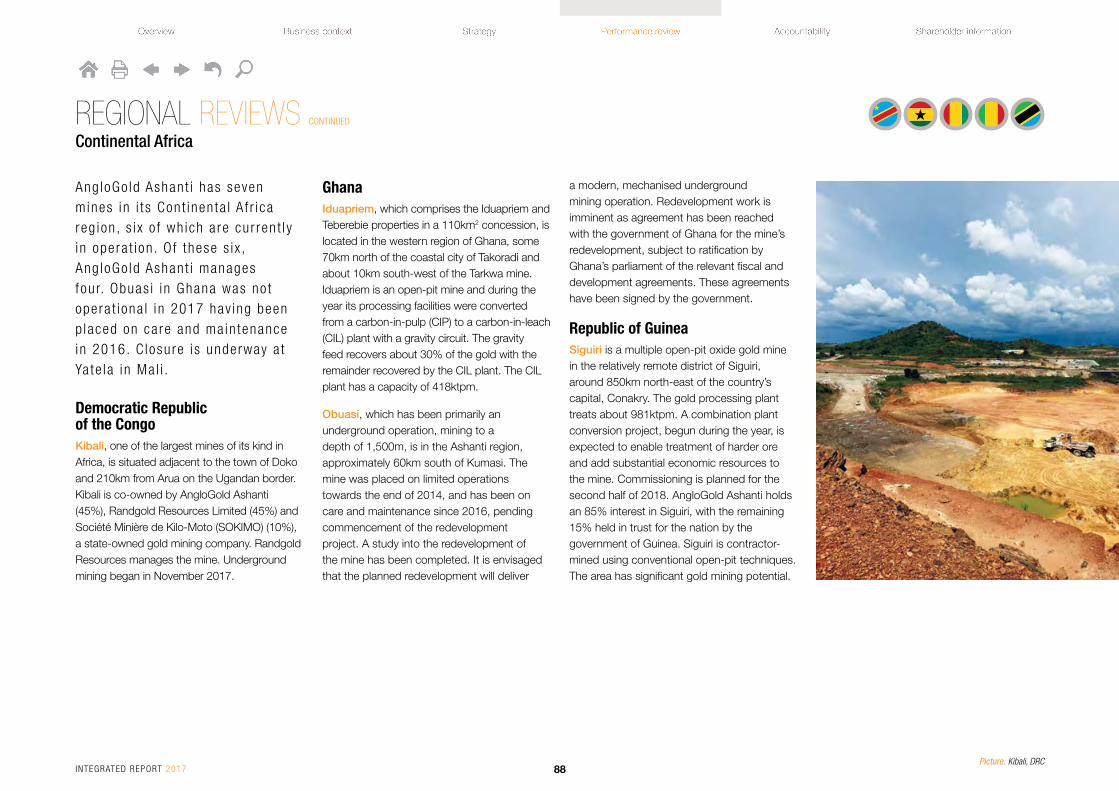
Ang loGo ld Ashant i has seven mines in i t s Cont inen ta l A f r i ca reg ion , s i x o f wh ich a re cur ren t l y in opera t ion . O f these s i x , Ang loGo ld Ashant i manages four. Obuas i in Ghana was no t opera t iona l in 2017 hav ing been p laced on care and ma in tenance in 2016. C losure i s underway a t Ya te la in Ma l i .
Democratic Republic of the CongoKibali, one of the largest mines of its kind in Africa, is situated adjacent to the town of Doko and 210km from Arua on the Ugandan border. Kibali is co-owned by AngloGold Ashanti (45%), Randgold Resources Limited (45%) and Société Minière de Kilo-Moto (SOKIMO) (10%), a state-owned gold mining company. Randgold Resources manages the mine. Underground mining began in November 2017.
Ghana Iduapriem, which comprises the Iduapriem and Teberebie properties in a 110km2 concession, is located in the western region of Ghana, some 70km north of the coastal city of Takoradi and about 10km south-west of the Tarkwa mine. Iduapriem is an open-pit mine and during the year its processing facilities were converted from a carbon-in-pulp (CIP) to a carbon-in-leach (CIL) plant with a gravity circuit. The gravity feed recovers about 30% of the gold with the remainder recovered by the CIL plant. The CIL plant has a capacity of 418ktpm.
Obuasi, which has been primarily an underground operation, mining to a depth of 1,500m, is in the Ashanti region, approximately 60km south of Kumasi. The mine was placed on limited operations towards the end of 2014, and has been on care and maintenance since 2016, pending commencement of the redevelopment project. A study into the redevelopment of the mine has been completed. It is envisaged that the planned redevelopment will deliver
a modern, mechanised underground mining operation. Redevelopment work is imminent as agreement has been reached with the government of Ghana for the mine’s redevelopment, subject to ratification by Ghana’s parliament of the relevant fiscal and development agreements. These agreements have been signed by the government.
Republic of Guinea Siguiri is a multiple open-pit oxide gold mine in the relatively remote district of Siguiri, around 850km north-east of the country’s capital, Conakry. The gold processing plant treats about 981ktpm. A combination plant conversion project, begun during the year, is expected to enable treatment of harder ore and add substantial economic resources to the mine. Commissioning is planned for the second half of 2018. AngloGold Ashanti holds an 85% interest in Siguiri, with the remaining 15% held in trust for the nation by the government of Guinea. Siguiri is contractor-mined using conventional open-pit techniques. The area has significant gold mining potential.
REGIONAL REVIEWS CONTINUED
Continental Africa
Picture: Kibali, DRCINTEGRATED REPORT 2017 88

Mali Morila is a joint venture between AngloGold Ashanti and Randgold Resources, in which each has a 40% interest. The remaining 20% is held by the government of Mali. Randgold Resources manages the mine. Morila is situated 280km south-east of Bamako, the country’s capital. The mine had completed mining in 2009 and transitioned to a tailings storage treatment operation at the end of 2016. Although the mine has been a tailings treatment operation, after the discovery more recently of additional economic ore, limited mining operations have resumed. The higher-grade ore being mined will partly replace the tailings storage treatment. The plant, which incorporates a conventional carbon-
in-leach (CIL) process with an upfront gravity section to extract the free gold, has an annual throughput capacity of 5.5Mt.
Sadiola is a joint venture between AngloGold Ashanti (41%) and IAMGOLD (41%). The government of Mali owns the remaining 18%. The Sadiola mine is situated in south- western Mali, 77km south-southwest of the regional capital Kayes. On-site surface infrastructure includes a 4.9Mt per annum CIL gold plant, where the ore is eluted and smelted. The mine, which began operating in 1996, has multiple open-pits and the mining operation is nearing the end of its economic life on the oxide Mineral Resource. Discussions continue with the government of Mali regarding the Sadiola sulphides project,
which is expected to enable the plant to
process sulphide ore.
Tanzania Geita, one of our flagship mines, is located
in northwestern Tanzania, in the Lake Victoria
goldfields of the Mwanza region, about 120km
from Mwanza and 4km west of the town of
Geita. The Geita gold deposit is mined as a
multiple open-pit and underground operation,
with the underground operation having begun
in 2016. The mine will continue to operate as
a mixed open-pit and underground operation
until the entire economic open-pit Mineral
Resource is exhausted. The mine is currently
serviced by a CIL processing plant with an
annual capacity of 5.1Mt.
REGIONAL REVIEWS CONTINUED
Continental Africa
Contribution to regional production
• Tanzania
• Ghana
• Guinea
• DRC
• Mali
% 37
1622
196
Contribution to group production
• Continental Africa
• Rest of AngloGold Ashanti % 39
61
Click on the map below to enlarge
Picture: Geita, TanzaniaINTEGRATED REPORT 2017 89

REGIONAL REVIEWS CONTINUED
Continental Africa
Key statisticsUnits 2017 2016 2015
Operational performance
Tonnes treated/milled Mt 28.0 27.6 27.2
Pay limit oz/t 0.040 0.035 0.036
g/t 1.367 1.199 1.233
Recovered grade oz/t 0.047 0.043 0.053
g/t 1.61 1.49 1.64
Gold production (attributable) 000oz 1,453 1,321 1,435
Total cash costs $/oz 720 717 678
Total production costs $/oz 1,012 1,005 900
All-in sustaining costs (1) $/oz 953 904 815
Capital expenditure (2) $m 409 291 315
Productivity oz/TEC 23.01 20.70 20.61
Safety
Number of fatalities 0 0 1
AIFR per million hours worked 0.39 0.51 0.50
People
Average no. of employees: total 13,593 12,691 11,942
– Permanent employees 5,467 5,331 5,061
– Contractors 8,126 7,360 6,881
Training and development expenditure $m 5 3 3
See footnotes overleaf
Production(000oz)
1,597
1,435
1,453
1,321
1,4602013
2014
2015
2016
2017
Productivity(oz/TEC)
14.36
20.61
23.01
20.70
9.972013
2014
2015
2016
2017
INTEGRATED REPORT 2017 90

REGIONAL REVIEWS CONTINUED
Continental Africa
Units 2017 2016 2015
Environment
Total water consumption ML 16,651 11,911 16,931
Total water use per tonne treated kL/t 0.614 0.428 0.603
Total energy usage PJ 9.16 8.46 8.41
Total energy usage per tonne treated GJ/t 0.34 0.30 0.30
Total GHG emissions 000t CO2e 666 682 694
Total GHG emissions per tonne treated t CO2e/t 0.025 0.025 0.024
Cyanide used t 7,274 7,693 8,405
No. of reportable environmental incidents 2 0 2
Total rehabilitation liabilities: $m 431 430 425
– restoration $m 253 262 261
– decommissioning $m 178 168 164
Community and government
Community expenditure $m 9 8 6
Payments to government $m 331 260 291
– Dividends $m 10 13 12
– Taxation $m 114 76 97
– Withholding tax (royalties, etc.) $m 98 79 85
– Other indirect taxes and duties $m 47 25 24
– Employee taxes and other contributions $m 51 46 52
– Property tax $m 1 1 1
– Other (includes skills development) $m 10 20 20
(1) Excludes stockpile write-offs.(2) Includes attributable share of equity-accounted investments.
Key statistics (continued)AIFR(per million hours worked)
1.56
0.50
0.39
0.51
1.972013
2014
2015
2016
2017
Total cash costs and all-in sustaining costs($/oz)
1,202783
968
720953
678815
717904
8692013
2014
2015
2016
2017
Total cash costs All-in sustaining costs
INTEGRATED REPORT 2017 91

Operational performance ProductionThe Continental Africa region delivered a sterling performance during 2017 with a 10% increase in production compared to the previous year. Exceptional production performances recorded at Siguiri, Iduapriem and Geita offset lower output from Sadiola, which has limited operational flexibility, mining its last remaining oxide Mineral Resource.
At Kibali, tonnage throughput increased by 4% in 2017 to record levels. Gold production at 268,000oz in 2017 reflected the significantly improved performance in the second half of the year. This was boosted by an increase in both open-pit and underground ore tonnes mined following the successful commissioning of the underground materials handling system and optimal use of the shaft, facilitating the increase in higher grade ore from underground. Improved plant availability and recovery rates also contributed to increased throughput and were boosted by additional ultra-fine grind and Pumpcell capacity. Using the Pumpcell amongst other things, helped facilitate the treatment of 100% sulphide ore at the processing plant where it was processed solely for extended periods, achieving design recovery and above-design throughput. This resulted in higher volumes of ore being treated and 2%
increase in production. In the underground mine, operational challenges compounded by underutilisation of the ore pass system, continued during the year and resulted in the treatment of lower grade ore at the expense of the high-grade underground ore.
Geita’s production increased by 10% compared to 2016, driven by a 14% increase in recovered grade, a result of the higher-grade ore mined at Nyankanga Cut 7 and Cut 8. Underground ore sources were in line with the mine plan while maiden underground operations were ramping up toward commercial volumes. Plant throughput achieved was above plan owing to the increase in the oxide feed and finer fragmentation resulting from the increased running time of the secondary and tertiary crusher circuits. The transition to underground operations continued with four areas being mined during the year, resulting in a 248% increase year-on-year to 493,000t in underground volumes treated.
Production at Siguiri increased by 25% year-on-year, following a solid performance with improved productivities and greater access to higher grade ore in the new Seguelen pit in Area 1. Production in 2017, the third highest in the mine’s history, was boosted by favourable grade variances and optimised treatment of full-grade ore laterite cap rock
(duricrust) stockpiles. This improvement offset treatment of lower-grade stockpiles from other pits and the lower volumes treated. During the year, work began on the Siguiri combination plant project, with commissioning planned for late 2018.
At Iduapriem, production increased by 7% year-on-year. Mining during the year focused on deeper, higher-grade areas, resulting in an 8% increase in recovered grade. Total tonnes mined increased 27% year-on-year to 35Mt, owing to greater mining-fleet productivity, as the mine continued with its extensive waste stripping programme to access the ore sources in the Block 7 and 8 pit that will provide the foundation for sustainable production over the future life-of-mine.
At Sadiola, production declined as the recovered grade decreased. This was a result of reduced mining flexibility as the remaining oxide ore mining sources are depleted. Plant operations were efficient and consistently achieved exceeded planned throughput. This helped to partly offset the lower feed grade and provided flexibility to maintain a steady production and revenue profile. Tonnage throughput was made up of a combination of the limited, newly mined oxide ore and full-grade ore stockpiles, as well as periodic drawdowns from the lower-grade marginal ore stockpiles.
Morila resumed mining in the latter part of the year, accessing and treating higher grade ore from the Domba pit, contributing to year-on-year increase in production. The increased tonnage throughput during the year was further boosted by consistent plant availability and treatment of softer ore, offsetting the decrease in recovered grade. The mine is expected to continue treatment of mineralised waste ore, augmented by higher grade ore from targeted mining areas, for the next three years, after which the mine will transition to full closure.
CostsAll-in sustaining costs for the region increased to $953/oz, mainly a result of increased sustaining capital expenditure as planned, partly offset by higher production. Total cash costs increased marginally year-on-year, due to the negative impact of higher initial costs from underground mining at Geita and operating costs at Kibali. This was partially offset by higher production and recovered grades.
Total cash costs at Siguiri, Iduapriem, Sadiola and Morila decreased year-on-year. At Siguiri, costs decreased by 8% as a result of increased production. At Iduapriem, total cash costs decreased by 9% due to higher production and lower costs as operational efficiencies and cost management initiatives continued to bear fruit during the year and higher recovered grades.
REGIONAL REVIEWS CONTINUED
Continental Africa
INTEGRATED REPORT 2017 92

Capital expenditureCapital expenditure for the region increased in line with company plans as we invested in growth projects at Siguiri and Kibali, and increased sustaining capital investment at Geita and Iduapriem. These projects are expected to realise future benefits as higher grade ore is accessed at Iduapriem and Ore Reserve development work in the underground operation at Geita continues to ramp up. The balance of sustaining capital expenditure was earmarked to improve asset reliability and consistent operations across the Continental Africa region.
All-in sustaining costs for Kibali increased year-on-year, a result of increased sustaining capital expenditure on waste stripping in the Pakaka and Kombokolo pits, increased underground capital expenditure, and higher plant engineering and process operating costs, in particular power costs. Open-pit mining costs were higher mainly due to lower equipment availability.
During the year, the region continued to drive continuous improvement through the Operational Excellence programme, a system that is now well entrenched across all sites and disciplines. The focus remains on
delivering systemic and sustainable operational improvements, aimed at each operation rapidly progressing towards targeted lower all-in sustaining costs that reflect the inherent opportunity that exists within each operation.
Growth and improvement Geita made good progress with the construction of the new 40MW power plant, which is expected to be commissioned in the first half of 2018. The plant will provide the required levels of reliable power to the mine and reduce the overall cost of power. The mine successfully transitioned to and expanded underground mining at Star & Comet, while developing two new underground mines in the Nyankanga mining area. Open-pit mining is anticipated to continue at Nyankanga Cut 8 until the second half of 2019 while Geita Hill East Cut 1 is expected to finish in the first half of 2018. Exploration work is being conducted at Selous, 2.4km from Star & Comet, for a satellite pit to supplement underground operations.
Siguiri’s combination plant is well advanced and scheduled to be fully commissioned in the second half of 2018. The associated 30MW power plant will also be commissioned in the second half of the year. Construction of the combination plant began with the
early works in the first half of the year carried out by a local contractor. The main civil construction commenced in the second half of the year with the first major concrete poured in December 2017. The mill shells arrived on site in September, and off-site fabrication and sourcing of electrical and instrumentation equipment and cabling, continued during the last quarter of the year. Major contractors mobilised on site and a new mining contractor was on track to begin mining in first half of 2018.
Siguiri has commenced drilling Block 2, after which it is expected that drilling can begin at Saraya and Foulata to support a prefeasibility study. Some of the farms being compensated will be for the infrastructure required for the development of the project. It is expected that Block 2 will both improve the ounce profile from 2020 and potentially extend the life.
At Iduapriem, the deferred stripping carried out during the year at Teberebie Cut 3 was completed and waste stripping at the larger Cut 1 exceeded planned targets. The project delivered an additional 4.1Mt of marginal and waste material as a result of improved efficiencies in mining unit rates. This work will now provide
access to the orebody to extend the mine life by about a decade. The plant recovery project was successfully completed and is expected to contribute to higher plant recoveries in 2018.
The main pit dewatering project at Sadiola was substantially completed at year end, with all equipment and materials delivered to site. Construction of the sulphide project awaits approval by the government of Mali, though no agreement has yet been reached in this regard. Despite our efforts and the clear benefits the project would generate locally and to the government of Mali, there has been no resolution around the terms critical to moving the project forward. AngloGold Ashanti and joint-venture partner IAMGOLD Corporation continue to evaluate the project which will add sulphide-ore processing capability to the plant. Although we remain committed to the project, if no agreement is reached, the operation will enter a restricted exploitation phase and then, when stockpiles are exhausted, it will enter a phase of suspended exploitation (care and maintenance).
At Kibali, capital expenditure of $110m for the year (attributable), was spent mostly on underground development, the vertical shaft and the second hydropower plant.
REGIONAL REVIEWS CONTINUED
Continental Africa
INTEGRATED REPORT 2017 93

Underground paving at the central haulage level was completed, allowing haulage from the ore passes into the underground crushers. The materials handling system was also commissioned during the last quarter of the year, and 118kt of ore hoisted from the shaft, with total underground ore tonnes of 1,110kt mined for the year. Underground ore production from the declines totalled 505,000t in the last quarter of the year. Once the ramp up has been completed, a significant increase in production is expected. Ambarau, the second hydropower station was completed and commissioned during the first half of the year, taking Kibali’s total hydro generation capacity to 32MW. At the plant, the ultra-fine grind and Pumpcell capacity was increased at the start of the year, enabling the processing of substantially increased flotation concentrate volumes, improving grind and recovery as well as providing flexibility in ore treatment. Furthermore, waste stripping at both Kombokolo and Pakaka satellite pits were undertaken during the course of the year. The only major capital project remaining is the third hydropower station at Azambi, which is being constructed and is expected to be commissioned in the second half of 2018.
Update on Obuasi redevelopment Obuasi, which was placed on care and maintenance in 2016, remained so throughout 2017. The cost of Obuasi’s care and maintenance programme was $62m in 2017 (2016: $70m).
The invasion of a part of the mine by illegal miners in 2016, as reported on extensively in our Integrated Report 2016, has been resolved and the mine’s operational area has been cleared of illegal miners. Public security agencies provided security at the mine throughout 2017, and continue to do so.
AngloGold Ashanti was in discussions with the government of Ghana throughout 2017 to secure the necessary agreements and permits for the possible redevelopment of the mine. The boards of AngloGold Ashanti (and its relevant subsidiaries) have approved the redevelopment of Obuasi, now expected to commence subject to ratification by Ghana’s parliament of the relevant fiscal, development and security agreements. These agreements have been signed by the government of Ghana. The board therefore approved interim funding of $31m to cover the first six months to enable the project team to be established
and to set-up the front-end engineering and design, so as not to delay the project.
The study into Obuasi’s redevelopment was completed with improvements in returns and payback period. This was achieved with an improved geological model, phased capital expenditure and the supportive agreements signed with the government of Ghana.
The redevelopment will establish Obuasi as a long-life, modern, mechanised underground mining operation. This is a fundamental departure from the mine’s previous operating model. The redevelopment will deliver a mine that makes use of automation and controls for improved operational efficiencies and consistency in performance. It envisages a smaller, but more skilled workforce that can operate in the planned mechanised and automated environment.
The detailed feasibility study covers every aspect of the mine, including operating methods, systems and processes, environmental management and mine rehabilitation, organisational design, human resource strategy and social responsibility, among others.
REGIONAL REVIEWS CONTINUED
Continental Africa
Picture: Obuasi, GhanaINTEGRATED REPORT 2017 94

Project implementation will be undertaken in two distinct phases:
• Phase 1 includes project establishment, mine rehabilitation and development, plant and infrastructure refurbishment to enable production at a rate of 2,000 tonnes per day (tpd) for the first operating year. The preparatory work to reach the start of Phase1 is expected to take approximately 18 months from the start of the project, with the first gold pour expected in the third quarter of 2019.
• Phase 2 includes refurbishing the underground materials handling system, shafts and ventilation, construction of a primary crusher, a SAG/ball circuit, carbon regeneration facility and a new gold room and tailings storage facility. This will take a further 12 months following Phase 1 and enable the operation to increase processing capacity to 4,000tpd within three to four years. The operation will then ramp up to 5,000tpd from the fifth year onward.
Mine production for the first 10 years will be focused on the upper ore bodies and is expected to average 350,000oz to 400,000oz annually at an average head grade of 8.1g/t. Total cash costs are expected to average between $590/oz and $680/oz, while the all-in sustaining cost is expected to be between $795/oz and $850/oz. Annual mine production
for the second 10 years is planned to increase
to between 400,000oz and 450,000oz, as
the mine deepens into higher grade ore. The
all-in sustaining cost is expected to improve
thereafter to between $750/oz -$800/oz.
It is estimated that the project, which is highly
leveraged to the gold price, will deliver an
internal real rate of return of between 16% and
23% at real gold prices of between $1,100/oz
and $1,240/oz.
Initial project capital expenditure anticipated
over the first 30 months is expected to be
between $450m and $500m, excluding pre-
production capital of $64m. On completion
of phase 2, extended project capital
expenditure of $94m will continue through
to year six, covering the development of the
Obuasi Deeps Decline to the lower level of
the mine, refurbishment of the KMS shaft,
installation of new underground pump
stations and construction of the flotation
tailings storage facility.
The project has a current life of more than 20
years. Opportunities exist to further optimise
the plan and to extend its life by targeting the mine’s significant additional mineral
endowment, particularly with down-plunge
extensions of the orebody into the Adansi
Deeps area below 50 level.
REGIONAL REVIEWS CONTINUED
Continental Africa
Update on Obuasi redevelopment (continued)
Obuasi project: key metrics
Gold produced (economic footprint) Moz 8.59 over 21 years
Annual gold production (steady state – first 10 years) 000oz 350 – 400
Annual gold production (second 10 years) 000oz 400 – 450
Average annual tonnage treated (steady state) Mt 1.6 – 1.8
Average head grade g/t 8.8
Gold price assumption (Real) $/oz 1,240
Cash cost per ounce (money terms at approval) $/oz 590 – 680
All-in-sustaining cost (money terms at approval) $/oz 750 – 850
Initial project capital expenditure (three years) $m 450 – 500
2018 % 25
2019 % 55
2020 % 20
Extended Project capital expenditure over six years (includes initial project capital)
$m 540 – 590
Capitalised operating cost $m 64
Internal rate of return ($1,100 – $1,240/oz) % 16 – 23
Payback period years 6.5
All-in sustaining cost margin % 38
INTEGRATED REPORT 2017 95

Sustainability performanceSafety The region reported an excellent safety performance in 2017, with a 24% year-on-year improvement in the AIFR to a low rate of 0.39 per million hours worked. There were no fatalities during the year, and the region achieved a record 801 days since the last fatality in October 2015. In May 2017, Geita was declared the overall winner, for the second consecutive year, in the mining sector by the Tanzanian Occupational Safety and Health Authority (OHSA). This award acknowledges Geita’s high level of safety and health in the workplace.
Siguiri maintained its record performance achieved in 2015 and 2016, having recorded only one workplace incident. This is a commendable performance, considering the increasing safety risk profile at the operation given the large construction project currently underway at the mine, as well as the change of mining contractor. Siguiri’s safety performance is attributed primarily to its focus on closely managing on-site contractors.
Iduapriem has remained fatality-free for four consecutive years, through its sustained focus on the management of contractors and ensuring that contractor activities conform to mine and group safety requirements. Iduapriem remains one of the top safety performers in Ghana and the operation was recognised for this at an awards ceremony held in Accra in November.
Sadiola’s all injury frequency rate improved by 20% to 1.25 injuries per million hours worked compared to the previous year. Various safety campaigns and initiatives aimed at improving driving skills and improving safety engagement in the workplace were credited for the improvement.
Obuasi recorded an injury-free year during 2017 and on 26 December 2017 achieved 2.5 million injury-free hours worked. Although the operation remains on care and maintenance, the team on site continued focus on the company’s safety initiatives.
Health The region continued with efforts to improve systems on the entire healthcare continuum, including health issues in the workplace, general wellness, as well as community-related diseases. In respect of employees, focus was placed on the prevention of diseases, effective disease management and rehabilitation to facilitate an early return to fitness and work. The operations embarked on comprehensive healthcare programmes, taking into account the capacity of local health systems to support mine needs; as well as local regulatory requirements. Specific health issues included noise-induced hearing loss (NIHL), dust management, malaria prevention and surveillance, and management of emerging infectious diseases, like Ebola, which have the potential for outbreaks.
AngloGold Ashanti has developed practical plans and activities to undertake to achieve
REGIONAL REVIEWS CONTINUED
Continental Africa
Picture: Malaria spraying control programme, Obuasi, GhanaINTEGRATED REPORT 2017 96

the company’s long-term aspirational goal of “healthy employees and healthy communities by 2030.” As part of the company’s health strategy, these plans are aligned with the company’s Sustainability Strategy, as well as the United Nations’ (UN) Sustainable Development Goals (SDGs).
The Continental Africa operations focused on, among other things, the malaria programme, promotion of health and wellness among our employees, contractors and dependants. Our malaria programme in the region covers, among other things, awareness and education; indoor residual spraying; provision of prophylaxis; early detection and treatment of cases; and personal protective equipment (the PPE) and clothing.
Geita had the lowest incidence of malaria across the region in 2017, at about 0.2% of the workforce. This can be attributed to the extensive malaria control programme that extends beyond the mine’s boundaries into the communities of Geita Town. Like our first malaria programme, which started at Obuasi in 2010, Geita has a community-based initiative, undertaken in partnership with government and NGOs. In Ghana, malaria control activities continued under the public-private partnership programme based at Obuasi and run by AngloGold Ashanti’s non-profit organisation, AGA-Mal. This programme continues to be supported financially and technically by our Ghana operations and the Global
Fund. In addition to the Obuasi districts, the programme covers 12 other districts in the Upper West and Upper East regions of Ghana. Iduapriem also continues to provide and sustain malaria control efforts in this region, which has a high incidence of the illness. In 2017, Iduapriem launched a malaria control programme themed “End Malaria for Good in our Communities”. The malaria control programme, covering employees, contractors and host communities, involved the distribution of 12,500 insecticide-treated nets (ITNs) during the year. An estimated 5,850 people in 16 host communities within the municipality, benefitted from this programme.
Sadiola also provides malaria control to site, as well as to surrounding communities with good malaria control and maintenance of gains over the years. Siguiri faced the most significant malaria-related challenges in the Continental Africa region. With a notable increase in the number of malaria cases, the mine undertook investigations and prompt action to reverse this trend. The programme’s roll-out to include Siguiri town is expected to be completed by the end of 2018. This is in addition to the extension to communities immediately surrounding the mine. The mine has already seen a reduction in the number of malaria cases, achieving an incidence rate in 2017 of 6.8% (2016: 11.5%) cases in the workforce.
Other healthcare work included Geita’s $135m contribution to build a surgical theatre unit in
Chato hospital, which is situated about 100km
from the mine. This was in addition to support
provided to the Geita municipal facility for HIV
and AIDS management, and to the local Geita
government hospital. More disclosure on the
region’s health programmes is available in
the <SDR>.
There were no cases of noise-induced hearing
loss in the region during 2017.
Employee relationsIn line with the continued implementation
of the Operational Excellence efficiency
programme, key people-focused initiatives
were undertaken and completed in the region
during the 2017. These are not limited to but
included the following:
• The ‘How We Work’ 1 programme was
launched which included capacity-building
training of the human resources and senior
management teams and nominated line
managers at our sites. Implementation will
be further intensified and introduced to
employees at all levels across the region
• Focus remained on localisation initiatives,
talent management and succession planning
interventions across the region
• Successfully completed annual wage
negotiations for the period at all sites
There were no production interruptions and
the labour relations climate remained relatively
stable across the region.
REGIONAL REVIEWS CONTINUED
Continental Africa
USEFUL LINKS
1 See People are our business
In Siguiri, during the year, annual wage negotiations included the unions, management as well as the Ministry of Employment and the General Labour Inspection for mediation intervention between the parties. The negotiations led to the conclusion of a one-year wage agreement.
In Ghana, following the postponement of the proposed unitary negotiations by the Ghana Chamber of Mines, early in 2017, Iduapriem successfully concluded a two-year wage agreement with the Ghana Mineworkers Union in respect of 2016 and 2017. As part of the agreement, management and the union further committed to the development of a salary adjustment framework which would be a guide for future negotiations.
In Tanzania, key focus areas at Geita during the year included the initial preparatory work to support and guide the mine as it becomes an underground mining operation in addition to open-pit mining activities. Management and the majority union reached agreement on a compressed working-week shift roster, effective from December 2017, and a one-year wage agreement effective January 2017.
INTEGRATED REPORT 2017 97

In Mali, the mine labour relations climate was influenced by the uncertainty relating to the Sadiola sulphides project and a potential decision that would place the mine in limited operations, and then care and maintenance phase. The annual wage negotiations were successfully concluded and implemented effective January 2017. The wage agreement concluded between management and two recognised unions focused mainly on improving the social and employment conditions of employees.
At Yatela, the mine closure and retrenchment process received approval from the labour inspector.
Environment There were two reportable environmental incidents in the region in 2017, both at Obuasi. One occurred on 6 October 2017, when there was a loss of process water after intruders cut off the bolt heads and nuts holding flanges on a process water pipeline between the South Processing Plant and the South Tailings Storage Facility. The process water pipeline was repaired and security visibility increased to avoid any recurrence. On 26 June 2017, a very large volume of rain water (estimated at 22,708m3) collected because of rainfall overnight of 85mm,
overwhelmed the impoundment control valve boundary containment of the Kokoteasua dam, and eventually washed off the boundary containment. This resulted in an uncontrolled release of water into the Kokoteasua stream, leading to flooding of a school and some houses within the Abompe community of Obuasi. All the affected have been compensated and the boundary containment has been fixed and improved.
The Environmental Management Plan (EMP) for the Obuasi care-and-maintenance phase (May 2017 – April 2018) was submitted to the Ghanaian Environmental Protection Agency (EPA). A new reclamation security agreement for Obuasi was signed on 21 July 2017 and will come into effect once the EPA issues the requisite environmental permits for the redevelopment project. Iduapriem obtained approval from the national Inspectorate Division of Minerals Commission to resume mining of the Block 3 West Pit.
Geita was granted an environmental permit for the Nyankanga underground project from the Tanzanian National Environmental Management Commission, as well as approval for the change of mining method from the Ministry of Energy and Minerals. The mine also received approval from the Lake Victoria Basin
Water Board to dewater the Matandani pit into the Kukuluma pit to allow exploration work for the refractory ore project to begin. Approval for the removal of a causeway separating the Nyankanga dam into two basins was also granted. After two years of consecutive drought in the East Africa region, the mine received a permit for construction of a second water pipeline from Lake Victoria to Geita town, which will supply water directly to Geita town, leaving the Nyankanga Dam to serve the mine only.
Environmental authorisation for the Siguiri combination plant project was renewed by the Guinean National Environment Regulator (known as the BGEEE) following a site inspection in December. Authorisation certificates were also received for four exploration permits. The Sadiola sulphide project’s environmental permit was granted by the Malian Minister of Environment in March 2017.
All operating mines in the Continental Africa region retained their ISO 14001 and International Cyanide Management Code certification in 2017. At Obuasi, the ISO 14001 certification remained suspended for the year, as the mine is on care and maintenance. ISO 14001 is the international standard for an effective environmental management system.
Communities The five-year Geita Economic Development Programme (GEDP), which began in September 2015, is a collaboration between the mine and the Geita local authority and is aimed at improving community livelihoods and employment creation, particularly for the youth and women. This programme provides support to farming, small and medium enterprises and projects such as tailoring, shoemaking, embroidery, hydra-foam brickmaking, welding and fabrication, which have successfully changed the lives of youths and women. Details on this work are available in the <SDR>.
Additionally, we provide training on best-farming practices, which has benefitted about 980 farmers. Geita also completed construction of a modern, long-term storage facility in 2017 to assist farmers. By expanding the scope of paddy farming, this sub-sector is expected to attract more youths to farming.
Geita mine also assists with the provision of potable water to the residents of the Geita town. Potable water is distributed to residents by way of domestic connections and public access kiosks. When the project began in 2012, only 3% of residents had access to
REGIONAL REVIEWS CONTINUED
Continental Africa
INTEGRATED REPORT 2017 98
clean and safe tap water, now, after the limited distribution network was completed and the project launched in January 2016, that figure has risen to 36% although the percentage is constantly challenged by the growing rate of rural-urban immigration. The mine has spent over $5.2m to fund the project to its present stage.
In Guinea, AngloGold Ashanti’s subsidiary, Société AngloGold Ashanti de Guinée S.A. (SAG), through the Siguiri Economic Development Programme (SEDP), promotes local economic development. SEDP projects include agricultural, aquaculture, skills and enterprise development projects aimed at developing small businesses and employment opportunities for local communities. Currently these include horticulture, cashew plantation, rice/paddy farming and fish farming. SAG also implemented a commercial-scale aquaculture project (tilapia farming). Fish cultivation began in the second half of 2017 and the first harvest was in December 2017. Details on this work are available in the <SDR>.
Further, as part of SAG’s commitment to facilitate access to secondary education by the communities in the nearby village of Bouré and to establish a pipeline of educated youth to drive the local Siguiri economy, the company has provided free daily transportation to school children in Bouré to attend school at Siguiri (about 30km away) since 2002. To ensure the sustainability of this work for
the benefit of communities, SAG expanded education facilities, constructed and equipped five libraries and computer rooms, constructed 39 teachers’ accommodation units, and completed nine fresh water boreholes.
Since the establishment of the Iduapriem Gold Mine Community Trust Fund in 2012, its focus has been on providing infrastructural development in the mine’s host communities to advance the company’s participation and contribution to their sustainable long-term development. In 2017, the Trust Fund built a state-of-the-art multi-purpose hall for the Bankyim community, as well as a community health facility at Wangarakrom. The hall, which serves as a community centre, also hosts other functions for the community, including youth, and skills development programmes. The health facility has clinical equipment and the requisite furniture, is expected to be commissioned in 2018.
Additionally, a community market is under construction in Teberebie at Iduapriem and expected to be completed in the first half of 2018. The market is aimed at encouraging economic activity within the community, and the market building will accommodate about 40 traders.
In Mali, when we began mining, the water supply to the relocated villages at Sadiola and Farabakouta was linked to the mine’s water supply. To provide independent and sustainable water to these villages, the mine
embarked on a community water project which commenced in 2015. Construction of the water system comprises a 150m3 water reservoir, a solar-powered pump, a secured pumping station, as well as the piping distribution network to four villages has been successfully completed and the system tested. Related training and social intermediation is provided to enable beneficiaries to take over and independently manage the water supply system once it has been completed. Handover to beneficiaries is planned for the first half of 2018.
At Obuasi, an apprenticeship programme which was started 10 years ago following focused group engagements with the youth in Obuasi, as well as with the local municipality. The programme focuses on strengthening the socio-economic fabric of the area. More than 300 apprentices have been trained in the past decade. This programme was also an attempt to mitigate the effects of the downsizing of the Obuasi mine with youth being trained in skills that are required beyond mining and the borders of the town.
Twenty youths from five communities were selected for the pilot programme in mid-2016, and all successfully graduated in 2017, with certificates in auto-electrical engineering, welding and fabrication. The apprenticeship training programme is a partnership with local traditional authorities and HR World Company Limited, which provides training.
REGIONAL REVIEWS CONTINUED
Continental Africa
Security and human rights During 2017, security efforts continued to focus on an integrated approach for effective management of the various challenges faced by the operations. The five-point security plan, implemented in collaboration with communities, focuses on regenerating and sustaining relationships with communities, public security, pertinent governmental agencies and security at sites, with the aim of removing people from risk. The Voluntary Principles on Security and Human Rights (VPSHR), to which AngloGold Ashanti is a signatory, remain a key driver for our security management practices.
AngloGold Ashanti approved and adopted a human rights standard in 2016 1, and began its implementation during 2017. Human rights due diligence self-assessments were completed by each operation in the Continental Africa portfolio, and served as gap analyses for understanding areas which have the potential to intersect or infringe upon human rights and to direct our interventions where most required. All operations within the region are scheduled to be assessed during 2018, which will assist further in promoting awareness of human rights concerns among relevant role-players.
USEFUL LINKS1 Download the approved and adopted
a human rights standard https://thevault.exchange/?get_group_doc=143/1502453846-HRDueDiligenceStandard.pdf
INTEGRATED REPORT 2017 99

We also rolled-out human rights training to further embed awareness and understanding of the UN Guiding Principles on Human Rights, which is included in induction and refresher training and is offered either in the classroom or online. As at December 2017, a total of 7,479 employees and contract employees had undertaken human rights training across the region.
Regulatory changesAt the end of June 2017, the government of Tanzania (GoT), enacted the Natural Wealth and Resources (Permanent Sovereignty) Act, No 5 of 2017, the Natural Wealth and Resources Contract (Review and Re-Negotiation of Unconscionable Terms) Act, No 6 of 2017 and the Written Laws (Miscellaneous Amendments) Act, No 7 of 2017.
The three pieces of new legislation in question purport to make a number of changes to the operating environment for Tanzania’s extractive industries, including those in its mining, and oil and gas sectors. These changes include, among others: the right of the GoT to renegotiate existing Mine Development Agreements at its discretion; the provision that the GoT is entitled to a
non-dilutable, free-carried interest of no less than 16% in all mining projects; the right for the GoT to acquire up to 50% of any mining asset commensurate with the value of tax benefits provided to the owner of that asset by the GoT; removal of the refund of input VAT incurred on the production of raw materials for export; an increase in the rate of revenue royalties from 4% to 6%; requirements for local beneficiation and procurement; and constraints on the operation of off-shore bank accounts. For a more detailed reading of the legislative provisions included in the new laws, please see the Tanzanian parliamentary website. 1,2
AngloGold Ashanti’s subsidiaries continue to seek a constructive dialogue with the GoT, and its agencies, to gain assurances that Geita Mine will not be affected by these legal and fiscal changes. On 13 July 2017, AngloGold Ashanti announced that its subsidiaries in Tanzania had made a decision to take the precautionary step of safeguarding their interests under the Mine Development Agreement (MDA), by commencing arbitration proceedings under the rules of the United Nations Commission on International Trade Law, as provided for in the MDA. Despite
REGIONAL REVIEWS CONTINUED
Continental Africa
USEFUL LINKS
1 See: www.parliament.go.tz/bills-list
2 See: www.anglogoldashanti.com/investors/announcements/
Picture: Obuasi, Ghana
the dispute over the legal basis for the increased royalty rate, from 4% to 6%, and the imposition of a 1% clearing fee for the export of gold, Tanzanian officials have insisted upon receipt of such payments as a condition of the release of exports. While our subsidiaries in Tanzania do not accept that they are bound to pay either the new levy or the increased royalties, these royalties and fees are being paid under protest to ensure continued processing of export shipments. The impact of these additional royalties and levies currently is approximately $20m on an annualised basis. The lack of input VAT refunds has resulted in an approximate $50m increase in working capital for the year. The company continues to engage with the revenue authorities to secure the refunds due.
INTEGRATED REPORT 2017 100

REGIONAL REVIEWS CONTINUED
Australasia
AUSTRALASIA The Aus t ra las ia reg ion de l i ve red a s t rong per fo rmance w i th bo th mines in the reg ion hav ing so l id p lans in p lace to improve the qua l i t y and long- te rm op t iona l i t y o f the i r asse ts
Picture: Sunrise Dam, AustraliaINTEGRATED REPORT 2017 101
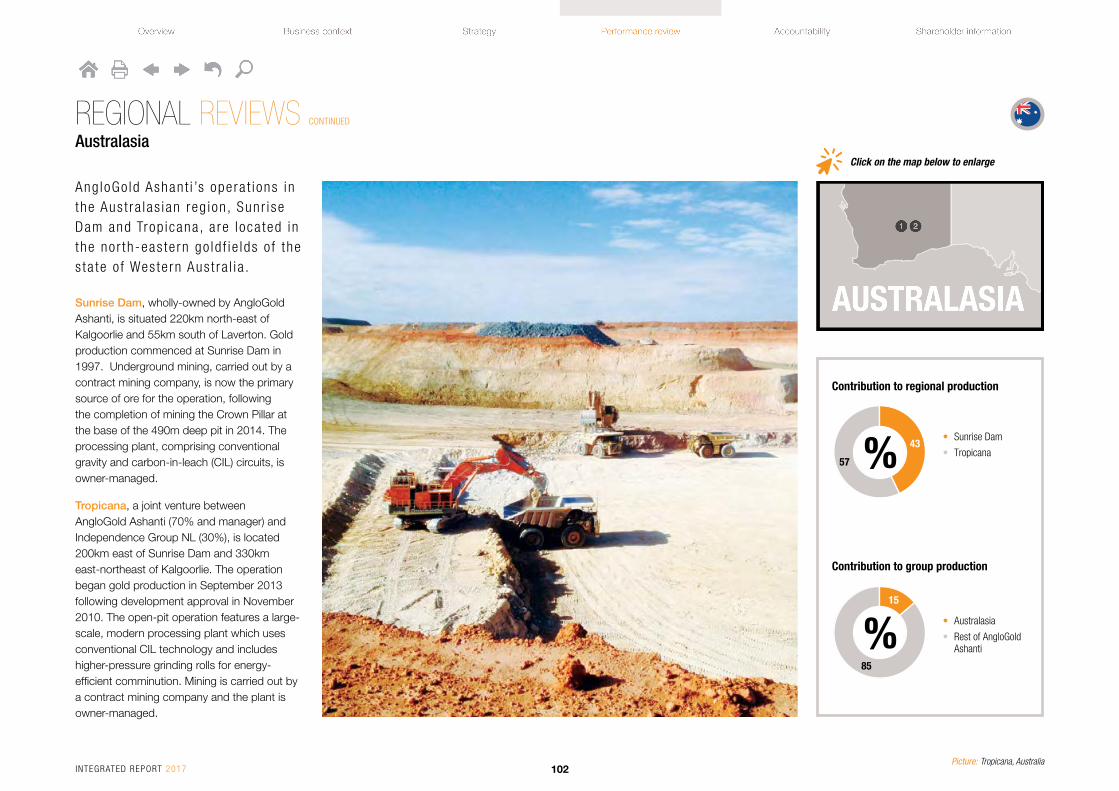
REGIONAL REVIEWS CONTINUED
Australasia
Ang loGo ld Ashant i ’s opera t ions in the Aus t ra las ian reg ion , Sunr i se Dam and Trop icana , a re loca ted in the nor th-eas te rn go ld f ie lds o f the s ta te o f Wes te rn Aus t ra l i a .
Sunrise Dam, wholly-owned by AngloGold Ashanti, is situated 220km north-east of Kalgoorlie and 55km south of Laverton. Gold production commenced at Sunrise Dam in 1997. Underground mining, carried out by a contract mining company, is now the primary source of ore for the operation, following the completion of mining the Crown Pillar at the base of the 490m deep pit in 2014. The processing plant, comprising conventional gravity and carbon-in-leach (CIL) circuits, is owner-managed.
Tropicana, a joint venture between AngloGold Ashanti (70% and manager) and Independence Group NL (30%), is located 200km east of Sunrise Dam and 330km east-northeast of Kalgoorlie. The operation began gold production in September 2013 following development approval in November 2010. The open-pit operation features a large-scale, modern processing plant which uses conventional CIL technology and includes higher-pressure grinding rolls for energy-efficient comminution. Mining is carried out by a contract mining company and the plant is owner-managed.
Contribution to regional production
• Sunrise Dam
• Tropicana % 43
57
Contribution to group production
• Australasia
• Rest of AngloGold Ashanti %
15
85
Click on the map below to enlarge
Picture: Tropicana, AustraliaINTEGRATED REPORT 2017 102

Key statisticsUnits 2017 2016 2015
Operational performance
Tonnes treated/milled Mt 9.4 8.9 8.2
Pay limit oz/t 0.06 0.06 0.06
g/t 1.84 1.86 1.85
Recovered grade oz/t 0.061 0.058 0.068
g/t 1.89 1.82 2.12
Gold production (attributable) 000oz 559 520 560
Total cash costs $/oz 743 793 702
Total production costs $/oz 991 1,056 919
All-in sustaining costs (1) $/oz 1,062 1,067 875
Capital expenditure (attributable) $m 153 109 78
Productivity oz/TEC 47.87 46.81 55.84
Safety
Number of fatalities 0 0 0
AIFR per million hours worked 8.53 9.49 8.56
People
Average no. of employees: total 974 925 836
– Permanent employees 226 211 195
– Contractors 748 714 641
Training and development expenditure $m 1 1 1
REGIONAL REVIEWS CONTINUED
Australasia
Production(000oz)
620
560
559
520
3422013
2014
2015
2016
2017
Productivity(oz/TEC)
62.00
55.84
47.87
46.81
49.642013
2014
2015
2016
2017
INTEGRATED REPORT 2017 103

REGIONAL REVIEWS CONTINUED
Australasia
Units 2017 2016 2015
Environment
Total water consumption ML 6,783 7,577 6,648
Total water use per tonne treated kL/t 0.581 0.691 0.662
Total energy usage PJ 6.32 5.62 5.14
Total energy usage per tonne treated GJ/t 0.54 0.51 0.51
Total GHG emissions 000t CO2e 372 336 336
Total GHG emissions per tonne treated t CO2e/t 0.032 0.031 0.034
Cyanide used t 4,011 4,696 4,130
No. of reportable environmental incidents 0 0 0
Total rehabilitation liabilities: $m 88 71 61
– restoration $m 54 42 32
– decommissioning $m 34 29 29
Community and government
Community expenditure $m 0.7 0.6 0.3
Payments to government $m 74 84 42
– Taxation $m 28 41 2
– Withholding tax (royalties, etc.) $m 18 16 16
– Employee taxes and other contributions $m 28 27 24
(1) Excludes stockpile write-offs.
Key statistics (continued)AIFR(per million hours worked)
10.73
8.56
8.53
9.49
7.912013
2014
2015
2016
2017
Total cash costs and all-in sustaining costs($/oz)
1,376804
986
7431,062
702875
7931,067
1,0472013
2014
2015
2016
2017
Total cash costs All-in sustaining costs
INTEGRATED REPORT 2017 104
Operational performance ProductionThe region delivered a strong performance in 2017, producing 559,000oz driven by higher mill throughput rates and feed grades and increased metallurgical recoveries.
Sunrise Dam celebrated its 20th anniversary in March 2017. A strategy, to lift the mined grade while maintaining the underground ore production rate at 3Mtpa, was successfully implemented during the year, resulting in a 5% lift in yield to 1.83g/t. The mine’s production increased by 4%, compared with 2016. Underground ore is the primary source of mill feed and is blended with intermediate grade (1.26 g/t) stockpiled ore that was accumulated during open-pit mining to meet the processing plant capacity of approximately 3.6Mtpa. The higher-grade Cosmo and Vogue ore bodies were the focus of development in 2017, with Vogue targeted to be the key ore source in 2018.
At Tropicana, optimisation and expansion of the processing plant lifted processing capacity to 7.7 Mtpa (100%), resulting in a 10% increase in mill throughput, which delivered a 10% increase in attributable gold production.
A fines pulping circuit was commissioned in November 2017, further improving efficiency by minimising downtime during maintenance shutdowns. This is expected to increase annual mill run times by approximately 2% to more than 98%.
Following the introduction of a 600t face shovel to the mining fleet, mining rates increased to more than 90Mtpa in 2017, enabling the resumption of grade streaming – the preferential treatment of higher grade ore while low-to-medium grade ore was stockpiled – during the second half of the year. Mining in 2017 focused on the Havana 3 and Tropicana 2 pits.
CostsAll-in sustaining costs for the region were in line with 2016 at $1,062/oz. The decreased mining unit costs at Tropicana were offset by a stronger Australian dollar against the US dollar and increased sustaining capital expenditure at Sunrise Dam, which included $20m for the Recovery Enhancement Project (REP).
Growth and improvementAt Tropicana, the focus for 2018 and beyond will be on implementation of the Long Island
strategy, which is expected to add 2.1Moz to Tropicana’s business plan, extending mine life by approximately seven years to 2027.
In December 2017, the Tropicana joint venture partners announced a commitment to the Long Island mining strategy and approval for an additional ball mill in the processing plant, to further lift plant throughput to 8.1Mtpa which is expected to increase gold recovery.
The Long Island strategy has been driven by finding a more cost-efficient way to mine waste in pit cutbacks. It involves using a strip-mining approach that minimises waste haulage distances by using in-pit backfill, essentially optimising haulage distances over the life of mine. The approach comprises eight stages with three major decision points providing flexibility to tailor the approach at each decision point, depending on market and other prevailing conditions.
Phase one comprises mining of the Havana South pit and a cutback of the Boston Shaker pit, using the completed Tropicana pit as the first backfill location.
The Long Island development is expected to increase mining rates to between 95Mtpa
and 107Mtpa over the next two years, to peak in 2019 and to continue at that rate for about four years. The project was enhanced by the decision to install a 6MW ball mill in the processing plant, enabling throughput to be lifted to 8.1Mtpa to match the increased mining rate. Through a reduction in grind size, baseline metallurgical gold recovery is expected to improve by up to 3% to approximately 92%. Production (at 100%) is forecast to be between 478,000oz and 492,000oz in 2018 and between 530,000oz and 548,000oz in 2019.
This does not include potential underground production from mineralisation at the Boston Shaker orebody, which remains open at depth. A prefeasibility study incorporating infill drilling and underground mining options will be undertaken in 2018. The target is to delineate the underground Ore Reserve at more than 3g/t to replace stockpiled mill feed after 2021.
The Long Island strategy was underpinned by an increase in the Ore Reserve to 66.59Mt, grading 1.91g/t gold, for a total of 4.08Moz. Including gold produced to date, Tropicana has delivered a 72% increase in its Ore Reserve since the project was approved in November 2010.
REGIONAL REVIEWS CONTINUED
Australasia
INTEGRATED REPORT 2017 105

In 2018, Sunrise Dam will continue to focus on embedding a more selective mining approach to target higher grade sections in the underground stopes, while maintaining the underground production rate at approximately 250,000t a month. This approach is designed to lift the grade of ore delivered to the mill and reduce cash operating costs. In line with this plan, work is focused on improving the productivity of the underground operation to lift sustainable ore production rates above 3Mtpa. Several capital projects, including ventilation upgrades and installation of an underground workshop, are aimed at improving the effective use of mining equipment and the reliability of the mine.
The Vogue orebody will be the key ore source in 2018 and remains open along strike and at depth. Two diamond drill rigs will continue to focus on drilling the Indicated and Inferred Mineral Resource at Vogue. Drilling of the deeper areas along the strike of the orebody will be facilitated by the Western Exploration Incline in 2018.
Delineation drilling targeting down dip extensions to Cosmo East and Cosmo has confirmed a down dip extension ore bodies.
The performance of the 4Mtpa processing plant also set the standard globally within AngloGold Ashanti, ranking at number one for overall equipment efficiency, with the potential for further, incremental improvements expected in 2018.
The REP at Sunrise Dam is scheduled for commissioning in the second half of 2018 and is expected to lift the recovery rate by an average of 8%, through the installation of flotation and ultra-fine grinding circuits.
Work will continue in 2018 on the underground mine management system (UMMS), which will enable real-time analysis of the mobile fleet and services such as ventilation, power and dewatering. Over the longer term, overall equipment efficiency will be analysed to identify specific Operational Excellence projects that improve the effective time, mining rate and quality performance metrics of the mining equipment. The UMMS will be a critical tool to enable an improved production rate at the underground mine.
Encouraging results were reported during the year from drilling on the Butcher Well/Lake Carey exploration joint venture tenements where there is potential for the discovery of an additional Ore Reserve for processing at Sunrise Dam, possibly replacing low-grade stockpiles currently being processed. 1
AngloGold Ashanti Australia has the right to earn up to 70% interest from Saracen Mineral Holdings Ltd in the tenements, which are located approximately 22km from Sunrise Dam, by spending up to A$25m on exploration. These tenements are part of the Butcher Well- Lake Carey exploration joint venture.
Around 20,000m of diamond drilling was undertaken during 2017 within the Butcher Well/Lake Carey exploration joint venture, along with aircore drilling to the north and metallurgical testing. A 30-person camp was established, together with a core processing facility.
Capital expenditureCapital expenditure at Tropicana related to Long Island will be primarily for the expansion of the accommodation camp, heavy vehicle workshop infrastructure and for a second ball mill. The installation of a second ball mill in the Tropicana processing plant grinding circuit was approved in 2017 with commissioning scheduled for the fourth quarter of 2018.
At Sunrise Dam, an EPC (engineering, procurement and construction) contract was awarded to GR Engineering Services to undertake the design and construction of a brownfields upgrade to processing facilities as part of the REP. The project also requires additional power generation capacity. To this end, it is planned that two 4MW gas generator sets will be added to the existing power station to increase capacity to 43MW. Work commenced in 2017 on an expansion to the tailings storage facility at Sunrise Dam, which will add approximately eight years to the life of the facility. This work is expected to be completed by the fourth quarter of 2018.
REGIONAL REVIEWS CONTINUED
Australasia
Picture: Tropicana, Australia
USEFUL LINKS1 See announcement made during the year
on www.anglogoldashanti.com
INTEGRATED REPORT 2017 106

Sustainability performanceSafetyThe safety performance in the Australasia region remained strong with an all injury frequency rate of 8.53 per million hours worked, a 10% improvement on the previous year. There were no fatalities in the region for another year.
The company’s safety programmes, including safety leadership, hazard and risk management and incident investigation continued to be held for managers and supervisors, with these competencies being embedded into day-to-day leadership and supervision. There was continued focus on major safety hazard management in the region with all risk assessments completed and the process of critical control monitoring being maintained by the operations. Engineering and other design improvements continued, aimed at reducing reliance on administrative controls. This included significant ventilation improvements at Sunrise Dam and continued geotechnical systems improvements at Tropicana.
HealthThe region completed a health Bowtie Risk Assessment aligned with group-wide health risks. The hygiene monitoring programme,
covering noise, dust, fumes and diesel particulate matter continued at the operations.
Sunrise Dam volunteered and was selected as the research site for the Western Australian regulator and mining industry-funded study on nano-diesel particulates to better understand the potential health impact, as well as the potential impact of deeper underground mining. The research reports are expected to be released in mid-2018.
Two electric shotcrete rigs replaced diesel-powered models throughout the year. This was to reduce exposure (to diesel fumes, noise and heat) by operators at the development heading during the ground support cycle.
Tropicana has introduced technology to assist with fatigue management and fitness for work practices, including a mining truck cabin alert system and personal wrist band technology to provide a baseline on fatigue levels. A health survey was completed and will assist with developing targeted health plans and programmes for the region.
Health and wellbeing projects include the ongoing Earbus programme, which has resulted in a 70% reduction in middle ear disease in children in the goldfields since it began in 2014.
Employees and labour relationsThe Australasia region’s tailored Fairness@AGAA programme, which uses the company’s values as a guide to leadership behaviour, continued to be rolled out for new employees and employees of major contractors. This programme incorporates hands-on exercises and real-life case studies to help participants understand unlawful discrimination, harassment and workplace bullying. These concepts are explained in terms of current legislation as well as the Australasia region’s fairness in employment policy and grievance process. The programme is aligned with best practice in relation to Australian equal employment opportunity legislation.
Complementing this training is the three-day human resources management programme for new managers. These programmes form part of a comprehensive framework focused on leadership and accountability.
We continue to support the Women in Mining of Western Australia mentoring programme, with employees participating both as mentors and mentees.
CommunitiesWe are actively involved in communities across the Western Australian goldfields, from
Laverton to Kalgoorlie-Boulder and beyond, including remote Aboriginal communities such as Tjuntjuntjara. The company supports education, youth, community development and health programmes and local training, along with offering employment and business participation opportunities.
Youth education and employment initiatives are delivered through long-term partnerships with indigenous academies such as the Goldfields Clontarf Academy and the Kalgoorlie Girls Academy, as well as Eastern Goldfields College and Kalgoorlie-Boulder Community High School.
Along with annual funding support for these organisations, we offer mine site tours, exposure to a wide variety of careers in the mining industry and a transition-to-work programme. During the year, the company also partnered with local schools to provide pre-university educational support programmes, and reading, writing and numeracy support programmes.
In 2017, we supported the Tjuntjuntjara Seed Collection Women’s Project, which seeks to train and support community women to collect, store and sell seeds for mining rehabilitation.
REGIONAL REVIEWS CONTINUED
Australasia
INTEGRATED REPORT 2017 107

Regulatory changes During 2017, the newly-elected Western Australian government announced its intention to increase the state gold royalty rate from 2.5% to 3.75% from January 2018. Following a public campaign by the Western Australian gold industry, the proposal was officially rebutted in the Upper House in November with Liberal MPs joining national and crossbench members to disallow the controversial revenue measure by 17 votes to 16.
A second attempt by the state government to increase the royalty under a revised plan was officially rebutted in November 2017. Under the revised plan, the royalty rate would have increased from 2.5% to 3.75% when the gold price was above A$1,400/oz instead of the previous hurdle of A$1,200/oz.
EnvironmentEnvironmental management and complianceFollowing the change in state government early in 2017, the new Western Australia Premier announced departmental amalgamations, affecting the state government’s administration of environmental planning, water and biodiversity laws with a view to streamlining government services and reducing costs.
Significant changes included a reform of the Mining Act with amendments designed to reduce red-tape and facilitate the high-level vision of a step-change in approach to streamlining approvals in the Department of Water and Environmental Regulation (DWER). It also included direct engagement with the mining industry and a complete review of licencing under Part V of the Environmental Protection Act.
Both mines have maintained certification following combined ISO 14001:2004 and OHSAS 18001:2007 surveillance audits by Bureau Veritas in June 2017.
In 2017, Sunrise Dam received certification under the International Cyanide Management Code following an audit. The Australasia region completed 2017 with no reportable environmental incidents and only two moderate environmental incidents. The Department of Mines conducted an environmental compliance inspection at Tropicana in 2017 and only minor non-compliances were identified, with positive feedback provided on the performance of the site.
Several Operational Excellence initiatives at both operations required approval relating to infrastructure such as tailing storage facilities, accommodation requirements in the village, mining services and waste water treatment infrastructure.
Sunrise Dam successfully consolidated 21 mining leases and eight miscellaneous licences into a new consolidated single mining lease, which has reduced rental and administration costs in 2017.
Climate changeSunrise Dam and Tropicana fulfilled the 2017 reporting obligations under the annual National Greenhouse and Energy Reporting scheme (NGER), which forms part of a single national framework for reporting and disseminating company information about greenhouse gas emissions, energy production, energy consumption and other information specified under NGER legislation.
During 2017, Sunrise Dam accepted the regulators’ reported baseline based on NGER scheme data reported between 2009-10 and 2013-14.
Tropicana applied for a calculated emissions baseline in 2017, as per the regulations, and has provided additional information to the regulator. An outcome is expected in early 2018.
Emissions baselines represent the reference point against which future emissions performance will be measured under the safeguard mechanism.
WaterIn early 2017, Sunrise Dam experienced above average rainfall, which included a 72 hours of rainfall (152.8mm) in late March and resulted in localised flooding. A flood study was commissioned to compliment the previous flood study conducted in 2010. These studies are important because Lake Carey is the primary receiving environment for water discharge from mine dewatering operations. See the <SDR> for more on these studies.
At Tropicana, the risk caused by hypersaline water mounding below the TSF continues to be monitored and during 2017, there was a general rise in water levels across the majority of the TSF monitoring bores, despite extraction from recovery bores. Immediate plans to
REGIONAL REVIEWS CONTINUED
Australasia
INTEGRATED REPORT 2017 108

mitigate this risk included equipping some of the recovery bores with larger pumps that could draw down the water more efficiently and restore a downward trend in monitored bore water levels.
BiodiversityThe Great Victoria Desert Biodiversity Trust (GVDBT) continued to make progress with the adaptive management partnership (AMP), which represents a co-ordinated approach to implementing adaptive management in the Great Victoria Desert, combining the philosophies and tools of landscape-scale management and collective action. The AMP will provide an ‘umbrella’ to co-ordinate activities, integrate science and action, and provide a monitoring and evaluation framework.
A number of funded projects in the Great Victoria Desert commenced in 2017.
The independent GVDBT was created by the Tropicana joint venture as part of its offset strategy for the mine under the Federal Environmental Protection and Conservation Act 1999.
Integrated closure planningThe Australian government’s Senate inquiry, to investigate whether resource companies are retaining adequate funds for mine rehabilitation and whether the process is being adequately monitored, continued in 2017. This is aimed at ensuring that companies undertake their rehabilitation responsibilities. The inquiry was granted an extension of time to report at the end of the first quarter of 2018.
As a spin-off from the Senate inquiry, the Council of Australian Governments (COAG) Energy Council was examining concerns that accounting standards and provisions of the Corporations Act were impeding efforts to ensure mining companies did not evade their rehabilitation responsibilities.
The Tropicana mine closure plan was updated and submitted to the regulator for approval in 2017 and Sunrise Dam is preparing an update of its closure plan for submission in 2018. Work includes open-pit geotechnical stability and closure criteria for waste dumps, an update on waste dump geochemistry and a revised stakeholder engagement plan.
REGIONAL REVIEWS CONTINUED
Australasia
Picture: Tropicana, AustraliaINTEGRATED REPORT 2017 109

REGIONAL REVIEWS CONTINUED
Americas
AMERICASOvera l l p roduc t ion inc reased, he lp ing to de l i ve r good per fo rmance, desp i te l oca l cur rency s t reng th in Braz i l . A ma iden Ore Reser ve was dec la red fo r Grama lo te in Co lombia
Picture: Serra Grande, BrazilINTEGRATED REPORT 2017 110

Ang loGo ld Ashant i has th ree min ing opera t ions – fea tu r ing open-p i t and underg round min ing – in i t s Amer icas reg ion . In add i t i on , an ac t i ve g reen f ie lds exp lo ra t ion p rog ramme is underway in Co lombia .
ArgentinaCerro Vanguardia, in which AngloGold Ashanti has a 92.5% stake, is the company’s sole operation in Argentina. Fomicruz, a state company, owns the remaining 7.5%. Located to the northwest of Puerto San Julián, in the province of Santa Cruz, Cerro Vanguardia operates multiple small open-pits with high stripping ratios and multiple narrow vein underground mines. The metallurgical plant
has a daily capacity of 3,000t and includes a cyanide recovery facility.
BrazilAngloGold Ashanti Córrego do Sítio Mineração (AGA Mineração), which is wholly owned, comprises two operational units located in the state of Minas Gerais, close to the city of Belo Horizonte:
• The Cuiabá complex includes the Cuiabá and Lamego mines and the Cuiabá and Queiroz plants. Cuiabá has been in operation for over 30 years while Lamego, also an underground mine, has been in operation for eight years. The Cuiabá mine has changed from cut-and-fill to sub-level stoping, increasing the contribution from narrow-vein ore bodies from 15% to 40% of the mine’s total production and improving rock engineering controls (support, design
and monitoring). Ore from the Cuiabá and Lamego mines is processed at the Cuiabá gold plant. The concentrate produced is transported 15km by aerial ropeway to the Queiroz plant for processing and refining. Total annual capacity of the complete Cuiabá circuit is 1.75Mt. The Queiroz hydrometallurgical plant also produces around 200,000t of sulphuric acid as a by-product, which is sold commercially in local Brazilian markets.
• Córrego do Sítio, in operation since 1989, consists of one oxide open-pit mine and one underground sulphide mine. The oxide ore is treated by heap leach and a pressure leaching plant treats the sulphide ore. The sub-level stoping mining method is used underground. The distance from the main underground mine (Mina I) to the metallurgical plant is around 15km. Annual plant capacity is 1.1Mt. Gold produced at both operations is refined at the Queiroz plant (141km away).
Serra Grande, wholly-owned by AngloGold Ashanti, is located in central Brazil in the state of Goiás, about 5km from the city of Crixás. It comprises three mechanised underground mines – Mina III, Mina Nova and Mina Palmeiras – as well as an open-pit. One dedicated metallurgical plant treats all ore mined. Annual plant capacity is 1.5Mt.
REGIONAL REVIEWS CONTINUED
Americas
Contribution to regional production
• Argentina
• Brazil %34
66
Contribution to group production
• Americas
• Rest of AngloGold Ashanti %
22
78
Click on the map below to enlarge
Picture: Cerro Vanguardia, ArgentinaINTEGRATED REPORT 2017 111

Key statisticsUnits 2017 2016 2015
Operational performance (1)
Tonnes treated/milled Mt 7.5 7.0 7.0
Pay limit oz/t 0.104 0.100 0.098
g/t 3.576 3.421 3.351
Recovered grade oz/t 0.102 0.106 0.108
g/t 3.49 3.64 3.71
Gold production (attributable) 000oz 840 820 948
– Continuing operations 000oz 840 820 831
– Discontinued operations 000oz – – 117
Silver (attributable) Moz 6.2 4.9 4.4
Total cash costs $/oz 638 578 576
Total production costs $/oz 973 909 845
All-in sustaining costs (2) $/oz 943 875 792
Capital expenditure (100% basis) $m 234 225 196
Productivity oz/TEC 13.34 13.98 15.05
Safety
Number of fatalities 0 1 1
AIFR per million hours worked 3.29 3.96 5.61
People
Average no. of employees: total (3) 8,511 8,126 7,679
– Permanent employees 5,888 5,653 5,492
– Contractors 2,623 2,473 2,187
Training and development expenditure (excluding Colombia) $m 2 2 2
REGIONAL REVIEWS CONTINUED
Americas
Production from continuing and discontinued operations(000oz)
996
948
840
820
1,0012013
2014
2015
2016
2017
Productivity(oz/TEC)
14.38
15.05
13.34
13.98
14.252013
2014
2015
2016
2017
INTEGRATED REPORT 2017 112

REGIONAL REVIEWS CONTINUED
Americas
Units 2017 2016 2015
Environment (excludes Colombia)
Total water consumption ML 8,283 8,067 10,839
Total water use per tonne treated kL/t 1.071 1.115 0.588
Energy usage PJ 4.23 3.94 4.86
Total energy usage per tonne treated GJ/t 0.55 0.54 0.26
Total greenhouse gas (GHG) emissions 000t CO2e 182 180 375
Total GHG emissions per tonne treated t CO2e/t 0.024 0.025 0.020
Cyanide used t 2,704 2,333 5,044
No. of reportable environmental incidents 0 1 1
Total rehabilitation liabilities (includes Colombia): $m 147 149 138
– restoration $m 106 108 100
– decommissioning $m 41 41 38
Community and government (includes Colombia)
Community expenditure $m 10 9 4
Payments to government $m 297 237 235
– Dividends $m 9 6 3
– Taxation $m 116 80 57
– Withholding tax (royalties, etc.) $m 53 50 48
– Other indirect taxes and duties $m 13 7 8
– Employee taxes and other contributions $m 84 71 82
– Property tax $m 2 3 3
– Other $m 20 20 34
(1) Operational performance data for the Americas region is for the continuing operations (excludes CC&V which was sold effective 3 August 2015), unless otherwise stated. (2) Excludes stockpile write-offs.(3) 100% basis and excluding Colombia and Denver regional office.
Key statistics (continued)AIFR(per million hours worked)
3.79
5.61
3.29
3.96
4.742013
2014
2015
2016
2017
Total cash costs and all-in sustaining costs($/oz)
1,011676
974
638943
576792
578875
6532013
2014
2015
2016
2017
Total cash costs All-in sustaining costs
INTEGRATED REPORT 2017 113

Operational performanceProductionProduction from the Americas region increased by 2%to 840,000oz in 2017, reflecting higher output from the Brazilian and Argentinian operations driven by operational improvements and an increase in tonnes treated.
In Brazil, at AGA Mineração, production increased 4% year-on-year, boosted by Córrego do Sítio’s strong performance, a result of improved geological modelling that assisted the recovery from the geotechnical challenges faced at the start of the year at the Córrego do Sítio complex. After a challenging start to 2017, various initiatives were implemented at the Cuiabá complex to improve future performance. These initiatives included the appointment of a new management team and adoption of an integrated planning system. The operation saw a 7% increase year-on-year in ore treated, an improvement which we believe to be sustainable. The challenges at Cuiabá were due to delays in development of infrastructure that hindered access to high-grade areas.
At Serra Grande, the production increase came despite lower feed grades and was driven by higher tonnes treated, supported by improved crushing and milling efficiencies and more efficient leaching, following the implementation of the carbon-in-leach project. These efficiencies were a result of Operational Excellence initiatives which led to
improved levels of ore mined, offsetting lower open-pit production.
The Operational Excellence initiatives focused on increasing open-pit mine production, new mine sequencing, development, HME availability, drilled Ore Reserve increment, debottlenecking the sulphide mine, improving plant performance and planning for the flotation tailings leaching project.
In Argentina, at Cerro Vanguardia, production increased to 283,000oz compared to the previous year, the highest level of production in 18 years. This achievement was driven mainly by the increase in tonnes treated at the plant together with operational and metallurgical improvements. In addition, the grades were higher year-on-year, a result of variability in the mining model.
CostsDespite the continued focus on cost management and production improvements, total cash costs for the Americas region were higher in 2017, due mainly to inflationary pressures, particularly salary adjustments, and also the stronger Brazilian Real compared with the previous year. In Brazil, costs were impacted by the lower grade feed, inflation and the 9% appreciation in the local currency against the US dollar. However, the cash costs increase in the region was partially offset by the 7% drop in total cash costs at Cerro Vanguardia, mainly due to record production,
higher by-product contribution and favourable stockpile movements.
At Cerro Vanguardia, various cost savings initiatives focused on improving efficiencies and production from the underground mine expansion, increasing mill throughput and silver recovery, and capital savings, among others. These cost saving initiatives are expected to continue to offset the combination of higher mining costs and the local currency impacts. Costs were also assisted by improved fleet availability and cost management initiatives implemented during the year, that resulted in price reductions being negotiated for key consumables such as fuel, ammonium nitrate, cyanide and crushing media. These positive factors were offset by inflationary pressures, particularly salary increases in Argentina that were agreed in October, as well as the elimination of the Patagonia ports rebates at the end of 2016, ending a 10% reimbursement from which Cerro Vanguardia had benefitted previously.
Capital expenditureRegional capital expenditure increased by 4%, mainly a result of the high level of planned sustaining capital investment in Brazil, owing to inflation and the stronger local currency. Most of the capital expenditure in Brazil was on Ore Reserve Development to improve mine flexibility and access to ore stopes. At Cerro Vanguardia, capital expenditure was lower compared to 2016, owing mainly to a depreciating Argentinian
peso against the US dollar. A more aggressive capital management approach was implemented across the region with all discretionary capital items being under strict review.
Growth and improvementApplication of the Operational Excellence principles to exploration, Ore Reserve development, mining and metallurgy is expected to yield improvements in productivity, with the region benefitting from ongoing asset optimisation work.
At AGA Mineração’s Cuiabá complex, a fourth working shift is to be introduced during 2018, which will assist in driving productivity gains. Plans are also underway to increase the annual tonnage of ore treated and to expand mill/plant throughput to 1.9Mt, followed by a further ramp-up towards 2.1Mtpa. An increased Ore Reserve conversion programme is expected to improve the mine plan’s reliability.
At Córrego do Sítio, work is underway to further improve development productivity levels. The rates at which the Mineral Resource is converted to Ore Reserve are increasing and work is underway to improve recovery rates to 94%, from 31.03% currently, in the coming years. Drilling campaigns continue to confirm the Ore Reserve that will extend the life of mine, including work on a new open-pit (Córrego do Sítio III) and the new underground mines at Mina II and São Bento Deep. Production increases will also be evaluated.
REGIONAL REVIEWS CONTINUED
Americas
INTEGRATED REPORT 2017 114

At Serra Grande, the Ingá orebody began production during the year, while the potential of the ore bodies at Mangaba and Corpo IV remain under evaluation. The mine delivered an 8% increase in ore treated year-on-year, a result of the plant’s CIL leaching conversion and continuous efficiency improvement initiatives. The Palmeiras South negotiations, aimed at reaching agreement on possible accelerated exploration to confirm the area’s potential, are at an advanced stage.
At Cerro Vanguardia, the mine plan was executed on schedule, following the initiative launched in 2015 to accelerate open-pit and underground operations to optimise economic performance over the remaining life of mine, and to potentially increase production. New projects and alternatives to extend life of mine will be assessed during 2018.
In Colombia, the greenfields exploration programmes were realigned and focused on minimising cost while maintaining future optionality. Force majeure was declared at the La Colosa project, stopping all activities, after a local referendum that was held on 26 March 2017. At Quebradona, following completion of a conceptual study in 2016, the focus in 2017 as the first
phase progressed was on evaluating the
alternatives to be considered during the
prefeasibility phase, which is expected to
be concluded in 2018. The alternatives
included mining methods, mine access
and project layout.
The Gramalote project, a joint venture
between AngloGold Ashanti (51% and
manager) and B2Gold (49%), declared its
maiden Ore Reserve of 63.7Mt @ 0.86 g/t
gold, at an attributable contained metal
content of 1.8Moz. Gramalote represents a
long-term option for AngloGold Ashanti, and
all avenues to realise value from this important
asset remain open. Work will continue to
optimise all aspects of the project during its
feasibility phase, which is currently under way.
AngloGold Ashanti is currently in discussions
with the joint venture partner, B2Gold, on how
to further progress the project, which lies on
the eastern flank of the Cordillera Central,
near the towns of Providencia and San Jose
del Nus in the municipality of San Roque, in
the northwest of the Antioquia Department. It
is approximately 230km north-west of Bogota
and 124km north-east of Medellin. For details
on this project, see our full year results report
on www.anglogoldashanti.com.
REGIONAL REVIEWS CONTINUED
Americas
Picture: Serra Grande, BrazilINTEGRATED REPORT 2017 115

Sustainability performanceSafetyIn an effort to further instill AngloGold Ashanti’s safety culture and promote proactive safe behaviour on site at Cerro Vanguardia, an external consultant was hired to conduct a training programme. Safety leadership training as well as accident investigation training, based on the AngloGold Ashanti methodology, were also conducted during the year. Meetings were also held with managers and their teams on monthly and bi-monthly basis to proactively detect unsafe activities and sub-standard conditions, and to analyse work planning and processes, in line with the group safety strategy.
In Brazil, safety and health projects were executed as planned in 2017. A highlight was the four-layered approach to safety risk management that was fully implemented at our operations in Brazil. This first layer is the baseline risk assessment of all operational production processes using the workplace risk assessment and control (WRAC) tool. High-risk events identified are then subject to a Bow-Tie analysis to identify potential outcomes, prevention measures and recovery controls. These initiatives have allowed the Brazilian operations to record zero fatalities in 2017 and to achieve a 14% improvement in the all injuries frequency rate to 3.98.
HealthAngloGold Ashanti’s health policy includes a focus on employee wellness programmes. At Cerro Vanguardia, various activities were undertaken to promote awareness of healthy living, including periodic medical examinations for all employees. In Brazil, a new occupational hygiene manual was issued to provide better information and an emphasis on preventing occupational diseases and promoting a healthy workplace. Several initiatives started in the year will continue in 2018, such as studies on noise and dust and on heavy equipment operator fatigue.
EnvironmentThere were no reportable environmental incidents in the region during 2017.
In Brazil, at Córrego do Sítio, critical operational licences were obtained during the year, including the permit for exploration at Córrego do Sítio I and at Santa Quitéria, and the permit for the Rosalino pit expansion.
Cerro Vanguardia is in the process of updating its environmental impact and mine closure reports to present to the environmental authority. External consulting firms have been hired who, together with our staff, have developed workshops to review and if needed, define mine-closure
methodologies. Additionally, a project is underway to obtain certification for the updated environmental management standard, ISO 14001: 2015.
Other environmental projects such as fish farming in the El Carbon and El Cututo lagoons in the proximity of Cerro Vanguardia continued during 2017, as did the revegetation project at the Cascote pit dump, where new methodologies for the planting of indigenous vegetable species are being developed.
All operations in the Americas region are ISO 14001 compliant and are certified compliant in terms of the cyanide code.
At Gramalote, our commitments regarding the use of water, waste management, fauna and flora management, and archaeology complied with our legal obligations in respect of the environmental licence. Following modification to the Gramalote project design, adjustments to the approved environmental licence will be sought in 2018. This will be to update the new locations of the infrastructure and adjust the anticipated social and environmental impacts.
The force majeure has been declared for one year. Consequently, field activities and all environmental commitments have been
suspended. The project will be maintained in good standing until the matter is resolved. It is expected that the force majeure will be renewed in October 2018.
CommunitiesIn Brazil, social investment in communities prioritise projects focused on culture, social development, health, income generation and environmentally sustainable solutions. Major projects implemented include:
• Sustainable Partnerships Programme (Public call for projects): Social projects supported by the company are selected by a committee comprising AngloGold Ashanti, specialists in social projects and community representatives, in line with the open and transparent management of social investments. In 2017, more than $400,000 was invested in 25 projects.
• Tax incentives: In Brazil, specific laws allow the company to invest part of its income tax due, in projects approved by the federal government in areas such as culture, sport, children and youth, elderly and disabled people, as well as health (particularly oncology). In 2017, AngloGold Ashanti invested around $2m in initiatives implemented for the benefit of cities surrounding its operations.
REGIONAL REVIEWS CONTINUED
Americas
INTEGRATED REPORT 2017 116

• Volunteerism: The Holding Hands Programme, established in 2004, has benefited more than 30,000 people through more than 140 activities (3,600 voluntary participants) over the years. The programme aims to encourage employees to become involved in and to contribute to social causes within local municipalities where the company operates.
• Tailing dams management: Since 2015, the tailings dam management programme has been reinforced. Activities in 2017 included registration of the residents who live in areas nearest to the dams (the Sabará, Nova Lima and Santa Barbara municipalities) meetings and operational visits arranged through the Good Neighbourhood programme. The Good Neighbourhood programme aims to strengthen relations and facilitate dialogue with communities. Highlights in 2017 were the first community training and simulated emergency test, conducted with the community of Pompeu (close to the
Cuiabá plant). All activities were conducted in partnership with the Civil Defence from Sabará and from the State of Minas Gerais. Representatives from local authorities and public organisations were also involved.
In Argentina, Cerro Vanguardia has engaged with the community of San Julián since the start of operations more than 20 years ago. In 2004, a development agency was established in collaboration with the mine, local and provincial authorities, the university, the rural association and the Chamber of Commerce. The work of this agency has been financed by the mine since its inception. In 2017, an agreement signed in 2010 was renewed. Through this contract, working with the development agency and the city of San Julian, Cerro Vanguardia financed the following, amongst other projects:
• remediation of the existing landfill of San Julian
• acquisition of two fuel depots for the San Julian Airport so that commercial flights to the area may resume
• contributions to the local municipality to acquire an old wool barrack to be used as a “Centre for the Production of Regional Articles and Events”
• contributing to projects approved by the development agency, such as supplying equipment for the manufacture and design of furniture, farming, a carwash, a carpentry workshop, a multi-purpose sports centre and the acquisition of machine and raw materials for the production of loom garments.
In Colombia, at Gramalote, work advanced on planning for and determining the baseline of the social and economic resettlement, as well as on the artisanal mining co-existence project (for which no firm commitments have yet been made). Both programmes were adjusted in line with the project update and the prefeasibility study (adjustments were mainly associated with the location of infrastructure). The plan in 2018 is to continue to develop the implementation plan, and to finalise the baseline for the economic and physical resettlement plan to ensure
it is ready to implement should the project advance to the construction phase.
At La Colosa, at a consultation held in March 2017 in Cajamarca (the municipality where the deposits are located), the community voted to forbid mining activities within their territory.
Following the outcome of the referendum, AngloGold Ashanti took the decision to pause much of the current fieldwork around the project while studying the impact on any future investment. In the meantime, we continue the necessary engagements with all stakeholders as we try to build consensus around the creation of a modern, environmentally responsible gold-mining industry in Colombia. This will, however, result in lower project expenditure, and a reduction in our investment around the town of Cajamarca, while this process is underway.
REGIONAL REVIEWS CONTINUED
Americas
INTEGRATED REPORT 2017 117

FIVE-YEAR STATISTICS BY OPERATIONOperational, financial and sustainability statistics
Production metricsAttributable tonnes treated/milled (Mt)
2017 2016 2015 2014 2013
South Africa 38.9 39.6 36.8 38.4 39.2Vaal River
Great Noligwa (1) 0.4 0.4Kopanang 0.6 0.6 0.7 0.8 1.0Moab Khotsong 1.1 1.0 0.9 0.7 0.7West Wits
Mponeng 1.0 1.1 0.8 1.1 1.6TauTona (including Savuka) 0.4 0.6 0.8 0.9 1.0Surface Operations
Surface Operations (2) 35.8 36.4 33.6 34.5 34.5Continental Africa 28.0 27.6 27.2 29.9 26.9DRC
Kibali (45%) (3) 3.4 3.3 3.1 2.5 0.4Ghana
Iduapriem 5.1 5.1 4.7 4.9 4.8Obuasi (4) – – 1.0 2.2 1.7Guinea
Siguiri (85%) 9.9 10.3 10.0 10.1 10.2Mali
Morila (40%) 2.2 1.5 1.2 1.3 1.4Sadiola (41%) 2.1 2.0 2.1 2.1 2.0Yatela (40%) (5) 0.9 1.0Namibia
Navachab (6) 0.7 1.4Tanzania
Geita 5.4 5.4 5.2 5.2 4.0
See footnotes overleaf
INTEGRATED REPORT 2017 118

FIVE-YEAR STATISTICS BY OPERATION CONTINUED
Operational, financial and sustainability statistics continued
Attributable tonnes treated/milled (Mt)
2017 2016 2015 2014 2013
Australasia 9.4 8.9 8.2 7.8 4.3Australia
Sunrise Dam 4.0 4.0 3.9 3.8 3.4Tropicana (70%) (3) 5.4 4.8 4.3 4.0 0.9Americas 7.5 7.0 7.0 6.8 5.9Argentina
Cerro Vanguardia (92.5%) 3.1 2.9 3.1 3.0 2.3Brazil
AGA Mineração 3.0 2.8 2.6 2.5 2.3Serra Grande 1.4 1.3 1.3 1.3 1.3CONTINUING OPERATIONS 83.8 83.1 79.1 82.9 76.3Discontinued operations
Cripple Creek & Victor (7) 11.3 19.3 20.8Total 83.8 83.1 90.4 102.2 97.1
(1) Great Noligwa and Moab Khotsong are treated as one cash-generating unit from 1 January 2015(2) For the purposes of this report, Surface Operations includes MWS, which is operated and managed as a separate cash-generating unit(3) Kibali and Tropicana began production in the fourth quarter of 2013(4) Obuasi was placed on limited operations at the end of 2014. In 2016, Obuasi was on care and maintenance(5) Yatela mine in closure from 2015(6) Sold effective 30 June 2014(7) Sold effective 3 August 2015
Production metrics (continued)
INTEGRATED REPORT 2017 119

FIVE-YEAR STATISTICS BY OPERATION CONTINUED
Operational, financial and sustainability statistics continued
Production metrics (continued)
Average grade recovered (g/t) Attributable gold production (000oz)
2017 2016 2015 2014 2013 2017 2016 2015 2014 2013
South Africa 903 967 1,004 1,223 1,302Vaal RiverGreat Noligwa (1) 6.44 6.15 78 83Kopanang 4.68 5.09 5.43 5.55 5.23 91 91 117 140 178Moab Khotsong 8.15 9.05 8.50 11.04 9.47 294 280 254 234 212West WitsMponeng 7.33 7.90 8.44 8.99 7.10 224 254 219 313 354TauTona (including Savuka) 6.56 7.59 8.46 8.21 7.34 91 146 209 232 235Surface OperationsSurface Operations (2) 0.17 0.16 0.18 0.20 0.22 192 186 193 223 240TechnologyTechnology 11 10 12 3Continental Africa 1,453 1,321 1,435 1,597 1,460DRCKibali (45%) (3) 2.44 2.49 2.93 2.95 3.41 268 264 289 237 40GhanaIduapriem 1.40 1.30 1.27 1.13 1.43 228 214 193 177 221Obuasi (4) – – 1.47 4.67 4.94 3 3 53 243 239GuineaSiguiri (85%) 1.01 0.79 0.80 0.89 0.82 324 259 255 290 268MaliMorila (40%) 0.40 0.45 1.24 1.06 1.23 28 22 49 44 57Sadiola (41%) 0.96 1.09 1.04 1.28 1.34 63 70 69 85 86Yatela (40%) (5) 0.59 0.93 11 27NamibiaNavachab (6) 1.44 1.39 33 63TanzaniaGeita 3.13 2.74 3.18 2.86 3.54 539 489 527 477 459
INTEGRATED REPORT 2017 120
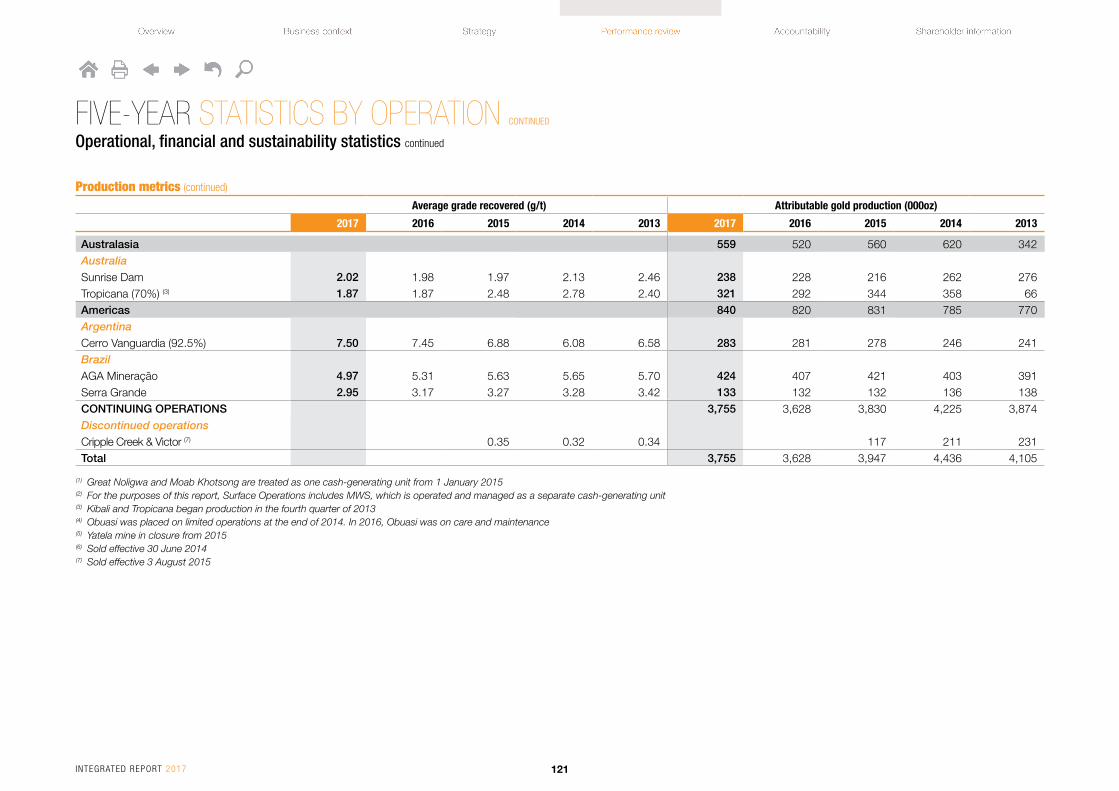
FIVE-YEAR STATISTICS BY OPERATION CONTINUED
Operational, financial and sustainability statistics continued
Average grade recovered (g/t) Attributable gold production (000oz)
2017 2016 2015 2014 2013 2017 2016 2015 2014 2013
Australasia 559 520 560 620 342Australia
Sunrise Dam 2.02 1.98 1.97 2.13 2.46 238 228 216 262 276Tropicana (70%) (3) 1.87 1.87 2.48 2.78 2.40 321 292 344 358 66Americas 840 820 831 785 770Argentina
Cerro Vanguardia (92.5%) 7.50 7.45 6.88 6.08 6.58 283 281 278 246 241Brazil
AGA Mineração 4.97 5.31 5.63 5.65 5.70 424 407 421 403 391Serra Grande 2.95 3.17 3.27 3.28 3.42 133 132 132 136 138CONTINUING OPERATIONS 3,755 3,628 3,830 4,225 3,874Discontinued operations
Cripple Creek & Victor (7) 0.35 0.32 0.34 117 211 231Total 3,755 3,628 3,947 4,436 4,105
(1) Great Noligwa and Moab Khotsong are treated as one cash-generating unit from 1 January 2015(2) For the purposes of this report, Surface Operations includes MWS, which is operated and managed as a separate cash-generating unit(3) Kibali and Tropicana began production in the fourth quarter of 2013(4) Obuasi was placed on limited operations at the end of 2014. In 2016, Obuasi was on care and maintenance(5) Yatela mine in closure from 2015(6) Sold effective 30 June 2014(7) Sold effective 3 August 2015
Production metrics (continued)
INTEGRATED REPORT 2017 121
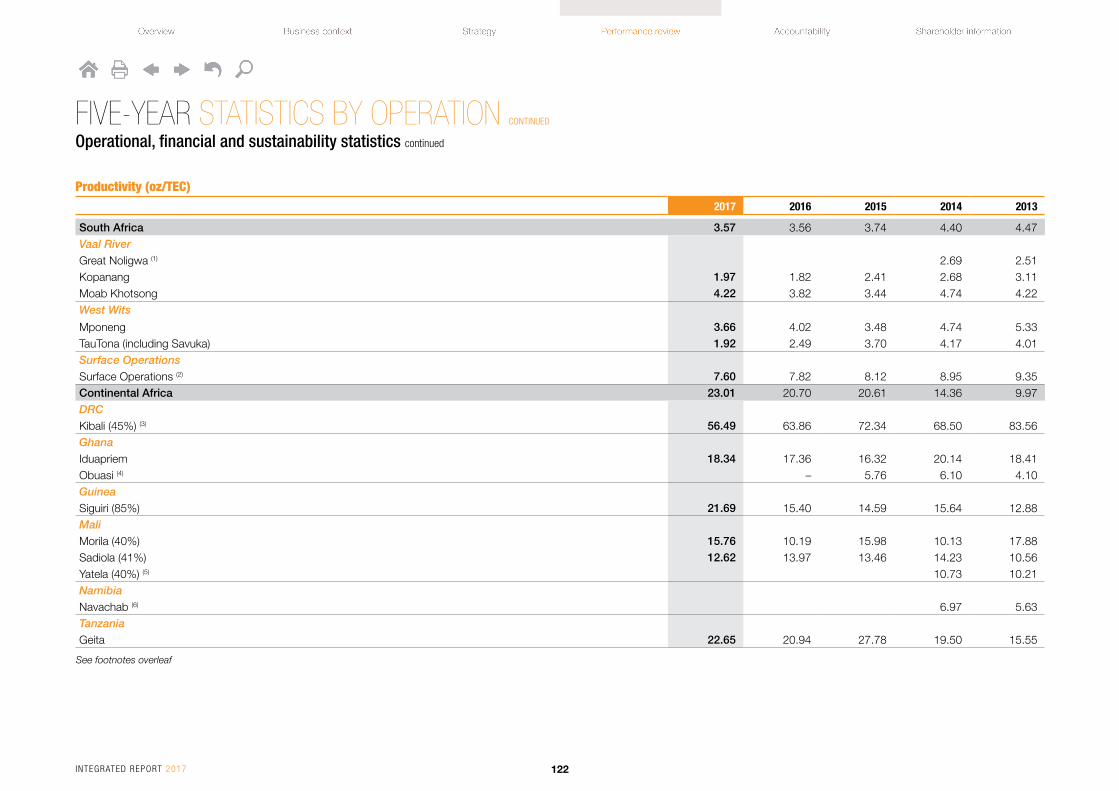
FIVE-YEAR STATISTICS BY OPERATION CONTINUED
Operational, financial and sustainability statistics continued
Productivity (oz/TEC)2017 2016 2015 2014 2013
South Africa 3.57 3.56 3.74 4.40 4.47Vaal River
Great Noligwa (1) 2.69 2.51Kopanang 1.97 1.82 2.41 2.68 3.11Moab Khotsong 4.22 3.82 3.44 4.74 4.22West Wits
Mponeng 3.66 4.02 3.48 4.74 5.33TauTona (including Savuka) 1.92 2.49 3.70 4.17 4.01Surface Operations
Surface Operations (2) 7.60 7.82 8.12 8.95 9.35Continental Africa 23.01 20.70 20.61 14.36 9.97DRC
Kibali (45%) (3) 56.49 63.86 72.34 68.50 83.56Ghana
Iduapriem 18.34 17.36 16.32 20.14 18.41Obuasi (4) – 5.76 6.10 4.10Guinea
Siguiri (85%) 21.69 15.40 14.59 15.64 12.88Mali
Morila (40%) 15.76 10.19 15.98 10.13 17.88Sadiola (41%) 12.62 13.97 13.46 14.23 10.56Yatela (40%) (5) 10.73 10.21Namibia
Navachab (6) 6.97 5.63Tanzania
Geita 22.65 20.94 27.78 19.50 15.55
See footnotes overleaf
INTEGRATED REPORT 2017 122

FIVE-YEAR STATISTICS BY OPERATION CONTINUED
Operational, financial and sustainability statistics continued
2017 2016 2015 2014 2013
Australasia 47.87 46.81 55.84 62.00 49.64Australia
Sunrise Dam 40.58 44.96 45.09 58.29 50.22Tropicana (70%) (3) 55.20 48.36 65.69 65.03 47.37Americas 13.34 13.98 15.05 14.38 14.25Argentina
Cerro Vanguardia (92.5%) 20.97 22.05 22.82 21.14 20.89Brazil
AGA Mineração 11.66 12.36 13.58 13.03 12.97Serra Grande 10.13 10.13 10.97 11.32 11.19CONTINUING OPERATIONS 9.66 8.97 9.50 9.30 7.77Discontinued operations
Cripple Creek & Victor (7) 29.63 33.33 37.45
(1) Great Noligwa and Moab Khotsong are treated as one cash-generating unit from 1 January 2015(2) For the purposes of this report, Surface Operations includes MWS, which is operated and managed as a separate cash-generating unit(3) Kibali and Tropicana began production in the fourth quarter of 2013(4) Obuasi was placed on limited operations at the end of 2014. In 2016, Obuasi was on care and maintenance(5) Yatela mine in closure from 2015(6) Sold effective 30 June 2014(7) Sold effective 3 August 2015
Productivity (oz/TEC) (continued)
INTEGRATED REPORT 2017 123

FIVE-YEAR STATISTICS BY OPERATION CONTINUED
Operational, financial and sustainability statistics continued
CostsTotal cash costs ($/oz produced)
All-in sustaining costs (8)
($/oz sold)
2017 2016 2015 2014 2013 2017 2016 2015 2014 2013
South Africa 1,085 896 881 849 850 1,245 1,081 1,088 1,064 1,120Vaal River
Great Noligwa (1) 1,074 1,100 1,185 1,305Kopanang 1,534 1,324 1,014 1,023 918 1,593 1,555 1,226 1,256 1,255Moab Khotsong 779 729 798 685 797 938 884 1,018 903 1,223West Wits
Mponeng 1,014 779 874 746 719 1,259 1,011 1,170 981 1,016TauTona (including Savuka) 2,044 1,148 883 882 920 2,242 1,345 1,044 1,059 1,149Surface Operations
Surface Operations (2) 969 899 912 941 883 1,045 1,004 1,006 1,153 969Continental Africa 720 717 678 783 869 953 904 815 968 1,202DRC
Kibali (45%) (3) 784 740 609 578 471 1,090 893 642 588 529Ghana
Iduapriem 823 908 995 865 861 1,033 950 1,020 1,020 1,025Obuasi (4) 167 966 1,086 1,406 440 1,185 1,374 2,214Guinea
Siguiri (85%) 725 784 827 799 918 796 915 965 917 1,085Mali
Morila (40%) 974 1,123 698 1,162 773 1,218 1,337 815 1,298 1,051Sadiola (41%) 900 991 818 1,028 1,334 1,019 1,066 886 1,133 1,510Yatela (40%) (5) 1,438 1,530 1,795 1,653Namibia
Navachab (6) 752 691 719 781Tanzania
Geita 608 530 480 599 515 941 844 717 890 833
See footnotes overleaf
INTEGRATED REPORT 2017 124

FIVE-YEAR STATISTICS BY OPERATION CONTINUED
Operational, financial and sustainability statistics continued
Total cash costs ($/oz produced)
All-in sustaining costs (8)
($/oz sold)
2017 2016 2015 2014 2013 2017 2016 2015 2014 2013
Australasia 743 793 702 804 1,047 1,062 1,067 875 986 1,376Australia
Sunrise Dam 919 926 970 1,105 1,110 1,203 1,080 1,110 1,214 1,321Tropicana (70%) (3) 564 630 492 545 568 885 970 671 752 1,113Americas 638 578 576 676 653 943 875 792 974 1,011Argentina
Cerro Vanguardia (92.5%) 522 563 625 692 622 772 773 873 938 912Brazil
AGA Mineração 671 562 518 644 646 1,006 893 712 966 1,023Serra Grande 764 634 635 748 719 1,103 1,020 861 1,062 970CONTINUING OPERATIONS 792 744 712 785 836 1,054 986 910 1,020 1,195Discontinued operations
Cripple Creek & Victor (7) 894 829 732 1,030 1,147 927
(1) Great Noligwa and Moab Khotsong are treated as one cash-generating unit from 1 January 2015 (2) For the purposes of this report, Surface Operations includes MWS, which is operated and managed as a separate cash-generating unit (3) Kibali and Tropicana began production in the fourth quarter of 2013 (4) Obuasi was placed on limited operations at the end of 2014. In 2016, Obuasi was on care and maintenance (5) Yatela mine in closure from 2015 (6) Sold effective 30 June 2014 (7) Sold effective 3 August 2015. Numbers included to the date of disposal (8) Excludes stockpile write-offs
Costs (continued)
INTEGRATED REPORT 2017 125

FIVE-YEAR STATISTICS BY OPERATION CONTINUED
Operational, financial and sustainability statistics continued
Capital expenditure ($m)2017 2016 2015 2014 2013
South Africa 150 182 206 264 451Vaal RiverGreat Noligwa (1) 7 13Kopanang 8 16 21 26 52Moab Khotsong 42 42 47 45 117West WitsMponeng 72 76 85 97 171TauTona (including Savuka) 13 25 28 35 59Surface OperationsSurface Operations (2) 12 17 17 46 39TechnologyTechnology 3 6 8 8Continental Africa 409 291 315 454 839DRCKibali (45%) (3) 110 92 124 179 341GhanaIduapriem 51 8 15 21 28Obuasi (4) – 6 23 82 196GuineaSiguiri (85%) 70 50 25 26 25MaliMorila (40%) 2 1 6 6 13Sadiola (41%) 7 7 2 6 42Yatela (40%) 3NamibiaNavachab (5) 1 5TanzaniaGeita 157 119 116 129 154Other and non-controlling interests 12 8 4 4 32
See footnotes overleaf
INTEGRATED REPORT 2017 126

FIVE-YEAR STATISTICS BY OPERATION CONTINUED
Operational, financial and sustainability statistics continued
2017 2016 2015 2014 2013
Australasia 153 109 78 91 285Australia
Sunrise Dam 62 32 29 31 39Tropicana (70%) (3) 91 77 48 59 241Other – – 1 1 5Americas 234 225 196 225 253Argentina
Cerro Vanguardia (92.5%) 54 55 62 54 64Brazil
AGA Mineração 136 122 89 127 123Serra Grande 38 43 33 38 40Other and non-controlling interests 6 5 12 6 26Other 7 4 4 6 8CONTINUING OPERATIONS 953 811 799 1,040 1,836Discontinued operations
Cripple Creek & Victor (6) 58 169 157Sub-total 953 811 857 1,209 1,993Equity-accounted investments (123) (100) (131) (191) (411)Total 830 711 726 1,018 1,582
(1) Great Noligwa and Moab Khotsong are treated as one cash-generating unit from 1 January 2015(2) For the purposes of this report, Surface Operations includes MWS, which is operated and managed as a separate cash generating unit(3) Kibali and Tropicana began production in the fourth quarter of 2013(4) Obuasi was placed on limited operations at the end of 2014. In 2016, Obuasi was on care and maintenance(5) Sold effective 30 June 2014(6) Sold effective 3 August 2015
Capital expenditure ($m) (continued)
INTEGRATED REPORT 2017 127

FIVE-YEAR STATISTICS BY OPERATION CONTINUED
Operational, financial and sustainability statistics continued
Average number of employees (permanent and contractor employees)2017 2016 2015 2014 2013
South Africa 26,245 28,507 28,325 29,511 32,406 Vaal RiverGreat Noligwa (1) 2,207 2,731 Kopanang 3,879 4,055 4,052 4,424 5,365 Moab Khotsong 6,143 6,310 6,469 4,573 5,692 West WitsMponeng 5,962 6,105 6,249 6,737 6,516 TauTona (including Savuka) 3,822 4,723 4,656 4,712 5,256 Surface OperationsSurface Operations (2) 3,161 3,140 2,929 3,058 2,142 Other 3,278 4,174 3,970 3,800 4,704 Continental Africa 13,593 12,691 11,942 16,070 16,625 DRCKibali (45%) (3) 2,428 2,180 2,061 2,245 158 GhanaIduapriem 1,598 1,576 1,565 1,352 1,590 Obuasi (4) 1,066 766 856 3,541 5,194 GuineaSiguiri (85%) 3,353 3,509 3,445 3,494 3,673 MaliMorila (40%) 305 324 389 500 390 Sadiola (41%) 592 588 585 654 810 Yatela (40%) (5) 226 367 NamibiaNavachab (6) 793 938 TanzaniaGeita 4,251 3,748 3,041 3,265 3,504
See footnotes overleaf
INTEGRATED REPORT 2017 128

FIVE-YEAR STATISTICS BY OPERATION CONTINUED
Operational, financial and sustainability statistics continued
2017 2016 2015 2014 2013
Australasia 974 925 836 832 925 Australia
Sunrise Dam 489 422 400 374 457 Tropicana (70%) (3) 485 503 436 458 468 Americas 8,511 8,126 7,679 7,441 7,542 Argentina
Cerro Vanguardia (92.5%) 2,001 1,877 1,687 1,640 1,696 Brazil
AGA Mineração 4,932 4,662 4,546 4,398 4,377 Serra Grande 1,578 1,587 1,446 1,403 1,469 Other, including corporate and non-gold producing subsidiaries 2,157 2,400 2,731 3,056 8,104 CONTINUING OPERATIONS 51,480 52,649 51,513 56,910 65,602 Discontinued operations
Cripple Creek & Victor (7) 753 1,147 832 Total 51,480 52,649 52,266 58,057 66,434
(1) Great Noligwa and Moab Khotsong are treated as one cash-generating unit from 1 January 2015 (2) For the purposes of this report, Surface Operations includes MWS, which is operated and managed as a separate cash-generating unit (3) Kibali and Tropicana began production in the fourth quarter of 2013 (4) Obuasi was placed on limited operations at the end of 2014. In 2016, Obuasi was on care and maintenance (5) Yatela mine in closure from 2015 (6) Sold effective 30 June 2014 (7) Sold effective 3 August 2015. Employee numbers included to the date of disposal
Average number of employees (permanent and contractor employees) (continued)
INTEGRATED REPORT 2017 129

FIVE-YEAR STATISTICS BY OPERATION CONTINUED
Operational, financial and sustainability statistics continued
SafetyAll injury frequency rate (1) Number of fatalities
2017 2016 2015 2014 2013 2017 2016 2015 2014 2013
South Africa 12.68 12.02 10.81 11.85 12.63 7 6 9 4 6Vaal RiverGreat Noligwa (2) 15.44 12.06 0 0Kopanang 20.99 21.37 17.50 13.56 17.58 2 1 1 1 0Moab Khotsong 15.55 12.58 13.54 18.62 16.35 1 0 2 0 1West WitsMponeng 18.88 15.77 13.37 16.33 17.86 4 1 3 3 3TauTona (including Savuka) 12.79 17.97 11.88 12.60 14.16 0 4 1 0 1Surface OperationsSurface Operations (3) 4.21 5.63 5.14 5.42 5.08 0 0 1 0 0Other 0 0 1 0 1Continental Africa 0.39 0.51 0.50 1.56 1.97 0 0 1 0 2DRCMongbwalu 1.98 6.15 0 0GhanaIduapriem 0.39 0.42 0.00 1.06 1.98 0 0 0 0 1Obuasi (4) – 0.30 1.28 3.01 2.39 0 0 1 0 1GuineaSiguiri 0.13 0.13 0.13 0.39 0.64 0 0 0 0 0MaliSadiola 1.25 1.56 0.51 0.50 1.28 0 0 0 0 0Yatela 2.34 0.95 0.00 0.00 0 0 0 0 0NamibiaNavachab (5) 6.39 5.58 0 0TanzaniaGeita 0.43 0.39 0.47 0.51 0.98 0 0 0 0 0
See footnotes overleaf
INTEGRATED REPORT 2017 130

FIVE-YEAR STATISTICS BY OPERATION CONTINUED
Operational, financial and sustainability statistics continued
All injury frequency rate (1) Number of fatalities
2017 2016 2015 2014 2013 2017 2016 2015 2014 2013
Australasia 8.53 9.49 8.56 10.73 7.91 0 0 0 0 0AustraliaSunrise Dam 12.10 8.24 11.59 12.54 11.19 0 0 0 0 0Tropicana (6) 6.11 10.87 6.80 9.96 8.60 0 0 0 0 0Americas 3.29 3.96 5.61 3.79 4.74 0 1 1 2 0ArgentinaCerro Vanguardia 1.77 2.39 1.63 1.40 0.58 0 0 0 0 0BrazilAGA Mineração 3.48 3.46 5.51 4.22 5.94 0 1 1 2 0Serra Grande 5.49 8.05 9.49 4.53 6.10 0 0 0 0 0Colombia 1.26 2.56 1.64 0.32 2.51 0 0 0 0 0United StatesCripple Creek & Victor 19.47 9.54 9.89 0 0 0Greenfields exploration 2.24 2.52 7.96 3.57 4.20 0 0 0 0 0Total 7.49 7.71 7.18 (7) 7.36 7.48 7 7 11 6 8
(1) Per million hours worked (2) Great Noligwa and Moab Khotsong are treated as one cash-generating unit from 1 January 2015 (3) For the purposes of this report, Surface Operations includes MWS, which is operated and managed as a separate cash-generating unit (4) Obuasi was placed on limited operations at the end of 2014. In 2016 and 2017, Obuasi was on care and maintenance (5) Sold effective 30 June 2014 (6) Tropicana began production in the fourth quarter of 2013 (7) All injury frequency rate for the group adjusted for the earthquake impact is 7.15
Safety (continued)
INTEGRATED REPORT 2017 131

FIVE-YEAR STATISTICS BY OPERATION CONTINUED
Operational, financial and sustainability statistics continued
Environmental performance (1)
Energy usage (PJ) Water usage (ML)
2017 2016 2015 2014 2013 2017 2016 2015 2014 2013
South Africa 10.05 10.54 10.65 11.31 11.80 20,503 23,161 25,182 27,219 27,228Vaal River (2) 4.61 4.87 (6) 4.89 5.31 5.63 10,813 12,275 13,259 13,402 14,331West Wits (2) 4.61 4.93 5.03 5.24 5.54 3,688 4,411 3,949 2,626 3,160Mine Waste Solutions 0.83 0.74 0.73 0.76 0.62 6,002 6,475 7,974 11,191 9,737Continental Africa 9.17 8.46 (6) 8.41 (6) 9.47 12.01 16,651 11,911 16,931 17,582 21,031Ghana
Iduapriem 1.46 1.02 0.89 0.62 1.25 2,137 936 750 342 795Obuasi (3) 0.26 0.30 0.56 1.46 1.77 – – 3,129 3,696 3,685Guinea
Siguiri 2.40 2.58 (6) 2.50 (6) 2.36 2.31 6,349 3,395 5,145 5,375 6,478Mali
Sadiola 1.55 1.40 1.40 1.59 2.11 3,476 3,940 4,625 4,051 4,330Yatela – 0.10 0.12 0.24 0.52 – 4 33 17 254Namibia
Navachab (3) 0.74 1,005Tanzania
Geita 3.49 3.07 2.93 3.21 3.32 4,689 3,637 3,249 4,101 4,484Australasia 6.32 5.62 5.14 5.52 2.81 6,783 7,577 6,648 6,749 3,925Australia
Sunrise Dam 2.18 2.03 1.97 2.29 2.14 1,115 1,779 1,772 1,866 1,828Tropicana (4,5) 4.14 3.59 3.17 3.23 0.73 5,668 5,798 4,876 4,883 (5) 2,097
See footnotes overleaf
INTEGRATED REPORT 2017 132

FIVE-YEAR STATISTICS BY OPERATION CONTINUED
Operational, financial and sustainability statistics continued
Energy usage (PJ) Water usage (ML)
2017 2016 2015 2014 2013 2017 2016 2015 2014 2013
Americas 4.23 3.94 4.86 6.04 6.06 8,283 8,067 10,839 12,170 11,732Argentina
Cerro Vanguardia 1.90 1.76 1.69 1.71 1.72 1,487 1,152 1,121 1,079 964Brazil
AGA Mineração 1.77 1.64 1.53 1.48 1.40 5,292 5,292 5,959 6,233 6,346Serra Grande 0.56 0.54 0.48 0.48 0.45 1,504 1,623 1,507 1,921 1,379United States
Cripple Creek & Victor 1.16 2.37 2.42 2,252 2,937 3,042Total 29.76 28.55 (6) 29.06 (6) 32.34 32.68 52,219 50,716 59,601 63,721 63,916
(1) Refer to the <SDR> for definitions of these environmental indicators(2) These include consumption by Surface Operations’ facilities located in these areas(3) Sold effective 30 June 2014(4) Excludes pre-production water use at Tropicana(5) Tropicana began production in the fourth quarter of 2013(6) Restated due to error in source data for 2014 and 2015
Environmental performance (1) (continued)
INTEGRATED REPORT 2017 133

FIVE-YEAR STATISTICS BY OPERATION CONTINUED
Operational, financial and sustainability statistics continued
GHG emissions (000t CO2e) No. of reportable environmental incidents
2017 2016 2015 2014 2013 2017 2016 2015 2014 2013
South Africa 2,733 2,864 2,756 2,981 3,025 1 0 1 1 3
Vaal River (2) 1,242 1,282 (5) 1,232 1,360 1,415 0 0 1 0 0West Wits (2) 1,290 1,375 1,331 1,420 1,445 0 0 0 0 0Mine Waste Solutions 201 207 193 201 165 1 0 0 1 3Continental Africa 666 682 (5) 694 (5) 824 969 2 0 2 4 5Ghana
Iduapriem 124 108 95 74 113 0 0 0 0 1Obuasi (4) 36 41 79 198 199 2 0 2 1 3Guinea
Siguiri 163 194 (5) 189 (5) 178 175 0 0 0 0 0Mali
Sadiola 106 104 104 118 156 0 0 0 0 0Yatela – 7 9 18 38 0 0 0 0 0Namibia
Navachab (3) 42 0 0Tanzania
Geita 238 228 218 238 246 0 0 0 3 1Australasia 372 336 336 359 174 0 0 0 0 2Australia
Sunrise Dam 122 113 116 135 123 0 0 0 0 0Tropicana (5) 250 223 220 224 51 0 0 0 0 2
Environmental performance (1) (continued)
See footnotes overleaf
INTEGRATED REPORT 2017 134
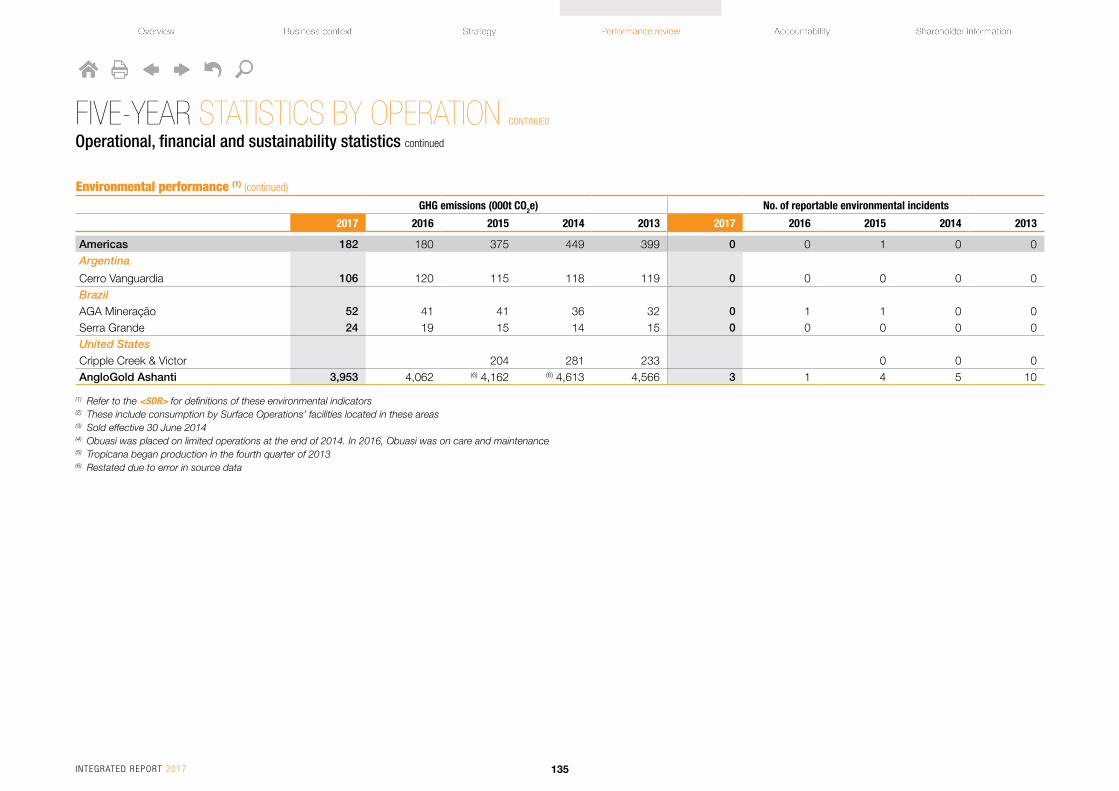
FIVE-YEAR STATISTICS BY OPERATION CONTINUED
Operational, financial and sustainability statistics continued
GHG emissions (000t CO2e) No. of reportable environmental incidents
2017 2016 2015 2014 2013 2017 2016 2015 2014 2013
Americas 182 180 375 449 399 0 0 1 0 0Argentina
Cerro Vanguardia 106 120 115 118 119 0 0 0 0 0Brazil
AGA Mineração 52 41 41 36 32 0 1 1 0 0Serra Grande 24 19 15 14 15 0 0 0 0 0United States
Cripple Creek & Victor 204 281 233 0 0 0AngloGold Ashanti 3,953 4,062 (6) 4,162 (6) 4,613 4,566 3 1 4 5 10
(1) Refer to the <SDR> for definitions of these environmental indicators(2) These include consumption by Surface Operations’ facilities located in these areas(3) Sold effective 30 June 2014(4) Obuasi was placed on limited operations at the end of 2014. In 2016, Obuasi was on care and maintenance(5) Tropicana began production in the fourth quarter of 2013(6) Restated due to error in source data
Environmental performance (1) (continued)
INTEGRATED REPORT 2017 135
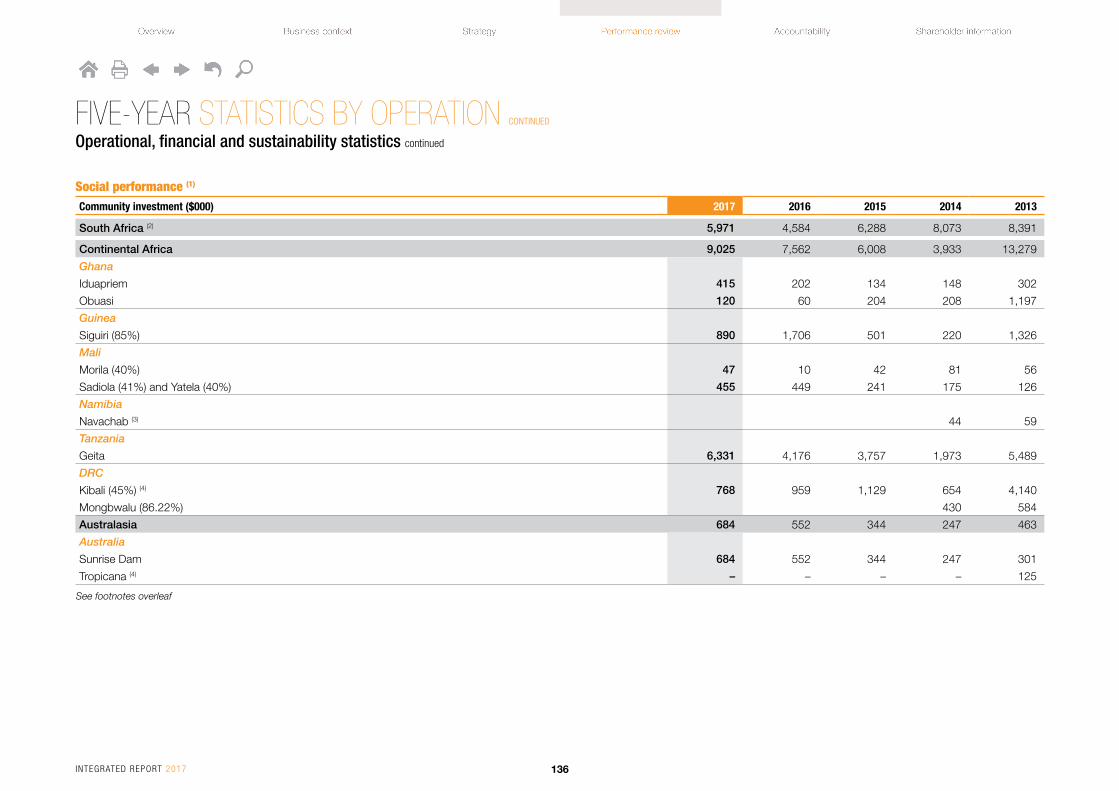
FIVE-YEAR STATISTICS BY OPERATION CONTINUED
Operational, financial and sustainability statistics continued
Social performance (1)
Community investment ($000) 2017 2016 2015 2014 2013
South Africa (2) 5,971 4,584 6,288 8,073 8,391
Continental Africa 9,025 7,562 6,008 3,933 13,279
Ghana
Iduapriem 415 202 134 148 302
Obuasi 120 60 204 208 1,197
Guinea
Siguiri (85%) 890 1,706 501 220 1,326
Mali
Morila (40%) 47 10 42 81 56
Sadiola (41%) and Yatela (40%) 455 449 241 175 126
Namibia
Navachab (3) 44 59
Tanzania
Geita 6,331 4,176 3,757 1,973 5,489
DRC
Kibali (45%) (4) 768 959 1,129 654 4,140
Mongbwalu (86.22%) 430 584
Australasia 684 552 344 247 463
Australia
Sunrise Dam 684 552 344 247 301
Tropicana (4) – – – – 125
See footnotes overleaf
INTEGRATED REPORT 2017 136
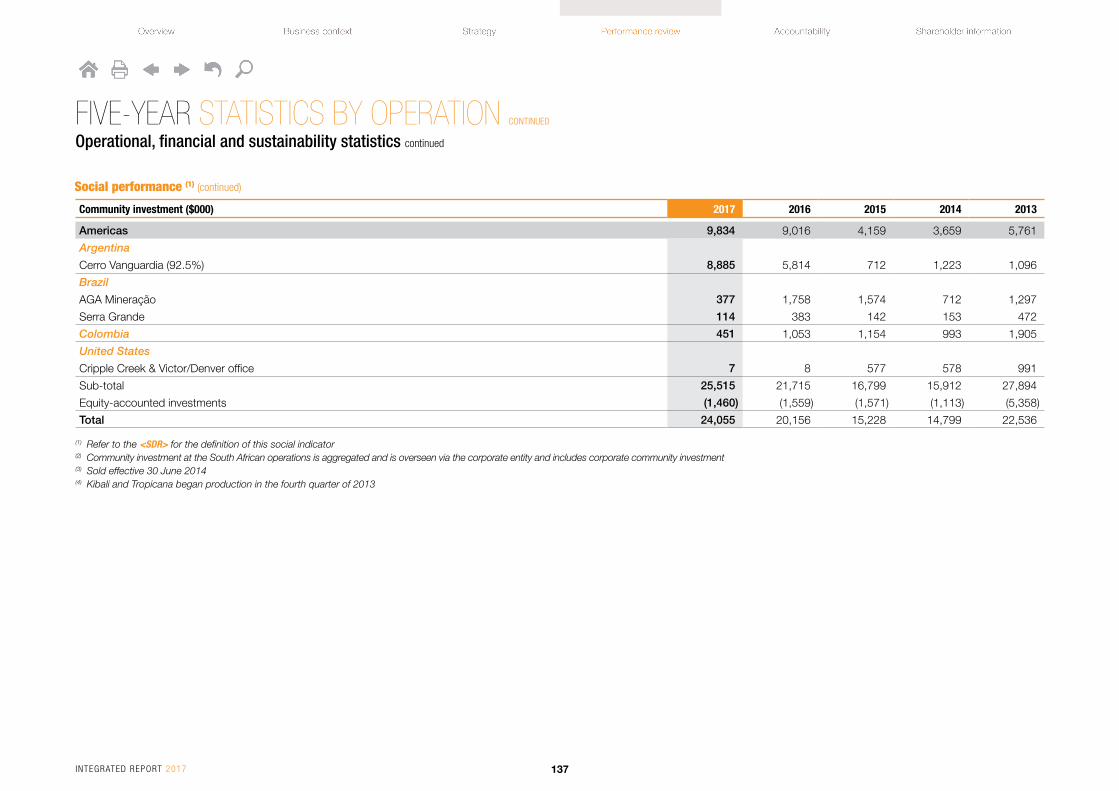
FIVE-YEAR STATISTICS BY OPERATION CONTINUED
Operational, financial and sustainability statistics continued
Community investment ($000) 2017 2016 2015 2014 2013
Americas 9,834 9,016 4,159 3,659 5,761
Argentina
Cerro Vanguardia (92.5%) 8,885 5,814 712 1,223 1,096
Brazil
AGA Mineração 377 1,758 1,574 712 1,297
Serra Grande 114 383 142 153 472
Colombia 451 1,053 1,154 993 1,905
United States
Cripple Creek & Victor/Denver office 7 8 577 578 991
Sub-total 25,515 21,715 16,799 15,912 27,894
Equity-accounted investments (1,460) (1,559) (1,571) (1,113) (5,358)
Total 24,055 20,156 15,228 14,799 22,536
(1) Refer to the <SDR> for the definition of this social indicator(2) Community investment at the South African operations is aggregated and is overseen via the corporate entity and includes corporate community investment(3) Sold effective 30 June 2014(4) Kibali and Tropicana began production in the fourth quarter of 2013
Social performance (1) (continued)
INTEGRATED REPORT 2017 137

The Minera l Resource and Ore Reser ve fo r Ang loGo ld Ashant i L im i ted (Ang loGo ld Ashant i ) a re repor ted in accordance w i th the min imum s tandards descr ibed by the South A f r i can Code fo r the Repor t ing o f Exp lo ra t ion Resu l t s , M inera l Resources and Minera l Reser ves (The SAMREC Code, 2016 ed i t i on ) , and a lso con fo rm to the s tandards se t ou t in the Aus t ra las ian Code fo r Repor t ing o f Exp lo ra t ion Resu l t s , M inera l Resources and Ore Reser ves (JORC Code, 2012 Ed i t i on ) .
MINERAL RESOURCE AND ORE RESERVE – SUMMARY
Local prices of gold
South AfricaZAR/kg
AustraliaAUD/oz
BrazilBRL/oz
ArgentinaARS/oz
2017 Ore Reserve 512,059 1,491 3,573 17,898
2017 Mineral Resource 601,870 1,824 4,492 21,242
The SAMREC and JORC Codes require the use of reasonable economic assumptions. These include long-range commodity price and exchange rate forecasts that are reviewed annually and are prepared in-house using a range of techniques including historic price averages.
2017 Ore Reserve – gold price
$1,100/oz
2017 Mineral Resource – gold price
$1,400/oz
Gold priceThe following local prices of gold were used as a basis for estimation in the December 2017 declaration:
The Mineral Resource is inclusive of the Ore Reserve component unless otherwise stated. In complying with revisions to the SAMREC Code, the changes to AngloGold Ashanti’s Mineral Resource and Ore Reserve have been reviewed and it was concluded that none of the changes are material to the overall valuation of the company. AngloGold Ashanti has therefore once again resolved not to provide the detailed reporting as defined in Table 1 of the Code, apart from the maiden Ore Reserve declaration for Gramalote. The company continues to
provide the high level of detail it has in previous years in the <R&R> in order to comply with the transparency requirements of the code.
AngloGold Ashanti strives to actively create value by growing its major asset – the Mineral Resource and Ore Reserve. This drive is based on active, well-defined brownfields and greenfields exploration programmes, innovation in both geological modelling and mine planning, and continual optimisation of the asset portfolio.
Picture: Serra Grande, BrazilINTEGRATED REPORT 2017 138

MINERAL RESOURCEThe AngloGold Ashanti gold Mineral Resource reduced from 214.7Moz in December 2016 to 208.2Moz in December 2017. This gross annual decrease of 6.6Moz includes depletion of 4.8Moz. The balance of 1.8Moz reductions in Mineral Resource, results from an increase due to exploration and modelling changes of 1.9Moz and a reduction due to other factors of 0.4Moz, while changes in economic assumptions resulted in a 3.3Moz reduction. The Mineral Resource has been estimated at a gold price of $1,400/oz (2016: $1,400/oz).
The AngloGold Ashanti copper Mineral Resource increased from 7,933 million pounds in December 2016* to 8,000 million pounds in December 2017. The increase was due to the attributable percentage for Quebradona increasing from 92.72% to 93.5%. The Mineral Resource has been estimated at a copper price of $3.16/lb (2016: $2.90/lb).
* Previously reported as a by-product in the <R&R>
MINERAL RESOURCE AND ORE RESERVE – SUMMARY CONTINUED
Gold: Mineral Resource Moz
Mineral Resource as at 31 December 2016 214.7
Depletions (4.8)
Sub-total 209.9
Additions
Siguiri Decreased costs resulted in a reduced cutoff grade 1.4
Obuasi Mineral Resource update based on recaptured geological data 0.6
Other Additions less than 0.5Moz 1.6
Sub-total 213.5
Reductions
TauTona Mine put into orderly closure and part of the Mineral Resource transferred to Mponeng
(2.6)
West Wits Surface Cost increase resulted in reductions (0.8)
Moab Khotsong Due primarily to reclassification of Mineral Resource (0.8)
Other Reductions less than 0.5Moz (1.1)
Mineral Resource as at 31 December 2017 208.2
Rounding of numbers may result in computational discrepancies
Gold: Mineral Resource reconciliation 2016 vs. 2017 (Moz) Total (attributable)
Ounc
es (m
illion
s)
216
214
212
210
208
206
204
214.7
2016
-4.8
Depl
etio
n
1.0
Expl
orat
ion
0.9
Met
hodo
logy
-0.2
Gold
pric
e
-3.2Co
st
0.1
Geot
echn
ical
-0.4
Othe
r
208.2
2017
Picture: Tropicana, AustraliaINTEGRATED REPORT 2017 139

MINERAL RESOURCE AND ORE RESERVE – SUMMARY CONTINUED
ORE RESERVEThe AngloGold Ashanti gold Ore Reserve reduced from 50.1Moz in December 2016 to 49.5Moz in December 2017. This gross annual decrease of 0.6Moz includes depletion of 4.3Moz. The balance of 3.7Moz additions in Ore Reserve, results from exploration and modelling changes of 4.0Moz and other factors of 0.5Moz, while changes in economic assumptions resulted in a 0.8Moz reduction. The Ore Reserve has been estimated using a gold price of $1,100/oz (2016: $1,100/oz).
Gold: Ore ReserveMoz
Ore Reserve as at 31 December 2016 50.1
Depletions (4.3)
Sub-total 45.8
Additions
Gramalote Positive prefeasibility study complete and approved by board 1.8
AGA Mineração Inclusion of transitional and sulphide material in the Córrego do Sítio Rosalino open-pit as well as Mineral Resource conversions
0.8
Tropicana Model update for Havana South and new designs for Boston Shaker 0.6
Obuasi Updated mine plan based on updated Mineral Resource models 0.4
Cerro Vanguardia Due to improved methodology 0.3
Other Additions less than 0.3Moz 0.8
Sub-total 50.5
Reductions
TauTona Mine has been placed into orderly closure (0.7)
Other Reductions less than 0.3Moz (0.3)
Ore Reserve as at 31 December 2017 49.5
Rounding of numbers may result in computational discrepancies
Gold: Ore Reserve reconciliation 2016 vs. 2017 (Moz) Total (attributable)
Ounc
es (m
illion
s)
52515049484746454443
50.1
2016
-4.3
Depl
etio
n
5.0
Expl
orat
ion
-1.0
Met
hodo
logy
-0.1
Gold
pric
e
-0.7
Cost
-0.2Ge
otec
hnic
al0.1
Met
allu
rgic
al
0.6
Othe
r
49.5
2017
0.1
Reve
nue
fact
or
Picture: Geita, TanzaniaINTEGRATED REPORT 2017 140
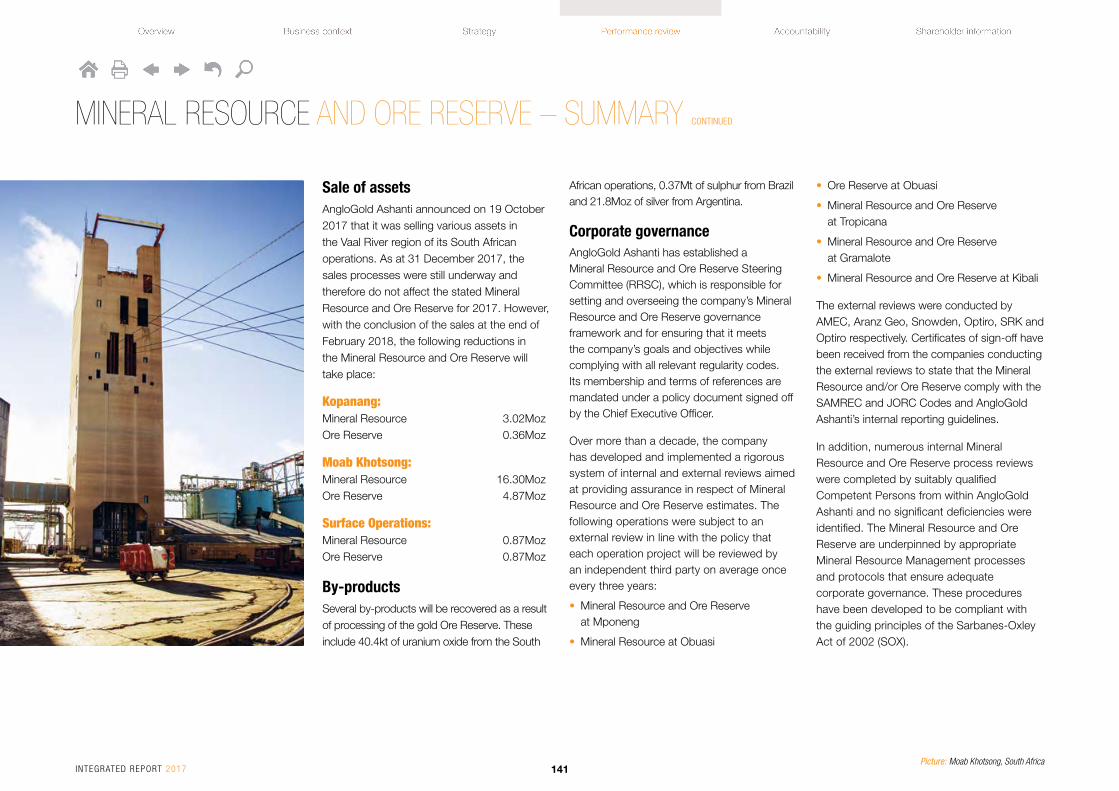
Sale of assetsAngloGold Ashanti announced on 19 October 2017 that it was selling various assets in the Vaal River region of its South African operations. As at 31 December 2017, the sales processes were still underway and therefore do not affect the stated Mineral Resource and Ore Reserve for 2017. However, with the conclusion of the sales at the end of February 2018, the following reductions in the Mineral Resource and Ore Reserve will take place:
Kopanang: Mineral Resource 3.02MozOre Reserve 0.36Moz
Moab Khotsong: Mineral Resource 16.30MozOre Reserve 4.87Moz
Surface Operations:Mineral Resource 0.87MozOre Reserve 0.87Moz
By-productsSeveral by-products will be recovered as a result of processing of the gold Ore Reserve. These include 40.4kt of uranium oxide from the South
African operations, 0.37Mt of sulphur from Brazil and 21.8Moz of silver from Argentina.
Corporate governanceAngloGold Ashanti has established a Mineral Resource and Ore Reserve Steering Committee (RRSC), which is responsible for setting and overseeing the company’s Mineral Resource and Ore Reserve governance framework and for ensuring that it meets the company’s goals and objectives while complying with all relevant regularity codes. Its membership and terms of references are mandated under a policy document signed off by the Chief Executive Officer.
Over more than a decade, the company has developed and implemented a rigorous system of internal and external reviews aimed at providing assurance in respect of Mineral Resource and Ore Reserve estimates. The following operations were subject to an external review in line with the policy that each operation project will be reviewed by an independent third party on average once every three years:
• Mineral Resource and Ore Reserve at Mponeng
• Mineral Resource at Obuasi
• Ore Reserve at Obuasi
• Mineral Resource and Ore Reserve at Tropicana
• Mineral Resource and Ore Reserve at Gramalote
• Mineral Resource and Ore Reserve at Kibali
The external reviews were conducted by AMEC, Aranz Geo, Snowden, Optiro, SRK and Optiro respectively. Certificates of sign-off have been received from the companies conducting the external reviews to state that the Mineral Resource and/or Ore Reserve comply with the SAMREC and JORC Codes and AngloGold Ashanti’s internal reporting guidelines.
In addition, numerous internal Mineral Resource and Ore Reserve process reviews were completed by suitably qualified Competent Persons from within AngloGold Ashanti and no significant deficiencies were identified. The Mineral Resource and Ore Reserve are underpinned by appropriate Mineral Resource Management processes and protocols that ensure adequate corporate governance. These procedures have been developed to be compliant with the guiding principles of the Sarbanes-Oxley Act of 2002 (SOX).
MINERAL RESOURCE AND ORE RESERVE – SUMMARY CONTINUED
Picture: Moab Khotsong, South AfricaINTEGRATED REPORT 2017 141

MINERAL RESOURCE AND ORE RESERVE – SUMMARY CONTINUED
AngloGold Ashanti makes use of a web- based group reporting database called the Mineral Resource and Ore Reserve Reporting System (Rcubed) for the compilation and authorisation of Mineral Resource and Ore Reserve reporting. It is a fully integrated system for the reporting and reconciliation of Mineral Resource and Ore Reserve that supports various regulatory reporting requirements including the SEC and the JSE under SAMREC. AngloGold Ashanti uses R3 to ensure a documented chain of responsibility exists from the competent persons at the operations to the RRSC.
AngloGold Ashanti has also developed an enterprise-wide risk management tool that
provides consistent and reliable data that
allows for visibility of risks and actions across
the group. This tool is used to facilitate, control
and monitor material risks to the Mineral
Resource and Ore Reserve, thus ensuring
that the appropriate risk management and
mitigation plans are in place.
Competent PersonsThe information in this report relating to
exploration results, the Mineral Resource
and the Ore Reserve is based on information
compiled by or under the supervision of
the Competent Persons as defined in the
SAMREC or JORC Codes. All Competent
Persons are employed by AngloGold Ashanti,
except for Kibali and Morila, and have sufficient experience relevant to the style of mineralisation and type of deposit under consideration and to the activity which they are undertaking. The legal tenure of each operation and project has been verified to the satisfaction of the accountable Competent Person and their respective Ore Reserve have been confirmed to be covered by the required mining permits or there exists a realistic expectation that these permits will be issued. This will be detailed in the 2017 Mineral Resource and Ore Reserve document.
Accordingly, the chairman of the Mineral Resource and Ore Reserve Steering Committee, VA Chamberlain, MSc (Mining
Engineering), BSc (Hons) (Geology), MGSSA, FAusIMM, assumes responsibility for the Mineral Resource and Ore Reserve processes for AngloGold Ashanti and is satisfied that the Competent Persons have fulfilled their responsibilities. VA Chamberlain has 30 years’ experience in exploration and mining and is employed full-time by AngloGold Ashanti and can be contacted at the following address: 76 Rahima Moosa Street, Newtown, 2001, South Africa.
A detailed breakdown of AngloGold Ashanti’s Mineral Resource and Ore Reserve and backup detail are provided on the websites, www.anglogoldashanti.com and www.aga-reports.com.
Picture: Serra Grande, BrazilINTEGRATED REPORT 2017 142

MINERAL RESOURCE AND ORE RESERVE – SUMMARY CONTINUED
Gold: Mineral Resource by region (attributable) inclusive of Ore ReserveGold as at 31 December 2017 Tonnes Grade Contained gold
Category million g/t tonnes Moz
South Africa Measured 138.59 1.83 254.26 8.17
Indicated 741.80 2.29 1,696.52 54.54
Inferred 28.22 14.52 409.69 13.17
Total 908.62 2.60 2,360.47 75.89
Continental Africa Measured 47.06 1.75 82.34 2.65
Indicated 467.81 2.60 1,218.43 39.17
Inferred 203.41 3.41 693.91 22.31
Total 718.27 2.78 1,994.69 64.13
Australasia Measured 33.57 0.97 32.40 1.04
Indicated 127.10 1.98 251.04 8.07
Inferred 35.38 1.84 64.93 2.09
Total 196.05 1.78 348.37 11.20
Americas Measured 27.47 5.07 139.23 4.48
Indicated 1,064.46 0.99 1,054.24 33.89
Inferred 802.73 0.72 577.57 18.57
Total 1,894.67 0.93 1,771.04 56.94
AngloGold Ashanti total
Measured 246.70 2.06 508.24 16.34
Indicated 2,401.18 1.76 4,220.23 135.68
Inferred 1,069.74 1.63 1,746.09 56.14
Total 3,717.61 1.74 6,474.56 208.16
Rounding of numbers may result in computational discrepancies
Gold: Mineral Resource by region (attributable) exclusive of Ore ReserveGold as at 31 December 2017 Tonnes Grade Contained gold
Category million g/t tonnes Moz
South Africa Measured 8.75 20.06 175.41 5.64
Indicated 82.13 10.28 844.59 27.15
Inferred 15.83 15.97 252.82 8.13
Total 106.71 11.93 1,272.82 40.92
Continental Africa Measured 4.80 4.78 22.96 0.74
Indicated 276.51 2.65 733.10 23.57
Inferred 203.00 3.42 693.59 22.30
Total 484.31 2.99 1,449.65 46.61
Australasia Measured 10.53 0.57 6.05 0.19
Indicated 84.41 1.79 151.43 4.87
Inferred 35.38 1.84 64.93 2.09
Total 130.32 1.71 222.41 7.15
Americas Measured 16.59 6.11 101.42 3.26
Indicated 982.51 0.92 903.33 29.04
Inferred 800.69 0.72 573.94 18.45
Total 1,799.79 0.88 1,578.70 50.76
AngloGold Ashanti total
Measured 40.67 7.52 305.84 9.83
Indicated 1,425.56 1.85 2,632.45 84.64
Inferred 1,054.90 1.50 1,585.28 50.97
Total 2,521.13 1.79 4,523.57 145.44
Contained gold
208Moz
Gold grade
1.74g/t
Gold grade
1.79g/t
Contained gold
145Moz
Mineral Resource (inclusive) Mineral Resource (exclusive)
INTEGRATED REPORT 2017 143

MINERAL RESOURCE AND ORE RESERVE – SUMMARY CONTINUED
Gold: Ore Reserve by region (attributable) Gold as at 31 December 2017 Tonnes Grade Contained gold
Category million g/t tonnes Moz
South Africa Proved 131.24 0.50 65.22 2.10
Probable 663.28 1.00 665.99 21.41
Total 794.52 0.92 731.21 23.51
Continental Africa Proved 35.79 1.48 53.06 1.71
Probable 184.07 2.57 472.31 15.19
Total 219.86 2.39 525.37 16.89
Australasia Proved 23.04 1.14 26.33 0.85
Probable 42.69 2.33 99.60 3.20
Total 65.73 1.92 125.94 4.05
Americas Proved 8.89 2.89 25.67 0.83
Probable 81.83 1.61 131.68 4.23
Total 90.72 1.73 157.35 5.06
AngloGold Ashanti total
Proved 198.96 0.86 170.29 5.47
Probable 971.87 1.41 1,369.57 44.03
Total 1,170.83 1.32 1,539.86 49.51
Copper: Inclusive Mineral Resource by region - attributableCopper as at 31 December 2017 Tonnes Grade Contained copper (Cu)
Category million %Cu Tonnes million Pounds million
Americas Measured – – – –
Indicated 105.25 1.08 1.14 2,508
Inferred 471.60 0.53 2.49 5,492
Total 576.85 0.63 3.63 8,000
AngloGold Ashanti total
Measured – – – –
Indicated 105.25 1.08 1.14 2,508
Inferred 471.60 0.53 2.49 5,492
Total 576.85 0.63 3.63 8,000
* The copper Mineral Resource exclusive and inclusive of the Ore Reserve are the same as there is no Ore Reserve
Rounding of numbers may result in computational discrepancies
Contained copper*
8,000Mlb
Copper grade
0.63%Cu
Gold grade
1.32g/t
Contained gold
50Moz
Mineral Resource (inclusive) Ore Reserve
INTEGRATED REPORT 2017 144

PLANNING FOR THE FUTURE
Our exp lo ra t ion p rog ramme covers g reen f ie lds and b rownf ie lds p ro jec ts . Exp lo ra t ion w i th in Ang loGo ld Ashant i i s f ocused on c rea t ing s ign i f i can t va lue fo r the company by p rov id ing long-te rm op t iona l i t y and improv ing the qua l i t y o f our por t f o l i o .
Exploration
The objectives are met by:
• Greenfields exploration, which aims to discover a large, high-value Mineral Resource that will ultimately lead to the development of new gold mines. AngloGold Ashanti’s greenfields exploration team has been recognised for three years in succession, as the industry’s most successful team in terms of Mineral Resource discovery by SNL*, a leading industry research group. The team has a proven track record that includes the discovery of world-class ore bodies at Tropicana, La Colosa, Gramalote, and Nuevo Chaquiro. These discoveries are attributed to our committed and professional team of geoscientists working on a portfolio of highly prospective and rigorously prioritised greenfields ground holdings.
• Brownfields exploration, which focuses on delivering value through incremental additions to the Ore Reserve in existing mines as well as new discoveries in defined areas around existing operations. Brownfields exploration actively seeks to create of value by growing our Mineral Resource and Ore Reserve, our major asset. The brownfields exploration programme is based on innovation in geological modelling and mine planning, and continual optimisation of our asset portfolio.
* SNL 2016 Strategies for Gold Reserves Replacement, best for the period studied from 2001-2015, page 16
Greenfields explorationOur greenfields holdings/tenements consist of over 9,000km2 of highly-prospective ground in four countries: Australia, Colombia, Brazil and the United States and include ground positions in Argentina and Tanzania. Actual expenditure on greenfields exploration activities was $30.7m in 2017 and this included over 64km of diamond, reverse circulation and aircore drilling.
In Australia, in the Laverton district, exploration commenced as part of the Butcher Well and Lake Carey farm-in agreement with Saracen Mineral Holdings. The agreement gives AngloGold Ashanti earn-in rights to 340km2 of tenements on and along the western margin of Lake Carey in the Laverton district of Western Australia, including those hosting the historically-mined Butcher Well gold deposits. AngloGold Ashanti can earn
Picture: La Colosa, ColombiaINTEGRATED REPORT 2017 145

PLANNING FOR THE FUTURE CONTINUED
up to 70% of the joint venture by spending A$15m within 48 months from start date to earn 51% and a further A$10m within 24 months thereafter to earn 70%. Work completed as part of the agreement in 2017 included 26.6km of reverse circulation and diamond drilling, 20.4km of aircore drilling and 3,897 ground gravity stations. The work focused on Butcher Well, where drilling returned several very encouraging intercepts. In addition, aircore drilling at the nearby Mt Minnie project returned several encouraging results over 3km of strike extent and follow up reverse circulation and diamond drilling confirmed these results.
In Brazil, exploration focused on the Tromai joint venture (AngloGold Ashanti earning into 70% equity from Trek Mining). The work focused on acquisition of regional airborne magnetic, radiometric and electromagnetic data in addition to reverse circulation and diamond drilling of known structures associated with artisanal mining and soil geochemistry. A total of 26,549-line km of magnetic/radiometric data were collected along with 4,560km of electromagnetic data. In addition, 4.7km of diamond drilling and 5.7km of reverse circulation drilling were completed. Moderate results were received and further work is planned to test targets generated from airborne geophysical techniques.
In the United States, a reconnaissance rotosonic drill programme was completed at the Celina project in Minnesota (100% AngloGold Ashanti) with 29 holes drilled for 1,034m. A regional magnetic airborne survey was also completed over a total of 50,697km. In addition, we successfully bid for 238 additional mining claims covering 382km2 in Minnesota In Nevada, AngloGold Ashanti entered into an option agreement with Renaissance Gold for the Silicon Project whereby AngloGold Ashanti will make a series of payments over a three-year period to acquire 100% of the project area. Exploration activities conducted at Silicon included geological and spectral mapping, along with surface geochemical sampling in preparation for diamond drill testing of the low-sulphidation vein target in 2018.
In Colombia, at Nuevo Guintar (100% AngloGold Ashanti), activities focused on reaching a decision point. Soil sampling, ground magnetic and induced polarisation (IP) programmes were completed along with a 1,478m diamond drilling programme. The principle target was a 500m by 300m gold and multi-element soil geochemistry anomaly with an epithermal signature. No significant results were received from the diamond drilling.
In Tanzania and Argentina, early stage grassroots evaluation and reconnaissance programmes progressed.
Brownfields explorationBrownfields exploration was carried out in 10 countries, in and around AngloGold Ashanti operations. A total of 594,794m of diamond and reverse circulation drilling was completed during the year.
South Africa: Exploration in the South Africa region continued with a total of four holes drilled at Mponeng’s Western Ultra Deep Levels (WUDLs). All these holes target the Ventersdorp Contact Reef.
Surface drillholes UD60 and UD58A were completed and the sites rehabilitated. Piloting of surface drill hole UD63A and UD61 was completed. Site establishment is underway and the foundations have been completed.
Argentina: At Cerro Vanguardia, drilling achieved 15,620m and focused firstly on testing ground magnetics anomalies around Laura, Sonia and extensions of Vanguardia 2 veins, and secondly on defining lateral and down-dip extensions of mineralisation in poorly-drilled areas of Ariadna, El Palo, Gesica, Patricia, Patty, Teresa, Vanguardia E and 3W, Verónica, Goyo, Portero, Zorro veins. The Claudia joint venture earn-in was concluded ahead of its first-year anniversary. A ground geophysics programme designed to search for shallow blind structures is ongoing and will continue in the first half of 2018.
Brazil: In the Iron Quadrangle, at Cuiabá, exploration activities focused on underground drilling for orebody extension, Mineral Resource conversion and testing of targets. Deep drilling moved from L28-30 to L24 to reach the northern edge of the Cuiabá structure.
Regional mapping and sampling continued around Cuiabá at the Pompeu target, with 45% of the soil sampling programme executed and 582 samples collected. The programme, which is aimed at developing drill targets, is expected to be completed in the first half of 2018 .
At Lamego, drilling was done at Cabeça de Pedra and at Carruagem. The drilling was predominantly focused on the Carraguem SW orebody where drilling is being undertaken from a hangingwall drive. The results are promising, especially on the normal limb where the Carraguem orebody shows continuity along with Carraguem SW. Mineral Resource modelling is in progress.
Exploration drilling at Córrego do Sítio (CdS) achieved 53,987m, with 78% (41,903m) of the drilling being done underground in the CdSI and CdSII mines. The purpose of these drilling programmes was for Mineral Resource conversion to support the production plan. Surface exploration drilling (12,084m) had three distinct purposes, targeting Mineral Resource addition (3,463m), Mineral Resource conversion (8,515m) and new targets (106m).
INTEGRATED REPORT 2017 146

PLANNING FOR THE FUTURE CONTINUED
A total of 38,500m was drilled at Serra Grande. Exploration focused on extension and infill of known ore bodies, this included drilling at Orebody IV, Structure III, Inga, Pequizao, Palmeiras and Mangaba. Positive results were achieved from the Mangaba target that increased the orebody’s grade confidence, while continuity of the inferior zone was confirmed at Flamboyant. Significant intersections were returned from the down-plunge extension of Orebody VI, confirming both grade and thickness, as well as from structures below Orebody VI. At Structure III and on Orebody A, significant intersections were obtained confirming that theory that layers were repeated and the ore zones stacked as well as down-plunge projections.
Field work continued on regional leases and confidentiality agreements were signed with interested parties.
Colombia: A total of 3,724m were drilled at Gramalote before the decision was made to stop drilling in the first half of the year. Field-based exploration focused on rock chip sampling and soil sampling at the San Javier, Santa Barbara, and Encarnaciones targets to continue delineation of the quartz vein systems identified in those areas.
The La Colosa project was formally placed on care and maintenance in the first quarter and consequently, all field activities came
to an end in April 2017. As part of the site investigation, geotechnical and hydrology drilling programmes, 946m were drilled.
A total of 2,132m was drilled at Quebradona. In June, the decision was made halt the drilling programme owing to budget constraints. During the second half of the year, work focused on supporting the prefeasibility study with field activities, geological and geotechnical logging.
Tanzania: Drilling programmes focused on both surface and underground operations. Surface drilling projects included Nyankanga Block 5 (Cut 9), Matandani BST, Geita Hill East, Star & Comet Cut 2 NW Extension, Geita Hill-Lone Cone Blocks 1 & 2 (underground potential), Nyankanga 3D Seismic Targets 1 & 5 and reconnaissance drilling at Selous Satellite target. Underground drilling programmes were carried out at Nyankanga Block 5 and Star & Comet Cuts 2 & 3 projects. A total of 347 drillholes (48,561m) were completed.
Surface geological mapping was carried out within the Nyamulilima Block on areas around Selous-Mabe-Xanadu, Roberts South, Star & Comet Cut 2 NW & South as well as on areas around Ridge 8 and in the Star & Comet Cut 3 – Ridge 8 Gap. The focus of the mapping exercise was to establish the surface geology of the prospective areas of Nyamulilima Block and define the potential targets for future
exploration. Surface geological mapping was also carried out at Kalondwa Hill, Fikiri-Jumanne-Samena through to Prospect 30 targets, to support target generation and prioritisation of future exploration works.
Guinea: At Siguiri, exploration activities included reconnaissance drilling on the John Deere, Kolenda South and Silakoro NE targets, as well as Mineral Resource definition drilling at Kami, Tubani, Silakoro, Seguelen, Sokunu and Foulata. A total of 48,198m was drilled during the year.
Preliminary interpretation of the airborne magnetic and a radiometric geophysical survey over portions of Block 1 and Block 2 and the Saraya West licence were completed. Seven targets were identified across the Seguelen West area, as well as an area northeast of the Foulata deposit and potential extensions of the Saraya mineralisation within the Saraya West licence.
Target generation and evaluation of the Corridor Blocks and tailings storage facilities exploration licences was carried out.
Picture: Gramalote, ColombiaINTEGRATED REPORT 2017 147

PLANNING FOR THE FUTURE CONTINUED
This was followed by field mapping. Soil sampling programmes to cover an untested area in the northwest of Block1 and on Saraya West PL were completed.
Ghana: No exploration was conducted at Obuasi. At Iduapriem, 7,214m of drilling was completed at the Block 1W/Nueng. Drilling targeted a fold model which predicted the conglomerate reef package near surface. It intersected the conglomerate reef package at 153m to 168m and the later part of the drilling campaign continued to confirm a single, truncated A reef.
At Block 4S, a total of 1,708m was drilled to upgrade material to Indicated Mineral Resource, increasing confidence in the structural model and modelling of reef displacement along the main fault.
A mapping campaign at Block 5 Extension informed the drill plan to intersect the mapped reef packages perpendicularly. A total of 2,412m was drilled with the aim of resolving the full extent of the reef packages along strike and the influence of faults and intrusives on the conglomerates. Recent mapping at the northern extent of the pit reveals continuation of the reefs with a southeast dip direction as opposed to the eastern dip direction that exists within the main pit.
Democratic Republic of the Congo: Drilling (22,364m) at Kibali focused around the Sessenge, Kombokolo, Aerodrome-Pamao,
Pamao-Makoke-Megi, Rhino-Agbarabo and KZD areas. Regional exploration covered the Kalimva-Ikamva, Belengo, Aindi Watsa-Dilolo-Zambula, Ndala North and South KZ areas.
At the KCD pit, the results were received for the 1,491m deep diamond drilling to test the down-plunge projection of the Banded Ironstone Formation. Results confirmed the down-plunge extension of the 3000 lode, the 5000 lode and a new lode. A follow up programme from underground will test this further.
At Kalimva, the second phase (26 holes totalling 3,072m) of reverse circulation drilling was completed to test high-grade shoots within the 1.6km long shear system. Logging and assay results received to date support a model with five stacked, plunging shoots of >2g/t within the 1.6km strike. At Ikamva, a fence of seven reverse circulation holes were drilled to follow up on the pit optimisation done in the western part of Ikamva. The observed mineralised zone is thinner and deeper than expected and some of the holes ended in mineralisation. Another phase of close spaced drilling is planned.
Mali: At Sadiola, a total of 14,260m of drilling was completed. Reverse circulation drilling for oxide potential was completed at Sadiola South, Tambali West, Dogofile South, Timbabougouni, Voyager West, Tabakoto West and Lakanfla. Drilling focused on the new oxide targets identified at a targeting workshop
held in June with participants from SEMOS, IAMGOLD and AngloGold Ashanti.
Australia: A total of 88,871m of exploration drilling was done at Sunrise Dam targeting the Vogue Deeps, the western area of Vogue 1800, 1600 and 1400 Blocks, Cosmo, northern and down dip extensions to Cosmo and Cosmo East, Dolly Porphyry, Carey Shear, Elle and Astro North ore bodies.
The drilling results from Vogue continue to be encouraging with significant intercepts returned from all panels. Assay results from definition drilling in the southern panel of Cosmo and Cosmo East down dip were returned with one significant intercept returned from Cosmo East down dip, and three significant intercepts from an isolated area between the Dolly and Cosmo ore bodies. Further drilling from the southern panel will be completed during 2018.
Drilling of the Carey Shear continued from a drill platform in the COS1630. One significant intercept was returned for Carey Shear with two further significant intercepts returned from further up hole. Drilling of this target will continue in the first half in 2018.
Mineral Resource definition drilling of the Elle target continued and Mineral Resource creation drilling to the south commenced. Seven significant intercepts were returned for Elle, and nine significant intercepts related to the Midway shears in this area.
USEFUL LINKS
1 www.anglogoldashanti.com
Blue sky tangible drilling of Astro North began and assay results are pending.
At Tropicana, a total of 93,428m of drilling was completed. During the first half of 2017, drilling targeted Sanpan, Zebra, New Zebra, Hat-Trick, Springbok, Southern Mining Lease (ML) conceptual targets, Angel Eyes, Beetlejuice, Crouching Tiger, Kamikaze and Little Wing targets.
Resource development drilling continued to complete extensional drilling at Boston Shaker to evaluate the underground potential down dip of the Long Island pit design. Following the scoping study which is currently underway, a prefeasibility study on underground mining will begin in 2018, in conjunction with infill drilling programmes.
Find more detail on the company’s exploration programmes under Exploration Updates on the company’s website. 1
INTEGRATED REPORT 2017 148

Rehabilitation and closureRehabilitation and closure make up the final stage in the mining process.
This happens as mines eventually exhaust their economically viable resources and mining operations cease. Although finalisation of this stage comes at the end of the mine life, at AngloGold Ashanti planning for mine closure is incorporated into our mine plans at the start of the exploration stage. We then continually revise the processes and plans to adapt to any relevant changes that may be applicable during the life of mine. Once mining activities cease, the final closure plan is implemented.
Responsible closure planning follows a holistic approach, taking into account all aspects of pre-operational planning, operational activities and post-closure activity.
The approach for many of our older mines is to incorporate closure considerations into existing operational plans as far as possible, to reduce operating and final closure costs and to mitigate the socio-economic impacts of closure. To support this goal, we apply a comprehensive closure planning management standard and guidelines that offer practical assistance to operations on how to apply the standard.
The purpose of the closure management standard is to facilitate the design and
implementation of closure plans to the extent possible during the life of a mine.
In our newer operations, planning for closure begins at mine conception and is incorporated in mine design – in essence, new mines are designed with closure in mind. Social considerations are also addressed, as communities close to the mine may be affected by closure. The closure planning standard provides for continuing community engagement and the development, where possible, of alternative livelihoods to mitigate the impact of closure. The objectives for overall closure, including social and workforce aspects, are clearly identified in closure plans, as these guide the definition of applicable options.
Our approach to the rehabilitation process is governed by our land use and biodiversity management standards and adapted for site-specific requirements. These standards include legal compliance as a minimum. Concurrent rehabilitation is undertaken where feasible, balanced against the need to avoid limiting access to resources in the future. Some specific examples of the rehabilitation and closure processes and/or plans are set out in the regional reviews.
In Australia, the Australian Government’s Senate continued with its inquiry to investigate whether resource companies are retaining adequate funds for mine
rehabilitation and whether the process is being adequately monitored. Our mines have made progress on integrated closure planning, which includes completion of a gap analysis of existing closure plans with the group’s closure standard, identifying knowledge gaps, and the scoping of projects to close out these gaps. For more on this, see page 108 the Regional review section.
In South Africa, proposed Amendments to the Financial Provision Regulations, 2015 were published for comment in October 2016. The mining industry has been engaging the Department of Environmental Affairs regarding the proposed amendments relating to closure liabilities. On 10 November 2017, proposed financial provision regulations were published for comment by interested and affected parties (Proposed Financial Provision Regulations). The Proposed Financial Provision Regulations will supersede the Financial Provision Regulations, 2015 if they are brought into effect in its current form by the Minister of Environmental Affairs. This is expected in 2018, with a compliance deadline of February 2019. Significant differences in the Proposed Financial Provision Regulations in comparison to the Financial Provisions Regulations, 2015 include, amongst others:
• The calculation for financial provision includes the consumer price index
• Reduction of the period for calculation from 10 years to three years
• The calculation of financial provision must account for ‘residual environmental impacts’ which includes any environmental impact or risk that may result or arise after actions for final rehabilitation, decommissioning and closure have been implemented. This, however does not include latent risks
• All provisions relating to care and maintenance have been removed
• Mining companies may now use any combination of the three financial vehicles (financial guarantee, rehabilitation trust or a bank account) administered by the Minister; however financial guarantees may not be used to account for ‘residual environmental impacts’
• The Minister may no longer retain such portion of the financial provision as may be required to rehabilitate the closed mining or prospecting operation in respect of latent, residual or any other environmental impacts but may still use a portion of the financial provision to do so subject to the mining company being notified 30 days prior to such action being taken
• Plans, reports and findings of reviews submitted by mining companies pursuant to the financial provision will no longer require approval from the Minister, thus only the financial provision submitted by mining companies needs to be approved
PLANNING FOR THE FUTURE CONTINUED
INTEGRATED REPORT 2017 149

PLANNING FOR THE FUTURE CONTINUED
Remediation obligations and provisionsThe company’s long-term environmental remediation obligations include decommissioning and restoration liabilities relating to past operations. These obligations are based on an operation’s Environmental Management Plan and the relevant regulatory requirements. An assessment of closure liabilities is undertaken annually and these liabilities are presented in the table alongside.
Provisions for remediation costs are made when there is a present obligation, when it is probable that expenditure on remediation work will be required and when the cost can be estimated within a reasonable range of possible outcomes. These costs are based on information currently available, the technology expected to be available at the time of the clean-up, the expected time-frame for remediation, laws and regulations presently or virtually certain to be enacted, and previous experience of remediation. Provision for restoration and decommissioning costs is made at the present value of the expenditures expected to settle the obligation using estimated cash flows based on current prices and discounted at a pre-tax rate that reflects current market assessments of the time value of money.
Rehabilitation liabilities per operation ($ million)
Operation 2017 2016
RestorationDecom-
missioning Total Total
South Africa 17.8 100.7 118.5 95.2 Great Noligwa (1) 3.4 28.2 31.6 –Kopanang – 9.3 9.3 13.2 Moab Khotsong (2) 3.3 15.5 18.8 33.3 TauTona (2) 4.1 17.1 21.2 15.5 Mponeng 2.5 6.1 8.6 8.1 Legacy projects- Vaal River – 3.0 3.0 4.2 - West Wits – 0.4 0.4 0.3 - Other 0.2 – 0.2 0.2 First Uranium SA 4.3 20.3 24.6 19.5 Nufcor – 0.8 0.8 0.9
Continental Africa
252.5 178.4 430.9 429.8
GhanaIduapriem 30.1 14.2 44.3 44.0 Obuasi (3) 149.8 61.6 211.4 216.2 GuineaSiguiri 29.1 30.3 59.4 56.0 Mali (4)
Morila – 9.0 9.0 7.0 Sadiola 14.1 12.5 26.6 27.2 Yatela 4.2 9.0 13.2 14.6 DRCKibali (4) – 10.5 10.5 9.5 TanzaniaGeita 25.2 31.3 56.5 55.3 Australasia 54.6 33.7 88.3 71.4 AustraliaSunrise Dam 27.1 15.0 42.1 29.7 Tropicana 27.5 18.7 46.2 41.7
Operation 2017 2016
RestorationDecom-
missioning Total Total
Americas 106.3 40.3 146.6 149.1 ArgentinaCerro Vanguardia 48.2 18.0 66.2 63.3 BrazilAGA Mineração 42.0 15.3 57.3 61.4 Serra Grande 9.4 7.0 16.4 16.6 United States of AmericaOther 0.5 – 0.5 0.5 ColombiaLa Colosa 5.8 – 5.8 7.0 Gramalote (4) 0.4 – 0.4 0.3 Other – – – 3.7
431.2 353.1 784.3 749.2 Less equity-accounted investments included above (4)
(18.6) (41.0) (59.6) (44.0)
Less liabilities held for sale included above (5)
(3.4) (25.7) (29.1) –
Total 409.2 286.4 695.6 705.2
(1) Includes Vaal River shared infrastructure which does not form part of the liabilities held for sale
(2) Includes Savuka (3) Includes Mpasatia (Bibiani pit) (4) The equity-accounted investments refer to the Mali assets, Kibali in the DRC
and Gramalote in Colombia (5) Includes the liabilities held for sale of Moab Khotsong, Kopanang and Nufcor
INTEGRATED REPORT 2017 150