section 5 kaka‘ako makai geographic zone (t-226 to t...
TRANSCRIPT

Cultural Surveys Hawai‘i Job Code: KALIHI 23 Kaka‘ako Makai Geographic Zone
Archaeological Inventory Survey Report, HHCTCP City Center Section 4 254
TMK: [1] 1-2, 1-5, 1-7, 2-1, 2-3 (Various Plats and Parcels)
Section 5 Kaka‘ako Makai Geographic Zone (T-226 to T-232A)
5.1 Overall Location
For reporting purposes for this AIS, the City Center Section 4 of the HHCTCP has been
divided into 11 zones based on geographical and cultural boundaries. The Kaka‘ako Makai
Geographic Zone was located within the central portion of Honolulu Ahupua‘a, Honolulu
District, Island of O‘ahu, in a physiographic division known as the Honolulu Plain (Armstrong
1983:36). The Kaka‘ako Makai portion of the City Center Section 4 was an additional utility re-
location route that extends approximately 1,250 m forming a makai loop off of the main transit
alignment (Figure 245). Where the main transit line heads off onto Halekauwila Street
approximately 100 m southeast of the Downtown Station, the utility relocation route continues to
head south on Nimitz Highway. The utility relocation route makes a sharp turn heading mauka
(northeast) off of Nimitz Highway onto Punchbowl Street and then turns southeast on Pohukaina
Street running parallel and one block makai of the main transit route on Halekauwila Street. The
utility re-location route then reconnects with the transit alignment by turning mauka (northeast)
on Cooke Street to rejoin the main transit alignment at the intersection of Halekauwila and
Cooke Streets.
A total of 16 test excavations (T-226 through T-232, T-226A, T-226B, T-226C, T-226D, T-
227A, T-228A, T-228B, T-231A, and T-232A) were excavated in the Kaka‘ako Makai Zone
along and adjacent to Punchbowl, Pohukaina, and Cooke Streets. Test excavation numbering
generally progresses from northwest to southeast. The density of testing in this zone was less
because confidence was high that the northwest portion of the Zone (northwest of Punchbowl
Street) was off-shore shallows into the mid-1800s.
All of these Kaka‘ako Makai test excavations were within City and County of Honolulu road
right-of-ways. Seven of the test excavations (T-226, T-226A, T-226B, T-226C, T-226 D, T-227,
and T-227A) were along Punchbowl Street within TMK [1] 2-1-027; seven test excavations (T-
227B, T-228, T-228A, T-229, T-230, T-231, and T-231A) were along Pohukaina Street within
TMK [1] 2-1-030, [1] 2-1-051, and [1] 2-1-054; and two (T-232 and T-232A) were along Cooke
Street within TMK [1] 2-1-052.
5.2 Geography, Geology, and Land Forms
The northwest portion of the Kaka‘ako Makai Zone was believed to have been coastal
shallows into the mid-1800s (see Vol. II Figure 24). The most inland portion (where Cooke
Street connects with Halekauwila Street would have been approximately 400 m inland of the
natural coastline. Present day elevations in the zone range from approximately 1.4 to 1.9 m amsl.
Portions of the project area were in fishponds.
The average annual rainfall measures approximately 658 to 698 mm (26 to 28 inches)
(Giambelluca et al. 2011), which would be marginal at best for non-irrigated agriculture.
Nu‘uanu Stream approximately 900 m to the northwest would have been a major source of fresh
water. The Kaka‘ako area to the east was known for its springs.
The Kaka‘ako Makai Zone consists of a portion of the broad elevated coral reef in southern
Oahu that probably formed during the 7.5-m (Waimanalo) stand (Macdonald et al. 1983:420-

Cultural Surveys Hawai‘i Job Code: KALIHI 23 Kaka‘ako Makai Geographic Zone
Archaeological Inventory Survey Report, HHCTCP City Center Section 4 255
TMK: [1] 1-2, 1-5, 1-7, 2-1, 2-3 (Various Plats and Parcels)
421). Most of the Kaka‘ako Makai Zone was in the shallows of, or just inshore of the main
natural entrance channel to Honolulu Harbor. The landscape would have been dominated by the
bay formed by Pākākā Point (with Kuloloia Beach) on the north side and Kaholoakeāhole point
on the south side. The deep channel and bay would probably have been a focus of fishermen for
centuries. Pākākā Point was a logical choice for the construction of the Honolulu Fort that would
dominate the waterfront for decades.
Vegetation in this area was not well documented, but just prior to development in the early
twentieth century was understood as including naupaka (Scaevola taccada), keawe (Prosopis
pallida), and coconut (Cocos nucifera). Present vegetation was almost entirely the result of
landscaping efforts.
According to the U.S. Department of Agriculture Soil Survey Geographic (SSURGO)
Database (2001) and soil survey data gathered by Foote et al. (1972), soils within the Kaka‘ako
Makai Zone consist predominantly of Fill Land (FL), with an area of ‘Ewa Silty Clay Loam
(EmA) in the central portion of the zone (Figure 245). Fill Land soils were described as:
…areas filled with material dredged from the ocean or hauled from nearby areas,
garbage, and general material from other sources… This land type was used for
urban development including airports, housing areas, and industrial facilities
[Foote et al. 1972:31].
‘Ewa Silty Clay Loam soils were described as:
…well-drained soils in basins and on alluvial fans… [that] developed in alluvium
derived from basic igneous rock... These soils were used for sugarcane, truck
crops, and pasture. The natural vegetation consists of fingergrass, kiawe, koa
haole, klu, and uhaloa [Foote et al. 1972:29].
5.3 Modern Land Use and Built Environment
The Kaka‘ako Makai Zone traverses an urban environment through the neighborhood of
Kaka‘ako. The Kaka‘ako Makai Zone corridor begins at the intersection of South Nimitz
Highway and Richards Street at the northwest end, follows along South Nimitz Highway onto
Ala Moana Boulevard, where it continues until Punchbowl Street, then follows Punchbowl Street
to Pohukaina Street, follows Pohukaina Street until Cook Street, then follows along Cook Street
until Halekauwila Street at the southeast end. Parcels bordering the Kaka‘ako Makai Zone
corridor contain commercial buildings and warehouses, high-rise condominiums, and large
parking lots. A massive utility corridor was also present throughout the Kaka‘ako Makai Zone
containing electrical, gas, water, sewer, and storm lines. The number and distribution of these
existing utilities indicate that this portion of the transit corridor has been heavily disturbed in the
past.
Cultural Surveys Hawai‘i Job Code: KALIHI 23 Kaka‘ako Makai Geographic Zone
Archaeological Inventory Survey Report, HHCTCP City Center Section 4 256
TMK: [1] 1-2, 1-5, 1-7, 2-1, 2-3 (Various Plats and Parcels)
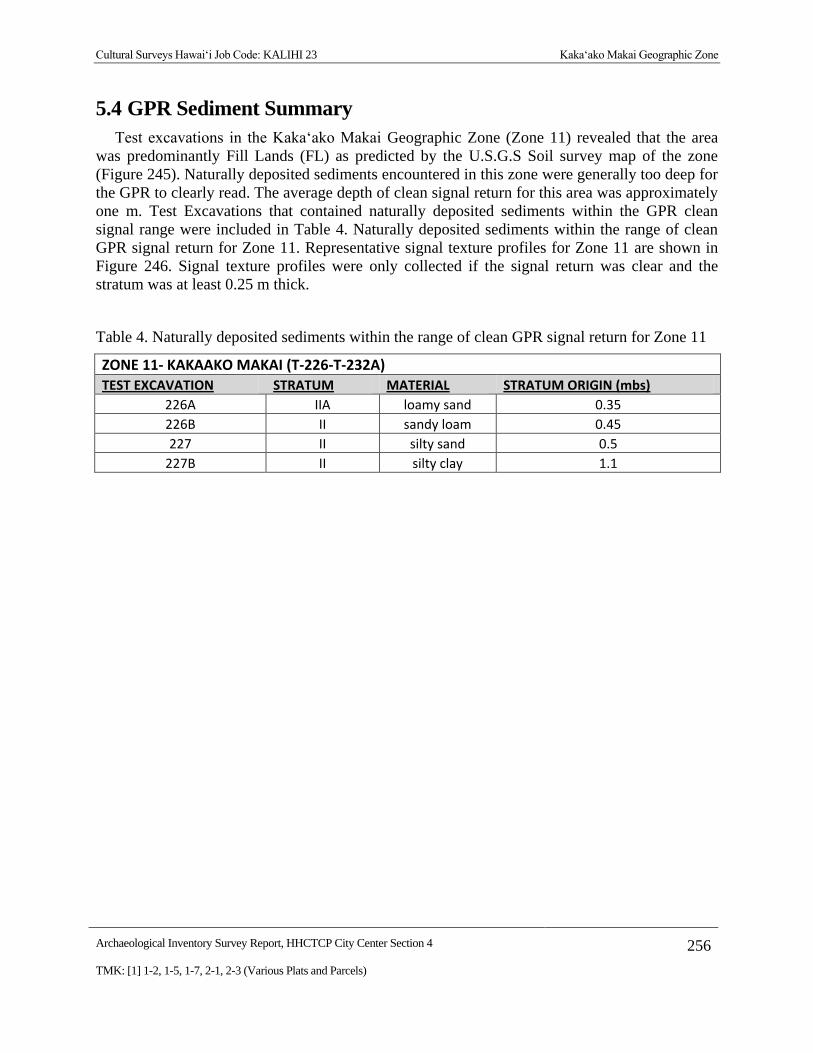
5.4 GPR Sediment Summary
Test excavations in the Kaka‘ako Makai Geographic Zone (Zone 11) revealed that the area
was predominantly Fill Lands (FL) as predicted by the U.S.G.S Soil survey map of the zone
(Figure 245). Naturally deposited sediments encountered in this zone were generally too deep for
the GPR to clearly read. The average depth of clean signal return for this area was approximately
one m. Test Excavations that contained naturally deposited sediments within the GPR clean
signal range were included in Table 4. Naturally deposited sediments within the range of clean
GPR signal return for Zone 11. Representative signal texture profiles for Zone 11 are shown in
Figure 246. Signal texture profiles were only collected if the signal return was clear and the
stratum was at least 0.25 m thick.
Table 4. Naturally deposited sediments within the range of clean GPR signal return for Zone 11
ZONE 11- KAKAAKO MAKAI (T-226-T-232A) TEST EXCAVATION STRATUM MATERIAL STRATUM ORIGIN (mbs)
226A IIA loamy sand 0.35 226B II sandy loam 0.45 227 II silty sand 0.5
227B II silty clay 1.1

Cultural Surveys Hawai‘i Job Code: KALIHI 23 Kaka‘ako Makai Geographic Zone
Archaeological Inventory Survey Report, HHCTCP City Center Section 4 257
TMK: [1] 1-2, 1-5, 1-7, 2-1, 2-3 (Various Plats and Parcels)
Figure 245. Aerial photograph (source: U.S. Geological Survey Orthoimagery 2005) with
overlay of the Soil Survey of Hawai‘i (Foote et al. 1972) showing sediment types
within and in the vicinity of the Kaka'ako Makai Zone

Cultural Surveys Hawai‘i Job Code: KALIHI 23 Kaka‘ako Makai Geographic Zone
Archaeological Inventory Survey Report, HHCTCP City Center Section 4 258
TMK: [1] 1-2, 1-5, 1-7, 2-1, 2-3 (Various Plats and Parcels)
Figure 246. Examples of GPR signal textures representing Zone 11 sediments

Cultural Surveys Hawai‘i Job Code: KALIHI 23 Kaka‘ako Makai Geographic Zone
Archaeological Inventory Survey Report, HHCTCP City Center Section 4 259
TMK: [1] 1-2, 1-5, 1-7, 2-1, 2-3 (Various Plats and Parcels)
Test Excavation 226
T-226 measured 0.6 m by 6.0 m and was oriented northeast to southwest and was located
within the road cut of Punchbowl Street, 57.0 m northeast of Ala Moana Boulevard and
Punchbowl Street intersection. The GPR grid measured 2.0 m by 9.0 m with 0.25 m spacing
between Y transects and 1.0 m spacing between X transects. Utilities located near the excavation
include: water drain 1.8 m southeast, water line 1.9 m northwest, sewer line 6.0 m east and
southeast. Concrete jackets were encountered on the north and south end of excavation and a
large utility pipe was encountered 0.6 mbs running through the center of the excavation location.
A review of amplitude slice maps indicated linear features which seem to corresponded to the
utilities and concrete jackets encountered during excavation. Reflectivity was relatively uniform
throughout the grid and decreased with depth. A transition from higher reflectivity to lower
reflectivity was observed at approximately 0.5 mbs (Figure 247).
GPR depth profiles for T-226 identified horizontal banding, commonly associated with
stratigraphic layering, throughout the survey area (Figure 248). This banding corresponded to
variations of density and chemical composition within fill deposits. The profile also indicated a
change in reflectivity that occurred around 0.2 mbs. An anomaly was observed in the profile and
corresponded with the large utility pipe encountered during excavation. The maximum depth of
clean signal return was approximately 1.0 mbs.
Figure 247. Slice maps of T-226 at 25cm depth intervals

Cultural Surveys Hawai‘i Job Code: KALIHI 23 Kaka‘ako Makai Geographic Zone
Archaeological Inventory Survey Report, HHCTCP City Center Section 4 260
TMK: [1] 1-2, 1-5, 1-7, 2-1, 2-3 (Various Plats and Parcels)
A visual comparison of the excavated profile and the GPR signal profile showed a strong
correlation in stratigraphic transitions (Figure 248). Strata Ia and Ic were clearly observed and
occured at the ground-truthed depths. Stratum Ib was not able to be observed in the profile due to
the large anomaly. Two concrete jackets and a utility pipe were found 0.12 and 0.6 mbs,
respectively. A large hyperbola anomaly was observed in the profile and corresponded to the
location that the utility pipe was found during excavation. No other discrete objects or
stratigraphic transitions were observed in the GPR results or subsequent excavation.
Figure 248. Visual comparison of excavated profile and GPR signal profile of T-226

Cultural Surveys Hawai‘i Job Code: KALIHI 23 Kaka‘ako Makai Geographic Zone
Archaeological Inventory Survey Report, HHCTCP City Center Section 4 261
TMK: [1] 1-2, 1-5, 1-7, 2-1, 2-3 (Various Plats and Parcels)
Test Excavation 226A
T-226A measured 0.6 m by 6.0 m and was oriented northeast to southwest and was located
within the road cut of Punchbowl Street, 52.0 m southwest of Punchbowl Street and Pohukaina
Street intersection. The GPR grid measured 2.5 m by 10.0 m with 0.25 m spacing between Y
transects and 1.0 m spacing between X transects. Utilities located near the excavation include:
sewer line 1.1 m southwest, water line 1.3 m northwest, water drain 2.8 m southeast. A utility
pipe was encountered 0.55 mbs in the center of the excavation and a utility jacket along the
entire edge of the northeast wall approximately 0.25 mbs.
A review of amplitude slice maps indicated a linear features that runs parallel to the
excavation and could corresponded to the utility jacket encountered during excavation.
Reflectivity was relatively uniform throughout the grid and decreased with depth. A transition
from higher reflectivity to lower reflectivity was observed at approximately 0.5 mbs (Figure
249).
GPR depth profiles for T-226A identified horizontal banding, commonly associated with
stratigraphic layering, throughout the survey area (Figure 250). This banding corresponded to
variations of density and chemical composition within fill deposits. The profile also indicated a
change in reflectivity that occurred around 0.2 mbs. Several anomalies were observed in the
profile and one corresponded to the utility pipe encountered during excavation and the others
were not within the excavation boundaries. The maximum depth of clean signal return was
approximately 0.9 mbs.
Figure 249. Slice maps of T- 226A at 25cm depth intervals

Cultural Surveys Hawai‘i Job Code: KALIHI 23 Kaka‘ako Makai Geographic Zone
Archaeological Inventory Survey Report, HHCTCP City Center Section 4 262
TMK: [1] 1-2, 1-5, 1-7, 2-1, 2-3 (Various Plats and Parcels)
A visual comparison of the excavated profile and the GPR signal profile showed a moderate
correlation in stratigraphic transitions (Figure 250). Strata Ia to Ic were clearly observed and
occured near the ground-truthed depths. An increase in reflectivity was observed around 0.8 mbs
and may represent loamy sand or sand located at this depth. A pipe was found 0.55 mbs. A void
was observed at the same location as the utility pipe. A utility jacket was found 0.25 mbs. This
jacket did not showed up on profile possibly due to the fact that the profile was not taken on the
wall that the jacket was found along. No other discrete objects were observed in the GPR results
or subsequent excavation.
Figure 250. Visual comparison of excavated profile and GPR signal profile of T- 226A

Cultural Surveys Hawai‘i Job Code: KALIHI 23 Kaka‘ako Makai Geographic Zone
Archaeological Inventory Survey Report, HHCTCP City Center Section 4 263
TMK: [1] 1-2, 1-5, 1-7, 2-1, 2-3 (Various Plats and Parcels)
Test Excavation 226B
T-226B measured 0.6 m by 6.0 m and was oriented northeast to southwest and was located
within the road cut of Punchbowl Street, 20.0 m east of Ala Moana Boulevard and Punchbowl
Street intersection. The GPR grid measured 3.0 m by 10.0 m with 0.25 m spacing between Y
transects and 1.0 m spacing between X transects. Utilities located near the excavation include:
water line 2.6 m southeast, water drain 3.8 m southeast, sewer line 6.8 m southeast. No utilities
transected the excavation location.
A review of amplitude slice maps indicated linear but not within the excavation boundaries.
Reflectivity was relatively uniform throughout the grid and decreased with depth except for the
linear features. A transition from higher reflectivity to lower reflectivity was observed at
approximately 0.25 mbs (Figure 251).
GPR depth profiles for T-226B identified horizontal banding, commonly associated with
stratigraphic layering, throughout the survey area (Figure 252). This banding corresponded to
variations of density and chemical composition within fill deposits. The profile also indicated a
change in reflectivity that occurred around 0.2 mbs. Anomalies were observed in the profile but
not within excavation boundaries. The maximum depth of clean signal return was approximately
0.75 mbs.
Figure 251. Slice maps of T-226B at 25cm depth intervals
Cultural Surveys Hawai‘i Job Code: KALIHI 23 Kaka‘ako Makai Geographic Zone
Archaeological Inventory Survey Report, HHCTCP City Center Section 4 264
TMK: [1] 1-2, 1-5, 1-7, 2-1, 2-3 (Various Plats and Parcels)
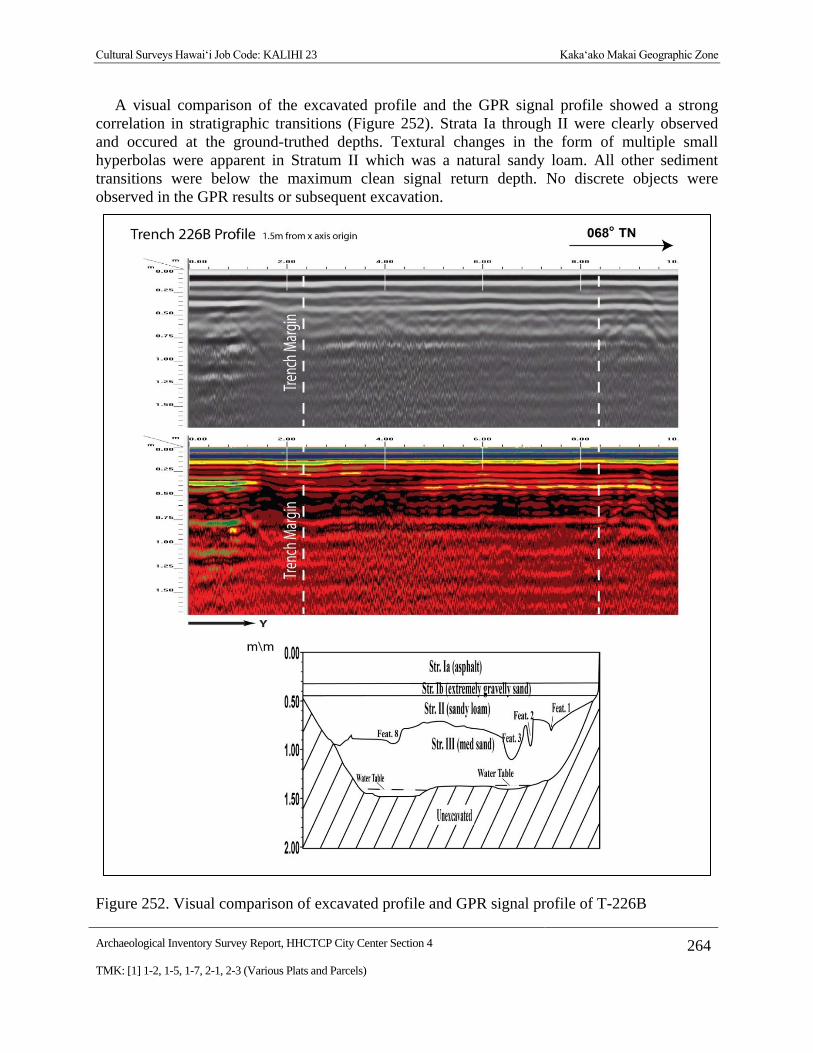
A visual comparison of the excavated profile and the GPR signal profile showed a strong
correlation in stratigraphic transitions (Figure 252). Strata Ia through II were clearly observed
and occured at the ground-truthed depths. Textural changes in the form of multiple small
hyperbolas were apparent in Stratum II which was a natural sandy loam. All other sediment
transitions were below the maximum clean signal return depth. No discrete objects were
observed in the GPR results or subsequent excavation.
Figure 252. Visual comparison of excavated profile and GPR signal profile of T-226B
Cultural Surveys Hawai‘i Job Code: KALIHI 23 Kaka‘ako Makai Geographic Zone
Archaeological Inventory Survey Report, HHCTCP City Center Section 4 265
TMK: [1] 1-2, 1-5, 1-7, 2-1, 2-3 (Various Plats and Parcels)
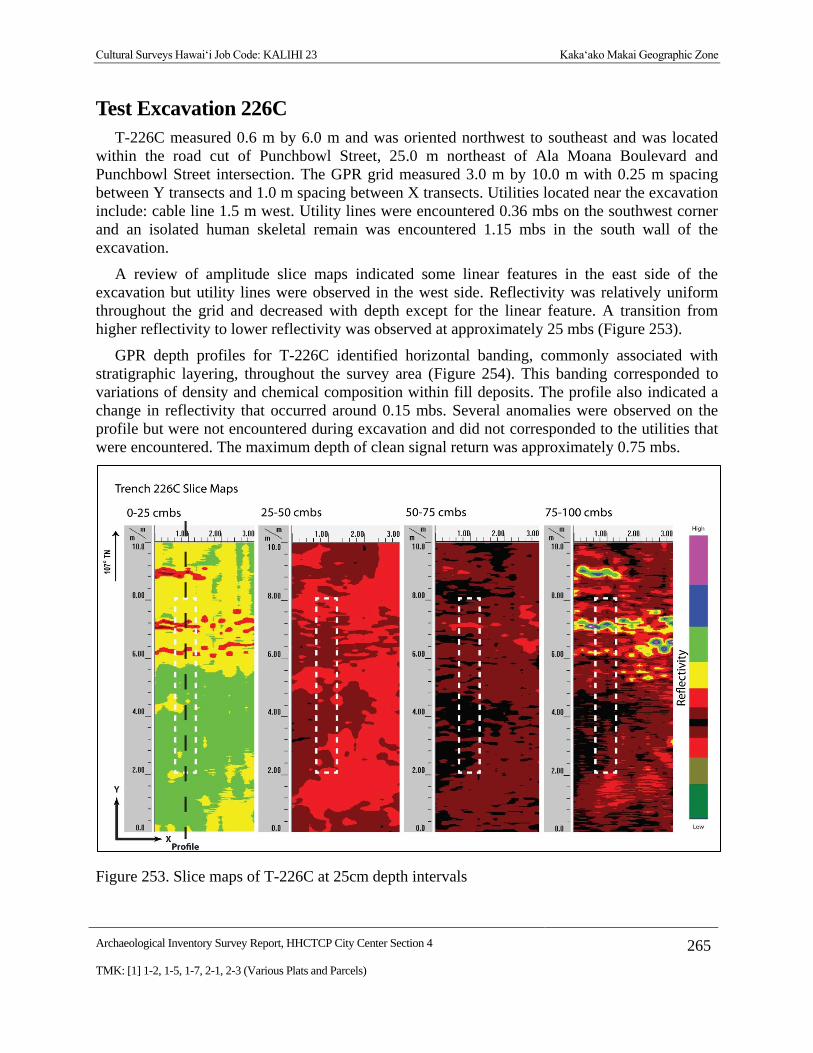
Test Excavation 226C
T-226C measured 0.6 m by 6.0 m and was oriented northwest to southeast and was located
within the road cut of Punchbowl Street, 25.0 m northeast of Ala Moana Boulevard and
Punchbowl Street intersection. The GPR grid measured 3.0 m by 10.0 m with 0.25 m spacing
between Y transects and 1.0 m spacing between X transects. Utilities located near the excavation
include: cable line 1.5 m west. Utility lines were encountered 0.36 mbs on the southwest corner
and an isolated human skeletal remain was encountered 1.15 mbs in the south wall of the
excavation.
A review of amplitude slice maps indicated some linear features in the east side of the
excavation but utility lines were observed in the west side. Reflectivity was relatively uniform
throughout the grid and decreased with depth except for the linear feature. A transition from
higher reflectivity to lower reflectivity was observed at approximately 25 mbs (Figure 253).
GPR depth profiles for T-226C identified horizontal banding, commonly associated with
stratigraphic layering, throughout the survey area (Figure 254). This banding corresponded to
variations of density and chemical composition within fill deposits. The profile also indicated a
change in reflectivity that occurred around 0.15 mbs. Several anomalies were observed on the
profile but were not encountered during excavation and did not corresponded to the utilities that
were encountered. The maximum depth of clean signal return was approximately 0.75 mbs.
Figure 253. Slice maps of T-226C at 25cm depth intervals

Cultural Surveys Hawai‘i Job Code: KALIHI 23 Kaka‘ako Makai Geographic Zone
Archaeological Inventory Survey Report, HHCTCP City Center Section 4 266
TMK: [1] 1-2, 1-5, 1-7, 2-1, 2-3 (Various Plats and Parcels)
A visual comparison of the excavated profile and the GPR signal profile showed a moderate
correlation in stratigraphic transitions (Figure 254). Strata Ia and Ib were all clearly observed and
occured near the ground-truthed depths. Several electrical PVC pipes were found 0.36 mbs.
These pipes did not showed up on the profile or slice maps. This may be due to the fact that the
pipes were comprised of PVC, very small, or similar in density to the surrounding stratum. No
other discrete objects were observed in the GPR results or subsequent excavation.
Figure 254. Visual comparison of excavated profile and GPR signal profile of T-226C
Cultural Surveys Hawai‘i Job Code: KALIHI 23 Kaka‘ako Makai Geographic Zone
Archaeological Inventory Survey Report, HHCTCP City Center Section 4 267
TMK: [1] 1-2, 1-5, 1-7, 2-1, 2-3 (Various Plats and Parcels)
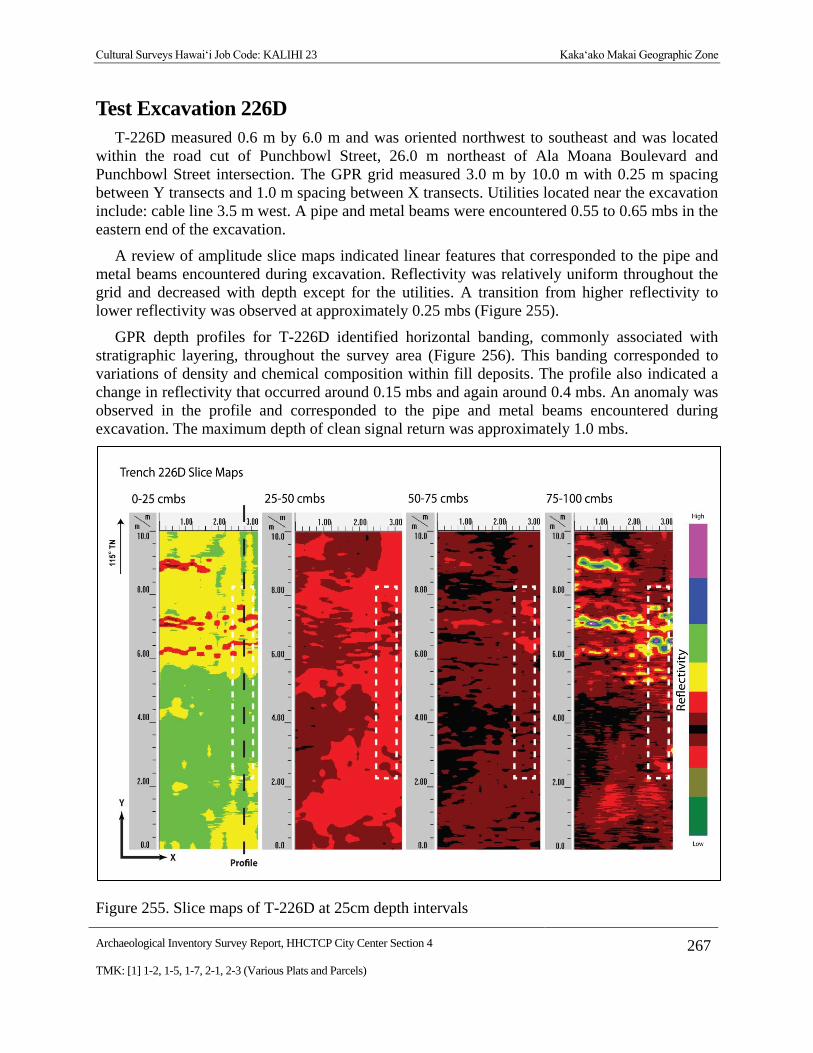
Test Excavation 226D
T-226D measured 0.6 m by 6.0 m and was oriented northwest to southeast and was located
within the road cut of Punchbowl Street, 26.0 m northeast of Ala Moana Boulevard and
Punchbowl Street intersection. The GPR grid measured 3.0 m by 10.0 m with 0.25 m spacing
between Y transects and 1.0 m spacing between X transects. Utilities located near the excavation
include: cable line 3.5 m west. A pipe and metal beams were encountered 0.55 to 0.65 mbs in the
eastern end of the excavation.
A review of amplitude slice maps indicated linear features that corresponded to the pipe and
metal beams encountered during excavation. Reflectivity was relatively uniform throughout the
grid and decreased with depth except for the utilities. A transition from higher reflectivity to
lower reflectivity was observed at approximately 0.25 mbs (Figure 255).
GPR depth profiles for T-226D identified horizontal banding, commonly associated with
stratigraphic layering, throughout the survey area (Figure 256). This banding corresponded to
variations of density and chemical composition within fill deposits. The profile also indicated a
change in reflectivity that occurred around 0.15 mbs and again around 0.4 mbs. An anomaly was
observed in the profile and corresponded to the pipe and metal beams encountered during
excavation. The maximum depth of clean signal return was approximately 1.0 mbs.
Figure 255. Slice maps of T-226D at 25cm depth intervals

Cultural Surveys Hawai‘i Job Code: KALIHI 23 Kaka‘ako Makai Geographic Zone
Archaeological Inventory Survey Report, HHCTCP City Center Section 4 268
TMK: [1] 1-2, 1-5, 1-7, 2-1, 2-3 (Various Plats and Parcels)
A visual comparison of the excavated profile and the GPR signal profile showed a strong
correlation in stratigraphic transitions (Figure 256). Strata Ia to Ic were clearly observed and
occured at the ground-truthed depths. All other sediment transitions were below the maximum
clean signal return depth. A utility pipe and metal beams were found 0.55-0.65 mbs. The pipe
and beams corresponded to an anomaly observed in the profile. No other discrete objects were
observed in the GPR results or subsequent excavation.
Figure 256. Visual comparison of excavated profile and GPR signal profile of T-226D

Cultural Surveys Hawai‘i Job Code: KALIHI 23 Kaka‘ako Makai Geographic Zone
Archaeological Inventory Survey Report, HHCTCP City Center Section 4 269
TMK: [1] 1-2, 1-5, 1-7, 2-1, 2-3 (Various Plats and Parcels)
Test Excavation 227
T-227 measured 0.6 m by 6.0 m and was oriented northeast to southwest and was located
within the road cut of Punchbowl Street, 13.0 m southwest of Punchbowl and Pohukaina Street
intersection. The GPR grid measured 2.0 m by 9.0 m with 0.25 m spacing between Y transects
and 1.0 m spacing between X transects. Utilities located near the excavation include: water line
1.5 m southeast. No utilities transected the GPR grid or excavation location.
A review of amplitude slice maps indicated no linear features which might indicate the
presence of utilities. Reflectivity was relatively uniform throughout the grid and decreased with
depth. A transition from higher reflectivity to lower reflectivity was observed at approximately
0.5 mbs (Figure 257).
GPR depth profiles for T-227 identified horizontal banding, commonly associated with
stratigraphic layering, throughout the survey area (Figure 258). This banding corresponded to
variations of density and chemical composition within fill deposits. The profile also indicated a
change in reflectivity that occurred around 0.25 mbs. No utilities were observed in the profile.
The maximum depth of clean signal return was approximately 0.9 mbs.
Figure 257. Slice maps of T-227 at 25cm depth intervals

Cultural Surveys Hawai‘i Job Code: KALIHI 23 Kaka‘ako Makai Geographic Zone
Archaeological Inventory Survey Report, HHCTCP City Center Section 4 270
TMK: [1] 1-2, 1-5, 1-7, 2-1, 2-3 (Various Plats and Parcels)
A visual comparison of the excavated profile and the GPR signal profile showed a strong
correlation in stratigraphic transitions (Figure 258). Strata Ia to II were clearly observed and
occured at the ground-truthed depths. Strata Ia through Id may be difficult to individually
discern, possibly due to the fact that they were very thin layers of compacted fill, but based on
reflectivity and horizontal banding it was apparent that there were multiple layers of fill
events.All other sediment transitions were below the maximum clean signal return depth. No
discrete objects were observed in the GPR results or subsequent excavation.
Figure 258. Visual comparison of excavated profile and GPR signal profile of T-227
Cultural Surveys Hawai‘i Job Code: KALIHI 23 Kaka‘ako Makai Geographic Zone
Archaeological Inventory Survey Report, HHCTCP City Center Section 4 271
TMK: [1] 1-2, 1-5, 1-7, 2-1, 2-3 (Various Plats and Parcels)
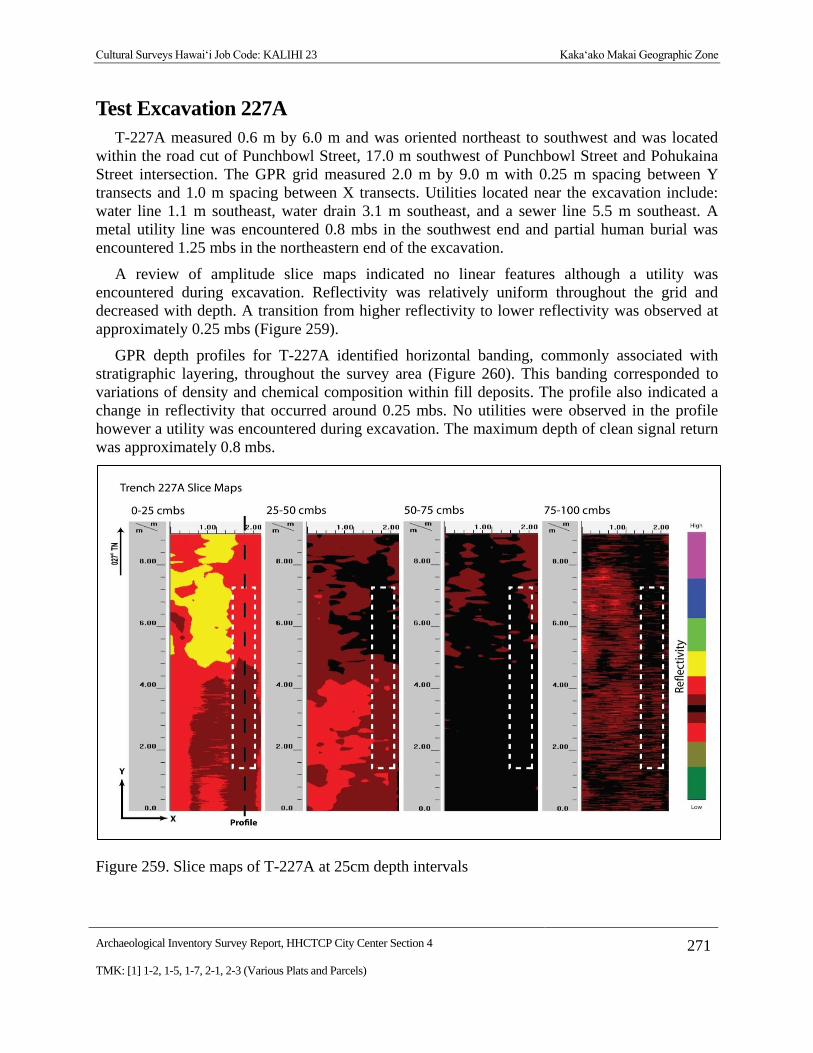
Test Excavation 227A
T-227A measured 0.6 m by 6.0 m and was oriented northeast to southwest and was located
within the road cut of Punchbowl Street, 17.0 m southwest of Punchbowl Street and Pohukaina
Street intersection. The GPR grid measured 2.0 m by 9.0 m with 0.25 m spacing between Y
transects and 1.0 m spacing between X transects. Utilities located near the excavation include:
water line 1.1 m southeast, water drain 3.1 m southeast, and a sewer line 5.5 m southeast. A
metal utility line was encountered 0.8 mbs in the southwest end and partial human burial was
encountered 1.25 mbs in the northeastern end of the excavation.
A review of amplitude slice maps indicated no linear features although a utility was
encountered during excavation. Reflectivity was relatively uniform throughout the grid and
decreased with depth. A transition from higher reflectivity to lower reflectivity was observed at
approximately 0.25 mbs (Figure 259).
GPR depth profiles for T-227A identified horizontal banding, commonly associated with
stratigraphic layering, throughout the survey area (Figure 260). This banding corresponded to
variations of density and chemical composition within fill deposits. The profile also indicated a
change in reflectivity that occurred around 0.25 mbs. No utilities were observed in the profile
however a utility was encountered during excavation. The maximum depth of clean signal return
was approximately 0.8 mbs.
Figure 259. Slice maps of T-227A at 25cm depth intervals

Cultural Surveys Hawai‘i Job Code: KALIHI 23 Kaka‘ako Makai Geographic Zone
Archaeological Inventory Survey Report, HHCTCP City Center Section 4 272
TMK: [1] 1-2, 1-5, 1-7, 2-1, 2-3 (Various Plats and Parcels)
A visual comparison of the excavated profile and the GPR signal profile showed a moderate
correlation in stratigraphic transitions (Figure 260). Strata Ia and Ib were clearly observed and
occured at the ground-truthed depths. A metal utility pipe was found 0.8 mbs. This pipe did not
showed up on the profile or slice maps. This may be due to the fact that it was empty or had a
small diam. A partial human burial was found 1.25 mbs but did not showed up on the profile or
slice maps due to it being below maximum clean signal return depth. No other discrete objects
were observed in the GPR results or subsequent excavation.
Figure 260. Visual comparison of excavated profile and GPR signal profile of T-227A
Cultural Surveys Hawai‘i Job Code: KALIHI 23 Kaka‘ako Makai Geographic Zone
Archaeological Inventory Survey Report, HHCTCP City Center Section 4 273
TMK: [1] 1-2, 1-5, 1-7, 2-1, 2-3 (Various Plats and Parcels)
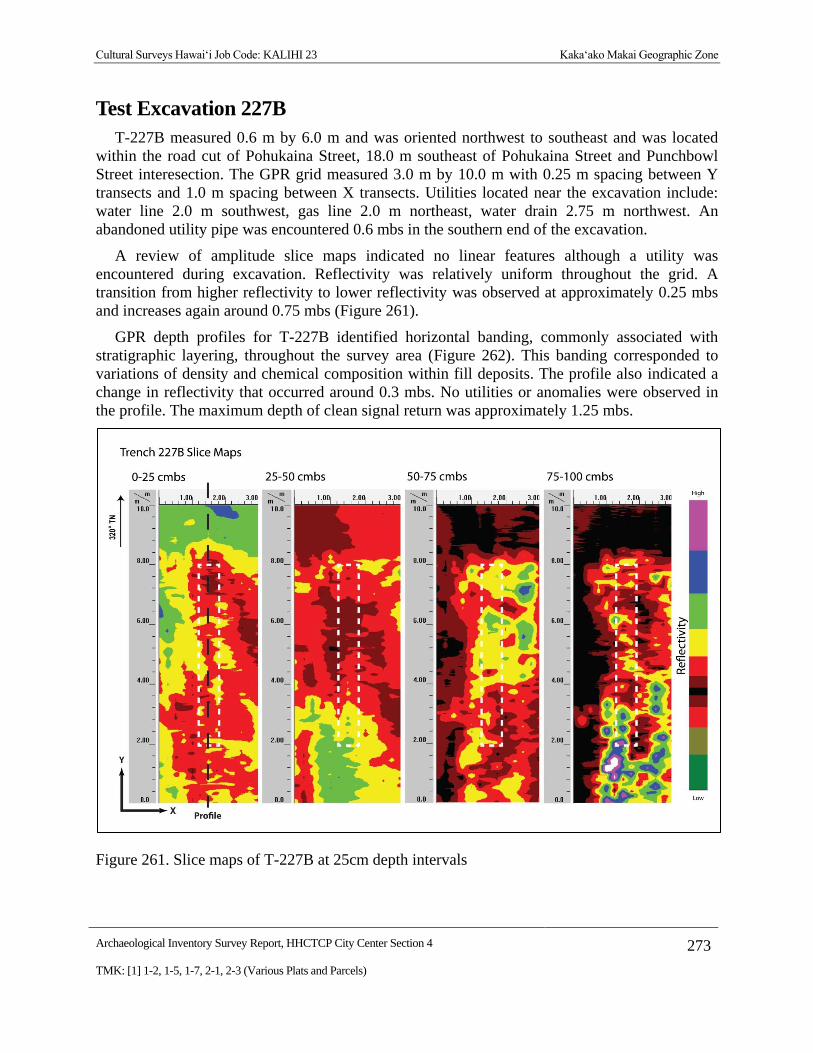
Test Excavation 227B
T-227B measured 0.6 m by 6.0 m and was oriented northwest to southeast and was located
within the road cut of Pohukaina Street, 18.0 m southeast of Pohukaina Street and Punchbowl
Street interesection. The GPR grid measured 3.0 m by 10.0 m with 0.25 m spacing between Y
transects and 1.0 m spacing between X transects. Utilities located near the excavation include:
water line 2.0 m southwest, gas line 2.0 m northeast, water drain 2.75 m northwest. An
abandoned utility pipe was encountered 0.6 mbs in the southern end of the excavation.
A review of amplitude slice maps indicated no linear features although a utility was
encountered during excavation. Reflectivity was relatively uniform throughout the grid. A
transition from higher reflectivity to lower reflectivity was observed at approximately 0.25 mbs
and increases again around 0.75 mbs (Figure 261).
GPR depth profiles for T-227B identified horizontal banding, commonly associated with
stratigraphic layering, throughout the survey area (Figure 262). This banding corresponded to
variations of density and chemical composition within fill deposits. The profile also indicated a
change in reflectivity that occurred around 0.3 mbs. No utilities or anomalies were observed in
the profile. The maximum depth of clean signal return was approximately 1.25 mbs.
Figure 261. Slice maps of T-227B at 25cm depth intervals
Cultural Surveys Hawai‘i Job Code: KALIHI 23 Kaka‘ako Makai Geographic Zone
Archaeological Inventory Survey Report, HHCTCP City Center Section 4 274
TMK: [1] 1-2, 1-5, 1-7, 2-1, 2-3 (Various Plats and Parcels)
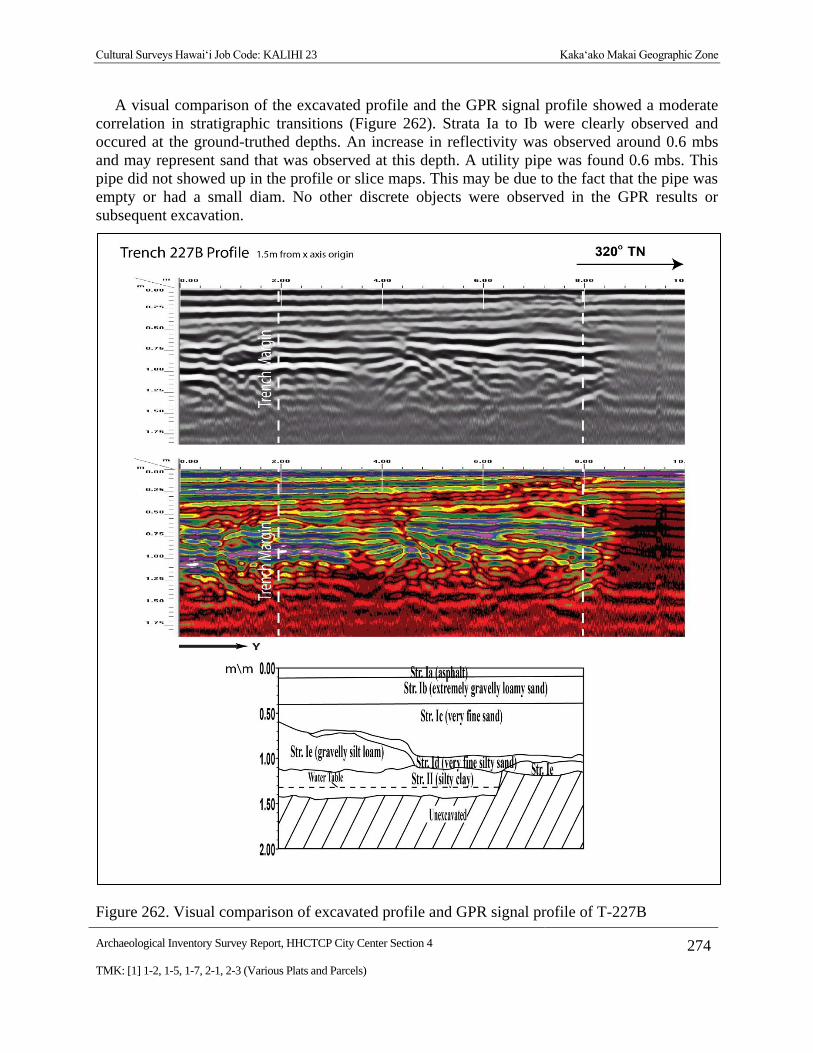
A visual comparison of the excavated profile and the GPR signal profile showed a moderate
correlation in stratigraphic transitions (Figure 262). Strata Ia to Ib were clearly observed and
occured at the ground-truthed depths. An increase in reflectivity was observed around 0.6 mbs
and may represent sand that was observed at this depth. A utility pipe was found 0.6 mbs. This
pipe did not showed up in the profile or slice maps. This may be due to the fact that the pipe was
empty or had a small diam. No other discrete objects were observed in the GPR results or
subsequent excavation.
Figure 262. Visual comparison of excavated profile and GPR signal profile of T-227B

Cultural Surveys Hawai‘i Job Code: KALIHI 23 Kaka‘ako Makai Geographic Zone
Archaeological Inventory Survey Report, HHCTCP City Center Section 4 275
TMK: [1] 1-2, 1-5, 1-7, 2-1, 2-3 (Various Plats and Parcels)
Test Excavation 228
T-228 measured 0.6 m by 6.0 m and was oriented northwest to southeast and was located
within the road cut of Pohukaina Street, 85.0 m northwest of Pohukaina Street and South Street
intersection. The GPR grid measured 2.5 m by 10.0 m with 0.25 m spacing between Y transects
and 1.0 m spacing between X transects. Utilities located near the excavation include: sewer line
3.5 m southwest, water line 5.6 m southwest. No utilities transected the excavation location.
A review of amplitude slice maps indicated no linear features which might indicate the
presence of utilities. Reflectivity was relatively uniform throughout the grid and decreased with
depth. A transition from higher reflectivity to lower reflectivity was observed at approximately
0.5 mbs (Figure 263).
GPR depth profiles for T-228 identified horizontal banding, commonly associated with
stratigraphic layering, throughout the survey area (Figure 264). This banding corresponded to
variations of density and chemical composition within fill deposits. The profile also indicated a
change in reflectivity that occurred around 0.35 mbs. Anomalies were observed in the profile but
not within the excavation boundaries. The maximum depth of clean signal return was
approximately 1.0 mbs.
Figure 263. Slice maps of T-228 at 25cm depth intervals
Cultural Surveys Hawai‘i Job Code: KALIHI 23 Kaka‘ako Makai Geographic Zone
Archaeological Inventory Survey Report, HHCTCP City Center Section 4 276
TMK: [1] 1-2, 1-5, 1-7, 2-1, 2-3 (Various Plats and Parcels)
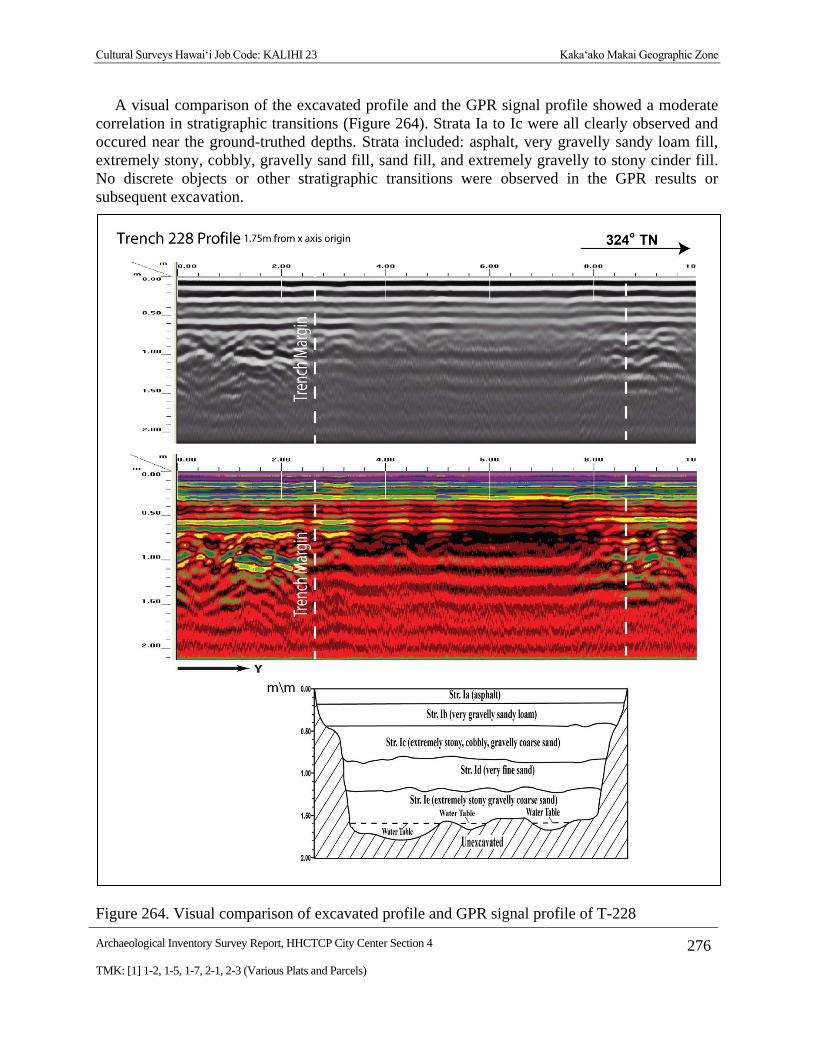
A visual comparison of the excavated profile and the GPR signal profile showed a moderate
correlation in stratigraphic transitions (Figure 264). Strata Ia to Ic were all clearly observed and
occured near the ground-truthed depths. Strata included: asphalt, very gravelly sandy loam fill,
extremely stony, cobbly, gravelly sand fill, sand fill, and extremely gravelly to stony cinder fill.
No discrete objects or other stratigraphic transitions were observed in the GPR results or
subsequent excavation.
Figure 264. Visual comparison of excavated profile and GPR signal profile of T-228

Cultural Surveys Hawai‘i Job Code: KALIHI 23 Kaka‘ako Makai Geographic Zone
Archaeological Inventory Survey Report, HHCTCP City Center Section 4 277
TMK: [1] 1-2, 1-5, 1-7, 2-1, 2-3 (Various Plats and Parcels)
Test Excavation 228A
T-228A measured 0.6 m by 6.0 m and was oriented northwest to southeast and was located
within the road cut of Pohukaina Street, 57.0 m southeast of Pohukaina Street and Punchbowl
Street intersection. The GPR grid measured 3.0 m by 10.0 m with 0.25 m spacing between Y
transects and 1.0 m spacing between X transects. Utilities located near the excavation include:
gas line 0.6 m southwest, sewer line 2.5 m southwest and 4.4 m southeast, water line 2.8 m
northwest. No utilities transected the excavation location.
A review of amplitude slice maps indicated no linear features which might indicate the
presence of utilities. Reflectivity was relatively uniform throughout the grid. A transition from
higher reflectivity to lower reflectivity was observed at approximately 0.25 mbs and increases
again around 0.75 mbs (Figure 265).
GPR depth profiles for T-228A identified horizontal banding, commonly associated with
stratigraphic layering, throughout the survey area (Figure 266). This banding corresponded to
variations of density and chemical composition within fill deposits. The profile also indicated a
change in reflectivity that occurred around 0.15 mbs and again at 0.5 mbs. No utilities were
observed in the profile. The maximum depth of clean signal return was approximately 1.3 mbs.
Figure 265. Slice maps of T-228A at 25cm depth intervals
Cultural Surveys Hawai‘i Job Code: KALIHI 23 Kaka‘ako Makai Geographic Zone
Archaeological Inventory Survey Report, HHCTCP City Center Section 4 278
TMK: [1] 1-2, 1-5, 1-7, 2-1, 2-3 (Various Plats and Parcels)
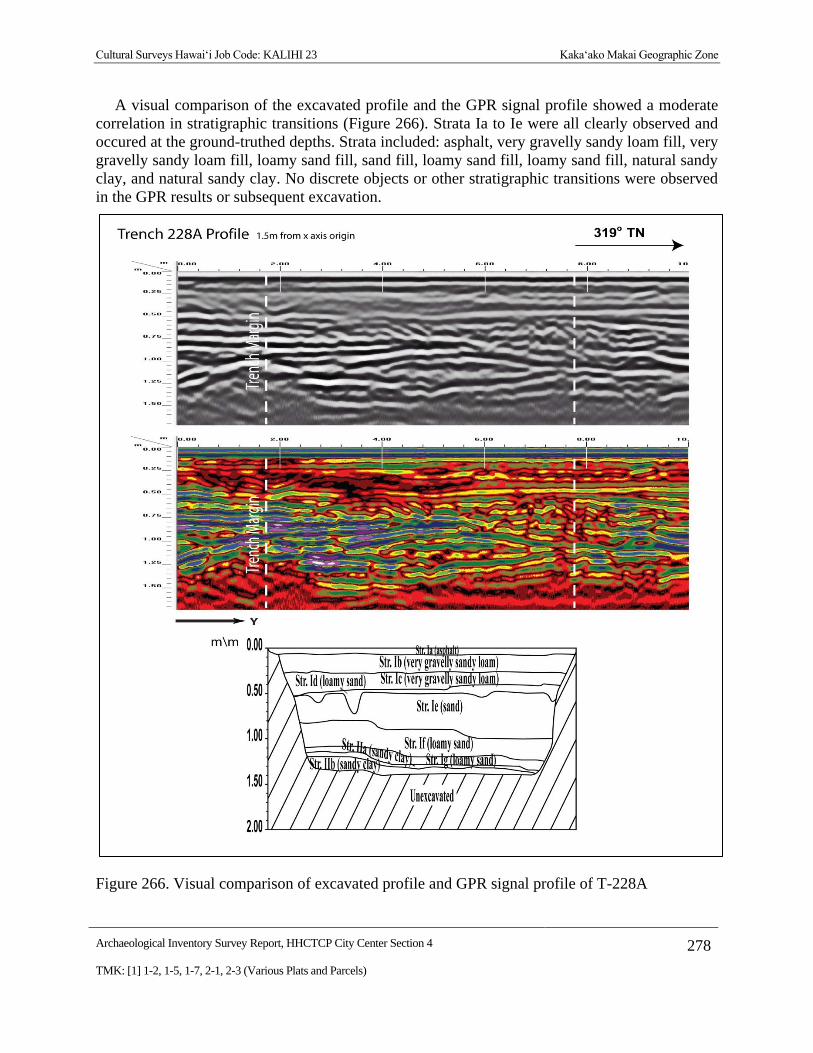
A visual comparison of the excavated profile and the GPR signal profile showed a moderate
correlation in stratigraphic transitions (Figure 266). Strata Ia to Ie were all clearly observed and
occured at the ground-truthed depths. Strata included: asphalt, very gravelly sandy loam fill, very
gravelly sandy loam fill, loamy sand fill, sand fill, loamy sand fill, loamy sand fill, natural sandy
clay, and natural sandy clay. No discrete objects or other stratigraphic transitions were observed
in the GPR results or subsequent excavation.
Figure 266. Visual comparison of excavated profile and GPR signal profile of T-228A

Cultural Surveys Hawai‘i Job Code: KALIHI 23 Kaka‘ako Makai Geographic Zone
Archaeological Inventory Survey Report, HHCTCP City Center Section 4 279
TMK: [1] 1-2, 1-5, 1-7, 2-1, 2-3 (Various Plats and Parcels)
Test Excavation 229
T-229 measured 0.6 m by 6.0 m and was oriented northwest to southeast and was located
within the road cut of Pohukaina Street, 55.0 m southeast of Pohukaina Street and South Street
intersection. The GPR grid measured 2.0 m by 9.0 m with 0.25 m spacing between Y transects
and 1.0 m spacing between X transects. Utilities located near the excavation include: water drain
0.2 m northeast, sewer line 3.8 m southwest. No utilities transected the GPR grid or excavation
location.
A review of amplitude slice maps indicated no linear features which might indicate the
presence of utilities. Reflectivity was relatively uniform throughout the grid and decreased with
depth. A transition from higher reflectivity to lower reflectivity was observed at approximately
0.5 mbs (Figure 267).
GPR depth profiles for T-229 identified horizontal banding, commonly associated with
stratigraphic layering, throughout the survey area (Figure 268). This banding corresponded to
variations of density and chemical composition within fill deposits. The profile also indicated a
change in reflectivity that occurred around 0.25 mbs. No utilities were observed in the profile.
The maximum depth of clean signal return was approximately 1.0 mbs.
Figure 267. Slice maps of T-229 at 25cm depth intervals

Cultural Surveys Hawai‘i Job Code: KALIHI 23 Kaka‘ako Makai Geographic Zone
Archaeological Inventory Survey Report, HHCTCP City Center Section 4 280
TMK: [1] 1-2, 1-5, 1-7, 2-1, 2-3 (Various Plats and Parcels)
A visual comparison of the excavated profile and the GPR signal profile showed a weak
correlation in stratigraphic transitions (Figure 268). Strata included: asphalt, basalt gravel,
gravelly sandy loam fill, incinerator layer, sandy clay loam fill, extremely cobbly sandy silt fill,
sandy clay fill, sandy clay fill, natural sandy clay, and the coral shelf. These transitions were not
clearly depicted in the GPR profile at the depths that they occured. No other sediment transitions
or discrete objects were observed in the GPR results or subsequent excavation.
Figure 268. Visual comparison of excavated profile and GPR signal profile of T-229

Cultural Surveys Hawai‘i Job Code: KALIHI 23 Kaka‘ako Makai Geographic Zone
Archaeological Inventory Survey Report, HHCTCP City Center Section 4 281
TMK: [1] 1-2, 1-5, 1-7, 2-1, 2-3 (Various Plats and Parcels)
Test Excavation 230
T-230 measured 0.6 m by 6.0 m and was oriented northwest to southeast and was located
within the road cut of Pohukaina Street, 21.0 m southeast of Pohukaina Street and Keawe Street
intersection. The GPR grid measured 2.0 m by 9.0 m with 0.25 m spacing between Y transects
and 1.0 m spacing between X transects. Utilities located near the excavation include: water drain
1.2 m northeast, sewer line 1.8 m southwest. No utilities transected the GPR grid or excavation
location.
A review of amplitude slice maps indicated no linear features which might indicate the
presence of utilities. Reflectivity was relatively uniform throughout the grid and decreased with
depth. A transition from higher reflectivity to lower reflectivity was observed at approximately
0.25 mbs (Figure 269).
GPR depth profiles for T-230 identified horizontal banding, commonly associated with
stratigraphic layering, throughout the survey area (Figure 270). This banding corresponded to
variations of density and chemical composition within fill deposits. The profile also indicated a
change in reflectivity that occurred around 0.1 mbs. No utilities were observed in the profile. The
maximum depth of clean signal return was approximately 1.0 mbs.
Figure 269. Slice maps of T-230 at 25cm depth intervals
Cultural Surveys Hawai‘i Job Code: KALIHI 23 Kaka‘ako Makai Geographic Zone
Archaeological Inventory Survey Report, HHCTCP City Center Section 4 282
TMK: [1] 1-2, 1-5, 1-7, 2-1, 2-3 (Various Plats and Parcels)
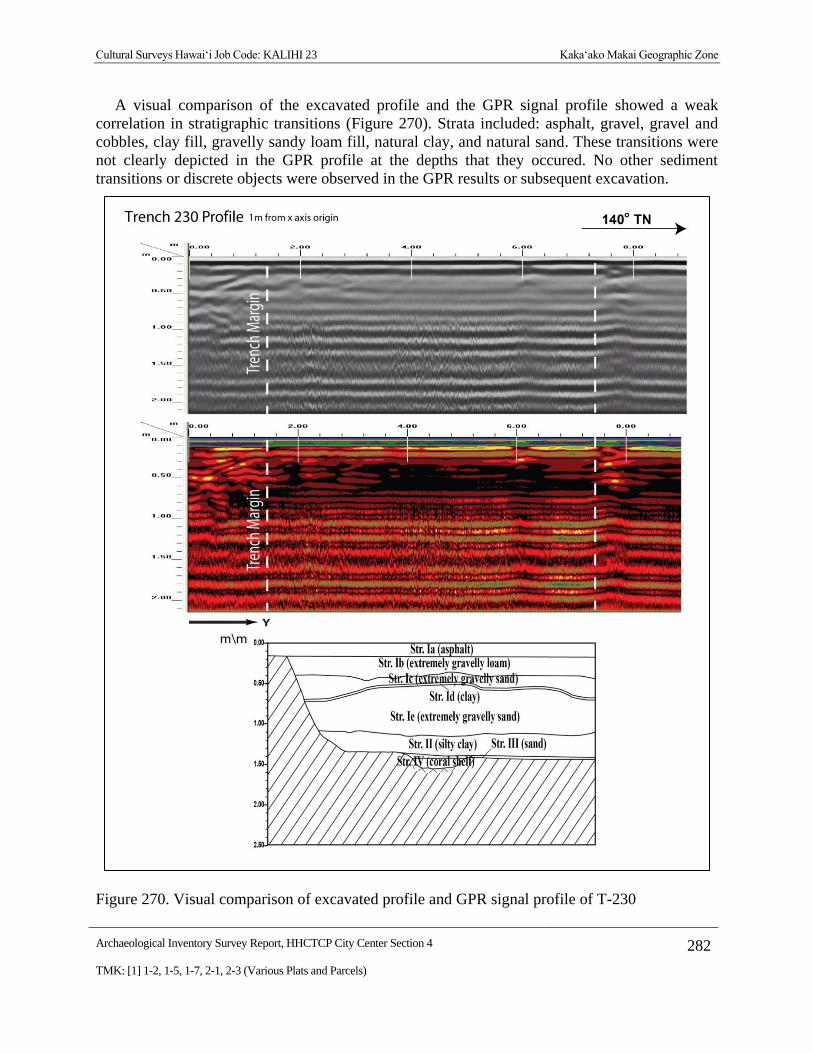
A visual comparison of the excavated profile and the GPR signal profile showed a weak
correlation in stratigraphic transitions (Figure 270). Strata included: asphalt, gravel, gravel and
cobbles, clay fill, gravelly sandy loam fill, natural clay, and natural sand. These transitions were
not clearly depicted in the GPR profile at the depths that they occured. No other sediment
transitions or discrete objects were observed in the GPR results or subsequent excavation.
Figure 270. Visual comparison of excavated profile and GPR signal profile of T-230

Cultural Surveys Hawai‘i Job Code: KALIHI 23 Kaka‘ako Makai Geographic Zone
Archaeological Inventory Survey Report, HHCTCP City Center Section 4 283
TMK: [1] 1-2, 1-5, 1-7, 2-1, 2-3 (Various Plats and Parcels)
Test Excavation 231
T-231 measured 0.6 m by 6.0 m and was oriented northwest to southeast and was located
within the road cut of Pohukaina Street, 6 m northwest of Pohukaina Street and Lana Lane
intersection. The GPR grid measured 3.0 m by 10.0 m with 0.25 m spacing between Y transects
and 1.0 m spacing between X transects. Utilities located near the excavation include: sewer line
runs from northwest end to southeast end of excavation, water line 3.7 m northeast. A 12” sewer
line was encountered 1.3 mbs running the full length and through the center of the excavation
location.
A review of amplitude slice maps indicated a linear feature which could corresponded to the
sewer line that was encountered during excavation. Reflectivity was relatively uniform
throughout the grid and decreased with depth. A transition from higher reflectivity to lower
reflectivity was observed at approximately 0.25 mbs (Figure 271).
GPR depth profiles for T-231 identified horizontal banding, commonly associated with
stratigraphic layering, throughout the survey area (Figure 272). This banding corresponded to
variations of density and chemical composition within fill deposits. The profile also indicated a
change in reflectivity that occurred around 0.2mbs and again around 0.7 mbs. An anomaly was
observed in the profile and seems to corresponded to the sewer line that was encountered during
excavation. The maximum depth of clean signal return was approximately 1.4 mbs.
Figure 271. Slice maps of T-231 at 25cm depth intervals

Cultural Surveys Hawai‘i Job Code: KALIHI 23 Kaka‘ako Makai Geographic Zone
Archaeological Inventory Survey Report, HHCTCP City Center Section 4 284
TMK: [1] 1-2, 1-5, 1-7, 2-1, 2-3 (Various Plats and Parcels)
A visual comparison of the excavated profile and the GPR signal profile showed a moderate
correlation in stratigraphic transitions (Figure 272). Strata Ia to Ib were clearly observed and
occured near the ground-truthed depths. Strata included: asphalt, extremely gravelly loam,
extremely gravelly sand, silty sand fill, and sand fill. A sewer line was found 1.3 mbs. This
corresponded to an increase in reflectivety and hyperbola around the same depth. No other
discrete objects were observed in the GPR results or subsequent excavation.
Figure 272. Visual comparison of excavated profile and GPR signal profile of T-231

Cultural Surveys Hawai‘i Job Code: KALIHI 23 Kaka‘ako Makai Geographic Zone
Archaeological Inventory Survey Report, HHCTCP City Center Section 4 285
TMK: [1] 1-2, 1-5, 1-7, 2-1, 2-3 (Various Plats and Parcels)
Test Excavation 231A
T-231A measured 0.6 m by 6.0 m and was oriented northwest to southeast and was located
within the road cut of Pohukaina Street, 8.0 m north of Pohukaina Street and Lana Lane
intersection. The GPR grid measured 3.0 m by 10.0 m with 0.25 m spacing between Y transects
and 1.0 m spacing between X transects. Utilities located near the excavation include: water line
4.3 m southwest, sewer line 8.1 m southeast. Two metal utility pipes were encountered at 0.55
mbs and 1.26 mbs in the northwest side of the excavation.
A review of amplitude slice maps indicated no linear features although two utilities were
encountered during excavation. Reflectivity was relatively uniform throughout the grid and
decreased with depth. A transition from higher reflectivity to lower reflectivity was observed at
approximately 0.25 mbs (Figure 273).
GPR depth profiles for T-231A identified horizontal banding, commonly associated with
stratigraphic layering, throughout the survey area (Figure 274). This banding corresponded to
variations of density and chemical composition within fill deposits. The profile also indicated a
change in reflectivity that occurred around 0.15 mbs and again around 0.6 mbs. An anomaly was
observed in the profile but was not observed during excavation and does not corresponded to the
utilities encountered. The maximum depth of clean signal return was approximately 0.8 mbs.
Figure 273. Slice maps of T-231A at 25cm depth intervals

Cultural Surveys Hawai‘i Job Code: KALIHI 23 Kaka‘ako Makai Geographic Zone
Archaeological Inventory Survey Report, HHCTCP City Center Section 4 286
TMK: [1] 1-2, 1-5, 1-7, 2-1, 2-3 (Various Plats and Parcels)
A visual comparison of the excavated profile and the GPR signal profile showed a strong
correlation in stratigraphic transitions (Figure 274). Strata Ia and Ib were clearly observed and
occured at the ground-truthed depths. Textural changes in the form of multiple small hyperbolas
were apparent in Stratum Ib which was extremely gravelly silty sand fill. All other sediment
transitions were below the maximum clean signal return depth. Two metal pipes were found 0.55
and 1.26 mbs. The two pipes did not showed up in the profile or slice maps. This may be due to
the fact that the pipes may have had a similar density to the surrounding stratum or that they
were empty. No other discrete objects were observed in the GPR results or subsequent
excavation.
Figure 274. Visual comparison of excavated profile and GPR signal profile of T-231A

Cultural Surveys Hawai‘i Job Code: KALIHI 23 Kaka‘ako Makai Geographic Zone
Archaeological Inventory Survey Report, HHCTCP City Center Section 4 287
TMK: [1] 1-2, 1-5, 1-7, 2-1, 2-3 (Various Plats and Parcels)
Test Excavation 232
T-232 measured 0.8 m by 6.0 m and was oriented northeast to southwest and was located in
within the road cut of Cooke Street, 58.0 m northeast of Cooke Street and Pohukaina Street
intersection. The GPR grid measured 2.0 m by 9.0 m with 0.25 m spacing between Y transects
and 1.0 m spacing between X transects. Utilities located near the excavation include: gas line
less than a m northwest, water drain 2.5 m northwest, sewer line 2.6 m southeast, water line 5.6
m southeast. A gas line was encountered 0.4 mbs in the northeastern end of the excavation.
A review of amplitude slice maps indicated no linear features although a gas line was
encountered during excavation. Reflectivity was relatively uniform throughout the grid and
decreased with depth. A transition from higher reflectivity to lower reflectivity was observed at
approximately 0.25 mbs (Figure 275).
GPR depth profiles for T-232 identified horizontal banding, commonly associated with
stratigraphic layering, throughout the survey area (Figure 276). This banding corresponded to
variations of density and chemical composition within fill deposits. The profile also indicated a
change in reflectivity that occurred around 0.25 mbs. No utilities were observed in the profile
although a gas line was encountered during excavation. The maximum depth of clean signal
return was approximately 0.75 mbs.
Figure 275. Slice maps of T-232 at 25cm depth intervals

Cultural Surveys Hawai‘i Job Code: KALIHI 23 Kaka‘ako Makai Geographic Zone
Archaeological Inventory Survey Report, HHCTCP City Center Section 4 288
TMK: [1] 1-2, 1-5, 1-7, 2-1, 2-3 (Various Plats and Parcels)
A visual comparison of the excavated profile and the GPR signal profile showed a moderate
correlation in stratigraphic transitions (Figure 276). Strata Ia to Ic were all clearly observed and
occured near the ground-truthed depths. Strata included: asphalt, extremely gravelly silty sand,
very gravelly silty sand fill, extremely gravelly sand, loamy sand fill, sandy clay loam, silty sand,
natural sand and natural gravelly sandy clay. A gas line was found 0.4 mbs. The gas line did not
showed up on the profile or slice maps. This may be due to the fact that the pipe was not
comprised of metal or because the diam of the pipe was less than 0.05 m. No other discrete
objects or other stratigraphic transitions were observed in the GPR results or subsequent
excavation
Figure 276. Visual comparison of excavated profile and GPR signal profile of T-232

Cultural Surveys Hawai‘i Job Code: KALIHI 23 Kaka‘ako Makai Geographic Zone
Archaeological Inventory Survey Report, HHCTCP City Center Section 4 289
TMK: [1] 1-2, 1-5, 1-7, 2-1, 2-3 (Various Plats and Parcels)
Test Excavation 232A
T-232A measured 0.6 m by 6.0 m and was oriented northeast to southwest and was located
within the road cut of Cooke Street, 19.0 m northeast of Cooke Street and Pohukaina Street
intersection. The GPR grid measured 2.0 m by 8.0 m with 0.25 m spacing between Y transects
and 1.0 m spacing between X transects. Utilities located near the excavation include: sewer line
within the excavation footprint as well as 1.4 m northwest, water line 1.6 m southeast. A gas line
was encountered 0.4 mbs running the length of the southeast side and a sewer line was
encountered 1.02 mbs on the northern corner of the excavation.
A review of amplitude slice maps indicated a linear feature on the southwest side of the
excavation but no utility was revealed in this area. Reflectivity was relatively uniform throughout
the grid and decreased with depth except for the linear feature. A transition from higher
reflectivity to lower reflectivity was observed at approximately 0.25 mbs (Figure 277).
GPR depth profiles for T-232A identified horizontal banding, commonly associated with
stratigraphic layering, throughout the survey area (Figure 278). This banding corresponded to
variations of density and chemical composition within fill deposits. The profile also indicated a
change in reflectivity that occurred around 0.2 mbs. An anomaly was observed in the profile but
was not encountered and does not corresponded to the utilities that were encountered during
excavation. The maximum depth of clean signal return was approximately 0.9 mbs.
Figure 277. Slice maps of T-232A at 25cm depth intervals
Cultural Surveys Hawai‘i Job Code: KALIHI 23 Kaka‘ako Makai Geographic Zone
Archaeological Inventory Survey Report, HHCTCP City Center Section 4 290
TMK: [1] 1-2, 1-5, 1-7, 2-1, 2-3 (Various Plats and Parcels)
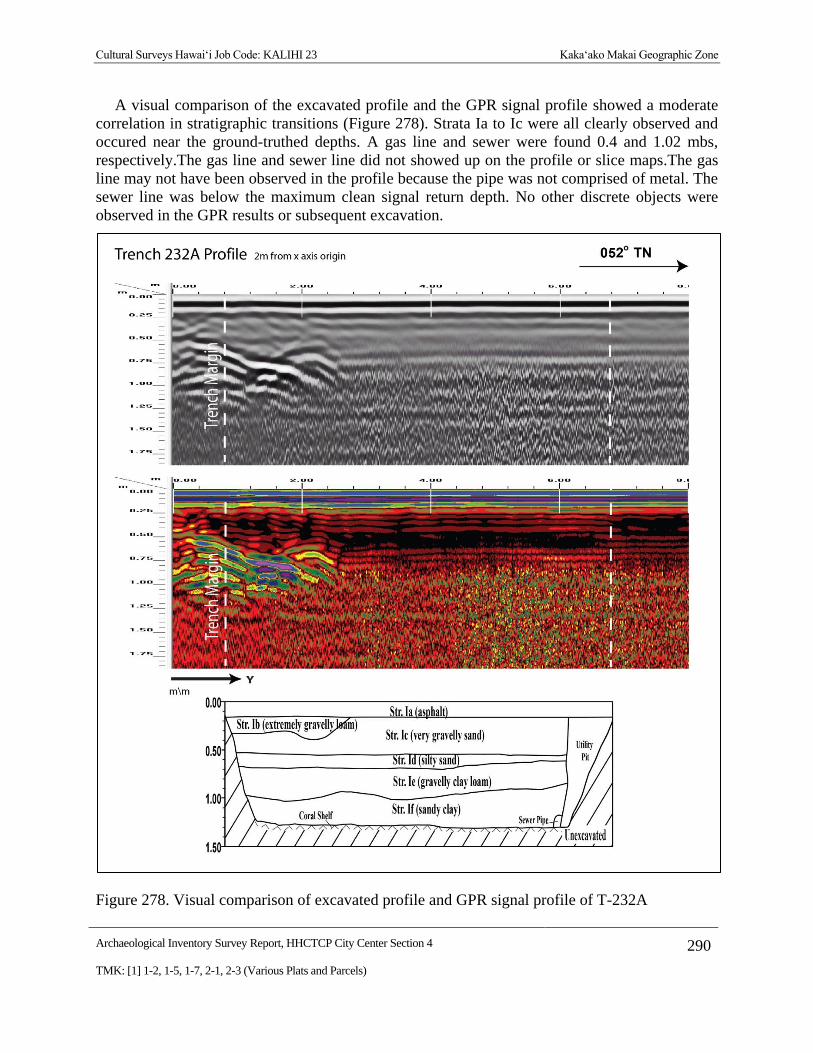
A visual comparison of the excavated profile and the GPR signal profile showed a moderate
correlation in stratigraphic transitions (Figure 278). Strata Ia to Ic were all clearly observed and
occured near the ground-truthed depths. A gas line and sewer were found 0.4 and 1.02 mbs,
respectively.The gas line and sewer line did not showed up on the profile or slice maps.The gas
line may not have been observed in the profile because the pipe was not comprised of metal. The
sewer line was below the maximum clean signal return depth. No other discrete objects were
observed in the GPR results or subsequent excavation.
Figure 278. Visual comparison of excavated profile and GPR signal profile of T-232A