section a - cued undergraduate teachingteaching.eng.cam.ac.uk/system/files/ib paper 8...
TRANSCRIPT

1
SECTION A
Introductory Business Economics B1 (Paper 8)
2013-2014
CRIBS
Exam setter: Dr. Andrea Mina
2
SECTION A Introductory Business Economics B1 (Paper 8)
CRIBS
1 (a) Use an appropriate diagram or diagrams to represent the industry demand
and supply curves, and the individual firm’s demand and cost curves in a perfectly
competitive market. On this basis:
(i) Identify the point at which the firm’s profits are maximised and explain
your answer; [5]
(ii) Define the firm’s shut-down condition in the short and in the long run. [5]
A perfectly competitive market has the following theoretical characteristics:
• Many suppliers each with an insignificant share of market;
• Each firm is too small to affect price via a change in market supply. Each individual
firm is therefore a price taker;
• Each firm produces homogeneous undifferentiated products (Consumers perceive the
products to be identical);
• Consumers have perfect information about the prices all sellers in the market charge
and there are no transaction costs;
• All firms have equal access to resources (such as technology and inputs) and there are
no barriers to entry and exit of firms.
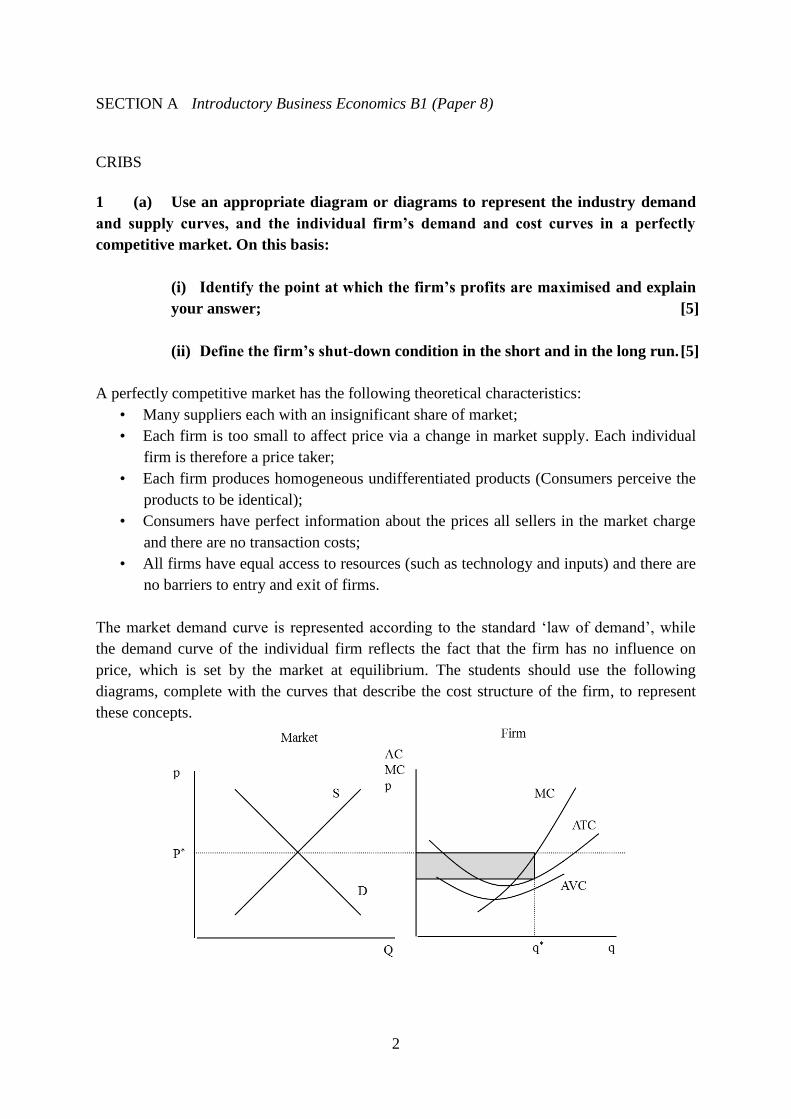
The market demand curve is represented according to the standard ‘law of demand’, while
the demand curve of the individual firm reflects the fact that the firm has no influence on
price, which is set by the market at equilibrium. The students should use the following
diagrams, complete with the curves that describe the cost structure of the firm, to represent
these concepts.

3
The point at which profits (grey area in the graph) are maximised reflects the standard
MR=MC condition, bearing in mind that in a perfectly competitive market MR=AR=P.
Therefore the profit maximising output (q*) is identified at the intersection between the price
level and the MC curve.
In the sort run – where the firm incurs both fixed and variable costs – the firm will shut down
when it is unable to cover its variable costs (TR < VC, equivalent to P < AVC). The firm has
to cover its fixed costs even it is making negative profits. It can minimise losses by producing
as long as it can cover its variable costs. In the long run – where all costs are variable – the
firm will shut down a P < AC.
(b) Under what circumstances may a monopoly be more desirable for
consumers than perfect competition? [5]
The microeconomic case against monopoly is that by taking the market demand curve as its
own, the monopolist is able to exert power over the setting of price and/or output. In so doing
it can earn abnormal profits by appropriating consumer surplus at the expense of economic
efficiency, which also implies that the product is being under-consumed. However, there are
cases when monopolies can generate advantages for consumers that a perfectly competitive
market may not be able to deliver. These include:
- The ability to incur large R&D expenditures that a perfectly competitive firm is not
able to afford;
- The possibility to avoid duplication of fixed costs (an inefficient use of resources)
under the constraints of a natural monopoly
- The exploitation of economies of scale, which reduce unit costs, and these cost
advantages can be reflect in prices;
- International competitiveness (a degree of local monopoly power may help the firm to
be very competitive on international markets).
(c) Compare and contrast the concepts of ‘comparative’ and ‘competitive’
advantage in international trade. [10]
The theory of comparative advantage explains why economies may improve their welfare by
trading with each other even if one country has absolute cost advantages. The fundamental
principle is that trade depends on the possibility and advantages (cost and benefits) of
exchange. The availability of natural resources, costs of production factors or know-how
generate differences in the productive capacities of different economies. Although
specialisation may lead to absolute advantages in production we should consider the

4
opportunity costs of production and identify activities where disadvantage is least or
advantage is best, so that all countries will benefit from trade. Candidates may present a
simple two-country, two-good case (as discussed in lectures with reference to the production
and trade of wine vs. computers).
The theory of comparative advantage is a good demonstration of the benefits of trade, but
also has limitations.
- Not all countries will be equally well off as gains from trade may not be evenly
distributed across all trading countries. In addition, it is possible that the terms of
trade may deteriorate over time;
- Not all citizens may benefit to the same degree within countries;
- There are risks of excess specialisation, especially in the context of a developing
economy.
Contrary to the theory of comparative advantage, the concept of ‘competitive’ advantage
emphasises that ‘advantage’ cannot be considered as a static property of an economy, a sector
or a firm: it cannot be taken for granted and can be deliberately created, for example by
investing in new knowledge and technology. For the advantages of trade to persist it is
important that an economy fosters opportunities for growth by making strategic choices in the
development and use of distinctive resources (natural, human, and technological). The better
students may be able to provide appropriate historical and or/comparative examples.
2 (a) What factors can determine the degree of market power of a firm? [5]
The degree of market power is a key dimension of market structure. It specifically involves
the ability of firms to make decisions about prices. It derives from the existence of entry
barriers, and is highest when there is only one supplier on the market and no close substitutes
to a product or service.
Barriers can be:
- Structural (or ‘Innocent’), due to differences in production costs;
- Statutory, that is to say entry barriers given force of law (National Lottery or
television and radio broadcasting licences)
- Strategic. These may be deliberately looked for and designed to block potential
entrants from entering a market (making the market ‘less contestable’), and to protect
the monopoly power of the incumbent and therefore its supernormal profits. They
may involve pricing decisions (e.g. limit o predatory pricing), advertising, marketing
or R&D investments.

5
The better students will be able to identify other interesting examples such as the control of
some scarce resources, patents, vertical integration or brand development.
(b) With reference to the concept of price discrimination:
(i) Identify and explain the different types of price discrimination; [5]
(ii) Explain the conditions that make it possible for a firm to apply price
discrimination. [5]
In a standard monopoly model it is assumed that a firm sells all units of output at the same
price. However, differences in consumer’s willingness to pay (both between different
consumers and between different units) mean that a monopolist often seeks to appropriate as
much consumer surplus as possible by applying price discrimination.
The three types of price discrimination are:
- First-degree (or perfect) price discrimination: the monopolist sells different units of
output for different prices and these prices may differ from person to person; this
enables the monopolist to extract as much surplus as possible from each consumer, for
example through a bargaining process (this enables the monopolist to discover the
reservation price of each consumer).
- Second-degree price discrimination: the monopolist sells different units of output for
different prices, but each individual who buys the same amount of the good pays the
same price (e.g. bulk discounts for large purchases);
- Third-degree price discrimination: the monopolist sells output to different consumers
for different prices, but every unit of output sold to a given person sells for the same
price (e.g. student discounts at the cinema, subscription prices to academic journals).
The better students will be able to produce and discuss the diagrams for each type of price
discrimination as treated in the lectures.
For a firm to apply price discrimination techniques it has to be able to exert some degree of
market power (no flat demand curve). Secondly, markets must be separate and consumers
must not be able to resell the product across market segments. Finally, demand elasticity must
differ between markets for second- and third-degree price discrimination. For third-degree
price discrimination it is also necessary that the firm is able to identify ex ante the two
submarkets (contrary to second-degree p.d. where consumers self-select into different
demand curves).

6
(c) Illustrate the idea of the ‘circular flow’ of the macroeconomy and identify
the relationship between injections and withdrawals at equilibrium. [10]
The students should start by explaining that the ‘circular flow’ is a way of representing how
resources and associated spending move in the macroeconomy. To begin with, households
own and supply factors of production to firms (namely their labour), receive income in return,
and spend income on goods and services. In turn, firms use factors of production supplied by
households to produce goods and services, pay households for these factors, and sell goods
and services to households. The part of income not spent goods and services constitutes
saving. Savings exit the circular flow, and are channelled back into the system by financial
institutions (e.g. through loans to firms) and result in investment (new capital goods). Imports
and exports complete the framework in an open economy.
Having distinguished between direct and indirect taxes, and defined the concept of transfer
payment, all ‘withdrawals’ (or ‘leakages’, i.e. net savings, net taxes and import expenditure)
and all ‘injections’ (i.e. investments, government expenditure and export expenditure) are
identified and can be located in the context of the circular flow.
At equilibrium injections should be equal to withdrawals. Therefore, S + T + Z = I + G + X.
Injections, however, do not always match withdrawals and it is possible that the economy
will present budget surpluses or deficits (compare T with G), trade surpluses or deficits
(compare Z with X), and positive or negative net capital outflows (compare S and I). The
better students will be able to define and briefly discuss each of these concepts.

3 Solution
(a)
(i) A tunnel's stability in clay is determined by its stability ratio, N, defined as
N = ( O"v- crt)lsu
where crv = total vertical pressure at tunnel axis level = y z
(y =unit weight, z =depth)
crt =tunnel support pressure (if any, = 0 if open face)
Su = undrained strength of the clay at tunnel axis level
If the value ofN is less than about 5 the tunnel face will be stable.
In zone A Su = 200 kPa at a depth of 25m. Total vertical pressure crv = 25 x 20 = 500
kPa. Hence for open face tunnelling (crt= 0) N = 500/200 = 2.5. This is less than 5,
hence open face tunnelling feasible.
In zone B su= 50 kPa at a depth of 25m. Total vertical pressure crv= 25 x 20 = 500 kPa.
Hence for open face tunnelling (crt= 0) N = 500/50 = 10. This is much greater than 5,
hence open face tunnelling is not feasible because tunnel would not be stable.
(ii) Low permeability soils are clays, high permeability soils are sands and gravels, with
silts in between. If tunnelling in clays, the permeability is low enough for there to be no
time for drainage (unless tunnelling is halted) and therefore the undrained strength is
often high enough to ensure temporary stability of the tunnel face. However, if
tunnelling in sands and gravels below the water table, the water will flow into the face,
causing collapse and de-stabilising the tunnel.
Potential problems in tunnelling below the water table in sands and gravels can be
overcome by (a) lowering the water table by pumping from wells installed for the

purpose (b) injecting grout into the ground in advance of tunnelling - usually chemical
grouts - to reduce the permeability (c) using compressed air in the tunnel- all of (a),
(b) and (c) enable open face tunnelling to proceed.
(b) Closed face tunnelling machines exert a pressure on the face as the soil is being
excavated. The two types of closed face tunnelling machines are slurry machines or
earth pressure balance machines. Both tunnelling machines cut the soil by a rotating
wheel. Slurry machines involve a bentonite slurry that is circulated under pressure into
the cutterhead: the excavated soil and slurry are taken by pipes to the ground surface,
where the soil is separated from the slurry which is then re-circulated. The pressure on
the soil face is maintained by the pressurised slurry. Earth pressure balance (EPB)
machines maintain a pressure on the soil face by means of the excavated soil being
mixed with conditioning agents and confined to a pressurised chamber. The pressurised
soil is removed from the pressurised chamber by means of a screw conveyor, which
allows the pressure to drop to atmospheric pressure so that it can taken out of the tunnel
by a belt conveyor.
(c) Segmental linings. These are commonly used for lining circular tunnels, constructed
with tunnelling machines, either open-face or closed-face. The segments are usually
made out of pre-cast concrete, but sometimes from SGI (Spheroidal Graphite Iron).
Advantages: made in factory under carefully controlled conditions, relatively easy to
handle, erected within tunnelling machine, robust, very rare for collapse to occur.
Disadvantages: usually only OK for circular tunnels, therefore lack of flexibility on
shape, difficult to vary thickness
Sprayed concrete linings(SCL). Sometimes known as NATM (New Austrian Tunnelling
Method). Concrete sprayed onto excavated soil surface, accelerators added, hardens
rapidly, usually with steel fibres added or light reinforcement mesh. Advantages: very
versatile, particularly for station construction ( eg Crossrail), can easily change
thickness, excavated shape. Disadvantages: needs careful quality control, susceptible to
poor workmanship, collapse of tunnels has occurred.
Page 2 of8

(d) Masonry buildings are particularly susceptible to differential settlement and cracking
is associated with tensile strain. Buildings subjected to hogging deformation are more
susceptible than those subject to sagging, because the tensile strains tend to be induced
in the top of the building whereas in the sagging zone they are in the foundations.
Compensation grouting involves injection of grout into the ground between the tunnel
and the building foundation in a controlled manner. The principal aim is to reduce the
potential differential settlement of the building, thereby limiting damage. The grout is
injected from tube-a-manchettes (TAM's) which are installed in the ground before
tunnelling, usually from an adjacent shaft. Instrumentation is installed on the building
(levelling and/or electrolevels) and in the ground (extensometers) to monitor settlement
and ground movements, and the grout is injected in response to the measurements.

4 Solution
(a) Diaphragm walls have two principal advantages for this application: they provide a
water tight barrier to keep the excavation dry (which is critical when undertaking
excavations in sand below the water table) and if propped near or at the top of the wall
they cause minimum subsidence behind the wall. They are formed from reinforced
concrete and become part of the main basement walls of the new building. The process
involves excavation of alternating panels along the proposed wall using bentonite slurry
to prevent the sides of the excavation collapsing. Construction starts with the
installation of shallow concrete or steel guide walls. The excavation is then undertaken
using a clamshell grab (in the case of soils). Bentonite slurry is pumped into the trench
to provide temporary support and a prefabricated reinforcing cage is lowered to the
bottom of the completed trench. Concrete is then placed at the bottom of the trench
using a tremie pipe, displacing the bentonite slurry, until the entire panel is full of
concrete. The sequence is repeated with the next panel.
(b)
Vertical stresses
Total vertical stress at the ground surface crv = 30 kPa.
Total vertical stress at the water table (2m depth) crv = 30 + 2 x 16 = 62 kPa
Total vertical stress at the sand-clay interface (8 m depth) crv = 30 + 2 x 16 + 6 x 18
= 170 kPa
Total vertical stress at 12m crv = 30 + 2 x 16 + 6 x 18 + 4 x 17 = 238 kPa
Effective vertical stress at the ground surface cr'v = crv- u = 30- 0 = 30 kPa
Effective vertical stress at the water table (2m depth) cr'v = crv- u = 62-0 = 62 kPa
Effective vertical stress at the sand-clay interface (8 m depth) cr'v = crv- u = 170- 6 x
10
= 110 kPa
Effective vertical stress at 12m cr'v = crv- u = 238- 10 x 10 = 138 kPa.
Active side in sand
Page 4 of8

Active pressure coefficient, Ka = (1-sin<j>)/(1 +sin<j>) = (1-sin35°)/(1 +sin35°) = 0.27
Pressure at the ground surface O'h = Kacr' v + u = 0.27 x 30 + 0 = 8.1 kPa
Pressure at the water table (2m depth) O'h = Kacr' v + u = 0.27 x 62 + 0 = 16.74 kPa
Pressure at the sand-clay interface in the sand (8 m depth) O'h = Kacr' v + u
=0.27x 110+6x 10=89.7kPa
Active side in clay
Pressure at the sand-clay interface in the clay (8 m depth) O'h = crv- 2cu = 170-2 x 75
= 20 kPa
Pressure at 12m O'h = crv- 2cu = 238-2 x 75 = 88 kPa
Passive side in clay
Pressure at the excavation level (8 m depth) O'h = crv + 2cu = 0 + 2 x 75 = 150 kPa
Pressure at 12m O'h = crv + 2cu = 17 x 4 + 2 x 75 = 218 kPa
200 100
E' -..c: -c.. Q)
0
Clay
(c)
Taking moments about the prop:
Pressure (kPa)
0 100 200
10
12 -
'-+-Acti-.e ~id;i ~Passi-.e side)
Excavation
Clay
300

Active moment (driving)= (8.1 x 2 x 1) + [0.5x (16.7-8.1) x 2 x (2 x 2/3)] + (16.7 x 6 x
5)
+ (0.5 X (89.7- 16.7) X 6 X (2 + 2/3 X 6)] + (20 X 4 X 10) + (0.5 (88 -20) X 4 X (8 + 2/3
x 4)] kN-m/m
= 16.2 + 11.5 + 501 + 1314 + 800 + 1450
= 4093 kN -m/m
Passive moment (resisting)= (150 x 4 x 10) + [0.5 (218 -150) x 4 x (8 + 2/3 x 4)] kN
m/m
= 6000 + 1450
= 7450 kN-m/m
Factor of safety= total resisting moment/ total driving moment= 7450/4093 := 1.82
(d)
Under drained conditions, passive pressure coefficient Kp in clay = ( 1 + sin25°)/( 1-
sin250)
=2.45
Horizontal passive pressure in clay zero at bottom of excavation increasing linearly with
depth
Total vertical stress at depth of 4m crv = 4 x 17 = 68 kPa
Water pressure at depth of 4m, u = 4 x 10 = 40 kPa
Effective vertical stress at depth of 4m cr'v = crv- u = 28 kPa
Horizontal passive pressure at depth of 4m = (Kp x cr'v) + u = (2.45 x 28) + 40 = 108.6
kPa
Passive moment (resisting) provided by clay therefore reduced to:
0.5 X 108.6 X 4 X (8 + 2/3 X 4) = 2317 kN-m/m
Factor of safety= 2317/4093 = 0.57
This shows that the wall would fail (by rotation about the prop) if the project was
delayed long enough for the clay on the passive side of the wall to drain via the sand
layers thereby reducing its passive resistance.
Page 6 of8

5 Solution a) Condition 1: Simply Supported
. . wL2 180x142 Moment m mtddle = 8 = 8 = 4,410 KNmfm
Condition 2: Fixed on both sides wL2 180x142
Moment at supports: 12 = 12 = 2,940 KNmfm Moment in middle = 4,410 - 2,940 = 1 ,4 70 KNm/m
b)
--wL2
-8
At C need to design for singly reinforced with moment 4,41 0 KNm/m
Maximum moment for singly reinforced= 0.15 X feu X bd2 = 4,410 KNm
Given b = 1,000 mm and feu = 40 => d 2 :2:: 4'410 x106 => d;;:::: 857 mm
40XQ.15X1,000
c) Overall depth= 1,800 mm Cover= 50 mm Rebar assume 40 mm Effective depth = 1,800 - 50 - 40/2 = 1, 730 mm
Assume x = 0.5 4,410X106 2
Then As = ( 0 5) = 8,493 mm fm 0.87X460X1,730 1--y
Steel force= 0.87 x fy x 8,493 = 3,399 KN fm Concrete stress::= 0.4 x 40 = 16 MPa
Depth at neutral axis= dn, dn X 1000 X 16 = 3,399 X 103 => dn = 212 mm Corrected lever arm= 1,730-212/2 = 1,624 mm
· d 4,410x106 5 mm2 mm2
As reqmre = o.a?x460x 1•624 = 6, 78 --:;- < 8,493--:;-
Could iterate again, but not worth it.
At A & B use 2/3 of this (4,523 mm2/m)

rrd2 6,785 bars 40 mm bars, area- 4 = 1,256 mm2, need 1,256 = 6--;;- = 40mm bars@ 150 crs. at
c At A & B could use 32 mm bars (area= 64% of 40 mm bars) at same crs.
d)
40 mm bars @ 300 crs.
40 mm bars @ 300 crs.
Overlap = 10.5 m ) I 32 mm bars@ 150 crs.
e) Structures in ground need to have very little cracking. Minimum thickness only ensures strength. Extra thickness will reduce cracking.
Page 8 of8
Engineering TriPos Part 18
PaPer 8, Selected ToPics, Section C
Crib 2013 lL4 MSutcliffe)
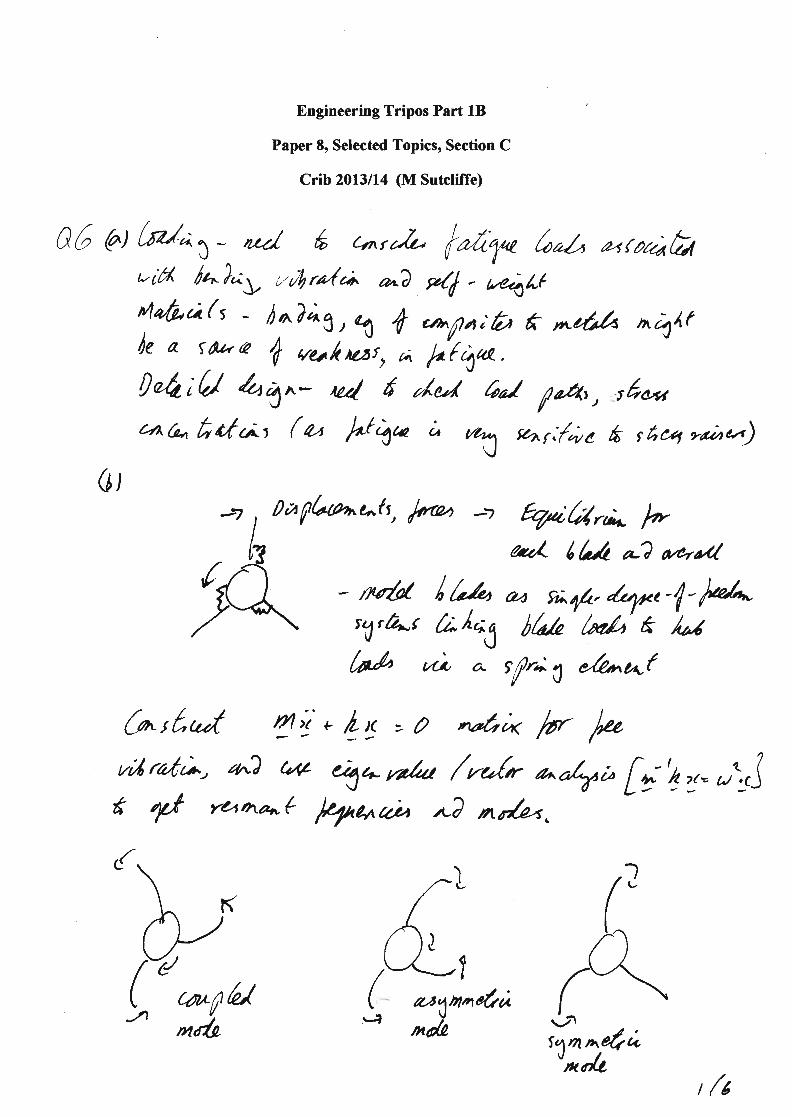
CI6 @) [rz/ar- ,1,// * cmrc.0- t*dW /"rt a-<oaah
bid lr.-?";y ,thd6 **? pq - b?AL(
vle,fi,a(s - l,.ligt\ + oa^pa;tt t &di^A nc14(
le a ta/,/ a /t t/er/ rit, ^ h'(q*.0r4i/ hln- rurt 6 ,/a-/ 6r/ fe', ,6*ur,G^ kt(^, (o, h4* ; ru rq,r./ia t rhoq raitu')
hapbroacn*, /rr*, *'7 tVrr"&rr^ /-*Qt
?ti/- I L/. *? a.qa,t/
- //sU I /r/, aa t 4/.. /*1*c -l'M^,1'h-t 0.la| rA/" ful4 e lrita/, ,A a ,f^ I *(e^cr(
* 4 L, , O "rrtrc< b', ketXc* rala /no.o ^4b [;'4,:. trrl
fut"r*, n? nn*-<,
(^t t ,r.( ry'Iurl ra,ti, ,t*2 w* d retrna*(
@fannil.
rl1,( )lu-l
( aYn^etti.., ^io
(_n
r/s

2/(

7 (a) Economic and political drivers - e.g' government incentives, changes in ta:< regime'
uncertainty in investmen! increased pressure for c02 emissions reductions, increase in fuel
costs.
Technical drivers - e.g. improvements in small and large wind efficiency, large offshore
reliability, transmission costs, need for good wind, change in other energy sources (e'g'
nuclear).
Societal - acceptance of small wind farms. Movement of[-shore of large installations.
Acceptance of climate change argument'
Overall the factors are likely to lead to larger offshore or Scouish developments- Not clear
about home production, not likely to make much impact so perhaps won't be incentivised'
b) capacity factor is defined as Annual energJ production/Anoual energy prduction
operating continuously at rated output. Since the revenue generated by a wind turbine is
related to its actual enerry production, whereas its capitat cost is typically proportional to its
rated outpu! capacity fu"t* essentially measures revenue/capital cost. Hence a high capaclty
factor suggests improved economic viability'
c) (i) Futting the numbers into P : 0.5crpAv3 gives for the rated power, and 1, = roR"/v to
obtain the angular sPeed:
option 1: P:0.5x0.35x1 ./]xnxQQ2xl?] = 1.87 MW and a:8x12/4O:Z' rads I
Option 2: P =O.S*0.:S, t 2]xvxQzxld = 4.43 MW and crr : 8x 16/4O = 3 '1rads I
(ii) Complete the table below forboth options'
Option 1
Wind speed (*t-') No of daYs
<3 20
8 200
12
16
>20 15
Total enerry =8493 MWhr'
Hours Power (MW)
480 0
4800 0.554
zrcA 1.87
960 1.87
360 0
90
40
Energy (MWh$
0
26594039
1795
0
1/6

71at)Option 2
Wind speed (ms') No ofdays Hours Power(MW) Energy (MWh4
<320480008 200 4800 0.554 2659
t2 90 2160 1.87 4039
16 40 960 4.43 4253
>20 15 360 0 0
Total energy = 10951 MWhr.
(iii) For option 1 the capacity factor is 8a93(365x24x1.87):0.5t8'
For option 2 the capacity factor is 109513 65x24x4.43): 0.2t2.
Option 2 has just over half the capacity of option l, suggesting that the retlrfl on gapital
would be similrly reduced. Thus option t has the greater economic viability-
c) Doubly-fed induction generators have the following advantages:'they allow the systern to
operate at continuously variable speeds over a limited range, thereby optimising the energy
harvested from the wind; they only require a fractionally-rated bidirectional converter to
achieve this; they are robust, efficient and cheap to manufacture.
[A well answered question, with a high average. Typical issues were listing factors but not
commenting on changes in installation in (a), and failing to note the no'power regimes and
the cap on power produced as the rated power in (c)'l
k/6
/^,;4 + dn
frcf o.a, frrnt) 4 hrl;tlo -rt,rn a> rfrl hLfii e t-lao)
I cd0)
@f. ) t/ac
(-
&
vl ,//"
t 70?,L k l/o((-*)
z /s.a ( t -^)
a = 4 (t -o) A Au 6,loa; /,al 4.e rt/n / h'
//ul7&4'La O -o)
f,^C c*,?,;(,ro
^"qt\ ulrt, 1.e.,
thn J Ha ori)a ,at,/ rrho*
nr| d?L'd'
/V
t(eu,'CuA
= i f l he o
^ 6r, /;c%--
s soe //A_^r
\I
/+ 4,qft
14aR
a/rr^
+rl
/ur*o
'- (t u)
. "oi(^_.-€tl il.rt#
A.a 4a,
t/. = l/
L
=La
t/glttl/arpO
t2
)
(t l Wo brou , /+,);3.-&>) P* n/rcc,r ;W-"' Lltrlc, s llrt4'
i) 6? = Ctta y'cna
tr/*" $ cr d# ui) =7
=) Q.raa + /r*,) Lo (t-o.
r n1lt+ ! (* (r;)'-L v,id )
9no e t-el/v,'o ;
i/6

gG)O ot7 '/z =) L*y'nauo
zll -,€>1-
t/g
f,.f ,/d ra,(a 4 , rrr /ur^/
u/oe (
I nua
tfd t4aa= lr (rL- L/L/ ^1& ,/.d()
2rc/e---.4 =t/c6p /r
l rhi*n1urG
fA66t icac(i , t l*, h./ = tr'5
w/a( A = h)c
h).-./ =L 2n r
--.-t4nn R
=a[tq,"-" f ,*hJ
6tlD" ("
Ox)ao '
Brrf Wrt/A
=J-'
il,/1
uc f" =L4 r-s (z
Z--2t ?ry= (4G'rcftftfi
riLat & (^ frf n'; * 6A ura'l* '
knu,/a, n ty pL,r* )
=3-vVJ
wt-
=l,l,/O
6/6

Solutions IB Paper 8 Section D – Aerothermal Elective June 2014 9. a)
Efficiency improvements (for given OPR, T04) will increase the specific work output available from the LPT (T045 - T05). Hence, more power to the fan for a fixed core mass flow. Given the jet velocities are fixed (implies fixed fan stagnation temperature rise), the fan must get larger and drive a higher mass flow. Hence, the bypass ratio and fan diameter will both increase. The sfc will decrease but only because the thermal efficiency of the engine improves (the propulsive efficiency would be unchanged as the jet velocities are fixed). The net thrust will increase as the total engine mass flow will increase and the jet velocity is the
same, ( ).N jF m V V= −ɺ
[8] b)
1
03
023,
03
023
1
0.891
is c
p
pT
T
γγ
η
−
− = =
− ⇒
( )1
03
02
28 11 2.787
0.89
T
T
γγ−
−= + = ⇒ T03 = 827.94 K
( )( )
( )( )
03 02320 2 2
1010 827.9 2970.399
10 0.35 10000 30
p
stage
c T Th U
n rψ
π
− × −= ∆ = = =
× Ω × × ×
A stage loading of 0.4 is typical for a compressor design [4]
c) Work balance for HP shaft, ( ) ( )0450402303 TTcmTTcm pp −=− ɺɺ
⇒ ( )045 04 03 023 1700 (827.94 297)T T T T= − − = − − = 1169.1 K
( )( )
( )( )
04 04520 2 2
1010 1700 11691.693
2 0.38 10000 30
p
stage
c T Th U
n rψ
π
− × −= ∆ = = =
× Ω × × ×
γγη
1
04
045
04
045
,
1
1
85.0 −
−
−==
p
p
T
T
tis ⇒
1.41 .4045
045 04
04
1169.11 117001 1
0.85 0.85
T
p T
p
γγ − − −
= − = −
= 0.201
⇒ 045 68 28 0.201p = × × = 383.3 kPa
[5]
irreversibility effects - for a given OPR and TET, increased power required for compressor, reduced power output from turbines ⇒ less power available to drive bypass fan

d) Work balance for the LP shaft:
( ) ( ) ( )050450201302023 . TTcmTTcmBPRTTcm ppp −=−+− ɺɺɺ
( ) ( ) ( )05 045 023 02 013 02 1169.1 297 255 10 45 677.1KT T T T BPR T T = − − + − = − − + × = For the LP Turbine,
1.41 .405
05 045
045
677.11 11169.11 1 0.1101
0.9 0.9
T
p T
p
γγ − − −
= − = − =
⇒ 05 383.3 0.1101 42.2p = × = kPa
For the exhaust jet, given the nozzle is isentropic:
( ) ( )( )( )γγ 105905905
29 15.0 −−=−= ppTcTTcV pp
( )( )( ) ( )( )1 .4/1.49 05 9 052 1 2 1010 677.1 1 26.4 / 42.2pV c T p p
γ γ−= − = × × × −
= 414 m/s [8]
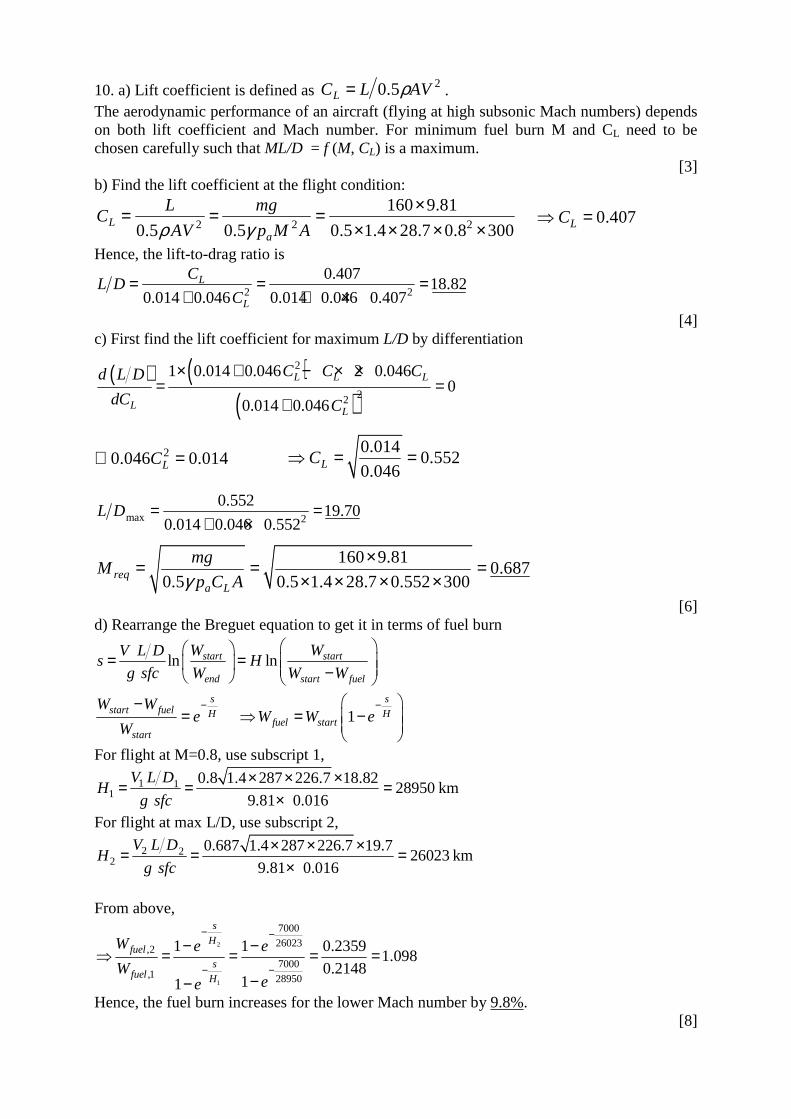
10. a) Lift coefficient is defined as 25.0 AVLCL ρ= . The aerodynamic performance of an aircraft (flying at high subsonic Mach numbers) depends on both lift coefficient and Mach number. For minimum fuel burn M and CL need to be chosen carefully such that ML/D = f (M, CL) is a maximum.
[3] b) Find the lift coefficient at the flight condition:
2 2 2
160 9.81
0.5 0.5 0.5 1.4 28.7 0.8 300L
a
L mgC
AV p M Aρ γ×= = =
× × × × 0.407LC⇒ =
Hence, the lift-to-drag ratio is
2 2
0.40718.82
0.014 0.046 0.014 0.046 0.407L
L
CL D
C= = =
+ + ×
[4] c) First find the lift coefficient for maximum L/D by differentiation
( ) ( )( )
2
22
1 0.014 0.046 2 0.0460
0.014 0.046
L L L
LL
C C Cd L D
dC C
× + − × ×= =
+
20.046 0.014LC∴ = 0.014
0.5520.046LC⇒ = =
max 2
0.55219.70
0.014 0.046 0.552L D = =
+ ×
160 9.810.687
0.5 0.5 1.4 28.7 0.552 300reqa L
mgM
p C Aγ×= = =
× × × ×
[6] d) Rearrange the Breguet equation to get it in terms of fuel burn
ln lnstart start
end start fuel
W WV L Ds H
g sfc W W W
= = −
sstart fuel H
start
W We
W
−−= 1
s
Hfuel startW W e
− ⇒ = −
For flight at M=0.8, use subscript 1,
1 11
0.8 1.4 287 226.7 18.8228950 km
9.81 0.016
V L DH
g sfc
× × ×= = =×
For flight at max L/D, use subscript 2,
2 22
0.687 1.4 287 226.7 19.726023 km
9.81 0.016
V L DH
g sfc
× × ×= = =×
From above,
2
1
7000
26023,2
7000,1 28950
1 1 0.23591.098
0.214811
s
Hfuel
sfuel H
W e e
Wee
− −
− −
− −⇒ = = = =
−−
Hence, the fuel burn increases for the lower Mach number by 9.8%. [8]

e) Comparing the range parameters, 2 1H H< . The amount L/D increases is proportionally
less than the amount the flight speed V reduces in order to get the CL required. A better strategy would be to maximise ML/D. The optimum CL should be set by changing the flight altitude at the Mach number required (rather than compromising the flight speed). Given the L/D equation is only valid up to M=0.8, could choose M=0.8 and increase flight altitude until CL = 0.552. It may be possible to have higher ML/D at higher M, but more information on the aircraft aerodynamics would be needed.
[4]

11 a) Propulsive power toaircraft
Rateof heat release fromfuelN N
ov p thf f
V F VF KE
m LCV KE m LCVη η η× ∆= = = × =
∆ɺ ɺ
[3] b)
0.85 1.4 287 223 254.4m/saV M RTγ= = × × × =
254.4 400.364
0.65 43000N
ovf
V F
m LCVη × ×= = =
×ɺ
2 254.4 20.828
254.4 360pj
V
V Vη ×= = =
+ +,
0.3640.440
0.828ov
thp
ηηη
= = =
[4] c) The mass flow rate of air is a significant mass flow and has a high momentum. It is therefore
non-dimensionalised as a mass or momentum flux ( 02pm c Tɺ represents a rate of change of
momentum). The mass flow rate of fuel, as a mass or momentum flow, is insignificant. However, it represents a large rate of energy release and is therefore non-dimensionalised as a
power ( 02 02N pA p c T = force × distance).
( )2 202
11 223 1 0.2 0.85
2aT T Mγ − = + = + ×
= 255.2 K
( )3.512 202
11 26 1 0.2 0.85
2ap p M
γγγ −− = + = + ×
= 41.7 kPa
( )N a jF m V V= −ɺ , ( )140000
378.8kgs360 254.4
Na
j
Fm
V V−= = =
−−ɺ
3
378.8 1010 255.21.774
41.7 10 2.6am
× ×= =× ×
ɶɺ
6
3
0.65 43 100.5078
41.7 10 2.6 1010 255.2fm
× ×= =× × × ×
ɶɺ
[8]
d) Use subscript TO for takeoff condition
( )2 202,
11 288 1 0.2 0.23
2TO aT T Mγ − = + = + ×
= 291.0 K
( )3.512 202,
11 101 1 0.2 0.23
2new ap p M
γγγ −− = + = + ×
= 104.8 kPa
302,
,02,
104.8 10 2.61.774
1010 291TO N
a TO ap TO
p Am m
c T
× ×= =×
ɶɺ ɺ = 891.6 kg/s
302, 02,
, 6
104.8 10 2.6 1010 2910.5078
43 10
TO N p TOf TO f
p A c Tm m
LCV
× × ×= =×
ɶɺ ɺ = 1.7446 kg/s

0.23 1.4 287 288 78.24m/sTO aV M RTγ= = × × × =
,78.24 180
0.18771.7446 43000
Nov TO
f
V F
m LCVη × ×= = =
×ɺ
1,
18000078.24 280.12
891.6N
j TOa
FV V m s
m−= + = + =
ɺ
,2 78.24 2
0.436778.24 280.12p TO
j
V
V Vη ×= = =
+ +, ,
0.18770.4299
0.4367ov
th TOp
ηηη
= = =
The thermal efficiencies at takeoff and cruise are almost the same (as the non-dimensional operating point is the same, but nozzle/duct losses may differ). The propulsive efficiency at takeoff is very low because of the low flight speed and this leads to a low overall efficiency and high fuel flow rate.
[10] Dr C. A. Hall

CRIB SHEET (Paper 8) (AN/1)
1 (a) (i) Si and ICs
Lower leakeage current compared to its predecessor, Ge.
High quality (low interface state density) silicon dioxide compared to the water soluble
germanium oxide.
Well-established/mature processing steps lending themselves well to scalability to large
areas.
Readily abundant silica and silicates comprises 25% of the earth’s crust.
Low cost silicon substrates
(a) (ii) Si and MEMS
Integration with CMOS signal processing/readout electronics
Has selective etch rates for different crystal orientations – e.g. (100) and (111)
High mechanical strength
Offers good selection of masking materials – e.g. SiO2, Si3N4
Mature processing steps hence low cost
(b) Two thermal oxidation schemes used in IC processing: dry and wet oxidation
Dry oxidation: used for formation of gate oxide – under which a conducting layer is formed
between S and D.
Wet oxidation: used for formation of field oxide to provide isolation from other device
structures.
Oxidation rate relates to the rate of incorporation of silicon atoms into the silicon dioxide
network – rate depends on the surface density of silicon atoms constant and hence dependent
on crystal orientation. The oxidation rate for (111)-silicon is larger because the density of
silicon atoms in the (111)-plane is larger than that in the (100)-plane.
(c) Final anisotropically-etched profiles with each type of pattern illustrating the <100>,
<110>, and <111> crystal planes and the orientation-dependence of the etching.
(d) For a 200 Ω/ diffusion, the aspect ratio
(L/W) of a 10 kΩ resistor is R = RS (L/W),
yielding L/W = 10kΩ/200Ω/. Thus aspect
ratio = 50.
For a layer width of 5 um, L = 250 um. For
minimal area, layout is as shown on the
right.

2(a) Book work
(b) Accumulation increases the current I from a low value by increasing carrier
concentration, so that it is normally off.
Depletion reduces and ultimately switches off the current and carrier density in channel from
an existing value, so that it is normally on.
(c) SiO2 is used as gate oxide, dielectric between metal lines, passivant, etch mask,
diffusion mask. Gate oxide use is most important for this course.
Si uses MOSFET design with SiO2 as an excellent gate dielectric - good.
The best aspect of Si is that it is most commercially useful design - good.
Si has reasonable band gap and moderate mobility and thus speed – not so good.
GaAs does not have native oxide to use as gate dielectric - bad.
Also cannot use SiO2 on GaAs – v bad.
GaAs uses MESFET design.
GaAs has higher mobility and thus higher speed - good.
GaAs has higher cost of material - bad.
(d) Gauss law applied to a cube shape of height x and dopant density N (show diagram)
equate field out of top face with enclosed charge density to give
E = N.e.x
Integrate this to give
- V = N.e.x2/2 or Vg = Nex
2/(2)
(e) 1019
cm-3
= 1025
m-3
!
V = (E2 /2eN ) = ([2.10
7]
2 10
-10 /2 1.6. 10
-19 . 10
25 ) = 0.012 V
3)
(a) In a doped semiconductor – the ionised dopants supply all the carriers.
Free carriers act like conduction electrons in a metal.
Conductivity is limited by scattering of carriers with vibrating atoms.
(b) mobility = velocity / electric field.
Conductivity = mobility x charge x electron density, σ = N.e.µ [not in data book]
Effective mass is a parameter defined as force on electron for example due to an electric field
divided by the resulting electron acceleration. It has dimensions of mass, but need not equal
the free electron mass.
(c) constant field scaling. sizes shrink by a factor k.
transistors per chip goes as k2,
lengths vary as 1/k,
power per chip = 1, stays constant.

(d) v = E, E = V/d t = d/v
so t = d2 /V
mobility = 3.3 m2 /Vs.
t = 10-7
10-7
/(3.3 0.8) = 3.8 10-15
s
Comment - This is much faster than equivalent Si FET for which t ~ 10-12
s.
E From data book,
V = Ned2/2. so N = 2 V/ e d
2
V = 0.1 V, eps = 1.5x10¹⁰
, d = 10-7
m.
Substitute in gives
N = 2 x 1.5.10-10
/2 . 1.6.10-19
(10-7
)2 = 1.875 x10
22 m
-3
This is a moderate donor density (1.8x10¹⁶
cm-3
) so this makes an effective FET.

15 (a) Probability of the data under uniform model:
P (S|uniform) =N∏n=1
3∏c=1
(1
100
)= 10−6N
[8]
(b) Let θ = (µ1, µ2, µ3, σ1, σ2, σ3) be the vector of model parameters. The prob-ability of the data under the Gaussian model:
P (S|θ) =N∏n=1
3∏c=1
N (xnc|µc, σ2c )
=N∏n=1
3∏c=1
(2πσ2c )−1/2 exp−(xnc − µc)2/(2σ2
c )
=3∏c=1
(2πσ2c )−N/2 exp−
N∑n=1
(xnc − µc)2/(2σ2c )
[7]
Describe a procedure for fitting the parameters µc and σ2c to the
data:At a high level, the maximum likelihood procedure could be used. Thisinvolves taking the derivative of the (log) likelihood with respect to theparameters, and setting to zero. This can be solved analytically (see below).Answers which suggest running an optimisation algorithm such as gradientdescent or Newton’s method get partial marks. The maximum likelihoodsolutions is:
µc =1
N
N∑n=1
xnc
σ2c =
1
N
N∑n=1
(xnc − µc)2
The derivation is straightforward and follows from lecture notes. Intuitively,this sets µc to the sample mean of the color c features and σ2
c to the corre-sponding sample variance.
More sophisticated answers could be to add a log prior and do Maximum APosteriori (MAP) point estimation of the parameters, regularised MaximumLikelihood, or to do full Bayesian inference on the parameters:
P (θ|S) =P (θ)P (S|θ)
P (S)
Answers which just say use Bayes rule without giving more detail get partialmarks. One motivation for Bayesian learning here is if N is small there is agreat deal of uncertainty in θ and the ML method can overfit. [10]
1

(c) What are some relative advantages and disadvantages of the mod-els described above in parts (a) and (b)?
The model in (a) is very simple and has no parameters. A major disadvantageof this is that it can’t be fit to data. The model is (b) has parameters andcan be fit to data, but a disadvantage is that it places probability mass overthe whole real line, including xnc < 0 and xnc > 100. Thus it can predict“impossible” values. Both models assume independence.
Propose another model which you think might be interesting touse for the data S and describe why you think it might be a bettermodel than the ones in parts (a) and (b).
Many options are possible here. A list of a few good suggestions:
– A multivariate Gaussian over the 3 variables in each data point. Thiscan model the correlations in the three (RGB) channels.
– A model that uses beta distributions for each color scaled to cover the[0, 100] range. This includes the uniform as a special case, is constrainedto [0, 100] unlike the Gaussian, but like the simple Gaussan it has 6parameters that can be tuned to data.
– A simple or a multivariate Gaussian model constrained to the [0, 100]intervals.
– A mixture of Gaussians, or mixture of betas as a more sophisticatedmodel that allows for clusters in the data.
[8]
2


17 (a) For separable filters the 2D convolution can be written as two 1D filteringoperations,
S(x, y) =∑u,v
L(u, v)I(x− u, y − v) =∑u
l1(x− u)∑v
l2(y − v)I(u, v).
Here the filter can be expressed, for example, as the product of l1 = [2, 3, 2]and l2 = [2, 4, 2] and it is therefore separable and can be implemented as two1D filtering operations. [4]
(b) The 2D convolution has computational cost O(NMK2) where NM = num-ber of pixels in the image, K2 = number of pixels in 2D Gaussian filter. Theoptimised version is O(NMK) and so the 1D implementation is K timesfaster. [4]
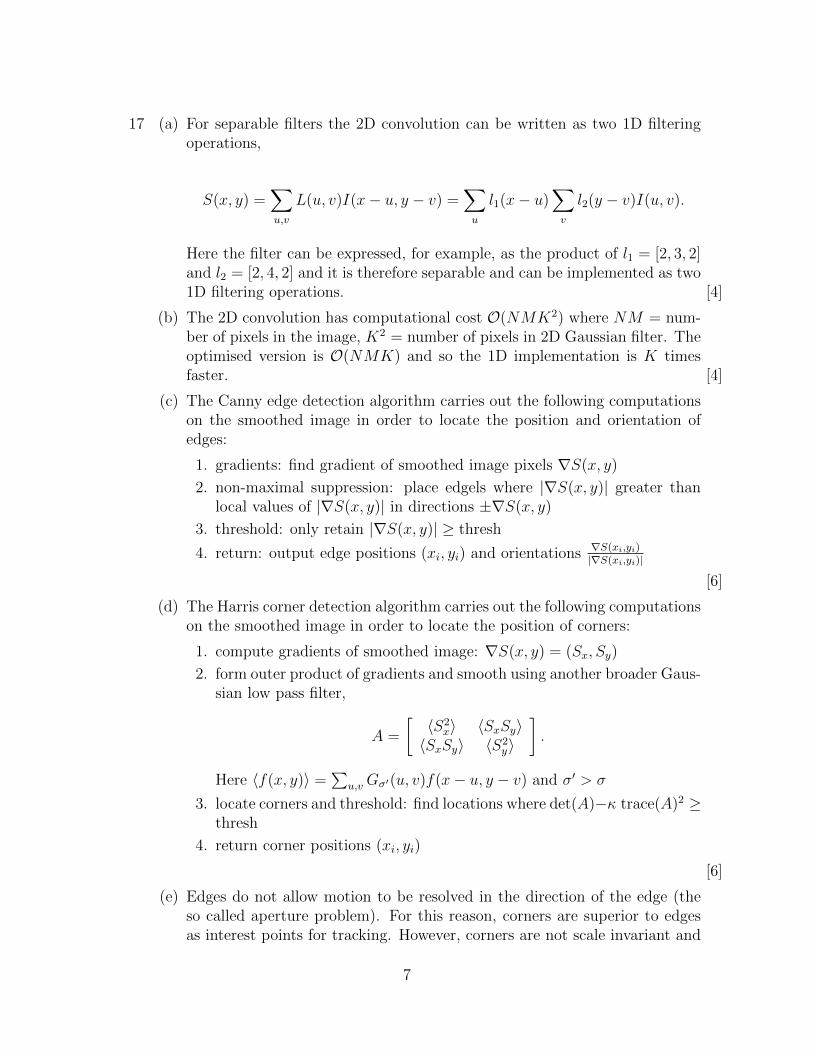
(c) The Canny edge detection algorithm carries out the following computationson the smoothed image in order to locate the position and orientation ofedges:
1. gradients: find gradient of smoothed image pixels ∇S(x, y)
2. non-maximal suppression: place edgels where |∇S(x, y)| greater thanlocal values of |∇S(x, y)| in directions ±∇S(x, y)
3. threshold: only retain |∇S(x, y)| ≥ thresh
4. return: output edge positions (xi, yi) and orientations ∇S(xi,yi)|∇S(xi,yi)|
[6]
(d) The Harris corner detection algorithm carries out the following computationson the smoothed image in order to locate the position of corners:
1. compute gradients of smoothed image: ∇S(x, y) = (Sx, Sy)
2. form outer product of gradients and smooth using another broader Gaus-sian low pass filter,
A =
[〈S2
x〉 〈SxSy〉〈SxSy〉 〈S2
y〉
].
Here 〈f(x, y)〉 =∑
u,v Gσ′(u, v)f(x− u, y − v) and σ′ > σ
3. locate corners and threshold: find locations where det(A)−κ trace(A)2 ≥thresh
4. return corner positions (xi, yi)
[6]
(e) Edges do not allow motion to be resolved in the direction of the edge (theso called aperture problem). For this reason, corners are superior to edgesas interest points for tracking. However, corners are not scale invariant and
7

will therefore perform poorly when used to match different views of the sameobject with large scale differences. This will occur when there is large depthvariation in the image and when the frame rate is low. Blobs would be amore sensible feature in this case.
[5]
8

Version GMT/1
EGT1ENGINEERING TRIPOS PART IB
?? 2014 ?? to ??
Paper 8: Section G Answer: CRIB
SELECTED TOPICS
STATIONERY REQUIREMENTS
SPECIAL REQUIREMENTS TO BE SUPPLIED FOR THIS EXAM
You may not start to read the questions printed on the subsequentpages of this question paper until instructed to do so.
Page 1 of 14

Version GMT/1
SECTION G
Bioengineering
18 Two thirds of the total focussing power of the eye comes from the cornea.
(a) Describe the composition and structure of the cornea and how it differs from theadjacent sclera. [5]
Answer: The cornea has cell layers on both surfaces and an interior that is largely made upof the fibrous protein collagen in a sugary and watery ground substance. Collagen in thecornea is crystalline: it is organized into very regular perpendicular lamellae with uniformspacing between individual collagen fibrils. The lamellar structure is important bothmechanically and optically. Mechanically, the lamellar organization provides resistanceto intraocular pressure and allows the cornea to serve its critical function of providing twothirds of the optical power of the eye overall. Optically, the regular crystalline structureallows for corneal transparency, again required for unconstructed vision. The collagen inthe sclera is much less well-organized and this gives rise to the “white” appearance of the“whites” of the eyes as light is scattered rather than transmitted as in the regular structureof the cornea. In disorders and diseases of the cornea, the tissue can become cloudy dueto changes in the collagen organization resulting in a loss of transmissibility of light.
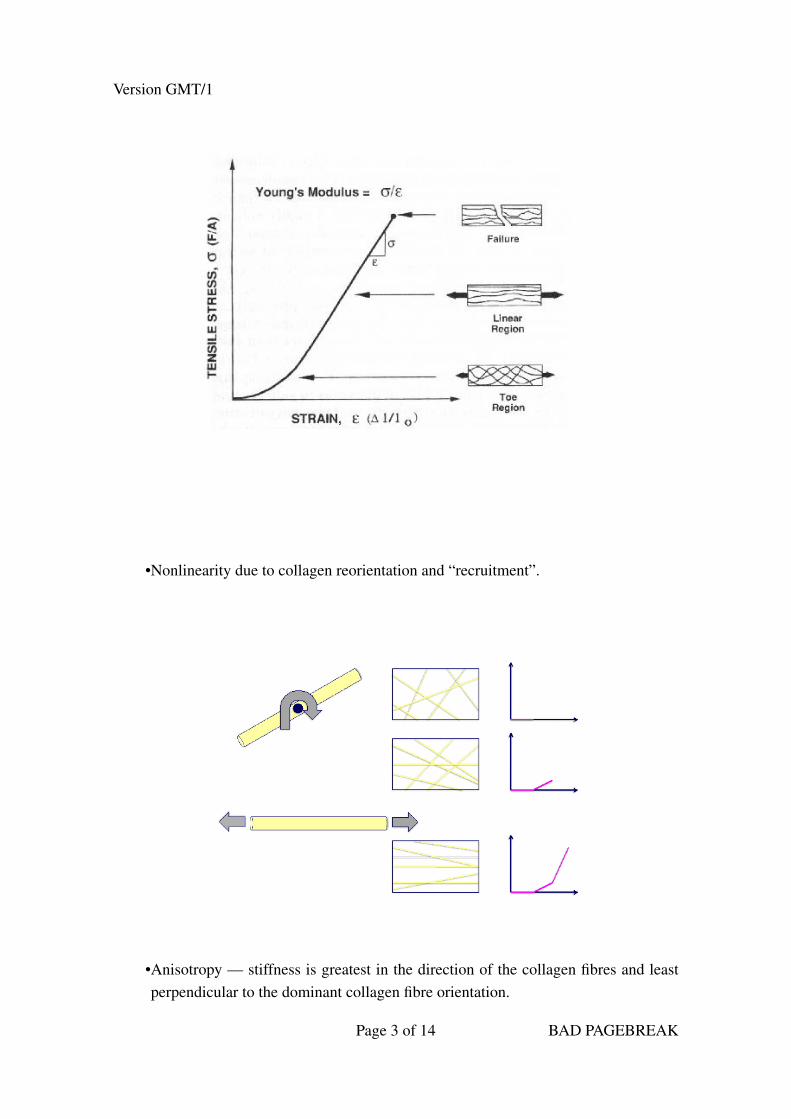
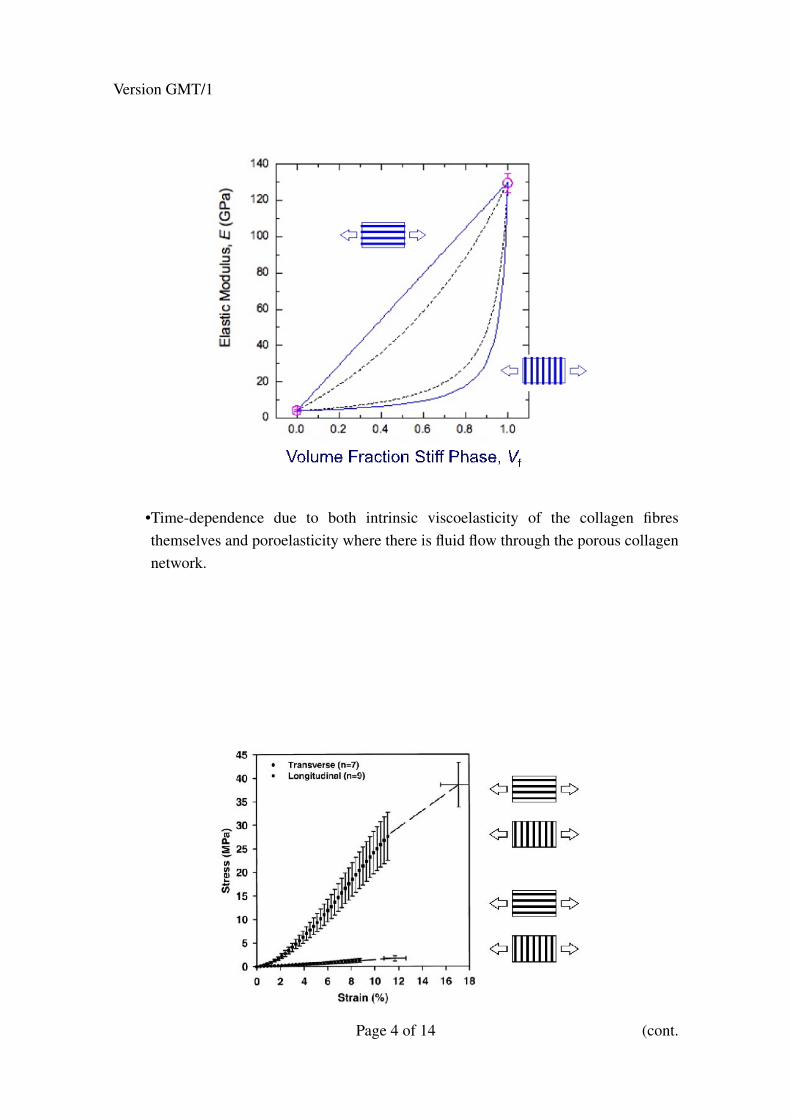
(b) Explain the three aspects of the mechanical response of a soft tissue such as corneathat differentiate such tissues from traditional engineering materials. Use graphs toillustrate each difference and describe what aspect of the tissue microstructure gives riseto each aspect of the response. [6]
Answer: The response of soft tissues differs in three critical ways.
Page 2 of 14 (cont.
Version GMT/1
•Nonlinearity due to collagen reorientation and “recruitment”.
•Anisotropy — stiffness is greatest in the direction of the collagen fibres and leastperpendicular to the dominant collagen fibre orientation.
Page 3 of 14 BAD PAGEBREAK
Version GMT/1
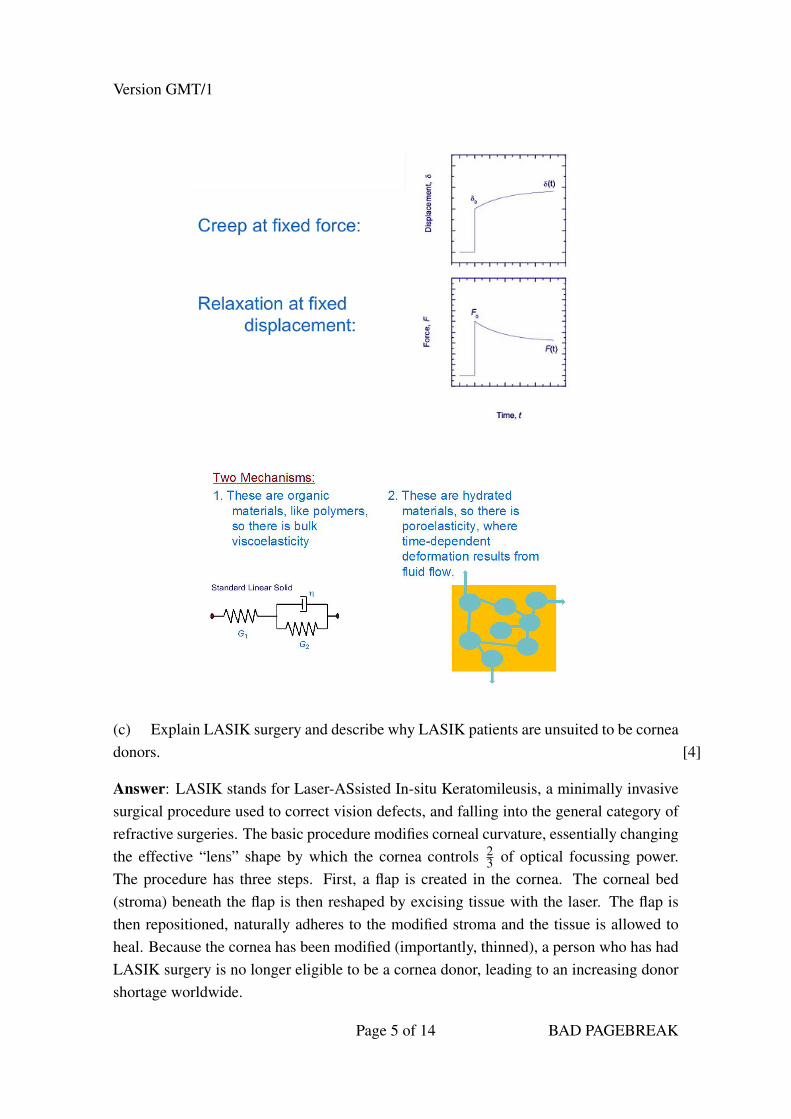
•Time-dependence due to both intrinsic viscoelasticity of the collagen fibresthemselves and poroelasticity where there is fluid flow through the porous collagennetwork.
Page 4 of 14 (cont.
Version GMT/1
(c) Explain LASIK surgery and describe why LASIK patients are unsuited to be corneadonors. [4]
Answer: LASIK stands for Laser-ASsisted In-situ Keratomileusis, a minimally invasivesurgical procedure used to correct vision defects, and falling into the general category ofrefractive surgeries. The basic procedure modifies corneal curvature, essentially changingthe effective “lens” shape by which the cornea controls 2
3 of optical focussing power.The procedure has three steps. First, a flap is created in the cornea. The corneal bed(stroma) beneath the flap is then reshaped by excising tissue with the laser. The flap isthen repositioned, naturally adheres to the modified stroma and the tissue is allowed toheal. Because the cornea has been modified (importantly, thinned), a person who has hadLASIK surgery is no longer eligible to be a cornea donor, leading to an increasing donorshortage worldwide.
Page 5 of 14 BAD PAGEBREAK

Version GMT/1
(d) (i) Describe the transport mechanism in poroelasticity. [3]
Answer: Poroelasticity is the pressure-induced flow of fluid through a porousnetwork, like a mechanical analog of chemical diffusion.
(ii) If a cornea has a thickness of 350 µm, an elastic modulus of 0.3 MPa, and anintrinsic permeability of 8.2× 10⁻¹⁷ m2, what is the time constant for poroelastictransport through the cornea? Assume that the viscosity of water is 1 mPa s. [3]
Answer:The time constant for transport is:
τ =h2
Eκ=
h2
E kη
Plugging in the values gives:
τ =h2
E kη= 4.98s
(iii) If the cornea thickness decreases to 200 µm, with all other parameters thesame as in (ii), what effect does this have on the transport behaviour? [2]
Answer: A decreased thickness would decrease the time constant since h is on thetop of the equation and squared, such that the time constant becomes:
τ =h2
E kη= 1.63s
(iv) With the thickness the same as in (iii) and the permeability unchanged, howwould the modulus have to change to restore the original transport response in (ii)? [2]
Answer: In order to compensate, the modulus would have to decrease as E2 =
E1h2
2
h12 to a value of 0.098 MPa (roughly 0.1 MPa) to restore the transport time
constant to ≈ 5 s.
Page 6 of 14 (cont.

Version GMT/1
19 (a) Describe, with appropriate diagrams, the key features of a fundus camera thatallow a clear image of the retina to be created. [6]
Answer: The most important features are the focussing technique and light transmission.Focussing is complicated by the light having to pass through the lens of the subjects eyeas well as of the camera.
In order to create a clear picture of the retina, the focal point of the camera has to coincidewith the focal point of the subject’s eye, as in the diagram above. The patient also needsto be looking at a far object (not the fundus camera) so that their eye is unaccommodated.
If the patient is not looking at a far object, the image of the retina will be blurred, as shownabove.
Light transmission is complicated by the cornea, which will reflect much of the light. As aresult, the path of the transmitted light is kept separate from the path of the reflected light.
Page 7 of 14 BAD PAGEBREAK

Version GMT/1
This is achieved as in the diagram above, by transmitting light in through a disc-shapedaperture, but only receiving reflections from the centre of that disc. We therefore have tokeep the pupil as dilated as possible, so more light can enter the eye: this is why eye-dropsare administered before an examination.
(b) In spectral-domain optical coherence tomography, the interference pattern from theimaged tissue is passed through a diffraction grating and its spectrum is detected by auniformly spaced linear array of photo-detectors. The inverse Fourier transform of thisspectrum gives a measure of tissue reflectivity as a function of depth into the tissue.Assume that the laser light centre wavelength (in air) is 850 nm, the bandwidth is 100 nmand the photo-detectors are arranged to make the best possible use of this spectrum. Therefractive index of the tissue is 1.36.
(i) If the diffraction grating spreads the light uniformly over the detector arraywith frequency, how many photo-detectors are required to image the tissue to adepth of 0.5 cm? [5]
Answer: The photo-detectors will be positioned to capture the useful spectrum ofthe laser, hence the effective sampling frequency fs is the same as the bandwidth ofthe laser pulse (c is the speed of light in air):
fs =c
800×10−9 − c900×10−9 = 138,889c
The time for each sample is 1fs . For N photo-detectors, and a speed of c
1.36 , then thedepth d is:
d =c
1.36× N
fs=
N188,889
If we want a useful depth of 0.5 cm, we actually need d to be 1 cm, since we onlymeasure the magnitude of the Fourier transform:
N = 188,889×0.01 = 1889
(ii) If the diffraction grating spreads the light uniformly over the detector arraywith wavelength, what are the minimum and maximum frequency differencesbetween neighbouring photo-detectors, if the same number are used as in (i)? [3]
Answer: The wavelength spacing is 1001888 = 0.053 nm. This gives:
fmin =c
900−0.053− c
900= 65.4c = 19.6GHz
fmax =c
800− c
800+0.053= 82.8c = 24.8GHz
Page 8 of 14 (cont.

Version GMT/1
(iii) How would you expect the tissue reflectivity measured in (i) to differ fromthat measured in (ii)? [3]
Answer: The uniform wavelength samples in (ii) have to be converted to uniformfrequency in order to perform the inverse Fourier transform. Hence the effectiveimage depth depends on how many samples are used in this conversion. If 1889samples are used, the same depth is achieved, but the noise increases with depthdue to the need to interpolate the higher frequency samples. The only way to avoidthis noise increase is to use fewer samples, but that would also reduce the imagingdepth.
(c) Data sampled in three dimensions, such as might be acquired from an opticalcoherence tomography system, is usually visualised on a two-dimensional display.
(i) Explain the term reslicing and outline the difficulties associated with reslicingsampled optical pulse-echo data. [4]
Answer: Reslicing describes the creation of an arbitrarily oriented cross-sectionalslice through a 3D data set.If displaying a 2D slice through 3D data, the regular 2D array of pixels on a typicaldisplay will not coincide with the location of the samples in the 3D volume. Henceinterpolation or approximation is required to find values for the sampled data at thedisplay points. The interpolation algorithm should be chosen dependent on howwe believe the real data behaves, and affects what the displated slice will look like.Some algorithms generate very smooth data and others generate discontinous data.Either approach could be correct, depending on the circumstances.Another factor in displaying a slice through a 3D data set is the orientation of thedisplay. Some features of pulse-echo systems are aligned with the direction of travelof the light or the sound waves. For instance, a strong reflector of sound or lightwill not allow the signal to pass through to deeper tissue, and hence deeper tissuewill appear very dark. Randomly orientated slices through 3D data are not alignedwith the direction of travel and hence can make the appearance of such featuresconfusing.In addition, even objects with fairly simply geometry can look a lot more complexin reslices, since we do not normally see the cross-sections of objects.
(ii) Briefly outline two techniques, other than reslicing, which can be used tovisualise sampled three-dimensional data on a two-dimensional display. [4]
Answer: Surface rendering is the process of visualising a geometric surface so thatit looks 3D on a 2D display. Starting with sampled three-dimensional data, we first
Page 9 of 14 BAD PAGEBREAK

Version GMT/1
need to extract an interesting surface from this data, which is typically an isosurfacewithin the data. We can extract this by thresholding the data at some data level andusing a mesh generation algorithm like Marching Cubes. A graphics card can thengenerate a surface which looks from this set of triangles by modelling a camera,light sources, and the geometry.Volume rendering is the process of visualising the entire sampled 3D data set on a2D display. Data values are maually assigned a colour and an opacity depending ontheir value, and these all contribute to the final image. It is also possible to definesurfaces within the data at particular thresholds, which also have a given opacity.Combined with a camera and lighting model, these can also be blended into thefinal image.
Page 10 of 14

Version GMT/1
20 (a) Sketch and describe the receptive fields of simple and complex cells in theprimary visual cortex. Also sketch and describe a network architecture that could formsimple cell receptive fields from the centre-surround receptive fields found in the lateralgeniculate nucleus. [4]
Answer: Simple cells respond to oriented bars or gratings within a small region of the
visual field. Complex cells also respond to bars or gratings, but they are insensitive tosmall shifts in the position of the grating and often selective with respect to the directionof motion of the stimulus. Complex cells thus form an early level of position invariancein the visual system. Simple cells can be formed by summing over the output signalsof several LGN cells, which all have ON (or OFF) center receptive fields with centerslocated on a straight line.
(b) Name four visual cues that can help to determine which of two objects is fartheraway. [2]
Answer: Any four of: relative size, occlusion, linear perspective, aerial perspective,shadow and illumination, texture gradients, motion parallax, binocular disparity,accommodation or vergence angle.
(c) Explain why, after fixating a waterfall for a minute, stationary objects you look atwill appear to be moving upwards. [3]
Answer: Direction-selective neurons (e.g., complex cells in primary visual cortex) thatrespond to downward motion adapt to the extended stimulation and are thus less activeafter viewing the waterfall. Until the adaptation abates, (unadapted) neurons encodingupward motion are more active than those encoding downward motion, causing theperception of a net upward motion.
(d) Explain why, after accidents involving damage to the visual system, doctors check
Page 11 of 14 BAD PAGEBREAK

Version GMT/1
if the perceptual defect concerns a visual hemifield or an individual eye. [3]
Answer: Before the optic chiasm, each of the two optic nerves transmits informationabout one eye. At the optic chiasm, the fibres reorganize, so that information from eachvisual hemifield is relayed to the contralateral side of the brain. Whether a hemifield oran eye is affected therefore helps the doctor to determine the anatomical site of a potentialbrain damage. If the perceptual defect concerns an individual eye, the damage is in theeye or in the part of the optic nerve between the eye and the optic chiasm. If the perceptualdefect concerns a hemifield, the damage is after the chiasm, potentially in the cortex.
(e) The following questions are about efficient coding in the (vertebrate) retina.
(i) Mutual information is a measure of the statistical dependency of two randomvariables. According to the efficient coding hypothesis, the mutual information oftwo specific random variables is maximized in retinal processing. Name these twovariables and provide the formula for the mutual information of two continuousvariables. [3]
Answer: The vector of pixels in the retinal image and the vector of ganglion cellresponses.There are different – equivalent – ways of defining mutual information:
I(X ,Y ) =∫ +∞
−∞
∫ +∞
−∞P(x,y) log
P(x,y)P(x) P(y)
dxdy
= H(X)−H(X | Y ) = H(Y )−H(Y | X)
where
H(X) =−∫ +∞
−∞P(x) logP(x) dx
H(X | Y ) =−∫ +∞
−∞P(y)
∫ +∞
−∞P(x | y) logP(x | y) dxdy
H(Y ) =−∫ +∞
−∞P(y) logP(y) dy
H(Y | X) =−∫ +∞
−∞P(x)
∫ +∞
−∞P(y | x) logP(y | x) dydx
(ii) Describe the approximations and assumptions underlying the proposition thatinformation maximisation in the retina can be achieved by whitening. [4]
Answer:
•The responses of retinal ganglion cells (RGCs) are nearly deterministic andso response noise entropy is zero, therefore information maximisation isequivalent to maximising the overall response entropy.
Page 12 of 14 (cont.

Version GMT/1
•The constraints acting on all RGCs are the same, therefore it will be optimal ifall of the RGCs have the same overall response distribution.
•The RGC population response is approximately normally distributed, so thatit is fully characterised by its first two moments (the mean and the covariancematrix), and in particular, its entropy is solely determined by the covariances.
•Each RGC acts as a simple linear filter on the input image.
•The statistics of natural images are translation (and rotation) invariant, and thusthe optimal RGC filters will all be identical up to translation.
•The population of RGCs is large, and can be well approximated by a continuous“neural field”.
•The input to the RGCs is a noiseless version of the retinal image.
(iii) Describe the shape of the Fourier spectrum of a whitening filter for naturalimages, and provide an explanation for this shape. [3]
Answer: The Fourier spectrum is monotonically increasing with frequency tocompensate for the fact that the power spectrum of the input is monotonicallydecreasing with frequency because i) the power spectrum of natural images isdecreasing, and ii) the optics of the eye act as a low-pass filter on the visualenvironment to create the retinal image.
(iv) Explain with reasons why pure whitening in the retina may not beadvantageous. [3]
Answer: This is because RGCs receive a noisy version of the retinal image (dueto upstream noise in retinal processing) and this noise part of the input shouldnot be transmitted. However, as we saw above, the power of the true signal innatural images (seen through the optics of the eye) decays with frequency, so athigh frequencies noise will dominate. This means that there should be a cut-off athigh frequencies in RGC filters, preventing pure whitening of the input.
END OF PAPER
Page 13 of 14

Version GMT/1
THIS PAGE IS BLANK
Page 14 of 14

IB Paper 8 Section H Crib:
21 You have developed a very low-cost, wearable, wirelessly connectable device
for monitoring a person’s level of alertness.
(a) Discuss how you could identity and assess the scale of potential markets for
this concept.
[9]
The first task is to define the market though segmentation. This could be achieved by
considering:
• Benefits that are delivered: what benefits do customers and users derive from the
product?
• Particular product attributes: the easiest way to segment a market is to compare
product attributes. This however tends to say little about the customers and is
often the weakest approach.
• Characteristics of the consumer: this can be split to include demographics, and
psychographics. Demographics relates to aspects such as social class, age,
house size, sex etc. Psychographics relates to the user’s attitudes and beliefs,
what they feel, their lifestyle etc.
• Product use: describing ways in which a product is used. There might be strong
customer loyalty, products might be used rarely or frequently, it could
describe purchase behaviour (e.g. Distress purchase, seasonal patterns or
regular upgrades etc).
A good answer would then consider segmentation for this specific product from
several of these perspectives.
Having defined this segments, could then undertake research onto size of these
potential segments. This could be through sampling of potential customers, or
considering markets for similar products for which data already exists.
For sampling, you would need to be careful about the reliability of responses when
assessing markets for ‘new to the world’ products.
For examination of similar products, you need to be very careful with markets that
may be superficially similar but actually very different.
(b) Describe the steps that you could take to understand the requirements of
potential customers for such a concept.
[8]
Need to describe the stages that need to be considered in undertaking any research or
investigation of user needs.
•Focus: The first stage is to be very clear about what it is that you are aiming to find
out, the focus of the research. Is it research that is aiming to unearth new and
previously unseen requirements, or is it research that is aiming to validate and qualify
current perceptions.
•Stakeholders: who is it that is the subject of the research, and why are they being
asked?
•Researchers: Who will do the research? Ideally, this should be a range of people in
the design team.
•Data collection: what will the mode of data collection be?
•Output: What will you do with the research when you have it? What decisions will it
help make? How will it be presented and to who?
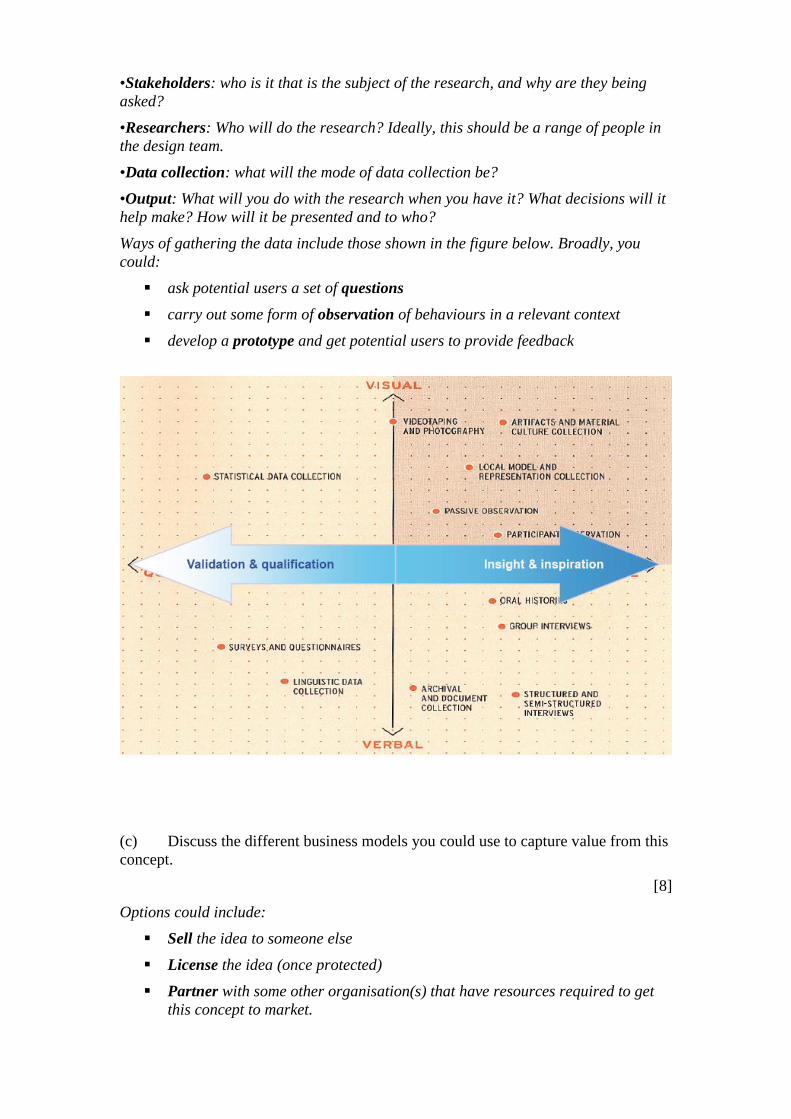
Ways of gathering the data include those shown in the figure below. Broadly, you
could:
ask potential users a set of questions
carry out some form of observation of behaviours in a relevant context
develop a prototype and get potential users to provide feedback
(c) Discuss the different business models you could use to capture value from this
concept.
[8]
Options could include:
Sell the idea to someone else
License the idea (once protected)
Partner with some other organisation(s) that have resources required to get
this concept to market.

Attempt to develop, make and sell a product and/or deliver a service alone.
Looking at this an alternative way:
Focus on the development of a physical product (which could be sold directly
or indirectly via a channel) for single markets, or different products for
different markets.
Focus on the development of a service enabled by this product (e.g. could be
good for employers of drivers / pilots / security guards etc to monitor
behaviours)
Could be product linked to collection of accessories (e.g. ways of adapting the
single product for application in different segments).
Better answers would then weigh up the relative merits of each of these business
models in the context of this technology and this opportunity.
Stronger answers should also consider that the choice of business model will be
influenced by the availability of resources, and this, in turn, is influenced by the
funding available. You could discuss different funding options for each of the
preferred business models, giving a very rough indication of which would need the
most money, what the money would be spent on, and where it might be sourced. There
may need to be iterations between the design of the preferred business model, the
resources required to implement that business model, and the availability of funding
to access the resources.
22 (a) Describe and give an example for each of the following types of
innovation:
(i) product;
(ii) process;
(iii) placement; and
(iv) paradigm.
[8]
Product / service: What is offered to the customer (e.g. iPhone, Tesco home delivery)
Process: How the operations of the business are managed (e.g. production process –
float glass; and business processes on-line auction - eBay)
Placement: How the product / service is positioned in the market (e.g. mobile phone
moving from business productivity tool to consumer device; Lucozade moving from
drink for those recovering from sickness, to sports energy drink).
Paradigm: A radical change in the way the business makes money (e.g. iTunes,
NetFlix)
(b) Discuss why large, long-established firms tend to focus on incremental rather
than radical innovations.
[9]
Key points to expand upon would be:
Large firms typically have invested large amounts of capital substantial resources
designed to create value in a particular way (e.g. a factory built to make one type of
product). They focus on making products in that factory as efficiently as possible, and
developing the markets for those products. Making small improvements (incremental
innovations) does not usually significantly disrupt the operations of the existing
factories / supply chains, but does offer some improvement to their customers in terms
of cost or quality. The company’s stakeholders (suppliers, investors, customers,
employees, etc) do not experience any dramatic change.
However, if the company tries to do something that is radically different from what
they currently do, this is likely to cause disruptions for all their stakeholders. The
firm’s current suppliers may find that they are no longer needed – and the firm has to
develop whole new supply chains; the firm’s current customers may not be the same
ones that want the new product / service, and so the firm may lose current customers
and have to build up new markets; investors may be very nervous about change that
may, in the short term, reduce the value of their investment.
(c) Discuss why technology-based start-up firms often form partnerships with
larger, more commercially experienced firms.
[8]
The answer should expand on the following points:
Problem: Start-up firms often have part of complete commercial solution. Technology
start-ups may have an exciting new technology, but not have the experience nor
required resources to develop, make and sell a product or service based upon this
technology. The start-up can attempt to overcome these shortcomings by raising
investment to allow them to buy-in the things they need (specialised skills, equipment,
routes to market, etc), but (a) they might fail to raise the money required and (b) it
may take a long time to get the skills, equipment, etc.
Solution: An alternative is to find a partner who already has the resources the start-
up needs, and to find a way to work with them. Typically, such a partner would be a
firm with substantial experience and the required development, production and
marketing capabilities. There would also be advantages from the perspective of the
large firm, that would be able to access the innovativeness of the start-up to address
some opportunity area that the large firm might otherwise struggle to address.
A strong answer could also discuss the fact that the challenge for the start-up is not
only to find the right partner, but to find a mutually beneficial way of working
together. There are numerous pitfalls in both of these stages that could be discussed.
23 (a) Describe, using examples, what is meant by:
(i) technology push; and
(ii) market pull.
[4]
Technology push = an invention/discovery which then seeks an application
Market pull = an application that requires an invention / discovery.
Technology push examples:
The Post-It note arose by accident
The DVD player arose by analogy and the Dyson was a transfer of an existing
industrial technology to a new domestic applications
The domestic breadmaker arose from a structured search for new kitchen appliances
The ‘inerter’ arose due to a gap in an existing map of possibilities
New materials allowed the hair dryer to move from an expensive metal body to a
cheaper plastic body.
Market pull examples:
The ‘aural’ thermometer for babies arose from the difficult experience of using
conventional mercury thermometers measuring babies temperatures with
The chopper bicycle arose from modifications to existing bikes by enthusiastic users
Fridges and washing machines are now sold as fashion items as the kitchen has
become the main entertaining room
The ink-jet printing industry around Cambridge has grown due to legislation on sell-
by dates for food
The model-T Ford was successful because Ford found ways that by making cars
cheaper he could turn a luxury product into a common one
(b) Describe the four tests that an invention must satisfy for it to be patentable.
[4]
Test 1 Novelty: is the invention genuinely new, or has it been publically revealed
before the filing date?
Test 2 Inventive step: asks whether there is a step involved in moving from what is
already known (the prior art) to the invention that would not be obvious to someone
who is quite skilled but completely unimaginative – that is the inventive step. Expert
advice is often needed to establish if this is satisfied.
Test 3 Practical application: means that the invention must take the practical form of
an apparatus or device, a product such as some new material or substance or an
industrial process or method of operation. "Industry" is meant in its broadest sense as
anything distinct from purely intellectual or aesthetic activity. It does not necessarily
imply the use of a machine or the manufacture of an article.
Test 4 Must not be excluded: an invention is not patentable if it is: a discovery; a
scientific theory or mathematical method; an aesthetic creation such as a literary,
dramatic or artistic work; a scheme or method for performing a mental act, playing a
game or doing business; the presentation of information, or a computer program.

(c) Discuss the relative advantages and disadvantages of protecting an invention
through:
(i) filing a patent; or
(ii) keeping the invention confidential.
[8]
A patent provides ensures that the nature of your invention is clear, and that if
anyone attempts to copy your idea, you have a clear reference point around
which to build a legal defence.
There are costs associated with patenting (though the filing is free, the cost of
legal advice and processing will be £5-10k. For international coverage, these
costs can grow to >£100k. There is then the annual fee to be paid, and this
will increase each year.
Having the patent as the basis for legal action against someone suspected of
infringing is just the starting point. Fighting a legal action can be extremely
costly and time consuming. The Dyson and Kearns examples described in
class provide examples that illustrate the time, costs and potential payouts
possible. Recent cases between Samsung and Apple also provide interesting
examples.
A patent is basically a public disclosure of an invention, showing the world
how to do something. Even if the idea is not directly copied, it can provide
stimulation for innovation in similar areas. An alternative is to keep the idea
confidential. The example in class of the Bessemer paint process is a good
example of this. By simply ensuring that nobody new all the stages of the
process, Bessemer was able to retain a monopoly in the ‘gold’ paint process.
The use of confidentiality agreements for employees (and suppliers) can be
very effective as a means of ensuring that an idea is not communicated to
others, and the value creating potential of the idea is maintained within the
organisation. However, confidentiality agreements only apply to those who
have signed them.
You can choose just to keep things secret, but this gives you no legal
protection should someone start using your idea.
If you chose to keep something secret, then someone then patents your idea,
you may then find that you are liable to pay them a license fee if you wish to
continue using that idea.
For firms seeking to raise money from investors, not having any legal
protection over your core invention may make them very nervous. For some
sectors (e.g. advanced materials, drug development, etc) patents are critical,
and any potential investor would want to know that you have clear registered
ownership before investing any money. Analysis of the patent position of a
start-up is often a key part of the due diligence process undertaken by would-
be investors.
A good answer should show understanding of issues such as these. The results
could be presented as a comparative table to aid the discussion.

(d) Discuss the challenges that an inventor may face when seeking to
commercially exploit potentially disruptive intellectual property in a sector dominated
by large companies.
[9]
This question requires you to think about the specific issues of single inventor
(probably has little money, very specific skills, an idea probably at a very early stage
of commercialisation), an idea that is disruptive (it will, in some way, change what is
already being sold), facing competitors that have lots of money, resources and
experience.
The core of a good answer is that there is often significant inertia in both markets and
within individual firms. Large companies have become large by developing (usually)
highly efficient and often complex systems for creating and capturing value from their
assets, based around the current technology. There are often high barriers to entry
for any new firm to enter that market, let alone one with a disruptive idea.
An inventor with an idea for something that is better than whatever is currently being
delivered to customers, but which is disruptive to the current players will face major
resistance. Investors may be very reluctant to back the inventor as they realise that it
may require huge amounts of money to overcome the cynicism of customers. Few of
the incumbent firms will want to back this new idea as it may destroy their current
way of doing business.
The incumbent firms will also often have made large investments in developing
substantial IP in this area, and will have a very strong vested interest in continuing to
generate returns from this IP. For example, Kodak had invested US$billions over the
period of many years in film-based technology. For them, there was little incentive to
switch to digital technologies which required a whole set of different skills, IP and
resources.
Despite these setbacks, there are examples of small firms that have successfully
disrupted markets with their new ideas: e.g. Apple with the Apple I and II kick-
starting the very disruptive PC revolution; Napster with peer-to-peer music
downloads that transformed the music industry; ARM and low power IP design;
Autonomy and probabilistic search technology.
Strong answers could also reflect upon the strategies of such smaller companies that
have managed to disrupt industry sectors successfully. Better answers should also
consider the different strategies that incumbent firms may deploy to respond to a
potential disruption (e.g., price undercutting, purchase and suppress, spread bad
publicity, etc). The choice of these different strategies may depend upon the nature of
the disruption, the firms involved, and the industry structure.