section a probability scale grade g e w 1. r l o two
TRANSCRIPT
Topic 8 - F Probability
St Paul’s Catholic School 1
Section A Probability Scale Grade G E
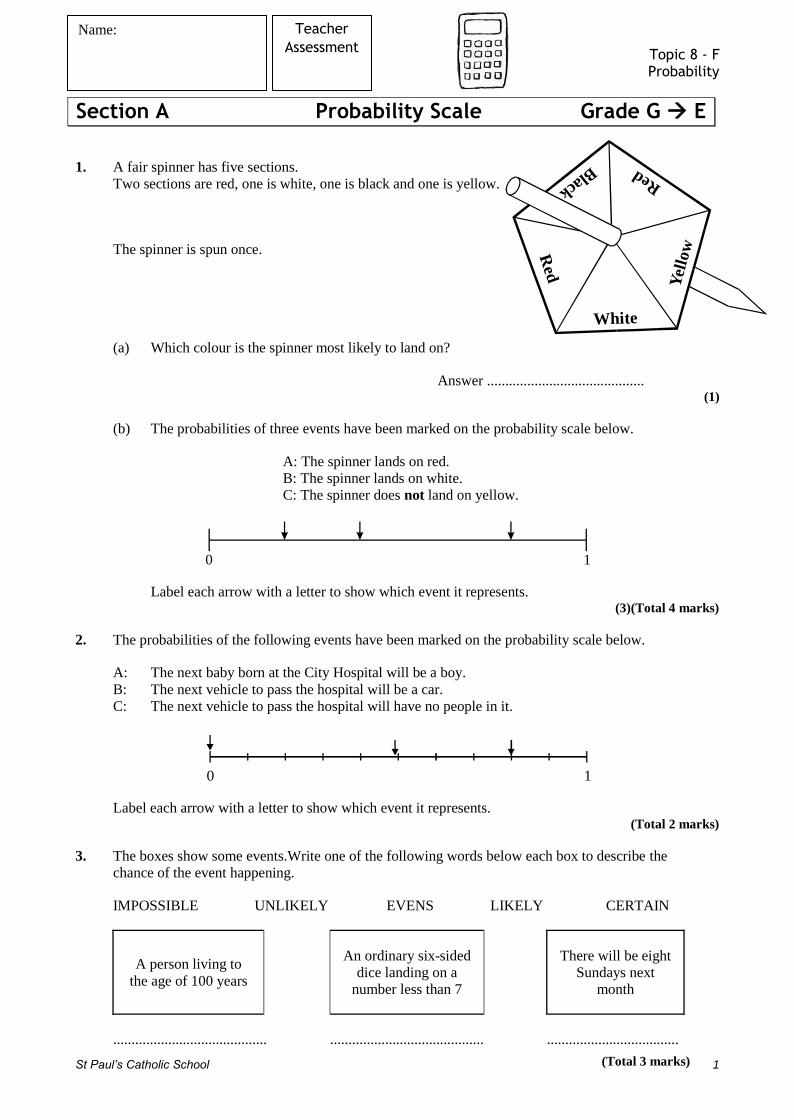
1. A fair spinner has five sections.
Two sections are red, one is white, one is black and one is yellow.
The spinner is spun once.
(a) Which colour is the spinner most likely to land on?
Answer ........................................... (1)
(b) The probabilities of three events have been marked on the probability scale below.
A: The spinner lands on red.
B: The spinner lands on white.
C: The spinner does not land on yellow.
0 1
Label each arrow with a letter to show which event it represents. (3)(Total 4 marks)
2. The probabilities of the following events have been marked on the probability scale below.
A: The next baby born at the City Hospital will be a boy.
B: The next vehicle to pass the hospital will be a car.
C: The next vehicle to pass the hospital will have no people in it.
0 1
Label each arrow with a letter to show which event it represents. (Total 2 marks)
3. The boxes show some events.Write one of the following words below each box to describe the
chance of the event happening.
IMPOSSIBLE UNLIKELY EVENS LIKELY CERTAIN
A person living to
the age of 100 years
An ordinary six-sided
dice landing on a
number less than 7
There will be eight
Sundays next
month
.......................................... .......................................... ....................................
Name: Teacher
Assessment
Black
White
Yel
low
Red
Red
(Total 3 marks)

Topic 8 - F Probability
St Paul’s Catholic School 2
4. A fair six-sided dice is thrown once.
Mark the probability of each of the following events onto the probability scale.
A: The dice lands on the number 3.
B: The dice lands on an odd number.
C: The dice lands on a number greater than 2.
0 1 (Total 3 marks)
5. A fair spinner has three equal sections. One section is red, one is blue and one is yellow.
The spinner is spun once.
The probabilities of three events have been marked on the probability scale below.
A: The spinner lands on blue.
B: The spinner lands on green.
C: The spinner does not land on red.
0 1
Label each arrow with the letter to show which event it represents. (Total 3 marks)
6. A fair six-sided spinner is numbered from 1 to 6.
The spinner is spun once.
Mark on the probability scale the probabilities of each of the following events.
A The spinner lands on an even number.
B The spinner lands on a 4 or a 5.
C The spinner lands on a number less than 7.
(Total 3 marks)
Success: Target:
yellow
blu
e red

Topic 8 - F Probability
St Paul’s Catholic School 3
Section B Calculating Probabilities Grade F D
1. This passage is from a reading book for Primary children.
Horatio was gazing into the night from his bedroom
window. He was watching for aliens.
(a) Complete this frequency table by counting the number of letters in each word in
the passage.
Number of letters
in each word
Tally Frequency
1
2
3
4
5
6
7
8
Total
(3)
(b) Write down the mode of the number of letters in a word.
Answer ................................................................... (1)
(c) A word is chosen at random from the passage. Find the probability that the word has
(i) exactly four letters,
Answer ......................................................................... (1)
(ii) more than five letters.
Answer ......................................................................... (2)
(d) What do you think would happen to the average word length if a similar passage was
chosen from an adult science fiction novel?
.......................................................................................................................................
....................................................................................................................................... (1)(Total 8 marks)
Teacher
Assessment

Topic 8 - F Probability
St Paul’s Catholic School 4
2. These are the members of a girls’ basketball team.
One girl is to be chosen at random to be captain.
What is the probability that her name begins with J?
…………..........…............……..……...................………………………………….
Answer …………………………………
(Total 2 marks)
3. Sami keeps her credit card receipts in a drawer until her statement arrives.
The table shows the number of each type of receipt in the drawer.
Petrol Groceries Hotels Rail fares Other
5 8 1 2 4
Sami picks a receipt at random from the drawer.
What is the probability that the receipt she picks is
(a) for hotels,
Answer ……………………………………… (2)
(b) not for hotels?
Answer ……………………………………… (1)
(Total 3 marks)
4. (a) The list gives some words used in probability.
Impossible unlikely evens likely certain
For each of the events below, write down the word from the list which describes its
probability.
(i) A fair coin landing on heads.
Answer .................................................... (1)
(ii) Picking a red ball, at random, from a bag containing 20 red balls and 3 black balls.
Answer ....................................................... (1)
(iii) Throwing the number 8 on an ordinary fair six-sided dice.
Answer ......................................................... (1)

Topic 8 - F Probability
St Paul’s Catholic School 5
(b) Brian has some red marbles, blue marbles and white marbles in a bag.
He says that the probability of choosing each colour is shown in the table.
Colour of marble red blue white
Probability 0.3 0.6 0.2
There is a mistake in the probabilities in the table. Explain how you know this.
..................................................................................................................................... (1)
(Total 4 marks)
5. A fair ordinary six-sided dice is thrown once. The boxes show some of the possible outcomes.
Draw a line from each box in column A to the box in column B which has the same probability.
Column A Column B
Throwing
a six
Throwing
an even number
Throwing
a two or a three
Throwing
a one
Throwing
an odd number
Throwing
a four or a five
(Total 3 marks)
6. Susan and Jill play a game.
(a) Susan has a box containing 3 red, 4 yellow and 2 blue counters. She picks a counter at
random. What is the probability that Susan picks a yellow counter?
Answer .................................................................. (2)
(b) Jill has a box containing 18 counters of which 8 are yellow. She picks a counter at
random. What is the probability that Jill does not pick a yellow counter?
Answer .................................................................. (2)
(c) Who is more likely to pick a yellow counter? Tick the correct box. Explain your answer.
Susan
Jill
Neither
Explanation ..................................................................................................................
...................................................................................................................................... (2)(Total 6 marks)

Topic 8 - F Probability
St Paul’s Catholic School 6
7. (a) A box of chocolates contains 7 soft centres, 5 toffee centres and 8 nut centres.
Mary chooses a chocolate at random.
What is the probability that she chooses a chocolate with a toffee centre?
.....................................................................................................................................
.....................................................................................................................................
Answer .......................................................................... (2)
(b) In a bag of sweets the probability of choosing a sweet with a soft centre is 0.4
What is the probability of choosing a sweet that does not have a soft centre?
.....................................................................................................................................
Answer .......................................................................... (1)
(Total 3 marks)
8. A bag contains 12 blue and 8 green counters. A counter is chosen at random.
(a) Find the probability that the counter chosen is red.
.....................................................................................................................................
.....................................................................................................................................
Answer .................................................... (1)
(b) Find the probability that the counter chosen is green.
Give your answer as a fraction in its lowest terms.
.....................................................................................................................................
.....................................................................................................................................
Answer .................................................... (2)
(c) 10 yellow counters are added to the bag.
Calculate the probability that a counter chosen at random is green or yellow.
.....................................................................................................................................
.....................................................................................................................................
.....................................................................................................................................
.....................................................................................................................................
Answer .................................................... (2)
(Total 5 marks)
Topic 8 - F Probability
St Paul’s Catholic School 7
9. In a raffle 200 tickets are sold. There is only one prize.
Mr Key buys 10 tickets.
Mrs Key buys 6 tickets.
Their children, Robert and Rachel, buy 2 tickets each.
(a) Which member of the family has the best chance of winning the prize?
Give a reason for your answer.
......................................................................................................................................
...................................................................................................................................... (2)
(b) What is the probability that Mrs Key wins the prize?
......................................................................................................................................
Answer ........................................................... (2)
(c) What is the probability that none of the family wins the prize?
......................................................................................................................................
......................................................................................................................................
Answer ........................................................... (3)
(Total 7 marks)
10. A bag contains blue, red and green cards only.
One card is taken at random from the bag.
The table shows the probabilities of taking a blue card and a red card.
Colour Blue Red Green
Probability 0.3 0.5
(a) What is the probability of taking a yellow card from the bag?
Answer ...................................................................... (1)
(b) What is the probability of taking a card that is not blue from the bag?
.....................................................................................................................................
Answer ...................................................................... (1)
(c) Complete the table to show the probability of taking a green card from the bag.
..................................................................................................................................... (1)
(Total 3 marks)

Topic 8 - F Probability
St Paul’s Catholic School 8
11. Danny has two fair spinners.
Spinner A has four equal sections, two are red, one is yellow and one is green.
Spinner B has six equal sections, three are red, one is yellow and two are green.
Spinner A Spinner B
yellow yellow
red red
red
red
red
green
green
green
Danny spins each spinner once.
(a) Which colour is Spinner A most likely to land on?
Answer ................................................ (1)
(b) Which spinner is more likely to land on yellow, Spinner A or Spinner B?
Give a reason for your answer.
.....................…………………………………………………………………………
.....................………………………………………………………………………… (1)
(c) What is the probability that Spinner A lands on green?
Answer ................................................ (1)
(d) The probabilities of three events have been marked on the probability scale below.
R: Spinner B lands on red
Y: Spinner B lands on yellow
G: Spinner B lands on green
0 1
Label each arrow with a letter to show which event it represents. (2)
(Total 5 marks)

Topic 8 - F Probability
St Paul’s Catholic School 9
12. (a) Ann has a spinner which has five equal sections.
Two sections are red, one is yellow, one is green and one is white.
Ann spins the spinner once.
On what colour is the spinner most likely to land?
Answer .................................................................. (1)
(b) Ann has a second spinner which has six equal sections.
Three sections are red, one is yellow and two are blue.
Ann spins this spinner once.
What is the probability that this spinner lands on red?
....................................................................................…..............................................
Answer .................................................................. (2)
(c) Ann thinks that she has more chance of getting yellow on the second spinner.
Explain why Ann is wrong.
..................................................................................................................................
..................................................................................................................................
.................................................................................................................................. (2)
(Total 5 marks)
Success: Target:
R Y
G R
W
First spinner
R
B
R
B
Y
R
Second spinner

Topic 8 - F Probability
St Paul’s Catholic School 10
Section C Listing Outcomes Grade D
1. Lucy has two ordinary, fair dice. One dice is red and the other is blue. She rolls each dice once
and adds the scores to get the total.
(a) Complete the table to show the totals.
(2)
(b) What is the probability that Lucy gets a
total of 12?
Answer ............................................ (1)
(c) What is the probability that Lucy gets a
total of 6?
Answer ............................................ (2)(Total 5 marks)
2. Two fair spinners A and B are shown.
6 5
1
A
1
4
7 6
1
B
2
5
James plays a game using the two spinners.
His score is the sum of the two numbers on spinner A and spinner B.
He wins if his score is even.
James plays the game many times.
Is he likely to win more times than he loses?
You must show your working.
You may use this table if you wish.
………………………………………………………………
…………………………………………………………………………………………...
……………………………………………………………………………………………...
……………………………………………………………………………………………... (Total 4 marks)
Teacher
Assessment
Spinner B + 1 1 4 5 6
1
2
5
6
7
Spinner A Spinner A
1
2
3
4
5
6
1 2 3 4 5 6
Blue dice
Red dice

Topic 8 - F Probability
St Paul’s Catholic School 11
3. Sarah is playing a game with a fair coin and a fair six-sided dice.
She spins the coin and then throws the dice.
If the coin shows heads Sarah’s score is 1 more than the number shown on the dice. If the coin
shows tails Sarah’s score is 2 less than the number shown on the dice.
(a) Complete the table to show all possible scores.
Dice
1 2 3 4 5 6
Coin Heads
5
Tails –1
(2)
(b) Work out the probability that Sarah’s score is
(i) negative Answer .............................................................. (1)
(ii) more than 3.
...........................................................................................................................
Answer .............................................................. (2)(Total 5 marks)
4. David is playing a game with a fair coin and a set of four cards. The cards are numbered 1, 2, 3
and 4. David spins the coin and then chooses a card at random.
If the coin shows heads David’s score is the same as the number on the card.
If the coin shows tails David’s score is twice the number on the card.
(a) Complete the table to show all possible scores.
Card
1 2 3 4
Coin Heads
2
Tails
6
(2)
(b) Work out the probability that David’s score is
(i) 3 Answer .......................................................................... (1)
(ii) an even number.
...........................................................................................................................
Answer .......................................................................... (2)(Total 5 marks)

Topic 8 - F Probability
St Paul’s Catholic School 12
5. Ashraf is playing a game with a fair coin and a fair triangular spinner with sections numbered 2,
3 and 4.
He flips the coin and then spins the spinner.
If the coin shows heads, his score is the number on the spinner multiplied by 3.
If the coin shows tails, his score is the number on the spinner.
(a) Complete the table to show all the possible scores that Ashraf can get.
(2)
(b) Write down the probability that Ashraf gets a score of
(i) 9, Answer ........................................................................ (1)
(ii) 6 or less. Answer ........................................................................ (2)(Total 5 marks)
6. Here is a pack of ten cards.
(a) Complete this two-way table to show the number of
(2)
(b) One of the cards is picked at random.
What is the probability that it has either a shaded circle or an unshaded triangle?
.....................................................................................................................................
.....................................................................................................................................
Answer............................................................................... (2)(Total 4 marks)
Success: Target:
Shaded Unshaded
Circles
Triangles
different cards in the pack.
Spinner
Heads
Tails
Coin
2 3 4
4
3

Topic 8 - F Probability
St Paul’s Catholic School 13
Section D Relative Frequency and Expectation Grade D / C
1. A dice is suspected of bias. Here are the results of 20 throws.
3 4 2 3 1 5 6 2 4 3
4 3 1 1 6 2 5 6 5 3
(a) Use these results to calculate the relative frequency of each score.
......................................................................................................................................
......................................................................................................................................
Score 1 2 3 4 5 6
Relative frequency
(2)
(b) Use the relative frequency to calculate how many times you would expect to score 3 in 60
throws of this dice.
......................................................................................................................................
......................................................................................................................................
......................................................................................................................................
Answer ........................................... (2)
(c) Compare your answer to part (b) with the number of times you would expect to score 3 in
60 throws of a fair dice.
......................................................................................................................................
......................................................................................................................................
......................................................................................................................................
(1)
(Total 5 marks)
Teacher
Assessment

Topic 8 - F Probability
St Paul’s Catholic School 14
2. Twenty pupils each shuffle a pack of coloured cards and choose a card at random. The colour of
the card is recorded for each pupil. (R = Red B = Blue G = Green Y = Yellow)
B
G
Y
B
Y
R
R
B
Y
Y
B
G
G
B
B
R
R
B
Y
Y
(a) Use these results to calculate the relative frequency of each colour.
......................................................................................................................................
Colour Red Blue Green Yellow
Relative frequency
(2)
(b) Use the results to calculate how many times you would expect a blue card if 100 pupils
each choose a card at random.
......................................................................................................................................
......................................................................................................................................
Answer .................................................................. (2)(Total 4 marks)
3. Red, blue, white and green tickets are sold in a raffle.
The table shows some of the probabilities of these tickets winning the first prize.
(a) Calculate the probability of a green
ticket winning the first prize.
...........................................................
...........................................................
...........................................................
...........................................................
Answer ........................................................................ (2)
(b) There were 1000 tickets sold in this raffle. Calculate how many red tickets and blue
tickets were sold altogether.
.....................................................................................................................................
.....................................................................................................................................
.....................................................................................................................................
Answer ........................................................................ (2)(Total 4 marks)
Ticket colour Probability of winning
first prize
Red 0.4
Blue 0.2
White 0.1
Green

Topic 8 - F Probability
St Paul’s Catholic School 15
4. Lynne has a spinner with coloured sections of equal size.
She wants to know the probability that her spinner lands on blue.
She spins it 100 times and calculates the relative frequency of blue after every 10 spins
Her results are shown on the graph.
Relativefrequency
Number of spins
0 10 20 30 40 50 60 70 80 90 100
0.35
0.3
0.25
0.2
0.15
0.1
0.05
0
×
××
××
××
× × ×
(a) Use the graph to calculate the number of times the spinner landed on blue in the first 20
spins
.....................................................................................................................................
.....................................................................................................................................
Answer ..................................................... (2)
(b) Use the graph to estimate the probability that the spinner will land on blue.
.....................................................................................................................................
Answer ..................................................... (1)
(Total 3 marks)

Topic 8 - F Probability
St Paul’s Catholic School 16
5. Amy has a bag containing red, green and blue balls.
She wants to know the probability of picking a red ball from the bag.
She picks a ball at random from the bag, records the colour and replaces the ball in the bag.
Amy does this 60 times and calculates the relative frequency of red after every 10 goes.
Her results are shown on the graph.
00 20 40 6010 30 50
Number of goes
Relative
frequency
of red
0.3
0.4
0.5
0.6
0.7
(a) Use the graph to calculate the number of times Amy picked a red ball in the first 10 goes.
……………………………………………………………………………………….
Answer …………………………………………………… (2)
(b) What is the best estimate for the probability of picking a red ball?
Explain your answer.
……………………………………………………………………………………….
……………………………………………………………………………………….
………………………………………………………………………………………. (2)
(Total 4 marks)

Topic 8 - F Probability
St Paul’s Catholic School 17
6. A four-sided spinner has sections labelled A,B,C,D.
The spinner is spun and the relative frequency of the letter A is recorded after every 10 spins.
(a) After 50 spins there were 20 letters As.
Plot this relative frequency on the diagram.
......................................................................
...................................................................... (1)
(b) The relative frequency after the first 60 spins is 0.45
How many times does the spinner land on A in the first 60 spins?
.....................................................................................................................................
Answer ...................................................................... (1)
(c) Is the spinner biased? Give a reason for your answer.
.....................................................................................................................................
..................................................................................................................................... (2)
(d) The spinner is spun 1000 times.
How many times would you expect the spinner to land on A?
.....................................................................................................................................
Answer ...................................................................... (2)
(e) A different four-sided spinner has these probabilities.
Letter A B C D
Probability 0.2 0.3 0.4 0.1
What is the probability of getting a B or a C with one spin?
.....................................................................................................................................
.....................................................................................................................................
Answer ...................................................................... (2)(Total 8 marks)
×
××
×
0.6
0.5
0.4
0.3
0.2
0.1
00 10 20 30 40 50 60
Number of spins
Relativefrequency

Topic 8 - F Probability
St Paul’s Catholic School 18
7. Alan, Bob and Colin play a game of darts.
There is only one winner.
The probability that Alan wins the game is 0.3
The probability that Bob wins the game is 0.5
(a) What is the probability that Alan or Bob wins the game?
.....................................................................................................................................
.....................................................................................................................................
Answer …………………………………….. (1)
(b) Alan, Bob and Colin play 20 games of darts. How many games would you expect Colin to
win?
.....................................................................................................................................
.....................................................................................................................................
.....................................................................................................................................
.....................................................................................................................................
.....................................................................................................................................
.....................................................................................................................................
Answer ......................................................................... (4)
(Total 5 marks)
8. A bag contains 200 coloured discs.
The discs are either red, blue or yellow.
There are 86 red discs in the bag.
The probability that a blue disc is chosen from the bag is 0.22
Calculate the number of yellow discs in the bag.
...............................................................................................................................................
...............................................................................................................................................
...............................................................................................................................................
...............................................................................................................................................
...............................................................................................................................................
...............................................................................................................................................
...............................................................................................................................................
...............................................................................................................................................
Answer .......................................................................... (Total 4 marks)

Topic 8 - F Probability
St Paul’s Catholic School 19
9. A spinner has a red sector (R) and a yellow sector (Y).
Red
Yellow
The arrow is spun 1000 times.
The table shows the relative frequency of a red after different numbers of spins.
Number of spins Relative frequency
of a red
50 0.42
100 0.36
200 0.34
500 0.3
1000 0.32
(a) How many times was a red obtained after 200 spins?
.....................................................................................................................................
.....................................................................................................................................
.....................................................................................................................................
Answer............................................................................... (2)
(b) Which relative frequency gives the best estimate of the probability of a red?
Explain your answer.
.....................................................................................................................................
..................................................................................................................................... (2)
(Total 4 marks)

Topic 8 - F Probability
St Paul’s Catholic School 20
10. Penny, Sam and Robert do this experiment on the same bag of 10 counters.
1. Take a counter from the bag at random.
2. Record its colour.
3. Put the counter back in the bag.
Repeat this trial a number of times.
Their results are shown in this table.
Name of Number Colour of counter
pupil of trials Black White Green
Penny 10 0 6 4
Sam 40 3 16 21
Robert 200 22 76 102
Estimate the number of each different coloured counter in the bag.
Clearly state the set of results that you use to make the estimate.
Give a reason for your choice.
..............................................................................................................................................
..............................................................................................................................................
..............................................................................................................................................
..............................................................................................................................................
..............................................................................................................................................
..............................................................................................................................................
..............................................................................................................................................
Set of results used .....................................................
Reason .................................................................................................................................
..............................................................................................................................................
Answer Black ......................., White ......................., Green …………………. (Total 4 marks)
Success: Target: