section ix. medicaid managed care draft rate book (sfy
TRANSCRIPT

Section IX. Medicaid Managed Care Draft RateBook (SFY 2020)
North Carolina Department of Health andHuman Services
1 of 197Prepared by Mercer GovernmentHuman Services Consulting
RFP 30-190029-DHBSection IX. Medicaid Managed Care Draft Rate Book (SFY 2020)
TABLE OF CONTENTSExecutive Summary ........................................................................................................................................5
1 Introduction ...........................................................................................................................................9
2 Data Sources ........................................................................................................................................ 10
3 PHP Regions ......................................................................................................................................... 11
4 Population Groupings ........................................................................................................................... 12 Standard Plan Population ........................................................................................................................ 124.1 Future Managed Care Populations .......................................................................................................... 134.2 Excluded Populations .............................................................................................................................. 144.3
5 Service Categories ................................................................................................................................ 15
6 Historical Data Analysis ........................................................................................................................ 18 MMs Adjustment ..................................................................................................................................... 186.1 Retroactive Eligibility and Application Period ......................................................................................... 196.2 Completion Factors ................................................................................................................................. 206.3 GME Adjustment ..................................................................................................................................... 216.4 TPL Adjustment ....................................................................................................................................... 216.5 NEMT Adjustment ................................................................................................................................... 226.6 Fraud, Waste and Abuse Recoveries Adjustment ................................................................................... 226.7 LME/MCO Data Adjustments .................................................................................................................. 236.8
6.8.1 Patient Liability Adjustment ............................................................................................................ 236.8.2 Payments Made Outside of the Claims System ............................................................................... 23
7 Historical Data Exhibits ......................................................................................................................... 24 SFY 2016 Exhibits ..................................................................................................................................... 257.1
7.1.1 SFY 2016 Region 1 Exhibits .............................................................................................................. 267.1.2 SFY 2016 Region 2 Exhibits .............................................................................................................. 337.1.3 SFY 2016 Region 3 Exhibits .............................................................................................................. 407.1.4 SFY 2016 Region 4 Exhibits .............................................................................................................. 477.1.5 SFY 2016 Region 5 Exhibits .............................................................................................................. 547.1.6 SFY 2016 Region 6 Exhibits .............................................................................................................. 61
SFY 2017 Exhibits ..................................................................................................................................... 687.27.2.1 SFY 2017 Region 1 Exhibits .............................................................................................................. 697.2.2 SFY 2017 Region 2 Exhibits .............................................................................................................. 767.2.3 SFY 2017 Region 3 Exhibits .............................................................................................................. 837.2.4 SFY 2017 Region 4 Exhibits .............................................................................................................. 907.2.5 SFY 2017 Region 5 Exhibits .............................................................................................................. 977.2.6 SFY 2017 Region 6 Exhibits ............................................................................................................ 104
8 Capitation Rate Development ............................................................................................................. 111
9 Base Data Development ..................................................................................................................... 112
10 Trend Assumptions ............................................................................................................................. 113 Trend Development Methodology ........................................................................................................ 11310.1 Overall Trend Assumptions ................................................................................................................... 11310.2
10.2.1 Inpatient Hospital .......................................................................................................................... 11410.2.2 Prescription Drugs ......................................................................................................................... 114
11 Program Design Considerations .......................................................................................................... 116
2 of 197Prepared by Mercer GovernmentHuman Services Consulting
RFP 30-190029-DHBSection IX. Medicaid Managed Care Draft Rate Book (SFY 2020)

Hospital Reimbursement Methodology ................................................................................................ 11611.1 Maternity Enhanced Rate ...................................................................................................................... 11711.2 Long-Term Nursing Home Stay Beneficiaries ........................................................................................ 11711.3 Other Provider Reimbursement Considerations ................................................................................... 11811.4
11.4.1 Provider Rate Floors ...................................................................................................................... 11811.4.2 LME/MCO Services Reimbursement ............................................................................................. 11811.4.3 FQHC/RHC Providers ..................................................................................................................... 11811.4.4 Historical Cost Settlements ........................................................................................................... 118
Additional Programmatic Considerations ............................................................................................. 11911.5
12 Managed Care Assumptions................................................................................................................ 120 Overall Managed Care Findings ............................................................................................................. 12012.1 Non-Pharmacy Benefits ......................................................................................................................... 12112.2
12.2.1 Other State Medicaid Experience .................................................................................................. 12112.2.2 Efficiency Analysis .......................................................................................................................... 12212.2.3 Other Medical Services .................................................................................................................. 123
Pharmacy Benefits ................................................................................................................................. 12312.3
13 Non-Benefit Expense Considerations ................................................................................................... 124 Methodology and Data Sources ............................................................................................................ 12513.1 Program Management and Administrative Operations Personnel ....................................................... 12613.2 Care Management Personnel ................................................................................................................ 12613.3 Non-Personnel Costs ............................................................................................................................. 12813.4 Non-Benefit Expense Load Application to Capitation Rates ................................................................. 12813.5 Profit/Underwriting Gain and Premium Taxes ...................................................................................... 12813.6 Health Insurer Provider Fee (HIPF) ........................................................................................................ 12813.7
14 Capitation Rate Development Exhibits ................................................................................................ 130 Region 1 Capitation Rate Development Exhibits ................................................................................... 13214.1 Region 2 Capitation Rate Development Exhibits ................................................................................... 13814.2 Region 3 Capitation Rate Development Exhibits ................................................................................... 14414.3 Region 4 Capitation Rate Development Exhibits ................................................................................... 15014.4 Region 5 Capitation Rate Development Exhibits ................................................................................... 15614.5 Region 6 Capitation Rate Development Exhibits ................................................................................... 16214.6
15 Other Considerations .......................................................................................................................... 168 Member Choice ..................................................................................................................................... 16815.1
15.1.1 Tribal Members ............................................................................................................................. 16815.1.2 BH I/DD Tailored Plan .................................................................................................................... 168
Performance Withholds ........................................................................................................................ 16815.2 Risk Adjustment ..................................................................................................................................... 16915.3
15.3.1 Risk Adjustment Model ................................................................................................................. 16915.3.2 Data Collection .............................................................................................................................. 17015.3.3 Calculation of Risk Scores .............................................................................................................. 17015.3.4 Frequency of Updates ................................................................................................................... 17115.3.5 Final Capitation Rates .................................................................................................................... 171
Medical Loss Ratio ................................................................................................................................. 17215.415.4.1 Implied MLR Calculation based on Capitation Rate Development ............................................... 17215.4.2 Minimum MLR Threshold .............................................................................................................. 173
Appendix A — Maternity Event Criteria ...................................................................................................... 174Budget-Neutral Maternity Adjustment ............................................................................................................. 177
3 of 197Prepared by Mercer GovernmentHuman Services Consulting
RFP 30-190029-DHBSection IX. Medicaid Managed Care Draft Rate Book (SFY 2020)
Appendix B — Other Population Eligibility Criteria ...................................................................................... 178Future Managed Care Populations Criteria ...................................................................................................... 178Permanently Excluded Population Criteria ....................................................................................................... 178
Appendix C — Rate Cell Determination ....................................................................................................... 179Methodology ..................................................................................................................................................... 179Population Rate Cell Recommendations ........................................................................................................... 180Regional Rate Cell Recommendations .............................................................................................................. 181
Appendix D — Category of Service Criteria ................................................................................................. 182
Appendix E — BH I/DD Tailored Plan Criteria .............................................................................................. 186I/DD Criteria ...................................................................................................................................................... 186SED (Ages 0-17.99) and SPMI (Ages 18+) Criteria ............................................................................................. 187SUD Criteria ....................................................................................................................................................... 190
Appendix F — BH I/DD Tailored Plan Population ......................................................................................... 192Population Eligible for BH I/DD Tailored Plan ................................................................................................... 192Standard Plan Beneficiaries Demonstrating Potential Need for BH I/DD Tailored Plans ................................. 193
Appendix G – Approach to Medicaid Hospital Payments After the Transition to Managed Care .................... 194
4 of 197Prepared by Mercer GovernmentHuman Services Consulting
RFP 30-190029-DHBSection IX. Medicaid Managed Care Draft Rate Book (SFY 2020)

EXECUTIVE SUMMARYThe Department of Health and Human Services (DHHS) is implementing managed care in a way that advanceshigh-value care, improves population health, engages and supports providers and establishes a sustainableprogram with predictable costs. At the core of these efforts is the goal to improve the health of NorthCarolinians through an innovative, whole-person centered, well-coordinated system of care, which addressesmedical and non-medical drivers of health. In managed care, DHHS will remain responsible for all aspects of theMedicaid and NC Health Choice programs. However, as directed by the General Assembly, DHHS will delegatethe direct management of certain health services and financial risks to Prepaid Health Plans (PHPs). PHPs willreceive capitation payments and will contract with providers to deliver health services to their members.1
DHHS has contracted with Mercer Government Human Services Consulting (Mercer), part of Mercer Health &Benefits LLC, to develop the PHP capitation rates. As such, Mercer has produced the Draft Rate Book for DHHSas documentation of the development of the draft capitation rates effective in Contract Year 1 of managed carefor the proposed Standard Plan population. The capitation rates will be certified as actuarially sound inaccordance with applicable laws and regulations, including Actuarial Standards of Practice, to comply with theCenter for Medicare and Medicaid Services (CMS) regulations. Per 42 CFR 438.4(a), “actuarially sound capitationrates are projected to provide for all reasonable, appropriate, and attainable costs that are required under theterms of the contract and for the operation of the MCO, PIHP, or PAHP for the time period and the populationcovered under the terms of the contract, and such capitation rates are developed in accordance with therequirements in [42 CFR 438.4(b)].” Moreover, the capitation rates are meant to provide a reimbursementstructure that will match payment to the expected financial risk of the managed care program designed for theproposed Standard Plan population.
Following initial implementation of managed care and the rollout to the proposed Standard Plan population,additional populations will be phased-in over a five year period, as proposed by DHHS. However, information forthese populations is outside of the scope of the Draft Rate Book.
Contract Year 1 Standard Plan Draft Capitation RatesThe Contract Year 1 draft capitation rates were developed for non-dual Medicaid and NC Health Choicebeneficiaries in the Standard Plan, assuming Contract Year 1 runs from July 1, 2019 – June 30, 2020. Final rateswill reflect any changes in the Contract Year 1 start date or duration. For purposes of capitation ratedevelopment, the Standard Plan population was stratified by Aged, Blind, Disabled (ABD) and TemporaryAssistance for Needy Families and Other Related Children/Adults (TANF) beneficiaries. The capitation rates willbe paid on a per member per month (PMPM) basis, along with a one-time Maternity Event payment in theinstance of a live birth event. The table below reflects the draft base capitation rates; detailed summaries byregion, population and service category are provided in Section 14 of the Draft Rate Book.
Category of Aid Region 1 Region 2 Region 3 Region 4 Region 5 Region 6
ABD $1,373.30 $1,356.05 $1,529.02 $1,415.53 $1,278.26 $1,158.50TANF, Newborn (<1) $749.33 $707.22 $736.81 $660.06 $736.49 $563.56TANF, Child (1-20) $166.46 $148.78 $141.55 $141.70 $147.03 $136.70TANF, Adult (21+) $413.55 $437.60 $394.18 $385.86 $422.14 $373.97Maternity Event Payment $9,555.60 $9,760.42 $9,431.17 $8,857.91 $10,192.86 $8,844.00
1 Prepaid Health Plans in North Carolina Medicaid Managed Care. May 16, 2018.https://files.nc.gov/ncdhhs/documents/PHPs-in-Medicaid-Managed-Care-PolicyPaper_revFINAL_20180516.pdf
5 of 197Prepared by Mercer GovernmentHuman Services Consulting
RFP 30-190029-DHBSection IX. Medicaid Managed Care Draft Rate Book (SFY 2020)
The base capitation rates will also be risk adjusted, as required by Session Law (S.L.) 2015-2452, to reflect theunderlying health risk of the members enrolled in each PHP. Risk adjustment differentiates capitation paymentsto PHPs; however, this modeling has not yet occurred and will be forthcoming for final capitation rates.Additionally, DHHS will institute a Medical Loss Ratio (MLR) reporting and remittance process for all PHPs.
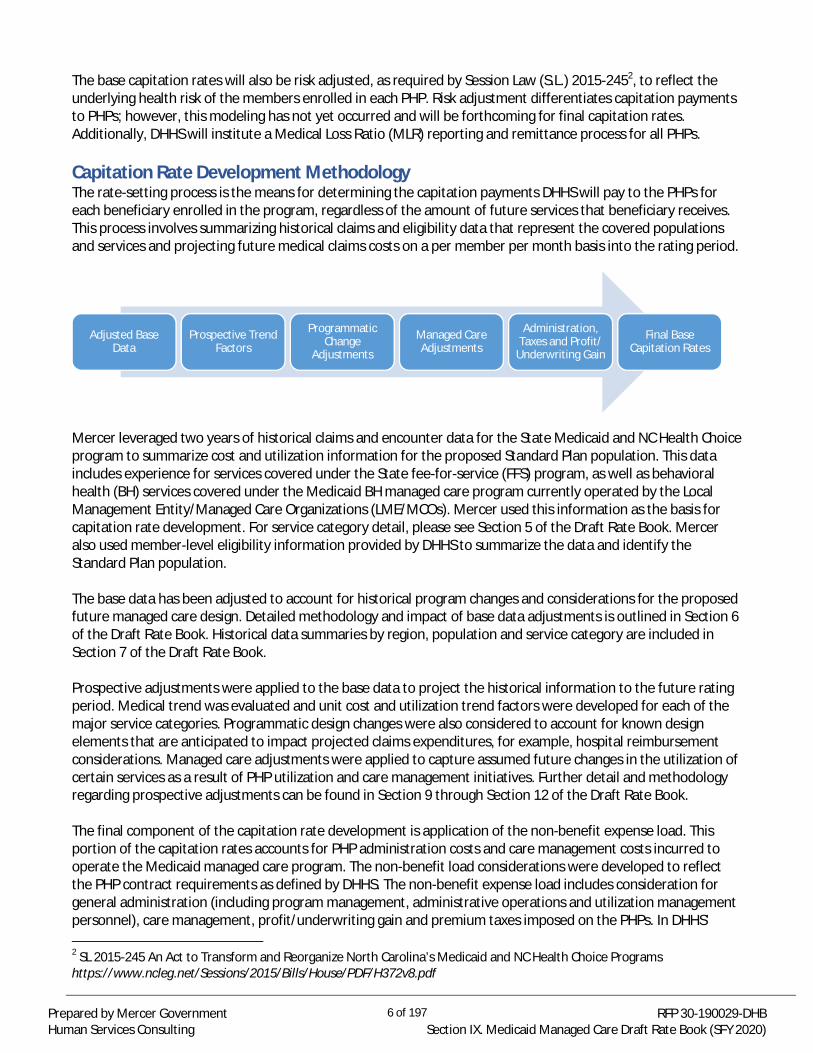
Capitation Rate Development MethodologyThe rate-setting process is the means for determining the capitation payments DHHS will pay to the PHPs foreach beneficiary enrolled in the program, regardless of the amount of future services that beneficiary receives.This process involves summarizing historical claims and eligibility data that represent the covered populationsand services and projecting future medical claims costs on a per member per month basis into the rating period.
Mercer leveraged two years of historical claims and encounter data for the State Medicaid and NC Health Choiceprogram to summarize cost and utilization information for the proposed Standard Plan population. This dataincludes experience for services covered under the State fee-for-service (FFS) program, as well as behavioralhealth (BH) services covered under the Medicaid BH managed care program currently operated by the LocalManagement Entity/Managed Care Organizations (LME/MCOs). Mercer used this information as the basis forcapitation rate development. For service category detail, please see Section 5 of the Draft Rate Book. Merceralso used member-level eligibility information provided by DHHS to summarize the data and identify theStandard Plan population.
The base data has been adjusted to account for historical program changes and considerations for the proposedfuture managed care design. Detailed methodology and impact of base data adjustments is outlined in Section 6of the Draft Rate Book. Historical data summaries by region, population and service category are included inSection 7 of the Draft Rate Book.
Prospective adjustments were applied to the base data to project the historical information to the future ratingperiod. Medical trend was evaluated and unit cost and utilization trend factors were developed for each of themajor service categories. Programmatic design changes were also considered to account for known designelements that are anticipated to impact projected claims expenditures, for example, hospital reimbursementconsiderations. Managed care adjustments were applied to capture assumed future changes in the utilization ofcertain services as a result of PHP utilization and care management initiatives. Further detail and methodologyregarding prospective adjustments can be found in Section 9 through Section 12 of the Draft Rate Book.
The final component of the capitation rate development is application of the non-benefit expense load. Thisportion of the capitation rates accounts for PHP administration costs and care management costs incurred tooperate the Medicaid managed care program. The non-benefit load considerations were developed to reflectthe PHP contract requirements as defined by DHHS. The non-benefit expense load includes consideration forgeneral administration (including program management, administrative operations and utilization managementpersonnel), care management, profit/underwriting gain and premium taxes imposed on the PHPs. In DHHS’
2 SL 2015-245 An Act to Transform and Reorganize North Carolina’s Medicaid and NC Health Choice Programshttps://www.ncleg.net/Sessions/2015/Bills/House/PDF/H372v8.pdf
Adjusted BaseData
Prospective TrendFactors
ProgrammaticChange
Adjustments
Managed CareAdjustments
Administration,Taxes and Profit/
Underwriting Gain
Final BaseCapitation Rates
6 of 197Prepared by Mercer GovernmentHuman Services Consulting
RFP 30-190029-DHBSection IX. Medicaid Managed Care Draft Rate Book (SFY 2020)
approach to managed care, care management is foundational to the success of North Carolina’s health caresystem for Medicaid and NC Health Choice beneficiaries, supporting high-quality delivery of the right care at theright place and at the right time in the right setting. Beneficiaries will have access to appropriate caremanagement and coordination support across multiple settings of care, including a strong basis in primary careand connections to specialty care and community-based resources. Access to local care management will drawfrom the Advanced Medical Home (AMH) model and participation from the Local Health Departments;additionally, DHHS is committed to providing care management for beneficiaries to address the four prioritydomains of opportunities for health: housing, food, transportation, and interpersonal safety. Mercer has alignedthe care management modeling with DHHS care management strategy. Section 13 of the Draft Rate Bookprovides additional information on the non-benefit expense considerations.
Outstanding Rate ConsiderationsThe capitation rates put forth in the Draft Rate Book are subject to change. Due to the timing of legislativechanges made during the 2018 legislative session, the draft rates contained herein do not reflect the mostrecent legislation. The following items have not yet been reflected in the capitation rates; impact of these itemson the capitation rates will be evaluated and reflected in the final rate development.
· PHP Contract Period – The draft capitation rates have been developed assuming a 12-month contractperiod of July 1, 2019 through June 30, 2020. The PHP RFP indicates that the Standard Plan Contractswill begin November 1, 2019. Additionally, S.L. 2018-493 allows DHHS to phase-in populations by regionover a five month period. Information on the phase-in schedule will be released after PHP contractaward. As such, the final capitation rates will reflect the appropriate contract period duration, includingan adjustment to the number of trend months applied, and the assumed level of managed care savingsto be achieved in Contract Year 1 of the program. The Department intends to have the rate period endon June 30, 2020 to align the future rate periods with the state fiscal year.
· Base Data – The base data underlying the draft capitation rates reflects July 1, 2015 – June 30, 2017claims experience and eligibility information. This base data will be updated to include more recentinformation and reflect July 1, 2016 – June 30, 2018 experience for purposes of final rate development.
· BH and Intellectual/Developmental Disability (BH I/DD) Tailored Plan Populations — Per S.L. 2018-484,the BH I/DD Tailored Plan will be implemented one year following the first contracts for the StandardPlan benefit. Prior to implementation of the BH I/DD Tailored Plan, beneficiaries meeting BH I/DDTailored Plan eligibility criteria will be defaulted into their current delivery system (FFS and LME/MCOfor most beneficiaries), and have the option to enroll in a Standard Plan. The draft capitation ratesassume eligibility for BH I/DD Tailored Plans based on criteria proposed by DHHS in the Fall of 2018. S.L.2018-48 includes additional eligibility criteria not reflected in the draft capitation rates. Additionally, thedraft capitation rates do not account for the potential that a BH I/DD Tailored Plan eligible beneficiarymay choose to enroll in a Standard Plan. Both of these items have a potential cost impact that is not yetreflected in the draft capitation rates.
· Tribal Member Choice — Members of federally recognized tribes will have the choice to enroll in a PHPand will be exempt from mandatory enrollment into managed care. This has a potential cost impact thatis not yet reflected in the draft capitation rates.
· Final Provider Reimbursement Arrangements — The capitation rates reflect adjustments for historicalprovider reimbursement arrangements and historical supplemental payments. To the extent there areexpected reimbursement changes under managed care program design, an impact to the capitationrates will need to be evaluated. This includes potential future fee schedule changes prior to or
3 SL 2018-49/House Bill 156 Medicaid PHP Licensure & Transformation Mods.https://www2.ncleg.net/BillLookUp/2017/h1564 SL 2018-48/House Bill 403 Medicaid and Behavioral Health Modifications.https://www.ncleg.net/Sessions/2017/Bills/House/PDF/H403v6.pdf
7 of 197Prepared by Mercer GovernmentHuman Services Consulting
RFP 30-190029-DHBSection IX. Medicaid Managed Care Draft Rate Book (SFY 2020)

concurrent with managed care implementation, provider rate floors, and reimbursement requirementsfor hospitals and Federally Qualified Health Centers and Rural Health Clinics.
· Extended Coverage for Services Delivered in an Institution for Mental Disease (IMD) — It is anticipatedthat this provision will have minimal impact to the Standard Plan member costs; however, this willcontinue to be evaluated for final rate development.
· Substance Use Disorder (SUD) Service Array Expansion — The State is working on updates to the SUDservice array, which may require updates to the State Plan. No adjustment is currently reflected in thedraft capitation rates for SUD service array changes.
· Number of PHPs — The non-benefit load rate considerations are dependent upon an assumed numberof PHPs administering the program, and their allocation across the six proposed PHP regions. Themodeling currently reflects four statewide PHPs and four regional provider-led entities (PLEs). Uponcontract award, this assumption will be updated to reflect the actual number of PHPs operatingwithin/across regions.
· AMH Tier 3 Beneficiaries — Currently, the draft rates reflect an assumption that 65.0% of beneficiarieswill receive care management through an AMH Tier 3 practice; this assumption will be revisited for finalrate determination.
· Premium Tax — The rates reflect consideration for a premium tax component and regulatory surcharge,which is consistent with the legislative intent included in S.L. 2018-49.
· Health Insurer Provider Fee (HIPF) — The HIPF is considered a cost of doing business that is appropriateto recognize in the payments to PHPs. Currently, there is a moratorium on the HIPF for premiumsearned in 2018 and uncertainty with respect to the applicability of the HIPF in the future, so at this pointthe draft rates do not reflect consideration for the HIPF.
· Performance Withholds — DHHS plans to include a performance-based incentive system financedthrough a withhold as part of the program design. Per S.L. 2018-49, the withhold program will not beginuntil at least 18 months after managed care implementation.
· Optical Services – This Draft Rate Book reflects the removal of optical services including services foreyeglasses frames, lenses, lens treatment, fabrication and fittings. Should additional legislation not beput forth, an adjustment to the draft capitation rates will be made to include the costs associated witheyeglass fittings.
· Fraud, Waste, and Abuse Recoveries – The base data reflected in this Draft Rate Book does not includean adjustment for recoveries collected for fraud, waste, and abuse. Mercer is working with DHHS toobtain more detailed information on these recoveries for Medicaid and NC Health Choice beneficiariesunder the FFS program to evaluate potential impact to the Standard Plan.
Mercer and DHHS have agreed to reevaluate the appropriateness of the capitation rates using more recentclaims and encounter experience before managed care implementation, along with considering applicablechanges to legislation, regulation, state plan, waivers, federal guidance or policy decisions that may not havebeen reflected in draft rates. As such, the capitation rates will be finalized at a later point in time, and thebase data, adjustments and capitation rates reflected in the Draft Rate Book are considered draft and aresubject to change.
8 of 197Prepared by Mercer GovernmentHuman Services Consulting
RFP 30-190029-DHBSection IX. Medicaid Managed Care Draft Rate Book (SFY 2020)
1 INTRODUCTIONMercer Government Human Services Consulting (Mercer), part of Mercer Health & Benefits LLC, has producedthis Draft Rate Book for the State of North Carolina (State) Department of Health and Human Services (DHHS) asdocumentation of the development of the draft capitation rates effective in Contract Year 1 of managed care(assumed July 1, 2019 through June 30, 2020) for the Standard Plan population. Following initial implementationof managed care and the rollout to the Standard Plan population, additional populations will be phased-in over afive year period, as proposed by DHHS. However, detailed cost and utilization information for these populationsis outside of the scope of this Draft Rate Book.
As a part of capitation rate development for the Standard Plan population, Mercer leveraged claims andencounter data for the State Medicaid and NC Health Choice programs to summarize cost and utilizationinformation for the Standard Plan population. This data includes experience for services covered under the Statefee-for-service (FFS) program, as well as behavioral health (BH) services covered under the Medicaid BHmanaged care program currently operated by the Local Management Entity/Managed Care Organizations(LME/MCOs). Mercer used this information as the basis for capitation rate development.
The intent of the Draft Rate Book is to summarize historical data and outline key prospective rate considerationsfor the Standard Plan population for purposes of providing transparency into the current program costs andutilization along with insight into the rate development process for potential Prepaid Health Plans (PHPs) andother interested stakeholders. The Draft Rate Book includes information on the cost and utilization patterns ofMedicaid and NC Health Choice eligibles by region, rate cell and category of service (COS). Sections 2 through 7provide information on the data summarization process including an outline of population and service groups,adjustments applied to the base data, and detailed summaries by region, rate cell and COS.
Additionally, the Draft Rate Book outlines key components of the capitation rate development process, includinginformation on specific prospective adjustments along with non-benefit cost considerations. Sections 8 through14 provide information on the key steps of the rate development process, details on trend, programmaticconsiderations, managed care adjustments and non-benefit load assumptions, with detailed rate developmentsummaries by region, rate cell and COS.
Finally, Section 15 provides details on other considerations for rate development and potential adjustments thatmay be forthcoming between the draft rates outlined in this Draft Rate Book and the final capitation rates forthe implementation of managed care.
The users of this Draft Rate Book are cautioned against relying solely on the data contained herein. DHHS andMercer provide no guarantee, either written or implied, that this book is 100% accurate or error-free.Additionally, it is important to note that information contained in this Draft Rate Book is considered draft.Mercer and DHHS have agreed to reevaluate the appropriateness of the capitation rates using more recentclaims and encounter experience before managed care implementation, along with considering applicablechanges to legislation, regulation, state plan, waivers, federal guidance or policy decisions that may not havebeen reflected in draft rates. Refer to Section 15 for examples of such items that may require adjustments tofinal rates. As such, the content of this Draft Rate Book and final capitation rates are subject to changepending updated base experience, possible adjustments not included in draft rates, additional guidance fromDHHS on policy determination, and/or final program design elements currently pending legislation.
9 of 197Prepared by Mercer GovernmentHuman Services Consulting
RFP 30-190029-DHBSection IX. Medicaid Managed Care Draft Rate Book (SFY 2020)

2 DATA SOURCESMercer used the FFS claims data from the DHHS Medicaid management information system, NC Tracks, whichwas provided by DHHS, and the BH encounter data provided to Mercer directly from the LME/MCOs to form thebase data. This data is summarized on a date of service (incurred) basis and includes actual experience from July1, 2015 through June 30, 2017 paid through September 30, 2017. For the base data development, this data issummarized by state fiscal year (SFY) 2016 (July 1, 2015 through June 30, 2016) and SFY 2017 (July 1, 2016through June 30, 2017).
As a part of the data summarization process, Mercer also analyzed eligibility information from the memberextract file provided by DHHS in October 2017. Eligibility information was used to categorize recipient-levelclaims experience into the populations outlined in Section 4. This information was also used to summarize themember month (MM) information reflected in various summaries throughout the Draft Rate Book.
Mercer also leveraged other data sources supplied by DHHS to calculate specific data adjustments outlined inSection 6, such as:
· State Medicaid monthly enrollment counts· Member-level information from the North Carolina Families Accessing Services through Technology (NC
FAST) system related to member retroactive eligibility and/or application period· Information provided by DHHS on historical Graduate Medical Expense (GME) expenditures· Non-Emergency Medical Transportation (NEMT) payments made outside of the FFS claims system· Third Party Liability (TPL) monthly costs and, where available, member-level information for Medicaid
participants· Fraud, waste and abuse recovery information for payments collected specific to the Medicaid and NC
Health Choice population· LME/MCO data adjustment information leveraged from the BH LME/MCO rate-setting process
For final capitation rate development, the base data will be updated to reflect more recent experience and willinclude SFY 2017 and SFY 2018 (July 1, 2017 through June 30, 2018) data.
The users of this Draft Rate Book are cautioned that direct comparisons cannot be made between theinformation in the data summaries and raw claims data. The data received was summarized on a date ofservice (incurred) basis, and Mercer applied additional adjustments to the summarized raw data. Mercer hasused and relied upon eligibility, claims, encounter and supplemental data and information supplied by bothDHHS and the LME/MCOs. Aforementioned parties are solely responsible for the validity and completeness ofthese supplied data and information. Mercer has reviewed the summarized data in compliance with theActuarial Standard of Practice (ASOP) on data quality (ASOP 23), which included checks for: completeness ofdata, accuracy of the data and consistency of data across data sources and years, including comparisons of BHencounter data to financial reports provided by the LME/MCOs. However, Mercer did not perform a completeaudit.
10 of 197Prepared by Mercer GovernmentHuman Services Consulting
RFP 30-190029-DHBSection IX. Medicaid Managed Care Draft Rate Book (SFY 2020)
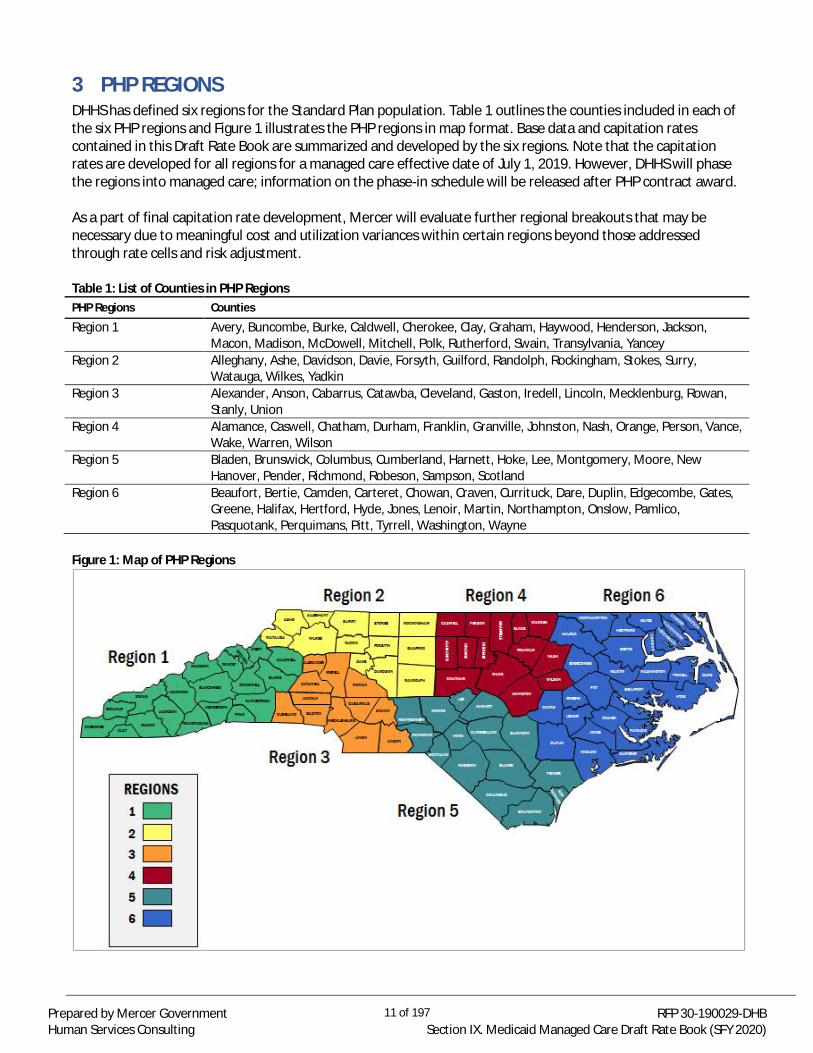
3 PHP REGIONSDHHS has defined six regions for the Standard Plan population. Table 1 outlines the counties included in each ofthe six PHP regions and Figure 1 illustrates the PHP regions in map format. Base data and capitation ratescontained in this Draft Rate Book are summarized and developed by the six regions. Note that the capitationrates are developed for all regions for a managed care effective date of July 1, 2019. However, DHHS will phasethe regions into managed care; information on the phase-in schedule will be released after PHP contract award.
As a part of final capitation rate development, Mercer will evaluate further regional breakouts that may benecessary due to meaningful cost and utilization variances within certain regions beyond those addressedthrough rate cells and risk adjustment.
Table 1: List of Counties in PHP RegionsPHP Regions Counties
Region 1 Avery, Buncombe, Burke, Caldwell, Cherokee, Clay, Graham, Haywood, Henderson, Jackson,Macon, Madison, McDowell, Mitchell, Polk, Rutherford, Swain, Transylvania, Yancey
Region 2 Alleghany, Ashe, Davidson, Davie, Forsyth, Guilford, Randolph, Rockingham, Stokes, Surry,Watauga, Wilkes, Yadkin
Region 3 Alexander, Anson, Cabarrus, Catawba, Cleveland, Gaston, Iredell, Lincoln, Mecklenburg, Rowan,Stanly, Union
Region 4 Alamance, Caswell, Chatham, Durham, Franklin, Granville, Johnston, Nash, Orange, Person, Vance,Wake, Warren, Wilson
Region 5 Bladen, Brunswick, Columbus, Cumberland, Harnett, Hoke, Lee, Montgomery, Moore, NewHanover, Pender, Richmond, Robeson, Sampson, Scotland
Region 6 Beaufort, Bertie, Camden, Carteret, Chowan, Craven, Currituck, Dare, Duplin, Edgecombe, Gates,Greene, Halifax, Hertford, Hyde, Jones, Lenoir, Martin, Northampton, Onslow, Pamlico,Pasquotank, Perquimans, Pitt, Tyrrell, Washington, Wayne
Figure 1: Map of PHP Regions
11 of 197Prepared by Mercer GovernmentHuman Services Consulting
RFP 30-190029-DHBSection IX. Medicaid Managed Care Draft Rate Book (SFY 2020)
4 POPULATION GROUPINGSDHHS will reimburse PHPs using full-risk capitation payments for eligible populations. Mercer determined ratecells for the Standard Plan population to account for material cost differences amongst populations. Since themanaged care population will have choice of PHPs, the rate cell structure is intended to differentiate paymentsto PHPs where disproportionate enrollment of certain populations may occur. However, since the State haschosen to risk adjust the capitation rates, fewer rate cells are necessary since a risk adjustment model accountsfor much of the age/gender risk within a population and differentiates payments to PHPs based on their enrolledpopulation risk profile. Alongside the monthly per member capitation rates, DHHS will make a one-timeMaternity Event payment that will cover prenatal, delivery and postpartum care for the mother. The final ratecell structure for the Standard Plan population is outlined in Section 4.1.
While the base data and rate development outlined in this Draft Rate Book is specific to the Standard Planpopulation, identification logic for future managed care populations and permanently excluded populations isoutlined in Sections 4.2 and 4.3, respectively.
Standard Plan Population4.1The information summarized in this Draft Rate Book is specific to the Standard Plan population, including bothMedicaid and NC Health Choice beneficiaries. As outlined, initial program implementation would enroll all non-dual beneficiaries into the Standard Plan who are otherwise not eligible for the BH andIntellectual/Developmental Disability (BH I/DD) Tailored Plan or fall into another excluded or delayed populationas proposed by DHHS5.
Based on a review of the Standard Plan population membership levels and cost variances by population,historical cost/utilization experience and rates for the Standard Plan population are summarized and developedfor the following rate cells. Please see Appendix C for an overview of the rate cell determination process.
· Aged, Blind, Disabled (ABD), all ages· Temporary Assistance for Needy Families (TANF) and Other Related Children (ages <1)· TANF and Other Related Children (ages 1–20)· TANF and Other Related Adults (ages 21+)· Maternity Event, all ages
The table below outlines the logic used to summarize the broader categories of aid (COA) for the Standard Planpopulation; this includes information on detailed eligibility codes and sub-population groups.
Table 2: Standard Plan Population Criteria6
COA Detailed Population Group Program Aid Code/Eligibility Code
ABD Aged MAABN, MAACY, MAAMN , MAANN, MAAQN, MAAQY,SAABN, SAACN, SAACY, SAAQN, SAAQY
Blind MABBN, MABCY, MABMN, MABNN, MABQN, MABQY
Disabled MADBN, MADCY, MADMN, MADNN, MADQN, MADQY,SADBN, SADCN, SADCY, SADQN, SADQY
5 Information on proposed program design can be found in the Policy Papers published by DHHS:https://www.ncdhhs.gov/concept-papers6 For specific program eligibility requirements, refer to the NC Basic Medicaid Income Eligibility Chart(https://files.nc.gov/ncdma/documents/files/BASIC_MEDICAID_INCOME_ELIGIBLITY_CHART_2017_03_10.pdf).
12 of 197Prepared by Mercer GovernmentHuman Services Consulting
RFP 30-190029-DHBSection IX. Medicaid Managed Care Draft Rate Book (SFY 2020)

COA Detailed Population Group Program Aid Code/Eligibility Code
TANF and OtherRelatedChildren/Adults
Aid to Families with Dependent Children AAFCN, AAFCY
Other Children MAFCN, MAFMN, MAFNN
Pregnant Women MPWNN
Infants and Children MICNN
Breast and Cervical Cancer (BCC) MAFWN
Legal Aliens (Full Medicaid) Eligibility codes with a fourth character of G, P, I or T
NC Health Choice MICAN, MICJN, MICKN, MICSN
NC Health Choice — Extended Coverage7 MICLN
Medicaid-Children's Health InsuranceProgram (M-CHIP)
MIC1N
Maternity Event N/A Cost summarized for pregnancy-related services forbeneficiaries with a live birth event. The live birth event isidentified by Current Procedural Terminology (CPT) codesor Diagnosis-Related Groups (DRGs). Prenatal services areincluded 8 whole months prior to the live birth event, andpostpartum services are included 2 whole months followingthe live birth event. Please see Appendix A for the detailedlogic used to identify these pregnancy-related services.
Members of federally recognized tribes are eligible to participate in managed care but are not required to enrollin PHPs. Members may voluntarily enroll in PHPs on an opt-in basis and may dis-enroll without cause at anytime. For purposes of draft capitation rates, cost and utilization associated with members of federally recognizedtribes have not been separately identified nor excluded for purposes of base data development. Mercer isworking with DHHS to evaluate the impact of cost and enrollment considerations for this population; please seeSection 15.1.1 for more information on this population.
Members of the Standard Plan population and the future BH I/DD Tailored Plan population will have the abilityto shift between plans under specific circumstances under managed care. Given the cost profile of thesemembers, this could have implications on the capitation rates. No considerations have been made in the draftrates for any shifting expectation at this point. Mercer and DHHS will continue to discuss this issue and mayincorporate consideration into risk adjustment or an adjustment into final rate development. Please refer toAppendix F for more detail on potential cost implications for this group.
Future Managed Care Populations4.2Following initial implementation of managed care and the rollout to the Standard Plan population, additionalpopulations will be phased-in over a five-year period, pursuant to Session Law (S.L.) 2015-2458, as amended. Thetable below outlines the treatment of each of these population cohorts for Contract Year 1. As mentioned,detailed cost and utilization information for populations other than the Standard Plan population is outside thescope of this Draft Rate Book.
7 NC Health Choice extended coverage is optional coverage for beneficiaries at 211%-225% Federal Poverty Level (FPL);beneficiaries may remain on NC Health Choice for a period not to exceed one year (NC DHHS On-Line Manual,https://www2.ncdhhs.gov/info/olm/manuals/dma/fcm/man/MA3255-05.htm).8 SL 2015-245 An Act to Transform and Reorganize North Carolina’s Medicaid and NC Health Choice Programshttps://www.ncleg.net/Sessions/2015/Bills/House/PDF/H372v8.pdf
13 of 197Prepared by Mercer GovernmentHuman Services Consulting
RFP 30-190029-DHBSection IX. Medicaid Managed Care Draft Rate Book (SFY 2020)
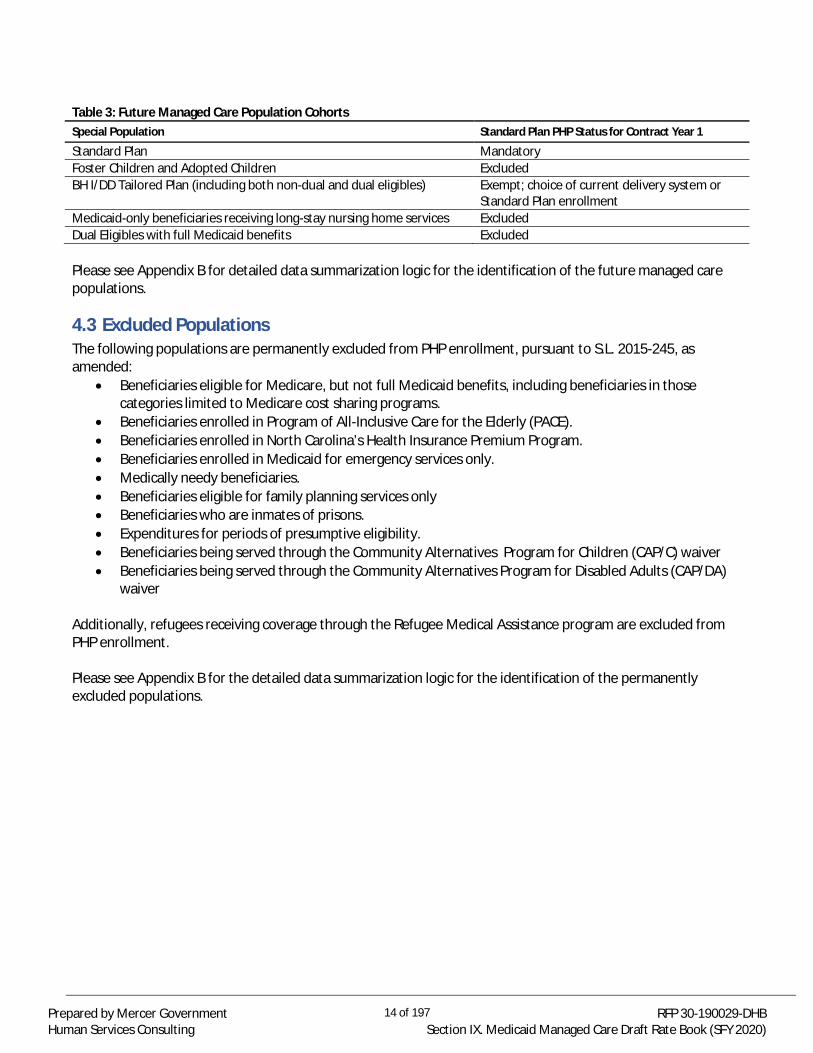
Table 3: Future Managed Care Population CohortsSpecial Population Standard Plan PHP Status for Contract Year 1
Standard Plan MandatoryFoster Children and Adopted Children ExcludedBH I/DD Tailored Plan (including both non-dual and dual eligibles) Exempt; choice of current delivery system or
Standard Plan enrollmentMedicaid-only beneficiaries receiving long-stay nursing home services ExcludedDual Eligibles with full Medicaid benefits Excluded
Please see Appendix B for detailed data summarization logic for the identification of the future managed carepopulations.
Excluded Populations4.3The following populations are permanently excluded from PHP enrollment, pursuant to S.L. 2015-245, asamended:
· Beneficiaries eligible for Medicare, but not full Medicaid benefits, including beneficiaries in thosecategories limited to Medicare cost sharing programs.
· Beneficiaries enrolled in Program of All-Inclusive Care for the Elderly (PACE).· Beneficiaries enrolled in North Carolina’s Health Insurance Premium Program.· Beneficiaries enrolled in Medicaid for emergency services only.· Medically needy beneficiaries.· Beneficiaries eligible for family planning services only· Beneficiaries who are inmates of prisons.· Expenditures for periods of presumptive eligibility.· Beneficiaries being served through the Community Alternatives Program for Children (CAP/C) waiver· Beneficiaries being served through the Community Alternatives Program for Disabled Adults (CAP/DA)
waiver
Additionally, refugees receiving coverage through the Refugee Medical Assistance program are excluded fromPHP enrollment.
Please see Appendix B for the detailed data summarization logic for the identification of the permanentlyexcluded populations.
14 of 197Prepared by Mercer GovernmentHuman Services Consulting
RFP 30-190029-DHBSection IX. Medicaid Managed Care Draft Rate Book (SFY 2020)

5 SERVICE CATEGORIESDHHS will reimburse PHPs using full-risk capitation payments for eligible services. Mercer has summarized thecost and utilization information from the historical FFS data and the LME/MCO encounter data into major COS.
The table below shows how the detailed service categories covered by the Standard Plans were grouped forpurposes of this report and the exhibits in Section 7. Please refer to the Request for Proposal (RFP) for details onthe covered and excluded services for the Standard Plan population.
Table 4: Standard Plan COS GroupingsCOS Grouping FFS Data Detailed COS Encounter Data Detailed COS Unit Type
Inpatient — Physical Health(PH)
Inpatient N/A Days
Inpatient — BH N/A Inpatient Days
Outpatient Hospital Outpatient N/A Visits
Emergency Room Emergency Room Emergency Room Visits
Physician Physician N/A Visits
Federally Qualified HealthCenter (FQHC)/Rural HealthClinic (RHC)
FQHCRHC
N/A Visits
Other Clinic Free-standing ClinicsHealth Check — Health DepartmentFamily Planning Services
N/A Visits
Other Practitioner ChiropracticPodiatry
N/A Visits
Therapies Physical TherapySpeech TherapyOccupational Therapy
N/A Visits
Prescribed Drugs Prescribed Drugs N/A Scripts
Other BH Services Mental Health services for non-LME/MCO population (Ages 0–3 andNC Health Choice)
Crisis ServicesOutpatient (includingpsychotherapy andalcohol/drug services)Partial Hospitalization
Procedure Count
Long Term Services andSupports (LTSS) Services
Home HealthHospiceNursing HomePersonal Care
N/A Procedure Count
Durable Medical Equipment Durable Medical Equipment N/A Procedure Count
Lab and X-Ray9 Lab and X-Ray N/A Procedure Count
Optical Optical, excluding costs foreyeglasses frames, lenses, lenstreatments, fabrication and fittings
N/A Procedure Count
9 To support the data summarization process eviCore (previously MedSolutions) capitation payments for lab and radiologyservices were removed in order to not duplicate actual cost and utilization reflected in the FFS data.
15 of 197Prepared by Mercer GovernmentHuman Services Consulting
RFP 30-190029-DHBSection IX. Medicaid Managed Care Draft Rate Book (SFY 2020)

COS Grouping FFS Data Detailed COS Encounter Data Detailed COS Unit Type
Limited Dental Services10 Into the Mouth of Babes program N/A Procedure Count
Transportation AmbulanceNEMT
N/A Claim Count
Medical Home Payments Historical payments made topractices in Carolina ACCESS (CA)program (practices in CA I receivefees of $1.00 per member permonth [PMPM] and practices in CA IIreceive fees of $2.50 or $5.00PMPM)
N/A Claim Count
Obstetric Care Management(OBCM) Payments
OBCM Payments N/A Claim Count
Care Coordination for Children(CC4C) Payments
CC4C Payments N/A Claim Count
Note that there are additional covered services specific to populations that will phase into managed care afterContract Year 1. Specifically, there are services unique to the BH I/DD Tailored Plan population and individualsenrolled in a 1915(c) waiver. See below for a list of covered services for the delayed populations that areassumed to not be covered under Standard Plans for purposes of these draft rates.
· The following Medicaid COS are proposed to be covered under the LME/MCOs and subsequently BHI/DD Tailored Plan, and not the Standard Plans:
o 1915(b)(3) Serviceso Innovations Waiver Serviceso Intermediate Care Facility for beneficiaries with I/DDso Traumatic Brain Injury (TBI) Waiver Serviceso Other BH Services
§ Assertive Community Treatment§ Child and Adolescent Day Treatment Services§ Community Support Team§ Intensive In-home Services§ Multi-systemic Therapy Services§ Psychiatric Residential Treatment Facilities§ Psychosocial Rehabilitation§ Residential Treatment Facility Services§ Substance Abuse Medically Monitored Residential Treatment§ Substance Abuse Non-medical Community Residential Treatment
· The following COS are covered for the LTSS 1915(c) waiver populations, and thus excluded fromStandard Plans in Contract Year 1:
o CAP/C Waiver Serviceso CAP/DA Waiver Services
Covered services that are excluded from PHPs, and continue under FFS, are summarized below:· Children’s Developmental Services Agencies· Dental services not identified in the COS table above· Local Education Agency
10 Costs associated with oral/maxillofacial surgery and adjunctive general dental services will be covered by PHPs whenbilled as a medical or professional claim; based on the COS mapping logic, these costs are captured in the abovemedical/professional service lines and thus not captured under the ‘Limited Dental Services’ COS.
16 of 197Prepared by Mercer GovernmentHuman Services Consulting
RFP 30-190029-DHBSection IX. Medicaid Managed Care Draft Rate Book (SFY 2020)
· Optical services for eyeglasses frames, lenses, lens treatments, fabrication and fittings are considerednon-covered services in this Rate Book, however this is subject to change pending legislation
As outlined in Table 4, Medical Home and Local Health Department (LHD) OBCM and CC4C PMPM payments areincluded in draft rate development since DHHS is requiring that PHPs continue these payments to thoseproviders. Other historical payments made through Community Care of North Carolina (CCNC) were notincluded in the data summaries in Section 7 (identified as Excluded Patient-Centered Medical Home [PCMH]Payments in Appendix D). These costs were related to monthly per member payments to coordinate andmanage care for members along with payments made to administer the Health Check and Pregnancy MedicalHome (PMH) programs. Additionally, Mercer did not include costs related to case management for HumanImmunodeficiency Virus (HIV) members as consideration for these care management activities is included as anon-benefit component of the rate development process.
Appendix D contains detailed coding logic used to define all detailed categories noted above.
17 of 197Prepared by Mercer GovernmentHuman Services Consulting
RFP 30-190029-DHBSection IX. Medicaid Managed Care Draft Rate Book (SFY 2020)
6 HISTORICAL DATA ANALYSISThis section provides an overview of the adjustments Mercer made to the data sources summarized in thisreport. These adjustments are reflected in the exhibits shown in Section 7.
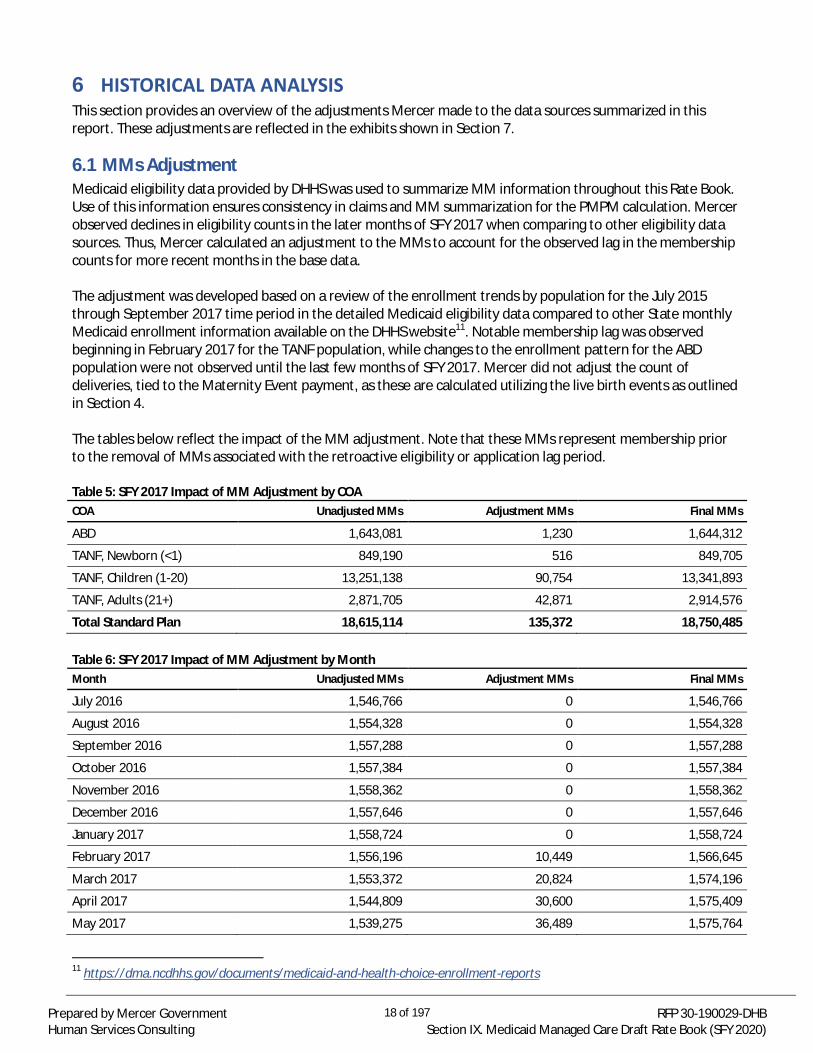
MMs Adjustment6.1Medicaid eligibility data provided by DHHS was used to summarize MM information throughout this Rate Book.Use of this information ensures consistency in claims and MM summarization for the PMPM calculation. Mercerobserved declines in eligibility counts in the later months of SFY 2017 when comparing to other eligibility datasources. Thus, Mercer calculated an adjustment to the MMs to account for the observed lag in the membershipcounts for more recent months in the base data.
The adjustment was developed based on a review of the enrollment trends by population for the July 2015through September 2017 time period in the detailed Medicaid eligibility data compared to other State monthlyMedicaid enrollment information available on the DHHS website11. Notable membership lag was observedbeginning in February 2017 for the TANF population, while changes to the enrollment pattern for the ABDpopulation were not observed until the last few months of SFY 2017. Mercer did not adjust the count ofdeliveries, tied to the Maternity Event payment, as these are calculated utilizing the live birth events as outlinedin Section 4.
The tables below reflect the impact of the MM adjustment. Note that these MMs represent membership priorto the removal of MMs associated with the retroactive eligibility or application lag period.
Table 5: SFY 2017 Impact of MM Adjustment by COACOA Unadjusted MMs Adjustment MMs Final MMs
ABD 1,643,081 1,230 1,644,312
TANF, Newborn (<1) 849,190 516 849,705
TANF, Children (1-20) 13,251,138 90,754 13,341,893
TANF, Adults (21+) 2,871,705 42,871 2,914,576
Total Standard Plan 18,615,114 135,372 18,750,485
Table 6: SFY 2017 Impact of MM Adjustment by MonthMonth Unadjusted MMs Adjustment MMs Final MMs
July 2016 1,546,766 0 1,546,766
August 2016 1,554,328 0 1,554,328
September 2016 1,557,288 0 1,557,288
October 2016 1,557,384 0 1,557,384
November 2016 1,558,362 0 1,558,362
December 2016 1,557,646 0 1,557,646
January 2017 1,558,724 0 1,558,724
February 2017 1,556,196 10,449 1,566,645
March 2017 1,553,372 20,824 1,574,196
April 2017 1,544,809 30,600 1,575,409
May 2017 1,539,275 36,489 1,575,764
11 https://dma.ncdhhs.gov/documents/medicaid-and-health-choice-enrollment-reports
18 of 197Prepared by Mercer GovernmentHuman Services Consulting
RFP 30-190029-DHBSection IX. Medicaid Managed Care Draft Rate Book (SFY 2020)
Month Unadjusted MMs Adjustment MMs Final MMs
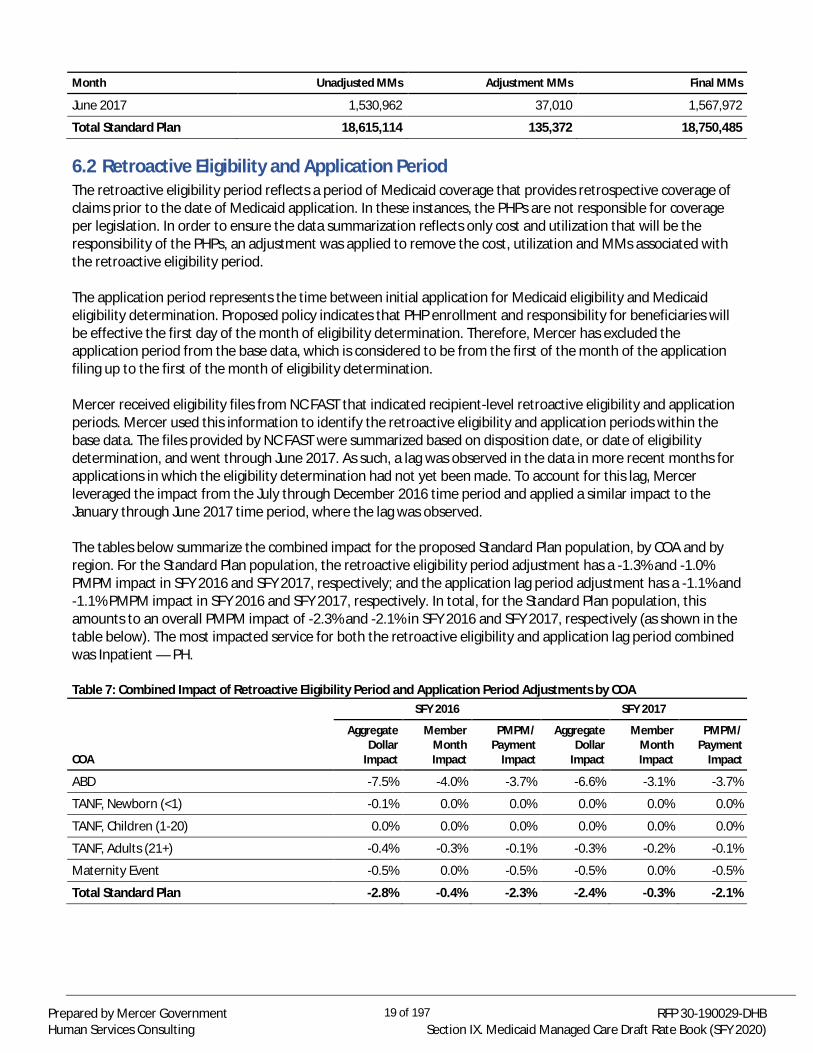
June 2017 1,530,962 37,010 1,567,972
Total Standard Plan 18,615,114 135,372 18,750,485
Retroactive Eligibility and Application Period6.2The retroactive eligibility period reflects a period of Medicaid coverage that provides retrospective coverage ofclaims prior to the date of Medicaid application. In these instances, the PHPs are not responsible for coverageper legislation. In order to ensure the data summarization reflects only cost and utilization that will be theresponsibility of the PHPs, an adjustment was applied to remove the cost, utilization and MMs associated withthe retroactive eligibility period.
The application period represents the time between initial application for Medicaid eligibility and Medicaideligibility determination. Proposed policy indicates that PHP enrollment and responsibility for beneficiaries willbe effective the first day of the month of eligibility determination. Therefore, Mercer has excluded theapplication period from the base data, which is considered to be from the first of the month of the applicationfiling up to the first of the month of eligibility determination.
Mercer received eligibility files from NC FAST that indicated recipient-level retroactive eligibility and applicationperiods. Mercer used this information to identify the retroactive eligibility and application periods within thebase data. The files provided by NC FAST were summarized based on disposition date, or date of eligibilitydetermination, and went through June 2017. As such, a lag was observed in the data in more recent months forapplications in which the eligibility determination had not yet been made. To account for this lag, Mercerleveraged the impact from the July through December 2016 time period and applied a similar impact to theJanuary through June 2017 time period, where the lag was observed.
The tables below summarize the combined impact for the proposed Standard Plan population, by COA and byregion. For the Standard Plan population, the retroactive eligibility period adjustment has a -1.3% and -1.0%PMPM impact in SFY 2016 and SFY 2017, respectively; and the application lag period adjustment has a -1.1% and-1.1% PMPM impact in SFY 2016 and SFY 2017, respectively. In total, for the Standard Plan population, thisamounts to an overall PMPM impact of -2.3% and -2.1% in SFY 2016 and SFY 2017, respectively (as shown in thetable below). The most impacted service for both the retroactive eligibility and application lag period combinedwas Inpatient — PH.
Table 7: Combined Impact of Retroactive Eligibility Period and Application Period Adjustments by COASFY 2016 SFY 2017
COA
AggregateDollar
Impact
MemberMonthImpact
PMPM/Payment
Impact
AggregateDollar
Impact
MemberMonthImpact
PMPM/Payment
Impact
ABD -7.5% -4.0% -3.7% -6.6% -3.1% -3.7%
TANF, Newborn (<1) -0.1% 0.0% 0.0% 0.0% 0.0% 0.0%
TANF, Children (1-20) 0.0% 0.0% 0.0% 0.0% 0.0% 0.0%
TANF, Adults (21+) -0.4% -0.3% -0.1% -0.3% -0.2% -0.1%
Maternity Event -0.5% 0.0% -0.5% -0.5% 0.0% -0.5%
Total Standard Plan -2.8% -0.4% -2.3% -2.4% -0.3% -2.1%
19 of 197Prepared by Mercer GovernmentHuman Services Consulting
RFP 30-190029-DHBSection IX. Medicaid Managed Care Draft Rate Book (SFY 2020)

Table 8: Combined Impact of Retroactive Eligibility Period and Application Period Adjustments by RegionSFY 2016 SFY 2017
Region
AggregateDollar
Impact
MemberMonthImpact
PMPM/Payment
Impact
AggregateDollar
Impact
MemberMonthImpact
PMPM/Payment
Impact
Region 1 -3.0% -0.6% -2.5% -2.5% -0.4% -2.2%
Region 2 -2.8% -0.4% -2.3% -2.4% -0.3% -2.1%
Region 3 -2.7% -0.4% -2.4% -2.2% -0.3% -1.9%
Region 4 -2.8% -0.4% -2.4% -2.3% -0.3% -2.0%
Region 5 -2.6% -0.4% -2.2% -2.4% -0.3% -2.1%
Region 6 -2.8% -0.4% -2.3% -2.5% -0.4% -2.2%
Total Standard Plan -2.8% -0.4% -2.3% -2.4% -0.3% -2.1%
Completion Factors6.3The summarized data include claims for dates of service for SFY 2016 and SFY 2017. Mercer developedcompletion factors to estimate incurred-but-not-reported (IBNR) claims (those claims not yet adjudicated). TheFFS data and the LME/MCO encounter data reflect payments through September 2017. The following factors areapplied to both dollars and utilization.
Table 9: Completion Factors
COS
Data Factors
SFY 2016 SFY 2017
Inpatient — PH 1.008 1.065
Inpatient — BH 1.001 1.047
Outpatient Hospital 1.000 1.023
Emergency Room 1.000 1.026
Physician 1.001 1.030
FQHC/RHC 1.001 1.030
Other Clinic 1.001 1.029
Other Practitioner 1.001 1.030
Therapies 1.001 1.032
Prescribed Drugs 1.000 1.001
Other BH Services 1.001 1.010
LTSS Services 1.000 1.012
Durable Medical Equipment 1.000 1.026
Lab and X-Ray 1.000 1.026
Optical 1.000 1.024
Limited Dental Services 1.000 1.026
Transportation 1.000 1.051
Medical Home Payments 1.000 1.021
OCBM Payments 1.000 1.000
CC4C Payments 1.000 1.000
Total Standard Plan 1.001 1.024
20 of 197Prepared by Mercer GovernmentHuman Services Consulting
RFP 30-190029-DHBSection IX. Medicaid Managed Care Draft Rate Book (SFY 2020)
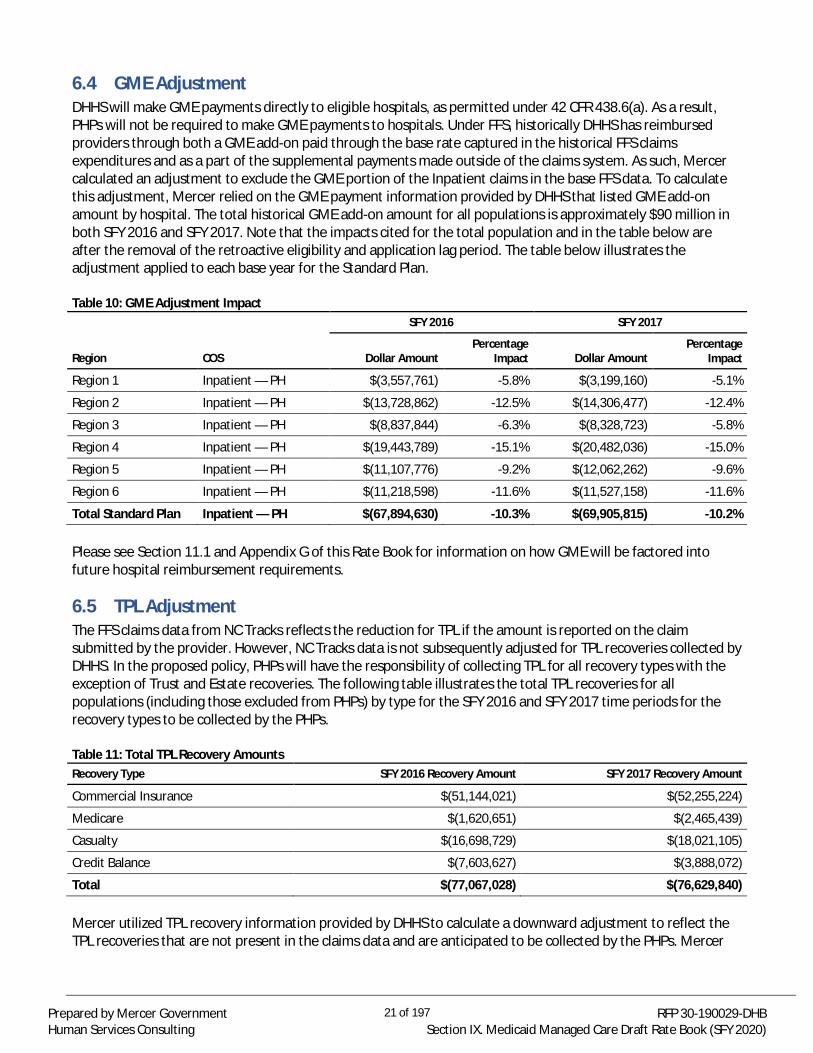
GME Adjustment6.4DHHS will make GME payments directly to eligible hospitals, as permitted under 42 CFR 438.6(a). As a result,PHPs will not be required to make GME payments to hospitals. Under FFS, historically DHHS has reimbursedproviders through both a GME add-on paid through the base rate captured in the historical FFS claimsexpenditures and as a part of the supplemental payments made outside of the claims system. As such, Mercercalculated an adjustment to exclude the GME portion of the Inpatient claims in the base FFS data. To calculatethis adjustment, Mercer relied on the GME payment information provided by DHHS that listed GME add-onamount by hospital. The total historical GME add-on amount for all populations is approximately $90 million inboth SFY 2016 and SFY 2017. Note that the impacts cited for the total population and in the table below areafter the removal of the retroactive eligibility and application lag period. The table below illustrates theadjustment applied to each base year for the Standard Plan.
Table 10: GME Adjustment Impact
Region COS
SFY 2016 SFY 2017
Dollar AmountPercentage
Impact Dollar AmountPercentage
Impact
Region 1 Inpatient — PH $(3,557,761) -5.8% $(3,199,160) -5.1%
Region 2 Inpatient — PH $(13,728,862) -12.5% $(14,306,477) -12.4%
Region 3 Inpatient — PH $(8,837,844) -6.3% $(8,328,723) -5.8%
Region 4 Inpatient — PH $(19,443,789) -15.1% $(20,482,036) -15.0%
Region 5 Inpatient — PH $(11,107,776) -9.2% $(12,062,262) -9.6%
Region 6 Inpatient — PH $(11,218,598) -11.6% $(11,527,158) -11.6%
Total Standard Plan Inpatient — PH $(67,894,630) -10.3% $(69,905,815) -10.2%
Please see Section 11.1 and Appendix G of this Rate Book for information on how GME will be factored intofuture hospital reimbursement requirements.
TPL Adjustment6.5The FFS claims data from NC Tracks reflects the reduction for TPL if the amount is reported on the claimsubmitted by the provider. However, NC Tracks data is not subsequently adjusted for TPL recoveries collected byDHHS. In the proposed policy, PHPs will have the responsibility of collecting TPL for all recovery types with theexception of Trust and Estate recoveries. The following table illustrates the total TPL recoveries for allpopulations (including those excluded from PHPs) by type for the SFY 2016 and SFY 2017 time periods for therecovery types to be collected by the PHPs.
Table 11: Total TPL Recovery AmountsRecovery Type SFY 2016 Recovery Amount SFY 2017 Recovery Amount
Commercial Insurance $(51,144,021) $(52,255,224)
Medicare $(1,620,651) $(2,465,439)
Casualty $(16,698,729) $(18,021,105)
Credit Balance $(7,603,627) $(3,888,072)
Total $(77,067,028) $(76,629,840)
Mercer utilized TPL recovery information provided by DHHS to calculate a downward adjustment to reflect theTPL recoveries that are not present in the claims data and are anticipated to be collected by the PHPs. Mercer
21 of 197Prepared by Mercer GovernmentHuman Services Consulting
RFP 30-190029-DHBSection IX. Medicaid Managed Care Draft Rate Book (SFY 2020)
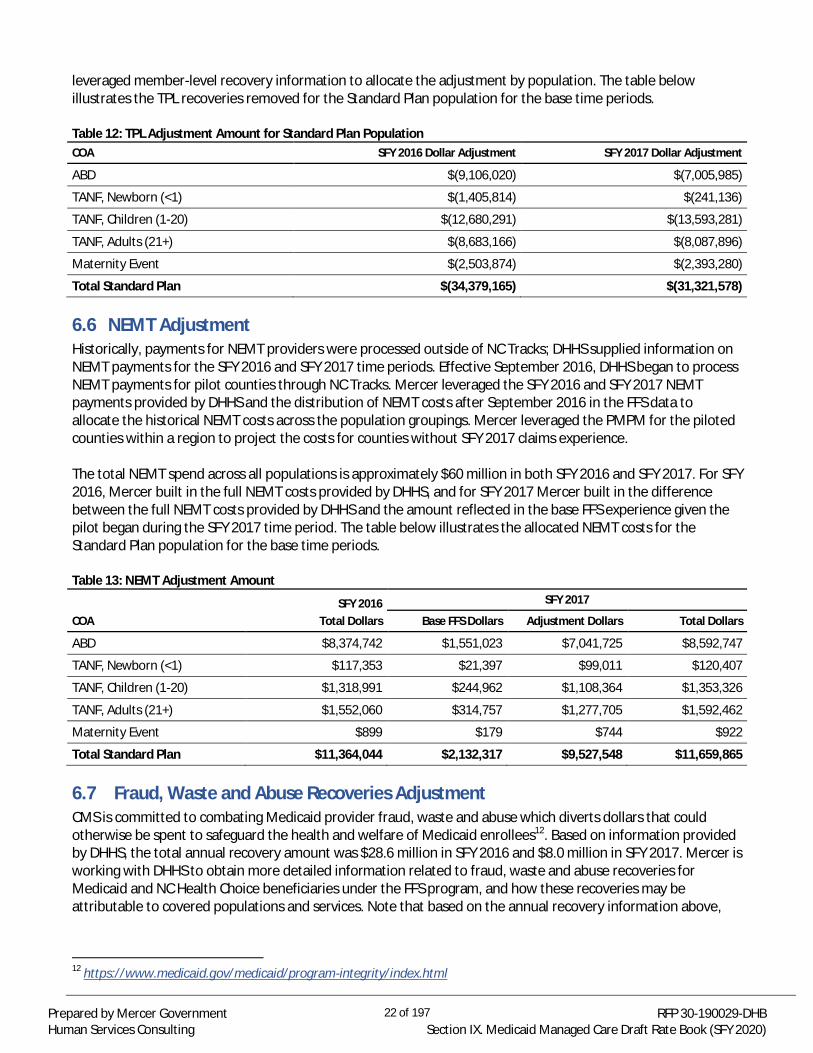
leveraged member-level recovery information to allocate the adjustment by population. The table belowillustrates the TPL recoveries removed for the Standard Plan population for the base time periods.
Table 12: TPL Adjustment Amount for Standard Plan PopulationCOA SFY 2016 Dollar Adjustment SFY 2017 Dollar Adjustment
ABD $(9,106,020) $(7,005,985)
TANF, Newborn (<1) $(1,405,814) $(241,136)
TANF, Children (1-20) $(12,680,291) $(13,593,281)
TANF, Adults (21+) $(8,683,166) $(8,087,896)
Maternity Event $(2,503,874) $(2,393,280)
Total Standard Plan $(34,379,165) $(31,321,578)
NEMT Adjustment6.6Historically, payments for NEMT providers were processed outside of NC Tracks; DHHS supplied information onNEMT payments for the SFY 2016 and SFY 2017 time periods. Effective September 2016, DHHS began to processNEMT payments for pilot counties through NC Tracks. Mercer leveraged the SFY 2016 and SFY 2017 NEMTpayments provided by DHHS and the distribution of NEMT costs after September 2016 in the FFS data toallocate the historical NEMT costs across the population groupings. Mercer leveraged the PMPM for the pilotedcounties within a region to project the costs for counties without SFY 2017 claims experience.
The total NEMT spend across all populations is approximately $60 million in both SFY 2016 and SFY 2017. For SFY2016, Mercer built in the full NEMT costs provided by DHHS, and for SFY 2017 Mercer built in the differencebetween the full NEMT costs provided by DHHS and the amount reflected in the base FFS experience given thepilot began during the SFY 2017 time period. The table below illustrates the allocated NEMT costs for theStandard Plan population for the base time periods.
Table 13: NEMT Adjustment Amount
COASFY 2016
Total Dollars
SFY 2017
Base FFS Dollars Adjustment Dollars Total Dollars
ABD $8,374,742 $1,551,023 $7,041,725 $8,592,747
TANF, Newborn (<1) $117,353 $21,397 $99,011 $120,407
TANF, Children (1-20) $1,318,991 $244,962 $1,108,364 $1,353,326
TANF, Adults (21+) $1,552,060 $314,757 $1,277,705 $1,592,462
Maternity Event $899 $179 $744 $922
Total Standard Plan $11,364,044 $2,132,317 $9,527,548 $11,659,865
Fraud, Waste and Abuse Recoveries Adjustment6.7CMS is committed to combating Medicaid provider fraud, waste and abuse which diverts dollars that couldotherwise be spent to safeguard the health and welfare of Medicaid enrollees12. Based on information providedby DHHS, the total annual recovery amount was $28.6 million in SFY 2016 and $8.0 million in SFY 2017. Mercer isworking with DHHS to obtain more detailed information related to fraud, waste and abuse recoveries forMedicaid and NC Health Choice beneficiaries under the FFS program, and how these recoveries may beattributable to covered populations and services. Note that based on the annual recovery information above,
12 https://www.medicaid.gov/medicaid/program-integrity/index.html
22 of 197Prepared by Mercer GovernmentHuman Services Consulting
RFP 30-190029-DHBSection IX. Medicaid Managed Care Draft Rate Book (SFY 2020)
this could necessitate up to a 0.6% downward adjustment to the Standard Plan population claims; however, atthis point no adjustment has been applied to the base data.
LME/MCO Data Adjustments6.8The following represents adjustments specific to the LME/MCO encounter data.
6.8.1 Patient Liability AdjustmentIn the North Carolina BH managed care program operated by the LME/MCOs under concurrent 1915(b)/(c)waiver authority, certain beneficiaries receiving services in Intermediate Care Facilities for Individuals withIntellectual and Developmental Disabilities (ICF/IIDs) have patient liability responsibilities through post-eligibilitytreatment of income to contribute to the reimbursement of their services. In the Medicaid FFS program, theICF/IID collects these patient liability payments directly from the beneficiary and submits a FFS claim to Medicaididentifying the collected patient liability and the remaining expense eligible for Medicaid reimbursement.
Under the LME/MCO BH managed care program, DHHS has been following a similar transactional process,where the ICF/IID continues to collect the patient liability directly from the beneficiary and submits a claim tothe LME/MCO for the balance of the charges. Mercer has reviewed the patient liability required for theimpacted beneficiaries each month from the statewide eligibility file and compared to the patient liabilitycollected and documented by the LME/MCO. Based on this review of ICF/IID encounter claims, an adjustmentwas made to account for the difference between the required amount and reported amount of patient liabilityobserved in the documentation provided by the LME/MCO. The adjustment ensures the base data reflectsclaims expenses that are the responsibility of the LME/MCOs.
The patient liability adjustment is applied to the LTSS Services COS, for LME/MCO beneficiaries. As mentioned,this adjustment is only applicable to the LME/MCO encounter data since there is a process in place to accountfor patient liability during FFS claims processing. The overall impact across all populations is approximately$(30,000) in SFY 2016 and SFY 2017, which rounds to a 0.0% overall adjustment in each year. There is no impactto the Standard Plan population for this adjustment; however, the impact applies to future managed carepopulations.
6.8.2 Payments Made Outside of the Claims SystemLME/MCOs have historically documented payments for services paid outside of the claims system that were nototherwise represented in the base data. LME/MCOs provided Mercer with documentation of these payments byCOS and date of service. Mercer used this information to build in an adjustment to the historical experience toensure that the data was fully representative of all BH service costs. For the Standard Plan, this adjustmentincreased the SFY 2016 and SFY 2017 LME/MCO BH encounter data by approximately 1.5% each year, whichrounds to a 0.0% adjustment as a percentage of total Standard Plan program costs (both FFS claims andLME/MCO BH encounter data).
23 of 197Prepared by Mercer GovernmentHuman Services Consulting
RFP 30-190029-DHBSection IX. Medicaid Managed Care Draft Rate Book (SFY 2020)
7 HISTORICAL DATA EXHIBITSMercer summarized the base data experience for the Standard Plan population in the following exhibits. Thesesummaries reflect the base data adjustments outlined in Section 6 of the narrative and are shown on a regionalbasis.
The top of each exhibit includes the following identifying information:· Time Period: SFY 2016 or SFY 2017· Region: Regional breakouts based on Section 3 of the narrative· COA: Specific COA group for the Standard Plan population as defined in Section 4.1 of the narrative:
o ABDo TANFo Maternity Evento All COAs combined
· Age Grouping: Specific age groups as defined in Section 4.1 of the narrative
Below the population criteria is information on the following metrics associated with the population selections:· MMs/Deliveries: MMs reflect a count of monthly eligibles for the historical time period; Deliveries
represents the count of live birth events related to the Maternity Event payment.· Average Monthly Members/Deliveries: MMs or Deliveries divided by 12.· Eligibles: Reflect a unique count of eligibles for the time period and population indicated.· COS: As described in Section 5, each of the covered services is listed.· Incurred Claims: Amount paid for each service line item based on the paid amount field included in
both the FFS data provided by DHHS and the encounter data provided by the LME/MCOs; theseamounts are based on date of service and reflect the applicable data adjustments outlined in Section 6.
· Utilization: Utilization for each service line item. This represents the number of visits, days, services orscripts for each category as reported in the data after application of adjustments outlined in Section 6;see Table 4 in Section 5 for the unit types used to define utilization for the various service categories.
· Users: Unique user count for each service.· Utilization per 1,000: Annual utilization for each service divided by total MMs multiplied by 12,000.· Unit Cost: Average cost of each service line item; paid claims divided by the utilization of services
delivered.· PMPM/Payment: PMPM is the incurred claims divided by total MMs; the Maternity Event payment is
the incurred claims divided by the Deliveries.
24 of 197Prepared by Mercer GovernmentHuman Services Consulting
RFP 30-190029-DHBSection IX. Medicaid Managed Care Draft Rate Book (SFY 2020)
SFY 2016 Exhibits7.1Cost and utilization information for the July 1, 2015 through June 30, 2016 (SFY 2016) time period is illustrated inSection 7.1.
25 of 197Prepared by Mercer GovernmentHuman Services Consulting
RFP 30-190029-DHBSection IX. Medicaid Managed Care Draft Rate Book (SFY 2020)

7.1.1 SFY 2016 Region 1 Exhibits
26 of 197Prepared by Mercer GovernmentHuman Services Consulting
RFP 30-190029-DHBSection IX. Medicaid Managed Care Draft Rate Book (SFY 2020)
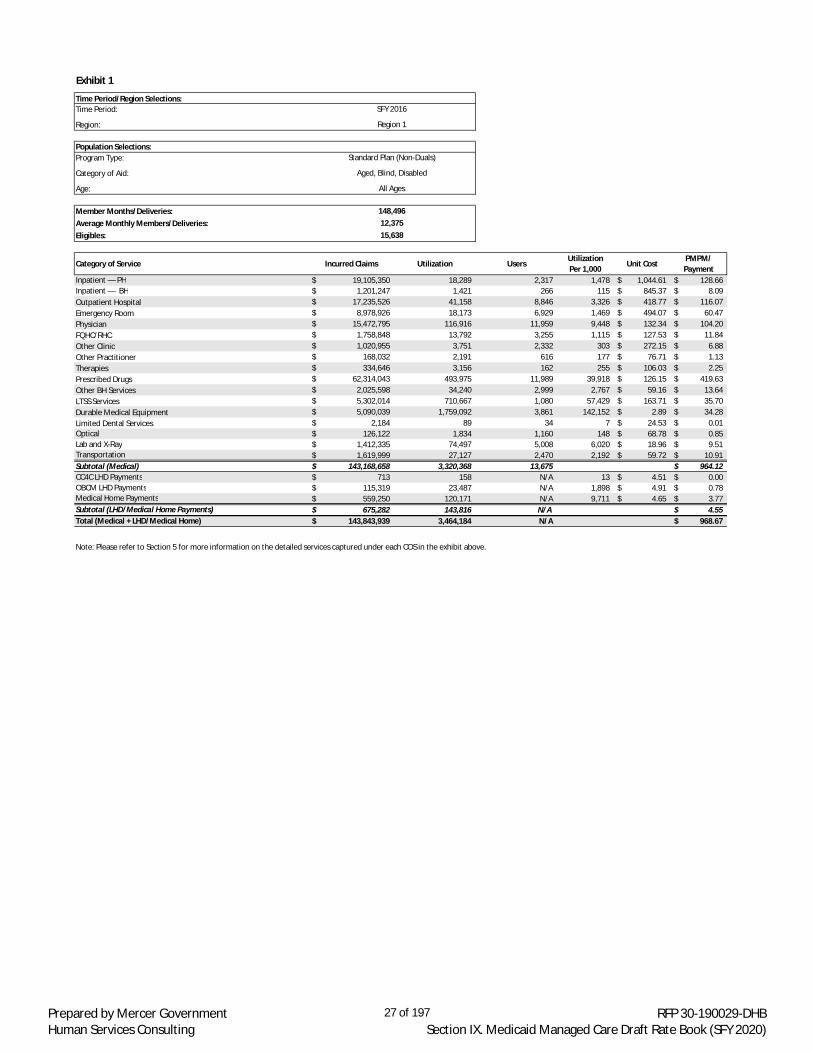
Exhibit 1
Time Period/Region Selections:Time Period:
Region:
Population Selections:Program Type:
Category of Aid:
Age:
Member Months/Deliveries:Average Monthly Members/Deliveries:Eligibles:
Category of Service Incurred Claims Utilization UsersUtilizationPer 1,000
Unit CostPMPM/Payment
Inpatient — PH 19,105,350$ 18,289 2,317 1,478 1,044.61$ 128.66$Inpatient — BH 1,201,247$ 1,421 266 115 845.37$ 8.09$Outpatient Hospital 17,235,526$ 41,158 8,846 3,326 418.77$ 116.07$Emergency Room 8,978,926$ 18,173 6,929 1,469 494.07$ 60.47$Physician 15,472,795$ 116,916 11,959 9,448 132.34$ 104.20$FQHC/RHC 1,758,848$ 13,792 3,255 1,115 127.53$ 11.84$Other Clinic 1,020,955$ 3,751 2,332 303 272.15$ 6.88$Other Practitioner 168,032$ 2,191 616 177 76.71$ 1.13$Therapies 334,646$ 3,156 162 255 106.03$ 2.25$Prescribed Drugs 62,314,043$ 493,975 11,989 39,918 126.15$ 419.63$Other BH Services 2,025,598$ 34,240 2,999 2,767 59.16$ 13.64$LTSS Services 5,302,014$ 710,667 1,080 57,429 163.71$ 35.70$Durable Medical Equipment 5,090,039$ 1,759,092 3,861 142,152 2.89$ 34.28$Limited Dental Services 2,184$ 89 34 7 24.53$ 0.01$Optical 126,122$ 1,834 1,160 148 68.78$ 0.85$Lab and X-Ray 1,412,335$ 74,497 5,008 6,020 18.96$ 9.51$Transportation 1,619,999$ 27,127 2,470 2,192 59.72$ 10.91$Subtotal (Medical) 143,168,658$ 3,320,368 13,675 964.12$CC4C LHD Payments 713$ 158 N/A 13 4.51$ 0.00$OBCM LHD Payments 115,319$ 23,487 N/A 1,898 4.91$ 0.78$Medical Home Payments 559,250$ 120,171 N/A 9,711 4.65$ 3.77$Subtotal (LHD/Medical Home Payments) 675,282$ 143,816 N/A 4.55$Total (Medical + LHD/Medical Home) 143,843,939$ 3,464,184 N/A 968.67$
Note: Please refer to Section 5 for more information on the detailed services captured under each COS in the exhibit above.
148,49612,37515,638
SFY 2016
Region 1
Standard Plan (Non-Duals)
Aged, Blind, Disabled
All Ages
27 of 197Prepared by Mercer GovernmentHuman Services Consulting
RFP 30-190029-DHBSection IX. Medicaid Managed Care Draft Rate Book (SFY 2020)

Exhibit 2
Time Period/Region Selections:Time Period:
Region:
Population Selections:Program Type:
Category of Aid:
Age:
Member Months/Deliveries:Average Monthly Members/Deliveries:Eligibles:
Category of Service Incurred Claims Utilization UsersUtilizationPer 1,000
Unit CostPMPM/Payment
Inpatient — PH 15,843,523$ 24,693 6,054 3,546 641.62$ 189.57$Inpatient — BH -$ - - - -$ -$Outpatient Hospital 1,539,559$ 9,727 3,955 1,397 158.28$ 18.42$Emergency Room 1,395,662$ 6,016 3,603 864 232.00$ 16.70$Physician 6,139,695$ 71,067 11,516 10,204 86.39$ 73.46$FQHC/RHC 780,550$ 6,193 1,280 889 126.04$ 9.34$Other Clinic 2,881,190$ 30,145 10,345 4,328 95.58$ 34.47$Other Practitioner 5,002$ 164 47 24 30.47$ 0.06$Therapies 67,043$ 812 175 117 82.61$ 0.80$Prescribed Drugs 1,121,377$ 26,052 6,772 3,741 43.04$ 13.42$Other BH Services 3,964$ 239 8 34 16.58$ 0.05$LTSS Services 175,369$ 4,931 230 708 35.56$ 2.10$Durable Medical Equipment 781,572$ 185,881 1,506 26,690 4.20$ 9.35$Limited Dental Services 142,761$ 5,779 2,399 830 24.71$ 1.71$Optical 787$ 10 8 1 78.73$ 0.01$Lab and X-Ray 42,938$ 2,116 1,058 304 20.29$ 0.51$Transportation 103,428$ 1,204 346 173 85.92$ 1.24$Subtotal (Medical) 31,024,420$ 375,027 12,602 371.22$CC4C LHD Payments 373,167$ 82,565 N/A 11,855 4.52$ 4.47$OBCM LHD Payments -$ - N/A - -$ -$Medical Home Payments 156,930$ 64,349 N/A 9,240 2.44$ 1.88$Subtotal (LHD/Medical Home Payments) 530,097$ 146,914 N/A 6.34$Total (Medical + LHD/Medical Home) 31,554,518$ 521,941 N/A 377.56$
Note: Please refer to Section 5 for more information on the detailed services captured under each COS in the exhibit above.
83,5756,965
13,657
SFY 2016
Region 1
Standard Plan (Non-Duals)
TANF and Other Related Children/Adults
Newborn (<1)
28 of 197Prepared by Mercer GovernmentHuman Services Consulting
RFP 30-190029-DHBSection IX. Medicaid Managed Care Draft Rate Book (SFY 2020)

Exhibit 3
Time Period/Region Selections:Time Period:
Region:
Population Selections:Program Type:
Category of Aid:
Age:
Member Months/Deliveries:Average Monthly Members/Deliveries:Eligibles:
Category of Service Incurred Claims Utilization UsersUtilizationPer 1,000
Unit CostPMPM/Payment
Inpatient — PH 4,512,089$ 4,336 959 43 1,040.71$ 3.76$Inpatient — BH 1,092,262$ 1,243 190 12 878.76$ 0.91$Outpatient Hospital 19,020,503$ 81,676 33,437 816 232.88$ 15.84$Emergency Room 14,661,088$ 49,031 30,011 490 299.01$ 12.21$Physician 25,651,627$ 366,338 83,459 3,660 70.02$ 21.36$FQHC/RHC 4,563,549$ 32,924 11,155 329 138.61$ 3.80$Other Clinic 6,679,000$ 63,001 52,689 629 106.01$ 5.56$Other Practitioner 232,590$ 4,191 1,271 42 55.50$ 0.19$Therapies 4,131,823$ 41,538 3,061 415 99.47$ 3.44$Prescribed Drugs 47,024,745$ 496,715 72,501 4,963 94.67$ 39.15$Other BH Services 8,499,056$ 113,879 9,648 1,138 74.63$ 7.08$LTSS Services 439,129$ 39,450 47 394 133.93$ 0.37$Durable Medical Equipment 2,742,607$ 780,094 6,983 7,794 3.52$ 2.28$Limited Dental Services 350,099$ 14,214 5,703 142 24.63$ 0.29$Optical 1,118,143$ 13,563 12,457 136 82.44$ 0.93$Lab and X-Ray 765,815$ 44,454 10,447 444 17.23$ 0.64$Transportation 621,485$ 9,108 2,042 91 68.23$ 0.52$Subtotal (Medical) 142,105,609$ 2,155,755 99,252 118.32$CC4C LHD Payments 1,263,406$ 280,424 N/A 2,802 4.51$ 1.05$OBCM LHD Payments 712,572$ 145,411 N/A 1,453 4.90$ 0.59$Medical Home Payments 2,574,411$ 1,057,454 N/A 10,566 2.43$ 2.14$Subtotal (LHD/Medical Home Payments) 4,550,389$ 1,483,289 N/A 3.79$Total (Medical + LHD/Medical Home) 146,655,997$ 3,639,044 N/A 122.11$
Note: Please refer to Section 5 for more information on the detailed services captured under each COS in the exhibit above.
1,201,019100,085118,468
SFY 2016
Region 1
Standard Plan (Non-Duals)
TANF and Other Related Children/Adults
Child (1-20)
29 of 197Prepared by Mercer GovernmentHuman Services Consulting
RFP 30-190029-DHBSection IX. Medicaid Managed Care Draft Rate Book (SFY 2020)

Exhibit 4
Time Period/Region Selections:Time Period:
Region:
Population Selections:Program Type:
Category of Aid:
Age:
Member Months/Deliveries:Average Monthly Members/Deliveries:Eligibles:
Category of Service Incurred Claims Utilization UsersUtilizationPer 1,000
Unit CostPMPM/Payment
Inpatient — PH 7,333,312$ 6,379 1,315 277 1,149.59$ 26.53$Inpatient — BH 920,217$ 1,163 245 50 790.96$ 3.33$Outpatient Hospital 13,668,579$ 45,643 15,014 1,981 299.47$ 49.44$Emergency Room 12,332,425$ 29,363 12,806 1,275 419.99$ 44.61$Physician 11,676,538$ 115,387 21,729 5,008 101.19$ 42.24$FQHC/RHC 1,677,174$ 13,147 4,374 571 127.57$ 6.07$Other Clinic 2,510,068$ 10,784 8,093 468 232.75$ 9.08$Other Practitioner 138,640$ 2,652 837 115 52.28$ 0.50$Therapies 51$ 1 1 0 51.06$ 0.00$Prescribed Drugs 24,434,442$ 335,088 20,962 14,545 72.92$ 88.38$Other BH Services 1,973,518$ 27,250 3,895 1,183 72.42$ 7.14$LTSS Services 357,563$ 26,745 154 1,161 181.27$ 1.29$Durable Medical Equipment 1,452,570$ 648,631 2,749 28,155 2.24$ 5.25$Limited Dental Services -$ - - - -$ -$Optical 88,942$ 1,303 854 57 68.23$ 0.32$Lab and X-Ray 2,762,326$ 132,365 10,539 5,745 20.87$ 9.99$Transportation 513,916$ 7,358 1,767 319 69.84$ 1.86$Subtotal (Medical) 81,840,280$ 1,403,259 27,307 296.03$CC4C LHD Payments 9$ 2 N/A 0 4.40$ 0.00$OBCM LHD Payments 943,885$ 193,057 N/A 8,380 4.89$ 3.41$Medical Home Payments 434,796$ 184,182 N/A 7,995 2.36$ 1.57$Subtotal (LHD/Medical Home Payments) 1,378,690$ 377,241 N/A 4.99$Total (Medical + LHD/Medical Home) 83,218,970$ 1,780,500 N/A 301.02$
Note: Please refer to Section 5 for more information on the detailed services captured under each COS in the exhibit above.
276,45823,03834,961
SFY 2016
Region 1
Standard Plan (Non-Duals)
TANF and Other Related Children/Adults
Adult (21+)
30 of 197Prepared by Mercer GovernmentHuman Services Consulting
RFP 30-190029-DHBSection IX. Medicaid Managed Care Draft Rate Book (SFY 2020)

Exhibit 5
Time Period/Region Selections:Time Period:
Region:
Population Selections:Program Type:
Category of Aid:
Age:
Member Months/Deliveries:Average Monthly Members/Deliveries:Eligibles:
Category of Service Incurred Claims Utilization UsersUtilizationPer 1,000
Unit CostPMPM/Payment
Inpatient — PH 10,649,440$ 14,314 5,168 32,444 744.00$ 2,011.54$Inpatient — BH -$ - - - -$ -$Outpatient Hospital 2,317,698$ 18,194 2,660 41,238 127.39$ 437.78$Emergency Room 1,333,244$ 4,004 547 9,076 332.97$ 251.83$Physician 8,048,706$ 41,885 5,081 94,939 192.16$ 1,520.29$FQHC/RHC 838,583$ 5,266 474 11,936 159.24$ 158.40$Other Clinic 952,430$ 7,788 1,254 17,653 122.29$ 179.90$Other Practitioner 322$ 12 48 27 26.86$ 0.06$Therapies -$ - - - -$ -$Prescribed Drugs -$ - - - -$ -$Other BH Services -$ - - - -$ -$LTSS Services 9,645$ 2,038 8 4,619 4.73$ 1.82$Durable Medical Equipment 29,121$ 333 164 755 87.42$ 5.50$Limited Dental Services -$ - - - -$ -$Optical 200$ 2 12 5 100.04$ 0.04$Lab and X-Ray 155,314$ 7,930 719 17,975 19.58$ 29.34$Transportation 64,394$ 604 225 1,369 106.59$ 12.16$Subtotal (Medical) 24,399,097$ 102,371 5,416 4,608.67$CC4C LHD Payments -$ - N/A - -$ -$OBCM LHD Payments -$ - N/A - -$ -$Medical Home Payments -$ - N/A - -$ -$Subtotal (LHD/Medical Home Payments) -$ - N/A -$Total (Medical + LHD/Medical Home) 24,399,097$ 102,371 N/A 4,608.67$
Note: Please refer to Section 5 for more information on the detailed services captured under each COS in the exhibit above.
5,294441
5,450
SFY 2016
Region 1
Standard Plan (Non-Duals)
Maternity Event
All Ages
31 of 197Prepared by Mercer GovernmentHuman Services Consulting
RFP 30-190029-DHBSection IX. Medicaid Managed Care Draft Rate Book (SFY 2020)

Exhibit 6
Time Period/Region Selections:Time Period:
Region:
Population Selections:Program Type:
Category of Aid:
Age:
Member Months/Deliveries:Average Monthly Members/Deliveries:Eligibles:
Category of Service Incurred Claims Utilization UsersUtilizationPer 1,000
Unit CostPMPM/Payment
Inpatient — PH 57,443,714$ 68,011 15,813 477 844.63$ 33.60$Inpatient — BH 3,213,725$ 3,827 702 27 839.67$ 1.88$Outpatient Hospital 53,781,865$ 196,396 63,912 1,379 273.84$ 31.46$Emergency Room 38,701,344$ 106,588 53,896 748 363.09$ 22.64$Physician 66,989,361$ 711,593 133,744 4,995 94.14$ 39.19$FQHC/RHC 9,618,704$ 71,321 20,538 501 134.86$ 5.63$Other Clinic 14,043,642$ 115,470 74,713 811 121.62$ 8.21$Other Practitioner 544,586$ 9,209 2,819 65 59.13$ 0.32$Therapies 4,533,563$ 45,506 3,399 319 99.63$ 2.65$Prescribed Drugs 134,894,607$ 1,351,830 115,478 9,489 99.79$ 78.91$Other BH Services 12,502,136$ 175,608 16,703 1,233 71.19$ 7.31$LTSS Services 6,283,719$ 783,831 1,519 5,502 164.47$ 3.68$Durable Medical Equipment 10,095,909$ 3,374,031 15,263 23,684 2.99$ 5.91$Limited Dental Services 495,044$ 20,082 8,136 141 24.65$ 0.29$Optical 1,334,194$ 16,712 14,491 117 79.83$ 0.78$Lab and X-Ray 5,138,727$ 261,362 27,771 1,835 19.66$ 3.01$Transportation 2,923,222$ 45,401 6,850 319 64.39$ 1.71$Subtotal (Medical) 422,538,064$ 7,356,779 158,137 247.16$CC4C LHD Payments 1,637,295$ 363,149 N/A 2,549 4.51$ 0.96$OBCM LHD Payments 1,771,776$ 361,955 N/A 2,541 4.90$ 1.04$Medical Home Payments 3,725,386$ 1,426,156 N/A 10,011 2.61$ 2.18$Subtotal (LHD/Medical Home Payments) 7,134,457$ 2,151,260 N/A 4.17$Total (Medical + LHD/Medical Home) 429,672,521$ 9,508,039 N/A 251.34$
Note: Please refer to Section 5 for more information on the detailed services captured under each COS in the exhibit above.
1,709,548142,462188,174
SFY 2016
Region 1
Standard Plan (Non-Duals)
All Population Groups
All Ages
32 of 197Prepared by Mercer GovernmentHuman Services Consulting
RFP 30-190029-DHBSection IX. Medicaid Managed Care Draft Rate Book (SFY 2020)

7.1.2 SFY 2016 Region 2 Exhibits
33 of 197Prepared by Mercer GovernmentHuman Services Consulting
RFP 30-190029-DHBSection IX. Medicaid Managed Care Draft Rate Book (SFY 2020)

Exhibit 7
Time Period/Region Selections:Time Period:
Region:
Population Selections:Program Type:
Category of Aid:
Age:
Member Months/Deliveries:Average Monthly Members/Deliveries:Eligibles:
Category of Service Incurred Claims Utilization UsersUtilizationPer 1,000
Unit CostPMPM/Payment
Inpatient — PH 34,460,023$ 35,532 3,810 1,603 969.84$ 129.56$Inpatient — BH 1,591,719$ 2,368 421 107 672.19$ 5.98$Outpatient Hospital 29,418,670$ 61,032 12,528 2,754 482.02$ 110.60$Emergency Room 16,700,555$ 32,769 11,885 1,478 509.65$ 62.79$Physician 26,666,391$ 202,317 20,595 9,128 131.81$ 100.26$FQHC/RHC 521,458$ 4,427 1,393 200 117.79$ 1.96$Other Clinic 2,193,531$ 7,421 4,322 335 295.60$ 8.25$Other Practitioner 200,337$ 2,660 1,069 120 75.32$ 0.75$Therapies 713,572$ 5,980 392 270 119.33$ 2.68$Prescribed Drugs 106,617,766$ 754,878 19,990 34,057 141.24$ 400.84$Other BH Services 3,747,230$ 65,003 5,475 2,933 57.65$ 14.09$LTSS Services 15,890,578$ 2,957,310 2,224 133,421 162.49$ 59.74$Durable Medical Equipment 9,568,592$ 3,084,897 6,221 139,177 3.10$ 35.97$Limited Dental Services 11,494$ 468 166 21 24.55$ 0.04$Optical 229,609$ 3,217 2,035 145 71.37$ 0.86$Lab and X-Ray 3,294,326$ 182,351 10,915 8,227 18.07$ 12.39$Transportation 3,190,015$ 35,059 4,098 1,582 90.99$ 11.99$Subtotal (Medical) 255,015,865$ 7,437,689 23,086 958.77$CC4C LHD Payments 2,122$ 470 N/A 21 4.51$ 0.01$OBCM LHD Payments 215,412$ 43,873 N/A 1,979 4.91$ 0.81$Medical Home Payments 1,055,887$ 226,172 N/A 10,204 4.67$ 3.97$Subtotal (LHD/Medical Home Payments) 1,273,422$ 270,515 N/A 4.79$Total (Medical + LHD/Medical Home) 256,289,287$ 7,708,204 N/A 963.55$
Note: Please refer to Section 5 for more information on the detailed services captured under each COS in the exhibit above.
265,98422,16526,813
SFY 2016
Region 2
Standard Plan (Non-Duals)
Aged, Blind, Disabled
All Ages
34 of 197Prepared by Mercer GovernmentHuman Services Consulting
RFP 30-190029-DHBSection IX. Medicaid Managed Care Draft Rate Book (SFY 2020)

Exhibit 8
Time Period/Region Selections:Time Period:
Region:
Population Selections:Program Type:
Category of Aid:
Age:
Member Months/Deliveries:Average Monthly Members/Deliveries:Eligibles:
Category of Service Incurred Claims Utilization UsersUtilizationPer 1,000
Unit CostPMPM/Payment
Inpatient — PH 22,543,143$ 41,308 11,016 3,351 545.74$ 152.42$Inpatient — BH -$ - - - -$ -$Outpatient Hospital 1,886,093$ 12,602 5,242 1,022 149.67$ 12.75$Emergency Room 3,196,619$ 12,729 7,369 1,033 251.13$ 21.61$Physician 10,165,211$ 122,217 20,585 9,916 83.17$ 68.73$FQHC/RHC 571,259$ 5,220 1,340 423 109.44$ 3.86$Other Clinic 5,576,307$ 54,182 19,221 4,396 102.92$ 37.70$Other Practitioner 1,440$ 34 13 3 42.30$ 0.01$Therapies 90,341$ 841 144 68 107.47$ 0.61$Prescribed Drugs 1,686,718$ 43,580 12,060 3,536 38.70$ 11.40$Other BH Services 6,402$ 273 54 22 23.45$ 0.04$LTSS Services 173,286$ 14,131 119 1,146 12.26$ 1.17$Durable Medical Equipment 968,409$ 48,192 1,783 3,910 20.09$ 6.55$Limited Dental Services 357,285$ 14,429 6,074 1,171 24.76$ 2.42$Optical 4,688$ 51 38 4 91.89$ 0.03$Lab and X-Ray 111,634$ 8,204 3,909 666 13.61$ 0.75$Transportation 144,799$ 1,498 711 121 96.69$ 0.98$Subtotal (Medical) 47,483,633$ 379,490 22,433 321.04$CC4C LHD Payments 658,149$ 145,621 N/A 11,815 4.52$ 4.45$OBCM LHD Payments 10$ 2 N/A 0 4.94$ 0.00$Medical Home Payments 278,570$ 112,822 N/A 9,154 2.47$ 1.88$Subtotal (LHD/Medical Home Payments) 936,729$ 258,445 N/A 6.33$Total (Medical + LHD/Medical Home) 48,420,362$ 637,935 N/A 327.37$
Note: Please refer to Section 5 for more information on the detailed services captured under each COS in the exhibit above.
147,90512,32524,147
SFY 2016
Region 2
Standard Plan (Non-Duals)
TANF and Other Related Children/Adults
Newborn (<1)
35 of 197Prepared by Mercer GovernmentHuman Services Consulting
RFP 30-190029-DHBSection IX. Medicaid Managed Care Draft Rate Book (SFY 2020)

Exhibit 9
Time Period/Region Selections:Time Period:
Region:
Population Selections:Program Type:
Category of Aid:
Age:
Member Months/Deliveries:Average Monthly Members/Deliveries:Eligibles:
Category of Service Incurred Claims Utilization UsersUtilizationPer 1,000
Unit CostPMPM/Payment
Inpatient — PH 9,910,920$ 7,935 1,859 43 1,249.08$ 4.48$Inpatient — BH 2,050,152$ 3,076 490 17 666.45$ 0.93$Outpatient Hospital 21,420,811$ 97,832 42,351 531 218.96$ 9.69$Emergency Room 29,933,020$ 96,253 59,143 522 310.98$ 13.53$Physician 41,004,876$ 612,460 151,606 3,323 66.95$ 18.54$FQHC/RHC 2,741,954$ 25,439 12,228 138 107.78$ 1.24$Other Clinic 13,199,664$ 124,161 101,404 674 106.31$ 5.97$Other Practitioner 248,666$ 3,292 1,385 18 75.53$ 0.11$Therapies 6,201,731$ 51,490 3,753 279 120.45$ 2.80$Prescribed Drugs 76,749,940$ 849,725 128,693 4,610 90.32$ 34.70$Other BH Services 9,856,914$ 135,954 12,698 738 72.50$ 4.46$LTSS Services 314,012$ 32,585 103 177 133.53$ 0.14$Durable Medical Equipment 4,026,763$ 1,414,058 11,181 7,672 2.85$ 1.82$Limited Dental Services 934,170$ 37,626 14,186 204 24.83$ 0.42$Optical 2,194,008$ 26,197 22,729 142 83.75$ 0.99$Lab and X-Ray 4,162,080$ 234,768 41,416 1,274 17.73$ 1.88$Transportation 915,674$ 9,929 3,994 54 92.22$ 0.41$Subtotal (Medical) 225,865,354$ 3,762,781 177,918 102.12$CC4C LHD Payments 2,352,092$ 522,058 N/A 2,833 4.51$ 1.06$OBCM LHD Payments 1,304,330$ 266,155 N/A 1,444 4.90$ 0.59$Medical Home Payments 4,893,899$ 1,997,152 N/A 10,836 2.45$ 2.21$Subtotal (LHD/Medical Home Payments) 8,550,322$ 2,785,365 N/A 3.87$Total (Medical + LHD/Medical Home) 234,415,675$ 6,548,146 N/A 105.99$
Note: Please refer to Section 5 for more information on the detailed services captured under each COS in the exhibit above.
2,211,702184,308216,119
SFY 2016
Region 2
Standard Plan (Non-Duals)
TANF and Other Related Children/Adults
Child (1-20)
36 of 197Prepared by Mercer GovernmentHuman Services Consulting
RFP 30-190029-DHBSection IX. Medicaid Managed Care Draft Rate Book (SFY 2020)

Exhibit 10
Time Period/Region Selections:Time Period:
Region:
Population Selections:Program Type:
Category of Aid:
Age:
Member Months/Deliveries:Average Monthly Members/Deliveries:Eligibles:
Category of Service Incurred Claims Utilization UsersUtilizationPer 1,000
Unit CostPMPM/Payment
Inpatient — PH 11,383,199$ 10,526 2,253 275 1,081.46$ 24.82$Inpatient — BH 1,001,470$ 1,435 382 38 697.65$ 2.18$Outpatient Hospital 16,008,748$ 48,723 19,170 1,275 328.56$ 34.90$Emergency Room 21,734,187$ 48,143 22,568 1,259 451.45$ 47.38$Physician 22,293,837$ 205,138 37,613 5,367 108.68$ 48.60$FQHC/RHC 322,203$ 3,026 1,270 79 106.48$ 0.70$Other Clinic 3,704,218$ 16,437 13,051 430 225.36$ 8.08$Other Practitioner 186,991$ 2,824 1,046 74 66.22$ 0.41$Therapies 76$ 2 2 0 37.96$ 0.00$Prescribed Drugs 45,602,993$ 542,304 34,295 14,187 84.09$ 99.42$Other BH Services 3,167,099$ 43,239 5,095 1,131 73.25$ 6.90$LTSS Services 900,145$ 159,622 295 4,176 153.01$ 1.96$Durable Medical Equipment 2,350,540$ 1,067,373 4,033 27,924 2.20$ 5.12$Limited Dental Services -$ - - - -$ -$Optical 198,761$ 2,959 1,410 77 67.17$ 0.43$Lab and X-Ray 7,248,529$ 364,088 23,501 9,525 19.91$ 15.80$Transportation 1,094,182$ 11,835 3,249 310 92.45$ 2.39$Subtotal (Medical) 137,197,178$ 2,527,674 44,664 299.10$CC4C LHD Payments 31$ 7 N/A 0 4.42$ 0.00$OBCM LHD Payments 1,643,881$ 336,202 N/A 8,795 4.89$ 3.58$Medical Home Payments 739,829$ 314,517 N/A 8,228 2.35$ 1.61$Subtotal (LHD/Medical Home Payments) 2,383,741$ 650,726 N/A 5.20$Total (Medical + LHD/Medical Home) 139,580,919$ 3,178,400 N/A 304.30$
Note: Please refer to Section 5 for more information on the detailed services captured under each COS in the exhibit above.
458,69638,22556,407
SFY 2016
Region 2
Standard Plan (Non-Duals)
TANF and Other Related Children/Adults
Adult (21+)
37 of 197Prepared by Mercer GovernmentHuman Services Consulting
RFP 30-190029-DHBSection IX. Medicaid Managed Care Draft Rate Book (SFY 2020)

Exhibit 11
Time Period/Region Selections:Time Period:
Region:
Population Selections:Program Type:
Category of Aid:
Age:
Member Months/Deliveries:Average Monthly Members/Deliveries:Eligibles:
Category of Service Incurred Claims Utilization UsersUtilizationPer 1,000
Unit CostPMPM/Payment
Inpatient — PH 17,105,261$ 25,310 8,954 32,910 675.82$ 1,853.47$Inpatient — BH -$ - - - -$ -$Outpatient Hospital 3,496,038$ 28,212 3,612 36,684 123.92$ 378.82$Emergency Room 3,325,977$ 10,840 1,460 14,095 306.82$ 360.39$Physician 15,821,943$ 68,707 9,073 89,339 230.28$ 1,714.41$FQHC/RHC 64,073$ 470 37 612 136.23$ 6.94$Other Clinic 605,022$ 4,201 2,196 5,463 144.00$ 65.56$Other Practitioner 286$ 11 16 14 26.00$ 0.03$Therapies -$ - - - -$ -$Prescribed Drugs -$ - - - -$ -$Other BH Services 87$ 1 153 1 87.19$ 0.01$LTSS Services 10,526$ 581 13 756 18.12$ 1.14$Durable Medical Equipment 23,082$ 641 207 834 35.99$ 2.50$Limited Dental Services -$ - - - -$ -$Optical 79$ 1 24 1 78.45$ 0.01$Lab and X-Ray 250,289$ 15,088 2,205 19,619 16.59$ 27.12$Transportation 104,097$ 1,085 520 1,410 95.97$ 11.28$Subtotal (Medical) 40,806,760$ 155,150 9,401 4,421.68$CC4C LHD Payments -$ - N/A - -$ -$OBCM LHD Payments -$ - N/A - -$ -$Medical Home Payments -$ - N/A - -$ -$Subtotal (LHD/Medical Home Payments) -$ - N/A -$Total (Medical + LHD/Medical Home) 40,806,760$ 155,150 N/A 4,421.68$
Note: Please refer to Section 5 for more information on the detailed services captured under each COS in the exhibit above.
9,229769
9,459
SFY 2016
Region 2
Standard Plan (Non-Duals)
Maternity Event
All Ages
38 of 197Prepared by Mercer GovernmentHuman Services Consulting
RFP 30-190029-DHBSection IX. Medicaid Managed Care Draft Rate Book (SFY 2020)

Exhibit 12
Time Period/Region Selections:Time Period:
Region:
Population Selections:Program Type:
Category of Aid:
Age:
Member Months/Deliveries:Average Monthly Members/Deliveries:Eligibles:
Category of Service Incurred Claims Utilization UsersUtilizationPer 1,000
Unit CostPMPM/Payment
Inpatient — PH 95,402,547$ 120,610 27,892 469 791.00$ 30.93$Inpatient — BH 4,643,341$ 6,880 1,296 27 674.94$ 1.51$Outpatient Hospital 72,230,360$ 248,402 82,903 966 290.78$ 23.42$Emergency Room 74,890,358$ 200,734 102,425 781 373.08$ 24.28$Physician 115,952,258$ 1,210,839 239,472 4,711 95.76$ 37.59$FQHC/RHC 4,220,946$ 38,583 16,268 150 109.40$ 1.37$Other Clinic 25,278,741$ 206,402 140,194 803 122.47$ 8.20$Other Practitioner 637,719$ 8,821 3,529 34 72.30$ 0.21$Therapies 7,005,720$ 58,312 4,293 227 120.14$ 2.27$Prescribed Drugs 230,657,416$ 2,190,487 201,214 8,523 105.30$ 74.78$Other BH Services 16,777,732$ 244,470 23,475 951 68.63$ 5.44$LTSS Services 17,288,547$ 3,164,229 2,754 12,311 161.55$ 5.61$Durable Medical Equipment 16,937,386$ 5,615,162 23,425 21,847 3.02$ 5.49$Limited Dental Services 1,302,949$ 52,523 20,426 204 24.81$ 0.42$Optical 2,627,144$ 32,425 26,236 126 81.02$ 0.85$Lab and X-Ray 15,066,858$ 804,500 81,946 3,130 18.73$ 4.89$Transportation 5,448,766$ 59,406 12,572 231 91.72$ 1.77$Subtotal (Medical) 706,368,789$ 14,262,784 277,162 229.02$CC4C LHD Payments 3,012,394$ 668,156 N/A 2,600 4.51$ 0.98$OBCM LHD Payments 3,163,634$ 646,232 N/A 2,514 4.90$ 1.03$Medical Home Payments 6,968,186$ 2,650,663 N/A 10,313 2.63$ 2.26$Subtotal (LHD/Medical Home Payments) 13,144,214$ 3,965,051 N/A 4.26$Total (Medical + LHD/Medical Home) 719,513,002$ 18,227,835 N/A 233.28$
Note: Please refer to Section 5 for more information on the detailed services captured under each COS in the exhibit above.
3,084,286257,024332,945
SFY 2016
Region 2
Standard Plan (Non-Duals)
All Population Groups
All Ages
39 of 197Prepared by Mercer GovernmentHuman Services Consulting
RFP 30-190029-DHBSection IX. Medicaid Managed Care Draft Rate Book (SFY 2020)

7.1.3 SFY 2016 Region 3 Exhibits
40 of 197Prepared by Mercer GovernmentHuman Services Consulting
RFP 30-190029-DHBSection IX. Medicaid Managed Care Draft Rate Book (SFY 2020)

Exhibit 13
Time Period/Region Selections:Time Period:
Region:
Population Selections:Program Type:
Category of Aid:
Age:
Member Months/Deliveries:Average Monthly Members/Deliveries:Eligibles:
Category of Service Incurred Claims Utilization UsersUtilizationPer 1,000
Unit CostPMPM/Payment
Inpatient — PH 44,947,199$ 47,286 4,785 1,744 950.54$ 138.18$Inpatient — BH 2,222,641$ 3,870 521 143 574.31$ 6.83$Outpatient Hospital 32,951,616$ 75,421 16,183 2,782 436.90$ 101.30$Emergency Room 22,924,088$ 44,473 15,197 1,641 515.46$ 70.47$Physician 36,833,898$ 276,265 25,568 10,192 133.33$ 113.24$FQHC/RHC 986,695$ 9,228 2,924 340 106.92$ 3.03$Other Clinic 3,142,908$ 7,396 4,751 273 424.97$ 9.66$Other Practitioner 304,312$ 4,082 1,380 151 74.56$ 0.94$Therapies 1,247,469$ 11,050 630 408 112.90$ 3.84$Prescribed Drugs 137,286,703$ 922,617 24,769 34,036 148.80$ 422.05$Other BH Services 4,928,674$ 110,375 7,007 4,072 44.65$ 15.15$LTSS Services 29,482,325$ 5,931,807 3,628 218,831 163.66$ 90.64$Durable Medical Equipment 13,641,280$ 4,001,788 7,689 147,630 3.41$ 41.94$Limited Dental Services 8,063$ 325 116 12 24.80$ 0.02$Optical 226,009$ 3,221 1,847 119 70.16$ 0.69$Lab and X-Ray 3,652,850$ 198,454 11,618 7,321 18.41$ 11.23$Transportation 3,489,633$ 55,881 5,352 2,061 62.45$ 10.73$Subtotal (Medical) 338,276,362$ 11,703,538 28,891 1,039.95$CC4C LHD Payments 1,763$ 391 N/A 14 4.51$ 0.01$OBCM LHD Payments 260,916$ 53,141 N/A 1,960 4.91$ 0.80$Medical Home Payments 1,278,833$ 268,380 N/A 9,901 4.77$ 3.93$Subtotal (LHD/Medical Home Payments) 1,541,513$ 321,912 N/A 4.74$Total (Medical + LHD/Medical Home) 339,817,875$ 12,025,450 N/A 1,044.69$
Note: Please refer to Section 5 for more information on the detailed services captured under each COS in the exhibit above.
325,28227,10733,445
SFY 2016
Region 3
Standard Plan (Non-Duals)
Aged, Blind, Disabled
All Ages
41 of 197Prepared by Mercer GovernmentHuman Services Consulting
RFP 30-190029-DHBSection IX. Medicaid Managed Care Draft Rate Book (SFY 2020)

Exhibit 14
Time Period/Region Selections:Time Period:
Region:
Population Selections:Program Type:
Category of Aid:
Age:
Member Months/Deliveries:Average Monthly Members/Deliveries:Eligibles:
Category of Service Incurred Claims Utilization UsersUtilizationPer 1,000
Unit CostPMPM/Payment
Inpatient — PH 34,656,427$ 62,472 16,039 3,440 554.75$ 159.01$Inpatient — BH -$ - - - -$ -$Outpatient Hospital 2,252,725$ 14,087 7,895 776 159.91$ 10.34$Emergency Room 4,884,408$ 19,056 11,005 1,049 256.32$ 22.41$Physician 15,509,201$ 181,531 30,438 9,995 85.44$ 71.16$FQHC/RHC 325,282$ 3,006 786 166 108.21$ 1.49$Other Clinic 7,577,368$ 77,930 27,844 4,291 97.23$ 34.77$Other Practitioner 11,020$ 311 63 17 35.41$ 0.05$Therapies 149,553$ 1,618 316 89 92.42$ 0.69$Prescribed Drugs 3,143,156$ 66,879 17,577 3,682 47.00$ 14.42$Other BH Services 7,836$ 447 14 25 17.53$ 0.04$LTSS Services 375,197$ 26,734 277 1,472 14.03$ 1.72$Durable Medical Equipment 1,504,729$ 61,167 2,782 3,368 24.60$ 6.90$Limited Dental Services 402,377$ 16,242 6,807 894 24.77$ 1.85$Optical 1,890$ 23 19 1 83.97$ 0.01$Lab and X-Ray 326,604$ 11,588 3,917 638 28.19$ 1.50$Transportation 188,842$ 2,084 1,006 115 90.63$ 0.87$Subtotal (Medical) 71,316,613$ 545,175 32,642 327.22$CC4C LHD Payments 967,322$ 214,018 N/A 11,784 4.52$ 4.44$OBCM LHD Payments 15$ 3 N/A 0 4.85$ 0.00$Medical Home Payments 379,029$ 153,708 N/A 8,463 2.47$ 1.74$Subtotal (LHD/Medical Home Payments) 1,346,366$ 367,729 N/A 6.18$Total (Medical + LHD/Medical Home) 72,662,979$ 912,904 N/A 333.40$
Note: Please refer to Section 5 for more information on the detailed services captured under each COS in the exhibit above.
217,94818,16235,611
SFY 2016
Region 3
Standard Plan (Non-Duals)
TANF and Other Related Children/Adults
Newborn (<1)
42 of 197Prepared by Mercer GovernmentHuman Services Consulting
RFP 30-190029-DHBSection IX. Medicaid Managed Care Draft Rate Book (SFY 2020)

Exhibit 15
Time Period/Region Selections:Time Period:
Region:
Population Selections:Program Type:
Category of Aid:
Age:
Member Months/Deliveries:Average Monthly Members/Deliveries:Eligibles:
Category of Service Incurred Claims Utilization UsersUtilizationPer 1,000
Unit CostPMPM/Payment
Inpatient — PH 11,829,192$ 10,815 2,432 41 1,093.79$ 3.77$Inpatient — BH 2,101,819$ 3,698 543 14 568.36$ 0.67$Outpatient Hospital 25,303,002$ 98,593 55,107 377 256.64$ 8.07$Emergency Room 40,795,473$ 134,717 82,521 516 302.82$ 13.01$Physician 65,482,259$ 874,336 217,046 3,347 74.89$ 20.89$FQHC/RHC 1,754,241$ 16,222 6,655 62 108.14$ 0.56$Other Clinic 17,279,207$ 173,069 143,265 662 99.84$ 5.51$Other Practitioner 595,096$ 7,449 2,361 29 79.89$ 0.19$Therapies 8,335,611$ 80,393 6,317 308 103.69$ 2.66$Prescribed Drugs 108,757,643$ 1,158,392 176,790 4,434 93.89$ 34.69$Other BH Services 15,497,836$ 212,892 19,931 815 72.80$ 4.94$LTSS Services 845,706$ 130,962 232 501 6.46$ 0.27$Durable Medical Equipment 5,614,221$ 1,617,871 16,386 6,192 3.47$ 1.79$Limited Dental Services 947,407$ 38,340 14,894 147 24.71$ 0.30$Optical 2,031,904$ 24,308 22,627 93 83.59$ 0.65$Lab and X-Ray 4,238,985$ 252,883 45,724 968 16.76$ 1.35$Transportation 1,276,706$ 17,385 6,432 67 73.44$ 0.41$Subtotal (Medical) 312,686,309$ 4,852,327 248,053 99.73$CC4C LHD Payments 3,330,399$ 739,202 N/A 2,829 4.51$ 1.06$OBCM LHD Payments 1,826,970$ 372,824 N/A 1,427 4.90$ 0.58$Medical Home Payments 6,626,707$ 2,696,457 N/A 10,321 2.46$ 2.11$Subtotal (LHD/Medical Home Payments) 11,784,076$ 3,808,483 N/A 3.76$Total (Medical + LHD/Medical Home) 324,470,385$ 8,660,810 N/A 103.49$
Note: Please refer to Section 5 for more information on the detailed services captured under each COS in the exhibit above.
3,135,185261,265311,208
SFY 2016
Region 3
Standard Plan (Non-Duals)
TANF and Other Related Children/Adults
Child (1-20)
43 of 197Prepared by Mercer GovernmentHuman Services Consulting
RFP 30-190029-DHBSection IX. Medicaid Managed Care Draft Rate Book (SFY 2020)

Exhibit 16
Time Period/Region Selections:Time Period:
Region:
Population Selections:Program Type:
Category of Aid:
Age:
Member Months/Deliveries:Average Monthly Members/Deliveries:Eligibles:
Category of Service Incurred Claims Utilization UsersUtilizationPer 1,000
Unit CostPMPM/Payment
Inpatient — PH 14,127,689$ 13,080 2,828 227 1,080.11$ 20.40$Inpatient — BH 1,348,824$ 2,233 432 39 604.10$ 1.95$Outpatient Hospital 22,634,076$ 74,930 30,094 1,298 302.07$ 32.68$Emergency Room 33,660,655$ 76,800 33,982 1,331 438.29$ 48.60$Physician 31,986,827$ 292,460 54,068 5,067 109.37$ 46.18$FQHC/RHC 955,471$ 9,164 3,673 159 104.26$ 1.38$Other Clinic 4,851,825$ 23,088 18,618 400 210.15$ 7.00$Other Practitioner 282,315$ 4,695 1,582 81 60.13$ 0.41$Therapies 1,487$ 31 31 1 47.89$ 0.00$Prescribed Drugs 61,141,743$ 741,867 50,424 12,853 82.42$ 88.27$Other BH Services 4,851,614$ 87,596 7,403 1,518 55.39$ 7.00$LTSS Services 1,648,739$ 342,972 517 5,942 148.35$ 2.38$Durable Medical Equipment 3,919,781$ 1,550,837 5,579 26,868 2.53$ 5.66$Limited Dental Services -$ - - - -$ -$Optical 141,413$ 2,118 1,128 37 66.77$ 0.20$Lab and X-Ray 8,886,430$ 428,004 28,077 7,415 20.76$ 12.83$Transportation 1,245,218$ 16,518 5,204 286 75.38$ 1.80$Subtotal (Medical) 191,684,109$ 3,666,392 65,506 276.75$CC4C LHD Payments 164$ 38 N/A 1 4.33$ 0.00$OBCM LHD Payments 2,485,588$ 508,368 N/A 8,808 4.89$ 3.59$Medical Home Payments 1,102,731$ 457,965 N/A 7,934 2.41$ 1.59$Subtotal (LHD/Medical Home Payments) 3,588,484$ 966,371 N/A 5.18$Total (Medical + LHD/Medical Home) 195,272,593$ 4,632,763 N/A 281.93$
Note: Please refer to Section 5 for more information on the detailed services captured under each COS in the exhibit above.
692,63657,72085,395
SFY 2016
Region 3
Standard Plan (Non-Duals)
TANF and Other Related Children/Adults
Adult (21+)
44 of 197Prepared by Mercer GovernmentHuman Services Consulting
RFP 30-190029-DHBSection IX. Medicaid Managed Care Draft Rate Book (SFY 2020)

Exhibit 17
Time Period/Region Selections:Time Period:
Region:
Population Selections:Program Type:
Category of Aid:
Age:
Member Months/Deliveries:Average Monthly Members/Deliveries:Eligibles:
Category of Service Incurred Claims Utilization UsersUtilizationPer 1,000
Unit CostPMPM/Payment
Inpatient — PH 25,429,311$ 35,907 12,640 32,784 708.21$ 1,934.84$Inpatient — BH -$ - - - -$ -$Outpatient Hospital 4,036,284$ 30,623 5,372 27,961 131.80$ 307.11$Emergency Room 5,263,196$ 14,246 2,045 13,007 369.45$ 400.46$Physician 20,059,949$ 85,503 12,818 78,068 234.61$ 1,526.30$FQHC/RHC 47,046$ 401 14 366 117.24$ 3.58$Other Clinic 2,706,459$ 16,181 3,197 14,774 167.26$ 205.93$Other Practitioner 9,067$ 246 52 225 36.85$ 0.69$Therapies -$ - - - -$ -$Prescribed Drugs -$ - - - -$ -$Other BH Services -$ - - - -$ -$LTSS Services 71,521$ 5,936 21 5,420 12.05$ 5.44$Durable Medical Equipment 12,069$ 497 327 454 24.27$ 0.92$Limited Dental Services -$ - - - -$ -$Optical -$ - - - -$ -$Lab and X-Ray 354,777$ 15,021 2,024 13,715 23.62$ 26.99$Transportation 166,153$ 1,818 750 1,660 91.40$ 12.64$Subtotal (Medical) 58,155,832$ 206,380 13,380 4,424.91$CC4C LHD Payments -$ - N/A - -$ -$OBCM LHD Payments -$ - N/A - -$ -$Medical Home Payments -$ - N/A - -$ -$Subtotal (LHD/Medical Home Payments) -$ - N/A -$Total (Medical + LHD/Medical Home) 58,155,832$ 206,380 N/A 4,424.91$
Note: Please refer to Section 5 for more information on the detailed services captured under each COS in the exhibit above.
13,1431,095
13,431
SFY 2016
Region 3
Standard Plan (Non-Duals)
Maternity Event
All Ages
45 of 197Prepared by Mercer GovernmentHuman Services Consulting
RFP 30-190029-DHBSection IX. Medicaid Managed Care Draft Rate Book (SFY 2020)

Exhibit 18
Time Period/Region Selections:Time Period:
Region:
Population Selections:Program Type:
Category of Aid:
Age:
Member Months/Deliveries:Average Monthly Members/Deliveries:Eligibles:
Category of Service Incurred Claims Utilization UsersUtilizationPer 1,000
Unit CostPMPM/Payment
Inpatient — PH 130,989,817$ 169,560 38,724 465 772.53$ 29.97$Inpatient — BH 5,673,285$ 9,801 1,499 27 578.85$ 1.30$Outpatient Hospital 87,177,702$ 293,655 114,651 806 296.87$ 19.94$Emergency Room 107,527,820$ 289,291 144,750 794 371.69$ 24.60$Physician 169,872,133$ 1,710,095 339,938 4,695 99.33$ 38.86$FQHC/RHC 4,068,736$ 38,022 14,052 104 107.01$ 0.93$Other Clinic 35,557,767$ 297,664 197,675 817 119.46$ 8.13$Other Practitioner 1,201,811$ 16,783 5,438 46 71.61$ 0.27$Therapies 9,734,120$ 93,092 7,294 256 104.56$ 2.23$Prescribed Drugs 310,329,245$ 2,889,755 277,585 7,933 107.39$ 71.00$Other BH Services 25,285,961$ 411,311 34,610 1,129 61.48$ 5.78$LTSS Services 32,423,488$ 6,438,412 4,675 17,676 161.73$ 7.42$Durable Medical Equipment 24,692,080$ 7,232,161 32,763 19,855 3.41$ 5.65$Limited Dental Services 1,357,847$ 54,907 21,817 151 24.73$ 0.31$Optical 2,401,215$ 29,669 25,641 81 80.93$ 0.55$Lab and X-Ray 17,459,646$ 905,951 91,360 2,487 19.27$ 3.99$Transportation 6,366,552$ 93,685 18,744 257 67.96$ 1.46$Subtotal (Medical) 972,119,224$ 20,973,812 388,017 222.40$CC4C LHD Payments 4,299,649$ 953,649 N/A 2,618 4.51$ 0.98$OBCM LHD Payments 4,573,489$ 934,336 N/A 2,565 4.89$ 1.05$Medical Home Payments 9,387,301$ 3,576,510 N/A 9,819 2.62$ 2.15$Subtotal (LHD/Medical Home Payments) 18,260,439$ 5,464,495 N/A 4.18$Total (Medical + LHD/Medical Home) 990,379,663$ 26,438,307 N/A 226.58$
Note: Please refer to Section 5 for more information on the detailed services captured under each COS in the exhibit above.
4,371,052364,254479,090
SFY 2016
Region 3
Standard Plan (Non-Duals)
All Population Groups
All Ages
46 of 197Prepared by Mercer GovernmentHuman Services Consulting
RFP 30-190029-DHBSection IX. Medicaid Managed Care Draft Rate Book (SFY 2020)
7.1.4 SFY 2016 Region 4 Exhibits
47 of 197Prepared by Mercer GovernmentHuman Services Consulting
RFP 30-190029-DHBSection IX. Medicaid Managed Care Draft Rate Book (SFY 2020)

Exhibit 19
Time Period/Region Selections:Time Period:
Region:
Population Selections:Program Type:
Category of Aid:
Age:
Member Months/Deliveries:Average Monthly Members/Deliveries:Eligibles:
Category of Service Incurred Claims Utilization UsersUtilizationPer 1,000
Unit CostPMPM/Payment
Inpatient — PH 37,959,143$ 38,694 3,662 1,682 981.01$ 137.49$Inpatient — BH 1,813,577$ 2,641 308 115 686.66$ 6.57$Outpatient Hospital 25,967,271$ 54,081 12,082 2,351 480.16$ 94.05$Emergency Room 15,184,312$ 30,722 11,967 1,335 494.24$ 55.00$Physician 27,909,412$ 197,542 20,543 8,586 141.28$ 101.09$FQHC/RHC 1,881,022$ 16,613 4,925 722 113.22$ 6.81$Other Clinic 3,356,768$ 8,013 4,605 348 418.90$ 12.16$Other Practitioner 171,847$ 2,181 980 95 78.81$ 0.62$Therapies 1,375,705$ 12,029 699 523 114.37$ 4.98$Prescribed Drugs 109,662,363$ 689,234 20,314 29,957 159.11$ 397.19$Other BH Services 4,933,598$ 103,409 6,006 4,495 47.71$ 17.87$LTSS Services 16,826,783$ 3,578,620 2,320 155,540 163.31$ 60.95$Durable Medical Equipment 8,219,124$ 3,257,667 6,448 141,590 2.52$ 29.77$Limited Dental Services 11,397$ 460 167 20 24.77$ 0.04$Optical 279,585$ 3,943 2,444 171 70.90$ 1.01$Lab and X-Ray 2,637,137$ 153,089 9,579 6,654 17.23$ 9.55$Transportation 2,602,438$ 43,163 4,053 1,876 60.29$ 9.43$Subtotal (Medical) 260,791,483$ 8,192,102 24,058 944.58$CC4C LHD Payments 1,963$ 435 N/A 19 4.51$ 0.01$OBCM LHD Payments 213,426$ 43,470 N/A 1,889 4.91$ 0.77$Medical Home Payments 1,087,407$ 227,397 N/A 9,884 4.78$ 3.94$Subtotal (LHD/Medical Home Payments) 1,302,796$ 271,302 N/A 4.72$Total (Medical + LHD/Medical Home) 262,094,279$ 8,463,404 N/A 949.30$
Note: Please refer to Section 5 for more information on the detailed services captured under each COS in the exhibit above.
276,09323,00828,128
SFY 2016
Region 4
Standard Plan (Non-Duals)
Aged, Blind, Disabled
All Ages
48 of 197Prepared by Mercer GovernmentHuman Services Consulting
RFP 30-190029-DHBSection IX. Medicaid Managed Care Draft Rate Book (SFY 2020)

Exhibit 20
Time Period/Region Selections:Time Period:
Region:
Population Selections:Program Type:
Category of Aid:
Age:
Member Months/Deliveries:Average Monthly Members/Deliveries:Eligibles:
Category of Service Incurred Claims Utilization UsersUtilizationPer 1,000
Unit CostPMPM/Payment
Inpatient — PH 30,442,859$ 55,574 12,844 3,774 547.79$ 172.30$Inpatient — BH -$ - - - -$ -$Outpatient Hospital 1,453,859$ 9,719 5,050 660 149.59$ 8.23$Emergency Room 3,766,594$ 15,453 8,789 1,049 243.75$ 21.32$Physician 13,570,959$ 148,528 23,981 10,088 91.37$ 76.81$FQHC/RHC 1,293,410$ 12,386 2,990 841 104.42$ 7.32$Other Clinic 6,331,693$ 65,558 21,845 4,453 96.58$ 35.84$Other Practitioner 3,800$ 83 16 6 45.75$ 0.02$Therapies 125,205$ 1,308 265 89 95.72$ 0.71$Prescribed Drugs 2,466,439$ 46,285 13,261 3,144 53.29$ 13.96$Other BH Services 6,358$ 192 23 13 33.11$ 0.04$LTSS Services 100,995$ 6,928 23 471 14.58$ 0.57$Durable Medical Equipment 513,155$ 81,363 1,870 5,526 6.31$ 2.90$Limited Dental Services 367,652$ 14,825 6,261 1,007 24.80$ 2.08$Optical 2,400$ 28 27 2 85.71$ 0.01$Lab and X-Ray 105,238$ 7,805 3,444 530 13.48$ 0.60$Transportation 184,550$ 1,819 844 124 101.45$ 1.04$Subtotal (Medical) 60,735,166$ 467,853 26,562 343.75$CC4C LHD Payments 785,335$ 173,753 N/A 11,801 4.52$ 4.44$OBCM LHD Payments -$ - N/A - -$ -$Medical Home Payments 306,684$ 125,508 N/A 8,524 2.44$ 1.74$Subtotal (LHD/Medical Home Payments) 1,092,019$ 299,261 N/A 6.18$Total (Medical + LHD/Medical Home) 61,827,185$ 767,114 N/A 349.93$
Note: Please refer to Section 5 for more information on the detailed services captured under each COS in the exhibit above.
176,68514,72428,904
SFY 2016
Region 4
Standard Plan (Non-Duals)
TANF and Other Related Children/Adults
Newborn (<1)
49 of 197Prepared by Mercer GovernmentHuman Services Consulting
RFP 30-190029-DHBSection IX. Medicaid Managed Care Draft Rate Book (SFY 2020)

Exhibit 21
Time Period/Region Selections:Time Period:
Region:
Population Selections:Program Type:
Category of Aid:
Age:
Member Months/Deliveries:Average Monthly Members/Deliveries:Eligibles:
Category of Service Incurred Claims Utilization UsersUtilizationPer 1,000
Unit CostPMPM/Payment
Inpatient — PH 10,021,676$ 8,698 2,056 41 1,152.19$ 3.91$Inpatient — BH 2,369,461$ 3,695 422 17 641.27$ 0.93$Outpatient Hospital 20,225,810$ 65,510 36,361 307 308.75$ 7.90$Emergency Room 31,244,482$ 104,503 65,122 490 298.98$ 12.20$Physician 48,721,156$ 610,010 163,973 2,858 79.87$ 19.02$FQHC/RHC 5,550,833$ 53,532 23,023 251 103.69$ 2.17$Other Clinic 14,120,485$ 140,583 112,040 659 100.44$ 5.51$Other Practitioner 247,312$ 3,035 1,305 14 81.48$ 0.10$Therapies 13,737,346$ 121,207 8,020 568 113.34$ 5.36$Prescribed Drugs 76,171,672$ 775,889 135,031 3,635 98.17$ 29.74$Other BH Services 14,658,536$ 182,631 16,403 856 80.26$ 5.72$LTSS Services 267,248$ 33,717 99 158 101.23$ 0.10$Durable Medical Equipment 4,673,169$ 1,632,429 15,827 7,647 2.86$ 1.82$Limited Dental Services 880,838$ 35,641 13,953 167 24.71$ 0.34$Optical 2,779,619$ 33,491 30,350 157 83.00$ 1.09$Lab and X-Ray 3,152,389$ 216,303 39,998 1,013 14.57$ 1.23$Transportation 813,013$ 9,735 4,894 46 83.51$ 0.32$Subtotal (Medical) 249,635,045$ 4,030,610 203,876 97.45$CC4C LHD Payments 2,736,815$ 607,444 N/A 2,846 4.51$ 1.07$OBCM LHD Payments 1,412,063$ 288,135 N/A 1,350 4.90$ 0.55$Medical Home Payments 5,442,294$ 2,215,381 N/A 10,378 2.46$ 2.12$Subtotal (LHD/Medical Home Payments) 9,591,172$ 3,110,960 N/A 3.74$Total (Medical + LHD/Medical Home) 259,226,217$ 7,141,570 N/A 101.20$
Note: Please refer to Section 5 for more information on the detailed services captured under each COS in the exhibit above.
2,561,546213,462255,071
SFY 2016
Region 4
Standard Plan (Non-Duals)
TANF and Other Related Children/Adults
Child (1-20)
50 of 197Prepared by Mercer GovernmentHuman Services Consulting
RFP 30-190029-DHBSection IX. Medicaid Managed Care Draft Rate Book (SFY 2020)

Exhibit 22
Time Period/Region Selections:Time Period:
Region:
Population Selections:Program Type:
Category of Aid:
Age:
Member Months/Deliveries:Average Monthly Members/Deliveries:Eligibles:
Category of Service Incurred Claims Utilization UsersUtilizationPer 1,000
Unit CostPMPM/Payment
Inpatient — PH 10,652,638$ 9,808 2,027 238 1,086.07$ 21.59$Inpatient — BH 737,019$ 1,015 209 25 726.22$ 1.49$Outpatient Hospital 14,583,002$ 43,489 20,390 1,057 335.32$ 29.55$Emergency Room 22,102,801$ 48,951 24,142 1,190 451.53$ 44.79$Physician 21,578,124$ 184,335 38,681 4,482 117.06$ 43.72$FQHC/RHC 1,707,792$ 15,848 6,223 385 107.76$ 3.46$Other Clinic 4,156,204$ 25,403 17,805 618 163.61$ 8.42$Other Practitioner 148,026$ 1,972 891 48 75.05$ 0.30$Therapies 1,393$ 29 27 1 47.96$ 0.00$Prescribed Drugs 39,655,962$ 478,426 35,233 11,633 82.89$ 80.35$Other BH Services 4,085,791$ 52,573 5,804 1,278 77.72$ 8.28$LTSS Services 862,968$ 160,316 309 3,898 163.02$ 1.75$Durable Medical Equipment 2,133,831$ 1,049,049 4,612 25,508 2.03$ 4.32$Limited Dental Services 77$ 4 3 0 19.13$ 0.00$Optical 164,480$ 2,376 1,440 58 69.23$ 0.33$Lab and X-Ray 6,366,443$ 330,133 23,901 8,027 19.28$ 12.90$Transportation 736,771$ 9,568 3,414 233 77.00$ 1.49$Subtotal (Medical) 129,673,324$ 2,413,297 49,345 262.76$CC4C LHD Payments 112$ 25 N/A 1 4.47$ 0.00$OBCM LHD Payments 1,798,462$ 367,823 N/A 8,944 4.89$ 3.64$Medical Home Payments 756,687$ 312,935 N/A 7,609 2.42$ 1.53$Subtotal (LHD/Medical Home Payments) 2,555,261$ 680,783 N/A 5.18$Total (Medical + LHD/Medical Home) 132,228,585$ 3,094,080 N/A 267.93$
Note: Please refer to Section 5 for more information on the detailed services captured under each COS in the exhibit above.
493,51341,12664,794
SFY 2016
Region 4
Standard Plan (Non-Duals)
TANF and Other Related Children/Adults
Adult (21+)
51 of 197Prepared by Mercer GovernmentHuman Services Consulting
RFP 30-190029-DHBSection IX. Medicaid Managed Care Draft Rate Book (SFY 2020)

Exhibit 23
Time Period/Region Selections:Time Period:
Region:
Population Selections:Program Type:
Category of Aid:
Age:
Member Months/Deliveries:Average Monthly Members/Deliveries:Eligibles:
Category of Service Incurred Claims Utilization UsersUtilizationPer 1,000
Unit CostPMPM/Payment
Inpatient — PH 19,460,479$ 27,881 9,627 33,814 697.97$ 1,966.78$Inpatient — BH -$ - - - -$ -$Outpatient Hospital 3,959,874$ 27,345 3,723 33,163 144.81$ 400.21$Emergency Room 4,249,729$ 11,649 1,470 14,128 364.81$ 429.50$Physician 15,371,357$ 69,061 9,741 83,756 222.58$ 1,553.51$FQHC/RHC 551,826$ 4,299 314 5,214 128.36$ 55.77$Other Clinic 2,223,071$ 12,893 3,070 15,636 172.43$ 224.68$Other Practitioner 120$ 3 16 4 39.84$ 0.01$Therapies -$ - - - -$ -$Prescribed Drugs -$ - - - -$ -$Other BH Services 889$ 14 199 17 63.47$ 0.09$LTSS Services 24,929$ 6,100 19 7,398 4.09$ 2.52$Durable Medical Equipment 21,990$ 722 260 876 30.45$ 2.22$Limited Dental Services -$ - - - -$ -$Optical 114$ 2 19 2 57.06$ 0.01$Lab and X-Ray 427,670$ 18,051 2,271 21,892 23.69$ 43.22$Transportation 129,702$ 1,361 629 1,650 95.32$ 13.11$Subtotal (Medical) 46,421,750$ 179,382 10,110 4,691.63$CC4C LHD Payments -$ - N/A - -$ -$OBCM LHD Payments -$ - N/A - -$ -$Medical Home Payments -$ - N/A - -$ -$Subtotal (LHD/Medical Home Payments) -$ - N/A -$Total (Medical + LHD/Medical Home) 46,421,750$ 179,382 N/A 4,691.63$
Note: Please refer to Section 5 for more information on the detailed services captured under each COS in the exhibit above.
9,895825
10,183
SFY 2016
Region 4
Standard Plan (Non-Duals)
Maternity Event
All Ages
52 of 197Prepared by Mercer GovernmentHuman Services Consulting
RFP 30-190029-DHBSection IX. Medicaid Managed Care Draft Rate Book (SFY 2020)

Exhibit 24
Time Period/Region Selections:Time Period:
Region:
Population Selections:Program Type:
Category of Aid:
Age:
Member Months/Deliveries:Average Monthly Members/Deliveries:Eligibles:
Category of Service Incurred Claims Utilization UsersUtilizationPer 1,000
Unit CostPMPM/Payment
Inpatient — PH 108,536,794$ 140,656 30,216 481 771.65$ 30.94$Inpatient — BH 4,920,057$ 7,351 939 25 669.31$ 1.40$Outpatient Hospital 66,189,817$ 200,143 77,606 685 330.71$ 18.87$Emergency Room 76,547,919$ 211,278 111,490 723 362.31$ 21.82$Physician 127,151,009$ 1,209,477 256,919 4,138 105.13$ 36.25$FQHC/RHC 10,984,883$ 102,679 37,475 351 106.98$ 3.13$Other Clinic 30,188,223$ 252,450 159,365 864 119.58$ 8.61$Other Practitioner 571,105$ 7,274 3,208 25 78.51$ 0.16$Therapies 15,239,649$ 134,573 9,011 460 113.24$ 4.34$Prescribed Drugs 227,956,436$ 1,989,834 209,164 6,807 114.56$ 64.98$Other BH Services 23,685,173$ 338,819 28,435 1,159 69.91$ 6.75$LTSS Services 18,082,923$ 3,785,682 2,770 12,950 164.79$ 5.16$Durable Medical Equipment 15,561,269$ 6,021,230 29,017 20,598 2.58$ 4.44$Limited Dental Services 1,259,963$ 50,931 20,384 174 24.74$ 0.36$Optical 3,226,198$ 39,840 34,280 136 80.98$ 0.92$Lab and X-Ray 12,688,878$ 725,381 79,193 2,481 17.49$ 3.62$Transportation 4,466,473$ 65,646 13,834 225 68.04$ 1.27$Subtotal (Medical) 747,256,769$ 15,283,244 313,396 213.02$CC4C LHD Payments 3,524,224$ 781,657 N/A 2,674 4.51$ 1.00$OBCM LHD Payments 3,423,952$ 699,428 N/A 2,393 4.90$ 0.98$Medical Home Payments 7,593,072$ 2,881,221 N/A 9,856 2.64$ 2.16$Subtotal (LHD/Medical Home Payments) 14,541,248$ 4,362,306 N/A 4.15$Total (Medical + LHD/Medical Home) 761,798,016$ 19,645,550 N/A 217.17$
Note: Please refer to Section 5 for more information on the detailed services captured under each COS in the exhibit above.
3,507,837292,320387,080
SFY 2016
Region 4
Standard Plan (Non-Duals)
All Population Groups
All Ages
53 of 197Prepared by Mercer GovernmentHuman Services Consulting
RFP 30-190029-DHBSection IX. Medicaid Managed Care Draft Rate Book (SFY 2020)

7.1.5 SFY 2016 Region 5 Exhibits
54 of 197Prepared by Mercer GovernmentHuman Services Consulting
RFP 30-190029-DHBSection IX. Medicaid Managed Care Draft Rate Book (SFY 2020)

Exhibit 25
Time Period/Region Selections:Time Period:
Region:
Population Selections:Program Type:
Category of Aid:
Age:
Member Months/Deliveries:Average Monthly Members/Deliveries:Eligibles:
Category of Service Incurred Claims Utilization UsersUtilizationPer 1,000
Unit CostPMPM/Payment
Inpatient — PH 42,980,100$ 47,378 4,516 1,822 907.18$ 137.71$Inpatient — BH 1,383,726$ 2,116 372 81 653.89$ 4.43$Outpatient Hospital 26,374,888$ 53,612 13,698 2,061 491.96$ 84.51$Emergency Room 17,104,032$ 39,021 14,405 1,500 438.33$ 54.80$Physician 35,678,291$ 252,643 23,588 9,714 141.22$ 114.32$FQHC/RHC 2,016,353$ 20,506 4,975 788 98.33$ 6.46$Other Clinic 3,243,299$ 7,287 4,596 280 445.05$ 10.39$Other Practitioner 271,106$ 3,666 1,283 141 73.96$ 0.87$Therapies 2,029,014$ 18,785 958 722 108.02$ 6.50$Prescribed Drugs 116,567,756$ 872,775 23,493 33,557 133.56$ 373.49$Other BH Services 4,728,085$ 66,653 6,058 2,563 70.94$ 15.15$LTSS Services 20,646,580$ 4,522,069 2,937 173,869 161.39$ 66.15$Durable Medical Equipment 9,173,715$ 3,694,744 7,288 142,059 2.48$ 29.39$Limited Dental Services 8,320$ 336 129 13 24.75$ 0.03$Optical 496,667$ 7,642 3,602 294 65.00$ 1.59$Lab and X-Ray 3,915,422$ 217,209 11,915 8,351 18.03$ 12.55$Transportation 2,060,412$ 28,966 5,435 1,114 71.13$ 6.60$Subtotal (Medical) 288,677,766$ 9,855,407 26,943 924.95$CC4C LHD Payments 2,257$ 500 N/A 19 4.51$ 0.01$OBCM LHD Payments 245,000$ 49,899 N/A 1,919 4.91$ 0.78$Medical Home Payments 1,237,466$ 259,007 N/A 9,959 4.78$ 3.96$Subtotal (LHD/Medical Home Payments) 1,484,723$ 309,406 N/A 4.76$Total (Medical + LHD/Medical Home) 290,162,489$ 10,164,813 N/A 929.70$
Note: Please refer to Section 5 for more information on the detailed services captured under each COS in the exhibit above.
312,10326,00931,124
SFY 2016
Region 5
Standard Plan (Non-Duals)
Aged, Blind, Disabled
All Ages
55 of 197Prepared by Mercer GovernmentHuman Services Consulting
RFP 30-190029-DHBSection IX. Medicaid Managed Care Draft Rate Book (SFY 2020)

Exhibit 26
Time Period/Region Selections:Time Period:
Region:
Population Selections:Program Type:
Category of Aid:
Age:
Member Months/Deliveries:Average Monthly Members/Deliveries:Eligibles:
Category of Service Incurred Claims Utilization UsersUtilizationPer 1,000
Unit CostPMPM/Payment
Inpatient — PH 24,601,998$ 46,618 10,363 3,976 527.74$ 174.84$Inpatient — BH -$ - - - -$ -$Outpatient Hospital 998,951$ 8,397 4,281 716 118.97$ 7.10$Emergency Room 2,754,046$ 14,025 7,748 1,196 196.37$ 19.57$Physician 11,455,591$ 119,505 19,799 10,192 95.86$ 81.41$FQHC/RHC 460,136$ 4,621 1,079 394 99.58$ 3.27$Other Clinic 5,219,250$ 51,899 18,109 4,426 100.57$ 37.09$Other Practitioner 3,873$ 52 16 4 74.42$ 0.03$Therapies 81,601$ 971 178 83 84.06$ 0.58$Prescribed Drugs 2,046,215$ 50,954 12,371 4,345 40.16$ 14.54$Other BH Services 2,552$ 138 7 12 18.49$ 0.02$LTSS Services 54,472$ 1,997 65 170 27.27$ 0.39$Durable Medical Equipment 480,535$ 109,985 1,766 9,380 4.37$ 3.42$Limited Dental Services 343,593$ 13,872 5,738 1,183 24.77$ 2.44$Optical 12,352$ 157 123 13 78.65$ 0.09$Lab and X-Ray 113,524$ 5,526 2,322 471 20.54$ 0.81$Transportation 185,427$ 1,324 785 113 140.05$ 1.32$Subtotal (Medical) 48,814,117$ 430,040 21,241 346.91$CC4C LHD Payments 628,182$ 138,989 N/A 11,853 4.52$ 4.46$OBCM LHD Payments -$ - N/A - -$ -$Medical Home Payments 254,644$ 104,969 N/A 8,952 2.43$ 1.81$Subtotal (LHD/Medical Home Payments) 882,826$ 243,958 N/A 6.27$Total (Medical + LHD/Medical Home) 49,696,943$ 673,998 N/A 353.19$
Note: Please refer to Section 5 for more information on the detailed services captured under each COS in the exhibit above.
140,71111,72623,094
SFY 2016
Region 5
Standard Plan (Non-Duals)
TANF and Other Related Children/Adults
Newborn (<1)
56 of 197Prepared by Mercer GovernmentHuman Services Consulting
RFP 30-190029-DHBSection IX. Medicaid Managed Care Draft Rate Book (SFY 2020)

Exhibit 27
Time Period/Region Selections:Time Period:
Region:
Population Selections:Program Type:
Category of Aid:
Age:
Member Months/Deliveries:Average Monthly Members/Deliveries:Eligibles:
Category of Service Incurred Claims Utilization UsersUtilizationPer 1,000
Unit CostPMPM/Payment
Inpatient — PH 9,713,159$ 9,013 2,273 51 1,077.73$ 4.58$Inpatient — BH 1,394,564$ 2,214 311 13 629.78$ 0.66$Outpatient Hospital 15,722,919$ 59,014 33,568 334 266.43$ 7.41$Emergency Room 26,005,939$ 105,950 63,131 599 245.46$ 12.25$Physician 42,463,907$ 575,829 142,263 3,255 73.74$ 20.01$FQHC/RHC 2,875,787$ 31,068 12,475 176 92.56$ 1.35$Other Clinic 12,267,363$ 116,685 93,129 660 105.13$ 5.78$Other Practitioner 245,584$ 3,374 1,227 19 72.79$ 0.12$Therapies 12,480,599$ 115,042 7,036 650 108.49$ 5.88$Prescribed Drugs 75,677,720$ 850,321 125,255 4,807 89.00$ 35.65$Other BH Services 11,344,267$ 155,995 14,877 882 72.72$ 5.34$LTSS Services 190,433$ 37,810 126 214 93.59$ 0.09$Durable Medical Equipment 3,042,897$ 1,188,599 10,573 6,720 2.56$ 1.43$Limited Dental Services 951,522$ 38,629 14,324 218 24.63$ 0.45$Optical 2,928,708$ 36,044 30,515 204 81.25$ 1.38$Lab and X-Ray 2,659,638$ 151,971 29,719 859 17.50$ 1.25$Transportation 903,051$ 9,793 5,159 55 92.21$ 0.43$Subtotal (Medical) 220,868,056$ 3,487,350 169,878 104.06$CC4C LHD Payments 2,230,710$ 495,131 N/A 2,799 4.51$ 1.05$OBCM LHD Payments 1,316,151$ 268,567 N/A 1,518 4.90$ 0.62$Medical Home Payments 4,510,956$ 1,848,289 N/A 10,449 2.44$ 2.13$Subtotal (LHD/Medical Home Payments) 8,057,817$ 2,611,987 N/A 3.80$Total (Medical + LHD/Medical Home) 228,925,873$ 6,099,337 N/A 107.85$
Note: Please refer to Section 5 for more information on the detailed services captured under each COS in the exhibit above.
2,122,571176,881207,787
SFY 2016
Region 5
Standard Plan (Non-Duals)
TANF and Other Related Children/Adults
Child (1-20)
57 of 197Prepared by Mercer GovernmentHuman Services Consulting
RFP 30-190029-DHBSection IX. Medicaid Managed Care Draft Rate Book (SFY 2020)
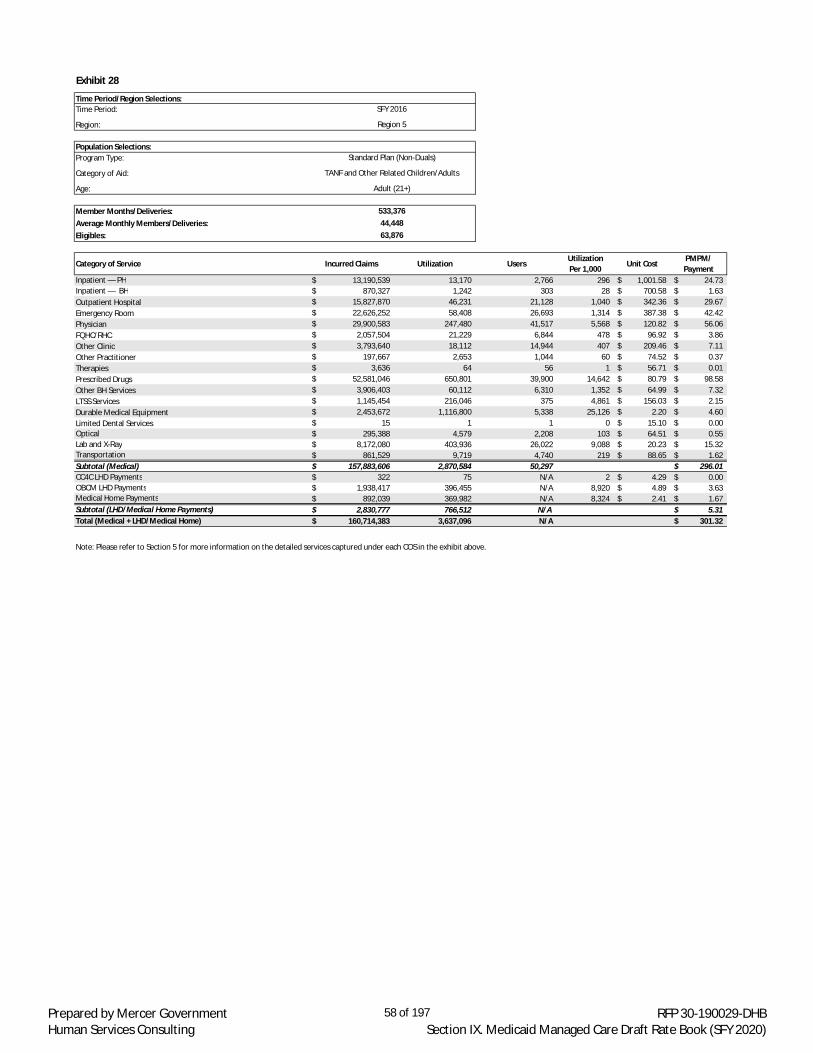
Exhibit 28
Time Period/Region Selections:Time Period:
Region:
Population Selections:Program Type:
Category of Aid:
Age:
Member Months/Deliveries:Average Monthly Members/Deliveries:Eligibles:
Category of Service Incurred Claims Utilization UsersUtilizationPer 1,000
Unit CostPMPM/Payment
Inpatient — PH 13,190,539$ 13,170 2,766 296 1,001.58$ 24.73$Inpatient — BH 870,327$ 1,242 303 28 700.58$ 1.63$Outpatient Hospital 15,827,870$ 46,231 21,128 1,040 342.36$ 29.67$Emergency Room 22,626,252$ 58,408 26,693 1,314 387.38$ 42.42$Physician 29,900,583$ 247,480 41,517 5,568 120.82$ 56.06$FQHC/RHC 2,057,504$ 21,229 6,844 478 96.92$ 3.86$Other Clinic 3,793,640$ 18,112 14,944 407 209.46$ 7.11$Other Practitioner 197,667$ 2,653 1,044 60 74.52$ 0.37$Therapies 3,636$ 64 56 1 56.71$ 0.01$Prescribed Drugs 52,581,046$ 650,801 39,900 14,642 80.79$ 98.58$Other BH Services 3,906,403$ 60,112 6,310 1,352 64.99$ 7.32$LTSS Services 1,145,454$ 216,046 375 4,861 156.03$ 2.15$Durable Medical Equipment 2,453,672$ 1,116,800 5,338 25,126 2.20$ 4.60$Limited Dental Services 15$ 1 1 0 15.10$ 0.00$Optical 295,388$ 4,579 2,208 103 64.51$ 0.55$Lab and X-Ray 8,172,080$ 403,936 26,022 9,088 20.23$ 15.32$Transportation 861,529$ 9,719 4,740 219 88.65$ 1.62$Subtotal (Medical) 157,883,606$ 2,870,584 50,297 296.01$CC4C LHD Payments 322$ 75 N/A 2 4.29$ 0.00$OBCM LHD Payments 1,938,417$ 396,455 N/A 8,920 4.89$ 3.63$Medical Home Payments 892,039$ 369,982 N/A 8,324 2.41$ 1.67$Subtotal (LHD/Medical Home Payments) 2,830,777$ 766,512 N/A 5.31$Total (Medical + LHD/Medical Home) 160,714,383$ 3,637,096 N/A 301.32$
Note: Please refer to Section 5 for more information on the detailed services captured under each COS in the exhibit above.
533,37644,44863,876
SFY 2016
Region 5
Standard Plan (Non-Duals)
TANF and Other Related Children/Adults
Adult (21+)
58 of 197Prepared by Mercer GovernmentHuman Services Consulting
RFP 30-190029-DHBSection IX. Medicaid Managed Care Draft Rate Book (SFY 2020)

Exhibit 29
Time Period/Region Selections:Time Period:
Region:
Population Selections:Program Type:
Category of Aid:
Age:
Member Months/Deliveries:Average Monthly Members/Deliveries:Eligibles:
Category of Service Incurred Claims Utilization UsersUtilizationPer 1,000
Unit CostPMPM/Payment
Inpatient — PH 18,036,806$ 26,193 8,539 35,767 688.61$ 2,052.45$Inpatient — BH -$ - - - -$ -$Outpatient Hospital 3,131,933$ 27,019 3,709 36,895 115.92$ 356.39$Emergency Room 3,128,692$ 9,950 1,145 13,587 314.45$ 356.02$Physician 15,632,406$ 63,245 8,681 86,362 247.17$ 1,778.85$FQHC/RHC 465,819$ 3,216 299 4,392 144.84$ 53.01$Other Clinic 970,427$ 6,891 1,764 9,410 140.82$ 110.43$Other Practitioner 39$ 1 14 1 38.73$ 0.00$Therapies 61$ 1 1 1 61.21$ 0.01$Prescribed Drugs -$ - - - -$ -$Other BH Services 219$ 4 185 5 54.68$ 0.02$LTSS Services 29,229$ 5,508 15 7,522 5.31$ 3.33$Durable Medical Equipment 31,789$ 644 604 880 49.35$ 3.62$Limited Dental Services -$ - - - -$ -$Optical 194$ 3 20 4 64.58$ 0.02$Lab and X-Ray 345,324$ 14,963 1,806 20,433 23.08$ 39.30$Transportation 176,420$ 1,690 648 2,308 104.37$ 20.08$Subtotal (Medical) 41,949,358$ 159,330 8,927 4,773.52$CC4C LHD Payments -$ - N/A - -$ -$OBCM LHD Payments -$ - N/A - -$ -$Medical Home Payments -$ - N/A - -$ -$Subtotal (LHD/Medical Home Payments) -$ - N/A -$Total (Medical + LHD/Medical Home) 41,949,358$ 159,330 N/A 4,773.52$
Note: Please refer to Section 5 for more information on the detailed services captured under each COS in the exhibit above.
8,788732
8,964
SFY 2016
Region 5
Standard Plan (Non-Duals)
Maternity Event
All Ages
59 of 197Prepared by Mercer GovernmentHuman Services Consulting
RFP 30-190029-DHBSection IX. Medicaid Managed Care Draft Rate Book (SFY 2020)

Exhibit 30
Time Period/Region Selections:Time Period:
Region:
Population Selections:Program Type:
Category of Aid:
Age:
Member Months/Deliveries:Average Monthly Members/Deliveries:Eligibles:
Category of Service Incurred Claims Utilization UsersUtilizationPer 1,000
Unit CostPMPM/Payment
Inpatient — PH 108,522,603$ 142,371 28,457 550 762.25$ 34.91$Inpatient — BH 3,648,617$ 5,573 987 22 654.72$ 1.17$Outpatient Hospital 62,056,562$ 194,273 76,384 750 319.43$ 19.96$Emergency Room 71,618,962$ 227,354 113,122 878 315.01$ 23.04$Physician 135,130,778$ 1,258,702 235,848 4,859 107.36$ 43.47$FQHC/RHC 7,875,598$ 80,640 25,672 311 97.66$ 2.53$Other Clinic 25,493,979$ 200,875 132,542 775 126.91$ 8.20$Other Practitioner 718,268$ 9,745 3,584 38 73.70$ 0.23$Therapies 14,594,911$ 134,862 8,229 521 108.22$ 4.69$Prescribed Drugs 246,872,736$ 2,424,851 206,747 9,360 101.81$ 79.41$Other BH Services 19,981,526$ 282,902 27,437 1,092 70.63$ 6.43$LTSS Services 22,066,168$ 4,783,431 3,519 18,464 158.33$ 7.10$Durable Medical Equipment 15,182,608$ 6,110,772 25,569 23,588 2.48$ 4.88$Limited Dental Services 1,303,450$ 52,838 20,192 204 24.67$ 0.42$Optical 3,733,310$ 48,424 36,468 187 77.10$ 1.20$Lab and X-Ray 15,205,989$ 793,605 71,784 3,063 19.16$ 4.89$Transportation 4,186,839$ 51,493 16,767 199 81.31$ 1.35$Subtotal (Medical) 758,192,903$ 16,802,710 276,945 243.89$CC4C LHD Payments 2,861,471$ 634,695 N/A 2,450 4.51$ 0.92$OBCM LHD Payments 3,499,567$ 714,921 N/A 2,760 4.90$ 1.13$Medical Home Payments 6,895,105$ 2,582,247 N/A 9,968 2.67$ 2.22$Subtotal (LHD/Medical Home Payments) 13,256,142$ 3,931,863 N/A 4.26$Total (Medical + LHD/Medical Home) 771,449,045$ 20,734,573 N/A 248.15$
Note: Please refer to Section 5 for more information on the detailed services captured under each COS in the exhibit above.
3,108,760259,063334,845
SFY 2016
Region 5
Standard Plan (Non-Duals)
All Population Groups
All Ages
60 of 197Prepared by Mercer GovernmentHuman Services Consulting
RFP 30-190029-DHBSection IX. Medicaid Managed Care Draft Rate Book (SFY 2020)

7.1.6 SFY 2016 Region 6 Exhibits
61 of 197Prepared by Mercer GovernmentHuman Services Consulting
RFP 30-190029-DHBSection IX. Medicaid Managed Care Draft Rate Book (SFY 2020)

Exhibit 31
Time Period/Region Selections:Time Period:
Region:
Population Selections:Program Type:
Category of Aid:
Age:
Member Months/Deliveries:Average Monthly Members/Deliveries:Eligibles:
Category of Service Incurred Claims Utilization UsersUtilizationPer 1,000
Unit CostPMPM/Payment
Inpatient — PH 33,746,462$ 33,582 3,497 1,483 1,004.89$ 124.17$Inpatient — BH 2,041,020$ 2,925 381 129 697.69$ 7.51$Outpatient Hospital 18,007,561$ 35,785 10,613 1,580 503.22$ 66.26$Emergency Room 15,518,336$ 32,035 12,348 1,414 484.42$ 57.10$Physician 27,413,637$ 188,235 20,024 8,312 145.63$ 100.87$FQHC/RHC 1,987,124$ 19,232 5,328 849 103.32$ 7.31$Other Clinic 3,558,962$ 7,844 4,459 346 453.73$ 13.10$Other Practitioner 231,660$ 3,202 1,216 141 72.35$ 0.85$Therapies 1,416,161$ 12,220 613 540 115.89$ 5.21$Prescribed Drugs 95,090,588$ 696,518 20,453 30,755 136.52$ 349.90$Other BH Services 3,391,052$ 58,654 5,772 2,590 57.81$ 12.48$LTSS Services 17,109,712$ 3,489,771 2,090 154,092 164.84$ 62.96$Durable Medical Equipment 9,274,550$ 3,136,402 6,108 138,489 2.96$ 34.13$Limited Dental Services 6,713$ 274 99 12 24.49$ 0.02$Optical 338,362$ 4,874 3,082 215 69.43$ 1.25$Lab and X-Ray 2,617,835$ 149,366 10,766 6,595 17.53$ 9.63$Transportation 2,639,256$ 41,632 4,335 1,838 63.39$ 9.71$Subtotal (Medical) 234,388,990$ 7,912,551 23,632 862.46$CC4C LHD Payments 1,581$ 350 N/A 15 4.52$ 0.01$OBCM LHD Payments 214,584$ 43,705 N/A 1,930 4.91$ 0.79$Medical Home Payments 1,093,735$ 229,616 N/A 10,139 4.76$ 4.02$Subtotal (LHD/Medical Home Payments) 1,309,900$ 273,671 N/A 4.82$Total (Medical + LHD/Medical Home) 235,698,890$ 8,186,222 N/A 867.28$
Note: Please refer to Section 5 for more information on the detailed services captured under each COS in the exhibit above.
271,76822,64727,187
SFY 2016
Region 6
Standard Plan (Non-Duals)
Aged, Blind, Disabled
All Ages
62 of 197Prepared by Mercer GovernmentHuman Services Consulting
RFP 30-190029-DHBSection IX. Medicaid Managed Care Draft Rate Book (SFY 2020)

Exhibit 32
Time Period/Region Selections:Time Period:
Region:
Population Selections:Program Type:
Category of Aid:
Age:
Member Months/Deliveries:Average Monthly Members/Deliveries:Eligibles:
Category of Service Incurred Claims Utilization UsersUtilizationPer 1,000
Unit CostPMPM/Payment
Inpatient — PH 19,176,688$ 34,213 8,324 3,580 560.51$ 167.22$Inpatient — BH -$ - - - -$ -$Outpatient Hospital 932,170$ 5,729 3,373 600 162.71$ 8.13$Emergency Room 2,602,548$ 10,661 5,956 1,116 244.11$ 22.69$Physician 8,026,720$ 88,860 15,709 9,298 90.33$ 69.99$FQHC/RHC 667,309$ 6,408 1,484 671 104.13$ 5.82$Other Clinic 4,640,715$ 41,615 14,369 4,355 111.51$ 40.47$Other Practitioner 1,567$ 25 15 3 62.62$ 0.01$Therapies 102,872$ 903 145 94 113.97$ 0.90$Prescribed Drugs 1,547,167$ 33,986 9,379 3,556 45.52$ 13.49$Other BH Services 5,516$ 339 9 35 16.27$ 0.05$LTSS Services 9,048$ 547 9 57 16.54$ 0.08$Durable Medical Equipment 209,818$ 22,958 1,066 2,402 9.14$ 1.83$Limited Dental Services 308,066$ 12,428 5,098 1,301 24.79$ 2.69$Optical 6,295$ 73 68 8 86.20$ 0.05$Lab and X-Ray 52,726$ 3,312 1,615 347 15.92$ 0.46$Transportation 252,244$ 1,990 724 208 126.76$ 2.20$Subtotal (Medical) 38,541,467$ 264,049 17,306 336.08$CC4C LHD Payments 510,941$ 113,049 N/A 11,830 4.52$ 4.46$OBCM LHD Payments -$ - N/A - -$ -$Medical Home Payments 212,887$ 87,084 N/A 9,113 2.44$ 1.86$Subtotal (LHD/Medical Home Payments) 723,828$ 200,133 N/A 6.31$Total (Medical + LHD/Medical Home) 39,265,296$ 464,182 N/A 342.40$
Note: Please refer to Section 5 for more information on the detailed services captured under each COS in the exhibit above.
114,6789,556
18,758
SFY 2016
Region 6
Standard Plan (Non-Duals)
TANF and Other Related Children/Adults
Newborn (<1)
63 of 197Prepared by Mercer GovernmentHuman Services Consulting
RFP 30-190029-DHBSection IX. Medicaid Managed Care Draft Rate Book (SFY 2020)

Exhibit 33
Time Period/Region Selections:Time Period:
Region:
Population Selections:Program Type:
Category of Aid:
Age:
Member Months/Deliveries:Average Monthly Members/Deliveries:Eligibles:
Category of Service Incurred Claims Utilization UsersUtilizationPer 1,000
Unit CostPMPM/Payment
Inpatient — PH 7,145,189$ 5,875 1,281 42 1,216.16$ 4.24$Inpatient — BH 1,367,229$ 2,342 289 17 583.88$ 0.81$Outpatient Hospital 11,778,648$ 35,556 21,302 253 331.27$ 6.99$Emergency Room 22,751,995$ 82,296 49,499 586 276.47$ 13.51$Physician 28,818,468$ 417,336 110,112 2,974 69.05$ 17.11$FQHC/RHC 3,289,015$ 32,669 13,162 233 100.68$ 1.95$Other Clinic 10,505,924$ 96,433 76,729 687 108.95$ 6.24$Other Practitioner 185,005$ 2,491 950 18 74.28$ 0.11$Therapies 5,294,784$ 46,445 3,658 331 114.00$ 3.14$Prescribed Drugs 60,404,898$ 636,860 95,451 4,538 94.85$ 35.87$Other BH Services 7,096,542$ 103,600 12,382 738 68.50$ 4.21$LTSS Services 456,631$ 54,259 61 387 97.08$ 0.27$Durable Medical Equipment 2,638,242$ 986,319 8,081 7,029 2.67$ 1.57$Limited Dental Services 826,732$ 33,501 12,044 239 24.68$ 0.49$Optical 2,235,342$ 26,873 24,723 192 83.18$ 1.33$Lab and X-Ray 1,968,925$ 115,805 22,208 825 17.00$ 1.17$Transportation 867,571$ 10,676 3,929 76 81.26$ 0.52$Subtotal (Medical) 167,631,139$ 2,689,334 135,612 99.55$CC4C LHD Payments 1,789,238$ 397,139 N/A 2,830 4.51$ 1.06$OBCM LHD Payments 1,014,494$ 207,016 N/A 1,475 4.90$ 0.60$Medical Home Payments 3,673,284$ 1,501,853 N/A 10,703 2.45$ 2.18$Subtotal (LHD/Medical Home Payments) 6,477,016$ 2,106,008 N/A 3.85$Total (Medical + LHD/Medical Home) 174,108,155$ 4,795,342 N/A 103.39$
Note: Please refer to Section 5 for more information on the detailed services captured under each COS in the exhibit above.
1,683,919140,327166,388
SFY 2016
Region 6
Standard Plan (Non-Duals)
TANF and Other Related Children/Adults
Child (1-20)
64 of 197Prepared by Mercer GovernmentHuman Services Consulting
RFP 30-190029-DHBSection IX. Medicaid Managed Care Draft Rate Book (SFY 2020)

Exhibit 34
Time Period/Region Selections:Time Period:
Region:
Population Selections:Program Type:
Category of Aid:
Age:
Member Months/Deliveries:Average Monthly Members/Deliveries:Eligibles:
Category of Service Incurred Claims Utilization UsersUtilizationPer 1,000
Unit CostPMPM/Payment
Inpatient — PH 9,613,378$ 7,721 1,659 231 1,245.02$ 23.96$Inpatient — BH 1,007,650$ 1,374 246 41 733.50$ 2.51$Outpatient Hospital 10,378,550$ 26,984 14,510 807 384.62$ 25.86$Emergency Room 19,093,129$ 47,274 21,335 1,414 403.88$ 47.58$Physician 16,536,882$ 149,024 30,089 4,456 110.97$ 41.21$FQHC/RHC 1,716,029$ 17,262 6,018 516 99.41$ 4.28$Other Clinic 3,838,973$ 21,268 13,785 636 180.51$ 9.57$Other Practitioner 182,124$ 2,510 1,001 75 72.57$ 0.45$Therapies 120$ 2 2 0 59.72$ 0.00$Prescribed Drugs 35,015,197$ 424,751 29,947 12,701 82.44$ 87.25$Other BH Services 2,732,287$ 41,433 5,428 1,239 65.95$ 6.81$LTSS Services 637,940$ 112,513 214 3,364 108.78$ 1.59$Durable Medical Equipment 1,830,965$ 817,160 3,597 24,435 2.24$ 4.56$Limited Dental Services -$ - - - -$ -$Optical 155,921$ 2,256 1,481 67 69.12$ 0.39$Lab and X-Ray 5,238,306$ 254,812 19,930 7,620 20.56$ 13.05$Transportation 693,643$ 8,812 3,043 264 78.72$ 1.73$Subtotal (Medical) 108,671,094$ 1,935,154 38,739 270.80$CC4C LHD Payments 507$ 118 N/A 4 4.30$ 0.00$OBCM LHD Payments 1,491,982$ 305,139 N/A 9,125 4.89$ 3.72$Medical Home Payments 694,052$ 291,057 N/A 8,703 2.38$ 1.73$Subtotal (LHD/Medical Home Payments) 2,186,541$ 596,314 N/A 5.45$Total (Medical + LHD/Medical Home) 110,857,635$ 2,531,468 N/A 276.25$
Note: Please refer to Section 5 for more information on the detailed services captured under each COS in the exhibit above.
401,29933,44249,451
SFY 2016
Region 6
Standard Plan (Non-Duals)
TANF and Other Related Children/Adults
Adult (21+)
65 of 197Prepared by Mercer GovernmentHuman Services Consulting
RFP 30-190029-DHBSection IX. Medicaid Managed Care Draft Rate Book (SFY 2020)

Exhibit 35
Time Period/Region Selections:Time Period:
Region:
Population Selections:Program Type:
Category of Aid:
Age:
Member Months/Deliveries:Average Monthly Members/Deliveries:Eligibles:
Category of Service Incurred Claims Utilization UsersUtilizationPer 1,000
Unit CostPMPM/Payment
Inpatient — PH 15,473,680$ 20,211 7,284 32,522 765.61$ 2,074.93$Inpatient — BH -$ - - - -$ -$Outpatient Hospital 1,810,873$ 13,975 2,735 22,487 129.58$ 242.83$Emergency Room 2,903,617$ 10,194 1,413 16,403 284.84$ 389.36$Physician 12,212,921$ 48,927 7,194 78,729 249.62$ 1,637.68$FQHC/RHC 1,006,079$ 6,656 525 10,710 151.16$ 134.91$Other Clinic 1,630,980$ 12,154 2,393 19,557 134.20$ 218.70$Other Practitioner 271$ 4 12 6 67.77$ 0.04$Therapies -$ - - - -$ -$Prescribed Drugs -$ - - - -$ -$Other BH Services 88$ 1 177 2 88.00$ 0.01$LTSS Services 20,591$ 2,134 9 3,434 9.65$ 2.76$Durable Medical Equipment 25,608$ 339 163 546 75.53$ 3.43$Limited Dental Services -$ - - - -$ -$Optical 576$ 6 14 10 96.02$ 0.08$Lab and X-Ray 315,511$ 12,163 1,964 19,572 25.94$ 42.31$Transportation 151,602$ 1,426 566 2,295 106.30$ 20.33$Subtotal (Medical) 35,552,399$ 128,189 7,582 4,767.37$CC4C LHD Payments -$ - N/A - -$ -$OBCM LHD Payments -$ - N/A - -$ -$Medical Home Payments -$ - N/A - -$ -$Subtotal (LHD/Medical Home Payments) -$ - N/A -$Total (Medical + LHD/Medical Home) 35,552,399$ 128,189 N/A 4,767.37$
Note: Please refer to Section 5 for more information on the detailed services captured under each COS in the exhibit above.
7,457621
7,632
SFY 2016
Region 6
Standard Plan (Non-Duals)
Maternity Event
All Ages
66 of 197Prepared by Mercer GovernmentHuman Services Consulting
RFP 30-190029-DHBSection IX. Medicaid Managed Care Draft Rate Book (SFY 2020)

Exhibit 36
Time Period/Region Selections:Time Period:
Region:
Population Selections:Program Type:
Category of Aid:
Age:
Member Months/Deliveries:Average Monthly Members/Deliveries:Eligibles:
Category of Service Incurred Claims Utilization UsersUtilizationPer 1,000
Unit CostPMPM/Payment
Inpatient — PH 85,155,397$ 101,603 22,045 493 838.12$ 34.45$Inpatient — BH 4,415,899$ 6,641 918 32 664.97$ 1.79$Outpatient Hospital 42,907,801$ 118,028 52,533 573 363.54$ 17.36$Emergency Room 62,869,623$ 182,459 90,551 886 344.57$ 25.44$Physician 93,008,627$ 892,381 183,128 4,333 104.23$ 37.63$FQHC/RHC 8,665,556$ 82,227 26,517 399 105.39$ 3.51$Other Clinic 24,175,554$ 179,313 111,735 871 134.82$ 9.78$Other Practitioner 600,627$ 8,231 3,194 40 72.97$ 0.24$Therapies 6,813,937$ 59,570 4,418 289 114.39$ 2.76$Prescribed Drugs 192,057,850$ 1,792,115 159,980 8,701 107.17$ 77.70$Other BH Services 13,225,485$ 204,027 23,768 991 64.82$ 5.35$LTSS Services 18,233,922$ 3,659,223 2,383 17,766 160.19$ 7.38$Durable Medical Equipment 13,979,184$ 4,963,178 19,015 24,096 2.82$ 5.66$Limited Dental Services 1,141,510$ 46,203 17,241 224 24.71$ 0.46$Optical 2,736,497$ 34,081 29,368 165 80.29$ 1.11$Lab and X-Ray 10,193,303$ 535,458 56,483 2,600 19.04$ 4.12$Transportation 4,604,316$ 64,536 12,597 313 71.34$ 1.86$Subtotal (Medical) 584,785,089$ 12,929,276 222,587 236.60$CC4C LHD Payments 2,302,267$ 510,656 N/A 2,479 4.51$ 0.93$OBCM LHD Payments 2,721,061$ 555,860 N/A 2,699 4.90$ 1.10$Medical Home Payments 5,673,958$ 2,109,610 N/A 10,242 2.69$ 2.30$Subtotal (LHD/Medical Home Payments) 10,697,286$ 3,176,126 N/A 4.33$Total (Medical + LHD/Medical Home) 595,482,375$ 16,105,402 N/A 240.92$
Note: Please refer to Section 5 for more information on the detailed services captured under each COS in the exhibit above.
2,471,664205,972269,416
SFY 2016
Region 6
Standard Plan (Non-Duals)
All Population Groups
All Ages
67 of 197Prepared by Mercer GovernmentHuman Services Consulting
RFP 30-190029-DHBSection IX. Medicaid Managed Care Draft Rate Book (SFY 2020)

SFY 2017 Exhibits7.2Cost and utilization information for the July 1, 2016 through June 30, 2017 (SFY 2017) time period is illustrated inSection 7.2.
68 of 197Prepared by Mercer GovernmentHuman Services Consulting
RFP 30-190029-DHBSection IX. Medicaid Managed Care Draft Rate Book (SFY 2020)

7.2.1 SFY 2017 Region 1 Exhibits
69 of 197Prepared by Mercer GovernmentHuman Services Consulting
RFP 30-190029-DHBSection IX. Medicaid Managed Care Draft Rate Book (SFY 2020)

Exhibit 37
Time Period/Region Selections:Time Period:
Region:
Population Selections:Program Type:
Category of Aid:
Age:
Member Months/Deliveries:Average Monthly Members/Deliveries:Eligibles:
Category of Service Incurred Claims Utilization UsersUtilizationPer 1,000
Unit CostPMPM/Payment
Inpatient — PH 18,994,504$ 18,663 2,226 1,525 1,017.76$ 129.35$Inpatient — BH 1,338,873$ 1,901 275 155 704.19$ 9.12$Outpatient Hospital 18,296,270$ 40,731 8,523 3,328 449.20$ 124.59$Emergency Room 9,346,567$ 18,051 6,512 1,475 517.80$ 63.65$Physician 15,556,490$ 115,987 11,575 9,478 134.12$ 105.94$FQHC/RHC 2,218,513$ 17,279 3,821 1,412 128.40$ 15.11$Other Clinic 1,166,583$ 3,710 2,170 303 314.47$ 7.94$Other Practitioner 180,776$ 2,318 653 189 78.00$ 1.23$Therapies 486,461$ 4,406 263 360 110.40$ 3.31$Prescribed Drugs 61,440,392$ 491,070 11,706 40,129 125.12$ 418.40$Other BH Services 2,094,097$ 37,746 2,879 3,085 55.48$ 14.26$LTSS Services 7,210,950$ 850,972 1,068 69,539 189.60$ 49.11$Durable Medical Equipment 5,723,376$ 2,063,918 3,815 168,658 2.77$ 38.97$Limited Dental Services 3,342$ 137 50 11 24.43$ 0.02$Optical 132,996$ 1,897 1,174 155 70.11$ 0.91$Lab and X-Ray 1,088,692$ 37,872 4,843 3,095 28.75$ 7.41$Transportation 1,676,927$ 27,938 2,706 2,283 60.02$ 11.42$Subtotal (Medical) 146,955,808$ 3,734,595 13,178 1,000.74$CC4C LHD Payments 397$ 88 N/A 7 4.54$ 0.00$OBCM LHD Payments 101,345$ 20,523 N/A 1,677 4.94$ 0.69$Medical Home Payments 621,927$ 133,474 N/A 10,907 4.66$ 4.24$Subtotal (LHD/Medical Home Payments) 723,669$ 154,084 N/A 4.93$Total (Medical + LHD/Medical Home) 147,679,478$ 3,888,679 N/A 1,005.67$
Note: Please refer to Section 5 for more information on the detailed services captured under each COS in the exhibit above.
146,84712,23714,853
SFY 2017
Region 1
Standard Plan (Non-Duals)
Aged, Blind, Disabled
All Ages
70 of 197Prepared by Mercer GovernmentHuman Services Consulting
RFP 30-190029-DHBSection IX. Medicaid Managed Care Draft Rate Book (SFY 2020)

Exhibit 38
Time Period/Region Selections:Time Period:
Region:
Population Selections:Program Type:
Category of Aid:
Age:
Member Months/Deliveries:Average Monthly Members/Deliveries:Eligibles:
Category of Service Incurred Claims Utilization UsersUtilizationPer 1,000
Unit CostPMPM/Payment
Inpatient — PH 15,525,719$ 24,261 5,804 3,720 639.95$ 198.39$Inpatient — BH -$ - - - -$ -$Outpatient Hospital 1,728,925$ 11,443 3,805 1,755 151.10$ 22.09$Emergency Room 1,316,140$ 5,521 3,212 847 238.40$ 16.82$Physician 6,695,472$ 73,367 10,474 11,250 91.26$ 85.56$FQHC/RHC 779,884$ 5,972 1,367 916 130.59$ 9.97$Other Clinic 2,464,658$ 27,935 9,257 4,284 88.23$ 31.49$Other Practitioner 2,393$ 60 24 9 39.69$ 0.03$Therapies 85,974$ 915 187 140 93.91$ 1.10$Prescribed Drugs 1,101,993$ 23,586 6,177 3,617 46.72$ 14.08$Other BH Services 5,128$ 257 11 39 19.93$ 0.07$LTSS Services 163,499$ 1,914 246 293 85.44$ 2.09$Durable Medical Equipment 822,414$ 182,332 1,251 27,959 4.51$ 10.51$Limited Dental Services 122,046$ 4,930 2,027 756 24.75$ 1.56$Optical 2,257$ 29 19 4 77.33$ 0.03$Lab and X-Ray 43,797$ 2,096 646 321 20.89$ 0.56$Transportation 109,478$ 1,300 389 199 84.19$ 1.40$Subtotal (Medical) 30,969,776$ 365,919 11,576 395.75$CC4C LHD Payments 323,152$ 70,918 N/A 10,875 4.56$ 4.13$OBCM LHD Payments 15$ 3 N/A 0 4.96$ 0.00$Medical Home Payments 163,036$ 66,160 N/A 10,145 2.46$ 2.08$Subtotal (LHD/Medical Home Payments) 486,203$ 137,081 N/A 6.21$Total (Medical + LHD/Medical Home) 31,455,979$ 503,000 N/A 401.96$
Note: Please refer to Section 5 for more information on the detailed services captured under each COS in the exhibit above.
78,2576,521
12,641
SFY 2017
Region 1
Standard Plan (Non-Duals)
TANF and Other Related Children/Adults
Newborn (<1)
71 of 197Prepared by Mercer GovernmentHuman Services Consulting
RFP 30-190029-DHBSection IX. Medicaid Managed Care Draft Rate Book (SFY 2020)

Exhibit 39
Time Period/Region Selections:Time Period:
Region:
Population Selections:Program Type:
Category of Aid:
Age:
Member Months/Deliveries:Average Monthly Members/Deliveries:Eligibles:
Category of Service Incurred Claims Utilization UsersUtilizationPer 1,000
Unit CostPMPM/Payment
Inpatient — PH 5,297,873$ 4,396 991 43 1,205.11$ 4.34$Inpatient — BH 1,431,364$ 1,575 214 15 909.02$ 1.17$Outpatient Hospital 22,147,849$ 93,938 34,648 924 235.77$ 18.15$Emergency Room 15,014,302$ 49,887 29,704 491 300.97$ 12.31$Physician 27,760,868$ 383,658 83,775 3,773 72.36$ 22.75$FQHC/RHC 5,694,160$ 41,304 13,839 406 137.86$ 4.67$Other Clinic 6,516,181$ 65,219 53,472 641 99.91$ 5.34$Other Practitioner 215,180$ 4,152 1,149 41 51.83$ 0.18$Therapies 4,634,703$ 46,289 3,434 455 100.13$ 3.80$Prescribed Drugs 49,955,652$ 501,953 72,628 4,937 99.52$ 40.94$Other BH Services 8,956,123$ 119,215 9,894 1,173 75.13$ 7.34$LTSS Services 327,992$ 29,662 53 292 25.08$ 0.27$Durable Medical Equipment 3,334,257$ 999,037 6,621 9,826 3.34$ 2.73$Limited Dental Services 382,494$ 15,519 5,648 153 24.65$ 0.31$Optical 1,175,104$ 14,300 12,815 141 82.17$ 0.96$Lab and X-Ray 732,355$ 36,994 9,426 364 19.80$ 0.60$Transportation 631,403$ 8,983 2,230 88 70.29$ 0.52$Subtotal (Medical) 154,207,860$ 2,416,081 98,966 126.39$CC4C LHD Payments 1,179,912$ 260,803 N/A 2,565 4.52$ 0.97$OBCM LHD Payments 658,366$ 133,787 N/A 1,316 4.92$ 0.54$Medical Home Payments 2,796,550$ 1,143,143 N/A 11,243 2.45$ 2.29$Subtotal (LHD/Medical Home Payments) 4,634,828$ 1,537,733 N/A 3.80$Total (Medical + LHD/Medical Home) 158,842,688$ 3,953,814 N/A 130.19$
Note: Please refer to Section 5 for more information on the detailed services captured under each COS in the exhibit above.
1,220,080101,673116,531
SFY 2017
Region 1
Standard Plan (Non-Duals)
TANF and Other Related Children/Adults
Child (1-20)
72 of 197Prepared by Mercer GovernmentHuman Services Consulting
RFP 30-190029-DHBSection IX. Medicaid Managed Care Draft Rate Book (SFY 2020)

Exhibit 40
Time Period/Region Selections:Time Period:
Region:
Population Selections:Program Type:
Category of Aid:
Age:
Member Months/Deliveries:Average Monthly Members/Deliveries:Eligibles:
Category of Service Incurred Claims Utilization UsersUtilizationPer 1,000
Unit CostPMPM/Payment
Inpatient — PH 7,923,909$ 6,445 1,290 286 1,229.50$ 29.30$Inpatient — BH 798,181$ 1,015 203 45 786.59$ 2.95$Outpatient Hospital 14,339,387$ 45,065 14,113 2,000 318.19$ 53.03$Emergency Room 11,885,273$ 26,596 12,069 1,180 446.88$ 43.95$Physician 11,407,559$ 109,837 20,943 4,874 103.86$ 42.18$FQHC/RHC 2,082,077$ 16,108 5,354 715 129.26$ 7.70$Other Clinic 2,241,069$ 7,958 7,512 353 281.61$ 8.29$Other Practitioner 128,946$ 2,276 722 101 56.66$ 0.48$Therapies 5,759$ 96 61 4 60.20$ 0.02$Prescribed Drugs 23,691,831$ 318,126 20,038 14,117 74.47$ 87.61$Other BH Services 1,977,560$ 27,475 3,698 1,219 71.98$ 7.31$LTSS Services 317,349$ 18,616 150 826 172.95$ 1.17$Durable Medical Equipment 1,592,017$ 686,886 2,671 30,480 2.32$ 5.89$Limited Dental Services -$ - - - -$ -$Optical 95,213$ 1,380 843 61 68.99$ 0.35$Lab and X-Ray 2,284,452$ 65,669 9,654 2,914 34.79$ 8.45$Transportation 517,694$ 7,405 1,797 329 69.91$ 1.91$Subtotal (Medical) 81,288,275$ 1,340,954 26,354 300.59$CC4C LHD Payments -$ - N/A - -$ -$OBCM LHD Payments 853,983$ 173,769 N/A 7,711 4.91$ 3.16$Medical Home Payments 456,639$ 192,396 N/A 8,537 2.37$ 1.69$Subtotal (LHD/Medical Home Payments) 1,310,621$ 366,164 N/A 4.85$Total (Medical + LHD/Medical Home) 82,598,896$ 1,707,119 N/A 305.44$
Note: Please refer to Section 5 for more information on the detailed services captured under each COS in the exhibit above.
270,42522,53533,192
SFY 2017
Region 1
Standard Plan (Non-Duals)
TANF and Other Related Children/Adults
Adult (21+)
73 of 197Prepared by Mercer GovernmentHuman Services Consulting
RFP 30-190029-DHBSection IX. Medicaid Managed Care Draft Rate Book (SFY 2020)

Exhibit 41
Time Period/Region Selections:Time Period:
Region:
Population Selections:Program Type:
Category of Aid:
Age:
Member Months/Deliveries:Average Monthly Members/Deliveries:Eligibles:
Category of Service Incurred Claims Utilization UsersUtilizationPer 1,000
Unit CostPMPM/Payment
Inpatient — PH 11,196,571$ 14,204 4,806 32,587 788.30$ 2,140.69$Inpatient — BH -$ - - - -$ -$Outpatient Hospital 1,988,804$ 15,334 2,412 35,180 129.70$ 380.24$Emergency Room 1,719,165$ 5,102 683 11,706 336.95$ 328.69$Physician 8,069,159$ 44,448 4,938 101,978 181.54$ 1,542.75$FQHC/RHC 1,101,462$ 7,373 602 16,917 149.38$ 210.59$Other Clinic 1,075,068$ 8,221 1,217 18,861 130.77$ 205.54$Other Practitioner 616$ 6 19 14 98.69$ 0.12$Therapies -$ - - - -$ -$Prescribed Drugs -$ - - - -$ -$Other BH Services 87$ 1 144 2 87.29$ 0.02$LTSS Services 7,547$ 987 5 2,264 7.65$ 1.44$Durable Medical Equipment 45,075$ 590 179 1,354 76.40$ 8.62$Limited Dental Services -$ - - - -$ -$Optical 127$ 1 3 2 121.79$ 0.02$Lab and X-Ray 199,971$ 7,563 533 17,353 26.44$ 38.23$Transportation 66,700$ 645 263 1,480 103.41$ 12.75$Subtotal (Medical) 25,470,353$ 104,476 5,323 4,869.71$CC4C LHD Payments -$ - N/A - -$ -$OBCM LHD Payments -$ - N/A - -$ -$Medical Home Payments -$ - N/A - -$ -$Subtotal (LHD/Medical Home Payments) -$ - N/A -$Total (Medical + LHD/Medical Home) 25,470,353$ 104,476 N/A 4,869.71$
Note: Please refer to Section 5 for more information on the detailed services captured under each COS in the exhibit above.
5,230436
5,361
SFY 2017
Region 1
Standard Plan (Non-Duals)
Maternity Event
All Ages
74 of 197Prepared by Mercer GovernmentHuman Services Consulting
RFP 30-190029-DHBSection IX. Medicaid Managed Care Draft Rate Book (SFY 2020)

Exhibit 42
Time Period/Region Selections:Time Period:
Region:
Population Selections:Program Type:
Category of Aid:
Age:
Member Months/Deliveries:Average Monthly Members/Deliveries:Eligibles:
Category of Service Incurred Claims Utilization UsersUtilizationPer 1,000
Unit CostPMPM/Payment
Inpatient — PH 58,938,575$ 67,968 15,117 475 867.15$ 34.35$Inpatient — BH 3,568,417$ 4,491 697 31 794.63$ 2.08$Outpatient Hospital 58,501,235$ 206,511 63,501 1,444 283.28$ 34.10$Emergency Room 39,281,447$ 105,157 52,180 736 373.55$ 22.90$Physician 69,489,547$ 727,298 131,705 5,087 95.54$ 40.50$FQHC/RHC 11,876,095$ 88,035 24,983 616 134.90$ 6.92$Other Clinic 13,463,559$ 113,043 73,628 791 119.10$ 7.85$Other Practitioner 527,911$ 8,812 2,567 62 59.91$ 0.31$Therapies 5,212,896$ 51,706 3,946 362 100.82$ 3.04$Prescribed Drugs 136,189,868$ 1,334,735 113,718 9,336 102.04$ 79.38$Other BH Services 13,032,996$ 184,695 16,626 1,292 70.56$ 7.60$LTSS Services 8,027,337$ 902,150 1,522 6,310 189.51$ 4.68$Durable Medical Equipment 11,517,139$ 3,932,762 14,537 27,508 2.93$ 6.71$Limited Dental Services 507,883$ 20,586 7,725 144 24.67$ 0.30$Optical 1,405,697$ 17,607 14,854 123 79.84$ 0.82$Lab and X-Ray 4,349,267$ 150,195 25,102 1,051 28.96$ 2.54$Transportation 3,002,202$ 46,271 7,385 324 64.88$ 1.75$Subtotal (Medical) 438,892,071$ 7,962,025 155,271 255.82$CC4C LHD Payments 1,503,461$ 331,809 N/A 2,321 4.53$ 0.88$OBCM LHD Payments 1,613,708$ 328,082 N/A 2,295 4.92$ 0.94$Medical Home Payments 4,038,152$ 1,535,172 N/A 10,738 2.63$ 2.35$Subtotal (LHD/Medical Home Payments) 7,155,321$ 2,195,063 N/A 4.17$Total (Medical + LHD/Medical Home) 446,047,392$ 10,157,087 N/A 259.99$
Note: Please refer to Section 5 for more information on the detailed services captured under each COS in the exhibit above.
1,715,609142,967182,578
SFY 2017
Region 1
Standard Plan (Non-Duals)
All Population Groups
All Ages
75 of 197Prepared by Mercer GovernmentHuman Services Consulting
RFP 30-190029-DHBSection IX. Medicaid Managed Care Draft Rate Book (SFY 2020)
7.2.2 SFY 2017 Region 2 Exhibits
76 of 197Prepared by Mercer GovernmentHuman Services Consulting
RFP 30-190029-DHBSection IX. Medicaid Managed Care Draft Rate Book (SFY 2020)

Exhibit 43
Time Period/Region Selections:Time Period:
Region:
Population Selections:Program Type:
Category of Aid:
Age:
Member Months/Deliveries:Average Monthly Members/Deliveries:Eligibles:
Category of Service Incurred Claims Utilization UsersUtilizationPer 1,000
Unit CostPMPM/Payment
Inpatient — PH 33,083,387$ 33,435 3,631 1,525 989.49$ 125.73$Inpatient — BH 1,581,726$ 2,275 441 104 695.42$ 6.01$Outpatient Hospital 31,459,577$ 62,331 12,516 2,843 504.72$ 119.56$Emergency Room 16,949,675$ 32,514 11,717 1,483 521.31$ 64.41$Physician 26,481,959$ 204,381 20,426 9,321 129.57$ 100.64$FQHC/RHC 526,521$ 4,249 1,282 194 123.91$ 2.00$Other Clinic 2,287,971$ 6,835 4,055 312 334.72$ 8.70$Other Practitioner 208,798$ 2,803 1,077 128 74.48$ 0.79$Therapies 819,074$ 7,765 458 354 105.48$ 3.11$Prescribed Drugs 103,369,743$ 765,152 20,070 34,894 135.10$ 392.84$Other BH Services 4,094,563$ 62,861 5,480 2,867 65.14$ 15.56$LTSS Services 17,626,213$ 3,058,087 2,099 139,461 169.55$ 66.99$Durable Medical Equipment 10,831,764$ 3,708,218 6,231 169,109 2.92$ 41.16$Limited Dental Services 10,381$ 412 143 19 25.21$ 0.04$Optical 248,853$ 3,518 2,010 160 70.75$ 0.95$Lab and X-Ray 2,735,269$ 109,014 10,867 4,971 25.09$ 10.39$Transportation 3,308,251$ 37,263 4,850 1,699 88.78$ 12.57$Subtotal (Medical) 255,623,725$ 8,101,112 22,727 971.45$CC4C LHD Payments 1,114$ 245 N/A 11 4.54$ 0.00$OBCM LHD Payments 196,065$ 39,704 N/A 1,811 4.94$ 0.75$Medical Home Payments 1,139,481$ 243,996 N/A 11,127 4.67$ 4.33$Subtotal (LHD/Medical Home Payments) 1,336,660$ 283,945 N/A 5.08$Total (Medical + LHD/Medical Home) 256,960,385$ 8,385,058 N/A 976.53$
Note: Please refer to Section 5 for more information on the detailed services captured under each COS in the exhibit above.
263,13621,92825,937
SFY 2017
Region 2
Standard Plan (Non-Duals)
Aged, Blind, Disabled
All Ages
77 of 197Prepared by Mercer GovernmentHuman Services Consulting
RFP 30-190029-DHBSection IX. Medicaid Managed Care Draft Rate Book (SFY 2020)

Exhibit 44
Time Period/Region Selections:Time Period:
Region:
Population Selections:Program Type:
Category of Aid:
Age:
Member Months/Deliveries:Average Monthly Members/Deliveries:Eligibles:
Category of Service Incurred Claims Utilization UsersUtilizationPer 1,000
Unit CostPMPM/Payment
Inpatient — PH 26,576,128$ 47,242 11,050 3,922 562.55$ 183.88$Inpatient — BH -$ - - - -$ -$Outpatient Hospital 2,106,834$ 13,525 5,393 1,123 155.78$ 14.58$Emergency Room 3,182,994$ 11,942 6,874 991 266.55$ 22.02$Physician 12,150,122$ 133,359 19,705 11,073 91.11$ 84.07$FQHC/RHC 641,465$ 5,569 1,225 462 115.19$ 4.44$Other Clinic 5,142,516$ 53,297 17,927 4,425 96.49$ 35.58$Other Practitioner 1,191$ 37 12 3 32.17$ 0.01$Therapies 112,191$ 1,144 157 95 98.08$ 0.78$Prescribed Drugs 1,946,504$ 41,817 11,502 3,472 46.55$ 13.47$Other BH Services 8,618$ 376 62 31 22.89$ 0.06$LTSS Services 35,172$ 546 65 45 64.47$ 0.24$Durable Medical Equipment 1,128,812$ 39,504 1,701 3,280 28.57$ 7.81$Limited Dental Services 312,710$ 12,578 5,100 1,044 24.86$ 2.16$Optical 3,409$ 35 30 3 97.60$ 0.02$Lab and X-Ray 118,304$ 6,993 2,524 581 16.92$ 0.82$Transportation 135,618$ 1,503 721 125 90.22$ 0.94$Subtotal (Medical) 53,602,588$ 369,466 21,347 370.88$CC4C LHD Payments 595,268$ 130,636 N/A 10,847 4.56$ 4.12$OBCM LHD Payments -$ - N/A - -$ -$Medical Home Payments 302,478$ 122,332 N/A 10,157 2.47$ 2.09$Subtotal (LHD/Medical Home Payments) 897,746$ 252,967 N/A 6.21$Total (Medical + LHD/Medical Home) 54,500,334$ 622,433 N/A 377.09$
Note: Please refer to Section 5 for more information on the detailed services captured under each COS in the exhibit above.
144,52812,04423,173
SFY 2017
Region 2
Standard Plan (Non-Duals)
TANF and Other Related Children/Adults
Newborn (<1)
78 of 197Prepared by Mercer GovernmentHuman Services Consulting
RFP 30-190029-DHBSection IX. Medicaid Managed Care Draft Rate Book (SFY 2020)

Exhibit 45
Time Period/Region Selections:Time Period:
Region:
Population Selections:Program Type:
Category of Aid:
Age:
Member Months/Deliveries:Average Monthly Members/Deliveries:Eligibles:
Category of Service Incurred Claims Utilization UsersUtilizationPer 1,000
Unit CostPMPM/Payment
Inpatient — PH 10,752,091$ 8,205 1,852 43 1,310.38$ 4.68$Inpatient — BH 2,114,694$ 3,235 524 17 653.76$ 0.92$Outpatient Hospital 24,844,015$ 105,826 44,807 553 234.76$ 10.82$Emergency Room 31,493,396$ 97,184 58,948 508 324.06$ 13.71$Physician 45,315,943$ 655,747 155,015 3,425 69.11$ 19.73$FQHC/RHC 2,928,078$ 25,853 11,590 135 113.26$ 1.27$Other Clinic 13,436,188$ 131,296 103,554 686 102.33$ 5.85$Other Practitioner 234,925$ 2,965 1,369 15 79.23$ 0.10$Therapies 6,837,795$ 59,661 3,997 312 114.61$ 2.98$Prescribed Drugs 84,692,324$ 875,933 131,257 4,576 96.69$ 36.87$Other BH Services 10,839,718$ 140,832 13,430 736 76.97$ 4.72$LTSS Services 174,936$ 26,924 85 141 6.50$ 0.08$Durable Medical Equipment 5,217,783$ 2,011,476 11,540 10,508 2.59$ 2.27$Limited Dental Services 1,005,121$ 40,739 13,961 213 24.67$ 0.44$Optical 2,395,843$ 28,838 23,135 151 83.08$ 1.04$Lab and X-Ray 3,364,513$ 178,466 42,564 932 18.85$ 1.46$Transportation 958,910$ 10,649 4,449 56 90.05$ 0.42$Subtotal (Medical) 246,606,272$ 4,403,829 180,636 107.35$CC4C LHD Payments 2,230,258$ 492,968 N/A 2,575 4.52$ 0.97$OBCM LHD Payments 1,263,793$ 256,816 N/A 1,342 4.92$ 0.55$Medical Home Payments 5,345,660$ 2,179,810 N/A 11,387 2.45$ 2.33$Subtotal (LHD/Medical Home Payments) 8,839,710$ 2,929,593 N/A 3.85$Total (Medical + LHD/Medical Home) 255,445,982$ 7,333,422 N/A 111.20$
Note: Please refer to Section 5 for more information on the detailed services captured under each COS in the exhibit above.
2,297,179191,432216,277
SFY 2017
Region 2
Standard Plan (Non-Duals)
TANF and Other Related Children/Adults
Child (1-20)
79 of 197Prepared by Mercer GovernmentHuman Services Consulting
RFP 30-190029-DHBSection IX. Medicaid Managed Care Draft Rate Book (SFY 2020)

Exhibit 46
Time Period/Region Selections:Time Period:
Region:
Population Selections:Program Type:
Category of Aid:
Age:
Member Months/Deliveries:Average Monthly Members/Deliveries:Eligibles:
Category of Service Incurred Claims Utilization UsersUtilizationPer 1,000
Unit CostPMPM/Payment
Inpatient — PH 11,971,337$ 11,199 2,262 287 1,068.94$ 25.55$Inpatient — BH 1,014,168$ 1,495 382 38 678.22$ 2.16$Outpatient Hospital 17,998,181$ 51,707 19,704 1,324 348.08$ 38.41$Emergency Room 20,552,237$ 44,736 22,136 1,146 459.42$ 43.86$Physician 22,478,323$ 208,375 37,935 5,336 107.87$ 47.97$FQHC/RHC 324,957$ 2,701 1,193 69 120.31$ 0.69$Other Clinic 3,651,840$ 14,503 12,615 371 251.80$ 7.79$Other Practitioner 176,221$ 2,613 1,043 67 67.45$ 0.38$Therapies 6,918$ 125 98 3 55.20$ 0.01$Prescribed Drugs 51,201,429$ 542,420 34,564 13,891 94.39$ 109.27$Other BH Services 3,523,543$ 45,048 5,294 1,154 78.22$ 7.52$LTSS Services 1,109,248$ 163,970 298 4,199 172.43$ 2.37$Durable Medical Equipment 2,716,156$ 1,264,152 4,234 32,375 2.15$ 5.80$Limited Dental Services -$ - - - -$ -$Optical 250,399$ 3,797 1,565 97 65.95$ 0.53$Lab and X-Ray 6,453,854$ 227,736 23,592 5,832 28.34$ 13.77$Transportation 1,146,516$ 12,345 3,507 316 92.88$ 2.45$Subtotal (Medical) 144,575,328$ 2,596,921 44,687 308.55$CC4C LHD Payments 18$ 4 N/A 0 4.52$ 0.00$OBCM LHD Payments 1,579,767$ 321,452 N/A 8,232 4.91$ 3.37$Medical Home Payments 795,630$ 336,586 N/A 8,620 2.36$ 1.70$Subtotal (LHD/Medical Home Payments) 2,375,415$ 658,041 N/A 5.07$Total (Medical + LHD/Medical Home) 146,950,743$ 3,254,963 N/A 313.62$
Note: Please refer to Section 5 for more information on the detailed services captured under each COS in the exhibit above.
468,56939,04756,420
SFY 2017
Region 2
Standard Plan (Non-Duals)
TANF and Other Related Children/Adults
Adult (21+)
80 of 197Prepared by Mercer GovernmentHuman Services Consulting
RFP 30-190029-DHBSection IX. Medicaid Managed Care Draft Rate Book (SFY 2020)

Exhibit 47
Time Period/Region Selections:Time Period:
Region:
Population Selections:Program Type:
Category of Aid:
Age:
Member Months/Deliveries:Average Monthly Members/Deliveries:Eligibles:
Category of Service Incurred Claims Utilization UsersUtilizationPer 1,000
Unit CostPMPM/Payment
Inpatient — PH 18,484,926$ 26,525 8,734 34,361 696.87$ 1,995.43$Inpatient — BH -$ - - - -$ -$Outpatient Hospital 4,001,893$ 31,395 3,775 40,669 127.47$ 432.00$Emergency Room 4,737,924$ 13,907 1,445 18,016 340.67$ 511.46$Physician 16,582,118$ 75,117 9,064 97,306 220.75$ 1,790.03$FQHC/RHC 64,871$ 517 38 670 125.40$ 7.00$Other Clinic 1,041,576$ 7,139 2,368 9,247 145.91$ 112.44$Other Practitioner -$ - - - -$ -$Therapies -$ - - - -$ -$Prescribed Drugs -$ - - - -$ -$Other BH Services 215$ 5 174 7 42.19$ 0.02$LTSS Services 23,955$ 4,764 7 6,172 5.03$ 2.59$Durable Medical Equipment 16,373$ 619 256 802 26.45$ 1.77$Limited Dental Services -$ - - - -$ -$Optical 247$ 3 20 4 80.26$ 0.03$Lab and X-Ray 367,249$ 18,967 2,042 24,570 19.36$ 39.64$Transportation 97,926$ 982 487 1,272 99.69$ 10.57$Subtotal (Medical) 45,419,272$ 179,942 9,364 4,902.97$CC4C LHD Payments -$ - N/A - -$ -$OBCM LHD Payments -$ - N/A - -$ -$Medical Home Payments -$ - N/A - -$ -$Subtotal (LHD/Medical Home Payments) -$ - N/A -$Total (Medical + LHD/Medical Home) 45,419,272$ 179,942 N/A 4,902.97$
Note: Please refer to Section 5 for more information on the detailed services captured under each COS in the exhibit above.
9,264772
9,406
SFY 2017
Region 2
Standard Plan (Non-Duals)
Maternity Event
All Ages
81 of 197Prepared by Mercer GovernmentHuman Services Consulting
RFP 30-190029-DHBSection IX. Medicaid Managed Care Draft Rate Book (SFY 2020)

Exhibit 48
Time Period/Region Selections:Time Period:
Region:
Population Selections:Program Type:
Category of Aid:
Age:
Member Months/Deliveries:Average Monthly Members/Deliveries:Eligibles:
Category of Service Incurred Claims Utilization UsersUtilizationPer 1,000
Unit CostPMPM/Payment
Inpatient — PH 100,867,870$ 126,607 27,529 479 796.70$ 31.79$Inpatient — BH 4,710,589$ 7,005 1,349 26 672.51$ 1.48$Outpatient Hospital 80,410,499$ 264,783 86,195 1,001 303.68$ 25.34$Emergency Room 76,916,227$ 200,282 101,120 757 384.04$ 24.24$Physician 123,008,465$ 1,276,979 242,145 4,829 96.33$ 38.76$FQHC/RHC 4,485,892$ 38,890 15,328 147 115.35$ 1.41$Other Clinic 25,560,091$ 213,070 140,519 806 119.96$ 8.05$Other Practitioner 621,135$ 8,418 3,509 32 73.79$ 0.20$Therapies 7,775,978$ 68,695 4,710 260 113.20$ 2.45$Prescribed Drugs 241,209,999$ 2,225,322 203,600 8,415 108.39$ 76.01$Other BH Services 18,466,657$ 249,122 24,440 942 74.13$ 5.82$LTSS Services 18,969,525$ 3,254,292 2,554 12,306 170.88$ 5.98$Durable Medical Equipment 19,910,887$ 7,023,969 23,962 26,561 2.83$ 6.27$Limited Dental Services 1,328,212$ 53,729 19,204 203 24.72$ 0.42$Optical 2,898,750$ 36,190 26,760 137 80.10$ 0.91$Lab and X-Ray 13,039,190$ 541,176 81,589 2,046 24.09$ 4.11$Transportation 5,647,221$ 62,742 14,014 237 90.01$ 1.78$Subtotal (Medical) 745,827,186$ 15,651,270 278,326 235.02$CC4C LHD Payments 2,826,658$ 623,853 N/A 2,359 4.53$ 0.89$OBCM LHD Payments 3,039,624$ 617,972 N/A 2,337 4.92$ 0.96$Medical Home Payments 7,583,248$ 2,882,723 N/A 10,901 2.63$ 2.39$Subtotal (LHD/Medical Home Payments) 13,449,531$ 4,124,547 N/A 4.24$Total (Medical + LHD/Medical Home) 759,276,717$ 19,775,818 N/A 239.26$
Note: Please refer to Section 5 for more information on the detailed services captured under each COS in the exhibit above.
3,173,411264,451331,213
SFY 2017
Region 2
Standard Plan (Non-Duals)
All Population Groups
All Ages
82 of 197Prepared by Mercer GovernmentHuman Services Consulting
RFP 30-190029-DHBSection IX. Medicaid Managed Care Draft Rate Book (SFY 2020)

7.2.3 SFY 2017 Region 3 Exhibits
83 of 197Prepared by Mercer GovernmentHuman Services Consulting
RFP 30-190029-DHBSection IX. Medicaid Managed Care Draft Rate Book (SFY 2020)

Exhibit 49
Time Period/Region Selections:Time Period:
Region:
Population Selections:Program Type:
Category of Aid:
Age:
Member Months/Deliveries:Average Monthly Members/Deliveries:Eligibles:
Category of Service Incurred Claims Utilization UsersUtilizationPer 1,000
Unit CostPMPM/Payment
Inpatient — PH 41,598,028$ 42,685 4,608 1,559 974.53$ 126.62$Inpatient — BH 2,290,834$ 4,096 454 150 559.29$ 6.97$Outpatient Hospital 35,546,505$ 73,931 15,775 2,700 480.81$ 108.20$Emergency Room 22,891,149$ 45,627 15,006 1,667 501.70$ 69.68$Physician 37,974,265$ 282,103 25,581 10,304 134.61$ 115.59$FQHC/RHC 1,081,821$ 9,709 2,908 355 111.43$ 3.29$Other Clinic 3,723,798$ 8,149 4,961 298 456.95$ 11.33$Other Practitioner 284,035$ 3,766 1,323 138 75.42$ 0.86$Therapies 1,780,683$ 16,327 1,037 596 109.07$ 5.42$Prescribed Drugs 153,170,308$ 942,292 24,965 34,419 162.55$ 466.24$Other BH Services 5,135,458$ 104,727 6,843 3,825 49.04$ 15.63$LTSS Services 31,801,162$ 6,153,530 3,492 224,769 168.18$ 96.80$Durable Medical Equipment 15,590,300$ 4,925,689 7,927 179,920 3.17$ 47.46$Limited Dental Services 9,796$ 386 145 14 25.41$ 0.03$Optical 219,763$ 3,083 1,816 113 71.28$ 0.67$Lab and X-Ray 3,124,896$ 123,251 11,636 4,502 25.35$ 9.51$Transportation 3,542,680$ 61,309 6,189 2,239 57.78$ 10.78$Subtotal (Medical) 359,765,481$ 12,800,659 28,564 1,095.09$CC4C LHD Payments 1,416$ 312 N/A 11 4.54$ 0.00$OBCM LHD Payments 238,983$ 48,396 N/A 1,768 4.94$ 0.73$Medical Home Payments 1,453,939$ 302,679 N/A 11,056 4.80$ 4.43$Subtotal (LHD/Medical Home Payments) 1,694,338$ 351,387 N/A 5.16$Total (Medical + LHD/Medical Home) 361,459,819$ 13,152,046 N/A 1,100.25$
Note: Please refer to Section 5 for more information on the detailed services captured under each COS in the exhibit above.
328,52527,37732,778
SFY 2017
Region 3
Standard Plan (Non-Duals)
Aged, Blind, Disabled
All Ages
84 of 197Prepared by Mercer GovernmentHuman Services Consulting
RFP 30-190029-DHBSection IX. Medicaid Managed Care Draft Rate Book (SFY 2020)

Exhibit 50
Time Period/Region Selections:Time Period:
Region:
Population Selections:Program Type:
Category of Aid:
Age:
Member Months/Deliveries:Average Monthly Members/Deliveries:Eligibles:
Category of Service Incurred Claims Utilization UsersUtilizationPer 1,000
Unit CostPMPM/Payment
Inpatient — PH 39,150,106$ 67,642 15,412 3,839 578.78$ 185.17$Inpatient — BH -$ - - - -$ -$Outpatient Hospital 2,291,442$ 13,526 7,212 768 169.41$ 10.84$Emergency Room 4,503,473$ 18,120 10,252 1,028 248.53$ 21.30$Physician 18,382,371$ 195,045 28,890 11,070 94.25$ 86.94$FQHC/RHC 327,502$ 2,924 659 166 112.01$ 1.55$Other Clinic 7,106,897$ 75,519 25,720 4,286 94.11$ 33.61$Other Practitioner 16,794$ 446 73 25 37.64$ 0.08$Therapies 238,573$ 2,634 361 149 90.58$ 1.13$Prescribed Drugs 3,245,173$ 62,943 16,361 3,572 51.56$ 15.35$Other BH Services 18,984$ 1,151 41 65 16.49$ 0.09$LTSS Services 375,745$ 25,068 270 1,423 14.99$ 1.78$Durable Medical Equipment 1,891,641$ 71,498 2,717 4,058 26.46$ 8.95$Limited Dental Services 356,162$ 14,319 5,745 813 24.87$ 1.68$Optical 890$ 9 8 0 102.46$ 0.00$Lab and X-Ray 362,383$ 10,187 2,748 578 35.57$ 1.71$Transportation 188,556$ 1,943 975 110 97.04$ 0.89$Subtotal (Medical) 78,456,691$ 562,974 30,794 371.07$CC4C LHD Payments 867,157$ 190,304 N/A 10,801 4.56$ 4.10$OBCM LHD Payments 5$ 1 N/A 0 4.96$ 0.00$Medical Home Payments 418,634$ 169,083 N/A 9,596 2.48$ 1.98$Subtotal (LHD/Medical Home Payments) 1,285,797$ 359,387 N/A 6.08$Total (Medical + LHD/Medical Home) 79,742,487$ 922,361 N/A 377.15$
Note: Please refer to Section 5 for more information on the detailed services captured under each COS in the exhibit above.
211,43317,61933,933
SFY 2017
Region 3
Standard Plan (Non-Duals)
TANF and Other Related Children/Adults
Newborn (<1)
85 of 197Prepared by Mercer GovernmentHuman Services Consulting
RFP 30-190029-DHBSection IX. Medicaid Managed Care Draft Rate Book (SFY 2020)

Exhibit 51
Time Period/Region Selections:Time Period:
Region:
Population Selections:Program Type:
Category of Aid:
Age:
Member Months/Deliveries:Average Monthly Members/Deliveries:Eligibles:
Category of Service Incurred Claims Utilization UsersUtilizationPer 1,000
Unit CostPMPM/Payment
Inpatient — PH 12,385,404$ 11,265 2,430 42 1,099.48$ 3.82$Inpatient — BH 2,072,143$ 3,875 578 14 534.69$ 0.64$Outpatient Hospital 25,456,020$ 95,720 53,076 354 265.94$ 7.85$Emergency Room 40,944,054$ 138,951 82,366 514 294.67$ 12.62$Physician 70,311,450$ 927,875 219,935 3,432 75.78$ 21.67$FQHC/RHC 1,785,329$ 15,073 6,462 56 118.45$ 0.55$Other Clinic 19,078,107$ 193,462 148,634 716 98.61$ 5.88$Other Practitioner 646,166$ 7,977 2,263 30 81.01$ 0.20$Therapies 10,137,948$ 102,097 7,207 378 99.30$ 3.13$Prescribed Drugs 114,284,540$ 1,177,481 179,354 4,356 97.06$ 35.23$Other BH Services 17,461,990$ 231,775 20,559 857 75.34$ 5.38$LTSS Services 933,047$ 113,486 219 420 22.25$ 0.29$Durable Medical Equipment 7,018,183$ 2,132,100 16,249 7,887 3.29$ 2.16$Limited Dental Services 1,012,572$ 40,951 14,558 151 24.73$ 0.31$Optical 2,033,644$ 24,224 22,053 90 83.95$ 0.63$Lab and X-Ray 5,428,344$ 247,962 45,200 917 21.89$ 1.67$Transportation 1,228,715$ 17,417 6,352 64 70.55$ 0.38$Subtotal (Medical) 332,217,656$ 5,481,690 250,681 102.41$CC4C LHD Payments 3,184,269$ 703,839 N/A 2,604 4.52$ 0.98$OBCM LHD Payments 1,735,278$ 352,627 N/A 1,304 4.92$ 0.53$Medical Home Payments 7,385,222$ 2,996,840 N/A 11,086 2.46$ 2.28$Subtotal (LHD/Medical Home Payments) 12,304,769$ 4,053,305 N/A 3.79$Total (Medical + LHD/Medical Home) 344,522,425$ 9,534,995 N/A 106.20$
Note: Please refer to Section 5 for more information on the detailed services captured under each COS in the exhibit above.
3,243,949270,329308,878
SFY 2017
Region 3
Standard Plan (Non-Duals)
TANF and Other Related Children/Adults
Child (1-20)
86 of 197Prepared by Mercer GovernmentHuman Services Consulting
RFP 30-190029-DHBSection IX. Medicaid Managed Care Draft Rate Book (SFY 2020)

Exhibit 52
Time Period/Region Selections:Time Period:
Region:
Population Selections:Program Type:
Category of Aid:
Age:
Member Months/Deliveries:Average Monthly Members/Deliveries:Eligibles:
Category of Service Incurred Claims Utilization UsersUtilizationPer 1,000
Unit CostPMPM/Payment
Inpatient — PH 15,322,830$ 13,791 2,684 232 1,111.10$ 21.52$Inpatient — BH 1,236,429$ 2,212 382 37 558.94$ 1.74$Outpatient Hospital 22,025,205$ 69,568 27,879 1,173 316.60$ 30.94$Emergency Room 32,641,030$ 73,873 33,311 1,245 441.85$ 45.85$Physician 32,474,178$ 295,608 54,292 4,983 109.86$ 45.62$FQHC/RHC 964,134$ 8,969 3,531 151 107.49$ 1.35$Other Clinic 4,865,419$ 21,997 18,253 371 221.19$ 6.83$Other Practitioner 263,606$ 4,308 1,494 73 61.19$ 0.37$Therapies 25,581$ 452 401 8 56.63$ 0.04$Prescribed Drugs 64,644,468$ 733,296 50,217 12,361 88.16$ 90.81$Other BH Services 4,875,878$ 75,615 7,176 1,275 64.48$ 6.85$LTSS Services 1,977,810$ 332,526 502 5,605 160.13$ 2.78$Durable Medical Equipment 4,169,468$ 1,749,357 5,681 29,488 2.38$ 5.86$Limited Dental Services 30$ 2 1 0 15.06$ 0.00$Optical 145,795$ 2,102 1,167 35 69.35$ 0.20$Lab and X-Ray 8,241,625$ 270,613 27,708 4,562 30.46$ 11.58$Transportation 1,275,756$ 17,486 5,143 295 72.96$ 1.79$Subtotal (Medical) 195,149,244$ 3,671,775 65,333 274.12$CC4C LHD Payments 5$ 1 N/A 0 4.52$ 0.00$OBCM LHD Payments 2,376,978$ 483,668 N/A 8,153 4.91$ 3.34$Medical Home Payments 1,252,574$ 514,790 N/A 8,677 2.43$ 1.76$Subtotal (LHD/Medical Home Payments) 3,629,556$ 998,459 N/A 5.10$Total (Medical + LHD/Medical Home) 198,778,800$ 4,670,234 N/A 279.22$
Note: Please refer to Section 5 for more information on the detailed services captured under each COS in the exhibit above.
711,90359,32584,698
SFY 2017
Region 3
Standard Plan (Non-Duals)
TANF and Other Related Children/Adults
Adult (21+)
87 of 197Prepared by Mercer GovernmentHuman Services Consulting
RFP 30-190029-DHBSection IX. Medicaid Managed Care Draft Rate Book (SFY 2020)

Exhibit 53
Time Period/Region Selections:Time Period:
Region:
Population Selections:Program Type:
Category of Aid:
Age:
Member Months/Deliveries:Average Monthly Members/Deliveries:Eligibles:
Category of Service Incurred Claims Utilization UsersUtilizationPer 1,000
Unit CostPMPM/Payment
Inpatient — PH 26,477,511$ 36,076 11,977 33,103 733.93$ 2,024.61$Inpatient — BH -$ - - - -$ -$Outpatient Hospital 3,228,461$ 23,951 4,613 21,977 134.80$ 246.87$Emergency Room 6,100,174$ 16,495 2,258 15,136 369.81$ 466.45$Physician 21,653,244$ 93,486 12,698 85,781 231.62$ 1,655.72$FQHC/RHC 100,569$ 767 42 704 131.16$ 7.69$Other Clinic 3,065,443$ 15,434 2,973 14,162 198.62$ 234.40$Other Practitioner 1,775$ 40 27 37 44.05$ 0.14$Therapies 387$ 4 2 4 89.84$ 0.03$Prescribed Drugs -$ - - - -$ -$Other BH Services -$ - - - -$ -$LTSS Services 46,500$ 57,529 20 52,788 0.81$ 3.56$Durable Medical Equipment 26,774$ 1,037 351 952 25.81$ 2.05$Limited Dental Services 51$ 2 - 2 24.71$ 0.00$Optical 144$ 2 15 2 69.74$ 0.01$Lab and X-Ray 619,157$ 21,757 1,957 19,964 28.46$ 47.34$Transportation 127,393$ 1,396 668 1,281 91.28$ 9.74$Subtotal (Medical) 61,447,583$ 267,977 13,221 4,698.62$CC4C LHD Payments -$ - N/A - -$ -$OBCM LHD Payments -$ - N/A - -$ -$Medical Home Payments -$ - N/A - -$ -$Subtotal (LHD/Medical Home Payments) -$ - N/A -$Total (Medical + LHD/Medical Home) 61,447,583$ 267,977 N/A 4,698.62$
Note: Please refer to Section 5 for more information on the detailed services captured under each COS in the exhibit above.
13,0781,090
13,259
SFY 2017
Region 3
Standard Plan (Non-Duals)
Maternity Event
All Ages
88 of 197Prepared by Mercer GovernmentHuman Services Consulting
RFP 30-190029-DHBSection IX. Medicaid Managed Care Draft Rate Book (SFY 2020)

Exhibit 54
Time Period/Region Selections:Time Period:
Region:
Population Selections:Program Type:
Category of Aid:
Age:
Member Months/Deliveries:Average Monthly Members/Deliveries:Eligibles:
Category of Service Incurred Claims Utilization UsersUtilizationPer 1,000
Unit CostPMPM/Payment
Inpatient — PH 134,933,879$ 171,459 37,111 458 786.98$ 30.01$Inpatient — BH 5,599,406$ 10,183 1,416 27 549.85$ 1.25$Outpatient Hospital 88,547,633$ 276,696 108,555 739 320.02$ 19.70$Emergency Room 107,079,880$ 293,067 143,193 782 365.38$ 23.82$Physician 180,795,507$ 1,794,117 341,396 4,789 100.77$ 40.21$FQHC/RHC 4,259,355$ 37,441 13,602 100 113.76$ 0.95$Other Clinic 37,839,664$ 314,561 200,541 840 120.29$ 8.42$Other Practitioner 1,212,375$ 16,537 5,180 44 73.31$ 0.27$Therapies 12,183,172$ 121,514 9,008 324 100.26$ 2.71$Prescribed Drugs 335,344,488$ 2,916,011 278,989 7,783 115.00$ 74.59$Other BH Services 27,492,311$ 413,268 34,870 1,103 66.52$ 6.12$LTSS Services 35,134,265$ 6,682,139 4,503 17,836 167.51$ 7.81$Durable Medical Equipment 28,696,365$ 8,879,681 32,925 23,701 3.23$ 6.38$Limited Dental Services 1,378,611$ 55,659 20,449 149 24.77$ 0.31$Optical 2,400,237$ 29,421 25,059 79 81.58$ 0.53$Lab and X-Ray 17,776,406$ 673,770 89,249 1,798 26.38$ 3.95$Transportation 6,363,100$ 99,551 19,327 266 63.92$ 1.42$Subtotal (Medical) 1,027,036,654$ 22,785,075 388,116 228.44$CC4C LHD Payments 4,052,847$ 894,455 N/A 2,387 4.53$ 0.90$OBCM LHD Payments 4,351,244$ 884,692 N/A 2,361 4.92$ 0.97$Medical Home Payments 10,510,370$ 3,983,391 N/A 10,632 2.64$ 2.34$Subtotal (LHD/Medical Home Payments) 18,914,461$ 5,762,538 N/A 4.21$Total (Medical + LHD/Medical Home) 1,045,951,115$ 28,547,613 N/A 232.65$
Note: Please refer to Section 5 for more information on the detailed services captured under each COS in the exhibit above.
4,495,811374,651473,546
SFY 2017
Region 3
Standard Plan (Non-Duals)
All Population Groups
All Ages
89 of 197Prepared by Mercer GovernmentHuman Services Consulting
RFP 30-190029-DHBSection IX. Medicaid Managed Care Draft Rate Book (SFY 2020)

7.2.4 SFY 2017 Region 4 Exhibits
90 of 197Prepared by Mercer GovernmentHuman Services Consulting
RFP 30-190029-DHBSection IX. Medicaid Managed Care Draft Rate Book (SFY 2020)

Exhibit 55
Time Period/Region Selections:Time Period:
Region:
Population Selections:Program Type:
Category of Aid:
Age:
Member Months/Deliveries:Average Monthly Members/Deliveries:Eligibles:
Category of Service Incurred Claims Utilization UsersUtilizationPer 1,000
Unit CostPMPM/Payment
Inpatient — PH 38,729,867$ 39,670 3,610 1,709 976.30$ 139.06$Inpatient — BH 2,067,638$ 2,586 304 111 799.57$ 7.42$Outpatient Hospital 27,936,179$ 54,068 11,740 2,330 516.68$ 100.31$Emergency Room 17,085,084$ 33,138 12,223 1,428 515.57$ 61.34$Physician 28,552,620$ 204,806 20,445 8,824 139.41$ 102.52$FQHC/RHC 2,013,794$ 17,215 4,840 742 116.98$ 7.23$Other Clinic 4,031,634$ 8,133 4,302 350 495.74$ 14.48$Other Practitioner 174,698$ 2,215 917 95 78.86$ 0.63$Therapies 1,820,760$ 15,897 929 685 114.53$ 6.54$Prescribed Drugs 121,607,990$ 703,312 20,431 30,303 172.91$ 436.64$Other BH Services 5,974,538$ 101,786 5,806 4,386 58.70$ 21.45$LTSS Services 17,890,751$ 3,563,752 2,243 153,549 171.36$ 64.24$Durable Medical Equipment 10,148,598$ 3,845,988 6,547 165,710 2.64$ 36.44$Limited Dental Services 9,625$ 390 144 17 24.66$ 0.03$Optical 283,386$ 4,041 2,392 174 70.14$ 1.02$Lab and X-Ray 2,448,064$ 105,268 9,564 4,536 23.26$ 8.79$Transportation 2,707,501$ 46,364 4,592 1,998 58.40$ 9.72$Subtotal (Medical) 283,482,727$ 8,748,629 23,855 1,017.85$CC4C LHD Payments 1,087$ 240 N/A 10 4.54$ 0.00$OBCM LHD Payments 194,270$ 39,341 N/A 1,695 4.94$ 0.70$Medical Home Payments 1,234,620$ 256,154 N/A 11,037 4.82$ 4.43$Subtotal (LHD/Medical Home Payments) 1,429,978$ 295,734 N/A 5.13$Total (Medical + LHD/Medical Home) 284,912,705$ 9,044,364 N/A 1,022.99$
Note: Please refer to Section 5 for more information on the detailed services captured under each COS in the exhibit above.
278,51123,20927,445
SFY 2017
Region 4
Standard Plan (Non-Duals)
Aged, Blind, Disabled
All Ages
91 of 197Prepared by Mercer GovernmentHuman Services Consulting
RFP 30-190029-DHBSection IX. Medicaid Managed Care Draft Rate Book (SFY 2020)

Exhibit 56
Time Period/Region Selections:Time Period:
Region:
Population Selections:Program Type:
Category of Aid:
Age:
Member Months/Deliveries:Average Monthly Members/Deliveries:Eligibles:
Category of Service Incurred Claims Utilization UsersUtilizationPer 1,000
Unit CostPMPM/Payment
Inpatient — PH 33,192,884$ 59,628 12,717 4,181 556.67$ 193.95$Inpatient — BH -$ - - - -$ -$Outpatient Hospital 1,558,689$ 10,016 4,852 702 155.62$ 9.11$Emergency Room 4,032,465$ 15,019 8,330 1,053 268.50$ 23.56$Physician 16,249,014$ 159,947 22,675 11,215 101.59$ 94.94$FQHC/RHC 1,331,168$ 12,586 2,728 883 105.76$ 7.78$Other Clinic 5,670,995$ 60,423 19,861 4,237 93.85$ 33.14$Other Practitioner 3,714$ 80 24 6 46.54$ 0.02$Therapies 146,961$ 1,450 319 102 101.37$ 0.86$Prescribed Drugs 2,326,991$ 42,297 12,393 2,966 55.01$ 13.60$Other BH Services 16,882$ 377 68 26 44.81$ 0.10$LTSS Services 138,232$ 9,368 22 657 14.76$ 0.81$Durable Medical Equipment 592,898$ 108,736 1,677 7,624 5.45$ 3.46$Limited Dental Services 328,860$ 13,198 5,322 925 24.92$ 1.92$Optical 4,012$ 46 39 3 86.63$ 0.02$Lab and X-Ray 150,471$ 6,704 2,203 470 22.44$ 0.88$Transportation 205,431$ 2,190 904 154 93.79$ 1.20$Subtotal (Medical) 65,949,665$ 502,066 25,034 385.35$CC4C LHD Payments 703,766$ 154,446 N/A 10,829 4.56$ 4.11$OBCM LHD Payments -$ - N/A - -$ -$Medical Home Payments 340,825$ 138,895 N/A 9,739 2.45$ 1.99$Subtotal (LHD/Medical Home Payments) 1,044,591$ 293,341 N/A 6.10$Total (Medical + LHD/Medical Home) 66,994,257$ 795,408 N/A 391.45$
Note: Please refer to Section 5 for more information on the detailed services captured under each COS in the exhibit above.
171,14414,26227,550
SFY 2017
Region 4
Standard Plan (Non-Duals)
TANF and Other Related Children/Adults
Newborn (<1)
92 of 197Prepared by Mercer GovernmentHuman Services Consulting
RFP 30-190029-DHBSection IX. Medicaid Managed Care Draft Rate Book (SFY 2020)

Exhibit 57
Time Period/Region Selections:Time Period:
Region:
Population Selections:Program Type:
Category of Aid:
Age:
Member Months/Deliveries:Average Monthly Members/Deliveries:Eligibles:
Category of Service Incurred Claims Utilization UsersUtilizationPer 1,000
Unit CostPMPM/Payment
Inpatient — PH 10,743,316$ 9,464 2,049 43 1,135.22$ 4.04$Inpatient — BH 3,347,145$ 4,904 512 22 682.59$ 1.26$Outpatient Hospital 21,664,568$ 68,578 36,951 309 315.91$ 8.14$Emergency Room 35,537,128$ 110,945 67,270 500 320.31$ 13.35$Physician 51,877,982$ 642,506 167,275 2,897 80.74$ 19.49$FQHC/RHC 5,883,863$ 56,555 23,375 255 104.04$ 2.21$Other Clinic 14,767,935$ 146,571 107,852 661 100.76$ 5.55$Other Practitioner 254,872$ 3,144 1,356 14 81.08$ 0.10$Therapies 15,642,186$ 140,175 9,534 632 111.59$ 5.88$Prescribed Drugs 83,094,773$ 793,826 138,203 3,579 104.68$ 31.22$Other BH Services 16,490,885$ 201,086 16,840 907 82.01$ 6.20$LTSS Services 506,994$ 55,059 88 248 100.42$ 0.19$Durable Medical Equipment 5,323,569$ 1,843,198 16,064 8,310 2.89$ 2.00$Limited Dental Services 1,006,920$ 40,769 14,218 184 24.70$ 0.38$Optical 2,858,250$ 35,190 29,914 159 81.22$ 1.07$Lab and X-Ray 3,539,940$ 221,569 41,038 999 15.98$ 1.33$Transportation 928,882$ 12,288 5,462 55 75.59$ 0.35$Subtotal (Medical) 273,469,208$ 4,385,825 207,373 102.75$CC4C LHD Payments 2,601,271$ 574,975 N/A 2,592 4.52$ 0.98$OBCM LHD Payments 1,373,290$ 279,067 N/A 1,258 4.92$ 0.52$Medical Home Payments 6,100,387$ 2,481,210 N/A 11,187 2.46$ 2.29$Subtotal (LHD/Medical Home Payments) 10,074,948$ 3,335,253 N/A 3.79$Total (Medical + LHD/Medical Home) 283,544,156$ 7,721,078 N/A 106.53$
Note: Please refer to Section 5 for more information on the detailed services captured under each COS in the exhibit above.
2,661,605221,800254,570
SFY 2017
Region 4
Standard Plan (Non-Duals)
TANF and Other Related Children/Adults
Child (1-20)
93 of 197Prepared by Mercer GovernmentHuman Services Consulting
RFP 30-190029-DHBSection IX. Medicaid Managed Care Draft Rate Book (SFY 2020)

Exhibit 58
Time Period/Region Selections:Time Period:
Region:
Population Selections:Program Type:
Category of Aid:
Age:
Member Months/Deliveries:Average Monthly Members/Deliveries:Eligibles:
Category of Service Incurred Claims Utilization UsersUtilizationPer 1,000
Unit CostPMPM/Payment
Inpatient — PH 11,795,791$ 11,082 2,048 261 1,064.42$ 23.15$Inpatient — BH 776,246$ 979 206 23 792.51$ 1.52$Outpatient Hospital 16,897,404$ 45,563 19,957 1,073 370.86$ 33.17$Emergency Room 24,056,553$ 49,941 24,093 1,176 481.70$ 47.22$Physician 21,895,235$ 193,964 39,057 4,568 112.88$ 42.98$FQHC/RHC 1,859,431$ 16,940 6,144 399 109.77$ 3.65$Other Clinic 4,116,851$ 23,515 17,253 554 175.07$ 8.08$Other Practitioner 155,717$ 2,046 856 48 76.12$ 0.31$Therapies 14,062$ 252 187 6 55.91$ 0.03$Prescribed Drugs 43,540,709$ 481,193 35,552 11,334 90.48$ 85.46$Other BH Services 4,241,961$ 53,394 5,626 1,258 79.45$ 8.33$LTSS Services 962,875$ 164,580 311 3,876 161.73$ 1.89$Durable Medical Equipment 2,316,258$ 1,165,421 4,649 27,449 1.99$ 4.55$Limited Dental Services 16$ 1 1 0 15.11$ 0.00$Optical 182,097$ 2,654 1,541 63 68.61$ 0.36$Lab and X-Ray 5,662,928$ 223,143 23,527 5,256 25.38$ 11.11$Transportation 848,431$ 11,709 3,769 276 72.46$ 1.67$Subtotal (Medical) 139,322,565$ 2,446,376 49,408 273.46$CC4C LHD Payments 59$ 13 N/A 0 4.52$ 0.00$OBCM LHD Payments 1,726,213$ 351,250 N/A 8,273 4.91$ 3.39$Medical Home Payments 852,336$ 350,290 N/A 8,250 2.43$ 1.67$Subtotal (LHD/Medical Home Payments) 2,578,607$ 701,554 N/A 5.06$Total (Medical + LHD/Medical Home) 141,901,172$ 3,147,930 N/A 278.52$
Note: Please refer to Section 5 for more information on the detailed services captured under each COS in the exhibit above.
509,48742,45763,865
SFY 2017
Region 4
Standard Plan (Non-Duals)
TANF and Other Related Children/Adults
Adult (21+)
94 of 197Prepared by Mercer GovernmentHuman Services Consulting
RFP 30-190029-DHBSection IX. Medicaid Managed Care Draft Rate Book (SFY 2020)

Exhibit 59
Time Period/Region Selections:Time Period:
Region:
Population Selections:Program Type:
Category of Aid:
Age:
Member Months/Deliveries:Average Monthly Members/Deliveries:Eligibles:
Category of Service Incurred Claims Utilization UsersUtilizationPer 1,000
Unit CostPMPM/Payment
Inpatient — PH 20,698,110$ 27,700 9,171 33,970 747.23$ 2,115.28$Inpatient — BH -$ - - - -$ -$Outpatient Hospital 4,185,698$ 26,015 3,533 31,904 160.90$ 427.77$Emergency Room 5,781,685$ 14,018 1,737 17,191 412.46$ 590.87$Physician 15,890,268$ 73,835 9,536 90,548 215.21$ 1,623.93$FQHC/RHC 540,150$ 4,280 311 5,248 126.21$ 55.20$Other Clinic 2,723,339$ 16,916 3,107 20,746 160.99$ 278.32$Other Practitioner -$ - - - -$ -$Therapies -$ - - - -$ -$Prescribed Drugs -$ - - - -$ -$Other BH Services 1,015$ 17 192 21 58.47$ 0.10$LTSS Services 16,604$ 3,655 20 4,482 4.54$ 1.70$Durable Medical Equipment 11,888$ 184 280 226 64.53$ 1.21$Limited Dental Services 106$ 4 - 5 25.18$ 0.01$Optical -$ - - - -$ -$Lab and X-Ray 742,268$ 27,079 2,088 33,208 27.41$ 75.86$Transportation 137,693$ 1,535 653 1,883 89.70$ 14.07$Subtotal (Medical) 50,728,824$ 195,238 9,909 5,184.32$CC4C LHD Payments -$ - N/A - -$ -$OBCM LHD Payments -$ - N/A - -$ -$Medical Home Payments -$ - N/A - -$ -$Subtotal (LHD/Medical Home Payments) -$ - N/A -$Total (Medical + LHD/Medical Home) 50,728,824$ 195,238 N/A 5,184.32$
Note: Please refer to Section 5 for more information on the detailed services captured under each COS in the exhibit above.
9,785815
9,978
SFY 2017
Region 4
Standard Plan (Non-Duals)
Maternity Event
All Ages
95 of 197Prepared by Mercer GovernmentHuman Services Consulting
RFP 30-190029-DHBSection IX. Medicaid Managed Care Draft Rate Book (SFY 2020)

Exhibit 60
Time Period/Region Selections:Time Period:
Region:
Population Selections:Program Type:
Category of Aid:
Age:
Member Months/Deliveries:Average Monthly Members/Deliveries:Eligibles:
Category of Service Incurred Claims Utilization UsersUtilizationPer 1,000
Unit CostPMPM/Payment
Inpatient — PH 115,159,968$ 147,543 29,595 489 780.52$ 31.81$Inpatient — BH 6,191,029$ 8,469 1,025 28 731.02$ 1.71$Outpatient Hospital 72,242,539$ 204,240 77,033 677 353.71$ 19.95$Emergency Room 86,492,915$ 223,060 113,653 739 387.76$ 23.89$Physician 134,465,119$ 1,275,058 258,988 4,226 105.46$ 37.14$FQHC/RHC 11,628,405$ 107,575 37,398 357 108.10$ 3.21$Other Clinic 31,310,754$ 255,559 152,375 847 122.52$ 8.65$Other Practitioner 589,000$ 7,484 3,161 25 78.70$ 0.16$Therapies 17,623,969$ 157,773 10,969 523 111.70$ 4.87$Prescribed Drugs 250,570,463$ 2,020,628 211,979 6,697 124.01$ 69.20$Other BH Services 26,725,280$ 356,659 28,532 1,182 74.93$ 7.38$LTSS Services 19,515,455$ 3,796,414 2,684 12,582 170.40$ 5.39$Durable Medical Equipment 18,393,211$ 6,963,527 29,217 23,079 2.64$ 5.08$Limited Dental Services 1,345,527$ 54,363 19,685 180 24.75$ 0.37$Optical 3,327,746$ 41,931 33,903 139 79.36$ 0.92$Lab and X-Ray 12,543,671$ 583,764 78,420 1,935 21.49$ 3.46$Transportation 4,827,938$ 74,087 15,380 246 65.17$ 1.33$Subtotal (Medical) 812,952,989$ 16,278,134 315,007 224.53$CC4C LHD Payments 3,306,184$ 729,674 N/A 2,418 4.53$ 0.91$OBCM LHD Payments 3,293,773$ 669,658 N/A 2,219 4.92$ 0.91$Medical Home Payments 8,528,168$ 3,226,550 N/A 10,694 2.64$ 2.36$Subtotal (LHD/Medical Home Payments) 15,128,124$ 4,625,882 N/A 4.18$Total (Medical + LHD/Medical Home) 828,081,113$ 20,904,016 N/A 228.70$
Note: Please refer to Section 5 for more information on the detailed services captured under each COS in the exhibit above.
3,620,746301,729383,408
SFY 2017
Region 4
Standard Plan (Non-Duals)
All Population Groups
All Ages
96 of 197Prepared by Mercer GovernmentHuman Services Consulting
RFP 30-190029-DHBSection IX. Medicaid Managed Care Draft Rate Book (SFY 2020)

7.2.5 SFY 2017 Region 5 Exhibits
97 of 197Prepared by Mercer GovernmentHuman Services Consulting
RFP 30-190029-DHBSection IX. Medicaid Managed Care Draft Rate Book (SFY 2020)

Exhibit 61
Time Period/Region Selections:Time Period:
Region:
Population Selections:Program Type:
Category of Aid:
Age:
Member Months/Deliveries:Average Monthly Members/Deliveries:Eligibles:
Category of Service Incurred Claims Utilization UsersUtilizationPer 1,000
Unit CostPMPM/Payment
Inpatient — PH 40,612,383$ 42,084 4,313 1,631 965.03$ 131.16$Inpatient — BH 1,864,503$ 2,693 379 104 692.36$ 6.02$Outpatient Hospital 27,508,819$ 52,609 13,244 2,039 522.90$ 88.84$Emergency Room 18,961,621$ 39,224 14,102 1,520 483.42$ 61.24$Physician 33,875,195$ 248,340 23,159 9,624 136.41$ 109.40$FQHC/RHC 1,866,205$ 18,500 4,747 717 100.87$ 6.03$Other Clinic 3,299,232$ 7,614 4,659 295 433.34$ 10.66$Other Practitioner 276,665$ 3,624 1,216 140 76.35$ 0.89$Therapies 2,451,168$ 22,859 1,171 886 107.23$ 7.92$Prescribed Drugs 118,183,541$ 870,596 23,351 33,740 135.75$ 381.68$Other BH Services 5,304,737$ 74,299 6,109 2,879 71.40$ 17.13$LTSS Services 19,007,888$ 3,980,340 2,569 154,257 183.98$ 61.39$Durable Medical Equipment 10,628,755$ 3,778,000 7,348 146,416 2.81$ 34.33$Limited Dental Services 11,350$ 458 167 18 24.78$ 0.04$Optical 495,088$ 7,574 3,415 294 65.36$ 1.60$Lab and X-Ray 3,483,305$ 128,141 11,730 4,966 27.18$ 11.25$Transportation 2,165,704$ 29,698 5,503 1,151 72.93$ 6.99$Subtotal (Medical) 289,996,157$ 9,306,652 26,375 936.56$CC4C LHD Payments 1,393$ 307 N/A 12 4.54$ 0.00$OBCM LHD Payments 227,324$ 46,035 N/A 1,784 4.94$ 0.73$Medical Home Payments 1,375,299$ 288,824 N/A 11,193 4.76$ 4.44$Subtotal (LHD/Medical Home Payments) 1,604,016$ 335,165 N/A 5.18$Total (Medical + LHD/Medical Home) 291,600,174$ 9,641,817 N/A 941.74$
Note: Please refer to Section 5 for more information on the detailed services captured under each COS in the exhibit above.
309,63925,80330,210
SFY 2017
Region 5
Standard Plan (Non-Duals)
Aged, Blind, Disabled
All Ages
98 of 197Prepared by Mercer GovernmentHuman Services Consulting
RFP 30-190029-DHBSection IX. Medicaid Managed Care Draft Rate Book (SFY 2020)

Exhibit 62
Time Period/Region Selections:Time Period:
Region:
Population Selections:Program Type:
Category of Aid:
Age:
Member Months/Deliveries:Average Monthly Members/Deliveries:Eligibles:
Category of Service Incurred Claims Utilization UsersUtilizationPer 1,000
Unit CostPMPM/Payment
Inpatient — PH 27,527,584$ 50,762 10,306 4,501 542.29$ 203.40$Inpatient — BH -$ - - - -$ -$Outpatient Hospital 1,082,010$ 8,301 4,063 736 130.34$ 7.99$Emergency Room 2,916,943$ 13,428 7,304 1,191 217.22$ 21.55$Physician 13,689,167$ 130,796 18,720 11,597 104.66$ 101.15$FQHC/RHC 423,789$ 4,260 1,008 378 99.48$ 3.13$Other Clinic 4,623,649$ 50,617 16,743 4,488 91.35$ 34.16$Other Practitioner 3,178$ 45 12 4 70.51$ 0.02$Therapies 131,091$ 1,633 250 145 80.29$ 0.97$Prescribed Drugs 2,203,710$ 47,463 11,603 4,208 46.43$ 16.28$Other BH Services 23,757$ 977 26 87 24.32$ 0.18$LTSS Services 47,343$ 2,743 50 243 17.26$ 0.35$Durable Medical Equipment 538,442$ 154,897 1,631 13,734 3.48$ 3.98$Limited Dental Services 304,063$ 12,224 4,974 1,084 24.87$ 2.25$Optical 10,944$ 140 100 12 77.89$ 0.08$Lab and X-Ray 121,307$ 4,449 1,298 395 27.26$ 0.90$Transportation 239,493$ 1,459 776 129 164.11$ 1.77$Subtotal (Medical) 53,886,470$ 484,195 20,079 398.16$CC4C LHD Payments 557,110$ 122,261 N/A 10,841 4.56$ 4.12$OBCM LHD Payments -$ - N/A - -$ -$Medical Home Payments 273,894$ 111,246 N/A 9,864 2.46$ 2.02$Subtotal (LHD/Medical Home Payments) 831,004$ 233,508 N/A 6.14$Total (Medical + LHD/Medical Home) 54,717,474$ 717,703 N/A 404.30$
Note: Please refer to Section 5 for more information on the detailed services captured under each COS in the exhibit above.
135,33811,27821,970
SFY 2017
Region 5
Standard Plan (Non-Duals)
TANF and Other Related Children/Adults
Newborn (<1)
99 of 197Prepared by Mercer GovernmentHuman Services Consulting
RFP 30-190029-DHBSection IX. Medicaid Managed Care Draft Rate Book (SFY 2020)

Exhibit 63
Time Period/Region Selections:Time Period:
Region:
Population Selections:Program Type:
Category of Aid:
Age:
Member Months/Deliveries:Average Monthly Members/Deliveries:Eligibles:
Category of Service Incurred Claims Utilization UsersUtilizationPer 1,000
Unit CostPMPM/Payment
Inpatient — PH 11,636,909$ 9,854 2,270 54 1,180.90$ 5.33$Inpatient — BH 1,883,430$ 2,838 340 16 663.67$ 0.86$Outpatient Hospital 16,688,669$ 58,785 32,333 323 283.90$ 7.64$Emergency Room 29,730,660$ 109,861 63,656 604 270.62$ 13.62$Physician 45,810,665$ 605,763 143,958 3,329 75.62$ 20.98$FQHC/RHC 2,962,837$ 31,615 12,412 174 93.72$ 1.36$Other Clinic 12,237,362$ 122,028 93,960 671 100.28$ 5.60$Other Practitioner 201,271$ 2,305 1,041 13 87.33$ 0.09$Therapies 13,751,741$ 132,724 7,670 729 103.61$ 6.30$Prescribed Drugs 79,259,858$ 859,738 126,619 4,725 92.19$ 36.30$Other BH Services 12,831,228$ 165,675 15,127 911 77.45$ 5.88$LTSS Services 285,805$ 35,577 118 196 98.42$ 0.13$Durable Medical Equipment 3,747,091$ 1,494,775 10,436 8,216 2.51$ 1.72$Limited Dental Services 1,003,780$ 40,617 14,034 223 24.71$ 0.46$Optical 2,925,673$ 35,965 29,624 198 81.35$ 1.34$Lab and X-Ray 2,800,306$ 128,611 28,381 707 21.77$ 1.28$Transportation 1,028,192$ 10,494 5,365 58 97.98$ 0.47$Subtotal (Medical) 238,785,477$ 3,847,224 170,371 109.37$CC4C LHD Payments 2,096,343$ 463,368 N/A 2,547 4.52$ 0.96$OBCM LHD Payments 1,250,632$ 254,142 N/A 1,397 4.92$ 0.57$Medical Home Payments 5,066,409$ 2,066,633 N/A 11,359 2.45$ 2.32$Subtotal (LHD/Medical Home Payments) 8,413,384$ 2,784,143 N/A 3.85$Total (Medical + LHD/Medical Home) 247,198,861$ 6,631,367 N/A 113.22$
Note: Please refer to Section 5 for more information on the detailed services captured under each COS in the exhibit above.
2,183,299181,942206,833
SFY 2017
Region 5
Standard Plan (Non-Duals)
TANF and Other Related Children/Adults
Child (1-20)
100 of 197Prepared by Mercer GovernmentHuman Services Consulting
RFP 30-190029-DHBSection IX. Medicaid Managed Care Draft Rate Book (SFY 2020)

Exhibit 64
Time Period/Region Selections:Time Period:
Region:
Population Selections:Program Type:
Category of Aid:
Age:
Member Months/Deliveries:Average Monthly Members/Deliveries:Eligibles:
Category of Service Incurred Claims Utilization UsersUtilizationPer 1,000
Unit CostPMPM/Payment
Inpatient — PH 13,865,660$ 13,012 2,651 289 1,065.61$ 25.65$Inpatient — BH 1,245,868$ 1,728 355 38 721.16$ 2.30$Outpatient Hospital 16,250,251$ 47,359 20,793 1,051 343.13$ 30.06$Emergency Room 25,088,335$ 57,415 26,535 1,275 436.97$ 46.41$Physician 28,709,294$ 250,471 41,412 5,560 114.62$ 53.11$FQHC/RHC 1,869,126$ 19,086 6,283 424 97.93$ 3.46$Other Clinic 3,739,911$ 16,035 14,756 356 233.23$ 6.92$Other Practitioner 179,258$ 2,442 967 54 73.42$ 0.33$Therapies 18,778$ 331 248 7 56.65$ 0.03$Prescribed Drugs 54,429,473$ 643,955 39,716 14,295 84.52$ 100.69$Other BH Services 4,372,906$ 57,473 6,681 1,276 76.09$ 8.09$LTSS Services 1,112,868$ 223,543 335 4,962 167.29$ 2.06$Durable Medical Equipment 2,901,484$ 1,157,933 5,315 25,704 2.51$ 5.37$Limited Dental Services -$ - - - -$ -$Optical 292,396$ 4,521 2,118 100 64.67$ 0.54$Lab and X-Ray 7,635,268$ 249,732 24,812 5,544 30.57$ 14.12$Transportation 990,173$ 10,918 4,868 242 90.69$ 1.83$Subtotal (Medical) 162,701,048$ 2,755,954 49,986 300.97$CC4C LHD Payments -$ - N/A - -$ -$OBCM LHD Payments 1,832,484$ 372,875 N/A 8,277 4.91$ 3.39$Medical Home Payments 1,006,669$ 418,439 N/A 9,289 2.41$ 1.86$Subtotal (LHD/Medical Home Payments) 2,839,153$ 791,313 N/A 5.25$Total (Medical + LHD/Medical Home) 165,540,201$ 3,547,268 N/A 306.22$
Note: Please refer to Section 5 for more information on the detailed services captured under each COS in the exhibit above.
540,58745,04963,298
SFY 2017
Region 5
Standard Plan (Non-Duals)
TANF and Other Related Children/Adults
Adult (21+)
101 of 197Prepared by Mercer GovernmentHuman Services Consulting
RFP 30-190029-DHBSection IX. Medicaid Managed Care Draft Rate Book (SFY 2020)
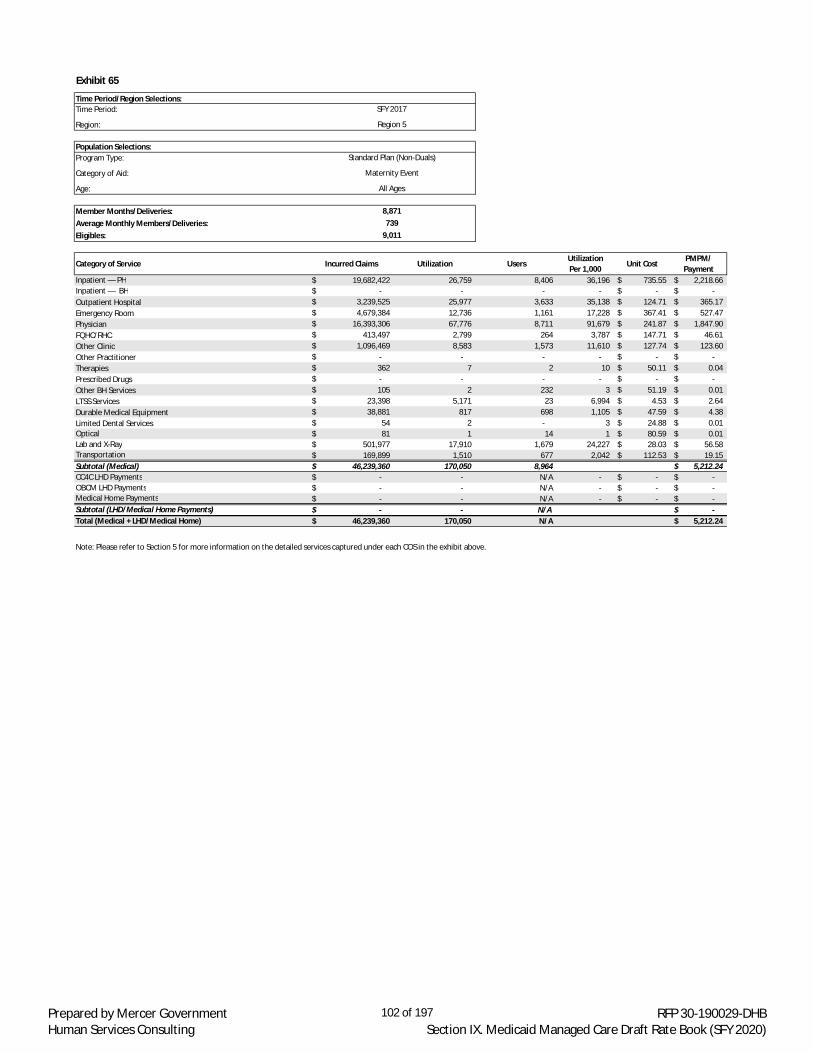
Exhibit 65
Time Period/Region Selections:Time Period:
Region:
Population Selections:Program Type:
Category of Aid:
Age:
Member Months/Deliveries:Average Monthly Members/Deliveries:Eligibles:
Category of Service Incurred Claims Utilization UsersUtilizationPer 1,000
Unit CostPMPM/Payment
Inpatient — PH 19,682,422$ 26,759 8,406 36,196 735.55$ 2,218.66$Inpatient — BH -$ - - - -$ -$Outpatient Hospital 3,239,525$ 25,977 3,633 35,138 124.71$ 365.17$Emergency Room 4,679,384$ 12,736 1,161 17,228 367.41$ 527.47$Physician 16,393,306$ 67,776 8,711 91,679 241.87$ 1,847.90$FQHC/RHC 413,497$ 2,799 264 3,787 147.71$ 46.61$Other Clinic 1,096,469$ 8,583 1,573 11,610 127.74$ 123.60$Other Practitioner -$ - - - -$ -$Therapies 362$ 7 2 10 50.11$ 0.04$Prescribed Drugs -$ - - - -$ -$Other BH Services 105$ 2 232 3 51.19$ 0.01$LTSS Services 23,398$ 5,171 23 6,994 4.53$ 2.64$Durable Medical Equipment 38,881$ 817 698 1,105 47.59$ 4.38$Limited Dental Services 54$ 2 - 3 24.88$ 0.01$Optical 81$ 1 14 1 80.59$ 0.01$Lab and X-Ray 501,977$ 17,910 1,679 24,227 28.03$ 56.58$Transportation 169,899$ 1,510 677 2,042 112.53$ 19.15$Subtotal (Medical) 46,239,360$ 170,050 8,964 5,212.24$CC4C LHD Payments -$ - N/A - -$ -$OBCM LHD Payments -$ - N/A - -$ -$Medical Home Payments -$ - N/A - -$ -$Subtotal (LHD/Medical Home Payments) -$ - N/A -$Total (Medical + LHD/Medical Home) 46,239,360$ 170,050 N/A 5,212.24$
Note: Please refer to Section 5 for more information on the detailed services captured under each COS in the exhibit above.
8,871739
9,011
SFY 2017
Region 5
Standard Plan (Non-Duals)
Maternity Event
All Ages
102 of 197Prepared by Mercer GovernmentHuman Services Consulting
RFP 30-190029-DHBSection IX. Medicaid Managed Care Draft Rate Book (SFY 2020)

Exhibit 66
Time Period/Region Selections:Time Period:
Region:
Population Selections:Program Type:
Category of Aid:
Age:
Member Months/Deliveries:Average Monthly Members/Deliveries:Eligibles:
Category of Service Incurred Claims Utilization UsersUtilizationPer 1,000
Unit CostPMPM/Payment
Inpatient — PH 113,324,958$ 142,471 27,946 540 795.43$ 35.76$Inpatient — BH 4,993,801$ 7,258 1,075 27 688.00$ 1.58$Outpatient Hospital 64,769,273$ 193,030 74,066 731 335.54$ 20.44$Emergency Room 81,376,943$ 232,664 112,758 881 349.76$ 25.68$Physician 138,477,627$ 1,303,147 235,960 4,935 106.26$ 43.70$FQHC/RHC 7,535,453$ 76,261 24,714 289 98.81$ 2.38$Other Clinic 24,996,624$ 204,877 131,691 776 122.01$ 7.89$Other Practitioner 660,373$ 8,415 3,243 32 78.47$ 0.21$Therapies 16,353,139$ 157,554 9,341 597 103.79$ 5.16$Prescribed Drugs 254,076,583$ 2,421,752 207,026 9,171 104.91$ 80.18$Other BH Services 22,532,732$ 298,425 28,175 1,130 75.51$ 7.11$LTSS Services 20,477,302$ 4,247,373 3,095 16,084 181.97$ 6.46$Durable Medical Equipment 17,854,652$ 6,586,422 25,428 24,942 2.71$ 5.63$Limited Dental Services 1,319,246$ 53,301 19,175 202 24.75$ 0.42$Optical 3,724,182$ 48,202 35,271 183 77.26$ 1.18$Lab and X-Ray 14,542,162$ 528,844 67,900 2,003 27.50$ 4.59$Transportation 4,593,461$ 54,078 17,189 205 84.94$ 1.45$Subtotal (Medical) 791,608,513$ 16,564,075 275,352 249.81$CC4C LHD Payments 2,654,845$ 585,936 N/A 2,219 4.53$ 0.84$OBCM LHD Payments 3,310,441$ 673,051 N/A 2,549 4.92$ 1.04$Medical Home Payments 7,722,271$ 2,885,143 N/A 10,926 2.68$ 2.44$Subtotal (LHD/Medical Home Payments) 13,687,557$ 4,144,130 N/A 4.32$Total (Medical + LHD/Medical Home) 805,296,070$ 20,708,205 N/A 254.13$
Note: Please refer to Section 5 for more information on the detailed services captured under each COS in the exhibit above.
3,168,863264,072331,322
SFY 2017
Region 5
Standard Plan (Non-Duals)
All Population Groups
All Ages
103 of 197Prepared by Mercer GovernmentHuman Services Consulting
RFP 30-190029-DHBSection IX. Medicaid Managed Care Draft Rate Book (SFY 2020)

7.2.6 SFY 2017 Region 6 Exhibits
104 of 197Prepared by Mercer GovernmentHuman Services Consulting
RFP 30-190029-DHBSection IX. Medicaid Managed Care Draft Rate Book (SFY 2020)

Exhibit 67
Time Period/Region Selections:Time Period:
Region:
Population Selections:Program Type:
Category of Aid:
Age:
Member Months/Deliveries:Average Monthly Members/Deliveries:Eligibles:
Category of Service Incurred Claims Utilization UsersUtilizationPer 1,000
Unit CostPMPM/Payment
Inpatient — PH 33,908,853$ 34,770 3,445 1,562 975.23$ 126.93$Inpatient — BH 2,181,274$ 2,921 372 131 746.83$ 8.17$Outpatient Hospital 20,092,525$ 35,463 10,317 1,593 566.57$ 75.21$Emergency Room 16,221,364$ 32,182 12,109 1,446 504.05$ 60.72$Physician 27,327,152$ 191,382 19,642 8,597 142.79$ 102.30$FQHC/RHC 2,032,962$ 19,316 5,292 868 105.25$ 7.61$Other Clinic 3,642,048$ 7,529 4,317 338 483.75$ 13.63$Other Practitioner 250,262$ 3,395 1,203 153 73.71$ 0.94$Therapies 1,278,108$ 11,240 660 505 113.71$ 4.78$Prescribed Drugs 96,667,525$ 702,485 20,214 31,556 137.61$ 361.87$Other BH Services 3,109,256$ 53,752 5,567 2,415 57.85$ 11.64$LTSS Services 17,007,737$ 3,253,079 2,030 146,132 182.17$ 63.67$Durable Medical Equipment 9,592,168$ 3,371,875 6,021 151,468 2.84$ 35.91$Limited Dental Services 9,836$ 397 128 18 24.76$ 0.04$Optical 362,636$ 5,181 3,151 233 70.00$ 1.36$Lab and X-Ray 2,491,765$ 109,950 10,797 4,939 22.66$ 9.33$Transportation 2,475,349$ 41,715 4,783 1,874 59.34$ 9.27$Subtotal (Medical) 238,650,822$ 7,876,632 22,943 893.37$CC4C LHD Payments 1,091$ 240 N/A 11 4.54$ 0.00$OBCM LHD Payments 193,836$ 39,253 N/A 1,763 4.94$ 0.73$Medical Home Payments 1,210,762$ 252,617 N/A 11,348 4.79$ 4.53$Subtotal (LHD/Medical Home Payments) 1,405,688$ 292,110 N/A 5.26$Total (Medical + LHD/Medical Home) 240,056,510$ 8,168,742 N/A 898.63$
Note: Please refer to Section 5 for more information on the detailed services captured under each COS in the exhibit above.
267,13622,26126,250
SFY 2017
Region 6
Standard Plan (Non-Duals)
Aged, Blind, Disabled
All Ages
105 of 197Prepared by Mercer GovernmentHuman Services Consulting
RFP 30-190029-DHBSection IX. Medicaid Managed Care Draft Rate Book (SFY 2020)

Exhibit 68
Time Period/Region Selections:Time Period:
Region:
Population Selections:Program Type:
Category of Aid:
Age:
Member Months/Deliveries:Average Monthly Members/Deliveries:Eligibles:
Category of Service Incurred Claims Utilization UsersUtilizationPer 1,000
Unit CostPMPM/Payment
Inpatient — PH 20,773,693$ 36,954 8,077 4,069 562.14$ 190.60$Inpatient — BH -$ - - - -$ -$Outpatient Hospital 1,062,514$ 5,906 3,306 650 179.90$ 9.75$Emergency Room 2,578,938$ 10,276 5,565 1,131 250.97$ 23.66$Physician 9,710,719$ 96,348 14,546 10,608 100.79$ 89.10$FQHC/RHC 645,160$ 6,198 1,382 682 104.10$ 5.92$Other Clinic 4,202,945$ 39,555 13,116 4,355 106.26$ 38.56$Other Practitioner 2,043$ 48 15 5 42.88$ 0.02$Therapies 101,548$ 976 169 108 103.99$ 0.93$Prescribed Drugs 1,631,998$ 31,402 8,681 3,457 51.97$ 14.97$Other BH Services 11,417$ 625 8 69 18.27$ 0.10$LTSS Services 70,376$ 1,048 7 115 67.16$ 0.65$Durable Medical Equipment 298,073$ 53,417 1,044 5,881 5.58$ 2.73$Limited Dental Services 271,630$ 10,897 4,303 1,200 24.93$ 2.49$Optical 7,233$ 89 69 10 81.68$ 0.07$Lab and X-Ray 64,975$ 3,118 978 343 20.84$ 0.60$Transportation 273,848$ 2,284 772 251 119.91$ 2.51$Subtotal (Medical) 41,707,110$ 299,140 16,085 382.66$CC4C LHD Payments 448,412$ 98,407 N/A 10,835 4.56$ 4.11$OBCM LHD Payments -$ - N/A - -$ -$Medical Home Payments 219,774$ 89,579 N/A 9,863 2.45$ 2.02$Subtotal (LHD/Medical Home Payments) 668,186$ 187,986 N/A 6.13$Total (Medical + LHD/Medical Home) 42,375,296$ 487,126 N/A 388.79$
Note: Please refer to Section 5 for more information on the detailed services captured under each COS in the exhibit above.
108,9929,083
17,762
SFY 2017
Region 6
Standard Plan (Non-Duals)
TANF and Other Related Children/Adults
Newborn (<1)
106 of 197Prepared by Mercer GovernmentHuman Services Consulting
RFP 30-190029-DHBSection IX. Medicaid Managed Care Draft Rate Book (SFY 2020)

Exhibit 69
Time Period/Region Selections:Time Period:
Region:
Population Selections:Program Type:
Category of Aid:
Age:
Member Months/Deliveries:Average Monthly Members/Deliveries:Eligibles:
Category of Service Incurred Claims Utilization UsersUtilizationPer 1,000
Unit CostPMPM/Payment
Inpatient — PH 6,922,858$ 5,524 1,238 38 1,253.21$ 3.99$Inpatient — BH 1,361,232$ 2,319 265 16 586.97$ 0.79$Outpatient Hospital 12,996,332$ 37,526 21,281 260 346.33$ 7.50$Emergency Room 23,892,199$ 84,304 49,404 584 283.40$ 13.78$Physician 31,089,086$ 437,138 110,576 3,026 71.12$ 17.93$FQHC/RHC 3,316,828$ 32,743 12,981 227 101.30$ 1.91$Other Clinic 10,472,431$ 99,358 76,957 688 105.40$ 6.04$Other Practitioner 178,352$ 2,450 927 17 72.81$ 0.10$Therapies 5,944,391$ 51,738 4,338 358 114.89$ 3.43$Prescribed Drugs 64,058,923$ 645,147 95,278 4,465 99.29$ 36.95$Other BH Services 7,845,836$ 104,811 12,584 725 74.86$ 4.53$LTSS Services 257,952$ 20,979 44 145 100.85$ 0.15$Durable Medical Equipment 2,911,911$ 1,079,420 8,057 7,471 2.70$ 1.68$Limited Dental Services 909,824$ 36,814 12,054 255 24.71$ 0.52$Optical 2,336,482$ 28,135 25,400 195 83.05$ 1.35$Lab and X-Ray 2,092,395$ 110,151 21,902 762 19.00$ 1.21$Transportation 875,144$ 11,298 4,147 78 77.46$ 0.50$Subtotal (Medical) 177,462,176$ 2,789,854 135,358 102.36$CC4C LHD Payments 1,691,277$ 373,833 N/A 2,587 4.52$ 0.98$OBCM LHD Payments 974,781$ 198,086 N/A 1,371 4.92$ 0.56$Medical Home Payments 4,024,743$ 1,642,587 N/A 11,369 2.45$ 2.32$Subtotal (LHD/Medical Home Payments) 6,690,801$ 2,214,507 N/A 3.86$Total (Medical + LHD/Medical Home) 184,152,977$ 5,004,360 N/A 106.22$
Note: Please refer to Section 5 for more information on the detailed services captured under each COS in the exhibit above.
1,733,723144,477164,827
SFY 2017
Region 6
Standard Plan (Non-Duals)
TANF and Other Related Children/Adults
Child (1-20)
107 of 197Prepared by Mercer GovernmentHuman Services Consulting
RFP 30-190029-DHBSection IX. Medicaid Managed Care Draft Rate Book (SFY 2020)

Exhibit 70
Time Period/Region Selections:Time Period:
Region:
Population Selections:Program Type:
Category of Aid:
Age:
Member Months/Deliveries:Average Monthly Members/Deliveries:Eligibles:
Category of Service Incurred Claims Utilization UsersUtilizationPer 1,000
Unit CostPMPM/Payment
Inpatient — PH 9,328,294$ 8,085 1,625 238 1,153.71$ 22.88$Inpatient — BH 954,536$ 1,153 221 34 827.64$ 2.34$Outpatient Hospital 11,099,675$ 28,181 14,061 829 393.87$ 27.22$Emergency Room 19,013,960$ 45,809 21,066 1,348 415.07$ 46.63$Physician 17,249,518$ 152,651 29,685 4,492 113.00$ 42.30$FQHC/RHC 1,737,885$ 17,224 5,889 507 100.90$ 4.26$Other Clinic 3,231,879$ 16,812 13,144 495 192.23$ 7.93$Other Practitioner 157,965$ 2,285 929 67 69.12$ 0.39$Therapies 4,959$ 101 83 3 49.00$ 0.01$Prescribed Drugs 37,976,488$ 425,052 29,509 12,508 89.35$ 93.13$Other BH Services 2,785,498$ 41,492 5,344 1,221 67.13$ 6.83$LTSS Services 569,700$ 106,364 206 3,130 173.22$ 1.40$Durable Medical Equipment 2,089,279$ 921,812 3,731 27,127 2.27$ 5.12$Limited Dental Services 15$ 1 1 0 15.11$ 0.00$Optical 148,446$ 2,118 1,394 62 70.10$ 0.36$Lab and X-Ray 4,928,565$ 183,312 19,404 5,395 26.89$ 12.09$Transportation 721,889$ 9,660 3,164 284 74.73$ 1.77$Subtotal (Medical) 111,998,551$ 1,962,113 38,188 274.66$CC4C LHD Payments -$ - N/A - -$ -$OBCM LHD Payments 1,409,970$ 286,901 N/A 8,443 4.91$ 3.46$Medical Home Payments 756,316$ 316,367 N/A 9,310 2.39$ 1.85$Subtotal (LHD/Medical Home Payments) 2,166,286$ 603,268 N/A 5.31$Total (Medical + LHD/Medical Home) 114,164,837$ 2,565,381 N/A 279.97$
Note: Please refer to Section 5 for more information on the detailed services captured under each COS in the exhibit above.
407,77533,98148,504
SFY 2017
Region 6
Standard Plan (Non-Duals)
TANF and Other Related Children/Adults
Adult (21+)
108 of 197Prepared by Mercer GovernmentHuman Services Consulting
RFP 30-190029-DHBSection IX. Medicaid Managed Care Draft Rate Book (SFY 2020)

Exhibit 71
Time Period/Region Selections:Time Period:
Region:
Population Selections:Program Type:
Category of Aid:
Age:
Member Months/Deliveries:Average Monthly Members/Deliveries:Eligibles:
Category of Service Incurred Claims Utilization UsersUtilizationPer 1,000
Unit CostPMPM/Payment
Inpatient — PH 16,577,058$ 20,705 6,964 34,296 800.63$ 2,288.19$Inpatient — BH -$ - - - -$ -$Outpatient Hospital 1,824,891$ 12,591 2,691 20,856 144.93$ 251.90$Emergency Room 3,213,442$ 10,590 1,369 17,542 303.44$ 443.56$Physician 12,376,813$ 51,708 6,877 85,649 239.36$ 1,708.42$FQHC/RHC 980,384$ 6,217 527 10,298 157.69$ 135.33$Other Clinic 2,051,707$ 15,842 1,978 26,241 129.51$ 283.21$Other Practitioner -$ - - - -$ -$Therapies -$ - - - -$ -$Prescribed Drugs -$ - - - -$ -$Other BH Services -$ - - - -$ -$LTSS Services 31,081$ 2,216 7 3,671 14.02$ 4.29$Durable Medical Equipment 7,087$ 119 195 197 59.53$ 0.98$Limited Dental Services 50$ 2 - 3 24.79$ 0.01$Optical 81$ 1 14 2 80.59$ 0.01$Lab and X-Ray 399,774$ 15,469 1,961 25,623 25.84$ 55.18$Transportation 155,300$ 1,367 576 2,264 113.62$ 21.44$Subtotal (Medical) 37,617,668$ 136,828 7,316 5,192.51$CC4C LHD Payments -$ - N/A - -$ -$OBCM LHD Payments -$ - N/A - -$ -$Medical Home Payments -$ - N/A - -$ -$Subtotal (LHD/Medical Home Payments) -$ - N/A -$Total (Medical + LHD/Medical Home) 37,617,668$ 136,828 N/A 5,192.51$
Note: Please refer to Section 5 for more information on the detailed services captured under each COS in the exhibit above.
7,245604
7,365
SFY 2017
Region 6
Standard Plan (Non-Duals)
Maternity Event
All Ages
109 of 197Prepared by Mercer GovernmentHuman Services Consulting
RFP 30-190029-DHBSection IX. Medicaid Managed Care Draft Rate Book (SFY 2020)

Exhibit 72
Time Period/Region Selections:Time Period:
Region:
Population Selections:Program Type:
Category of Aid:
Age:
Member Months/Deliveries:Average Monthly Members/Deliveries:Eligibles:
Category of Service Incurred Claims Utilization UsersUtilizationPer 1,000
Unit CostPMPM/Payment
Inpatient — PH 87,510,757$ 106,039 21,349 505 825.27$ 34.76$Inpatient — BH 4,497,042$ 6,393 859 30 703.42$ 1.79$Outpatient Hospital 47,075,937$ 119,668 51,656 570 393.39$ 18.70$Emergency Room 64,919,904$ 183,161 89,513 873 354.44$ 25.79$Physician 97,753,287$ 929,228 181,326 4,429 105.20$ 38.83$FQHC/RHC 8,713,219$ 81,697 26,071 389 106.65$ 3.46$Other Clinic 23,601,011$ 179,096 109,512 854 131.78$ 9.37$Other Practitioner 588,622$ 8,178 3,075 39 71.98$ 0.23$Therapies 7,329,005$ 64,056 5,250 305 114.42$ 2.91$Prescribed Drugs 200,334,934$ 1,804,087 158,208 8,599 111.05$ 79.57$Other BH Services 13,752,008$ 200,679 23,688 957 68.53$ 5.46$LTSS Services 17,936,846$ 3,383,686 2,294 16,128 181.75$ 7.12$Durable Medical Equipment 14,898,518$ 5,426,643 19,048 25,866 2.75$ 5.92$Limited Dental Services 1,191,355$ 48,111 16,486 229 24.76$ 0.47$Optical 2,854,879$ 35,523 30,028 169 80.37$ 1.13$Lab and X-Ray 9,977,474$ 422,000 55,042 2,011 23.64$ 3.96$Transportation 4,501,528$ 66,324 13,442 316 67.87$ 1.79$Subtotal (Medical) 607,436,327$ 13,064,567 219,576 241.27$CC4C LHD Payments 2,140,779$ 472,481 N/A 2,252 4.53$ 0.85$OBCM LHD Payments 2,578,587$ 524,240 N/A 2,499 4.92$ 1.02$Medical Home Payments 6,211,595$ 2,301,150 N/A 10,968 2.70$ 2.47$Subtotal (LHD/Medical Home Payments) 10,930,961$ 3,297,871 N/A 4.34$Total (Medical + LHD/Medical Home) 618,367,288$ 16,362,437 N/A 245.62$
Note: Please refer to Section 5 for more information on the detailed services captured under each COS in the exhibit above.
2,517,626209,802264,708
SFY 2017
Region 6
Standard Plan (Non-Duals)
All Population Groups
All Ages
110 of 197Prepared by Mercer GovernmentHuman Services Consulting
RFP 30-190029-DHBSection IX. Medicaid Managed Care Draft Rate Book (SFY 2020)
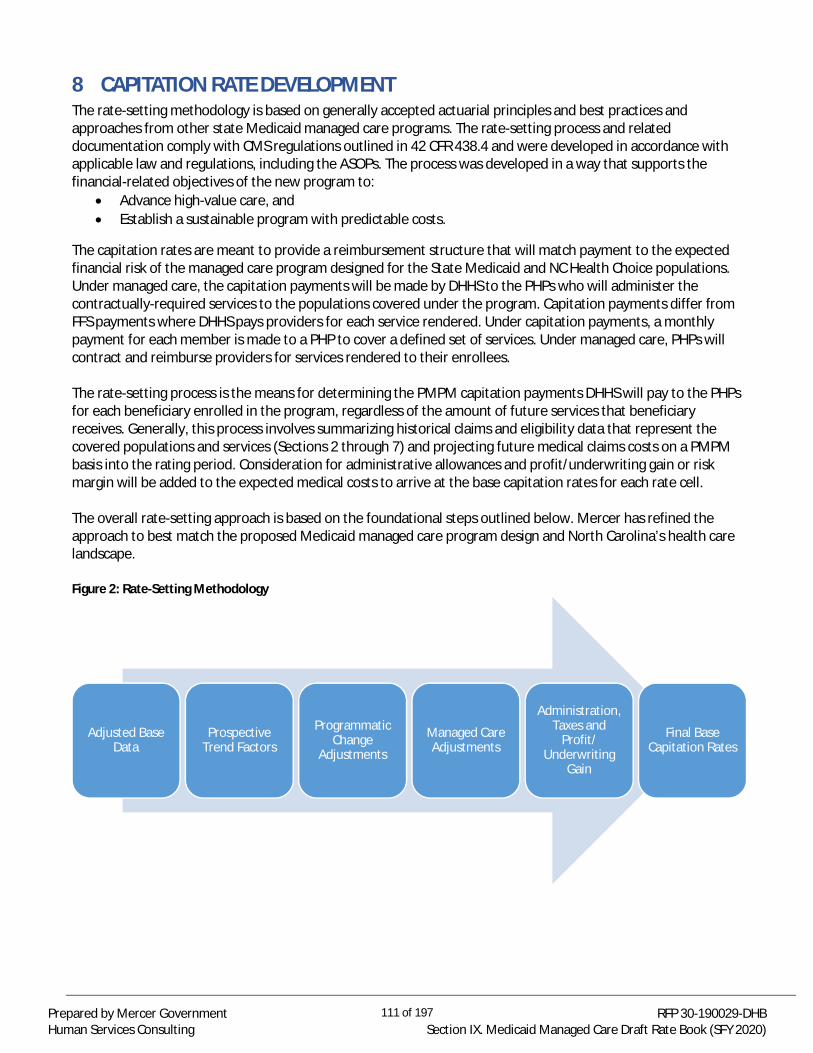
8 CAPITATION RATE DEVELOPMENTThe rate-setting methodology is based on generally accepted actuarial principles and best practices andapproaches from other state Medicaid managed care programs. The rate-setting process and relateddocumentation comply with CMS regulations outlined in 42 CFR 438.4 and were developed in accordance withapplicable law and regulations, including the ASOPs. The process was developed in a way that supports thefinancial-related objectives of the new program to:
· Advance high-value care, and· Establish a sustainable program with predictable costs.
The capitation rates are meant to provide a reimbursement structure that will match payment to the expectedfinancial risk of the managed care program designed for the State Medicaid and NC Health Choice populations.Under managed care, the capitation payments will be made by DHHS to the PHPs who will administer thecontractually-required services to the populations covered under the program. Capitation payments differ fromFFS payments where DHHS pays providers for each service rendered. Under capitation payments, a monthlypayment for each member is made to a PHP to cover a defined set of services. Under managed care, PHPs willcontract and reimburse providers for services rendered to their enrollees.
The rate-setting process is the means for determining the PMPM capitation payments DHHS will pay to the PHPsfor each beneficiary enrolled in the program, regardless of the amount of future services that beneficiaryreceives. Generally, this process involves summarizing historical claims and eligibility data that represent thecovered populations and services (Sections 2 through 7) and projecting future medical claims costs on a PMPMbasis into the rating period. Consideration for administrative allowances and profit/underwriting gain or riskmargin will be added to the expected medical costs to arrive at the base capitation rates for each rate cell.
The overall rate-setting approach is based on the foundational steps outlined below. Mercer has refined theapproach to best match the proposed Medicaid managed care program design and North Carolina’s health carelandscape.
Figure 2: Rate-Setting Methodology
Adjusted BaseData
ProspectiveTrend Factors
ProgrammaticChange
Adjustments
Managed CareAdjustments
Administration,Taxes and
Profit/Underwriting
Gain
Final BaseCapitation Rates
111 of 197Prepared by Mercer GovernmentHuman Services Consulting
RFP 30-190029-DHBSection IX. Medicaid Managed Care Draft Rate Book (SFY 2020)

9 BASE DATA DEVELOPMENTCapitation rates were developed starting with a 20.0%/80.0% blend of SFY 2016 and SFY 2017 base dataexperience, respectively (with the exception of pharmacy as described below). Prior to blending the base dataexperience into a single base year, Mercer trended SFY 2016 data forward one year so that the SFY 2016 and SFY2017 experience was on the same basis.
Mercer reviewed SFY 2015 through SFY 2017 historical experience to develop retrospective trend assumptions,which are used to trend SFY 2016 to SFY 2017 prior to blending. Retrospective trend assumptions weredeveloped by major COS groupings, and were developed in aggregate across all regions and COA. This approachhelps create a more credible level of data, smooth data anomalies and mitigate volatility for smaller COS withina rate cell. Since retrospective trend was developed and applied on an aggregate basis this allows for annualregional, COA and/or detailed COS variances to be mitigated by trending SFY 2016 to SFY 2017 and blending thetwo years of experience.
The table below provides an outline of how the detailed COS included in the base data summaries (Section 7)are aggregated for trend analyses (same COS groupings used for prospective trend in Section 10) along with theretrospective trend factors used to trend SFY 2016 onto a SFY 2017 time period basis.
Table 14: Retrospective Trend Factors for SFY 2016 to SFY 2017 by COSAggregate COS Detailed COS Trend Factors for SFY 2016 to SFY 2017
Inpatient Hospital Inpatient Hospital — PHInpatient Hospital — BH
2.0%
Outpatient Hospital Outpatient Hospital 2.0%
Emergency Room Emergency Room 2.0%
Physician PhysicianFQHC/RHCOther ClinicOther PractitionerTherapies
2.5%
Prescribed Drugs Prescribed Drugs Not Applicable
Other BH Services Other BH Services 6.5%
LTSS Services LTSS Services 2.0%
Other Acute Care Durable Medical EquipmentLimited Dental ServicesOpticalLab and X-Ray
2.0%
Transportation Transportation 0.0%
After trending SFY 2016 to a common SFY 2017 time period, Mercer smoothed the claims data by blending themultiple years of available data into a single base year (SFY 2017), placing higher credibility on the most recentyear. The goal of this process is to obtain a set of base data that has sufficient credibility and reasonableness todevelop actuarially sound capitation rates. For all populations and services, except for pharmacy, 20.0% weightwas given to SFY 2016 and 80.0% weight was given to SFY 2017. For pharmacy, effective January 1, 2016, DHHSimplemented a new reimbursement methodology based on Actual Acquisition Cost (AAC). Given this change isnot fully reflected in the SFY 2016 base data, Mercer placed 100.0% weight on the SFY 2017 experience.
Please note the base data development will be refreshed to include data through SFY 2018 in advance ofmanaged care implementation and final capitation rate development.
112 of 197Prepared by Mercer GovernmentHuman Services Consulting
RFP 30-190029-DHBSection IX. Medicaid Managed Care Draft Rate Book (SFY 2020)
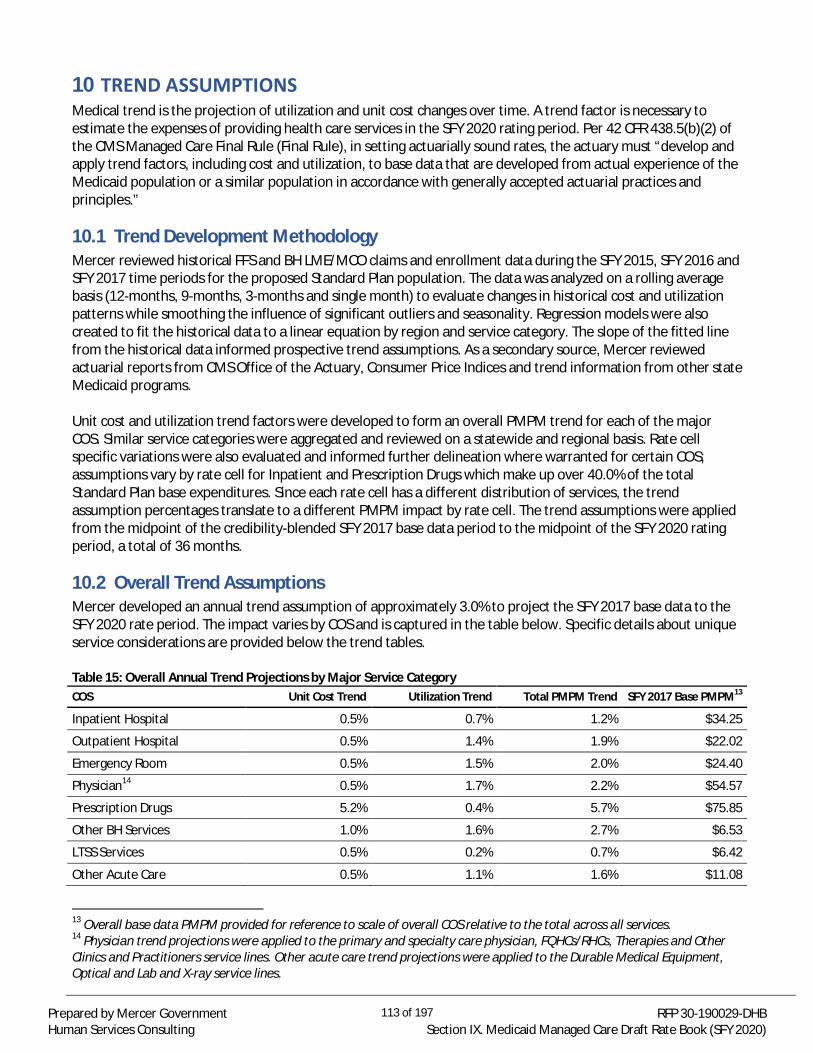
10 TREND ASSUMPTIONSMedical trend is the projection of utilization and unit cost changes over time. A trend factor is necessary toestimate the expenses of providing health care services in the SFY 2020 rating period. Per 42 CFR 438.5(b)(2) ofthe CMS Managed Care Final Rule (Final Rule), in setting actuarially sound rates, the actuary must “develop andapply trend factors, including cost and utilization, to base data that are developed from actual experience of theMedicaid population or a similar population in accordance with generally accepted actuarial practices andprinciples.”
Trend Development Methodology10.1Mercer reviewed historical FFS and BH LME/MCO claims and enrollment data during the SFY 2015, SFY 2016 andSFY 2017 time periods for the proposed Standard Plan population. The data was analyzed on a rolling averagebasis (12-months, 9-months, 3-months and single month) to evaluate changes in historical cost and utilizationpatterns while smoothing the influence of significant outliers and seasonality. Regression models were alsocreated to fit the historical data to a linear equation by region and service category. The slope of the fitted linefrom the historical data informed prospective trend assumptions. As a secondary source, Mercer reviewedactuarial reports from CMS Office of the Actuary, Consumer Price Indices and trend information from other stateMedicaid programs.
Unit cost and utilization trend factors were developed to form an overall PMPM trend for each of the majorCOS. Similar service categories were aggregated and reviewed on a statewide and regional basis. Rate cellspecific variations were also evaluated and informed further delineation where warranted for certain COS;assumptions vary by rate cell for Inpatient and Prescription Drugs which make up over 40.0% of the totalStandard Plan base expenditures. Since each rate cell has a different distribution of services, the trendassumption percentages translate to a different PMPM impact by rate cell. The trend assumptions were appliedfrom the midpoint of the credibility-blended SFY 2017 base data period to the midpoint of the SFY 2020 ratingperiod, a total of 36 months.
Overall Trend Assumptions10.2Mercer developed an annual trend assumption of approximately 3.0% to project the SFY 2017 base data to theSFY 2020 rate period. The impact varies by COS and is captured in the table below. Specific details about uniqueservice considerations are provided below the trend tables.
Table 15: Overall Annual Trend Projections by Major Service CategoryCOS Unit Cost Trend Utilization Trend Total PMPM Trend SFY 2017 Base PMPM13
Inpatient Hospital 0.5% 0.7% 1.2% $34.25
Outpatient Hospital 0.5% 1.4% 1.9% $22.02
Emergency Room 0.5% 1.5% 2.0% $24.40
Physician14 0.5% 1.7% 2.2% $54.57
Prescription Drugs 5.2% 0.4% 5.7% $75.85
Other BH Services 1.0% 1.6% 2.7% $6.53
LTSS Services 0.5% 0.2% 0.7% $6.42
Other Acute Care 0.5% 1.1% 1.6% $11.08
13 Overall base data PMPM provided for reference to scale of overall COS relative to the total across all services.14 Physician trend projections were applied to the primary and specialty care physician, FQHCs/RHCs, Therapies and OtherClinics and Practitioners service lines. Other acute care trend projections were applied to the Durable Medical Equipment,Optical and Lab and X-ray service lines.
113 of 197Prepared by Mercer GovernmentHuman Services Consulting
RFP 30-190029-DHBSection IX. Medicaid Managed Care Draft Rate Book (SFY 2020)
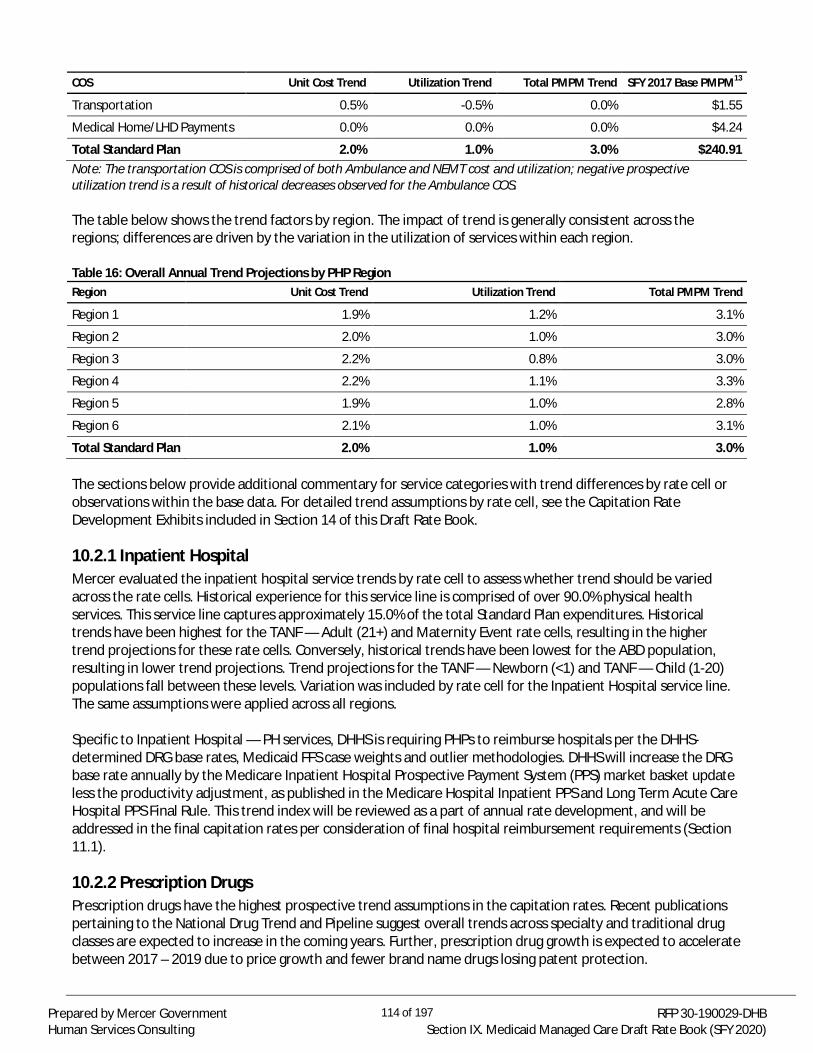
COS Unit Cost Trend Utilization Trend Total PMPM Trend SFY 2017 Base PMPM13
Transportation 0.5% -0.5% 0.0% $1.55
Medical Home/LHD Payments 0.0% 0.0% 0.0% $4.24
Total Standard Plan 2.0% 1.0% 3.0% $240.91Note: The transportation COS is comprised of both Ambulance and NEMT cost and utilization; negative prospectiveutilization trend is a result of historical decreases observed for the Ambulance COS.
The table below shows the trend factors by region. The impact of trend is generally consistent across theregions; differences are driven by the variation in the utilization of services within each region.
Table 16: Overall Annual Trend Projections by PHP RegionRegion Unit Cost Trend Utilization Trend Total PMPM Trend
Region 1 1.9% 1.2% 3.1%
Region 2 2.0% 1.0% 3.0%
Region 3 2.2% 0.8% 3.0%
Region 4 2.2% 1.1% 3.3%
Region 5 1.9% 1.0% 2.8%
Region 6 2.1% 1.0% 3.1%
Total Standard Plan 2.0% 1.0% 3.0%
The sections below provide additional commentary for service categories with trend differences by rate cell orobservations within the base data. For detailed trend assumptions by rate cell, see the Capitation RateDevelopment Exhibits included in Section 14 of this Draft Rate Book.
10.2.1 Inpatient HospitalMercer evaluated the inpatient hospital service trends by rate cell to assess whether trend should be variedacross the rate cells. Historical experience for this service line is comprised of over 90.0% physical healthservices. This service line captures approximately 15.0% of the total Standard Plan expenditures. Historicaltrends have been highest for the TANF — Adult (21+) and Maternity Event rate cells, resulting in the highertrend projections for these rate cells. Conversely, historical trends have been lowest for the ABD population,resulting in lower trend projections. Trend projections for the TANF — Newborn (<1) and TANF — Child (1-20)populations fall between these levels. Variation was included by rate cell for the Inpatient Hospital service line.The same assumptions were applied across all regions.
Specific to Inpatient Hospital — PH services, DHHS is requiring PHPs to reimburse hospitals per the DHHS-determined DRG base rates, Medicaid FFS case weights and outlier methodologies. DHHS will increase the DRGbase rate annually by the Medicare Inpatient Hospital Prospective Payment System (PPS) market basket updateless the productivity adjustment, as published in the Medicare Hospital Inpatient PPS and Long Term Acute CareHospital PPS Final Rule. This trend index will be reviewed as a part of annual rate development, and will beaddressed in the final capitation rates per consideration of final hospital reimbursement requirements (Section11.1).
10.2.2 Prescription DrugsPrescription drugs have the highest prospective trend assumptions in the capitation rates. Recent publicationspertaining to the National Drug Trend and Pipeline suggest overall trends across specialty and traditional drugclasses are expected to increase in the coming years. Further, prescription drug growth is expected to acceleratebetween 2017 – 2019 due to price growth and fewer brand name drugs losing patent protection.
114 of 197Prepared by Mercer GovernmentHuman Services Consulting
RFP 30-190029-DHBSection IX. Medicaid Managed Care Draft Rate Book (SFY 2020)
It is important to note pharmacy trends require special consideration in rate-setting. Recently, pharmacy trendshave been higher than other services covered under Medicaid programs driven by large trends in specialtymedications. Mercer has performed a trend analysis that reviews projections for specialty and traditionalpharmacy trends by rate cell to account for the varying impact of prescription drugs for each population. Someof the underlying reasons for the higher specialty trends include: expanded indications, direct to consumeradvertising and new drugs entering the market faster due to breakthrough therapy approvals granted by theFood and Drug Administration (FDA).
Pipeline drugs, which are drugs that are still under development or discovery, may not be reflected in thehistorical claims data, but are known to impact utilization and cost beyond the base data period. These types ofdrugs were evaluated and accounted for in the pharmacy trend development. There may also be significantgrowth in other drug classes such as diabetes (traditional), asthma (traditional), rheumatoid arthritis (specialty),oncology (specialty), HIV (specialty) and other new and emerging therapeutic drugs. Some recent examples ofemerging drugs that have impacted expected pharmacy costs are treatments for hypercholesterolemia, cysticfibrosis and hepatitis C. Pharmacy-specific trend models utilize this information along with historical utilizationdata to develop pharmacy trends for each rate cell.
Please note the trend assumptions will be re-evaluated when more recent base data experience becomesavailable in advance of managed care implementation and final capitation rate development. Pharmacytrends will be specifically reviewed to account for industry emerging trends, along with State-specific changesthat may impact pharmacy trends (e.g., 2017 Opioid policy changes).
115 of 197Prepared by Mercer GovernmentHuman Services Consulting
RFP 30-190029-DHBSection IX. Medicaid Managed Care Draft Rate Book (SFY 2020)

11 PROGRAM DESIGN CONSIDERATIONSMercer has adjusted the data for known programmatic design elements that are anticipated to impact theprojected claims expenditures. Mercer has utilized information in the claims data as well as informationprovided by DHHS to assess the impact of known programmatic changes to the capitation rates. Note that theseprogrammatic changes currently assume no changes to proposed covered benefits, and any changes (e.g.,changes to address the opioid crisis) will be evaluated and accounted for in the final capitation ratedevelopment process.
Hospital Reimbursement Methodology11.1DHHS has historically reimbursed hospitals using a mix of claims payments and supplemental payments. In theinitial contract years, rate floors will apply for PHP payments to hospitals that incorporate a portion of thesesupplemental payments into hospital base rates. For additional information on hospital reimbursementmethodology, see Appendix G.
For purposes of the draft rates, the hospital reimbursement adjustment has been modeled based on thehistorical supplemental payment levels. To account for the historical supplemental payments made to hospitalsoutside of the claims system, Mercer utilized supplemental payment information for the federal fiscal year (FFY)2016 time period to calculate a rate adjustment. Mercer evaluated the supplemental payments for InpatientHospital and Outpatient Hospital services, including Emergency Room services, by provider number (NationalProvider Identifier [NPI]). Mercer then distributed these payments across the Standard Plan population byregion and by rate cell based on the population-specific claim costs by hospital captured in the FFS data.
DHHS will make GME payments directly to eligible hospitals, and thus PHPs will not be required to reimbursehospitals for GME. The hospital reimbursement methodology adjustment reflects the reclassification ofhistorical supplemental payments as GME per the hospital reimbursement methodology; the total amount ofhistorical supplemental payments reclassified as GME in the draft rates is around $140 million for all populations(including those excluded from PHPs). This $140 million is in addition to the $85 million removed from historicalFFS claims expenditures, reflecting the GME add-on currently included in the hospital base rates (see Section 6.4of this Draft Rate Book). In total, $225 million in GME, representing the base rate add-on and portion ofsupplemental payments attributable to GME, was removed from the draft capitation rates.
The tables below represents the total regional supplemental payment amounts across all populations and thenthe amount allocated to the Standard Plan population and the overall impact by COA to the Standard Plancapitation rates. As mentioned above, the figures below reflect adjusted historical supplemental paymentinformation for the GME reclassification.
Table 17: Calculated Historical Supplemental Payments by RegionInpatient Hospital Outpatient Hospital (Includes Emergency Room)
Region
Total SupplementalPayments for All
Populations
Supplemental Paymentsfor the Standard Plan
Population
Total SupplementalPayments for All
Populations
Supplemental Paymentsfor the Standard Plan
Population
Region 1 $146.9M $112.8M $32.0M $24.2M
Region 2 $256.1M $204.4M $61.9M $49.2M
Region 3 $339.3M $267.8M $92.9M $73.8M
Region 4 $255.7M $190.9M $53.8M $41.4M
Region 5 $251.0M $196.7M $51.4M $41.5M
Region 6 $118.1M $91.4M $31.1M $24.9M
Total $1,367.1M $1,064.0M $323.1M $255.0M
116 of 197Prepared by Mercer GovernmentHuman Services Consulting
RFP 30-190029-DHBSection IX. Medicaid Managed Care Draft Rate Book (SFY 2020)

Table 18: Impact of Hospital Reimbursement Requirements by COACOA PMPM/Payment Impact Percent Impact
ABD $241.95 21.9%
TANF, Newborn (<1) $306.44 76.6%
TANF, Children (1-20) $12.85 10.7%
TANF, Adults (21+) $66.42 20.5%
Maternity Event $3,756.83 73.0%
Total Standard Plan $64.81 24.7%
Final capitation rates will reflect the final hospital base rates developed using the methodology described inAppendix G. Note as part of the hospital reimbursement design, DHHS will apply the new reimbursement ratesto the NC Health Choice population. The capitation rate adjustment outlined above does not reflect this impactfor the NC Health Choice population. DHHS is also requiring PHPs to make additional, utilization based, directedpayments to hospitals owned by UNC Health Care and Vidant Medical Center. DHHS will reimburse PHPs forthese additional payments outside of the prospective PMPM and maternity event capitated payments. Thehistorical supplemental payments for UNC and Vidant are included in the supplemental payments incorporatedinto the draft rates. The final rates will be adjusted downward to account for the directed payments to UNCHealth Care and Vidant Medical Center that will be removed from the risk pool.
Maternity Enhanced Rate11.2Under the current FFS program, providers offering coverage to beneficiaries enrolled in the PMH are reimbursedat an enhanced rate for vaginal deliveries (approximately 85.0% of total vaginal births). Under managed care,DHHS is requiring that PHPs reimburse all providers at the enhanced payment rate on all vaginal deliveries.Given that a portion of the historical FFS deliveries occurred outside of the PMH, Mercer evaluated anadjustment to ensure all vaginal deliveries in the base experience reflected the enhanced rate consistent withfuture PHP reimbursement requirements. To calculate this adjustment, Mercer identified the vaginal deliverieswith a unit cost corresponding to the fee schedule rate and repriced at the enhanced vaginal delivery unit costrepresented in the data. Claims and utilization data for this adjustment was based on the Calendar Year 2016time period to ensure adequate runout in order to capture all deliveries within a year. This adjustmentrepresented an overall 0.3%, or approximately $784,000 overall, upward adjustment to the Maternity Event ratecell (0.8% upward adjustment to the Physician COS).
Long-Term Nursing Home Stay Beneficiaries11.3The base data currently excludes beneficiaries with long-term nursing home stays (90 days or greater) from theStandard Plan population. Under the proposed program design, PHPs are responsible for short-term nursinghome stays along with the first 90 days of a long-term nursing home stay for new admissions to the nursinghome (after which they would be dis-enrolled from the PHP). Beneficiaries accessing services in State-ownedneuro-medical centers or State-owned veteran homes will be excluded from PHP coverage upon entry to one ofthose facilities. Since the summarized base experience does not include long-term nursing home staybeneficiaries, Mercer modeled an assumption to calculate an upward adjustment to account for the additionalcost and membership associated with new nursing home admissions during the first 90 days of a long-termnursing home stay. Mercer applied this adjustment on a PMPM basis to account for both the additional costsand MMs associated with these beneficiaries. Note that this adjustment is subject to change pending finalapproach to the long-term nursing home stay population.
117 of 197Prepared by Mercer GovernmentHuman Services Consulting
RFP 30-190029-DHBSection IX. Medicaid Managed Care Draft Rate Book (SFY 2020)

Table 19: Impact of Initial 90 Days of Long-term Nursing Home StaysCOA PMPM/Payment Impact
ABD 0.8%
TANF, Newborn (<1) 0.0%
TANF, Children (1-20) 0.0%
TANF, Adults (21+) 0.0%
Maternity Event 0.0%
Total Standard Plan 0.3%
Other Provider Reimbursement Considerations11.4
11.4.1 Provider Rate FloorsDHHS will establish rate floors set at FFS levels as allowed by 438.6(c)(1)(iii)(A) for in-network physicians,physician extenders, hospitals and nursing facilities. The rate floor for in-network primary and specialty carephysicians, as well as physician extenders (e.g., nurse practitioners and physician assistants) will be set at 100.0%of the Medicaid FFS rate. For a period of time to be defined by DHHS, PHPs shall be required to reimbursenursing facilities (excluding those owned and operated by the State) at a rate that is no less than the MedicaidFFS rate in effect six months prior to the start of the capitation rating year. As such, the capitation rates assumethe current FFS levels will be maintained as the payment level for these providers.
11.4.2 LME/MCO Services ReimbursementThe current proposed Standard Plan program design includes service offerings for a subset of BH serviceshistorically covered through the LME/MCOs (see Section 5, Table 4 for a listing of these services). However,proposed program design dictates that services historically covered by LME/MCOs should not be subject to arate floor requirement. While most LME/MCOs adhere to the State per diem fee schedule published for State-Operated ICF/IIDs, the LME/MCOs generally negotiate rates for other services. As such, the base encounterexperience reflects provider-negotiated rates for LME/MCO BH services covered under the Standard Plan. Noadjustments, other than trend, have been made in capitation rate development to alter the historical LME/MCOprovider rates.
11.4.3 FQHC/RHC ProvidersDHHS is currently working with FQHCs/RHCs on appropriate reimbursement rates under the PHP contracts. Forpurposes of draft rate development, similar reimbursement levels as FFS for these providers have beenassumed, with anticipated wrap payments as required. The historical cost settlements for FQHCs/RHCs were$10,039,949 and $17,211,997 for SFY 2015 and SFY 2016, respectively. Final rates will reflect PHP requirementsrelated to FQHC/RHC reimbursement.
11.4.4 Historical Cost SettlementsDHHS has historically cost settled certain providers in the FFS program. Interim payments are made based on adefined fee schedule and providers subsequently settled to actual cost. While cost settlements cannot continuein a managed care environment, DHHS is working with CMS to get approval for converting current costsettlements for certain providers to directed payments per 42 CFR 438.6(c). These are additional paymentsmade by PHPs to certain providers for a particular service, for which DHHS would reimburse PHPs outside of theprospective PMPM and maternity event capitated rates based on utilization of that particular service. As such,the capitation rates assume continuation of reimbursement consistent with current fee schedules. Any changesto this approach will be reflected in final rates.
118 of 197Prepared by Mercer GovernmentHuman Services Consulting
RFP 30-190029-DHBSection IX. Medicaid Managed Care Draft Rate Book (SFY 2020)
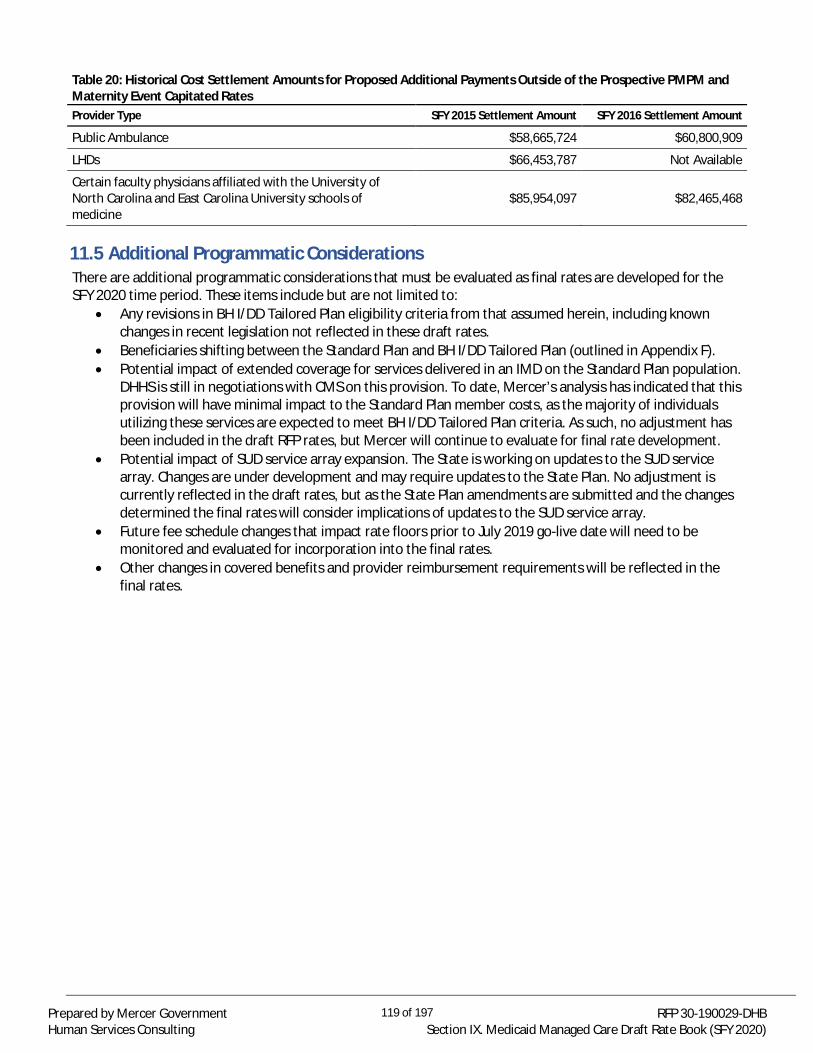
Table 20: Historical Cost Settlement Amounts for Proposed Additional Payments Outside of the Prospective PMPM andMaternity Event Capitated RatesProvider Type SFY 2015 Settlement Amount SFY 2016 Settlement Amount
Public Ambulance $58,665,724 $60,800,909
LHDs $66,453,787 Not Available
Certain faculty physicians affiliated with the University ofNorth Carolina and East Carolina University schools ofmedicine
$85,954,097 $82,465,468
Additional Programmatic Considerations11.5There are additional programmatic considerations that must be evaluated as final rates are developed for theSFY 2020 time period. These items include but are not limited to:
· Any revisions in BH I/DD Tailored Plan eligibility criteria from that assumed herein, including knownchanges in recent legislation not reflected in these draft rates.
· Beneficiaries shifting between the Standard Plan and BH I/DD Tailored Plan (outlined in Appendix F).· Potential impact of extended coverage for services delivered in an IMD on the Standard Plan population.
DHHS is still in negotiations with CMS on this provision. To date, Mercer’s analysis has indicated that thisprovision will have minimal impact to the Standard Plan member costs, as the majority of individualsutilizing these services are expected to meet BH I/DD Tailored Plan criteria. As such, no adjustment hasbeen included in the draft RFP rates, but Mercer will continue to evaluate for final rate development.
· Potential impact of SUD service array expansion. The State is working on updates to the SUD servicearray. Changes are under development and may require updates to the State Plan. No adjustment iscurrently reflected in the draft rates, but as the State Plan amendments are submitted and the changesdetermined the final rates will consider implications of updates to the SUD service array.
· Future fee schedule changes that impact rate floors prior to July 2019 go-live date will need to bemonitored and evaluated for incorporation into the final rates.
· Other changes in covered benefits and provider reimbursement requirements will be reflected in thefinal rates.
119 of 197Prepared by Mercer GovernmentHuman Services Consulting
RFP 30-190029-DHBSection IX. Medicaid Managed Care Draft Rate Book (SFY 2020)

12 MANAGED CARE ASSUMPTIONSManaged care adjustments are intended to capture expected future changes in the utilization of certain servicesas a result of care management initiatives by the PHPs. Mercer conducted a managed care opportunity analysisas part of the rate development process. The following components were analyzed as part of the managed careopportunity assessment and were specifically evaluated in the development of the Standard Plan capitation ratedevelopment:
· Comparison of North Carolina FFS statistics to other state managed care experience· Research regarding other state program initial managed care expectations and experience operating
under managed care· Pharmacy considerations under managed care· Low Acuity Non-Emergent (LANE) analysis related to avoidable visits to the Emergency Room in NC
Medicaid data· Potentially Preventable Admissions (PPA) analysis in NC Medicaid data for Inpatient Hospital visits· Analysis of Inpatient Hospital readmissions
More detail on each analysis is included in the remainder of this section.
Overall Managed Care Findings12.1Mercer applied managed care assumptions in the Contract year 1 capitation rate development for the StandardPlan population. These assumptions were developed based on a review of current program experience coupledwith other data sources which includes specific data analyses such as clinical efficiency analyses, pharmacyclinical edits analysis and potential PHP rebate analysis. Assumed reductions in provider services spend areoffset by non-benefit expenses incorporated into PHP capitation rates as outlined in Section 13.
Mercer assumes it will take approximately three years for each population under managed care to realize thefull extent of expected savings. Furthermore, Mercer assumes approximately 75.0% of managed care savings tobe realized in year 1 given a period of continuity of care and an implementation period for plans to realizeresults from their care management strategies and utilization management procedures. Mercer also expects thepharmacy clinical edits savings adjustment to ramp up to account for a potential continuity of care period wherepatients continue with the same prescribed drugs as when they were under FFS for a period of time. In theinstance the year 1 rating period is not twelve months, Mercer will reevaluate the appropriateness of the 75.0%assumption.
The table below illustrates the overall impact of the year 1 managed care assumptions by rate cell. Overall,these amount to approximately a -8.4% impact to the cost of Standard Plan medical benefits. Regional variationsare driven by varying assumptions for the Outpatient Hospital COS since observed utilization varied greatly byregion; all other assumptions by COS were applied consistently by region.
Table 21: Year 1 Standard Plan Savings Factors to Medical CostsCOA Region 1 Region 2 Region 3 Region 4 Region 5 Region 6
ABD -11.8% -11.3% -10.3% -10.2% -10.4% -9.4%
TANF, Newborn (<1) -12.9% -12.5% -12.6% -12.2% -12.5% -11.6%
TANF, Children (1-20) -7.2% -5.9% -5.8% -5.9% -5.9% -5.2%
TANF, Adults (21+) -10.9% -8.3% -8.4% -8.4% -8.1% -7.4%
Maternity Event -2.6% -2.6% -2.2% -2.7% -2.4% -2.0%
120 of 197Prepared by Mercer GovernmentHuman Services Consulting
RFP 30-190029-DHBSection IX. Medicaid Managed Care Draft Rate Book (SFY 2020)

Assumptions above are based on a review of current programmatic experience. The appropriateness of thesefactors will be re-evaluated as the base experience is updated upon calculation of final capitation rates forContract Year 1.
Non-Pharmacy Benefits12.2This section gives an overview of the available information utilized in development of the managed care factorsfor non-pharmacy benefits. Section 12.3 overviews the specific analyses used to develop pharmacy-specificopportunity assumptions.
Mercer reviewed a number of data sources in order to arrive at reasonable managed care expectations for theStandard Plan population. These reviews largely focused on a comparison to other state Medicaid managed careexperience along with results of managed care efficiency analyses run on the current program experience.Additionally, a review of other state Medicaid managed care assumptions helped inform expectations for othermedical services not compared in Section 12.2.1.
In general, PHPs are expected to impact the current levels of medical cost and utilization through caremanagement. The overall managed care savings may be achieved through a reduction to utilization of high-costand high-intensity services as a result of activities such as, but not limited to:
1. Encouraging the use of preventive services so that acute conditions are not exacerbated to the pointthat requires a visit to the Emergency Room or hospitalization.
2. Reducing non-emergent use of the Emergency room through member education and viable alternatives(e.g., extended hours for doctor’s offices, after-hours urgent care clinics, or even nurse advice lines).
3. Hospital discharge planning to ensure a smooth transition from facility-based care to communityresources, and minimize readmissions.
Mercer also reviewed the historical utilization of physician services in the FFS program. It is important to notethat the Physician service line for rate setting purposes was summarized to include both the attending physicianclaims for Outpatient Hospital visits as well as primary care and specialist physician office visits. Mercerconsidered each component of physician utilization to arrive at the overall managed care assumption by ratecell. For the portion of the utilization associated with the attending physician for Outpatient Hospital claims,Mercer assumed the same level of utilization savings as was assumed for the Outpatient Hospital facility claims.For office visits, Mercer evaluated the impact on utilization for both primary care and specialty Physician visits.Mercer assumed decreases on Physician specialty visits, assuming PHPs would increase provider networkmanagement to better manage services provided by specialists and specialty facilities. For primary care officevisits, Mercer assumed increased utilization as a result of PHP preventative care efforts coupled withbeneficiaries being diverted from more high-cost and high-intensity services.
Note that Maternity Event managed care expectations were developed based on the TANF Adult (21+) rate cellobservations given the majority of beneficiaries receiving maternity care also fall in the TANF Adult (21+) ratecell. However, the factors were tailored to target non-Physician services outside of the month of delivery.Moreover, the factor noted in the table above reflects a prorated factor adjusted for the portion of theMaternity Event payment attributable to costs outside of the month of delivery. The expectation is that throughcare management, the PHPs should be able to reduce hospital and Emergency Room utilization during theprenatal and postpartum periods of the maternity episode.
12.2.1 Other State Medicaid ExperienceMercer collected information from ten state Medicaid programs to serve as a comparison to North Carolina dataand provide context regarding potential savings under managed care. Based on Mercer’s review of the NorthCarolina experience compared to other state Medicaid programs, Mercer observes TANF and Other RelatedChildren and Adult PMPM costs for North Carolina are generally in the range of other state Medicaid programs.
121 of 197Prepared by Mercer GovernmentHuman Services Consulting
RFP 30-190029-DHBSection IX. Medicaid Managed Care Draft Rate Book (SFY 2020)

However, the utilization per 1,000 members statistics for some services (e.g., Inpatient Hospital — PH) are onthe higher end of the range for other state Medicaid programs. For the ABD population, costs and utilization areabove other state Medicaid program experience; even without prescription drug considerations, most otherservices fall towards the top of the PMPM and utilization per 1,000 range.
It is important to note that in North Carolina a number of services and populations are already receiving somecoordinated care and management through (1) the CCNC/CA program, which is an enhanced Primary Care CaseManagement model and (2) the BH managed care program run by the LME/MCOs. Since DHHS already operatesunder a “managed” FFS model with CCNC/CA and has BH managed care, DHHS may observe less managed caresavings opportunities due to the implementation of capitated managed care as compared to other states, giventhat the effect of some care management is already being realized.
12.2.2 Efficiency AnalysisMercer completed efficiency analyses that further evaluated potential savings to support the general managedcare assumptions related to Inpatient Hospital and Emergency Room services. The analyses detailed belowinclude analysis of inpatient claims for PPA and Inpatient Hospital readmission analysis along with LANE analysisrelated to avoidable visits to the Emergency Room.
PPA AnalysisMercer performed a PPA analysis to identify opportunities for managed care impact on inpatient admissionsthat could be achieved through PHP management of PPAs. Mercer’s PPA analysis identifies inpatient admissionsthat could have been avoided through high quality outpatient care and/or reflects conditions that could be lesssevere and not warrant an inpatient level of care if treated early and appropriately. The PPA analysis can helpidentify potential reductions of health care inefficiencies in the inpatient hospital setting and support DHHS’desire for a more value focused purchasing strategy.
In total, Mercer found that around 3.0% for TANF and 10.0% for ABD of Inpatient Hospital spend is related toPediatric Quality Indicators/Prevention Quality Indicators (PDI/PQI) flagged conditions. After a series ofexclusions for high-risk beneficiaries and enrollment duration considerations around the time to reasonablymanage care, the refined proportion of PPA dollars drops to approximately 2.0% for TANF and 7.0% for ABD as apercentage of Inpatient Hospital spend. Note that results of the full PPA efficiency adjustment analysis fromother state Medicaid programs generally impact Inpatient by 2.0% to 7.0%; state variations are generally a resultof different underlying populations.
Inpatient Readmission AnalysisLike PPA admissions, hospital readmissions represent health care expenditures that could possibly be avoidedthrough high-quality outpatient care and post-discharge transition planning. Mercer’s readmission analysisfocused on hospital admissions within 30 days of a previous discharge for the same recipient at any facility andfor any diagnosis-related group. A readmission within 30 days can be a result of a breakdown in dischargeplanning or outpatient care subsequent to the original admission.
The observed experience based on the raw Inpatient readmission analysis is approximately 5.5% readmissionrate for TANF and above 20.0% readmission rate for ABD beneficiaries. Note that results of other state Inpatientreadmission analyses equate to approximately a 7.0% to 10.0% inpatient readmission rate.
LANE AnalysisMercer performed a LANE analysis as part of the managed care opportunities analysis to support the managedcare assumptions related to Emergency Room utilization. The LANE analysis identifies instances when Medicaideligibles may not have needed to make a trip to the Emergency Room if they had received effective outreach,care coordination and/or access to preventative care. The management of the identified LANE visits is an
122 of 197Prepared by Mercer GovernmentHuman Services Consulting
RFP 30-190029-DHBSection IX. Medicaid Managed Care Draft Rate Book (SFY 2020)
effective cost-containment strategy that can help reduce health care inefficiencies in the Emergency Roomsetting; and therefore, supports DHHS’ desire for a more value-focused purchasing strategy.
The overall results illustrate that on average LANE dollars represented approximately 50.0% of total EmergencyRoom costs. When looking specifically at less intensive LANE visits (as defined by attending physician code of99281-99283), Mercer observes that these constitute approximately 9.0% for TANF and 4.0% for ABD of totalEmergency Room, variable by population. Results of the full LANE efficiency adjustment analysis from otherstate Medicaid programs generally range from 5.0% to 10.0%; state variations are generally a result of differentunderlying populations and different state methodology assumptions.
12.2.3 Other Medical ServicesMercer reviewed other state Medicaid experience to also understand the level of potential savings on otherCOS. In general, Mercer noted that other states applied savings adjustments and/or realized savings on DurableMedical Equipment. Mercer assumed all Standard Plan rate cells (other than the Maternity Event payment)would generate savings.
Savings on State Plan LTSS services including personal care is expected to take time to materialize throughlonger term management of patient conditions, thus a minimal savings assumption was put forth for thesecommunity LTSS services. Also, since the majority of spend for LTSS services is for the ABD population, Merceronly applied a savings factor to the ABD rate cell.
Pharmacy Benefits12.3Reimbursement and utilization management strategies play an important role in controlling pharmacy costs.Effective management of federal and supplemental rebates also contributes to decreasing the overall net drugcosts to the Medicaid program. Along with other medical services, DHHS will move the management of thepharmacy benefit under the control of the PHPs.
Mercer performed a retrospective analysis of pharmacy claims data to identify inappropriate prescribing and/ordispensing patterns, using a customized series of clinical rules-based, pharmacy utilization management edits.These edits are developed by Mercer’s managed pharmacy practice based on various states’ pharmacy policies,published literature, industry standard practices, clinical appropriateness review, professional expertise andinformation gathered during the review of several Medicaid MCO pharmacy programs across the country. Thisanalysis resulted in an estimated total savings opportunity of approximately -2.4%.
Additionally, under FFS, DHHS has developed a strong pharmacy benefit program, which includes a PreferredDrug List (PDL) that generates significant pharmacy rebates to DHHS on the prescription drugs administered toMedicaid beneficiaries. As a part of Medicaid Transformation efforts, the State is requiring that PHPs adhere tothe State PDL. By requiring PHPs to follow the PDL, DHHS should expect to receive similar rebates on the drugsadministered to PHP beneficiaries. Additionally, DHHS is mandating in the contract that the PHPs shall notnegotiate rebates for drugs on the State PDL. As such, Mercer does not anticipate the PHPs will be able tonegotiate further material rebates with the manufacturers under managed care, and no additional adjustmentwas assumed related to PHP rebate opportunities.
123 of 197Prepared by Mercer GovernmentHuman Services Consulting
RFP 30-190029-DHBSection IX. Medicaid Managed Care Draft Rate Book (SFY 2020)
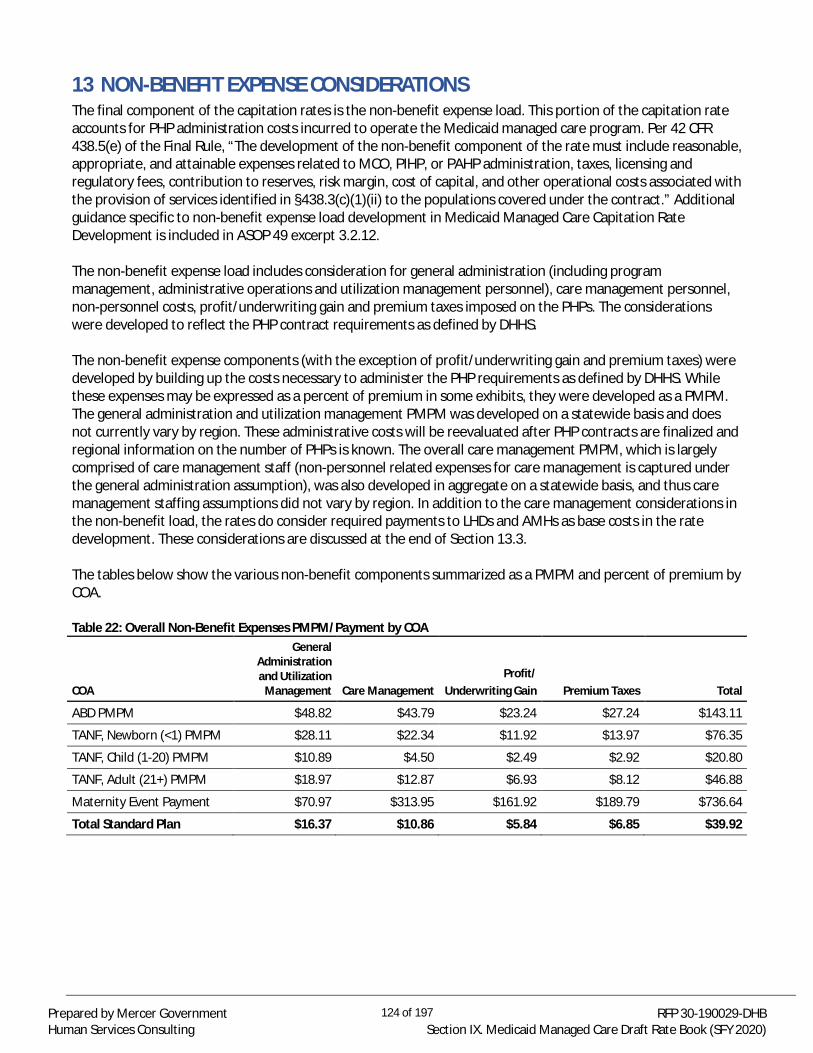
13 NON-BENEFIT EXPENSE CONSIDERATIONSThe final component of the capitation rates is the non-benefit expense load. This portion of the capitation rateaccounts for PHP administration costs incurred to operate the Medicaid managed care program. Per 42 CFR438.5(e) of the Final Rule, “The development of the non-benefit component of the rate must include reasonable,appropriate, and attainable expenses related to MCO, PIHP, or PAHP administration, taxes, licensing andregulatory fees, contribution to reserves, risk margin, cost of capital, and other operational costs associated withthe provision of services identified in §438.3(c)(1)(ii) to the populations covered under the contract.” Additionalguidance specific to non-benefit expense load development in Medicaid Managed Care Capitation RateDevelopment is included in ASOP 49 excerpt 3.2.12.
The non-benefit expense load includes consideration for general administration (including programmanagement, administrative operations and utilization management personnel), care management personnel,non-personnel costs, profit/underwriting gain and premium taxes imposed on the PHPs. The considerationswere developed to reflect the PHP contract requirements as defined by DHHS.
The non-benefit expense components (with the exception of profit/underwriting gain and premium taxes) weredeveloped by building up the costs necessary to administer the PHP requirements as defined by DHHS. Whilethese expenses may be expressed as a percent of premium in some exhibits, they were developed as a PMPM.The general administration and utilization management PMPM was developed on a statewide basis and doesnot currently vary by region. These administrative costs will be reevaluated after PHP contracts are finalized andregional information on the number of PHPs is known. The overall care management PMPM, which is largelycomprised of care management staff (non-personnel related expenses for care management is captured underthe general administration assumption), was also developed in aggregate on a statewide basis, and thus caremanagement staffing assumptions did not vary by region. In addition to the care management considerations inthe non-benefit load, the rates do consider required payments to LHDs and AMHs as base costs in the ratedevelopment. These considerations are discussed at the end of Section 13.3.
The tables below show the various non-benefit components summarized as a PMPM and percent of premium byCOA.
Table 22: Overall Non-Benefit Expenses PMPM/Payment by COA
COA
GeneralAdministrationand Utilization
Management Care ManagementProfit/
Underwriting Gain Premium Taxes Total
ABD PMPM $48.82 $43.79 $23.24 $27.24 $143.11
TANF, Newborn (<1) PMPM $28.11 $22.34 $11.92 $13.97 $76.35
TANF, Child (1-20) PMPM $10.89 $4.50 $2.49 $2.92 $20.80
TANF, Adult (21+) PMPM $18.97 $12.87 $6.93 $8.12 $46.88
Maternity Event Payment $70.97 $313.95 $161.92 $189.79 $736.64
Total Standard Plan $16.37 $10.86 $5.84 $6.85 $39.92
124 of 197Prepared by Mercer GovernmentHuman Services Consulting
RFP 30-190029-DHBSection IX. Medicaid Managed Care Draft Rate Book (SFY 2020)

Table 23: Overall Non-Benefit Expenses as a Percent of Premium by COA
COA
GeneralAdministrationand Utilization
Management Care ManagementProfit/
Underwriting Gain Premium Taxes Total
ABD 3.7% 3.3% 1.75% 2.01% 10.6%
TANF, Newborn (<1) 4.1% 3.3% 1.75% 2.01% 11.0%
TANF, Child (1-20) 7.6% 3.2% 1.75% 2.01% 14.3%
TANF, Adult (21+) 4.8% 3.3% 1.75% 2.01% 11.6%
Maternity Event 0.8% 3.4% 1.75% 2.01% 7.8%
Total Standard Plan 4.9% 3.3% 1.75% 2.01% 11.7%Note: The PMPM figures in the table above were translated to a percent of total premium. In comparing these percentagesto other states or industry benchmarks, please note that the total premium includes consideration for historicalsupplemental payments as outlined in Section 11.1.
Methodology and Data Sources13.1Mercer developed an administrative model that calculates the expected cost to operate a Medicaid managedcare program for each rate cell. The model includes personnel costs for program management and generaladministrative operations as well as non-personnel costs necessary to run the program. Mercer prepared anadditional model that established cost expectations for the anticipated personnel required to achieve DHHS’proposed care management requirements. The results of this modeling and its impact to the capitation rates arediscussed in the subsequent sections.
The primary data source for estimating administrative staffing salaries was supplied by the Bureau of LaborStatistics (BLS) website. The Occupational Employment Statistics (OES) program estimates the number of jobs,salary and wage data by surveying employers throughout the country for more than 800 occupations. This datais available on a nationwide basis, by state and between urban and rural areas within each state. The OES surveydata includes several statistical measures of salaries and wages, including the hourly and annual mean, medianand various percentiles. The most recent information available is as of May 2016. The dataset was restricted toexperience for the State of North Carolina. 15
Colliers International publishes quarterly reports summarizing commercial real estate market statistics, includingthe average rent cost per square foot by geography. Quarterly reports are prepared for Charlotte, Raleigh-Durham and surrounding cities. The latest reports available for Raleigh-Durham, Charlotte and surroundingareas were as of the third quarter of 2017. This information supported regional cost expectations forcommercial real estate needed to administer a Medicaid managed care program. 16,17
The model output is dependent upon the assumed allocation of PHPs administering the program and theirallocation across the six proposed PHP regions. Per legislation, DHHS will contract with four statewide PHPs andup to twelve regional contracts with provider-led entities (PLEs)18. Mercer’s model currently assumes fourstatewide PHPs and four regional PLEs. The model allocates applicable staffing positions across regions toaccount for the anticipated split of responsibilities across regions for PHPs that participate in more than one
15 https://www.bls.gov/oes/special.requests/oesm16st.zip16 http://www.colliers.com/-/media/files/united states/markets/north carolina/charlotte/office market reports/q3 2017market report - office.pdf17 http://www.colliers.com/-/media/files/marketresearch/unitedstates/markets/raleigh/2017 reports/2017-q3-office-raleighdurham-report-colliers.pdf18 https://webservices.ncleg.net/ViewBillDocument/2017/7169/0/H403-PCCS10514-TR-21
125 of 197Prepared by Mercer GovernmentHuman Services Consulting
RFP 30-190029-DHBSection IX. Medicaid Managed Care Draft Rate Book (SFY 2020)
region. Upon contract award, this assumption will be updated to reflect the actual number of PHPs and PLEsoperating within/across regions.
Program Management and Administrative Operations Personnel13.2The general administration and utilization management model addresses the expected staffing needs to operateand administer a Medicaid program. The capitation rates assume each PHP will have program management staffthat is further delineated by executive management, financial, clinical operations, legal (general counsel),human resources and information technology. Executive management includes the Chief Executive and ChiefOperating Officers. Financial staff includes the Chief Financial Officer, accountants, financial analysts andactuarial staff. Clinical operations include a Chief Medical Officer, Pharmacy Director and BH Coordinator.Information technology staff includes the Chief Information Officer, reporting and monitoring as well as ITspecialists and support.
The capitation rates also include consideration for general administrative operations staff, delineated bycustomer service, compliance, network, claims processing and utilization management. Operations staff reflectscustomer service representatives, Compliance Officer, program integrity team, provider specialists and claimsprocessing.
Assumptions for the number of Full-Time Equivalents (FTEs) vary by staffing position across each of the PHPregions. Salaries for each personnel component were developed based on the median salary levels in the BLSdata for each staff type in the State of North Carolina. In addition to the BLS salary data, Mercer included anassumption for fringe benefits and payroll taxes.
Care Management Personnel13.3Care management is foundational to the success of North Carolina’s health care system for Medicaid and NCHealth Choice beneficiaries, supporting high-quality delivery of the right care at the right place and at the righttime in the right setting. DHHS’ care management strategy will focus on improving the health of beneficiariesthrough an innovative, person-centered and well-coordinated system of care that addresses medical andnonmedical drivers of health. Beneficiaries will have access to appropriate care management and coordinationsupport across multiple settings of care, including a strong basis in primary care and connections to specialtycare and contributions to health-related resources. Access to local care management will draw from theAdvanced Medical Home (AMH) model and participation from the LHDs; additionally DHHS is committed toproviding care management for beneficiaries to address the four priority domains of opportunities for health:housing, food, transportation, and interpersonal safety. Mercer has aligned the care management modeling, asoutlined below, with the DHHS care management strategy. Please see the North Carolina’s Care ManagementStrategy under Managed Care policy paper, released on March 9, 2018, for more insight into DHHS’ caremanagement strategy19.
The general care management model addresses both beneficiary care management and care coordination as apart of the approach to ensure efficient, coordinated and quality care. Care coordination is moreadministratively focused and as such, it is available to all beneficiaries and is often administered by a non-licensed individual. Care management is a team-based, person-centered approach to effectively managepatients’ medical, social and behavioral conditions.
The base care management modeling assumes that 100.0% of beneficiaries will have access to care coordinationwhereas care management will be focused on low to high-needs beneficiaries which are assumed to comprisearound 22.0% of the Standard Plan population, which represents an increased investment in care management
19 North Carolina’s Care Management Strategy under Managed Care. March 9, 2018.https://files.nc.gov/ncdhhs/documents/CareMgmt-AMH_ConceptPaper_FINAL_20180309.pdf
126 of 197Prepared by Mercer GovernmentHuman Services Consulting
RFP 30-190029-DHBSection IX. Medicaid Managed Care Draft Rate Book (SFY 2020)
from the current system. Additionally, the base care management modeling includes consideration for caremanagement FTEs based on a beneficiary to staff ratio. As mentioned, care coordinators are expected toperform tasks such as conducting care needs screening and providing linkage to community resources, which aremore administratively focused. Given this, a higher member to staff ratio assumption is used for the carecoordinator position. Whereas care managers are anticipated to perform more intensive beneficiary caremanagement activities, and thus Mercer assumed a lower caseload compared to care coordinators. Mercer alsoassumed varied care manager caseloads depending on a range of low to high-needs priority populationbeneficiaries. BLS data was then leveraged to estimate the cost per FTE based on anticipated position jobrequirements. FTE assumptions were calculated based on the Standard Plan population average monthlymembership (1.6 million).
Given DHHS’ care management strategy and specific requirements outlined in the RFP, Mercer also includedconsideration in the care management assumption for LHD payment requirements, AMH contracting andpayment requirements and additional costs for requirements related to opportunities for health initiatives.
Under managed care, DHHS is initially requiring PHPs to continue the historical payments to LHDs in thecapitation rates to ensure payment levels not be disrupted under the transition to managed care. Historicalpayments made to LHDs for the OBCM and CC4C program are included as a service line item in the base datadevelopment. In addition to the base service costs, Mercer included consideration in the care managementassumption for a small offset to PHP care management costs given LHD responsibilities along with additionalPHP costs for oversight responsibilities.
DHHS has also made program design decisions to incorporate an AMH model under managed care to ease someof the transition from the historical Medical Home model. AMH practices will be designated into Tier 1, 2 or 3practice categories. DHHS is mandating that PHPs contract with a certain number of AMH practices and alsoreimburse AMHs similar to the historical payments made to practices in the CA program which are included as aservice line item in the base data development (Medical Home Payments). AMH Tier 3 practices will alsoperform beneficiary care management activities, and thus be reimbursed at an enhanced rate to account forthese additional activities. Mercer worked with DHHS to estimate the anticipated number of AMH Tier 3practices, assuming that approximately 65.0% of beneficiaries are tied to an AMH Tier 3 practice. Based on thisassumption, Mercer assumed some level of additional costs to the PHPs to ensure backstop accountability forPHP members tied to an AMH Tier 3 practice and PHP oversight responsibilities and coordination with AMH Tier3 practices. Note that the assumption around the percent of beneficiaries tied to an AMH Tier 3 practice will berevisited for final rates.
There are also a number of contract and staffing requirements related to the DHHS opportunities for healthinitiative considered in development of assumed care management costs, such as:
· Basic opportunities for health PHP screening requirements for all members· Beneficiaries with high unmet social needs, regardless of medical conditions, flagged as priority
population for comprehensive evaluation and potentially care management· Specific PHP staffing requirements, such as a housing specialist
As discussed, the base data already accounts for some level of requirements associated with care managementactivities (OBCM LHD, CC4C LHD, Medical Home Payments). In addition to the costs captured in the baseexperience ($1.89 PMPM for LHD payments and $2.35 PMPM for AMH base payments), Mercer included anadditional $10.86 PMPM based on the considerations and methodology outlined in Section 13.3 above, totaling$15.10 PMPM associated with medical home and care management requirements/activities.
127 of 197Prepared by Mercer GovernmentHuman Services Consulting
RFP 30-190029-DHBSection IX. Medicaid Managed Care Draft Rate Book (SFY 2020)
Non-Personnel Costs13.4The capitation rates include consideration for the non-personnel costs associated with program management,administrative operations and care management. Non-personnel costs primarily consist of annual rent andutilities as well as the necessary equipment and supplies required to operate a business, including computersand cell phones. North Carolina commercial real estate market data from various regions throughout the statewere utilized to develop cost expectations for the average annual rent cost per square foot per region.The capitation rates also capture costs for staff travel time, IT software, systems and licensing.
Finally, the capitation rates reflect the administrative costs for third-party Pharmacy Benefit Managers (PBMs) tocontract with pharmacies, process/pay prescription drug claims and collect rebates for the PHPs. To calculatethe impact, Mercer relied upon experience with other states due to the limited availability of data specific toNorth Carolina. The PBM administrative cost for other states equates to 2.0% of the projected prescription drugclaim costs. For the Standard Plan, 2.0% of the base prescription drug experience levels equate to $28 million inadministrative PBM costs or roughly $1.50 PMPM.
Non-Benefit Expense Load Application to Capitation Rates13.5Each component within program management and administrative operations personnel, care managementpersonnel and non-personnel modeling is classified as either a fixed or variable cost. This approach recognizesthat certain administrative costs will be incurred regardless of population size or magnitude of medical claims(fixed costs) while others are a function of the size of the population served or services provided to members(variable costs). The capitation rates aggregated across all rate cells illustrate a split of approximately 25.0%fixed and 75.0% variable costs for each region.
The fixed PMPM is applied uniformly to all rate cells within each region (other than the Maternity Eventpayment), such that each rate cell receives the same fixed PMPM. The Maternity Event payment does notinclude the fixed portion of the administrative expense PMPM as each pregnant woman’s rate cell capitationpayment (concurrent with the Maternity Event payment) for non-delivery related services will include fixedadministrative costs. The remaining portion of the administrative PMPM pertains to variable costs. The totalregional PMPM was converted to a rate cell specific PMPM based on distribution of claim costs; the resultingvariable PMPM varies by rate cell. The statewide Standard Plan non-benefit expense PMPM prior to theapplication of profit/underwriting gain and premium taxes is $27.23.
Profit/Underwriting Gain and Premium Taxes13.6Per ASOP 49, underwriting gain (or profit) provides compensation for the risk assumed by the MCO.Underwriting gain includes consideration for cost of capital and margin for risk contingency. Risks includeinsurance, investment, inflation and regulatory risks as well as risk associated with social, economic and legalenvironments. An overall profit/underwriting gain assumption of 1.75% has been included, comprised of 1.25%for cost of capital and 0.5% for margin for risk.
Mercer has included a 2.01% consideration for PHP premium taxes in the capitation rate development, perDHHS and House Bill 15620, which indicates legislative intent to apply the commercial insurance premium taxand regulatory surcharge applied to PHPs.
Health Insurer Provider Fee (HIPF)13.7The HIPF is a federal fee that applies to certain health insurers. In the context of rate-setting, the HIPF isconsidered a cost of doing business that is appropriate to recognize in the payments to PHPs. Currently, there isa moratorium on the HIPF for premiums earned in 2018 and uncertainty with respect to the applicability of the
20 https://webservices.ncleg.net/ViewBillDocument/2017/7124/0/H156-PCCS40774-TR-22
128 of 197Prepared by Mercer GovernmentHuman Services Consulting
RFP 30-190029-DHBSection IX. Medicaid Managed Care Draft Rate Book (SFY 2020)

HIPF in the future. As such, no adjustment has been included in the draft capitation rates for the HIPF. DHHS willreimburse PHPs for these fees and will determine the appropriate approach as more information becomesavailable on the applicability of the fee.
129 of 197Prepared by Mercer GovernmentHuman Services Consulting
RFP 30-190029-DHBSection IX. Medicaid Managed Care Draft Rate Book (SFY 2020)
14 CAPITATION RATE DEVELOPMENT EXHIBITSThe first exhibit in this section provides an overview of the MMs and draft capitation rates by COA and region.This exhibit is followed by detailed summaries illustrating the full rate development process for each regionalrate cell, from the adjusted base data (including all adjustments outlined in Section 6) to the prospectiveadjustments outlined in Sections 8 through 12. Additionally, the non-medical expense considerations areoutlined in each summary in accordance with the methodology in Section 13 of this Rate Book.
130 of 197Prepared by Mercer GovernmentHuman Services Consulting
RFP 30-190029-DHBSection IX. Medicaid Managed Care Draft Rate Book (SFY 2020)

Exhibit 73
Member Months/Deliveries by Region and Category of Aid
Rating Group Region 1 Region 2 Region 3 Region 4 Region 5 Region 6 Statewide
Aged, Blind, Disabled 146,847 263,136 328,525 278,511 309,639 267,136 1,593,794
TANF and Other Related Children (<1) 78,257 144,528 211,433 171,144 135,338 108,992 849,691
TANF and Other Related Children (1-20) 1,220,080 2,297,179 3,243,949 2,661,605 2,183,299 1,733,723 13,339,835
TANF and Other Related Adults (21+) 270,425 468,569 711,903 509,487 540,587 407,775 2,908,746
Maternity Event 5,230 9,264 13,078 9,785 8,871 7,245 53,473
Total 1,715,609 3,173,411 4,495,811 3,620,746 3,168,863 2,517,626 18,692,065
Capitation Rates by Region and Category of Aid
Rating Group Region 1 Region 2 Region 3 Region 4 Region 5 Region 6 Statewide
Aged, Blind, Disabled 1,373.30$ 1,356.05$ 1,529.02$ 1,415.53$ 1,278.26$ 1,158.50$ 1,355.46$
TANF and Other Related Children (<1) 749.33$ 707.22$ 736.81$ 660.06$ 736.49$ 563.56$ 695.20$
TANF and Other Related Children (1-20) 166.46$ 148.78$ 141.55$ 141.70$ 147.03$ 136.70$ 145.37$
TANF and Other Related Adults (21+) 413.55$ 437.60$ 394.18$ 385.86$ 422.14$ 373.97$ 403.88$
Maternity Event 9,555.60$ 9,760.42$ 9,431.17$ 8,857.91$ 10,192.86$ 8,844.00$ 9,442.29$
Total 364.43$ 345.46$ 338.37$ 322.48$ 358.20$ 327.48$ 340.78$
131 of 197Prepared by Mercer GovernmentHuman Services Consulting
RFP 30-190029-DHBSection IX. Medicaid Managed Care Draft Rate Book (SFY 2020)

Region 1 Capitation Rate Development Exhibits14.1
132 of 197Prepared by Mercer GovernmentHuman Services Consulting
RFP 30-190029-DHBSection IX. Medicaid Managed Care Draft Rate Book (SFY 2020)

Exhibit 74
Region:Category of Aid:Sex:
Member Months/Deliveries: 146,847
Blended Base Data:Contract Period:Trend Months:
(A) (B) (C) (D) (E) (F) (G) (H) (I) (J) (K) (L) (M) (N) (O)
PMPM/Payment Unit Cost Util/1000 PMPM/
Payment Unit Cost Util/1000 PMPM/Payment Unit Cost Util/1000 PMPM/
Payment Unit Cost Util/1000 PMPM/Payment Unit Cost Util/1000
Inpatient — PH 129.73$ 1,027.07$ 1,516 0.5% 0.5% 0.0% 168.6% 168.6% 0.0% -15.8% 0.0% -15.8% 297.69$ 2,799.99$ 1,276Inpatient — BH 8.94$ 728.85$ 147 0.5% 0.5% 0.0% 0.0% 0.0% 0.0% -0.8% 0.0% -0.8% 9.00$ 739.83$ 146Outpatient Hospital 123.35$ 444.79$ 3,328 3.0% 0.5% 2.5% 32.7% 32.7% 0.0% -30.8% 0.0% -30.8% 123.72$ 599.09$ 2,478Emergency Room 63.25$ 515.04$ 1,474 1.5% 0.5% 1.0% 22.9% 22.9% 0.0% -19.6% 0.0% -19.6% 65.37$ 642.43$ 1,221Physician 106.11$ 134.43$ 9,472 2.5% 0.5% 2.0% 0.0% 0.0% 0.0% -13.0% 0.0% -13.0% 99.42$ 136.45$ 8,743FQHC/RHC 14.51$ 128.78$ 1,352 2.5% 0.5% 2.0% 0.0% 0.0% 0.0% -8.3% 0.0% -8.3% 14.33$ 130.72$ 1,315Other Clinic 7.76$ 307.37$ 303 2.5% 0.5% 2.0% 0.0% 0.0% 0.0% -8.3% 0.0% -8.3% 7.67$ 312.00$ 295Other Practitioner 1.22$ 78.12$ 187 2.5% 0.5% 2.0% 0.0% 0.0% 0.0% -8.3% 0.0% -8.3% 1.20$ 79.29$ 182Therapies 3.11$ 110.14$ 339 2.5% 0.5% 2.0% 0.0% 0.0% 0.0% -8.3% 0.0% -8.3% 3.07$ 111.80$ 330Prescribed Drugs 418.40$ 125.12$ 40,129 5.8% 5.3% 0.5% 0.0% 0.0% 0.0% -2.4% 0.0% -2.4% 482.92$ 145.87$ 39,727Other BH Services 14.31$ 56.86$ 3,021 2.0% 1.0% 1.0% 0.0% 0.0% 0.0% -0.8% 0.0% -0.8% 15.06$ 58.58$ 3,086LTSS Services 46.57$ 8.33$ 67,117 3.8% 0.5% 3.2% 12.4% 12.4% 0.0% -4.6% 0.0% -4.6% 55.80$ 9.50$ 70,463Durable Medical Equipment 38.17$ 2.80$ 163,357 1.5% 0.5% 1.0% 0.0% 0.0% 0.0% -15.8% 0.0% -15.8% 33.60$ 2.85$ 141,651Limited Dental Services 0.02$ 24.51$ 10 1.5% 0.5% 1.0% 0.0% 0.0% 0.0% -0.8% 0.0% -0.8% 0.02$ 24.88$ 11Optical 0.90$ 70.12$ 154 1.5% 0.5% 1.0% 0.0% 0.0% 0.0% -0.8% 0.0% -0.8% 0.93$ 71.18$ 157Lab and X-Ray 7.87$ 25.67$ 3,680 1.5% 0.5% 1.0% 0.0% 0.0% 0.0% -0.8% 0.0% -0.8% 8.16$ 26.05$ 3,760Transportation 11.32$ 59.96$ 2,265 0.4% 0.5% -0.1% 0.0% 0.0% 0.0% -0.8% 0.0% -0.8% 11.36$ 60.87$ 2,239Subtotal (Medical) 995.55$ N/A 297,851 3.6% 2.5% 1.1% 26.0% 26.0% 0.0% -11.9% 0.0% -11.9% 1,229.33$ N/A 277,080
CC4C LHD Payments 0.00$ 4.53$ 8 0.0% 0.0% 0.0% 0.0% 0.0% 0.0% 0.0% 0.0% 0.0% -$ 4.53$ 8OBCM LHD Payments 0.71$ 4.93$ 1,721 0.0% 0.0% 0.0% 0.0% 0.0% 0.0% 0.0% 0.0% 0.0% 0.71$ 4.93$ 1,721Medical Home Payments 4.14$ 4.66$ 10,668 0.0% 0.0% 0.0% 0.0% 0.0% 0.0% 0.0% 0.0% 0.0% 4.14$ 4.66$ 10,668Subtotal (LHD/Medical Home Payments) 4.85$ N/A 12,397 0.0% 0.0% 0.0% 0.0% 0.0% 0.0% 0.0% 0.0% 0.0% 4.85$ N/A 12,397Total (Medical + LHD/Medical Home) 1,000.40$ N/A 310,249 3.6% 2.5% 1.1% 25.9% 25.9% 0.0% -11.8% 0.0% -11.8% 1,234.18$ N/A 289,477
Note: Total Medical Calculation: M = A * [(1 + D) ^ (36/12)] * (1 + G) * (1 + J) Gross Medical PMPM/Payment:
Non-Benefit Expense PMPM/Payment:General Administration (3.46%)Care Management (3.08%)Profit/Underwriting Gain (1.75%)
Total Service Cost and Non-Benefit Load PMPM/Payment:Premium Taxes (2.01%)
Total Capitation Rate: 1,373.30$
1,234.18$
46.55$41.42$23.55$
1,345.70$27.60$
Category of ServiceBase Data Trend Program Changes Managed Care Adjustment Total Medical
Region 1Aged, Blind, Disabled
Male & Female
July 1, 2015 - June 30, 2017July 1, 2019 - June 30, 2020
36
133 of 197Prepared by Mercer GovernmentHuman Services Consulting
RFP 30-190029-DHBSection IX. Medicaid Managed Care Draft Rate Book (SFY 2020)

Exhibit 75
Region:Category of Aid:Sex:
Member Months/Deliveries: 78,257
Blended Base Data:Contract Period:Trend Months:
(A) (B) (C) (D) (E) (F) (G) (H) (I) (J) (K) (L) (M) (N) (O)
PMPM/Payment Unit Cost Util/1000 PMPM/
Payment Unit Cost Util/1000 PMPM/Payment Unit Cost Util/1000 PMPM/
Payment Unit Cost Util/1000 PMPM/Payment Unit Cost Util/1000
Inpatient — PH 197.39$ 642.74$ 3,685 1.5% 0.5% 1.0% 165.8% 165.8% 0.0% -15.0% 0.0% -15.0% 466.31$ 1,734.07$ 3,227Inpatient — BH -$ -$ - 1.5% 0.5% 1.0% 0.0% 0.0% 0.0% 0.0% 0.0% 0.0% -$ -$ -Outpatient Hospital 21.43$ 152.81$ 1,683 3.0% 0.5% 2.5% 19.4% 19.4% 0.0% -15.0% 0.0% -15.0% 23.77$ 185.19$ 1,540Emergency Room 16.86$ 238.04$ 850 1.5% 0.5% 1.0% 19.1% 19.1% 0.0% -7.5% 0.0% -7.5% 19.43$ 287.82$ 810Physician 83.51$ 90.76$ 11,041 2.5% 0.5% 2.0% 0.0% 0.0% 0.0% -7.6% 0.0% -7.6% 83.06$ 92.13$ 10,819FQHC/RHC 9.89$ 130.32$ 910 2.5% 0.5% 2.0% 0.0% 0.0% 0.0% -7.5% 0.0% -7.5% 9.85$ 132.28$ 893Other Clinic 32.26$ 90.19$ 4,293 2.5% 0.5% 2.0% 0.0% 0.0% 0.0% -7.5% 0.0% -7.5% 32.14$ 91.55$ 4,212Other Practitioner 0.04$ 36.40$ 12 2.5% 0.5% 2.0% 0.0% 0.0% 0.0% -7.5% 0.0% -7.5% 0.04$ 36.95$ 12Therapies 1.04$ 92.32$ 136 2.5% 0.5% 2.0% 0.0% 0.0% 0.0% -7.5% 0.0% -7.5% 1.04$ 93.72$ 133Prescribed Drugs 14.08$ 46.72$ 3,617 -2.8% -2.8% 0.0% 0.0% 0.0% 0.0% -1.7% 0.0% -1.7% 12.73$ 42.97$ 3,554Other BH Services 0.06$ 19.52$ 38 2.0% 1.0% 1.0% 0.0% 0.0% 0.0% 0.0% 0.0% 0.0% 0.07$ 20.12$ 40LTSS Services 2.10$ 66.94$ 376 3.8% 0.5% 3.2% 0.0% 0.0% 0.0% 0.0% 0.0% 0.0% 2.34$ 67.95$ 414Durable Medical Equipment 10.32$ 4.47$ 27,705 1.5% 0.5% 1.0% 0.0% 0.0% 0.0% -7.5% 0.0% -7.5% 9.98$ 4.54$ 26,400Limited Dental Services 1.60$ 24.85$ 771 1.5% 0.5% 1.0% 0.0% 0.0% 0.0% 0.0% 0.0% 0.0% 1.67$ 25.22$ 794Optical 0.02$ 77.55$ 4 1.5% 0.5% 1.0% 0.0% 0.0% 0.0% 0.0% 0.0% 0.0% 0.03$ 78.72$ 4Lab and X-Ray 0.55$ 20.85$ 318 1.5% 0.5% 1.0% 0.0% 0.0% 0.0% 0.0% 0.0% 0.0% 0.58$ 21.17$ 328Transportation 1.37$ 84.50$ 194 0.4% 0.5% -0.1% 0.0% 0.0% 0.0% 0.0% 0.0% 0.0% 1.38$ 85.77$ 194Subtotal (Medical) 392.52$ N/A 55,633 1.8% 0.4% 1.4% 84.6% 84.6% 0.0% -13.0% 0.0% -13.0% 664.39$ N/A 53,373
CC4C LHD Payments 4.20$ 4.55$ 11,071 0.0% 0.0% 0.0% 0.0% 0.0% 0.0% 0.0% 0.0% 0.0% 4.20$ 4.55$ 11,071OBCM LHD Payments 0.00$ 4.96$ 0 0.0% 0.0% 0.0% 0.0% 0.0% 0.0% 0.0% 0.0% 0.0% -$ 4.96$ -Medical Home Payments 2.04$ 2.46$ 9,964 0.0% 0.0% 0.0% 0.0% 0.0% 0.0% 0.0% 0.0% 0.0% 2.04$ 2.46$ 9,964Subtotal (LHD/Medical Home Payments) 6.24$ N/A 21,035 0.0% 0.0% 0.0% 0.0% 0.0% 0.0% 0.0% 0.0% 0.0% 6.24$ N/A 21,035Total (Medical + LHD/Medical Home) 398.76$ N/A 76,668 1.7% 0.4% 1.4% 83.4% 83.4% 0.0% -12.9% 0.0% -12.9% 670.63$ N/A 74,408
Note: Total Medical Calculation: M = A * [(1 + D) ^ (36/12)] * (1 + G) * (1 + J) Gross Medical PMPM/Payment:
Non-Benefit Expense PMPM/Payment:General Administration (3.85%)Care Management (3.06%)Profit/Underwriting Gain (1.75%)
Total Service Cost and Non-Benefit Load PMPM/Payment:Premium Taxes (2.01%)
Total Capitation Rate: 749.33$
670.63$
28.28$22.50$12.85$
734.27$15.06$
Category of ServiceBase Data Trend Program Changes Managed Care Adjustment Total Medical
Region 1TANF and Other Related Children (<1)
Male & Female
July 1, 2015 - June 30, 2017July 1, 2019 - June 30, 2020
36
134 of 197Prepared by Mercer GovernmentHuman Services Consulting
RFP 30-190029-DHBSection IX. Medicaid Managed Care Draft Rate Book (SFY 2020)

Exhibit 76
Region:Category of Aid:Sex:
Member Months/Deliveries: 1,220,080
Blended Base Data:Contract Period:Trend Months:
(A) (B) (C) (D) (E) (F) (G) (H) (I) (J) (K) (L) (M) (N) (O)
PMPM/Payment Unit Cost Util/1000 PMPM/
Payment Unit Cost Util/1000 PMPM/Payment Unit Cost Util/1000 PMPM/
Payment Unit Cost Util/1000 PMPM/Payment Unit Cost Util/1000
Inpatient — PH 4.24$ 1,176.35$ 43 1.5% 0.5% 1.0% 143.8% 143.8% 0.0% -15.3% 0.0% -15.3% 9.16$ 2,911.63$ 38Inpatient — BH 1.12$ 906.90$ 15 1.5% 0.5% 1.0% 0.0% 0.0% 0.0% -0.3% 0.0% -0.3% 1.17$ 920.57$ 15Outpatient Hospital 17.75$ 236.09$ 902 3.0% 0.5% 2.5% 24.2% 24.2% 0.0% -15.3% 0.0% -15.3% 20.40$ 297.57$ 823Emergency Room 12.34$ 301.77$ 491 1.5% 0.5% 1.0% 20.0% 20.0% 0.0% -7.8% 0.0% -7.8% 14.27$ 367.44$ 466Physician 22.58$ 72.24$ 3,751 2.5% 0.5% 2.0% 0.0% 0.0% 0.0% -8.5% 0.0% -8.5% 22.25$ 73.33$ 3,641FQHC/RHC 4.51$ 138.57$ 391 2.5% 0.5% 2.0% 0.0% 0.0% 0.0% -7.8% 0.0% -7.8% 4.48$ 140.66$ 382Other Clinic 5.41$ 101.64$ 639 2.5% 0.5% 2.0% 0.0% 0.0% 0.0% -7.8% 0.0% -7.8% 5.37$ 103.17$ 625Other Practitioner 0.18$ 52.86$ 41 2.5% 0.5% 2.0% 0.0% 0.0% 0.0% -7.8% 0.0% -7.8% 0.18$ 53.66$ 40Therapies 3.74$ 100.47$ 447 2.5% 0.5% 2.0% 0.0% 0.0% 0.0% -7.8% 0.0% -7.8% 3.72$ 101.98$ 437Prescribed Drugs 40.94$ 99.52$ 4,937 5.0% 4.5% 0.5% 0.0% 0.0% 0.0% -2.5% 0.0% -2.5% 46.23$ 113.57$ 4,884Other BH Services 7.38$ 75.98$ 1,166 2.0% 1.0% 1.0% 0.0% 0.0% 0.0% -0.3% 0.0% -0.3% 7.81$ 78.28$ 1,197LTSS Services 0.29$ 11.13$ 312 3.8% 0.5% 3.2% 2.6% 2.6% 0.0% -0.3% 0.0% -0.3% 0.33$ 11.59$ 342Durable Medical Equipment 2.65$ 3.38$ 9,420 1.5% 0.5% 1.0% 0.0% 0.0% 0.0% -7.8% 0.0% -7.8% 2.56$ 3.43$ 8,947Limited Dental Services 0.31$ 24.74$ 151 1.5% 0.5% 1.0% 0.0% 0.0% 0.0% -0.3% 0.0% -0.3% 0.32$ 25.11$ 155Optical 0.96$ 82.55$ 140 1.5% 0.5% 1.0% 0.0% 0.0% 0.0% -0.3% 0.0% -0.3% 1.00$ 83.79$ 143Lab and X-Ray 0.61$ 19.28$ 380 1.5% 0.5% 1.0% 0.0% 0.0% 0.0% -0.3% 0.0% -0.3% 0.64$ 19.57$ 390Transportation 0.52$ 69.87$ 89 0.4% 0.5% -0.1% 0.0% 0.0% 0.0% -0.3% 0.0% -0.3% 0.52$ 70.92$ 88Subtotal (Medical) 125.55$ N/A 23,313 3.2% 1.8% 1.3% 9.9% 9.9% 0.0% -7.4% 0.0% -7.4% 140.40$ N/A 22,615
CC4C LHD Payments 0.98$ 4.52$ 2,612 0.0% 0.0% 0.0% 0.0% 0.0% 0.0% 0.0% 0.0% 0.0% 0.98$ 4.52$ 2,612OBCM LHD Payments 0.55$ 4.92$ 1,343 0.0% 0.0% 0.0% 0.0% 0.0% 0.0% 0.0% 0.0% 0.0% 0.55$ 4.92$ 1,343Medical Home Payments 2.26$ 2.44$ 11,108 0.0% 0.0% 0.0% 0.0% 0.0% 0.0% 0.0% 0.0% 0.0% 2.26$ 2.44$ 11,108Subtotal (LHD/Medical Home Payments) 3.80$ N/A 15,063 0.0% 0.0% 0.0% 0.0% 0.0% 0.0% 0.0% 0.0% 0.0% 3.80$ N/A 15,063Total (Medical + LHD/Medical Home) 129.34$ N/A 38,377 3.1% 1.8% 1.3% 9.6% 9.6% 0.0% -7.2% 0.0% -7.2% 144.20$ N/A 37,678
Note: Total Medical Calculation: M = A * [(1 + D) ^ (36/12)] * (1 + G) * (1 + J) Gross Medical PMPM/Payment:
Non-Benefit Expense PMPM/Payment:General Administration (6.88%)Care Management (2.97%)Profit/Underwriting Gain (1.75%)
Total Service Cost and Non-Benefit Load PMPM/Payment:Premium Taxes (2.01%)
Total Capitation Rate: 166.46$
144.20$
11.22$4.84$2.85$
163.11$3.35$
Category of ServiceBase Data Trend Program Changes Managed Care Adjustment Total Medical
Region 1TANF and Other Related Children (1-20)
Male & Female
July 1, 2015 - June 30, 2017July 1, 2019 - June 30, 2020
36
135 of 197Prepared by Mercer GovernmentHuman Services Consulting
RFP 30-190029-DHBSection IX. Medicaid Managed Care Draft Rate Book (SFY 2020)

Exhibit 77
Region:Category of Aid:Sex:
Member Months/Deliveries: 270,425
Blended Base Data:Contract Period:Trend Months:
(A) (B) (C) (D) (E) (F) (G) (H) (I) (J) (K) (L) (M) (N) (O)
PMPM/Payment Unit Cost Util/1000 PMPM/
Payment Unit Cost Util/1000 PMPM/Payment Unit Cost Util/1000 PMPM/
Payment Unit Cost Util/1000 PMPM/Payment Unit Cost Util/1000
Inpatient — PH 28.85$ 1,218.41$ 284 3.5% 0.5% 3.0% 152.3% 152.3% 0.0% -12.2% 0.0% -12.2% 70.89$ 3,119.96$ 273Inpatient — BH 3.04$ 791.01$ 46 3.5% 0.5% 3.0% 0.0% 0.0% 0.0% -0.9% 0.0% -0.9% 3.34$ 802.93$ 50Outpatient Hospital 52.51$ 315.66$ 1,996 3.0% 0.5% 2.5% 29.2% 29.2% 0.0% -23.4% 0.0% -23.4% 56.78$ 413.99$ 1,646Emergency Room 44.26$ 442.95$ 1,199 1.5% 0.5% 1.0% 22.8% 22.8% 0.0% -12.2% 0.0% -12.2% 49.93$ 552.16$ 1,085Physician 42.41$ 103.83$ 4,901 2.5% 0.5% 2.0% 0.0% 0.0% 0.0% -12.3% 0.0% -12.3% 40.04$ 105.40$ 4,559FQHC/RHC 7.40$ 129.51$ 686 2.5% 0.5% 2.0% 0.0% 0.0% 0.0% -8.4% 0.0% -8.4% 7.30$ 131.46$ 667Other Clinic 8.49$ 270.90$ 376 2.5% 0.5% 2.0% 0.0% 0.0% 0.0% -8.4% 0.0% -8.4% 8.38$ 274.98$ 366Other Practitioner 0.48$ 55.98$ 104 2.5% 0.5% 2.0% 0.0% 0.0% 0.0% -8.4% 0.0% -8.4% 0.48$ 56.82$ 101Therapies 0.02$ 60.18$ 3 2.5% 0.5% 2.0% 0.0% 0.0% 0.0% -8.4% 0.0% -8.4% 0.02$ 61.08$ 3Prescribed Drugs 87.61$ 74.47$ 14,117 5.3% 5.0% 0.2% 0.0% 0.0% 0.0% -2.8% 0.0% -2.8% 99.31$ 86.21$ 13,823Other BH Services 7.37$ 72.98$ 1,212 2.0% 1.0% 1.0% 0.0% 0.0% 0.0% -0.9% 0.0% -0.9% 7.75$ 75.19$ 1,237LTSS Services 1.20$ 16.16$ 893 3.8% 0.5% 3.2% 1.0% 1.0% 0.0% -0.9% 0.0% -0.9% 1.34$ 16.56$ 974Durable Medical Equipment 5.78$ 2.31$ 30,015 1.5% 0.5% 1.0% 0.0% 0.0% 0.0% -8.4% 0.0% -8.4% 5.54$ 2.35$ 28,323Limited Dental Services -$ -$ - 1.5% 0.5% 1.0% 0.0% 0.0% 0.0% -0.9% 0.0% -0.9% -$ -$ -Optical 0.35$ 69.10$ 60 1.5% 0.5% 1.0% 0.0% 0.0% 0.0% -0.9% 0.0% -0.9% 0.36$ 70.14$ 62Lab and X-Ray 8.80$ 30.33$ 3,480 1.5% 0.5% 1.0% 0.0% 0.0% 0.0% -0.9% 0.0% -0.9% 9.12$ 30.79$ 3,553Transportation 1.90$ 69.90$ 327 0.4% 0.5% -0.1% 0.0% 0.0% 0.0% -0.9% 0.0% -0.9% 1.91$ 70.95$ 323Subtotal (Medical) 300.47$ N/A 59,700 3.3% 1.8% 1.5% 23.0% 23.0% 0.0% -11.0% 0.0% -11.0% 362.49$ N/A 57,043
CC4C LHD Payments 0.00$ 4.40$ 0 0.0% 0.0% 0.0% 0.0% 0.0% 0.0% 0.0% 0.0% 0.0% -$ 4.40$ -OBCM LHD Payments 3.21$ 4.91$ 7,845 0.0% 0.0% 0.0% 0.0% 0.0% 0.0% 0.0% 0.0% 0.0% 3.21$ 4.91$ 7,845Medical Home Payments 1.67$ 2.37$ 8,429 0.0% 0.0% 0.0% 0.0% 0.0% 0.0% 0.0% 0.0% 0.0% 1.67$ 2.37$ 8,429Subtotal (LHD/Medical Home Payments) 4.87$ N/A 16,274 0.0% 0.0% 0.0% 0.0% 0.0% 0.0% 0.0% 0.0% 0.0% 4.87$ N/A 16,274Total (Medical + LHD/Medical Home) 305.35$ N/A 75,974 3.2% 1.8% 1.4% 22.6% 22.6% 0.0% -10.9% 0.0% -10.9% 367.37$ N/A 73,317
Note: Total Medical Calculation: M = A * [(1 + D) ^ (36/12)] * (1 + G) * (1 + J) Gross Medical PMPM/Payment:
Non-Benefit Expense PMPM/Payment:General Administration (4.55%)Care Management (3.04%)Profit/Underwriting Gain (1.75%)
Total Service Cost and Non-Benefit Load PMPM/Payment:Premium Taxes (2.01%)
Total Capitation Rate: 413.55$
367.37$
18.45$12.33$7.09$
405.24$8.31$
Category of ServiceBase Data Trend Program Changes Managed Care Adjustment Total Medical
Region 1TANF and Other Related Adults (21+)
Male & Female
July 1, 2015 - June 30, 2017July 1, 2019 - June 30, 2020
36
136 of 197Prepared by Mercer GovernmentHuman Services Consulting
RFP 30-190029-DHBSection IX. Medicaid Managed Care Draft Rate Book (SFY 2020)

Exhibit 78
Region:Category of Aid:Sex:
Member Months/Deliveries: 5,230
Blended Base Data:Contract Period:Trend Months:
(A) (B) (C) (D) (E) (F) (G) (H) (I) (J) (K) (L) (M) (N) (O)
PMPM/Payment Unit Cost Util/1000 PMPM/
Payment Unit Cost Util/1000 PMPM/Payment Unit Cost Util/1000 PMPM/
Payment Unit Cost Util/1000 PMPM/Payment Unit Cost Util/1000
Inpatient — PH 2,122.90$ 782.43$ 32,558 0.5% 0.5% 0.0% 176.1% 176.1% 0.0% -1.1% 0.0% -1.1% 5,882.81$ 2,192.88$ 32,192Inpatient — BH -$ -$ - 0.5% 0.5% 0.0% 0.0% 0.0% 0.0% 0.0% 0.0% 0.0% -$ -$ -Outpatient Hospital 393.50$ 129.75$ 36,392 3.0% 0.5% 2.5% 26.3% 26.3% 0.0% -22.5% 0.0% -22.5% 420.96$ 166.38$ 30,361Emergency Room 314.33$ 337.39$ 11,180 1.5% 0.5% 1.0% 23.3% 23.3% 0.0% -11.3% 0.0% -11.3% 359.66$ 422.25$ 10,221Physician 1,545.86$ 184.45$ 100,570 2.5% 0.5% 2.0% 0.8% 0.8% 0.0% 0.0% 0.0% 0.0% 1,678.24$ 188.75$ 106,694FQHC/RHC 200.94$ 151.46$ 15,921 2.5% 0.5% 2.0% 0.0% 0.0% 0.0% 0.0% 0.0% 0.0% 216.39$ 153.74$ 16,890Other Clinic 201.31$ 129.75$ 18,619 2.5% 0.5% 2.0% 0.0% 0.0% 0.0% 0.0% 0.0% 0.0% 216.79$ 131.70$ 19,753Other Practitioner 0.11$ 75.77$ 17 2.5% 0.5% 2.0% 0.0% 0.0% 0.0% 0.0% 0.0% 0.0% 0.11$ 76.92$ 18Therapies -$ -$ - 2.5% 0.5% 2.0% 0.0% 0.0% 0.0% 0.0% 0.0% 0.0% -$ -$ -Prescribed Drugs -$ -$ - 0.0% 0.0% 0.0% 0.0% 0.0% 0.0% 0.0% 0.0% 0.0% -$ -$ -Other BH Services 0.01$ 87.29$ 2 2.0% 1.0% 1.0% 0.0% 0.0% 0.0% 0.0% 0.0% 0.0% 0.01$ 89.93$ 2LTSS Services 1.53$ 6.69$ 2,735 3.8% 0.5% 3.2% 0.0% 0.0% 0.0% 0.0% 0.0% 0.0% 1.70$ 6.80$ 3,009Durable Medical Equipment 8.02$ 77.96$ 1,234 1.5% 0.5% 1.0% 0.0% 0.0% 0.0% 0.0% 0.0% 0.0% 8.38$ 79.14$ 1,271Limited Dental Services -$ -$ - 1.5% 0.5% 1.0% 0.0% 0.0% 0.0% 0.0% 0.0% 0.0% -$ -$ -Optical 0.03$ 115.45$ 3 1.5% 0.5% 1.0% 0.0% 0.0% 0.0% 0.0% 0.0% 0.0% 0.03$ 117.19$ 3Lab and X-Ray 36.57$ 25.11$ 17,477 1.5% 0.5% 1.0% 0.0% 0.0% 0.0% 0.0% 0.0% 0.0% 38.24$ 25.49$ 18,004Transportation 12.63$ 104.01$ 1,458 0.4% 0.5% -0.1% 0.0% 0.0% 0.0% 0.0% 0.0% 0.0% 12.79$ 105.58$ 1,453Subtotal (Medical) 4,837.74$ N/A 238,166 1.6% 0.5% 1.1% 78.8% 78.8% 0.0% -2.6% 0.0% -2.6% 8,836.13$ N/A 239,873
CC4C LHD Payments -$ -$ - 0.0% 0.0% 0.0% 0.0% 0.0% 0.0% 0.0% 0.0% 0.0% -$ -$ -OBCM LHD Payments -$ -$ - 0.0% 0.0% 0.0% 0.0% 0.0% 0.0% 0.0% 0.0% 0.0% -$ -$ -Medical Home Payments -$ -$ - 0.0% 0.0% 0.0% 0.0% 0.0% 0.0% 0.0% 0.0% 0.0% -$ -$ -Subtotal (LHD/Medical Home Payments) -$ N/A - 0.0% 0.0% 0.0% 0.0% 0.0% 0.0% 0.0% 0.0% 0.0% -$ N/A -Total (Medical + LHD/Medical Home) 4,837.74$ N/A 238,166 1.6% 0.5% 1.1% 78.8% 78.8% 0.0% -2.6% 0.0% -2.6% 8,836.13$ N/A 239,873
Note: Total Medical Calculation: M = A * [(1 + D) ^ (36/12)] * (1 + G) * (1 + J) Gross Medical PMPM/Payment:
Non-Benefit Expense PMPM/Payment:General Administration (0.72%)Care Management (3.17%)Profit/Underwriting Gain (1.75%)
Total Service Cost and Non-Benefit Load PMPM/Payment:Premium Taxes (2.01%)
Total Capitation Rate: 9,555.60$
8,836.13$
67.03$296.52$163.86$
9,363.54$192.07$
Category of ServiceBase Data Trend Program Changes Managed Care Adjustment Total Medical
Region 1Maternity Event
Female
July 1, 2015 - June 30, 2017July 1, 2019 - June 30, 2020
36
137 of 197Prepared by Mercer GovernmentHuman Services Consulting
RFP 30-190029-DHBSection IX. Medicaid Managed Care Draft Rate Book (SFY 2020)

Region 2 Capitation Rate Development Exhibits14.2
138 of 197Prepared by Mercer GovernmentHuman Services Consulting
RFP 30-190029-DHBSection IX. Medicaid Managed Care Draft Rate Book (SFY 2020)

Exhibit 79
Region:Category of Aid:Sex:
Member Months/Deliveries: 263,136
Blended Base Data:Contract Period:Trend Months:
(A) (B) (C) (D) (E) (F) (G) (H) (I) (J) (K) (L) (M) (N) (O)
PMPM/Payment Unit Cost Util/1000 PMPM/
Payment Unit Cost Util/1000 PMPM/Payment Unit Cost Util/1000 PMPM/
Payment Unit Cost Util/1000 PMPM/Payment Unit Cost Util/1000
Inpatient — PH 127.01$ 989.44$ 1,540 0.5% 0.5% 0.0% 167.2% 167.2% 0.0% -15.8% 0.0% -15.8% 289.97$ 2,683.58$ 1,297Inpatient — BH 6.03$ 693.41$ 104 0.5% 0.5% 0.0% 0.0% 0.0% 0.0% -0.8% 0.0% -0.8% 6.07$ 703.87$ 103Outpatient Hospital 118.21$ 502.17$ 2,825 3.0% 0.5% 2.5% 36.7% 36.7% 0.0% -27.1% 0.0% -27.1% 128.74$ 696.66$ 2,218Emergency Room 64.34$ 521.01$ 1,482 1.5% 0.5% 1.0% 29.6% 29.6% 0.0% -19.6% 0.0% -19.6% 70.13$ 685.43$ 1,228Physician 101.06$ 130.66$ 9,282 2.0% 0.5% 1.5% 0.0% 0.0% 0.0% -11.8% 0.0% -11.8% 94.62$ 132.63$ 8,561FQHC/RHC 2.00$ 123.26$ 195 2.0% 0.5% 1.5% 0.0% 0.0% 0.0% -8.3% 0.0% -8.3% 1.95$ 125.12$ 187Other Clinic 8.65$ 328.01$ 316 2.0% 0.5% 1.5% 0.0% 0.0% 0.0% -8.3% 0.0% -8.3% 8.41$ 332.95$ 303Other Practitioner 0.79$ 75.00$ 126 2.0% 0.5% 1.5% 0.0% 0.0% 0.0% -8.3% 0.0% -8.3% 0.77$ 76.13$ 121Therapies 3.04$ 108.18$ 337 2.0% 0.5% 1.5% 0.0% 0.0% 0.0% -8.3% 0.0% -8.3% 2.96$ 109.81$ 323Prescribed Drugs 392.84$ 135.10$ 34,894 6.0% 5.5% 0.5% 0.0% 0.0% 0.0% -2.4% 0.0% -2.4% 456.65$ 158.64$ 34,543Other BH Services 15.45$ 64.37$ 2,880 2.0% 1.0% 1.0% 0.0% 0.0% 0.0% -0.8% 0.0% -0.8% 16.26$ 66.33$ 2,942LTSS Services 65.78$ 5.71$ 138,253 1.0% 0.5% 0.5% 12.4% 12.4% 0.0% -4.6% 0.0% -4.6% 72.71$ 6.52$ 133,906Durable Medical Equipment 40.27$ 2.96$ 163,123 1.5% 0.5% 1.0% 0.0% 0.0% 0.0% -15.8% 0.0% -15.8% 35.45$ 3.01$ 141,448Limited Dental Services 0.04$ 25.18$ 19 1.5% 0.5% 1.0% 0.0% 0.0% 0.0% -0.8% 0.0% -0.8% 0.04$ 25.56$ 20Optical 0.93$ 71.12$ 157 1.5% 0.5% 1.0% 0.0% 0.0% 0.0% -0.8% 0.0% -0.8% 0.97$ 72.20$ 161Lab and X-Ray 10.84$ 23.14$ 5,623 1.5% 0.5% 1.0% 0.0% 0.0% 0.0% -0.8% 0.0% -0.8% 11.24$ 23.49$ 5,744Transportation 12.46$ 89.20$ 1,676 -0.8% 0.5% -1.3% 0.0% 0.0% 0.0% -0.8% 0.0% -0.8% 12.06$ 90.54$ 1,598Subtotal (Medical) 969.74$ N/A 362,832 3.4% 2.6% 0.8% 27.2% 27.2% 0.0% -11.4% 0.0% -11.4% 1,209.00$ N/A 334,703
CC4C LHD Payments 0.00$ 4.53$ 13 0.0% 0.0% 0.0% 0.0% 0.0% 0.0% 0.0% 0.0% 0.0% -$ 4.53$ 13OBCM LHD Payments 0.76$ 4.93$ 1,844 0.0% 0.0% 0.0% 0.0% 0.0% 0.0% 0.0% 0.0% 0.0% 0.76$ 4.93$ 1,844Medical Home Payments 4.26$ 4.67$ 10,942 0.0% 0.0% 0.0% 0.0% 0.0% 0.0% 0.0% 0.0% 0.0% 4.26$ 4.67$ 10,942Subtotal (LHD/Medical Home Payments) 5.02$ N/A 12,800 0.0% 0.0% 0.0% 0.0% 0.0% 0.0% 0.0% 0.0% 0.0% 5.02$ N/A 12,800Total (Medical + LHD/Medical Home) 974.76$ N/A 375,632 3.4% 2.6% 0.8% 27.0% 27.0% 0.0% -11.3% 0.0% -11.3% 1,214.02$ N/A 347,504
Note: Total Medical Calculation: M = A * [(1 + D) ^ (36/12)] * (1 + G) * (1 + J) Gross Medical PMPM/Payment:
Non-Benefit Expense PMPM/Payment:General Administration (3.64%)Care Management (3.25%)Profit/Underwriting Gain (1.75%)
Total Service Cost and Non-Benefit Load PMPM/Payment:Premium Taxes (2.01%)
Total Capitation Rate: 1,356.05$
1,214.02$
48.35$43.18$23.25$
1,328.79$27.26$
Category of ServiceBase Data Trend Program Changes Managed Care Adjustment Total Medical
Region 2Aged, Blind, Disabled
Male & Female
July 1, 2015 - June 30, 2017July 1, 2019 - June 30, 2020
36
139 of 197Prepared by Mercer GovernmentHuman Services Consulting
RFP 30-190029-DHBSection IX. Medicaid Managed Care Draft Rate Book (SFY 2020)

Exhibit 80
Region:Category of Aid:Sex:
Member Months/Deliveries: 144,528
Blended Base Data:Contract Period:Trend Months:
(A) (B) (C) (D) (E) (F) (G) (H) (I) (J) (K) (L) (M) (N) (O)
PMPM/Payment Unit Cost Util/1000 PMPM/
Payment Unit Cost Util/1000 PMPM/Payment Unit Cost Util/1000 PMPM/
Payment Unit Cost Util/1000 PMPM/Payment Unit Cost Util/1000
Inpatient — PH 178.20$ 561.51$ 3,808 1.5% 0.5% 1.0% 172.5% 172.5% 0.0% -15.0% 0.0% -15.0% 431.67$ 1,553.43$ 3,335Inpatient — BH -$ -$ - 1.5% 0.5% 1.0% 0.0% 0.0% 0.0% 0.0% 0.0% 0.0% -$ -$ -Outpatient Hospital 14.26$ 155.20$ 1,103 3.0% 0.5% 2.5% 36.6% 36.6% 0.0% -7.5% 0.0% -7.5% 19.69$ 215.21$ 1,098Emergency Room 22.03$ 264.40$ 1,000 1.5% 0.5% 1.0% 26.9% 26.9% 0.0% -7.5% 0.0% -7.5% 27.04$ 340.55$ 953Physician 81.34$ 90.04$ 10,841 2.0% 0.5% 1.5% 0.0% 0.0% 0.0% -6.8% 0.0% -6.8% 80.44$ 91.39$ 10,561FQHC/RHC 4.34$ 114.62$ 455 2.0% 0.5% 1.5% 0.0% 0.0% 0.0% -7.5% 0.0% -7.5% 4.26$ 116.35$ 440Other Clinic 36.19$ 98.28$ 4,419 2.0% 0.5% 1.5% 0.0% 0.0% 0.0% -7.5% 0.0% -7.5% 35.53$ 99.76$ 4,274Other Practitioner 0.01$ 34.22$ 3 2.0% 0.5% 1.5% 0.0% 0.0% 0.0% -7.5% 0.0% -7.5% 0.01$ 34.74$ 3Therapies 0.75$ 99.92$ 90 2.0% 0.5% 1.5% 0.0% 0.0% 0.0% -7.5% 0.0% -7.5% 0.73$ 101.42$ 87Prescribed Drugs 13.47$ 46.55$ 3,472 -1.5% -1.5% 0.0% 0.0% 0.0% 0.0% -1.7% 0.0% -1.7% 12.65$ 44.48$ 3,412Other BH Services 0.06$ 23.20$ 29 2.0% 1.0% 1.0% 0.0% 0.0% 0.0% 0.0% 0.0% 0.0% 0.06$ 23.91$ 30LTSS Services 0.43$ 19.60$ 266 1.0% 0.5% 0.5% 0.0% 0.0% 0.0% 0.0% 0.0% 0.0% 0.45$ 19.89$ 270Durable Medical Equipment 7.58$ 26.72$ 3,406 1.5% 0.5% 1.0% 0.0% 0.0% 0.0% -7.5% 0.0% -7.5% 7.34$ 27.12$ 3,246Limited Dental Services 2.22$ 24.95$ 1,070 1.5% 0.5% 1.0% 0.0% 0.0% 0.0% 0.0% 0.0% 0.0% 2.33$ 25.32$ 1,102Optical 0.03$ 96.58$ 3 1.5% 0.5% 1.0% 0.0% 0.0% 0.0% 0.0% 0.0% 0.0% 0.03$ 98.03$ 3Lab and X-Ray 0.81$ 16.24$ 598 1.5% 0.5% 1.0% 0.0% 0.0% 0.0% 0.0% 0.0% 0.0% 0.85$ 16.49$ 616Transportation 0.95$ 91.49$ 124 -0.8% 0.5% -1.3% 0.0% 0.0% 0.0% 0.0% 0.0% 0.0% 0.92$ 92.87$ 119Subtotal (Medical) 362.67$ N/A 30,686 1.6% 0.4% 1.2% 87.6% 87.6% 0.0% -12.6% 0.0% -12.6% 623.99$ N/A 29,547
CC4C LHD Payments 4.18$ 4.55$ 11,040 0.0% 0.0% 0.0% 0.0% 0.0% 0.0% 0.0% 0.0% 0.0% 4.18$ 4.55$ 11,040OBCM LHD Payments 0.00$ 4.94$ 0 0.0% 0.0% 0.0% 0.0% 0.0% 0.0% 0.0% 0.0% 0.0% -$ 4.94$ -Medical Home Payments 2.05$ 2.47$ 9,956 0.0% 0.0% 0.0% 0.0% 0.0% 0.0% 0.0% 0.0% 0.0% 2.05$ 2.47$ 9,956Subtotal (LHD/Medical Home Payments) 6.24$ N/A 20,997 0.0% 0.0% 0.0% 0.0% 0.0% 0.0% 0.0% 0.0% 0.0% 6.24$ N/A 20,997Total (Medical + LHD/Medical Home) 368.91$ N/A 51,683 1.6% 0.4% 1.2% 86.2% 86.2% 0.0% -12.5% 0.0% -12.5% 630.22$ N/A 50,544
Note: Total Medical Calculation: M = A * [(1 + D) ^ (36/12)] * (1 + G) * (1 + J) Gross Medical PMPM/Payment:
Non-Benefit Expense PMPM/Payment:General Administration (4.08%)Care Management (3.23%)Profit/Underwriting Gain (1.75%)
Total Service Cost and Non-Benefit Load PMPM/Payment:Premium Taxes (2.01%)
Total Capitation Rate: 707.22$
630.22$
28.25$22.41$12.13$
693.01$14.22$
Category of ServiceBase Data Trend Program Changes Managed Care Adjustment Total Medical
Region 2TANF and Other Related Children (<1)
Male & Female
July 1, 2015 - June 30, 2017July 1, 2019 - June 30, 2020
36
140 of 197Prepared by Mercer GovernmentHuman Services Consulting
RFP 30-190029-DHBSection IX. Medicaid Managed Care Draft Rate Book (SFY 2020)

Exhibit 81
Region:Category of Aid:Sex:
Member Months/Deliveries: 2,297,179
Blended Base Data:Contract Period:Trend Months:
(A) (B) (C) (D) (E) (F) (G) (H) (I) (J) (K) (L) (M) (N) (O)
PMPM/Payment Unit Cost Util/1000 PMPM/
Payment Unit Cost Util/1000 PMPM/Payment Unit Cost Util/1000 PMPM/
Payment Unit Cost Util/1000 PMPM/Payment Unit Cost Util/1000
Inpatient — PH 4.66$ 1,303.09$ 43 1.5% 0.5% 1.0% 142.3% 142.3% 0.0% -15.3% 0.0% -15.3% 10.00$ 3,204.87$ 37Inpatient — BH 0.93$ 658.91$ 17 1.5% 0.5% 1.0% 0.0% 0.0% 0.0% -0.3% 0.0% -0.3% 0.96$ 668.84$ 17Outpatient Hospital 10.63$ 232.55$ 548 3.0% 0.5% 2.5% 35.7% 35.7% 0.0% -7.8% 0.0% -7.8% 14.53$ 320.41$ 544Emergency Room 13.73$ 322.66$ 511 1.5% 0.5% 1.0% 28.4% 28.4% 0.0% -7.8% 0.0% -7.8% 17.00$ 420.59$ 485Physician 19.58$ 69.01$ 3,405 2.0% 0.5% 1.5% 0.0% 0.0% 0.0% -7.2% 0.0% -7.2% 19.29$ 70.05$ 3,305FQHC/RHC 1.27$ 112.69$ 136 2.0% 0.5% 1.5% 0.0% 0.0% 0.0% -7.8% 0.0% -7.8% 1.25$ 114.39$ 131Other Clinic 5.90$ 103.64$ 683 2.0% 0.5% 1.5% 0.0% 0.0% 0.0% -7.8% 0.0% -7.8% 5.78$ 105.21$ 659Other Practitioner 0.10$ 78.83$ 16 2.0% 0.5% 1.5% 0.0% 0.0% 0.0% -7.8% 0.0% -7.8% 0.10$ 80.02$ 15Therapies 2.96$ 116.23$ 305 2.0% 0.5% 1.5% 0.0% 0.0% 0.0% -7.8% 0.0% -7.8% 2.89$ 117.98$ 294Prescribed Drugs 36.87$ 96.69$ 4,576 4.8% 4.3% 0.5% 0.0% 0.0% 0.0% -2.5% 0.0% -2.5% 41.33$ 109.55$ 4,527Other BH Services 4.72$ 77.02$ 736 2.0% 1.0% 1.0% 0.0% 0.0% 0.0% -0.3% 0.0% -0.3% 5.00$ 79.35$ 756LTSS Services 0.09$ 7.29$ 148 1.0% 0.5% 0.5% 2.6% 2.6% 0.0% -0.3% 0.0% -0.3% 0.09$ 7.59$ 150Durable Medical Equipment 2.19$ 2.64$ 9,940 1.5% 0.5% 1.0% 0.0% 0.0% 0.0% -7.8% 0.0% -7.8% 2.11$ 2.68$ 9,441Limited Dental Services 0.44$ 24.80$ 211 1.5% 0.5% 1.0% 0.0% 0.0% 0.0% -0.3% 0.0% -0.3% 0.45$ 25.17$ 217Optical 1.04$ 83.53$ 149 1.5% 0.5% 1.0% 0.0% 0.0% 0.0% -0.3% 0.0% -0.3% 1.08$ 84.79$ 153Lab and X-Ray 1.56$ 18.66$ 1,001 1.5% 0.5% 1.0% 0.0% 0.0% 0.0% -0.3% 0.0% -0.3% 1.62$ 18.94$ 1,028Transportation 0.42$ 90.47$ 55 -0.8% 0.5% -1.3% 0.0% 0.0% 0.0% -0.3% 0.0% -0.3% 0.41$ 91.83$ 53Subtotal (Medical) 107.08$ N/A 22,480 2.9% 1.8% 1.1% 13.0% 13.0% 0.0% -6.1% 0.0% -6.1% 123.90$ N/A 21,812
CC4C LHD Payments 0.99$ 4.52$ 2,627 0.0% 0.0% 0.0% 0.0% 0.0% 0.0% 0.0% 0.0% 0.0% 0.99$ 4.52$ 2,627OBCM LHD Payments 0.56$ 4.92$ 1,362 0.0% 0.0% 0.0% 0.0% 0.0% 0.0% 0.0% 0.0% 0.0% 0.56$ 4.92$ 1,362Medical Home Payments 2.30$ 2.45$ 11,277 0.0% 0.0% 0.0% 0.0% 0.0% 0.0% 0.0% 0.0% 0.0% 2.30$ 2.45$ 11,277Subtotal (LHD/Medical Home Payments) 3.85$ N/A 15,265 0.0% 0.0% 0.0% 0.0% 0.0% 0.0% 0.0% 0.0% 0.0% 3.85$ N/A 15,265Total (Medical + LHD/Medical Home) 110.93$ N/A 37,745 2.8% 1.8% 1.1% 12.6% 12.6% 0.0% -5.9% 0.0% -5.9% 127.75$ N/A 37,078
Note: Total Medical Calculation: M = A * [(1 + D) ^ (36/12)] * (1 + G) * (1 + J) Gross Medical PMPM/Payment:
Non-Benefit Expense PMPM/Payment:General Administration (7.51%)Care Management (3.12%)Profit/Underwriting Gain (1.75%)
Total Service Cost and Non-Benefit Load PMPM/Payment:Premium Taxes (2.01%)
Total Capitation Rate: 148.78$
127.75$
10.95$4.54$2.55$
145.79$2.99$
Category of ServiceBase Data Trend Program Changes Managed Care Adjustment Total Medical
Region 2TANF and Other Related Children (1-20)
Male & Female
July 1, 2015 - June 30, 2017July 1, 2019 - June 30, 2020
36
141 of 197Prepared by Mercer GovernmentHuman Services Consulting
RFP 30-190029-DHBSection IX. Medicaid Managed Care Draft Rate Book (SFY 2020)
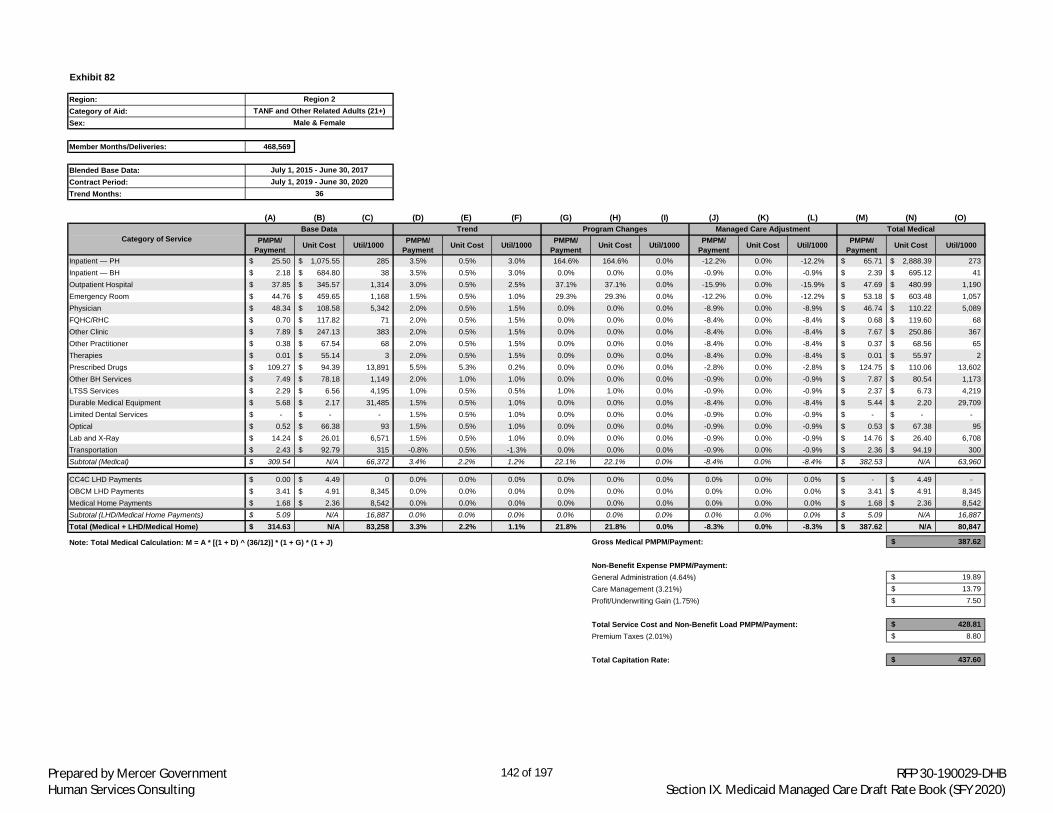
Exhibit 82
Region:Category of Aid:Sex:
Member Months/Deliveries: 468,569
Blended Base Data:Contract Period:Trend Months:
(A) (B) (C) (D) (E) (F) (G) (H) (I) (J) (K) (L) (M) (N) (O)
PMPM/Payment Unit Cost Util/1000 PMPM/
Payment Unit Cost Util/1000 PMPM/Payment Unit Cost Util/1000 PMPM/
Payment Unit Cost Util/1000 PMPM/Payment Unit Cost Util/1000
Inpatient — PH 25.50$ 1,075.55$ 285 3.5% 0.5% 3.0% 164.6% 164.6% 0.0% -12.2% 0.0% -12.2% 65.71$ 2,888.39$ 273Inpatient — BH 2.18$ 684.80$ 38 3.5% 0.5% 3.0% 0.0% 0.0% 0.0% -0.9% 0.0% -0.9% 2.39$ 695.12$ 41Outpatient Hospital 37.85$ 345.57$ 1,314 3.0% 0.5% 2.5% 37.1% 37.1% 0.0% -15.9% 0.0% -15.9% 47.69$ 480.99$ 1,190Emergency Room 44.76$ 459.65$ 1,168 1.5% 0.5% 1.0% 29.3% 29.3% 0.0% -12.2% 0.0% -12.2% 53.18$ 603.48$ 1,057Physician 48.34$ 108.58$ 5,342 2.0% 0.5% 1.5% 0.0% 0.0% 0.0% -8.9% 0.0% -8.9% 46.74$ 110.22$ 5,089FQHC/RHC 0.70$ 117.82$ 71 2.0% 0.5% 1.5% 0.0% 0.0% 0.0% -8.4% 0.0% -8.4% 0.68$ 119.60$ 68Other Clinic 7.89$ 247.13$ 383 2.0% 0.5% 1.5% 0.0% 0.0% 0.0% -8.4% 0.0% -8.4% 7.67$ 250.86$ 367Other Practitioner 0.38$ 67.54$ 68 2.0% 0.5% 1.5% 0.0% 0.0% 0.0% -8.4% 0.0% -8.4% 0.37$ 68.56$ 65Therapies 0.01$ 55.14$ 3 2.0% 0.5% 1.5% 0.0% 0.0% 0.0% -8.4% 0.0% -8.4% 0.01$ 55.97$ 2Prescribed Drugs 109.27$ 94.39$ 13,891 5.5% 5.3% 0.2% 0.0% 0.0% 0.0% -2.8% 0.0% -2.8% 124.75$ 110.06$ 13,602Other BH Services 7.49$ 78.18$ 1,149 2.0% 1.0% 1.0% 0.0% 0.0% 0.0% -0.9% 0.0% -0.9% 7.87$ 80.54$ 1,173LTSS Services 2.29$ 6.56$ 4,195 1.0% 0.5% 0.5% 1.0% 1.0% 0.0% -0.9% 0.0% -0.9% 2.37$ 6.73$ 4,219Durable Medical Equipment 5.68$ 2.17$ 31,485 1.5% 0.5% 1.0% 0.0% 0.0% 0.0% -8.4% 0.0% -8.4% 5.44$ 2.20$ 29,709Limited Dental Services -$ -$ - 1.5% 0.5% 1.0% 0.0% 0.0% 0.0% -0.9% 0.0% -0.9% -$ -$ -Optical 0.52$ 66.38$ 93 1.5% 0.5% 1.0% 0.0% 0.0% 0.0% -0.9% 0.0% -0.9% 0.53$ 67.38$ 95Lab and X-Ray 14.24$ 26.01$ 6,571 1.5% 0.5% 1.0% 0.0% 0.0% 0.0% -0.9% 0.0% -0.9% 14.76$ 26.40$ 6,708Transportation 2.43$ 92.79$ 315 -0.8% 0.5% -1.3% 0.0% 0.0% 0.0% -0.9% 0.0% -0.9% 2.36$ 94.19$ 300Subtotal (Medical) 309.54$ N/A 66,372 3.4% 2.2% 1.2% 22.1% 22.1% 0.0% -8.4% 0.0% -8.4% 382.53$ N/A 63,960
CC4C LHD Payments 0.00$ 4.49$ 0 0.0% 0.0% 0.0% 0.0% 0.0% 0.0% 0.0% 0.0% 0.0% -$ 4.49$ -OBCM LHD Payments 3.41$ 4.91$ 8,345 0.0% 0.0% 0.0% 0.0% 0.0% 0.0% 0.0% 0.0% 0.0% 3.41$ 4.91$ 8,345Medical Home Payments 1.68$ 2.36$ 8,542 0.0% 0.0% 0.0% 0.0% 0.0% 0.0% 0.0% 0.0% 0.0% 1.68$ 2.36$ 8,542Subtotal (LHD/Medical Home Payments) 5.09$ N/A 16,887 0.0% 0.0% 0.0% 0.0% 0.0% 0.0% 0.0% 0.0% 0.0% 5.09$ N/A 16,887Total (Medical + LHD/Medical Home) 314.63$ N/A 83,258 3.3% 2.2% 1.1% 21.8% 21.8% 0.0% -8.3% 0.0% -8.3% 387.62$ N/A 80,847
Note: Total Medical Calculation: M = A * [(1 + D) ^ (36/12)] * (1 + G) * (1 + J) Gross Medical PMPM/Payment:
Non-Benefit Expense PMPM/Payment:General Administration (4.64%)Care Management (3.21%)Profit/Underwriting Gain (1.75%)
Total Service Cost and Non-Benefit Load PMPM/Payment:Premium Taxes (2.01%)
Total Capitation Rate: 437.60$
387.62$
19.89$13.79$7.50$
428.81$8.80$
Category of ServiceBase Data Trend Program Changes Managed Care Adjustment Total Medical
Region 2TANF and Other Related Adults (21+)
Male & Female
July 1, 2015 - June 30, 2017July 1, 2019 - June 30, 2020
36
142 of 197Prepared by Mercer GovernmentHuman Services Consulting
RFP 30-190029-DHBSection IX. Medicaid Managed Care Draft Rate Book (SFY 2020)

Exhibit 83
Region:Category of Aid:Sex:
Member Months/Deliveries: 9,264
Blended Base Data:Contract Period:Trend Months:
(A) (B) (C) (D) (E) (F) (G) (H) (I) (J) (K) (L) (M) (N) (O)
PMPM/Payment Unit Cost Util/1000 PMPM/
Payment Unit Cost Util/1000 PMPM/Payment Unit Cost Util/1000 PMPM/
Payment Unit Cost Util/1000 PMPM/Payment Unit Cost Util/1000
Inpatient — PH 1,974.45$ 695.42$ 34,071 0.5% 0.5% 0.0% 192.2% 192.2% 0.0% -1.1% 0.0% -1.1% 5,791.09$ 2,062.87$ 33,687Inpatient — BH -$ -$ - 0.5% 0.5% 0.0% 0.0% 0.0% 0.0% 0.0% 0.0% 0.0% -$ -$ -Outpatient Hospital 422.88$ 127.27$ 39,872 3.0% 0.5% 2.5% 39.4% 39.4% 0.0% -15.0% 0.0% -15.0% 547.56$ 180.10$ 36,484Emergency Room 482.68$ 336.14$ 17,232 1.5% 0.5% 1.0% 30.9% 30.9% 0.0% -11.3% 0.0% -11.3% 586.57$ 446.80$ 15,754Physician 1,783.48$ 223.60$ 95,712 2.0% 0.5% 1.5% 0.8% 0.8% 0.0% 0.0% 0.0% 0.0% 1,908.00$ 228.82$ 100,062FQHC/RHC 7.03$ 128.05$ 658 2.0% 0.5% 1.5% 0.0% 0.0% 0.0% 0.0% 0.0% 0.0% 7.46$ 129.98$ 688Other Clinic 103.39$ 146.12$ 8,491 2.0% 0.5% 1.5% 0.0% 0.0% 0.0% 0.0% 0.0% 0.0% 109.72$ 148.33$ 8,876Other Practitioner 0.01$ 26.65$ 3 2.0% 0.5% 1.5% 0.0% 0.0% 0.0% 0.0% 0.0% 0.0% 0.01$ 27.05$ 3Therapies -$ -$ - 2.0% 0.5% 1.5% 0.0% 0.0% 0.0% 0.0% 0.0% 0.0% -$ -$ -Prescribed Drugs -$ -$ - 0.0% 0.0% 0.0% 0.0% 0.0% 0.0% 0.0% 0.0% 0.0% -$ -$ -Other BH Services 0.02$ 44.57$ 6 2.0% 1.0% 1.0% 0.0% 0.0% 0.0% 0.0% 0.0% 0.0% 0.02$ 45.92$ 6LTSS Services 2.30$ 5.43$ 5,089 1.0% 0.5% 0.5% 0.0% 0.0% 0.0% 0.0% 0.0% 0.0% 2.37$ 5.51$ 5,165Durable Medical Equipment 1.92$ 28.57$ 808 1.5% 0.5% 1.0% 0.0% 0.0% 0.0% 0.0% 0.0% 0.0% 2.01$ 29.00$ 833Limited Dental Services -$ -$ - 1.5% 0.5% 1.0% 0.0% 0.0% 0.0% 0.0% 0.0% 0.0% -$ -$ -Optical 0.02$ 80.24$ 3 1.5% 0.5% 1.0% 0.0% 0.0% 0.0% 0.0% 0.0% 0.0% 0.02$ 81.45$ 4Lab and X-Ray 37.25$ 18.96$ 23,580 1.5% 0.5% 1.0% 0.0% 0.0% 0.0% 0.0% 0.0% 0.0% 38.95$ 19.24$ 24,291Transportation 10.71$ 98.89$ 1,300 -0.8% 0.5% -1.3% 0.0% 0.0% 0.0% 0.0% 0.0% 0.0% 10.46$ 100.38$ 1,250Subtotal (Medical) 4,826.14$ N/A 226,824 1.4% 0.5% 0.9% 83.5% 83.5% 0.0% -2.6% 0.0% -2.6% 9,004.24$ N/A 227,103
CC4C LHD Payments -$ -$ - 0.0% 0.0% 0.0% 0.0% 0.0% 0.0% 0.0% 0.0% 0.0% -$ -$ -OBCM LHD Payments -$ -$ - 0.0% 0.0% 0.0% 0.0% 0.0% 0.0% 0.0% 0.0% 0.0% -$ -$ -Medical Home Payments -$ -$ - 0.0% 0.0% 0.0% 0.0% 0.0% 0.0% 0.0% 0.0% 0.0% -$ -$ -Subtotal (LHD/Medical Home Payments) -$ N/A - 0.0% 0.0% 0.0% 0.0% 0.0% 0.0% 0.0% 0.0% 0.0% -$ N/A -Total (Medical + LHD/Medical Home) 4,826.14$ N/A 226,824 1.4% 0.5% 0.9% 83.5% 83.5% 0.0% -2.6% 0.0% -2.6% 9,004.24$ N/A 227,103
Note: Total Medical Calculation: M = A * [(1 + D) ^ (36/12)] * (1 + G) * (1 + J) Gross Medical PMPM/Payment:
Non-Benefit Expense PMPM/Payment:General Administration (0.76%)Care Management (3.35%)Profit/Underwriting Gain (1.75%)
Total Service Cost and Non-Benefit Load PMPM/Payment:Premium Taxes (2.01%)
Total Capitation Rate: 9,760.42$
9,004.24$
72.39$320.23$167.37$
9,564.24$196.18$
Category of ServiceBase Data Trend Program Changes Managed Care Adjustment Total Medical
Region 2Maternity Event
Female
July 1, 2015 - June 30, 2017July 1, 2019 - June 30, 2020
36
143 of 197Prepared by Mercer GovernmentHuman Services Consulting
RFP 30-190029-DHBSection IX. Medicaid Managed Care Draft Rate Book (SFY 2020)
Region 3 Capitation Rate Development Exhibits14.3
144 of 197Prepared by Mercer GovernmentHuman Services Consulting
RFP 30-190029-DHBSection IX. Medicaid Managed Care Draft Rate Book (SFY 2020)

Exhibit 84
Region:Category of Aid:Sex:
Member Months/Deliveries: 328,525
Blended Base Data:Contract Period:Trend Months:
(A) (B) (C) (D) (E) (F) (G) (H) (I) (J) (K) (L) (M) (N) (O)
PMPM/Payment Unit Cost Util/1000 PMPM/
Payment Unit Cost Util/1000 PMPM/Payment Unit Cost Util/1000 PMPM/
Payment Unit Cost Util/1000 PMPM/Payment Unit Cost Util/1000
Inpatient — PH 129.48$ 973.44$ 1,596 0.5% 0.5% 0.0% 160.5% 160.5% 0.0% -15.8% 0.0% -15.8% 288.21$ 2,574.08$ 1,344Inpatient — BH 6.97$ 564.40$ 148 0.5% 0.5% 0.0% 0.0% 0.0% 0.0% -0.8% 0.0% -0.8% 7.02$ 572.90$ 147Outpatient Hospital 107.23$ 473.60$ 2,717 0.5% 0.5% 0.0% 40.6% 40.6% 0.0% -27.1% 0.0% -27.1% 111.56$ 675.70$ 1,981Emergency Room 70.12$ 506.46$ 1,661 0.5% 0.5% 0.0% 35.6% 35.6% 0.0% -19.6% 0.0% -19.6% 77.62$ 697.07$ 1,336Physician 115.69$ 135.02$ 10,282 2.5% 0.5% 2.0% 0.0% 0.0% 0.0% -10.8% 0.0% -10.8% 111.09$ 137.05$ 9,727FQHC/RHC 3.26$ 111.07$ 352 2.5% 0.5% 2.0% 0.0% 0.0% 0.0% -8.3% 0.0% -8.3% 3.21$ 112.75$ 342Other Clinic 11.05$ 452.97$ 293 2.5% 0.5% 2.0% 0.0% 0.0% 0.0% -8.3% 0.0% -8.3% 10.91$ 459.80$ 285Other Practitioner 0.88$ 75.64$ 140 2.5% 0.5% 2.0% 0.0% 0.0% 0.0% -8.3% 0.0% -8.3% 0.87$ 76.78$ 136Therapies 5.12$ 110.04$ 559 2.5% 0.5% 2.0% 0.0% 0.0% 0.0% -8.3% 0.0% -8.3% 5.06$ 111.70$ 543Prescribed Drugs 466.24$ 162.55$ 34,419 7.3% 6.8% 0.5% 0.0% 0.0% 0.0% -2.4% 0.0% -2.4% 561.37$ 197.74$ 34,067Other BH Services 15.73$ 48.73$ 3,875 2.0% 1.0% 1.0% 0.0% 0.0% 0.0% -0.8% 0.0% -0.8% 16.56$ 50.20$ 3,958LTSS Services 95.93$ 5.15$ 223,581 1.0% 0.5% 0.5% 12.4% 12.4% 0.0% -4.6% 0.0% -4.6% 106.05$ 5.88$ 216,553Durable Medical Equipment 46.52$ 3.22$ 173,462 2.0% 0.5% 1.5% 0.0% 0.0% 0.0% -15.8% 0.0% -15.8% 41.55$ 3.27$ 152,647Limited Dental Services 0.03$ 25.39$ 14 2.0% 0.5% 1.5% 0.0% 0.0% 0.0% -0.8% 0.0% -0.8% 0.03$ 25.77$ 14Optical 0.68$ 71.34$ 114 2.0% 0.5% 1.5% 0.0% 0.0% 0.0% -0.8% 0.0% -0.8% 0.71$ 72.42$ 118Lab and X-Ray 9.90$ 23.45$ 5,066 2.0% 0.5% 1.5% 0.0% 0.0% 0.0% -0.8% 0.0% -0.8% 10.42$ 23.81$ 5,252Transportation 10.77$ 58.66$ 2,204 -1.1% 0.5% -1.6% 0.0% 0.0% 0.0% -0.8% 0.0% -0.8% 10.33$ 59.54$ 2,083Subtotal (Medical) 1,095.59$ N/A 460,482 3.8% 3.3% 0.6% 23.9% 23.9% 0.0% -10.3% 0.0% -10.3% 1,362.59$ N/A 430,534
CC4C LHD Payments 0.00$ 4.53$ 12 0.0% 0.0% 0.0% 0.0% 0.0% 0.0% 0.0% 0.0% 0.0% -$ 4.53$ 12OBCM LHD Payments 0.74$ 4.93$ 1,806 0.0% 0.0% 0.0% 0.0% 0.0% 0.0% 0.0% 0.0% 0.0% 0.74$ 4.93$ 1,806Medical Home Payments 4.33$ 4.80$ 10,825 0.0% 0.0% 0.0% 0.0% 0.0% 0.0% 0.0% 0.0% 0.0% 4.33$ 4.80$ 10,825Subtotal (LHD/Medical Home Payments) 5.07$ N/A 12,643 0.0% 0.0% 0.0% 0.0% 0.0% 0.0% 0.0% 0.0% 0.0% 5.07$ N/A 12,643Total (Medical + LHD/Medical Home) 1,100.67$ N/A 473,125 3.8% 3.2% 0.6% 23.8% 23.8% 0.0% -10.3% 0.0% -10.3% 1,367.66$ N/A 443,178
Note: Total Medical Calculation: M = A * [(1 + D) ^ (36/12)] * (1 + G) * (1 + J) Gross Medical PMPM/Payment:
Non-Benefit Expense PMPM/Payment:General Administration (3.65%)Care Management (3.32%)Profit/Underwriting Gain (1.75%)
Total Service Cost and Non-Benefit Load PMPM/Payment:Premium Taxes (2.01%)
Total Capitation Rate: 1,529.02$
1,367.66$
54.66$49.75$26.22$
1,498.29$30.73$
Category of ServiceBase Data Trend Program Changes Managed Care Adjustment Total Medical
Region 3Aged, Blind, Disabled
Male & Female
July 1, 2015 - June 30, 2017July 1, 2019 - June 30, 2020
36
145 of 197Prepared by Mercer GovernmentHuman Services Consulting
RFP 30-190029-DHBSection IX. Medicaid Managed Care Draft Rate Book (SFY 2020)

Exhibit 85
Region:Category of Aid:Sex:
Member Months/Deliveries: 211,433
Blended Base Data:Contract Period:Trend Months:
(A) (B) (C) (D) (E) (F) (G) (H) (I) (J) (K) (L) (M) (N) (O)
PMPM/Payment Unit Cost Util/1000 PMPM/
Payment Unit Cost Util/1000 PMPM/Payment Unit Cost Util/1000 PMPM/
Payment Unit Cost Util/1000 PMPM/Payment Unit Cost Util/1000
Inpatient — PH 180.57$ 576.42$ 3,759 1.5% 0.5% 1.0% 185.2% 185.2% 0.0% -15.0% 0.0% -15.0% 457.70$ 1,668.59$ 3,292Inpatient — BH -$ -$ - 1.5% 0.5% 1.0% 0.0% 0.0% 0.0% 0.0% 0.0% 0.0% -$ -$ -Outpatient Hospital 10.78$ 168.14$ 769 0.5% 0.5% 0.0% 44.3% 44.3% 0.0% -7.5% 0.0% -7.5% 14.61$ 246.35$ 712Emergency Room 21.61$ 251.16$ 1,033 0.5% 0.5% 0.0% 32.3% 32.3% 0.0% -7.5% 0.0% -7.5% 26.84$ 337.20$ 955Physician 84.14$ 93.02$ 10,855 2.5% 0.5% 2.0% 0.0% 0.0% 0.0% -6.8% 0.0% -6.8% 84.45$ 94.42$ 10,733FQHC/RHC 1.55$ 111.80$ 166 2.5% 0.5% 2.0% 0.0% 0.0% 0.0% -7.5% 0.0% -7.5% 1.54$ 113.48$ 163Other Clinic 34.02$ 95.22$ 4,287 2.5% 0.5% 2.0% 0.0% 0.0% 0.0% -7.5% 0.0% -7.5% 33.89$ 96.65$ 4,207Other Practitioner 0.07$ 37.45$ 24 2.5% 0.5% 2.0% 0.0% 0.0% 0.0% -7.5% 0.0% -7.5% 0.07$ 38.01$ 23Therapies 1.04$ 91.12$ 137 2.5% 0.5% 2.0% 0.0% 0.0% 0.0% -7.5% 0.0% -7.5% 1.04$ 92.49$ 135Prescribed Drugs 15.35$ 51.56$ 3,572 -0.5% -0.5% 0.0% 0.0% 0.0% 0.0% -1.7% 0.0% -1.7% 14.86$ 50.79$ 3,511Other BH Services 0.08$ 16.68$ 57 2.0% 1.0% 1.0% 0.0% 0.0% 0.0% 0.0% 0.0% 0.0% 0.08$ 17.19$ 59LTSS Services 1.77$ 14.85$ 1,433 1.0% 0.5% 0.5% 0.0% 0.0% 0.0% 0.0% 0.0% 0.0% 1.83$ 15.07$ 1,454Durable Medical Equipment 8.57$ 26.22$ 3,920 2.0% 0.5% 1.5% 0.0% 0.0% 0.0% -7.5% 0.0% -7.5% 8.41$ 26.62$ 3,791Limited Dental Services 1.72$ 24.96$ 829 2.0% 0.5% 1.5% 0.0% 0.0% 0.0% 0.0% 0.0% 0.0% 1.83$ 25.34$ 867Optical 0.01$ 95.98$ 1 2.0% 0.5% 1.5% 0.0% 0.0% 0.0% 0.0% 0.0% 0.0% 0.01$ 97.42$ 1Lab and X-Ray 1.68$ 34.10$ 590 2.0% 0.5% 1.5% 0.0% 0.0% 0.0% 0.0% 0.0% 0.0% 1.78$ 34.61$ 617Transportation 0.89$ 95.72$ 111 -1.1% 0.5% -1.6% 0.0% 0.0% 0.0% 0.0% 0.0% 0.0% 0.86$ 97.16$ 106Subtotal (Medical) 363.84$ N/A 31,543 1.7% 0.5% 1.2% 94.6% 94.6% 0.0% -12.7% 0.0% -12.7% 649.78$ N/A 30,623
CC4C LHD Payments 4.17$ 4.55$ 10,997 0.0% 0.0% 0.0% 0.0% 0.0% 0.0% 0.0% 0.0% 0.0% 4.17$ 4.55$ 10,997OBCM LHD Payments 0.00$ 4.91$ 0 0.0% 0.0% 0.0% 0.0% 0.0% 0.0% 0.0% 0.0% 0.0% -$ 4.91$ -Medical Home Payments 1.93$ 2.47$ 9,370 0.0% 0.0% 0.0% 0.0% 0.0% 0.0% 0.0% 0.0% 0.0% 1.93$ 2.47$ 9,370Subtotal (LHD/Medical Home Payments) 6.10$ N/A 20,367 0.0% 0.0% 0.0% 0.0% 0.0% 0.0% 0.0% 0.0% 0.0% 6.10$ N/A 20,367Total (Medical + LHD/Medical Home) 369.94$ N/A 51,910 1.6% 0.5% 1.2% 93.1% 93.1% 0.0% -12.6% 0.0% -12.6% 655.88$ N/A 50,991
Note: Total Medical Calculation: M = A * [(1 + D) ^ (36/12)] * (1 + G) * (1 + J) Gross Medical PMPM/Payment:
Non-Benefit Expense PMPM/Payment:General Administration (4.10%)Care Management (3.30%)Profit/Underwriting Gain (1.75%)
Total Service Cost and Non-Benefit Load PMPM/Payment:Premium Taxes (2.01%)
Total Capitation Rate: 736.81$
655.88$
29.62$23.86$12.63$
722.00$14.81$
Category of ServiceBase Data Trend Program Changes Managed Care Adjustment Total Medical
Region 3TANF and Other Related Children (<1)
Male & Female
July 1, 2015 - June 30, 2017July 1, 2019 - June 30, 2020
36
146 of 197Prepared by Mercer GovernmentHuman Services Consulting
RFP 30-190029-DHBSection IX. Medicaid Managed Care Draft Rate Book (SFY 2020)

Exhibit 86
Region:Category of Aid:Sex:
Member Months/Deliveries: 3,243,949
Blended Base Data:Contract Period:Trend Months:
(A) (B) (C) (D) (E) (F) (G) (H) (I) (J) (K) (L) (M) (N) (O)
PMPM/Payment Unit Cost Util/1000 PMPM/
Payment Unit Cost Util/1000 PMPM/Payment Unit Cost Util/1000 PMPM/
Payment Unit Cost Util/1000 PMPM/Payment Unit Cost Util/1000
Inpatient — PH 3.82$ 1,102.70$ 42 1.5% 0.5% 1.0% 158.2% 158.2% 0.0% -15.3% 0.0% -15.3% 8.75$ 2,890.55$ 36Inpatient — BH 0.65$ 543.61$ 14 1.5% 0.5% 1.0% 0.0% 0.0% 0.0% -0.3% 0.0% -0.3% 0.68$ 551.80$ 15Outpatient Hospital 7.92$ 265.07$ 359 0.5% 0.5% 0.0% 41.2% 41.2% 0.0% -7.8% 0.0% -7.8% 10.47$ 379.92$ 331Emergency Room 12.75$ 297.52$ 514 0.5% 0.5% 0.0% 33.1% 33.1% 0.0% -7.8% 0.0% -7.8% 15.89$ 401.98$ 474Physician 21.62$ 75.97$ 3,415 2.5% 0.5% 2.0% 0.0% 0.0% 0.0% -7.1% 0.0% -7.1% 21.63$ 77.12$ 3,365FQHC/RHC 0.55$ 116.79$ 57 2.5% 0.5% 2.0% 0.0% 0.0% 0.0% -7.8% 0.0% -7.8% 0.55$ 118.55$ 56Other Clinic 5.83$ 99.31$ 705 2.5% 0.5% 2.0% 0.0% 0.0% 0.0% -7.8% 0.0% -7.8% 5.79$ 100.81$ 690Other Practitioner 0.20$ 81.18$ 29 2.5% 0.5% 2.0% 0.0% 0.0% 0.0% -7.8% 0.0% -7.8% 0.20$ 82.40$ 29Therapies 3.05$ 100.48$ 364 2.5% 0.5% 2.0% 0.0% 0.0% 0.0% -7.8% 0.0% -7.8% 3.02$ 101.99$ 356Prescribed Drugs 35.23$ 97.06$ 4,356 4.5% 4.0% 0.5% 0.0% 0.0% 0.0% -2.5% 0.0% -2.5% 39.21$ 109.18$ 4,309Other BH Services 5.36$ 75.76$ 849 2.0% 1.0% 1.0% 0.0% 0.0% 0.0% -0.3% 0.0% -0.3% 5.67$ 78.06$ 872LTSS Services 0.29$ 7.85$ 436 1.0% 0.5% 0.5% 2.6% 2.6% 0.0% -0.3% 0.0% -0.3% 0.30$ 8.17$ 441Durable Medical Equipment 2.10$ 3.33$ 7,548 2.0% 0.5% 1.5% 0.0% 0.0% 0.0% -7.8% 0.0% -7.8% 2.05$ 3.38$ 7,276Limited Dental Services 0.31$ 24.82$ 151 2.0% 0.5% 1.5% 0.0% 0.0% 0.0% -0.3% 0.0% -0.3% 0.33$ 25.19$ 157Optical 0.63$ 84.22$ 90 2.0% 0.5% 1.5% 0.0% 0.0% 0.0% -0.3% 0.0% -0.3% 0.67$ 85.49$ 94Lab and X-Ray 1.61$ 20.89$ 927 2.0% 0.5% 1.5% 0.0% 0.0% 0.0% -0.3% 0.0% -0.3% 1.71$ 21.21$ 967Transportation 0.38$ 71.14$ 65 -1.1% 0.5% -1.6% 0.0% 0.0% 0.0% -0.3% 0.0% -0.3% 0.37$ 72.21$ 62Subtotal (Medical) 102.32$ N/A 19,921 2.7% 1.7% 0.9% 12.6% 12.6% 0.0% -6.0% 0.0% -6.0% 117.28$ N/A 19,528
CC4C LHD Payments 1.00$ 4.52$ 2,649 0.0% 0.0% 0.0% 0.0% 0.0% 0.0% 0.0% 0.0% 0.0% 1.00$ 4.52$ 2,649OBCM LHD Payments 0.54$ 4.92$ 1,329 0.0% 0.0% 0.0% 0.0% 0.0% 0.0% 0.0% 0.0% 0.0% 0.54$ 4.92$ 1,329Medical Home Payments 2.24$ 2.46$ 10,933 0.0% 0.0% 0.0% 0.0% 0.0% 0.0% 0.0% 0.0% 0.0% 2.24$ 2.46$ 10,933Subtotal (LHD/Medical Home Payments) 3.79$ N/A 14,911 0.0% 0.0% 0.0% 0.0% 0.0% 0.0% 0.0% 0.0% 0.0% 3.79$ N/A 14,911Total (Medical + LHD/Medical Home) 106.10$ N/A 34,832 2.6% 1.7% 0.9% 12.2% 12.2% 0.0% -5.8% 0.0% -5.8% 121.06$ N/A 34,439
Note: Total Medical Calculation: M = A * [(1 + D) ^ (36/12)] * (1 + G) * (1 + J) Gross Medical PMPM/Payment:
Non-Benefit Expense PMPM/Payment:General Administration (7.79%)Care Management (3.18%)Profit/Underwriting Gain (1.75%)
Total Service Cost and Non-Benefit Load PMPM/Payment:Premium Taxes (2.01%)
Total Capitation Rate: 141.55$
121.06$
10.81$4.40$2.43$
138.70$2.85$
Category of ServiceBase Data Trend Program Changes Managed Care Adjustment Total Medical
Region 3TANF and Other Related Children (1-20)
Male & Female
July 1, 2015 - June 30, 2017July 1, 2019 - June 30, 2020
36
147 of 197Prepared by Mercer GovernmentHuman Services Consulting
RFP 30-190029-DHBSection IX. Medicaid Managed Care Draft Rate Book (SFY 2020)

Exhibit 87
Region:Category of Aid:Sex:
Member Months/Deliveries: 711,903
Blended Base Data:Contract Period:Trend Months:
(A) (B) (C) (D) (E) (F) (G) (H) (I) (J) (K) (L) (M) (N) (O)
PMPM/Payment Unit Cost Util/1000 PMPM/
Payment Unit Cost Util/1000 PMPM/Payment Unit Cost Util/1000 PMPM/
Payment Unit Cost Util/1000 PMPM/Payment Unit Cost Util/1000
Inpatient — PH 21.38$ 1,109.26$ 231 3.5% 0.5% 3.0% 177.7% 177.7% 0.0% -12.2% 0.0% -12.2% 57.83$ 3,126.78$ 222Inpatient — BH 1.79$ 570.73$ 38 3.5% 0.5% 3.0% 0.0% 0.0% 0.0% -0.9% 0.0% -0.9% 1.96$ 579.33$ 41Outpatient Hospital 31.42$ 314.76$ 1,198 0.5% 0.5% 0.0% 41.1% 41.1% 0.0% -15.9% 0.0% -15.9% 37.85$ 450.89$ 1,007Emergency Room 46.59$ 442.95$ 1,262 0.5% 0.5% 0.0% 35.2% 35.2% 0.0% -12.2% 0.0% -12.2% 56.19$ 608.01$ 1,109Physician 45.96$ 110.31$ 5,000 2.5% 0.5% 2.0% 0.0% 0.0% 0.0% -8.7% 0.0% -8.7% 45.17$ 111.97$ 4,840FQHC/RHC 1.37$ 107.36$ 153 2.5% 0.5% 2.0% 0.0% 0.0% 0.0% -8.4% 0.0% -8.4% 1.35$ 108.98$ 148Other Clinic 6.90$ 219.96$ 377 2.5% 0.5% 2.0% 0.0% 0.0% 0.0% -8.4% 0.0% -8.4% 6.81$ 223.28$ 366Other Practitioner 0.38$ 61.29$ 74 2.5% 0.5% 2.0% 0.0% 0.0% 0.0% -8.4% 0.0% -8.4% 0.37$ 62.21$ 72Therapies 0.03$ 56.50$ 6 2.5% 0.5% 2.0% 0.0% 0.0% 0.0% -8.4% 0.0% -8.4% 0.03$ 57.35$ 6Prescribed Drugs 90.81$ 88.16$ 12,361 6.0% 5.8% 0.2% 0.0% 0.0% 0.0% -2.8% 0.0% -2.8% 105.15$ 104.25$ 12,103Other BH Services 6.97$ 63.22$ 1,323 2.0% 1.0% 1.0% 0.0% 0.0% 0.0% -0.9% 0.0% -0.9% 7.33$ 65.14$ 1,351LTSS Services 2.71$ 5.73$ 5,673 1.0% 0.5% 0.5% 1.0% 1.0% 0.0% -0.9% 0.0% -0.9% 2.79$ 5.87$ 5,706Durable Medical Equipment 5.84$ 2.42$ 28,964 2.0% 0.5% 1.5% 0.0% 0.0% 0.0% -8.4% 0.0% -8.4% 5.68$ 2.46$ 27,737Limited Dental Services 0.00$ 15.06$ 0 2.0% 0.5% 1.5% 0.0% 0.0% 0.0% -0.9% 0.0% -0.9% -$ 15.28$ -Optical 0.21$ 69.10$ 36 2.0% 0.5% 1.5% 0.0% 0.0% 0.0% -0.9% 0.0% -0.9% 0.22$ 70.14$ 37Lab and X-Ray 11.88$ 27.77$ 5,132 2.0% 0.5% 1.5% 0.0% 0.0% 0.0% -0.9% 0.0% -0.9% 12.49$ 28.19$ 5,317Transportation 1.79$ 73.43$ 293 -1.1% 0.5% -1.6% 0.0% 0.0% 0.0% -0.9% 0.0% -0.9% 1.72$ 74.54$ 277Subtotal (Medical) 276.02$ N/A 62,119 3.1% 2.3% 0.8% 23.8% 23.8% 0.0% -8.5% 0.0% -8.5% 342.93$ N/A 60,339
CC4C LHD Payments 0.00$ 4.35$ 0 0.0% 0.0% 0.0% 0.0% 0.0% 0.0% 0.0% 0.0% 0.0% -$ 4.35$ -OBCM LHD Payments 3.39$ 4.91$ 8,284 0.0% 0.0% 0.0% 0.0% 0.0% 0.0% 0.0% 0.0% 0.0% 3.39$ 4.91$ 8,284Medical Home Payments 1.73$ 2.43$ 8,529 0.0% 0.0% 0.0% 0.0% 0.0% 0.0% 0.0% 0.0% 0.0% 1.73$ 2.43$ 8,529Subtotal (LHD/Medical Home Payments) 5.11$ N/A 16,813 0.0% 0.0% 0.0% 0.0% 0.0% 0.0% 0.0% 0.0% 0.0% 5.11$ N/A 16,813Total (Medical + LHD/Medical Home) 281.13$ N/A 78,932 3.1% 2.2% 0.8% 23.4% 23.4% 0.0% -8.4% 0.0% -8.4% 348.04$ N/A 77,151
Note: Total Medical Calculation: M = A * [(1 + D) ^ (36/12)] * (1 + G) * (1 + J) Gross Medical PMPM/Payment:
Non-Benefit Expense PMPM/Payment:General Administration (4.86%)Care Management (3.28%)Profit/Underwriting Gain (1.75%)
Total Service Cost and Non-Benefit Load PMPM/Payment:Premium Taxes (2.01%)
Total Capitation Rate: 394.18$
348.04$
18.79$12.66$6.76$
386.26$7.92$
Category of ServiceBase Data Trend Program Changes Managed Care Adjustment Total Medical
Region 3TANF and Other Related Adults (21+)
Male & Female
July 1, 2015 - June 30, 2017July 1, 2019 - June 30, 2020
36
148 of 197Prepared by Mercer GovernmentHuman Services Consulting
RFP 30-190029-DHBSection IX. Medicaid Managed Care Draft Rate Book (SFY 2020)

Exhibit 88
Region:Category of Aid:Sex:
Member Months/Deliveries: 13,078
Blended Base Data:Contract Period:Trend Months:
(A) (B) (C) (D) (E) (F) (G) (H) (I) (J) (K) (L) (M) (N) (O)
PMPM/Payment Unit Cost Util/1000 PMPM/
Payment Unit Cost Util/1000 PMPM/Payment Unit Cost Util/1000 PMPM/
Payment Unit Cost Util/1000 PMPM/Payment Unit Cost Util/1000
Inpatient — PH 2,014.40$ 731.64$ 33,039 0.5% 0.5% 0.0% 183.1% 183.1% 0.0% -1.1% 0.0% -1.1% 5,723.26$ 2,102.36$ 32,668Inpatient — BH -$ -$ - 0.5% 0.5% 0.0% 0.0% 0.0% 0.0% 0.0% 0.0% 0.0% -$ -$ -Outpatient Hospital 260.14$ 134.71$ 23,174 0.5% 0.5% 0.0% 41.5% 41.5% 0.0% -15.0% 0.0% -15.0% 317.55$ 193.45$ 19,697Emergency Room 454.86$ 371.06$ 14,710 0.5% 0.5% 0.0% 35.8% 35.8% 0.0% -11.3% 0.0% -11.3% 556.54$ 511.55$ 13,055Physician 1,637.47$ 233.26$ 84,239 2.5% 0.5% 2.0% 0.8% 0.8% 0.0% 0.0% 0.0% 0.0% 1,777.69$ 238.70$ 89,369FQHC/RHC 6.89$ 129.90$ 636 2.5% 0.5% 2.0% 0.0% 0.0% 0.0% 0.0% 0.0% 0.0% 7.42$ 131.86$ 675Other Clinic 229.74$ 193.00$ 14,284 2.5% 0.5% 2.0% 0.0% 0.0% 0.0% 0.0% 0.0% 0.0% 247.40$ 195.90$ 15,154Other Practitioner 0.25$ 40.26$ 75 2.5% 0.5% 2.0% 0.0% 0.0% 0.0% 0.0% 0.0% 0.0% 0.27$ 40.87$ 79Therapies 0.02$ 89.84$ 3 2.5% 0.5% 2.0% 0.0% 0.0% 0.0% 0.0% 0.0% 0.0% 0.03$ 91.20$ 3Prescribed Drugs -$ -$ - 0.0% 0.0% 0.0% 0.0% 0.0% 0.0% 0.0% 0.0% 0.0% -$ -$ -Other BH Services -$ -$ - 2.0% 1.0% 1.0% 0.0% 0.0% 0.0% 0.0% 0.0% 0.0% -$ -$ -LTSS Services 3.95$ 1.10$ 43,314 1.0% 0.5% 0.5% 0.0% 0.0% 0.0% 0.0% 0.0% 0.0% 4.07$ 1.11$ 43,964Durable Medical Equipment 1.83$ 25.70$ 852 2.0% 0.5% 1.5% 0.0% 0.0% 0.0% 0.0% 0.0% 0.0% 1.94$ 26.09$ 891Limited Dental Services 0.00$ 24.71$ 2 2.0% 0.5% 1.5% 0.0% 0.0% 0.0% 0.0% 0.0% 0.0% -$ 25.08$ 2Optical 0.01$ 69.74$ 2 2.0% 0.5% 1.5% 0.0% 0.0% 0.0% 0.0% 0.0% 0.0% 0.01$ 70.79$ 2Lab and X-Ray 43.38$ 27.82$ 18,714 2.0% 0.5% 1.5% 0.0% 0.0% 0.0% 0.0% 0.0% 0.0% 46.04$ 28.24$ 19,565Transportation 10.32$ 91.31$ 1,356 -1.1% 0.5% -1.6% 0.0% 0.0% 0.0% 0.0% 0.0% 0.0% 9.98$ 92.68$ 1,293Subtotal (Medical) 4,663.26$ N/A 234,400 1.3% 0.5% 0.8% 83.1% 83.1% 0.0% -2.2% 0.0% -2.2% 8,692.19$ N/A 236,416
CC4C LHD Payments -$ -$ - 0.0% 0.0% 0.0% 0.0% 0.0% 0.0% 0.0% 0.0% 0.0% -$ -$ -OBCM LHD Payments -$ -$ - 0.0% 0.0% 0.0% 0.0% 0.0% 0.0% 0.0% 0.0% 0.0% -$ -$ -Medical Home Payments -$ -$ - 0.0% 0.0% 0.0% 0.0% 0.0% 0.0% 0.0% 0.0% 0.0% -$ -$ -Subtotal (LHD/Medical Home Payments) -$ N/A - 0.0% 0.0% 0.0% 0.0% 0.0% 0.0% 0.0% 0.0% 0.0% -$ N/A -Total (Medical + LHD/Medical Home) 4,663.26$ N/A 234,400 1.3% 0.5% 0.8% 83.1% 83.1% 0.0% -2.2% 0.0% -2.2% 8,692.19$ N/A 236,416
Note: Total Medical Calculation: M = A * [(1 + D) ^ (36/12)] * (1 + G) * (1 + J) Gross Medical PMPM/Payment:
Non-Benefit Expense PMPM/Payment:General Administration (0.77%)Care Management (3.42%)Profit/Underwriting Gain (1.75%)
Total Service Cost and Non-Benefit Load PMPM/Payment:Premium Taxes (2.01%)
Total Capitation Rate: 9,431.17$
8,692.19$
71.48$316.20$161.73$
9,241.60$189.57$
Category of ServiceBase Data Trend Program Changes Managed Care Adjustment Total Medical
Region 3Maternity Event
Female
July 1, 2015 - June 30, 2017July 1, 2019 - June 30, 2020
36
149 of 197Prepared by Mercer GovernmentHuman Services Consulting
RFP 30-190029-DHBSection IX. Medicaid Managed Care Draft Rate Book (SFY 2020)

Region 4 Capitation Rate Development Exhibits14.4
150 of 197Prepared by Mercer GovernmentHuman Services Consulting
RFP 30-190029-DHBSection IX. Medicaid Managed Care Draft Rate Book (SFY 2020)

Exhibit 89
Region:Category of Aid:Sex:
Member Months/Deliveries: 278,511
Blended Base Data:Contract Period:Trend Months:
(A) (B) (C) (D) (E) (F) (G) (H) (I) (J) (K) (L) (M) (N) (O)
PMPM/Payment Unit Cost Util/1000 PMPM/
Payment Unit Cost Util/1000 PMPM/Payment Unit Cost Util/1000 PMPM/
Payment Unit Cost Util/1000 PMPM/Payment Unit Cost Util/1000
Inpatient — PH 139.30$ 981.10$ 1,704 0.5% 0.5% 0.0% 140.5% 140.5% 0.0% -15.8% 0.0% -15.8% 286.30$ 2,395.56$ 1,434Inpatient — BH 7.28$ 779.26$ 112 0.5% 0.5% 0.0% 0.0% 0.0% 0.0% -0.8% 0.0% -0.8% 7.33$ 791.01$ 111Outpatient Hospital 99.43$ 511.26$ 2,334 2.0% 0.5% 1.5% 27.8% 27.8% 0.0% -27.1% 0.0% -27.1% 98.34$ 663.24$ 1,779Emergency Room 60.29$ 513.40$ 1,409 3.0% 0.5% 2.5% 29.1% 29.1% 0.0% -19.6% 0.0% -19.6% 68.42$ 672.90$ 1,220Physician 102.74$ 140.47$ 8,777 2.0% 0.5% 1.5% 0.0% 0.0% 0.0% -10.5% 0.0% -10.5% 97.53$ 142.59$ 8,208FQHC/RHC 7.18$ 116.80$ 738 2.0% 0.5% 1.5% 0.0% 0.0% 0.0% -8.3% 0.0% -8.3% 6.99$ 118.56$ 707Other Clinic 14.07$ 482.53$ 350 2.0% 0.5% 1.5% 0.0% 0.0% 0.0% -8.3% 0.0% -8.3% 13.69$ 489.81$ 335Other Practitioner 0.63$ 79.24$ 95 2.0% 0.5% 1.5% 0.0% 0.0% 0.0% -8.3% 0.0% -8.3% 0.61$ 80.44$ 91Therapies 6.25$ 114.97$ 653 2.0% 0.5% 1.5% 0.0% 0.0% 0.0% -8.3% 0.0% -8.3% 6.08$ 116.70$ 625Prescribed Drugs 436.64$ 172.91$ 30,303 7.3% 6.8% 0.5% 0.0% 0.0% 0.0% -2.4% 0.0% -2.4% 525.73$ 210.34$ 29,993Other BH Services 20.97$ 57.09$ 4,407 3.5% 1.0% 2.5% 0.0% 0.0% 0.0% -0.8% 0.0% -0.8% 23.06$ 58.82$ 4,704LTSS Services 63.82$ 4.97$ 153,947 1.0% 0.5% 0.5% 12.4% 12.4% 0.0% -4.6% 0.0% -4.6% 70.56$ 5.68$ 149,108Durable Medical Equipment 35.22$ 2.63$ 160,886 2.0% 0.5% 1.5% 0.0% 0.0% 0.0% -15.8% 0.0% -15.8% 31.46$ 2.67$ 141,580Limited Dental Services 0.04$ 24.79$ 17 2.0% 0.5% 1.5% 0.0% 0.0% 0.0% -0.8% 0.0% -0.8% 0.04$ 25.17$ 18Optical 1.02$ 70.57$ 174 2.0% 0.5% 1.5% 0.0% 0.0% 0.0% -0.8% 0.0% -0.8% 1.07$ 71.63$ 180Lab and X-Ray 8.98$ 21.73$ 4,959 2.0% 0.5% 1.5% 0.0% 0.0% 0.0% -0.8% 0.0% -0.8% 9.45$ 22.06$ 5,142Transportation 9.66$ 58.76$ 1,973 0.4% 0.5% -0.1% 0.0% 0.0% 0.0% -0.8% 0.0% -0.8% 9.70$ 59.64$ 1,951Subtotal (Medical) 1,013.52$ N/A 372,838 4.1% 3.3% 0.8% 22.3% 22.3% 0.0% -10.3% 0.0% -10.3% 1,256.35$ N/A 347,188
CC4C LHD Payments 0.00$ 4.53$ 12 0.0% 0.0% 0.0% 0.0% 0.0% 0.0% 0.0% 0.0% 0.0% -$ 4.53$ 12OBCM LHD Payments 0.71$ 4.93$ 1,734 0.0% 0.0% 0.0% 0.0% 0.0% 0.0% 0.0% 0.0% 0.0% 0.71$ 4.93$ 1,734Medical Home Payments 4.33$ 4.81$ 10,806 0.0% 0.0% 0.0% 0.0% 0.0% 0.0% 0.0% 0.0% 0.0% 4.33$ 4.81$ 10,806Subtotal (LHD/Medical Home Payments) 5.05$ N/A 12,552 0.0% 0.0% 0.0% 0.0% 0.0% 0.0% 0.0% 0.0% 0.0% 5.05$ N/A 12,552Total (Medical + LHD/Medical Home) 1,018.58$ N/A 385,390 4.1% 3.3% 0.8% 22.2% 22.2% 0.0% -10.2% 0.0% -10.2% 1,261.40$ N/A 359,740
Note: Total Medical Calculation: M = A * [(1 + D) ^ (36/12)] * (1 + G) * (1 + J) Gross Medical PMPM/Payment:
Non-Benefit Expense PMPM/Payment:General Administration (3.82%)Care Management (3.49%)Profit/Underwriting Gain (1.75%)
Total Service Cost and Non-Benefit Load PMPM/Payment:Premium Taxes (2.01%)
Total Capitation Rate: 1,415.53$
1,261.40$
53.04$48.36$24.27$
1,387.08$28.45$
Category of ServiceBase Data Trend Program Changes Managed Care Adjustment Total Medical
Region 4Aged, Blind, Disabled
Male & Female
July 1, 2015 - June 30, 2017July 1, 2019 - June 30, 2020
36
151 of 197Prepared by Mercer GovernmentHuman Services Consulting
RFP 30-190029-DHBSection IX. Medicaid Managed Care Draft Rate Book (SFY 2020)
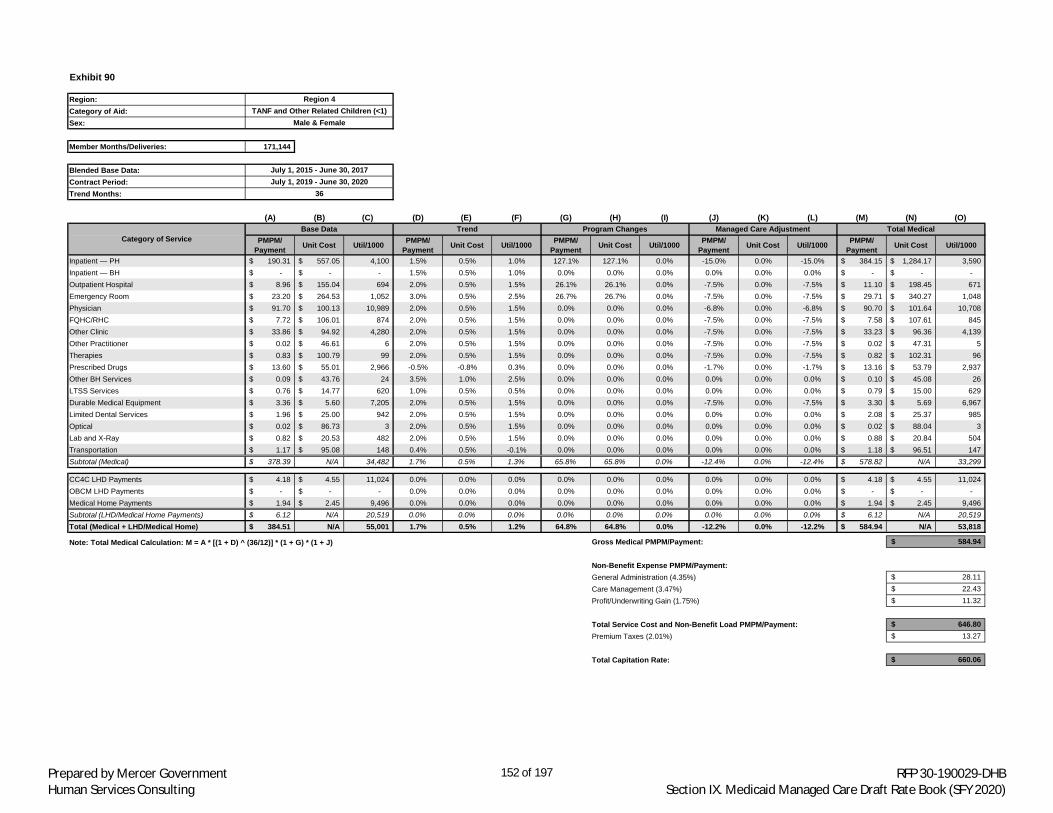
Exhibit 90
Region:Category of Aid:Sex:
Member Months/Deliveries: 171,144
Blended Base Data:Contract Period:Trend Months:
(A) (B) (C) (D) (E) (F) (G) (H) (I) (J) (K) (L) (M) (N) (O)
PMPM/Payment Unit Cost Util/1000 PMPM/
Payment Unit Cost Util/1000 PMPM/Payment Unit Cost Util/1000 PMPM/
Payment Unit Cost Util/1000 PMPM/Payment Unit Cost Util/1000
Inpatient — PH 190.31$ 557.05$ 4,100 1.5% 0.5% 1.0% 127.1% 127.1% 0.0% -15.0% 0.0% -15.0% 384.15$ 1,284.17$ 3,590Inpatient — BH -$ -$ - 1.5% 0.5% 1.0% 0.0% 0.0% 0.0% 0.0% 0.0% 0.0% -$ -$ -Outpatient Hospital 8.96$ 155.04$ 694 2.0% 0.5% 1.5% 26.1% 26.1% 0.0% -7.5% 0.0% -7.5% 11.10$ 198.45$ 671Emergency Room 23.20$ 264.53$ 1,052 3.0% 0.5% 2.5% 26.7% 26.7% 0.0% -7.5% 0.0% -7.5% 29.71$ 340.27$ 1,048Physician 91.70$ 100.13$ 10,989 2.0% 0.5% 1.5% 0.0% 0.0% 0.0% -6.8% 0.0% -6.8% 90.70$ 101.64$ 10,708FQHC/RHC 7.72$ 106.01$ 874 2.0% 0.5% 1.5% 0.0% 0.0% 0.0% -7.5% 0.0% -7.5% 7.58$ 107.61$ 845Other Clinic 33.86$ 94.92$ 4,280 2.0% 0.5% 1.5% 0.0% 0.0% 0.0% -7.5% 0.0% -7.5% 33.23$ 96.36$ 4,139Other Practitioner 0.02$ 46.61$ 6 2.0% 0.5% 1.5% 0.0% 0.0% 0.0% -7.5% 0.0% -7.5% 0.02$ 47.31$ 5Therapies 0.83$ 100.79$ 99 2.0% 0.5% 1.5% 0.0% 0.0% 0.0% -7.5% 0.0% -7.5% 0.82$ 102.31$ 96Prescribed Drugs 13.60$ 55.01$ 2,966 -0.5% -0.8% 0.3% 0.0% 0.0% 0.0% -1.7% 0.0% -1.7% 13.16$ 53.79$ 2,937Other BH Services 0.09$ 43.76$ 24 3.5% 1.0% 2.5% 0.0% 0.0% 0.0% 0.0% 0.0% 0.0% 0.10$ 45.08$ 26LTSS Services 0.76$ 14.77$ 620 1.0% 0.5% 0.5% 0.0% 0.0% 0.0% 0.0% 0.0% 0.0% 0.79$ 15.00$ 629Durable Medical Equipment 3.36$ 5.60$ 7,205 2.0% 0.5% 1.5% 0.0% 0.0% 0.0% -7.5% 0.0% -7.5% 3.30$ 5.69$ 6,967Limited Dental Services 1.96$ 25.00$ 942 2.0% 0.5% 1.5% 0.0% 0.0% 0.0% 0.0% 0.0% 0.0% 2.08$ 25.37$ 985Optical 0.02$ 86.73$ 3 2.0% 0.5% 1.5% 0.0% 0.0% 0.0% 0.0% 0.0% 0.0% 0.02$ 88.04$ 3Lab and X-Ray 0.82$ 20.53$ 482 2.0% 0.5% 1.5% 0.0% 0.0% 0.0% 0.0% 0.0% 0.0% 0.88$ 20.84$ 504Transportation 1.17$ 95.08$ 148 0.4% 0.5% -0.1% 0.0% 0.0% 0.0% 0.0% 0.0% 0.0% 1.18$ 96.51$ 147Subtotal (Medical) 378.39$ N/A 34,482 1.7% 0.5% 1.3% 65.8% 65.8% 0.0% -12.4% 0.0% -12.4% 578.82$ N/A 33,299
CC4C LHD Payments 4.18$ 4.55$ 11,024 0.0% 0.0% 0.0% 0.0% 0.0% 0.0% 0.0% 0.0% 0.0% 4.18$ 4.55$ 11,024OBCM LHD Payments -$ -$ - 0.0% 0.0% 0.0% 0.0% 0.0% 0.0% 0.0% 0.0% 0.0% -$ -$ -Medical Home Payments 1.94$ 2.45$ 9,496 0.0% 0.0% 0.0% 0.0% 0.0% 0.0% 0.0% 0.0% 0.0% 1.94$ 2.45$ 9,496Subtotal (LHD/Medical Home Payments) 6.12$ N/A 20,519 0.0% 0.0% 0.0% 0.0% 0.0% 0.0% 0.0% 0.0% 0.0% 6.12$ N/A 20,519Total (Medical + LHD/Medical Home) 384.51$ N/A 55,001 1.7% 0.5% 1.2% 64.8% 64.8% 0.0% -12.2% 0.0% -12.2% 584.94$ N/A 53,818
Note: Total Medical Calculation: M = A * [(1 + D) ^ (36/12)] * (1 + G) * (1 + J) Gross Medical PMPM/Payment:
Non-Benefit Expense PMPM/Payment:General Administration (4.35%)Care Management (3.47%)Profit/Underwriting Gain (1.75%)
Total Service Cost and Non-Benefit Load PMPM/Payment:Premium Taxes (2.01%)
Total Capitation Rate: 660.06$
584.94$
28.11$22.43$11.32$
646.80$13.27$
Category of ServiceBase Data Trend Program Changes Managed Care Adjustment Total Medical
Region 4TANF and Other Related Children (<1)
Male & Female
July 1, 2015 - June 30, 2017July 1, 2019 - June 30, 2020
36
152 of 197Prepared by Mercer GovernmentHuman Services Consulting
RFP 30-190029-DHBSection IX. Medicaid Managed Care Draft Rate Book (SFY 2020)

Exhibit 91
Region:Category of Aid:Sex:
Member Months/Deliveries: 2,661,605
Blended Base Data:Contract Period:Trend Months:
(A) (B) (C) (D) (E) (F) (G) (H) (I) (J) (K) (L) (M) (N) (O)
PMPM/Payment Unit Cost Util/1000 PMPM/
Payment Unit Cost Util/1000 PMPM/Payment Unit Cost Util/1000 PMPM/
Payment Unit Cost Util/1000 PMPM/Payment Unit Cost Util/1000
Inpatient — PH 4.03$ 1,142.94$ 42 1.5% 0.5% 1.0% 139.7% 139.7% 0.0% -15.3% 0.0% -15.3% 8.55$ 2,780.86$ 37Inpatient — BH 1.19$ 677.93$ 21 1.5% 0.5% 1.0% 0.0% 0.0% 0.0% -0.3% 0.0% -0.3% 1.25$ 688.15$ 22Outpatient Hospital 8.12$ 315.72$ 309 2.0% 0.5% 1.5% 28.2% 28.2% 0.0% -7.8% 0.0% -7.8% 10.19$ 410.93$ 298Emergency Room 13.17$ 317.30$ 498 3.0% 0.5% 2.5% 27.9% 27.9% 0.0% -7.8% 0.0% -7.8% 16.97$ 411.86$ 494Physician 19.49$ 80.97$ 2,889 2.0% 0.5% 1.5% 0.0% 0.0% 0.0% -7.1% 0.0% -7.1% 19.21$ 82.19$ 2,805FQHC/RHC 2.21$ 104.48$ 254 2.0% 0.5% 1.5% 0.0% 0.0% 0.0% -7.8% 0.0% -7.8% 2.17$ 106.06$ 245Other Clinic 5.57$ 101.19$ 660 2.0% 0.5% 1.5% 0.0% 0.0% 0.0% -7.8% 0.0% -7.8% 5.45$ 102.72$ 637Other Practitioner 0.10$ 81.57$ 14 2.0% 0.5% 1.5% 0.0% 0.0% 0.0% -7.8% 0.0% -7.8% 0.09$ 82.80$ 14Therapies 5.80$ 112.43$ 619 2.0% 0.5% 1.5% 0.0% 0.0% 0.0% -7.8% 0.0% -7.8% 5.68$ 114.13$ 597Prescribed Drugs 31.22$ 104.68$ 3,579 5.0% 4.5% 0.5% 0.0% 0.0% 0.0% -2.5% 0.0% -2.5% 35.25$ 119.45$ 3,541Other BH Services 6.18$ 82.67$ 896 3.5% 1.0% 2.5% 0.0% 0.0% 0.0% -0.3% 0.0% -0.3% 6.83$ 85.18$ 962LTSS Services 0.17$ 9.05$ 230 1.0% 0.5% 0.5% 2.6% 2.6% 0.0% -0.3% 0.0% -0.3% 0.18$ 9.43$ 233Durable Medical Equipment 1.97$ 2.89$ 8,178 2.0% 0.5% 1.5% 0.0% 0.0% 0.0% -7.8% 0.0% -7.8% 1.93$ 2.94$ 7,882Limited Dental Services 0.37$ 24.79$ 180 2.0% 0.5% 1.5% 0.0% 0.0% 0.0% -0.3% 0.0% -0.3% 0.39$ 25.17$ 188Optical 1.08$ 81.90$ 158 2.0% 0.5% 1.5% 0.0% 0.0% 0.0% -0.3% 0.0% -0.3% 1.14$ 83.14$ 165Lab and X-Ray 1.32$ 15.75$ 1,002 2.0% 0.5% 1.5% 0.0% 0.0% 0.0% -0.3% 0.0% -0.3% 1.39$ 15.99$ 1,044Transportation 0.34$ 76.95$ 53 0.4% 0.5% -0.1% 0.0% 0.0% 0.0% -0.3% 0.0% -0.3% 0.35$ 78.11$ 53Subtotal (Medical) 102.34$ N/A 19,584 3.1% 1.8% 1.3% 11.0% 11.0% 0.0% -6.1% 0.0% -6.1% 117.01$ N/A 19,216
CC4C LHD Payments 1.00$ 4.52$ 2,643 0.0% 0.0% 0.0% 0.0% 0.0% 0.0% 0.0% 0.0% 0.0% 1.00$ 4.52$ 2,643OBCM LHD Payments 0.52$ 4.92$ 1,277 0.0% 0.0% 0.0% 0.0% 0.0% 0.0% 0.0% 0.0% 0.0% 0.52$ 4.92$ 1,277Medical Home Payments 2.26$ 2.46$ 11,025 0.0% 0.0% 0.0% 0.0% 0.0% 0.0% 0.0% 0.0% 0.0% 2.26$ 2.46$ 11,025Subtotal (LHD/Medical Home Payments) 3.78$ N/A 14,945 0.0% 0.0% 0.0% 0.0% 0.0% 0.0% 0.0% 0.0% 0.0% 3.78$ N/A 14,945Total (Medical + LHD/Medical Home) 106.11$ N/A 34,529 3.0% 1.7% 1.3% 10.6% 10.6% 0.0% -5.9% 0.0% -5.9% 120.79$ N/A 34,161
Note: Total Medical Calculation: M = A * [(1 + D) ^ (36/12)] * (1 + G) * (1 + J) Gross Medical PMPM/Payment:
Non-Benefit Expense PMPM/Payment:General Administration (7.92%)Care Management (3.34%)Profit/Underwriting Gain (1.75%)
Total Service Cost and Non-Benefit Load PMPM/Payment:Premium Taxes (2.01%)
Total Capitation Rate: 141.70$
120.79$
11.00$4.63$2.43$
138.85$2.85$
Category of ServiceBase Data Trend Program Changes Managed Care Adjustment Total Medical
Region 4TANF and Other Related Children (1-20)
Male & Female
July 1, 2015 - June 30, 2017July 1, 2019 - June 30, 2020
36
153 of 197Prepared by Mercer GovernmentHuman Services Consulting
RFP 30-190029-DHBSection IX. Medicaid Managed Care Draft Rate Book (SFY 2020)
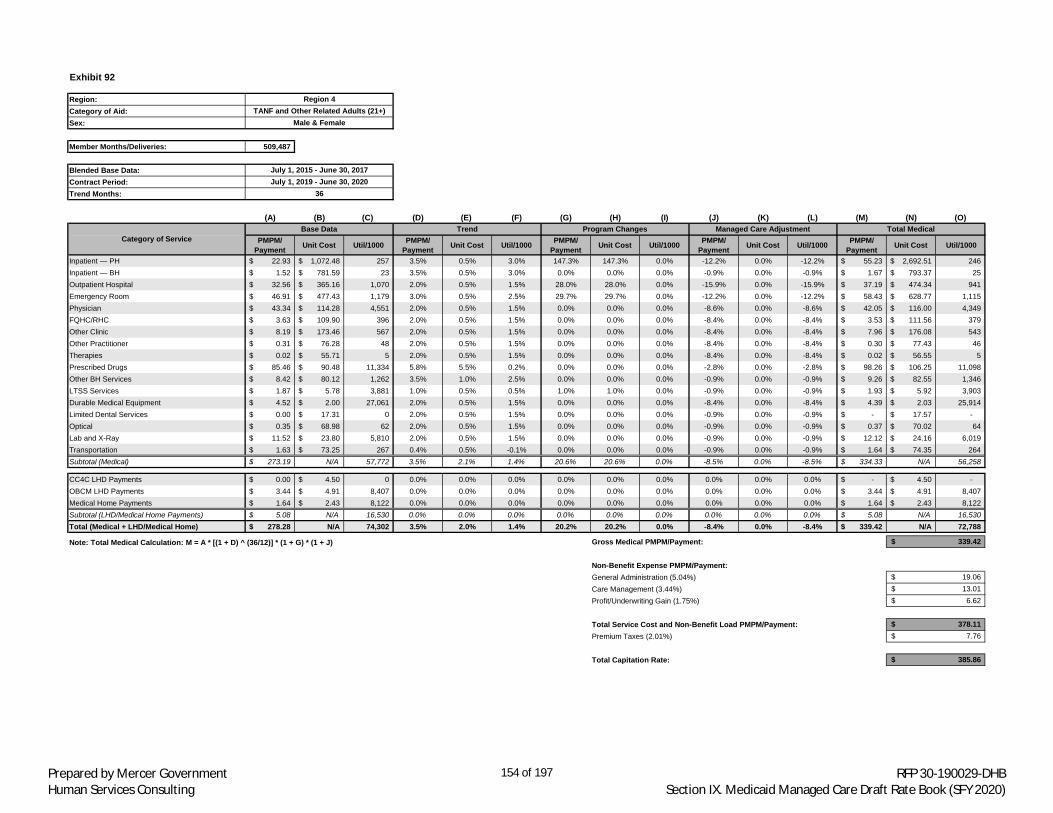
Exhibit 92
Region:Category of Aid:Sex:
Member Months/Deliveries: 509,487
Blended Base Data:Contract Period:Trend Months:
(A) (B) (C) (D) (E) (F) (G) (H) (I) (J) (K) (L) (M) (N) (O)
PMPM/Payment Unit Cost Util/1000 PMPM/
Payment Unit Cost Util/1000 PMPM/Payment Unit Cost Util/1000 PMPM/
Payment Unit Cost Util/1000 PMPM/Payment Unit Cost Util/1000
Inpatient — PH 22.93$ 1,072.48$ 257 3.5% 0.5% 3.0% 147.3% 147.3% 0.0% -12.2% 0.0% -12.2% 55.23$ 2,692.51$ 246Inpatient — BH 1.52$ 781.59$ 23 3.5% 0.5% 3.0% 0.0% 0.0% 0.0% -0.9% 0.0% -0.9% 1.67$ 793.37$ 25Outpatient Hospital 32.56$ 365.16$ 1,070 2.0% 0.5% 1.5% 28.0% 28.0% 0.0% -15.9% 0.0% -15.9% 37.19$ 474.34$ 941Emergency Room 46.91$ 477.43$ 1,179 3.0% 0.5% 2.5% 29.7% 29.7% 0.0% -12.2% 0.0% -12.2% 58.43$ 628.77$ 1,115Physician 43.34$ 114.28$ 4,551 2.0% 0.5% 1.5% 0.0% 0.0% 0.0% -8.6% 0.0% -8.6% 42.05$ 116.00$ 4,349FQHC/RHC 3.63$ 109.90$ 396 2.0% 0.5% 1.5% 0.0% 0.0% 0.0% -8.4% 0.0% -8.4% 3.53$ 111.56$ 379Other Clinic 8.19$ 173.46$ 567 2.0% 0.5% 1.5% 0.0% 0.0% 0.0% -8.4% 0.0% -8.4% 7.96$ 176.08$ 543Other Practitioner 0.31$ 76.28$ 48 2.0% 0.5% 1.5% 0.0% 0.0% 0.0% -8.4% 0.0% -8.4% 0.30$ 77.43$ 46Therapies 0.02$ 55.71$ 5 2.0% 0.5% 1.5% 0.0% 0.0% 0.0% -8.4% 0.0% -8.4% 0.02$ 56.55$ 5Prescribed Drugs 85.46$ 90.48$ 11,334 5.8% 5.5% 0.2% 0.0% 0.0% 0.0% -2.8% 0.0% -2.8% 98.26$ 106.25$ 11,098Other BH Services 8.42$ 80.12$ 1,262 3.5% 1.0% 2.5% 0.0% 0.0% 0.0% -0.9% 0.0% -0.9% 9.26$ 82.55$ 1,346LTSS Services 1.87$ 5.78$ 3,881 1.0% 0.5% 0.5% 1.0% 1.0% 0.0% -0.9% 0.0% -0.9% 1.93$ 5.92$ 3,903Durable Medical Equipment 4.52$ 2.00$ 27,061 2.0% 0.5% 1.5% 0.0% 0.0% 0.0% -8.4% 0.0% -8.4% 4.39$ 2.03$ 25,914Limited Dental Services 0.00$ 17.31$ 0 2.0% 0.5% 1.5% 0.0% 0.0% 0.0% -0.9% 0.0% -0.9% -$ 17.57$ -Optical 0.35$ 68.98$ 62 2.0% 0.5% 1.5% 0.0% 0.0% 0.0% -0.9% 0.0% -0.9% 0.37$ 70.02$ 64Lab and X-Ray 11.52$ 23.80$ 5,810 2.0% 0.5% 1.5% 0.0% 0.0% 0.0% -0.9% 0.0% -0.9% 12.12$ 24.16$ 6,019Transportation 1.63$ 73.25$ 267 0.4% 0.5% -0.1% 0.0% 0.0% 0.0% -0.9% 0.0% -0.9% 1.64$ 74.35$ 264Subtotal (Medical) 273.19$ N/A 57,772 3.5% 2.1% 1.4% 20.6% 20.6% 0.0% -8.5% 0.0% -8.5% 334.33$ N/A 56,258
CC4C LHD Payments 0.00$ 4.50$ 0 0.0% 0.0% 0.0% 0.0% 0.0% 0.0% 0.0% 0.0% 0.0% -$ 4.50$ -OBCM LHD Payments 3.44$ 4.91$ 8,407 0.0% 0.0% 0.0% 0.0% 0.0% 0.0% 0.0% 0.0% 0.0% 3.44$ 4.91$ 8,407Medical Home Payments 1.64$ 2.43$ 8,122 0.0% 0.0% 0.0% 0.0% 0.0% 0.0% 0.0% 0.0% 0.0% 1.64$ 2.43$ 8,122Subtotal (LHD/Medical Home Payments) 5.08$ N/A 16,530 0.0% 0.0% 0.0% 0.0% 0.0% 0.0% 0.0% 0.0% 0.0% 5.08$ N/A 16,530Total (Medical + LHD/Medical Home) 278.28$ N/A 74,302 3.5% 2.0% 1.4% 20.2% 20.2% 0.0% -8.4% 0.0% -8.4% 339.42$ N/A 72,788
Note: Total Medical Calculation: M = A * [(1 + D) ^ (36/12)] * (1 + G) * (1 + J) Gross Medical PMPM/Payment:
Non-Benefit Expense PMPM/Payment:General Administration (5.04%)Care Management (3.44%)Profit/Underwriting Gain (1.75%)
Total Service Cost and Non-Benefit Load PMPM/Payment:Premium Taxes (2.01%)
Total Capitation Rate: 385.86$
339.42$
19.06$13.01$6.62$
378.11$7.76$
Category of ServiceBase Data Trend Program Changes Managed Care Adjustment Total Medical
Region 4TANF and Other Related Adults (21+)
Male & Female
July 1, 2015 - June 30, 2017July 1, 2019 - June 30, 2020
36
154 of 197Prepared by Mercer GovernmentHuman Services Consulting
RFP 30-190029-DHBSection IX. Medicaid Managed Care Draft Rate Book (SFY 2020)

Exhibit 93
Region:Category of Aid:Sex:
Member Months/Deliveries: 9,785
Blended Base Data:Contract Period:Trend Months:
(A) (B) (C) (D) (E) (F) (G) (H) (I) (J) (K) (L) (M) (N) (O)
PMPM/Payment Unit Cost Util/1000 PMPM/
Payment Unit Cost Util/1000 PMPM/Payment Unit Cost Util/1000 PMPM/
Payment Unit Cost Util/1000 PMPM/Payment Unit Cost Util/1000
Inpatient — PH 2,093.45$ 740.20$ 33,939 0.5% 0.5% 0.0% 128.4% 128.4% 0.0% -1.1% 0.0% -1.1% 4,798.41$ 1,715.92$ 33,557Inpatient — BH -$ -$ - 0.5% 0.5% 0.0% 0.0% 0.0% 0.0% 0.0% 0.0% 0.0% -$ -$ -Outpatient Hospital 423.85$ 158.18$ 32,156 2.0% 0.5% 1.5% 22.9% 22.9% 0.0% -15.0% 0.0% -15.0% 469.91$ 197.34$ 28,575Emergency Room 560.31$ 405.58$ 16,578 3.0% 0.5% 2.5% 30.8% 30.8% 0.0% -11.3% 0.0% -11.3% 710.66$ 538.42$ 15,839Physician 1,617.62$ 217.64$ 89,190 2.0% 0.5% 1.5% 0.8% 0.8% 0.0% 0.0% 0.0% 0.0% 1,730.56$ 222.72$ 93,243FQHC/RHC 55.59$ 127.28$ 5,241 2.0% 0.5% 1.5% 0.0% 0.0% 0.0% 0.0% 0.0% 0.0% 59.00$ 129.20$ 5,480Other Clinic 268.71$ 163.49$ 19,724 2.0% 0.5% 1.5% 0.0% 0.0% 0.0% 0.0% 0.0% 0.0% 285.16$ 165.95$ 20,620Other Practitioner 0.00$ 40.83$ 1 2.0% 0.5% 1.5% 0.0% 0.0% 0.0% 0.0% 0.0% 0.0% -$ 41.45$ 1Therapies -$ -$ - 2.0% 0.5% 1.5% 0.0% 0.0% 0.0% 0.0% 0.0% 0.0% -$ -$ -Prescribed Drugs -$ -$ - 0.0% 0.0% 0.0% 0.0% 0.0% 0.0% 0.0% 0.0% 0.0% -$ -$ -Other BH Services 0.10$ 59.99$ 20 3.5% 1.0% 2.5% 0.0% 0.0% 0.0% 0.0% 0.0% 0.0% 0.11$ 61.81$ 22LTSS Services 1.87$ 4.43$ 5,065 1.0% 0.5% 0.5% 0.0% 0.0% 0.0% 0.0% 0.0% 0.0% 1.93$ 4.50$ 5,141Durable Medical Equipment 1.43$ 48.06$ 356 2.0% 0.5% 1.5% 0.0% 0.0% 0.0% 0.0% 0.0% 0.0% 1.51$ 48.78$ 372Limited Dental Services 0.01$ 25.18$ 4 2.0% 0.5% 1.5% 0.0% 0.0% 0.0% 0.0% 0.0% 0.0% 0.01$ 25.56$ 4Optical 0.00$ 58.20$ 0 2.0% 0.5% 1.5% 0.0% 0.0% 0.0% 0.0% 0.0% 0.0% -$ 59.08$ 1Lab and X-Ray 69.50$ 26.95$ 30,945 2.0% 0.5% 1.5% 0.0% 0.0% 0.0% 0.0% 0.0% 0.0% 73.76$ 27.36$ 32,352Transportation 13.88$ 90.71$ 1,836 0.4% 0.5% -0.1% 0.0% 0.0% 0.0% 0.0% 0.0% 0.0% 14.05$ 92.08$ 1,831Subtotal (Medical) 5,106.33$ N/A 235,056 1.5% 0.5% 1.0% 56.8% 56.8% 0.0% -2.7% 0.0% -2.7% 8,145.07$ N/A 237,036
CC4C LHD Payments -$ -$ - 0.0% 0.0% 0.0% 0.0% 0.0% 0.0% 0.0% 0.0% 0.0% -$ -$ -OBCM LHD Payments -$ -$ - 0.0% 0.0% 0.0% 0.0% 0.0% 0.0% 0.0% 0.0% 0.0% -$ -$ -Medical Home Payments -$ -$ - 0.0% 0.0% 0.0% 0.0% 0.0% 0.0% 0.0% 0.0% 0.0% -$ -$ -Subtotal (LHD/Medical Home Payments) -$ N/A - 0.0% 0.0% 0.0% 0.0% 0.0% 0.0% 0.0% 0.0% 0.0% -$ N/A -Total (Medical + LHD/Medical Home) 5,106.33$ N/A 235,056 1.5% 0.5% 1.0% 56.8% 56.8% 0.0% -2.7% 0.0% -2.7% 8,145.07$ N/A 237,036
Note: Total Medical Calculation: M = A * [(1 + D) ^ (36/12)] * (1 + G) * (1 + J) Gross Medical PMPM/Payment:
Non-Benefit Expense PMPM/Payment:General Administration (0.81%)Care Management (3.60%)Profit/Underwriting Gain (1.75%)
Total Service Cost and Non-Benefit Load PMPM/Payment:Premium Taxes (2.01%)
Total Capitation Rate: 8,857.91$
8,145.07$
70.60$312.30$151.90$
8,679.86$178.04$
Category of ServiceBase Data Trend Program Changes Managed Care Adjustment Total Medical
Region 4Maternity Event
Female
July 1, 2015 - June 30, 2017July 1, 2019 - June 30, 2020
36
155 of 197Prepared by Mercer GovernmentHuman Services Consulting
RFP 30-190029-DHBSection IX. Medicaid Managed Care Draft Rate Book (SFY 2020)

Region 5 Capitation Rate Development Exhibits14.5
156 of 197Prepared by Mercer GovernmentHuman Services Consulting
RFP 30-190029-DHBSection IX. Medicaid Managed Care Draft Rate Book (SFY 2020)

Exhibit 94
Region:Category of Aid:Sex:
Member Months/Deliveries: 309,639
Blended Base Data:Contract Period:Trend Months:
(A) (B) (C) (D) (E) (F) (G) (H) (I) (J) (K) (L) (M) (N) (O)
PMPM/Payment Unit Cost Util/1000 PMPM/
Payment Unit Cost Util/1000 PMPM/Payment Unit Cost Util/1000 PMPM/
Payment Unit Cost Util/1000 PMPM/Payment Unit Cost Util/1000
Inpatient — PH 133.02$ 956.37$ 1,669 0.5% 0.5% 0.0% 137.8% 137.8% 0.0% -15.8% 0.0% -15.8% 270.34$ 2,308.99$ 1,405Inpatient — BH 5.72$ 688.22$ 100 0.5% 0.5% 0.0% 0.0% 0.0% 0.0% -0.8% 0.0% -0.8% 5.76$ 698.60$ 99Outpatient Hospital 88.31$ 518.64$ 2,043 1.0% 0.5% 0.5% 32.5% 32.5% 0.0% -27.1% 0.0% -27.1% 87.91$ 697.46$ 1,512Emergency Room 60.17$ 476.23$ 1,516 3.0% 0.5% 2.5% 29.6% 29.6% 0.0% -19.6% 0.0% -19.6% 68.54$ 626.61$ 1,313Physician 110.96$ 138.09$ 9,642 2.0% 0.5% 1.5% 0.0% 0.0% 0.0% -9.6% 0.0% -9.6% 106.40$ 140.17$ 9,109FQHC/RHC 6.15$ 100.86$ 731 2.0% 0.5% 1.5% 0.0% 0.0% 0.0% -8.3% 0.0% -8.3% 5.98$ 102.38$ 701Other Clinic 10.65$ 437.72$ 292 2.0% 0.5% 1.5% 0.0% 0.0% 0.0% -8.3% 0.0% -8.3% 10.37$ 444.32$ 280Other Practitioner 0.89$ 76.24$ 141 2.0% 0.5% 1.5% 0.0% 0.0% 0.0% -8.3% 0.0% -8.3% 0.87$ 77.39$ 135Therapies 7.67$ 107.82$ 853 2.0% 0.5% 1.5% 0.0% 0.0% 0.0% -8.3% 0.0% -8.3% 7.46$ 109.45$ 818Prescribed Drugs 381.68$ 135.75$ 33,740 6.0% 5.5% 0.5% 0.0% 0.0% 0.0% -2.4% 0.0% -2.4% 443.68$ 159.40$ 33,400Other BH Services 16.93$ 72.15$ 2,816 3.5% 1.0% 2.5% 0.0% 0.0% 0.0% -0.8% 0.0% -0.8% 18.62$ 74.34$ 3,005LTSS Services 62.61$ 4.75$ 158,180 -0.7% 0.5% -1.2% 12.4% 12.4% 0.0% -4.6% 0.0% -4.6% 65.67$ 5.42$ 145,381Durable Medical Equipment 33.46$ 2.76$ 145,544 1.5% 0.5% 1.0% 0.0% 0.0% 0.0% -15.8% 0.0% -15.8% 29.45$ 2.80$ 126,206Limited Dental Services 0.03$ 24.85$ 17 1.5% 0.5% 1.0% 0.0% 0.0% 0.0% -0.8% 0.0% -0.8% 0.04$ 25.22$ 17Optical 1.60$ 65.55$ 294 1.5% 0.5% 1.0% 0.0% 0.0% 0.0% -0.8% 0.0% -0.8% 1.66$ 66.54$ 300Lab and X-Ray 11.56$ 24.58$ 5,643 1.5% 0.5% 1.0% 0.0% 0.0% 0.0% -0.8% 0.0% -0.8% 11.99$ 24.95$ 5,765Transportation 6.92$ 72.58$ 1,143 1.6% 0.5% 1.1% 0.0% 0.0% 0.0% -0.8% 0.0% -0.8% 7.19$ 73.67$ 1,172Subtotal (Medical) 938.33$ N/A 364,365 3.3% 2.6% 0.6% 23.5% 23.5% 0.0% -10.5% 0.0% -10.5% 1,141.92$ N/A 330,617
CC4C LHD Payments 0.01$ 4.53$ 13 0.0% 0.0% 0.0% 0.0% 0.0% 0.0% 0.0% 0.0% 0.0% 0.01$ 4.53$ 13OBCM LHD Payments 0.74$ 4.93$ 1,811 0.0% 0.0% 0.0% 0.0% 0.0% 0.0% 0.0% 0.0% 0.0% 0.74$ 4.93$ 1,811Medical Home Payments 4.35$ 4.76$ 10,946 0.0% 0.0% 0.0% 0.0% 0.0% 0.0% 0.0% 0.0% 0.0% 4.35$ 4.76$ 10,946Subtotal (LHD/Medical Home Payments) 5.10$ N/A 12,771 0.0% 0.0% 0.0% 0.0% 0.0% 0.0% 0.0% 0.0% 0.0% 5.10$ N/A 12,771Total (Medical + LHD/Medical Home) 943.43$ N/A 377,135 3.2% 2.6% 0.6% 23.4% 23.4% 0.0% -10.4% 0.0% -10.4% 1,147.01$ N/A 343,388
Note: Total Medical Calculation: M = A * [(1 + D) ^ (36/12)] * (1 + G) * (1 + J) Gross Medical PMPM/Payment:
Non-Benefit Expense PMPM/Payment:General Administration (3.55%)Care Management (3.13%)Profit/Underwriting Gain (1.75%)
Total Service Cost and Non-Benefit Load PMPM/Payment:Premium Taxes (2.01%)
Total Capitation Rate: 1,278.26$
1,147.01$
44.42$39.22$21.92$
1,252.56$25.69$
Category of ServiceBase Data Trend Program Changes Managed Care Adjustment Total Medical
Region 5Aged, Blind, Disabled
Male & Female
July 1, 2015 - June 30, 2017July 1, 2019 - June 30, 2020
36
157 of 197Prepared by Mercer GovernmentHuman Services Consulting
RFP 30-190029-DHBSection IX. Medicaid Managed Care Draft Rate Book (SFY 2020)

Exhibit 95
Region:Category of Aid:Sex:
Member Months/Deliveries: 135,338
Blended Base Data:Contract Period:Trend Months:
(A) (B) (C) (D) (E) (F) (G) (H) (I) (J) (K) (L) (M) (N) (O)
PMPM/Payment Unit Cost Util/1000 PMPM/
Payment Unit Cost Util/1000 PMPM/Payment Unit Cost Util/1000 PMPM/
Payment Unit Cost Util/1000 PMPM/Payment Unit Cost Util/1000
Inpatient — PH 198.39$ 541.57$ 4,396 1.5% 0.5% 1.0% 158.4% 158.4% 0.0% -15.0% 0.0% -15.0% 455.55$ 1,420.24$ 3,849Inpatient — BH -$ -$ - 1.5% 0.5% 1.0% 0.0% 0.0% 0.0% 0.0% 0.0% 0.0% -$ -$ -Outpatient Hospital 7.84$ 128.58$ 732 1.0% 0.5% 0.5% 29.1% 29.1% 0.0% -7.5% 0.0% -7.5% 9.65$ 168.50$ 687Emergency Room 21.24$ 213.83$ 1,192 3.0% 0.5% 2.5% 26.2% 26.2% 0.0% -7.5% 0.0% -7.5% 27.09$ 273.96$ 1,187Physician 97.61$ 103.51$ 11,316 2.0% 0.5% 1.5% 0.0% 0.0% 0.0% -6.8% 0.0% -6.8% 96.54$ 105.07$ 11,026FQHC/RHC 3.18$ 100.01$ 381 2.0% 0.5% 1.5% 0.0% 0.0% 0.0% -7.5% 0.0% -7.5% 3.12$ 101.52$ 368Other Clinic 34.93$ 93.67$ 4,476 2.0% 0.5% 1.5% 0.0% 0.0% 0.0% -7.5% 0.0% -7.5% 34.29$ 95.08$ 4,328Other Practitioner 0.02$ 71.76$ 4 2.0% 0.5% 1.5% 0.0% 0.0% 0.0% -7.5% 0.0% -7.5% 0.02$ 72.84$ 4Therapies 0.89$ 81.02$ 132 2.0% 0.5% 1.5% 0.0% 0.0% 0.0% -7.5% 0.0% -7.5% 0.88$ 82.24$ 128Prescribed Drugs 16.28$ 46.43$ 4,208 -1.0% -1.0% 0.0% 0.0% 0.0% 0.0% -1.7% 0.0% -1.7% 15.53$ 45.05$ 4,136Other BH Services 0.14$ 24.17$ 72 3.5% 1.0% 2.5% 0.0% 0.0% 0.0% 0.0% 0.0% 0.0% 0.16$ 24.90$ 77LTSS Services 0.36$ 18.84$ 229 -0.7% 0.5% -1.2% 0.0% 0.0% 0.0% 0.0% 0.0% 0.0% 0.35$ 19.12$ 220Durable Medical Equipment 3.88$ 3.62$ 12,863 1.5% 0.5% 1.0% 0.0% 0.0% 0.0% -7.5% 0.0% -7.5% 3.75$ 3.67$ 12,257Limited Dental Services 2.30$ 24.96$ 1,104 1.5% 0.5% 1.0% 0.0% 0.0% 0.0% 0.0% 0.0% 0.0% 2.40$ 25.33$ 1,137Optical 0.08$ 78.39$ 13 1.5% 0.5% 1.0% 0.0% 0.0% 0.0% 0.0% 0.0% 0.0% 0.09$ 79.57$ 13Lab and X-Ray 0.88$ 25.81$ 410 1.5% 0.5% 1.0% 0.0% 0.0% 0.0% 0.0% 0.0% 0.0% 0.92$ 26.20$ 422Transportation 1.68$ 159.80$ 126 1.6% 0.5% 1.1% 0.0% 0.0% 0.0% 0.0% 0.0% 0.0% 1.76$ 162.21$ 130Subtotal (Medical) 389.71$ N/A 41,653 1.6% 0.4% 1.2% 82.3% 82.3% 0.0% -12.6% 0.0% -12.6% 652.11$ N/A 39,971
CC4C LHD Payments 4.19$ 4.55$ 11,043 0.0% 0.0% 0.0% 0.0% 0.0% 0.0% 0.0% 0.0% 0.0% 4.19$ 4.55$ 11,043OBCM LHD Payments -$ -$ - 0.0% 0.0% 0.0% 0.0% 0.0% 0.0% 0.0% 0.0% 0.0% -$ -$ -Medical Home Payments 1.98$ 2.46$ 9,682 0.0% 0.0% 0.0% 0.0% 0.0% 0.0% 0.0% 0.0% 0.0% 1.98$ 2.46$ 9,682Subtotal (LHD/Medical Home Payments) 6.17$ N/A 20,725 0.0% 0.0% 0.0% 0.0% 0.0% 0.0% 0.0% 0.0% 0.0% 6.17$ N/A 20,725Total (Medical + LHD/Medical Home) 395.87$ N/A 62,378 1.6% 0.4% 1.2% 81.1% 81.1% 0.0% -12.5% 0.0% -12.5% 658.27$ N/A 60,695
Note: Total Medical Calculation: M = A * [(1 + D) ^ (36/12)] * (1 + G) * (1 + J) Gross Medical PMPM/Payment:
Non-Benefit Expense PMPM/Payment:General Administration (3.92%)Care Management (3.12%)Profit/Underwriting Gain (1.75%)
Total Service Cost and Non-Benefit Load PMPM/Payment:Premium Taxes (2.01%)
Total Capitation Rate: 736.49$
658.27$
28.28$22.51$12.63$
721.69$14.80$
Category of ServiceBase Data Trend Program Changes Managed Care Adjustment Total Medical
Region 5TANF and Other Related Children (<1)
Male & Female
July 1, 2015 - June 30, 2017July 1, 2019 - June 30, 2020
36
158 of 197Prepared by Mercer GovernmentHuman Services Consulting
RFP 30-190029-DHBSection IX. Medicaid Managed Care Draft Rate Book (SFY 2020)

Exhibit 96
Region:Category of Aid:Sex:
Member Months/Deliveries: 2,183,299
Blended Base Data:Contract Period:Trend Months:
(A) (B) (C) (D) (E) (F) (G) (H) (I) (J) (K) (L) (M) (N) (O)
PMPM/Payment Unit Cost Util/1000 PMPM/
Payment Unit Cost Util/1000 PMPM/Payment Unit Cost Util/1000 PMPM/
Payment Unit Cost Util/1000 PMPM/Payment Unit Cost Util/1000
Inpatient — PH 5.20$ 1,165.36$ 54 1.5% 0.5% 1.0% 130.3% 130.3% 0.0% -15.3% 0.0% -15.3% 10.60$ 2,723.82$ 47Inpatient — BH 0.82$ 660.11$ 15 1.5% 0.5% 1.0% 0.0% 0.0% 0.0% -0.3% 0.0% -0.3% 0.86$ 670.06$ 15Outpatient Hospital 7.63$ 281.40$ 325 1.0% 0.5% 0.5% 26.9% 26.9% 0.0% -7.8% 0.0% -7.8% 9.20$ 362.62$ 304Emergency Room 13.39$ 266.59$ 603 3.0% 0.5% 2.5% 27.3% 27.3% 0.0% -7.8% 0.0% -7.8% 17.18$ 344.59$ 598Physician 20.89$ 75.62$ 3,315 2.0% 0.5% 1.5% 0.0% 0.0% 0.0% -7.1% 0.0% -7.1% 20.59$ 76.76$ 3,219FQHC/RHC 1.36$ 93.95$ 174 2.0% 0.5% 1.5% 0.0% 0.0% 0.0% -7.8% 0.0% -7.8% 1.33$ 95.37$ 168Other Clinic 5.67$ 101.76$ 668 2.0% 0.5% 1.5% 0.0% 0.0% 0.0% -7.8% 0.0% -7.8% 5.55$ 103.29$ 644Other Practitioner 0.10$ 83.85$ 14 2.0% 0.5% 1.5% 0.0% 0.0% 0.0% -7.8% 0.0% -7.8% 0.10$ 85.11$ 13Therapies 6.24$ 104.99$ 714 2.0% 0.5% 1.5% 0.0% 0.0% 0.0% -7.8% 0.0% -7.8% 6.11$ 106.58$ 688Prescribed Drugs 36.30$ 92.19$ 4,725 3.5% 3.0% 0.5% 0.0% 0.0% 0.0% -2.5% 0.0% -2.5% 39.25$ 100.74$ 4,676Other BH Services 5.84$ 77.45$ 905 3.5% 1.0% 2.5% 0.0% 0.0% 0.0% -0.3% 0.0% -0.3% 6.46$ 79.80$ 971LTSS Services 0.12$ 7.41$ 199 -0.7% 0.5% -1.2% 2.6% 2.6% 0.0% -0.3% 0.0% -0.3% 0.12$ 7.72$ 191Durable Medical Equipment 1.67$ 2.52$ 7,917 1.5% 0.5% 1.0% 0.0% 0.0% 0.0% -7.8% 0.0% -7.8% 1.61$ 2.56$ 7,519Limited Dental Services 0.46$ 24.79$ 222 1.5% 0.5% 1.0% 0.0% 0.0% 0.0% -0.3% 0.0% -0.3% 0.48$ 25.17$ 228Optical 1.35$ 81.66$ 199 1.5% 0.5% 1.0% 0.0% 0.0% 0.0% -0.3% 0.0% -0.3% 1.41$ 82.89$ 204Lab and X-Ray 1.28$ 20.86$ 737 1.5% 0.5% 1.0% 0.0% 0.0% 0.0% -0.3% 0.0% -0.3% 1.34$ 21.17$ 757Transportation 0.46$ 96.87$ 57 1.6% 0.5% 1.1% 0.0% 0.0% 0.0% -0.3% 0.0% -0.3% 0.48$ 98.33$ 59Subtotal (Medical) 108.79$ N/A 20,843 2.6% 1.4% 1.2% 11.2% 11.2% 0.0% -6.1% 0.0% -6.1% 122.66$ N/A 20,303
CC4C LHD Payments 0.98$ 4.52$ 2,597 0.0% 0.0% 0.0% 0.0% 0.0% 0.0% 0.0% 0.0% 0.0% 0.98$ 4.52$ 2,597OBCM LHD Payments 0.58$ 4.92$ 1,421 0.0% 0.0% 0.0% 0.0% 0.0% 0.0% 0.0% 0.0% 0.0% 0.58$ 4.92$ 1,421Medical Home Payments 2.28$ 2.45$ 11,177 0.0% 0.0% 0.0% 0.0% 0.0% 0.0% 0.0% 0.0% 0.0% 2.28$ 2.45$ 11,177Subtotal (LHD/Medical Home Payments) 3.84$ N/A 15,195 0.0% 0.0% 0.0% 0.0% 0.0% 0.0% 0.0% 0.0% 0.0% 3.84$ N/A 15,195Total (Medical + LHD/Medical Home) 112.63$ N/A 36,038 2.5% 1.3% 1.2% 10.9% 10.9% 0.0% -5.9% 0.0% -5.9% 126.50$ N/A 35,498
Note: Total Medical Calculation: M = A * [(1 + D) ^ (36/12)] * (1 + G) * (1 + J) Gross Medical PMPM/Payment:
Non-Benefit Expense PMPM/Payment:General Administration (7.44%)Care Management (3.00%)Profit/Underwriting Gain (1.75%)
Total Service Cost and Non-Benefit Load PMPM/Payment:Premium Taxes (2.01%)
Total Capitation Rate: 147.03$
126.50$
10.72$4.33$2.52$
144.07$2.96$
Category of ServiceBase Data Trend Program Changes Managed Care Adjustment Total Medical
Region 5TANF and Other Related Children (1-20)
Male & Female
July 1, 2015 - June 30, 2017July 1, 2019 - June 30, 2020
36
159 of 197Prepared by Mercer GovernmentHuman Services Consulting
RFP 30-190029-DHBSection IX. Medicaid Managed Care Draft Rate Book (SFY 2020)

Exhibit 97
Region:Category of Aid:Sex:
Member Months/Deliveries: 540,587
Blended Base Data:Contract Period:Trend Months:
(A) (B) (C) (D) (E) (F) (G) (H) (I) (J) (K) (L) (M) (N) (O)
PMPM/Payment Unit Cost Util/1000 PMPM/
Payment Unit Cost Util/1000 PMPM/Payment Unit Cost Util/1000 PMPM/
Payment Unit Cost Util/1000 PMPM/Payment Unit Cost Util/1000
Inpatient — PH 25.56$ 1,056.63$ 290 3.5% 0.5% 3.0% 151.0% 151.0% 0.0% -12.2% 0.0% -12.2% 62.50$ 2,692.07$ 279Inpatient — BH 2.18$ 720.15$ 36 3.5% 0.5% 3.0% 0.0% 0.0% 0.0% -0.9% 0.0% -0.9% 2.39$ 731.00$ 39Outpatient Hospital 30.10$ 344.33$ 1,049 1.0% 0.5% 0.5% 34.8% 34.8% 0.0% -15.9% 0.0% -15.9% 35.15$ 471.05$ 895Emergency Room 45.78$ 428.39$ 1,282 3.0% 0.5% 2.5% 30.2% 30.2% 0.0% -12.2% 0.0% -12.2% 57.24$ 566.38$ 1,213Physician 53.98$ 116.47$ 5,562 2.0% 0.5% 1.5% 0.0% 0.0% 0.0% -8.3% 0.0% -8.3% 52.51$ 118.22$ 5,330FQHC/RHC 3.56$ 98.24$ 434 2.0% 0.5% 1.5% 0.0% 0.0% 0.0% -8.4% 0.0% -8.4% 3.46$ 99.72$ 416Other Clinic 6.99$ 229.11$ 366 2.0% 0.5% 1.5% 0.0% 0.0% 0.0% -8.4% 0.0% -8.4% 6.80$ 232.56$ 351Other Practitioner 0.34$ 74.06$ 55 2.0% 0.5% 1.5% 0.0% 0.0% 0.0% -8.4% 0.0% -8.4% 0.33$ 75.17$ 53Therapies 0.03$ 56.72$ 6 2.0% 0.5% 1.5% 0.0% 0.0% 0.0% -8.4% 0.0% -8.4% 0.03$ 57.58$ 6Prescribed Drugs 100.69$ 84.52$ 14,295 5.8% 5.5% 0.2% 0.0% 0.0% 0.0% -2.8% 0.0% -2.8% 115.77$ 99.25$ 13,997Other BH Services 8.03$ 74.65$ 1,291 3.5% 1.0% 2.5% 0.0% 0.0% 0.0% -0.9% 0.0% -0.9% 8.82$ 76.91$ 1,377LTSS Services 2.09$ 5.06$ 4,942 -0.7% 0.5% -1.2% 1.0% 1.0% 0.0% -0.9% 0.0% -0.9% 2.04$ 5.19$ 4,717Durable Medical Equipment 5.23$ 2.45$ 25,588 1.5% 0.5% 1.0% 0.0% 0.0% 0.0% -8.4% 0.0% -8.4% 5.01$ 2.49$ 24,146Limited Dental Services 0.00$ 15.40$ 0 1.5% 0.5% 1.0% 0.0% 0.0% 0.0% -0.9% 0.0% -0.9% -$ 15.63$ -Optical 0.55$ 64.90$ 101 1.5% 0.5% 1.0% 0.0% 0.0% 0.0% -0.9% 0.0% -0.9% 0.57$ 65.88$ 103Lab and X-Ray 14.42$ 27.68$ 6,252 1.5% 0.5% 1.0% 0.0% 0.0% 0.0% -0.9% 0.0% -0.9% 14.95$ 28.10$ 6,383Transportation 1.79$ 90.32$ 238 1.6% 0.5% 1.1% 0.0% 0.0% 0.0% -0.9% 0.0% -0.9% 1.86$ 91.68$ 243Subtotal (Medical) 301.32$ N/A 61,789 3.5% 2.2% 1.2% 20.6% 20.6% 0.0% -8.2% 0.0% -8.2% 369.42$ N/A 59,547
CC4C LHD Payments 0.00$ 4.29$ 0 0.0% 0.0% 0.0% 0.0% 0.0% 0.0% 0.0% 0.0% 0.0% -$ 4.29$ -OBCM LHD Payments 3.44$ 4.91$ 8,406 0.0% 0.0% 0.0% 0.0% 0.0% 0.0% 0.0% 0.0% 0.0% 3.44$ 4.91$ 8,406Medical Home Payments 1.82$ 2.41$ 9,096 0.0% 0.0% 0.0% 0.0% 0.0% 0.0% 0.0% 0.0% 0.0% 1.82$ 2.41$ 9,096Subtotal (LHD/Medical Home Payments) 5.26$ N/A 17,502 0.0% 0.0% 0.0% 0.0% 0.0% 0.0% 0.0% 0.0% 0.0% 5.26$ N/A 17,502Total (Medical + LHD/Medical Home) 306.58$ N/A 79,290 3.4% 2.2% 1.2% 20.3% 20.3% 0.0% -8.1% 0.0% -8.1% 374.69$ N/A 77,049
Note: Total Medical Calculation: M = A * [(1 + D) ^ (36/12)] * (1 + G) * (1 + J) Gross Medical PMPM/Payment:
Non-Benefit Expense PMPM/Payment:General Administration (4.57%)Care Management (3.10%)Profit/Underwriting Gain (1.75%)
Total Service Cost and Non-Benefit Load PMPM/Payment:Premium Taxes (2.01%)
Total Capitation Rate: 422.14$
374.69$
18.92$12.81$7.24$
413.65$8.48$
Category of ServiceBase Data Trend Program Changes Managed Care Adjustment Total Medical
Region 5TANF and Other Related Adults (21+)
Male & Female
July 1, 2015 - June 30, 2017July 1, 2019 - June 30, 2020
36
160 of 197Prepared by Mercer GovernmentHuman Services Consulting
RFP 30-190029-DHBSection IX. Medicaid Managed Care Draft Rate Book (SFY 2020)

Exhibit 98
Region:Category of Aid:Sex:
Member Months/Deliveries: 8,871
Blended Base Data:Contract Period:Trend Months:
(A) (B) (C) (D) (E) (F) (G) (H) (I) (J) (K) (L) (M) (N) (O)
PMPM/Payment Unit Cost Util/1000 PMPM/
Payment Unit Cost Util/1000 PMPM/Payment Unit Cost Util/1000 PMPM/
Payment Unit Cost Util/1000 PMPM/Payment Unit Cost Util/1000
Inpatient — PH 2,193.63$ 728.98$ 36,110 0.5% 0.5% 0.0% 177.4% 177.4% 0.0% -1.1% 0.0% -1.1% 6,108.10$ 2,052.92$ 35,704Inpatient — BH -$ -$ - 0.5% 0.5% 0.0% 0.0% 0.0% 0.0% 0.0% 0.0% 0.0% -$ -$ -Outpatient Hospital 364.84$ 123.36$ 35,489 1.0% 0.5% 0.5% 38.4% 38.4% 0.0% -15.0% 0.0% -15.0% 442.21$ 173.31$ 30,618Emergency Room 494.61$ 359.72$ 16,500 3.0% 0.5% 2.5% 32.0% 32.0% 0.0% -11.3% 0.0% -11.3% 633.12$ 481.96$ 15,764Physician 1,842.99$ 244.06$ 90,616 2.0% 0.5% 1.5% 0.8% 0.8% 0.0% 0.0% 0.0% 0.0% 1,971.67$ 249.75$ 94,734FQHC/RHC 48.15$ 147.88$ 3,908 2.0% 0.5% 1.5% 0.0% 0.0% 0.0% 0.0% 0.0% 0.0% 51.10$ 150.11$ 4,085Other Clinic 121.52$ 130.54$ 11,170 2.0% 0.5% 1.5% 0.0% 0.0% 0.0% 0.0% 0.0% 0.0% 128.95$ 132.51$ 11,678Other Practitioner 0.00$ 39.70$ 0 2.0% 0.5% 1.5% 0.0% 0.0% 0.0% 0.0% 0.0% 0.0% -$ 40.29$ -Therapies 0.03$ 50.54$ 8 2.0% 0.5% 1.5% 0.0% 0.0% 0.0% 0.0% 0.0% 0.0% 0.04$ 51.30$ 8Prescribed Drugs -$ -$ - 0.0% 0.0% 0.0% 0.0% 0.0% 0.0% 0.0% 0.0% 0.0% -$ -$ -Other BH Services 0.01$ 53.51$ 3 3.5% 1.0% 2.5% 0.0% 0.0% 0.0% 0.0% 0.0% 0.0% 0.02$ 55.14$ 4LTSS Services 2.79$ 4.71$ 7,100 -0.7% 0.5% -1.2% 0.0% 0.0% 0.0% 0.0% 0.0% 0.0% 2.73$ 4.78$ 6,838Durable Medical Equipment 4.24$ 48.05$ 1,060 1.5% 0.5% 1.0% 0.0% 0.0% 0.0% 0.0% 0.0% 0.0% 4.44$ 48.77$ 1,092Limited Dental Services 0.00$ 24.88$ 2 1.5% 0.5% 1.0% 0.0% 0.0% 0.0% 0.0% 0.0% 0.0% 0.01$ 25.26$ 2Optical 0.01$ 74.25$ 2 1.5% 0.5% 1.0% 0.0% 0.0% 0.0% 0.0% 0.0% 0.0% 0.01$ 75.37$ 2Lab and X-Ray 53.28$ 27.25$ 23,468 1.5% 0.5% 1.0% 0.0% 0.0% 0.0% 0.0% 0.0% 0.0% 55.72$ 27.66$ 24,175Transportation 19.34$ 110.73$ 2,095 1.6% 0.5% 1.1% 0.0% 0.0% 0.0% 0.0% 0.0% 0.0% 20.28$ 112.40$ 2,165Subtotal (Medical) 5,145.45$ N/A 227,532 1.4% 0.5% 0.9% 79.9% 79.9% 0.0% -2.4% 0.0% -2.4% 9,418.38$ N/A 226,870
CC4C LHD Payments -$ -$ - 0.0% 0.0% 0.0% 0.0% 0.0% 0.0% 0.0% 0.0% 0.0% -$ -$ -OBCM LHD Payments -$ -$ - 0.0% 0.0% 0.0% 0.0% 0.0% 0.0% 0.0% 0.0% 0.0% -$ -$ -Medical Home Payments -$ -$ - 0.0% 0.0% 0.0% 0.0% 0.0% 0.0% 0.0% 0.0% 0.0% -$ -$ -Subtotal (LHD/Medical Home Payments) -$ N/A - 0.0% 0.0% 0.0% 0.0% 0.0% 0.0% 0.0% 0.0% 0.0% -$ N/A -Total (Medical + LHD/Medical Home) 5,145.45$ N/A 227,532 1.4% 0.5% 0.9% 79.9% 79.9% 0.0% -2.4% 0.0% -2.4% 9,418.38$ N/A 226,870
Note: Total Medical Calculation: M = A * [(1 + D) ^ (36/12)] * (1 + G) * (1 + J) Gross Medical PMPM/Payment:
Non-Benefit Expense PMPM/Payment:General Administration (0.73%)Care Management (3.22%)Profit/Underwriting Gain (1.75%)
Total Service Cost and Non-Benefit Load PMPM/Payment:Premium Taxes (2.01%)
Total Capitation Rate: 10,192.86$
9,418.38$
72.80$322.02$174.79$
9,987.98$204.88$
Category of ServiceBase Data Trend Program Changes Managed Care Adjustment Total Medical
Region 5Maternity Event
Female
July 1, 2015 - June 30, 2017July 1, 2019 - June 30, 2020
36
161 of 197Prepared by Mercer GovernmentHuman Services Consulting
RFP 30-190029-DHBSection IX. Medicaid Managed Care Draft Rate Book (SFY 2020)

Region 6 Capitation Rate Development Exhibits14.6
162 of 197Prepared by Mercer GovernmentHuman Services Consulting
RFP 30-190029-DHBSection IX. Medicaid Managed Care Draft Rate Book (SFY 2020)

Exhibit 99
Region:Category of Aid:Sex:
Member Months/Deliveries: 267,136
Blended Base Data:Contract Period:Trend Months:
(A) (B) (C) (D) (E) (F) (G) (H) (I) (J) (K) (L) (M) (N) (O)
PMPM/Payment Unit Cost Util/1000 PMPM/
Payment Unit Cost Util/1000 PMPM/Payment Unit Cost Util/1000 PMPM/
Payment Unit Cost Util/1000 PMPM/Payment Unit Cost Util/1000
Inpatient — PH 126.88$ 984.78$ 1,546 0.5% 0.5% 0.0% 80.4% 80.4% 0.0% -15.8% 0.0% -15.8% 195.55$ 1,803.15$ 1,301Inpatient — BH 8.06$ 739.88$ 131 0.5% 0.5% 0.0% 0.0% 0.0% 0.0% -0.8% 0.0% -0.8% 8.12$ 751.03$ 130Outpatient Hospital 73.69$ 555.98$ 1,590 2.5% 0.5% 2.0% 20.9% 20.9% 0.0% -23.3% 0.0% -23.3% 73.59$ 682.56$ 1,294Emergency Room 60.23$ 502.10$ 1,439 3.0% 0.5% 2.5% 22.8% 22.8% 0.0% -19.6% 0.0% -19.6% 64.98$ 625.74$ 1,246Physician 102.52$ 144.05$ 8,540 2.0% 0.5% 1.5% 0.0% 0.0% 0.0% -8.6% 0.0% -8.6% 99.44$ 146.22$ 8,161FQHC/RHC 7.59$ 105.38$ 864 2.0% 0.5% 1.5% 0.0% 0.0% 0.0% -8.3% 0.0% -8.3% 7.38$ 106.97$ 828Other Clinic 13.59$ 479.94$ 340 2.0% 0.5% 1.5% 0.0% 0.0% 0.0% -8.3% 0.0% -8.3% 13.22$ 487.18$ 326Other Practitioner 0.92$ 73.79$ 150 2.0% 0.5% 1.5% 0.0% 0.0% 0.0% -8.3% 0.0% -8.3% 0.90$ 74.90$ 144Therapies 4.90$ 114.78$ 512 2.0% 0.5% 1.5% 0.0% 0.0% 0.0% -8.3% 0.0% -8.3% 4.76$ 116.51$ 491Prescribed Drugs 361.87$ 137.61$ 31,556 6.5% 6.0% 0.5% 0.0% 0.0% 0.0% -2.4% 0.0% -2.4% 426.63$ 163.89$ 31,237Other BH Services 11.97$ 58.63$ 2,450 2.5% 1.0% 1.5% 0.0% 0.0% 0.0% -0.8% 0.0% -0.8% 12.78$ 60.41$ 2,539LTSS Services 63.78$ 5.18$ 147,724 0.0% 0.5% -0.5% 12.4% 12.4% 0.0% -4.6% 0.0% -4.6% 68.43$ 5.91$ 138,872Durable Medical Equipment 35.69$ 2.88$ 148,872 1.0% 0.5% 0.5% 0.0% 0.0% 0.0% -15.8% 0.0% -15.8% 30.95$ 2.92$ 127,193Limited Dental Services 0.03$ 24.79$ 17 1.0% 0.5% 0.5% 0.0% 0.0% 0.0% -0.8% 0.0% -0.8% 0.04$ 25.17$ 17Optical 1.34$ 70.15$ 229 1.0% 0.5% 0.5% 0.0% 0.0% 0.0% -0.8% 0.0% -0.8% 1.37$ 71.21$ 231Lab and X-Ray 9.43$ 21.46$ 5,270 1.0% 0.5% 0.5% 0.0% 0.0% 0.0% -0.8% 0.0% -0.8% 9.63$ 21.79$ 5,305Transportation 9.36$ 60.14$ 1,867 0.4% 0.5% -0.1% 0.0% 0.0% 0.0% -0.8% 0.0% -0.8% 9.39$ 61.04$ 1,846Subtotal (Medical) 891.83$ N/A 353,097 3.6% 2.8% 0.8% 14.4% 14.4% 0.0% -9.4% 0.0% -9.4% 1,027.17$ N/A 321,160
CC4C LHD Payments 0.00$ 4.53$ 12 0.0% 0.0% 0.0% 0.0% 0.0% 0.0% 0.0% 0.0% 0.0% -$ 4.53$ 12OBCM LHD Payments 0.74$ 4.93$ 1,797 0.0% 0.0% 0.0% 0.0% 0.0% 0.0% 0.0% 0.0% 0.0% 0.74$ 4.93$ 1,797Medical Home Payments 4.43$ 4.79$ 11,106 0.0% 0.0% 0.0% 0.0% 0.0% 0.0% 0.0% 0.0% 0.0% 4.43$ 4.79$ 11,106Subtotal (LHD/Medical Home Payments) 5.17$ N/A 12,914 0.0% 0.0% 0.0% 0.0% 0.0% 0.0% 0.0% 0.0% 0.0% 5.17$ N/A 12,914Total (Medical + LHD/Medical Home) 897.01$ N/A 366,012 3.5% 2.8% 0.8% 14.4% 14.4% 0.0% -9.4% 0.0% -9.4% 1,032.35$ N/A 334,074
Note: Total Medical Calculation: M = A * [(1 + D) ^ (36/12)] * (1 + G) * (1 + J) Gross Medical PMPM/Payment:
Non-Benefit Expense PMPM/Payment:General Administration (3.88%)Care Management (3.43%)Profit/Underwriting Gain (1.75%)
Total Service Cost and Non-Benefit Load PMPM/Payment:Premium Taxes (2.01%)
Total Capitation Rate: 1,158.50$
1,032.35$
44.08$38.92$19.87$
1,135.21$23.29$
Category of ServiceBase Data Trend Program Changes Managed Care Adjustment Total Medical
Region 6Aged, Blind, Disabled
Male & Female
July 1, 2015 - June 30, 2017July 1, 2019 - June 30, 2020
36
163 of 197Prepared by Mercer GovernmentHuman Services Consulting
RFP 30-190029-DHBSection IX. Medicaid Managed Care Draft Rate Book (SFY 2020)

Exhibit 100
Region:Category of Aid:Sex:
Member Months/Deliveries: 108,992
Blended Base Data:Contract Period:Trend Months:
(A) (B) (C) (D) (E) (F) (G) (H) (I) (J) (K) (L) (M) (N) (O)
PMPM/Payment Unit Cost Util/1000 PMPM/
Payment Unit Cost Util/1000 PMPM/Payment Unit Cost Util/1000 PMPM/
Payment Unit Cost Util/1000 PMPM/Payment Unit Cost Util/1000
Inpatient — PH 186.59$ 563.87$ 3,971 1.5% 0.5% 1.0% 80.6% 80.6% 0.0% -15.0% 0.0% -15.0% 299.59$ 1,033.95$ 3,477Inpatient — BH -$ -$ - 1.5% 0.5% 1.0% 0.0% 0.0% 0.0% 0.0% 0.0% 0.0% -$ -$ -Outpatient Hospital 9.46$ 177.29$ 640 2.5% 0.5% 2.0% 14.7% 14.7% 0.0% -3.8% 0.0% -3.8% 11.25$ 206.49$ 654Emergency Room 23.56$ 250.58$ 1,128 3.0% 0.5% 2.5% 19.7% 19.7% 0.0% -7.5% 0.0% -7.5% 28.51$ 304.52$ 1,123Physician 85.63$ 99.31$ 10,346 2.0% 0.5% 1.5% 0.0% 0.0% 0.0% -6.6% 0.0% -6.6% 84.83$ 100.81$ 10,098FQHC/RHC 5.93$ 104.62$ 680 2.0% 0.5% 1.5% 0.0% 0.0% 0.0% -7.5% 0.0% -7.5% 5.82$ 106.20$ 658Other Clinic 39.15$ 107.87$ 4,355 2.0% 0.5% 1.5% 0.0% 0.0% 0.0% -7.5% 0.0% -7.5% 38.43$ 109.49$ 4,211Other Practitioner 0.02$ 45.25$ 5 2.0% 0.5% 1.5% 0.0% 0.0% 0.0% -7.5% 0.0% -7.5% 0.02$ 45.93$ 5Therapies 0.93$ 106.30$ 105 2.0% 0.5% 1.5% 0.0% 0.0% 0.0% -7.5% 0.0% -7.5% 0.91$ 107.90$ 101Prescribed Drugs 14.97$ 51.97$ 3,457 0.0% 0.0% 0.0% 0.0% 0.0% 0.0% -1.7% 0.0% -1.7% 14.72$ 51.97$ 3,398Other BH Services 0.09$ 18.16$ 62 2.5% 1.0% 1.5% 0.0% 0.0% 0.0% 0.0% 0.0% 0.0% 0.10$ 18.71$ 65LTSS Services 0.53$ 61.61$ 104 0.0% 0.5% -0.5% 0.0% 0.0% 0.0% 0.0% 0.0% 0.0% 0.53$ 62.54$ 102Durable Medical Equipment 2.56$ 5.93$ 5,185 1.0% 0.5% 0.5% 0.0% 0.0% 0.0% -7.5% 0.0% -7.5% 2.44$ 6.02$ 4,868Limited Dental Services 2.54$ 25.00$ 1,220 1.0% 0.5% 0.5% 0.0% 0.0% 0.0% 0.0% 0.0% 0.0% 2.62$ 25.38$ 1,238Optical 0.06$ 82.70$ 9 1.0% 0.5% 0.5% 0.0% 0.0% 0.0% 0.0% 0.0% 0.0% 0.07$ 83.95$ 9Lab and X-Ray 0.57$ 19.91$ 344 1.0% 0.5% 0.5% 0.0% 0.0% 0.0% 0.0% 0.0% 0.0% 0.59$ 20.21$ 349Transportation 2.45$ 121.09$ 243 0.4% 0.5% -0.1% 0.0% 0.0% 0.0% 0.0% 0.0% 0.0% 2.48$ 122.91$ 242Subtotal (Medical) 375.04$ N/A 31,854 1.7% 0.5% 1.2% 41.5% 41.5% 0.0% -11.8% 0.0% -11.8% 492.90$ N/A 30,599
CC4C LHD Payments 4.18$ 4.55$ 11,034 0.0% 0.0% 0.0% 0.0% 0.0% 0.0% 0.0% 0.0% 0.0% 4.18$ 4.55$ 11,034OBCM LHD Payments -$ -$ - 0.0% 0.0% 0.0% 0.0% 0.0% 0.0% 0.0% 0.0% 0.0% -$ -$ -Medical Home Payments 1.98$ 2.45$ 9,713 0.0% 0.0% 0.0% 0.0% 0.0% 0.0% 0.0% 0.0% 0.0% 1.98$ 2.45$ 9,713Subtotal (LHD/Medical Home Payments) 6.17$ N/A 20,746 0.0% 0.0% 0.0% 0.0% 0.0% 0.0% 0.0% 0.0% 0.0% 6.17$ N/A 20,746Total (Medical + LHD/Medical Home) 381.21$ N/A 52,601 1.7% 0.5% 1.2% 40.9% 40.9% 0.0% -11.6% 0.0% -11.6% 499.06$ N/A 51,345
Note: Total Medical Calculation: M = A * [(1 + D) ^ (36/12)] * (1 + G) * (1 + J) Gross Medical PMPM/Payment:
Non-Benefit Expense PMPM/Payment:General Administration (4.47%)Care Management (3.41%)Profit/Underwriting Gain (1.75%)
Total Service Cost and Non-Benefit Load PMPM/Payment:Premium Taxes (2.01%)
Total Capitation Rate: 563.56$
499.06$
24.69$18.82$9.66$
552.23$11.33$
Category of ServiceBase Data Trend Program Changes Managed Care Adjustment Total Medical
Region 6TANF and Other Related Children (<1)
Male & Female
July 1, 2015 - June 30, 2017July 1, 2019 - June 30, 2020
36
164 of 197Prepared by Mercer GovernmentHuman Services Consulting
RFP 30-190029-DHBSection IX. Medicaid Managed Care Draft Rate Book (SFY 2020)

Exhibit 101
Region:Category of Aid:Sex:
Member Months/Deliveries: 1,733,723
Blended Base Data:Contract Period:Trend Months:
(A) (B) (C) (D) (E) (F) (G) (H) (I) (J) (K) (L) (M) (N) (O)
PMPM/Payment Unit Cost Util/1000 PMPM/
Payment Unit Cost Util/1000 PMPM/Payment Unit Cost Util/1000 PMPM/
Payment Unit Cost Util/1000 PMPM/Payment Unit Cost Util/1000
Inpatient — PH 4.06$ 1,250.47$ 39 1.5% 0.5% 1.0% 62.1% 62.1% 0.0% -15.3% 0.0% -15.3% 5.83$ 2,056.96$ 34Inpatient — BH 0.79$ 588.74$ 16 1.5% 0.5% 1.0% 0.0% 0.0% 0.0% -0.3% 0.0% -0.3% 0.83$ 597.62$ 17Outpatient Hospital 7.42$ 344.68$ 258 2.5% 0.5% 2.0% 20.8% 20.8% 0.0% -4.1% 0.0% -4.1% 9.27$ 422.64$ 263Emergency Room 13.78$ 283.12$ 584 3.0% 0.5% 2.5% 21.9% 21.9% 0.0% -7.8% 0.0% -7.8% 16.92$ 350.20$ 580Physician 17.85$ 71.05$ 3,015 2.0% 0.5% 1.5% 0.0% 0.0% 0.0% -6.9% 0.0% -6.9% 17.64$ 72.12$ 2,935FQHC/RHC 1.93$ 101.69$ 228 2.0% 0.5% 1.5% 0.0% 0.0% 0.0% -7.8% 0.0% -7.8% 1.89$ 103.22$ 220Other Clinic 6.11$ 106.65$ 688 2.0% 0.5% 1.5% 0.0% 0.0% 0.0% -7.8% 0.0% -7.8% 5.98$ 108.26$ 663Other Practitioner 0.10$ 73.50$ 17 2.0% 0.5% 1.5% 0.0% 0.0% 0.0% -7.8% 0.0% -7.8% 0.10$ 74.61$ 16Therapies 3.39$ 115.26$ 353 2.0% 0.5% 1.5% 0.0% 0.0% 0.0% -7.8% 0.0% -7.8% 3.31$ 117.00$ 340Prescribed Drugs 36.95$ 99.29$ 4,465 4.0% 3.5% 0.5% 0.0% 0.0% 0.0% -2.5% 0.0% -2.5% 40.53$ 110.09$ 4,418Other BH Services 4.52$ 74.47$ 728 2.5% 1.0% 1.5% 0.0% 0.0% 0.0% -0.3% 0.0% -0.3% 4.85$ 76.73$ 759LTSS Services 0.17$ 10.81$ 193 0.0% 0.5% -0.5% 2.6% 2.6% 0.0% -0.3% 0.0% -0.3% 0.18$ 11.26$ 190Durable Medical Equipment 1.66$ 2.70$ 7,383 1.0% 0.5% 0.5% 0.0% 0.0% 0.0% -7.8% 0.0% -7.8% 1.58$ 2.74$ 6,909Limited Dental Services 0.52$ 24.80$ 252 1.0% 0.5% 0.5% 0.0% 0.0% 0.0% -0.3% 0.0% -0.3% 0.53$ 25.18$ 255Optical 1.35$ 83.40$ 194 1.0% 0.5% 0.5% 0.0% 0.0% 0.0% -0.3% 0.0% -0.3% 1.39$ 84.66$ 196Lab and X-Ray 1.20$ 18.64$ 775 1.0% 0.5% 0.5% 0.0% 0.0% 0.0% -0.3% 0.0% -0.3% 1.24$ 18.92$ 784Transportation 0.51$ 78.21$ 78 0.4% 0.5% -0.1% 0.0% 0.0% 0.0% -0.3% 0.0% -0.3% 0.51$ 79.38$ 77Subtotal (Medical) 102.33$ N/A 19,266 2.8% 1.6% 1.2% 6.8% 6.8% 0.0% -5.3% 0.0% -5.3% 112.58$ N/A 18,656
CC4C LHD Payments 0.99$ 4.52$ 2,636 0.0% 0.0% 0.0% 0.0% 0.0% 0.0% 0.0% 0.0% 0.0% 0.99$ 4.52$ 2,636OBCM LHD Payments 0.57$ 4.92$ 1,392 0.0% 0.0% 0.0% 0.0% 0.0% 0.0% 0.0% 0.0% 0.0% 0.57$ 4.92$ 1,392Medical Home Payments 2.29$ 2.45$ 11,236 0.0% 0.0% 0.0% 0.0% 0.0% 0.0% 0.0% 0.0% 0.0% 2.29$ 2.45$ 11,236Subtotal (LHD/Medical Home Payments) 3.86$ N/A 15,264 0.0% 0.0% 0.0% 0.0% 0.0% 0.0% 0.0% 0.0% 0.0% 3.86$ N/A 15,264Total (Medical + LHD/Medical Home) 106.19$ N/A 34,530 2.7% 1.5% 1.2% 6.6% 6.6% 0.0% -5.2% 0.0% -5.2% 116.44$ N/A 33,920
Note: Total Medical Calculation: M = A * [(1 + D) ^ (36/12)] * (1 + G) * (1 + J) Gross Medical PMPM/Payment:
Non-Benefit Expense PMPM/Payment:General Administration (8.05%)Care Management (3.28%)Profit/Underwriting Gain (1.75%)
Total Service Cost and Non-Benefit Load PMPM/Payment:Premium Taxes (2.01%)
Total Capitation Rate: 136.70$
116.44$
10.78$4.39$2.34$
133.95$2.75$
Category of ServiceBase Data Trend Program Changes Managed Care Adjustment Total Medical
Region 6TANF and Other Related Children (1-20)
Male & Female
July 1, 2015 - June 30, 2017July 1, 2019 - June 30, 2020
36
165 of 197Prepared by Mercer GovernmentHuman Services Consulting
RFP 30-190029-DHBSection IX. Medicaid Managed Care Draft Rate Book (SFY 2020)
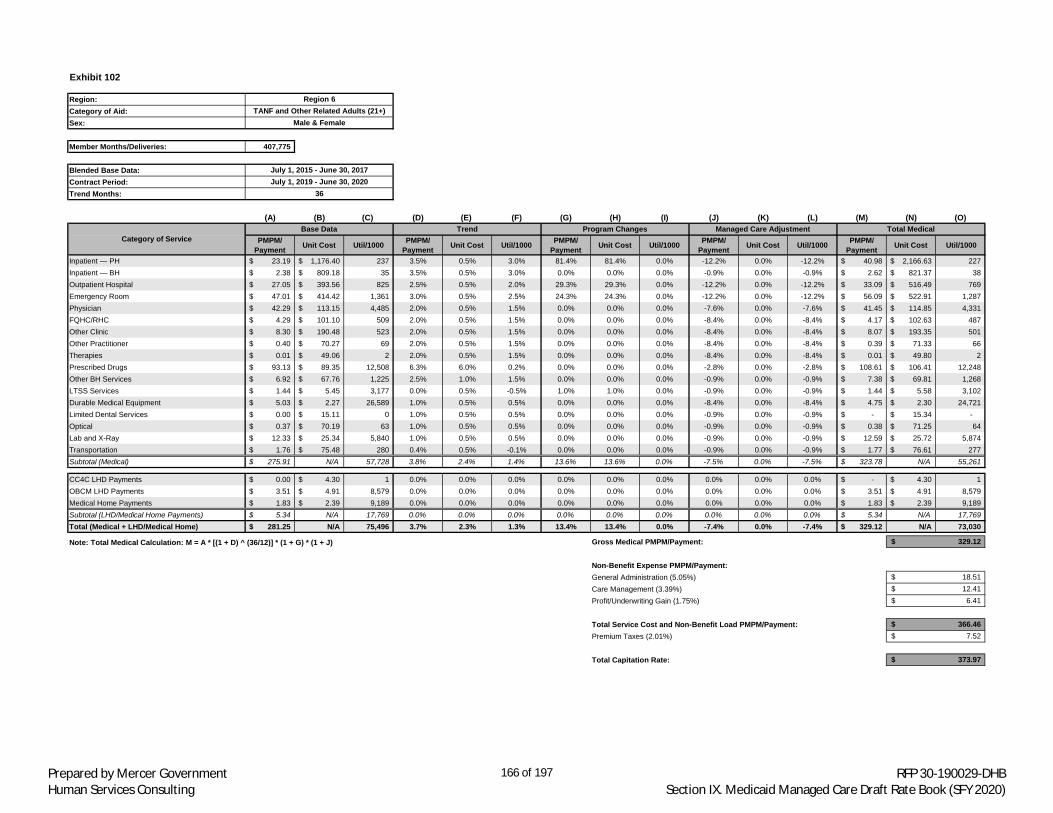
Exhibit 102
Region:Category of Aid:Sex:
Member Months/Deliveries: 407,775
Blended Base Data:Contract Period:Trend Months:
(A) (B) (C) (D) (E) (F) (G) (H) (I) (J) (K) (L) (M) (N) (O)
PMPM/Payment Unit Cost Util/1000 PMPM/
Payment Unit Cost Util/1000 PMPM/Payment Unit Cost Util/1000 PMPM/
Payment Unit Cost Util/1000 PMPM/Payment Unit Cost Util/1000
Inpatient — PH 23.19$ 1,176.40$ 237 3.5% 0.5% 3.0% 81.4% 81.4% 0.0% -12.2% 0.0% -12.2% 40.98$ 2,166.63$ 227Inpatient — BH 2.38$ 809.18$ 35 3.5% 0.5% 3.0% 0.0% 0.0% 0.0% -0.9% 0.0% -0.9% 2.62$ 821.37$ 38Outpatient Hospital 27.05$ 393.56$ 825 2.5% 0.5% 2.0% 29.3% 29.3% 0.0% -12.2% 0.0% -12.2% 33.09$ 516.49$ 769Emergency Room 47.01$ 414.42$ 1,361 3.0% 0.5% 2.5% 24.3% 24.3% 0.0% -12.2% 0.0% -12.2% 56.09$ 522.91$ 1,287Physician 42.29$ 113.15$ 4,485 2.0% 0.5% 1.5% 0.0% 0.0% 0.0% -7.6% 0.0% -7.6% 41.45$ 114.85$ 4,331FQHC/RHC 4.29$ 101.10$ 509 2.0% 0.5% 1.5% 0.0% 0.0% 0.0% -8.4% 0.0% -8.4% 4.17$ 102.63$ 487Other Clinic 8.30$ 190.48$ 523 2.0% 0.5% 1.5% 0.0% 0.0% 0.0% -8.4% 0.0% -8.4% 8.07$ 193.35$ 501Other Practitioner 0.40$ 70.27$ 69 2.0% 0.5% 1.5% 0.0% 0.0% 0.0% -8.4% 0.0% -8.4% 0.39$ 71.33$ 66Therapies 0.01$ 49.06$ 2 2.0% 0.5% 1.5% 0.0% 0.0% 0.0% -8.4% 0.0% -8.4% 0.01$ 49.80$ 2Prescribed Drugs 93.13$ 89.35$ 12,508 6.3% 6.0% 0.2% 0.0% 0.0% 0.0% -2.8% 0.0% -2.8% 108.61$ 106.41$ 12,248Other BH Services 6.92$ 67.76$ 1,225 2.5% 1.0% 1.5% 0.0% 0.0% 0.0% -0.9% 0.0% -0.9% 7.38$ 69.81$ 1,268LTSS Services 1.44$ 5.45$ 3,177 0.0% 0.5% -0.5% 1.0% 1.0% 0.0% -0.9% 0.0% -0.9% 1.44$ 5.58$ 3,102Durable Medical Equipment 5.03$ 2.27$ 26,589 1.0% 0.5% 0.5% 0.0% 0.0% 0.0% -8.4% 0.0% -8.4% 4.75$ 2.30$ 24,721Limited Dental Services 0.00$ 15.11$ 0 1.0% 0.5% 0.5% 0.0% 0.0% 0.0% -0.9% 0.0% -0.9% -$ 15.34$ -Optical 0.37$ 70.19$ 63 1.0% 0.5% 0.5% 0.0% 0.0% 0.0% -0.9% 0.0% -0.9% 0.38$ 71.25$ 64Lab and X-Ray 12.33$ 25.34$ 5,840 1.0% 0.5% 0.5% 0.0% 0.0% 0.0% -0.9% 0.0% -0.9% 12.59$ 25.72$ 5,874Transportation 1.76$ 75.48$ 280 0.4% 0.5% -0.1% 0.0% 0.0% 0.0% -0.9% 0.0% -0.9% 1.77$ 76.61$ 277Subtotal (Medical) 275.91$ N/A 57,728 3.8% 2.4% 1.4% 13.6% 13.6% 0.0% -7.5% 0.0% -7.5% 323.78$ N/A 55,261
CC4C LHD Payments 0.00$ 4.30$ 1 0.0% 0.0% 0.0% 0.0% 0.0% 0.0% 0.0% 0.0% 0.0% -$ 4.30$ 1OBCM LHD Payments 3.51$ 4.91$ 8,579 0.0% 0.0% 0.0% 0.0% 0.0% 0.0% 0.0% 0.0% 0.0% 3.51$ 4.91$ 8,579Medical Home Payments 1.83$ 2.39$ 9,189 0.0% 0.0% 0.0% 0.0% 0.0% 0.0% 0.0% 0.0% 0.0% 1.83$ 2.39$ 9,189Subtotal (LHD/Medical Home Payments) 5.34$ N/A 17,769 0.0% 0.0% 0.0% 0.0% 0.0% 0.0% 0.0% 0.0% 0.0% 5.34$ N/A 17,769Total (Medical + LHD/Medical Home) 281.25$ N/A 75,496 3.7% 2.3% 1.3% 13.4% 13.4% 0.0% -7.4% 0.0% -7.4% 329.12$ N/A 73,030
Note: Total Medical Calculation: M = A * [(1 + D) ^ (36/12)] * (1 + G) * (1 + J) Gross Medical PMPM/Payment:
Non-Benefit Expense PMPM/Payment:General Administration (5.05%)Care Management (3.39%)Profit/Underwriting Gain (1.75%)
Total Service Cost and Non-Benefit Load PMPM/Payment:Premium Taxes (2.01%)
Total Capitation Rate: 373.97$
329.12$
18.51$12.41$6.41$
366.46$7.52$
Category of ServiceBase Data Trend Program Changes Managed Care Adjustment Total Medical
Region 6TANF and Other Related Adults (21+)
Male & Female
July 1, 2015 - June 30, 2017July 1, 2019 - June 30, 2020
36
166 of 197Prepared by Mercer GovernmentHuman Services Consulting
RFP 30-190029-DHBSection IX. Medicaid Managed Care Draft Rate Book (SFY 2020)

Exhibit 103
Region:Category of Aid:Sex:
Member Months/Deliveries: 7,245
Blended Base Data:Contract Period:Trend Months:
(A) (B) (C) (D) (E) (F) (G) (H) (I) (J) (K) (L) (M) (N) (O)
PMPM/Payment Unit Cost Util/1000 PMPM/
Payment Unit Cost Util/1000 PMPM/Payment Unit Cost Util/1000 PMPM/
Payment Unit Cost Util/1000 PMPM/Payment Unit Cost Util/1000
Inpatient — PH 2,253.84$ 796.85$ 33,941 0.5% 0.5% 0.0% 119.1% 119.1% 0.0% -1.1% 0.0% -1.1% 4,955.47$ 1,771.95$ 33,559Inpatient — BH -$ -$ - 0.5% 0.5% 0.0% 0.0% 0.0% 0.0% 0.0% 0.0% 0.0% -$ -$ -Outpatient Hospital 251.05$ 142.22$ 21,183 2.5% 0.5% 2.0% 34.5% 34.5% 0.0% -11.3% 0.0% -11.3% 322.65$ 194.13$ 19,944Emergency Room 434.28$ 300.99$ 17,314 3.0% 0.5% 2.5% 24.7% 24.7% 0.0% -11.3% 0.0% -11.3% 525.27$ 381.05$ 16,542Physician 1,702.46$ 242.44$ 84,265 2.0% 0.5% 1.5% 0.8% 0.8% 0.0% 0.0% 0.0% 0.0% 1,821.33$ 248.10$ 88,095FQHC/RHC 135.92$ 157.13$ 10,380 2.0% 0.5% 1.5% 0.0% 0.0% 0.0% 0.0% 0.0% 0.0% 144.24$ 159.49$ 10,852Other Clinic 271.40$ 130.77$ 24,904 2.0% 0.5% 1.5% 0.0% 0.0% 0.0% 0.0% 0.0% 0.0% 288.01$ 132.74$ 26,036Other Practitioner 0.01$ 69.47$ 1 2.0% 0.5% 1.5% 0.0% 0.0% 0.0% 0.0% 0.0% 0.0% 0.01$ 70.51$ 1Therapies -$ -$ - 2.0% 0.5% 1.5% 0.0% 0.0% 0.0% 0.0% 0.0% 0.0% -$ -$ -Prescribed Drugs -$ -$ - 0.0% 0.0% 0.0% 0.0% 0.0% 0.0% 0.0% 0.0% 0.0% -$ -$ -Other BH Services 0.00$ 93.72$ 0 2.5% 1.0% 1.5% 0.0% 0.0% 0.0% 0.0% 0.0% 0.0% -$ 96.56$ -LTSS Services 4.00$ 13.23$ 3,623 0.0% 0.5% -0.5% 0.0% 0.0% 0.0% 0.0% 0.0% 0.0% 4.00$ 13.43$ 3,570Durable Medical Equipment 1.48$ 66.69$ 267 1.0% 0.5% 0.5% 0.0% 0.0% 0.0% 0.0% 0.0% 0.0% 1.53$ 67.69$ 271Limited Dental Services 0.01$ 24.79$ 3 1.0% 0.5% 0.5% 0.0% 0.0% 0.0% 0.0% 0.0% 0.0% 0.01$ 25.16$ 3Optical 0.02$ 90.87$ 3 1.0% 0.5% 0.5% 0.0% 0.0% 0.0% 0.0% 0.0% 0.0% 0.03$ 92.24$ 3Lab and X-Ray 52.78$ 25.94$ 24,413 1.0% 0.5% 0.5% 0.0% 0.0% 0.0% 0.0% 0.0% 0.0% 54.38$ 26.33$ 24,779Transportation 21.22$ 112.14$ 2,270 0.4% 0.5% -0.1% 0.0% 0.0% 0.0% 0.0% 0.0% 0.0% 21.47$ 113.83$ 2,263Subtotal (Medical) 5,128.46$ N/A 222,569 1.4% 0.5% 0.9% 55.1% 55.1% 0.0% -2.0% 0.0% -2.0% 8,138.38$ N/A 225,919
CC4C LHD Payments -$ -$ - 0.0% 0.0% 0.0% 0.0% 0.0% 0.0% 0.0% 0.0% 0.0% -$ -$ -OBCM LHD Payments -$ -$ - 0.0% 0.0% 0.0% 0.0% 0.0% 0.0% 0.0% 0.0% 0.0% -$ -$ -Medical Home Payments -$ -$ - 0.0% 0.0% 0.0% 0.0% 0.0% 0.0% 0.0% 0.0% 0.0% -$ -$ -Subtotal (LHD/Medical Home Payments) -$ N/A - 0.0% 0.0% 0.0% 0.0% 0.0% 0.0% 0.0% 0.0% 0.0% -$ N/A -Total (Medical + LHD/Medical Home) 5,128.46$ N/A 222,569 1.4% 0.5% 0.9% 55.1% 55.1% 0.0% -2.0% 0.0% -2.0% 8,138.38$ N/A 225,919
Note: Total Medical Calculation: M = A * [(1 + D) ^ (36/12)] * (1 + G) * (1 + J) Gross Medical PMPM/Payment:
Non-Benefit Expense PMPM/Payment:General Administration (0.80%)Care Management (3.54%)Profit/Underwriting Gain (1.75%)
Total Service Cost and Non-Benefit Load PMPM/Payment:Premium Taxes (2.01%)
Total Capitation Rate: 8,844.00$
8,138.38$
69.36$306.83$151.66$
8,666.24$177.76$
Category of ServiceBase Data Trend Program Changes Managed Care Adjustment Total Medical
Region 6Maternity Event
Female
July 1, 2015 - June 30, 2017July 1, 2019 - June 30, 2020
36
167 of 197Prepared by Mercer GovernmentHuman Services Consulting
RFP 30-190029-DHBSection IX. Medicaid Managed Care Draft Rate Book (SFY 2020)
15 OTHER CONSIDERATIONSThe following section represents other rating considerations not reflected in the Section 14 capitation ratesummaries.
Member Choice15.1
15.1.1 Tribal MembersDHHS, in consultation with North Carolina’s only federally recognized tribe, determined that members offederally-recognized tribes should be exempt from mandatory enrollment in managed care and have the choicebetween Medicaid FFS and enrolling in a PHP or tribal option, if one is available. Members of federallyrecognized tribes will default to Medicaid FFS unless a tribal option is available.
Mercer has identified the portion of the Standard Plan population that has accessed services at one of the tribalhealthcare facilities. Using this data as a potential proxy for the size and PMPM of the tribal population, Mercerfound that approximately 2.3% of the Standard Plan population eligible in Region 1 utilized services at a tribalprovider, with limited tribal provider utilization for beneficiaries eligible in other regions. Mercer also noted thatthe population that accessed services at a tribal provider exhibited a higher than average PMPM cost. If allclaims and MMs associated with tribal providers were excluded from the base experience, the average basePMPM in Region 1 would decline by approximately 1.6%. Mercer is working with DHHS to develop a morerefined impact analysis to inform an adjustment for final rates. Note that any adjustment included in the finalrates will need to also account for the number of beneficiaries anticipated to opt in to managed care.
15.1.2 BH I/DD Tailored PlanPer S.L. 2018-4821, the BH I/DD Tailored Plan for individuals with high BH needs will launch one year after theimplementation of managed care. The majority of Medicaid and NC Health Choice enrollees, including adultsand children with lower BH needs, will receive services through the Standard Plan upon launch of managed care.Individuals with higher BH needs that meet certain eligibility criteria may participate in the BH I/DD TailoredPlans. Beneficiaries passively enrolled in the future BH I/DD Tailored Plan may choose to opt out of the BH I/DDTailored Plan, and instead receive services under the Standard Plan. Additionally, Standard Plan beneficiarieswho exhibit a need for unique BH I/DD Tailored Plan services may also opt out of the Standard Plan and enroll inFFS and LME/MCOs (before BH I/DD Tailored Plans go live). Mercer will work with DHHS to further refineadjustments related to the delineation of Standard Plan and BH I/DD Tailored Plan populations as part of thefinal rates. Further information about this population and potential member choice can be found in Appendix F.
Performance Withholds15.2DHHS has proposed a performance-based incentive system financed through a withhold as part of the programdesign. Per S.L. 2018-49, performance withholds will not apply to the first 18 months of managed careimplementation. The long-term goal of the incentives would be to ensure that PHPs deliver value around thevarious DHHS priorities and ultimately improve quality of care provided to the Medicaid population in NorthCarolina.
When the withhold program is enacted, DHHS and its actuaries will ensure the payment implications ofwithholds are designed to comply with federal regulations. Any withhold must be reviewed by the Actuary todetermine that the withhold should be “reasonably achievable” and the capitation rate including the withholdmust be certified as actuarially sound. The methodology to perform the actuarial soundness assessment will befurther refined as the actual withhold percentages are defined and the metrics finalized.
21 SL 2018-48/House Bill 403 Medicaid and Behavioral Health Modifications.https://www.ncleg.net/Sessions/2017/Bills/House/PDF/H403v6.pdf
168 of 197Prepared by Mercer GovernmentHuman Services Consulting
RFP 30-190029-DHBSection IX. Medicaid Managed Care Draft Rate Book (SFY 2020)
Risk Adjustment15.3DHHS will implement a prospective risk adjustment process as required by the managed care legislation (Section5.5(a) of Session Law 2015-245). Health-based risk adjustment has been documented in multiple Society ofActuaries (SOA) studies and other publications as a significantly better predictor of healthcare costs thantraditional age/gender rating. A risk adjusted payment process differentiates capitation payments to PHPs basedon measured risk differences in their enrolled populations. Appropriately paying PHPs for their enrolledpopulation, enables the overall managed care program to operate effectively and efficiently and discouragesPHPs to avoid enrolling higher risk individuals. Since risk adjustment is reliant on detailed claims or encounterinformation, the PHPs have a strong incentive to submit complete and accurate encounters. Finally, riskadjustment can simplify the rate structure by reducing the number of rate cells needed from a systems andpayment perspective.
15.3.1 Risk Adjustment ModelWhile many models exist, DHHS is proposing to use the Chronic Illness Disability Payment System plus Pharmacy(CDPS+Rx) model to adjust the capitation payments beginning at the start of Contract Year 1 to reflect theunderlying health risk of the members enrolled in each PHP. The CDPS+Rx model is a disease classificationsystem developed by researchers from the University of California, San Diego (UCSD). The model uses medicaland pharmacy data to assign risk markers that correlate to predictive, high cost disease conditions. Along withbeing built on a Medicaid-specific framework, the CDPS+Rx model is the most prevalent model used withinMedicaid, approved by CMS, has limited licensing fees and maintains a high level of transparency regarding itsmodel logic and assumptions. Many commercially available models that were developed using commercialhealthcare populations and services are not as transparent and are generally more costly to implement. Whilethe CDPS+Rx model inherently addresses some unique aspects of Medicaid members, additional informationmay be incorporated into the model where appropriate.
Medicaid Rx will also be run in conjunction with CDPS+Rx as a means to evaluate the impact of encounter datasubmitted by the PHPs. Medicaid Rx was also developed by UCSD and is based on a similar framework andcommon principles as CDPS+Rx. Since pharmacy claims/encounters are typically more straightforward to collect,Medicaid Rx results can be used as a benchmark against the CDPS+Rx results where full medicalclaims/encounters are being utilized. Medicaid Rx uses only pharmacy information within the risk assessmentprocess and has been used by states where full diagnostic encounters were not reliable. Both model results willbe actively evaluated and available in the event the results need to be adjusted based on the adequacy andvalidity of PHP-reported encounters.
Both models will be calibrated using State-specific FFS data upon implementation. While the model developersoften utilize an external (“national”) data set for producing relative cost categories, the use of State-specific databest reflects North Carolina’s populations, provider practice patterns and covered benefits. FFS data is readilyavailable and of sufficient quality to use for the calibration process. Since the risk adjustment will be appliedprospectively to capitation payments, the model weights will be calibrated on a prospective basis. The riskadjustment cost weights may be updated periodically if material changes are made to covered benefits, morerelevant data becomes available, or at the discretion of DHHS.
Risk adjustment considerations will be specifically evaluated for the BH I/DD Tailored Plans as well as the LTSSpopulations to assess whether the current models selected for implementation of the standard plans aresuitable for risk adjustment of those populations. Alternatively, other models or calibration will be consideredfor these specialized populations.
169 of 197Prepared by Mercer GovernmentHuman Services Consulting
RFP 30-190029-DHBSection IX. Medicaid Managed Care Draft Rate Book (SFY 2020)

15.3.2 Data CollectionThe risk adjustment process utilizes beneficiary eligibility, demographic, diagnosis and pharmacy claims data.Risk adjustment will be implemented at the start of the program and will initially utilize DHHS FFS data. PHP-reported encounter data will also be collected and validated as it becomes available. After the data elementshave been collected, they must be validated for completeness and accuracy. Risk adjustment data will beevaluated for consistency of reporting in terms of volume and completeness of critical fields (i.e., diagnosiscodes). During the initial months after implementation, DHHS will review encounter data as often as monthly toidentify and address issues with the completeness of the data. This validation is crucial for general programmonitoring as well as rate-setting and risk adjustment.
For risk adjustment analysis, data will be extracted and analyzed on a semi-annual basis for development ofbeneficiary risk scores. The data extraction dates will be clearly communicated to the PHPs to ensure they havea chance to submit/re-submit any encounters to be considered in the risk adjustment process. While the PHPsare expected to constantly be submitting encounters to DHHS in a timely manner, clearly communicating cut-offdates when the data are utilized for risk adjustment analysis will allow the PHPs to plan resubmissions,adjustments and other transactions to ensure they are included in the risk adjustment process.
The presence of a single diagnosis, regardless of position on the claim, or a single national drug code is sufficientto support a classification into a CDPS+Rx diagnostic category. Consistent with general risk adjustment practices,laboratory and diagnostic radiology claims will be excluded from the disease classification process. Theseservices often do not indicate the presence of a disease condition and may produce “false positives” within theresults. While only managed care covered benefits will be included in the cost weight development, FFS claimswill be used for disease condition flagging where available and appropriate.
15.3.3 Calculation of Risk ScoresBeneficiary Risk Score DevelopmentUsing the models and data described above, a risk assessment will be performed for each scored beneficiary.Scored beneficiaries are defined as any individual with at least six months of eligibility (non-continuous) duringthe 12-month study period. The six month scoring criteria provides sufficient time to accumulate beneficiary’sapplicable health diagnosis and pharmacy usage.
The risk assessment is performed by assigning any applicable disease condition categories to each scoredbeneficiary. Once the disease condition flagging is complete, each beneficiary’s acuity level (i.e., beneficiary riskscore) will be determined by adding the relative cost of all their flagged conditions and demographic category.This process of calculating individual beneficiary risk scores is anticipated to occur every six months.
PHP EnrollmentOnce the scored and unscored beneficiaries are given a risk score, actual PHP enrollment is collected to evaluatethe average risk scores for each PHP. Since the goal of risk adjustment is to project payments during the contractperiod, an enrollment snapshot that represents PHP membership will be applied as close to the contract periodstart date as possible. For example, for July risk adjustment, an enrollment snapshot as of June based onbeneficiary selection and assignment is expected to be utilized.
The enrollment snapshot is cross-referenced to the individual beneficiary risk score file to develop a raw averagerisk score for each PHP. DHHS is considering updating the enrollment snapshot each month for the first sixmonths of program implementation in each region to account for the higher member movement that mayoccur. At that point it will be evaluated if moving to quarterly updates is appropriate and eventually moving tosemi-annual updates when deemed appropriate. Similarly, as populations are phased into managed care, thePHP enrollment snapshots may be updated monthly for the first six months of managed care.
170 of 197Prepared by Mercer GovernmentHuman Services Consulting
RFP 30-190029-DHBSection IX. Medicaid Managed Care Draft Rate Book (SFY 2020)

Budget Neutral Risk ScoresThe average risk scores will be calculated for each rate cell for all beneficiaries who are enrolled in each PHP.Since the data used to produce the risk adjustment cost weights and the 12 month application are fromdifferent time periods, distortions in the model results occur due to changes in practice patterns and codingspecificity. Therefore, the initial results are considered to be “raw” risk scores. The distortions describedpreviously may cause the raw risk scores to be inappropriately inflated or deflated, depending on thepopulations and models being applied. To address this issue, a budget neutrality adjustment is required.
CMS requires that risk adjustment be applied in a budget neutral manner. This calculation is done by dividingeach PHP’s raw risk score by the total PHP raw risk score for each rate cell. This adjustment will result in theweighted average of the budget neutral risk scores equaling 1.0. The final payments made to the PHP aredetermined by multiplying a base capitation rate by each PHP’s budget neutral risk score and by its enrollmentfor each rate cell.
15.3.4 Frequency of UpdatesThe risk adjustment study period (used to set risk scores by beneficiary) will be updated every six monthscorresponding with the first and second half of each contract year. For each six month update cycle, a full yearof encounter or claims data will be pulled for a time period beginning two years before the beginning of thecycle. This timing allows for six months of runout and six months of calculation time. This semi-annual processwill also allow for 6 months of overlapping data with each update. The illustration below shows a sampletimeline.
Figure 3: Risk Adjustment Analysis
15.3.5 Final Capitation RatesThe final budget neutral risk scores for each PHP will be applied to the base capitation rates for the Medicaidand NC Health Choice populations, thus producing the risk adjusted rates for each rate cell. The resultingcapitation rates will reflect the relative risk between PHPs and rate cells. Risk adjustment is anticipated to beapplied to all managed care populations, but will not be applied to the Maternity Event payments and newbornrate cells. Maternity Event payments are not typically risk adjusted because the delivery payment is already aform of risk adjustment. Newborns are also typically excluded from risk adjustment because it is challenging dueto the lack of historical data at the beneficiary level. DHHS is utilizing a separate rate cell for newborns toaccount for their higher than average costs.
The resulting risk adjustment scores are projections of relative risk, and actual relative risk will likely differ fromthat which was projected. The PHPs are encouraged to review the results with their own data. DHHS will use therisk adjustment scores to adjust actuarially sound base capitation rates as a means of matching PHP payments totheir relative risks. Use of the risk adjustment results for any purpose beyond that stated may not beappropriate. The risk adjustment model produces precise adjustment factors that are applied to the capitationrates. However, acceptable variation exists within the calculated results due to the specific risk adjustmentmodel chosen, the various assumptions applied and the availability and accuracy of the source data utilized.Although health-based risk adjustment is not a perfect system that predicts all variation in beneficiary and PHP
Data Period July 2017 – June 2018 Runout(6 months)
Calculations(6 months)
Application toCap. Pmt. July –December 2019
171 of 197Prepared by Mercer GovernmentHuman Services Consulting
RFP 30-190029-DHBSection IX. Medicaid Managed Care Draft Rate Book (SFY 2020)
costs, published results have shown that using health status as a predictor of costs is a significant improvementover age/gender rating.
When developing a risk adjustment payment approach, there are many decision points and assumptions thatneed to be determined. The methodology described in this section is based on program goals and objectives,multiple discussions between DHHS and its actuaries and best/common practice of risk adjustment use in otherstate Medicaid programs. Further, DHHS made decisions based on the specific implementation schedule andapproach to managed care within North Carolina’s Medicaid program. For example, the selection of both adiagnosis and pharmacy-based models provides DHHS with flexibility and options in light of encounter datauncertainty at the onset of the program. As the program matures, certain assumptions may be re-evaluated toenable the risk adjustment methodology to best achieve DHHS’ objectives.
Medical Loss Ratio15.4The CMS Final Rule outlines requirements for rate-setting and financial reporting related to the medical lossratio (MLR). From a rate-setting standpoint, 42 CFR 438.4(b)(9) stipulates that rates must be established in sucha way that a PHP would reasonably achieve a MLR of at least 85%. From a financial reporting perspective, CMSprescribes the MLR calculation methodology in 42 CFR 438.8 for states and their contractors including how toclassify various incurred costs and how to develop the numerator and denominator included in the ratio. Lastly,the Final Rule allows, but does not require, states to implement a remittance process for PHPs which do notmeet state-established minimum MLR thresholds.
15.4.1 Implied MLR Calculation based on Capitation Rate DevelopmentThe capitation rates are developed independent of the MLR implications and are based on anticipated,reasonable expenditures required to meet the obligations put forth in the PHP contract. The capitation rateshave not been developed based on a target MLR, nor are they influenced by any potential remittance process tobe implemented by the State. Mercer calculated the implied MLRs for each rate cell on a statewide averagebasis using the MLR methodology outlined in the Final Rule. A summary of this calculation is offered below andillustrated in the Table 24. While CMS has established a minimum MLR for Medicaid rate-setting of 85%, thehigher MLRs are allowable as long as rates “are adequate for reasonable, appropriate, and attainable nonbenefit costs” as noted in 42 CFR 438.4(b)(9).
As is shown, the numerator includes all of the expected medical claims for the rate cell (i.e., Gross MedicalPMPM) as well as 85.0% of the included care management considerations included as part of the non-benefitexpenses. These care management costs were included in the numerator as DHHS expects much of the caremanagement costs incurred by the PHPs to meet the definition of Health Care Quality Improvements (HCQI)which is included as part of the numerator within the Final Rule MLR methodology. HCQI are defined within 42CFR 438.8(e)(3) as:
· Those activities that improve health quality and increase the likelihood of desired health outcomes asdefined in 45 CFR 158.150
· Activities related to any External-Quality Review (EQR) activities as defined at 42 CFR 438.358(b) and (c)· Health Information Technology expenses as defined at 45 CFR 158.151
Additionally, within 42 CFR 438.8(f), CMS outlines that the denominator of the MLR should be premiumrevenues excluding amounts for PHP taxes/fees/assessments. As a result, Mercer set the denominator in thetable below as the total capitation rate less the PHP premium tax considerations included in the ratedevelopment process.
For comparison, Mercer also included a traditional pricing MLR calculation in the table below using amethodology that compares the Gross Medical PMPM to the total capitation rate. This pricing MLR is shown in
172 of 197Prepared by Mercer GovernmentHuman Services Consulting
RFP 30-190029-DHBSection IX. Medicaid Managed Care Draft Rate Book (SFY 2020)

row H of the table below. This was included to illustrate what portion of the total capitation rate is for medicalcosts. Also, one minus this ratio illustrates what portion of total capitation is intended for GeneralAdministration and Utilization Management, Care Management, Profit/Underwriting Gain and Premium Taxes.These ratios are significantly lower than the Final Rule MLR as they do not include any care management costs inthe numerator and premium taxes are included in the denominator.
Table 24: Statewide Implied MLR Calculation by Rate Cell Utilizing Draft Capitation Rates
Capitation Rate Component ABD
TANF,Newborn
(<1)TANF, Child
(1-20)TANF, Adult
(21+)Maternity
Event
TotalStandard
Plan
(A) = Gross Medical PMPM or Payment $1,212.36 $618.85 $124.56 $357.00 $8,705.66 $300.86
(B) = Care Management PMPM orPayment
$43.79 $22.34 $4.50 $12.87 $313.95 $10.86
(C) = (A) + 85% x (B) $1,249.58 $637.84 $128.39 $367.94 $8,972.52 $310.09
(D) = Total Capitation Rate $1,355.46 $695.20 $145.37 $403.88 $9,442.29 $340.78
(E) = Premium Taxes PMPM or Payment $27.24 $13.97 $2.92 $8.12 $189.79 $6.85
(F) = (D) – (E) $1,328.22 $681.23 $142.44 $395.76 $9,252.50 $333.93
(G) = (C) / (F) = Implied MLR 94.1% 93.6% 90.1% 93.0% 97.0% 92.9%
(H) = (A) / (D) = Pricing MLR 89.4% 89.0% 85.7% 88.4% 92.2% 88.3%
15.4.2 Minimum MLR ThresholdAs part of Medicaid Transformation, DHHS will institute a MLR reporting and remittance process for all PHPs toensure on a retrospective basis that PHPs directed a sufficient portion of the capitation payments received fromDHHS to services and activities that improve health in alignment with the program goals and objectives. Inaccordance with S.L. 2018-49, a statewide minimum MLR threshold will be established at 88% for health careservices, with the components of the numerator and denominator to be defined by DHHS (DHHS-defined MLR).To recognize MLR variability across rate cells (as demonstrated in Table 24), the minimum MLR threshold foreach PHP shall be calculated based on the actual capitation revenue mix of the PHP, by taking the revenueweighted average of factors to be defined by DHHS for each rating group (ABD; TANF, Newborn; TANF, Child;TANF, Adult; and Maternity Event), based on the total capitation payments for the rating year for each ratinggroup. The factors will be developed from the Implied MLR calculated from the final capitation rates andcalibrated to an 88% MLR threshold.
PHPs will be required to calculate and report aggregate MLR on an annual, retrospective basis aligned to thecontract year according to two formulas, CMS-defined MLR and DHHS-defined MLR as outlined in the RFP.
If the PHP’s DHHS-defined MLR is less than the minimum MLR threshold as defined above, the PHP shall remit tothe Department a rebate equal to the denominator of the DHHS-defined MLR, multiplied by the differencebetween the minimum MLR threshold and the DHHS-defined MLR result. The PHP may make contributions tohealth-related resources (that meet certain requirements) in lieu of all or a portion of the required rebate.
173 of 197Prepared by Mercer GovernmentHuman Services Consulting
RFP 30-190029-DHBSection IX. Medicaid Managed Care Draft Rate Book (SFY 2020)
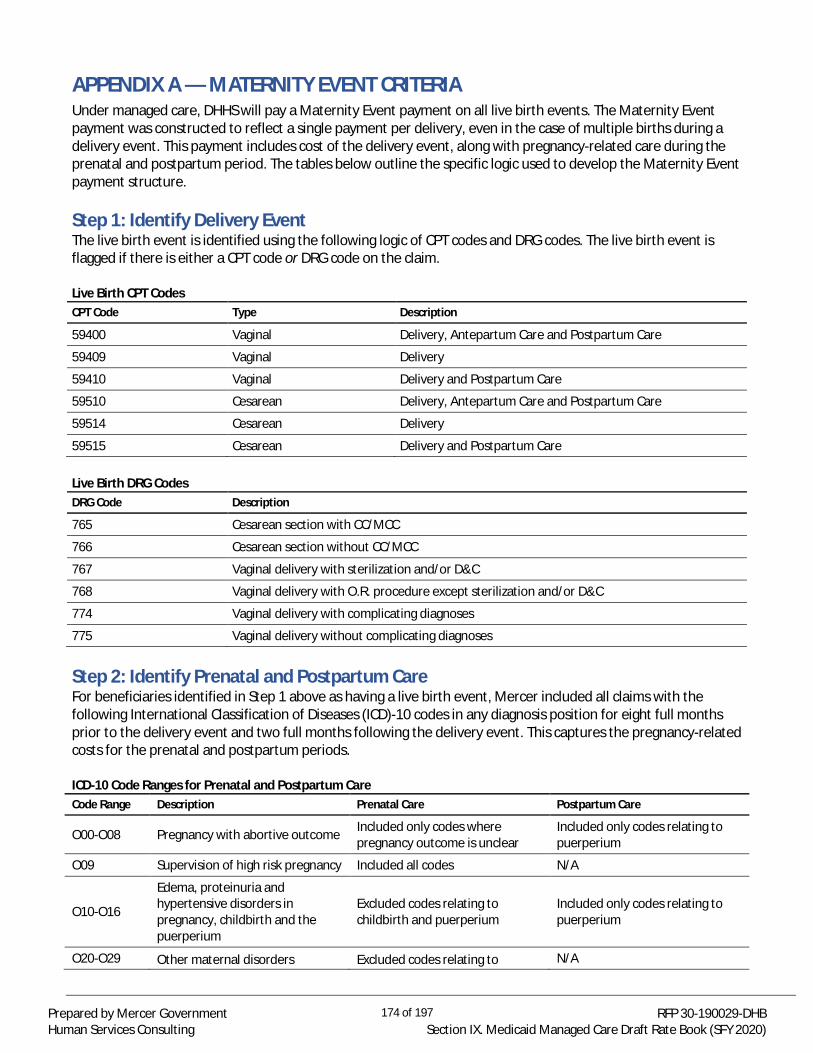
APPENDIX A — MATERNITY EVENT CRITERIAUnder managed care, DHHS will pay a Maternity Event payment on all live birth events. The Maternity Eventpayment was constructed to reflect a single payment per delivery, even in the case of multiple births during adelivery event. This payment includes cost of the delivery event, along with pregnancy-related care during theprenatal and postpartum period. The tables below outline the specific logic used to develop the Maternity Eventpayment structure.
Step 1: Identify Delivery EventThe live birth event is identified using the following logic of CPT codes and DRG codes. The live birth event isflagged if there is either a CPT code or DRG code on the claim.
Live Birth CPT CodesCPT Code Type Description
59400 Vaginal Delivery, Antepartum Care and Postpartum Care
59409 Vaginal Delivery
59410 Vaginal Delivery and Postpartum Care
59510 Cesarean Delivery, Antepartum Care and Postpartum Care
59514 Cesarean Delivery
59515 Cesarean Delivery and Postpartum Care
Live Birth DRG CodesDRG Code Description
765 Cesarean section with CC/MCC
766 Cesarean section without CC/MCC
767 Vaginal delivery with sterilization and/or D&C
768 Vaginal delivery with O.R. procedure except sterilization and/or D&C
774 Vaginal delivery with complicating diagnoses
775 Vaginal delivery without complicating diagnoses
Step 2: Identify Prenatal and Postpartum CareFor beneficiaries identified in Step 1 above as having a live birth event, Mercer included all claims with thefollowing International Classification of Diseases (ICD)-10 codes in any diagnosis position for eight full monthsprior to the delivery event and two full months following the delivery event. This captures the pregnancy-relatedcosts for the prenatal and postpartum periods.
ICD-10 Code Ranges for Prenatal and Postpartum CareCode Range Description Prenatal Care Postpartum Care
O00-O08 Pregnancy with abortive outcome Included only codes wherepregnancy outcome is unclear
Included only codes relating topuerperium
O09 Supervision of high risk pregnancy Included all codes N/A
O10-O16
Edema, proteinuria andhypertensive disorders inpregnancy, childbirth and thepuerperium
Excluded codes relating tochildbirth and puerperium
Included only codes relating topuerperium
O20-O29 Other maternal disorders Excluded codes relating to N/A
174 of 197Prepared by Mercer GovernmentHuman Services Consulting
RFP 30-190029-DHBSection IX. Medicaid Managed Care Draft Rate Book (SFY 2020)

Code Range Description Prenatal Care Postpartum Care
predominately related topregnancy
childbirth and puerperium
O30-O48Maternal care related to the fetusand amniotic cavity and possibledelivery problems
Included all codes N/A
O60-O77 Complications of labor anddelivery
Included all codes dealing withunspecified, second and thirdtrimester
Included only codes relating topuerperium
O80-O82 Encounter for delivery N/A N/A
O85-O92 Complications predominatelyrelated to the puerperium
Included all codes dealing withunspecified, first, second andthird trimester
Included only codes relating topuerperium
O94-O9A Other obstetric conditions, notelsewhere classified
Excluded codes relating tochildbirth and puerperium
Included only codes relating topuerperium
Step 3: Identify Other Pregnancy-Related ServicesFor beneficiaries identified in Step 1 above as having a live birth event, Mercer also included other pregnancy-related services, consistent with current State clinical coverage policies. Utilization for these services areincluded for eight full months prior to and two full months following the delivery event.
Childbirth Education Clinical Coverage PolicyCPT Code Description
S9442 Birthing Class
Obstetrics and PMH Clinical Coverage PolicyCPT Code Description
59425 Antepartum care only; 4–6 visits
59426 Antepartum care only; 7 or more visits
59430 Postpartum care only (separate procedure)
T1015 FQHC/RHC visit
59412 External cephalic version, with or without tocolysis
59414 Delivery of placenta (separate procedure)
99360 Physician standby service, requiring prolonged physician attendance, each 30 minutes (e.g., operativestandby, standby for frozen section, for cesarean/high risk delivery, for monitoring EEG)
99464 Attendance at delivery (when requested by delivering physician) and initial stabilization of newborn
S0280 PMH Incentive
S0281 PMH Incentive
Fetal Surveillance Clinical Coverage PolicyCPT Code Description
Ultrasound in Maternity Care
76801 Ultrasound, pregnant uterus, real time with image documentation, fetal and maternal evaluation, firsttrimester (< 14 weeks 0 days), transabdominal approach; single or first gestation
76802 Ultrasound, pregnant uterus, real time with image documentation, fetal and maternal evaluation, firsttrimester (< 14 weeks 0 days), transabdominal approach; each additional
175 of 197Prepared by Mercer GovernmentHuman Services Consulting
RFP 30-190029-DHBSection IX. Medicaid Managed Care Draft Rate Book (SFY 2020)
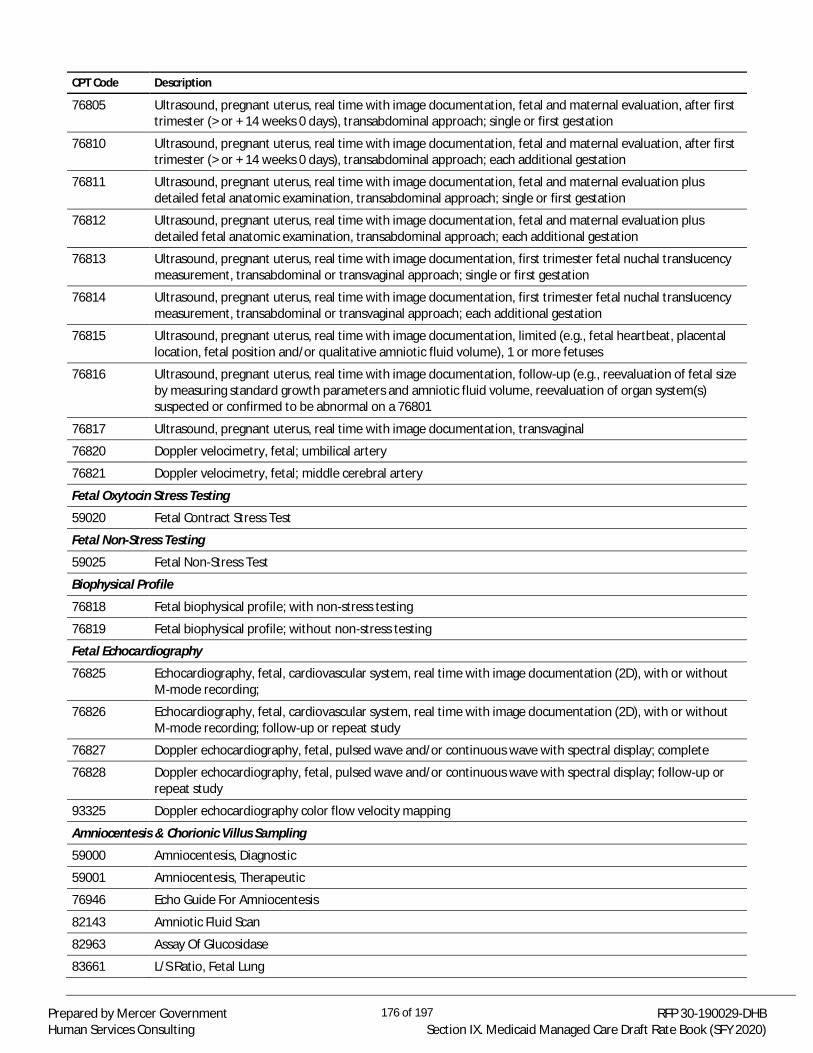
CPT Code Description
76805 Ultrasound, pregnant uterus, real time with image documentation, fetal and maternal evaluation, after firsttrimester (> or + 14 weeks 0 days), transabdominal approach; single or first gestation
76810 Ultrasound, pregnant uterus, real time with image documentation, fetal and maternal evaluation, after firsttrimester (> or + 14 weeks 0 days), transabdominal approach; each additional gestation
76811 Ultrasound, pregnant uterus, real time with image documentation, fetal and maternal evaluation plusdetailed fetal anatomic examination, transabdominal approach; single or first gestation
76812 Ultrasound, pregnant uterus, real time with image documentation, fetal and maternal evaluation plusdetailed fetal anatomic examination, transabdominal approach; each additional gestation
76813 Ultrasound, pregnant uterus, real time with image documentation, first trimester fetal nuchal translucencymeasurement, transabdominal or transvaginal approach; single or first gestation
76814 Ultrasound, pregnant uterus, real time with image documentation, first trimester fetal nuchal translucencymeasurement, transabdominal or transvaginal approach; each additional gestation
76815 Ultrasound, pregnant uterus, real time with image documentation, limited (e.g., fetal heartbeat, placentallocation, fetal position and/or qualitative amniotic fluid volume), 1 or more fetuses
76816 Ultrasound, pregnant uterus, real time with image documentation, follow-up (e.g., reevaluation of fetal sizeby measuring standard growth parameters and amniotic fluid volume, reevaluation of organ system(s)suspected or confirmed to be abnormal on a 76801
76817 Ultrasound, pregnant uterus, real time with image documentation, transvaginal
76820 Doppler velocimetry, fetal; umbilical artery
76821 Doppler velocimetry, fetal; middle cerebral artery
Fetal Oxytocin Stress Testing
59020 Fetal Contract Stress Test
Fetal Non-Stress Testing
59025 Fetal Non-Stress Test
Biophysical Profile
76818 Fetal biophysical profile; with non-stress testing
76819 Fetal biophysical profile; without non-stress testing
Fetal Echocardiography
76825 Echocardiography, fetal, cardiovascular system, real time with image documentation (2D), with or withoutM-mode recording;
76826 Echocardiography, fetal, cardiovascular system, real time with image documentation (2D), with or withoutM-mode recording; follow-up or repeat study
76827 Doppler echocardiography, fetal, pulsed wave and/or continuous wave with spectral display; complete
76828 Doppler echocardiography, fetal, pulsed wave and/or continuous wave with spectral display; follow-up orrepeat study
93325 Doppler echocardiography color flow velocity mapping
Amniocentesis & Chorionic Villus Sampling
59000 Amniocentesis, Diagnostic
59001 Amniocentesis, Therapeutic
76946 Echo Guide For Amniocentesis
82143 Amniotic Fluid Scan
82963 Assay Of Glucosidase
83661 L/S Ratio, Fetal Lung
176 of 197Prepared by Mercer GovernmentHuman Services Consulting
RFP 30-190029-DHBSection IX. Medicaid Managed Care Draft Rate Book (SFY 2020)

CPT Code Description
83662 Foam Stability, Fetal Lung
83663 Fluoro Polarize, Fetal Lung
83664 Lamellar Body, Fetal Lung
84081 Amniotic Fluid Enzyme Test
88235 Tissue Culture, Placenta
88267 Chromosome Analysis, Placenta
88269 Chromosome Analysis, Amniotic
59015 Chorion Biopsy
76945 Echo Guide, Villus Sampling
Cordocentesis
59012 Fetal Cord Puncture, Prenatal
Fetal Fibronectin Testing
82731 Assay Of Fetal Fibronectin
Budget-Neutral Maternity AdjustmentAs previously outlined in Section 4, the Maternity Event payment is constructed to capture costs related to thedelivery event along with the cost of providing prenatal services (occurring 8 full months prior to the live birthevent) and postpartum services (occurring 2 full months after the live birth event). However, the data extractonly reflects claims paid through September 2017. As such, prenatal costs associated with deliveries occurringafter September 30, 2017 are not captured using the Maternity Event payment logic outlined in Steps 1-3 above.To account for this delivery event lag, Mercer made a budget-neutral adjustment to the data to captureadditional prenatal costs, not necessarily tied to a live birth event, and summarized those under the MaternityEvent payment. The table below illustrates the budget neutral shift in costs for prenatal services under theMaternity Event payment.
SFY 2017 Impact of Maternity Event Payment AdjustmentCOA Dollar Amount
ABD $(898,826)
TANF, Newborn (<1) $(12,445)
TANF, Children (1-20) $(3,787,242)
TANF, Adults (21+) $(13,469,265)
Maternity Event $18,167,778
Total Standard Plan $0
177 of 197Prepared by Mercer GovernmentHuman Services Consulting
RFP 30-190029-DHBSection IX. Medicaid Managed Care Draft Rate Book (SFY 2020)

APPENDIX B — OTHER POPULATION ELIGIBILITY CRITERIA
Future Managed Care Populations CriteriaThe following table represents the mapping logic used to define the future populations that DHHS has proposedto phase in to managed care after initial implementation (pending legislation).
Future Managed Care PopulationsPopulation Group Program Aid Code/Eligibility Code
BH I/DD Tailored Plan See Appendix E
Foster Children and AdoptedChildren
HSFCY, HSFNN, IASCN, IASCY, MFCNN
Non-Dual LTSS — Nursing FacilityLevel Of Care (NFLOC)
Identify 3 months of consecutive nursing home utilization; mark member as beingNF from first month of 3 month consecutive utilization forward
Dual Eligibles, not eligible for BH I/DDTailored Plan
A beneficiary was identified as dual-eligible if either their eligibility fields“MA_STATUS” or “MB_STATUS” had a value of “MA” or “MB” respectively. Dualeligible beneficiaries not identified as eligible for the BH I/DD Tailored Plan weresummarized into the following population groupings:· LTSS Population: NFLOC· Non-LTSS Population: ABD, TANF and Other Related Children/Adults, NC
Health Choice, M-CHIP and Foster Children and Adopted Children
Permanently Excluded Population CriteriaThe following table represents the mapping logic used to define the proposed permanently excludedpopulations.
Permanently Excluded Population CriteriaPopulation Group Program Aid Code/Eligibility Code
Medically Needy Fourth digit of program category code of “M”
Family Planning MAFDN
Partial Duals MQBBN, MQBEN, MQBQN
Aliens (Emergency Services Only) Eligibility codes with a fourth character of F, H, O, R or V
Refugees MRFMN, MRFNN, RRFCN
Health Insurance Premium Program Beneficiary roster provided by DHHS
Inmates Living Arrangement Code 16
CAP/C Setting of Care codes (HC, IC or SC)
CAP/DA Setting of Care codes (CI, CS, ID or SD)
Note that beneficiaries enrolled in Program of All-Inclusive Care for the Elderly (PACE) are excluded frommanaged care and population criteria will be refined for final capitation rate development.
178 of 197Prepared by Mercer GovernmentHuman Services Consulting
RFP 30-190029-DHBSection IX. Medicaid Managed Care Draft Rate Book (SFY 2020)
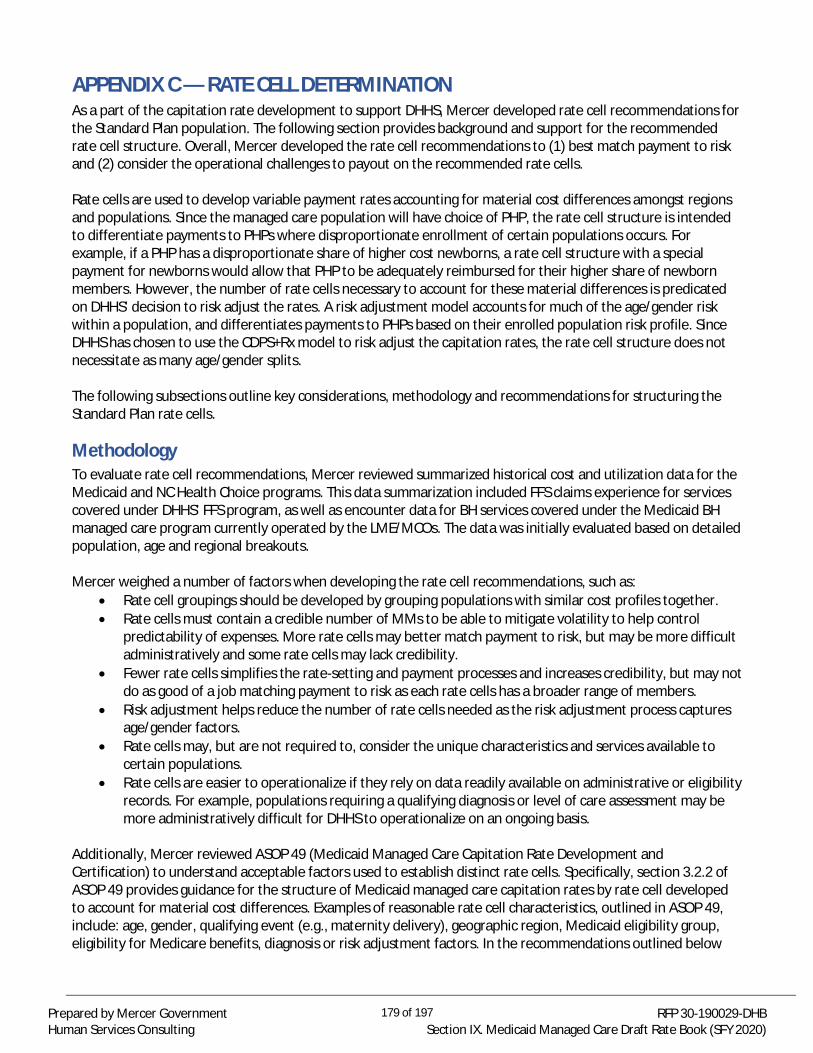
APPENDIX C — RATE CELL DETERMINATIONAs a part of the capitation rate development to support DHHS, Mercer developed rate cell recommendations forthe Standard Plan population. The following section provides background and support for the recommendedrate cell structure. Overall, Mercer developed the rate cell recommendations to (1) best match payment to riskand (2) consider the operational challenges to payout on the recommended rate cells.
Rate cells are used to develop variable payment rates accounting for material cost differences amongst regionsand populations. Since the managed care population will have choice of PHP, the rate cell structure is intendedto differentiate payments to PHPs where disproportionate enrollment of certain populations occurs. Forexample, if a PHP has a disproportionate share of higher cost newborns, a rate cell structure with a specialpayment for newborns would allow that PHP to be adequately reimbursed for their higher share of newbornmembers. However, the number of rate cells necessary to account for these material differences is predicatedon DHHS’ decision to risk adjust the rates. A risk adjustment model accounts for much of the age/gender riskwithin a population, and differentiates payments to PHPs based on their enrolled population risk profile. SinceDHHS has chosen to use the CDPS+Rx model to risk adjust the capitation rates, the rate cell structure does notnecessitate as many age/gender splits.
The following subsections outline key considerations, methodology and recommendations for structuring theStandard Plan rate cells.
MethodologyTo evaluate rate cell recommendations, Mercer reviewed summarized historical cost and utilization data for theMedicaid and NC Health Choice programs. This data summarization included FFS claims experience for servicescovered under DHHS’ FFS program, as well as encounter data for BH services covered under the Medicaid BHmanaged care program currently operated by the LME/MCOs. The data was initially evaluated based on detailedpopulation, age and regional breakouts.
Mercer weighed a number of factors when developing the rate cell recommendations, such as:· Rate cell groupings should be developed by grouping populations with similar cost profiles together.· Rate cells must contain a credible number of MMs to be able to mitigate volatility to help control
predictability of expenses. More rate cells may better match payment to risk, but may be more difficultadministratively and some rate cells may lack credibility.
· Fewer rate cells simplifies the rate-setting and payment processes and increases credibility, but may notdo as good of a job matching payment to risk as each rate cells has a broader range of members.
· Risk adjustment helps reduce the number of rate cells needed as the risk adjustment process capturesage/gender factors.
· Rate cells may, but are not required to, consider the unique characteristics and services available tocertain populations.
· Rate cells are easier to operationalize if they rely on data readily available on administrative or eligibilityrecords. For example, populations requiring a qualifying diagnosis or level of care assessment may bemore administratively difficult for DHHS to operationalize on an ongoing basis.
Additionally, Mercer reviewed ASOP 49 (Medicaid Managed Care Capitation Rate Development andCertification) to understand acceptable factors used to establish distinct rate cells. Specifically, section 3.2.2 ofASOP 49 provides guidance for the structure of Medicaid managed care capitation rates by rate cell developedto account for material cost differences. Examples of reasonable rate cell characteristics, outlined in ASOP 49,include: age, gender, qualifying event (e.g., maternity delivery), geographic region, Medicaid eligibility group,eligibility for Medicare benefits, diagnosis or risk adjustment factors. In the recommendations outlined below
179 of 197Prepared by Mercer GovernmentHuman Services Consulting
RFP 30-190029-DHBSection IX. Medicaid Managed Care Draft Rate Book (SFY 2020)

for the Standard Plan population, Mercer focused on the following: Medicaid eligibility group, age, qualifyingevent and geographic region.
Population Rate Cell RecommendationsHistorical data was summarized by population and age group for beneficiaries covered under the Standard Plan.Mercer first reviewed the cost volatility, cost differential and membership levels on a statewide basis for variouspopulation/age splits.
Mercer also reviewed other state rate cell structures to understand industry standards and also considered howrisk adjustment would help account for any cost differentials by population. As a reminder, the risk adjustmentmodel assigns cost weights by gender, age and also based on certain disease prevalence. Since the riskadjustment model will be calibrated to North Carolina’s specific experience, certain cost differences amongstage bands (e.g., the ABD adult PMPM is more than twice the ABD child PMPM) may be accounted for throughthe risk adjustment process.
Given that DHHS has chosen to risk adjust the capitation rates, Mercer recommended reducing the number ofpopulation/age delineations since there is not a large population difference (other than for ABD) and much ofthe cost differential associated with age breakouts will be captured under the risk adjustment model. As such,Mercer recommended the following four rate cells plus the Maternity Event payment.
See below for observations used to determine the necessary level of detail to retain in the rate cell structure.
The ABD population is much more costly than TANF, NC Health Choice and M-CHIP (ABD costs are more thanfive times the total PMPM cost for other Standard Plan populations). Additionally, there is a separate riskadjustment model for the TANF and ABD population. As such, Mercer recommended a separate ABD rate cell.
ABD observations:· When looking closer at the ABD population, there is a clear cost differential between the newborn, child
and adult group. However, recall that the risk adjustment model will calibrate the cost weights for thedefined age/gender splits in the model and will thus account for the differential. As a point of reference,Mercer reviewed average risk scores from another state Medicaid program by age/gender band for theABD non-dual population. Mercer observed that cost weights from other state experience mirror someof the differential observed in the North Carolina experience. Mercer expects the calibration of riskscores to the North Carolina data will result in more alignment of the risk scores to the differential childand adult costs in the North Carolina ABD population.
· Specific to ABD newborn beneficiaries, in some years these beneficiaries have costs more than threetimes that of the child and adult ABD age groups. However, this group is highly volatile year over year.What’s more, ABD newborn beneficiaries make up less than 1.0% of the ABD population and less than0.1% of the total Standard Plan membership. As such, Mercer recommended blending the ABDnewborns with the rest of the ABD population.
ABD(All Ages)
TANF and OtherRelated Children
(<1)
TANF and OtherRelated Children
(1-20)
TANF and OtherRelated Adults
(21+)
Maternity Event(All Ages)
180 of 197Prepared by Mercer GovernmentHuman Services Consulting
RFP 30-190029-DHBSection IX. Medicaid Managed Care Draft Rate Book (SFY 2020)

TANF and Other Related Children/Adult observations:· The TANF newborn population has a substantial membership base (approximately 900,000), with
steady PMPMs year over year. However, costs are over three times the cost of TANF children (1-20).Thus, given TANF newborns are more costly and have a robust membership base, Mercerrecommended a separate TANF newborn rate cell.
· For the remaining child (1-20 population), Mercer recommended combining the TANF, NC HealthChoice and M-CHIP population into a single rate cell. In the base experience, NC Health Choice and M-CHIP are within +5.0% of the TANF child PMPM. Using a similar risk adjustment analysis as describedabove, Mercer observes the risk scores for these populations are also similar.
· The remaining Medicaid population is exclusively TANF adults; as such, Mercer recommended aseparate rate cell for the TANF adult (21+ population).
As previously discussed, DHHS will make a Maternity Event payment alongside the monthly capitation payment.Maternity Event payments help to align payment to risk. Deliveries are expensive, and prospective riskadjustment models are generally designed to reflect costs associated with chronic conditions, not pregnancy. Asa result, in risk adjusted payment models, event payments are often used to mitigate the risk that any PHP has adisproportionate number of enrollees with maternity expenses.
Regional Rate Cell RecommendationsDHHS has defined six PHP regions (see Section 3, Figure 1). For the Standard Plan population each region hasover 1.7 million MMs; review of the six regional/rate cell combinations also shows a credible number of MMs tobe able to mitigate volatility to help control predictability of expenses. The capitation rates provided in this DraftRate Book reflect the six PHP regions. However, as a part of final capitation rate development, Mercer willevaluate further regional breakouts that may be necessary due to meaningful cost and utilization varianceswithin certain regions beyond those addressed through rate cells and risk adjustment.
181 of 197Prepared by Mercer GovernmentHuman Services Consulting
RFP 30-190029-DHBSection IX. Medicaid Managed Care Draft Rate Book (SFY 2020)

APPENDIX D — CATEGORY OF SERVICE CRITERIAThe following tables represent the mapping logic used to define the detailed COS. The FFS data detailed COSlogic is based on a combination of claim type and State-defined categories based on provider taxonomy. Theencounter data detailed COS logic is based on logic defined and used for the development of the LME/MCOcapitation rates. The COS groups are assigned in a hierarchy, as outlined in the tables below. Note that this listincludes a comprehensive assignment of all COS, and is not limited to those covered under the Standard Plan.
Excluded ServicesCOS Description Data Source Coding Logic
Capitation FFS Claim_Type '4'This excludes the following capitation payments:MedSolutions, PACE, BH LME Capitation, Innovations LMECapitation
Dental FFS Claim_Type 'D' OR(Procedure codes with first character 'D', but NOT [(D0145OR D1206) AND not claim type D])
Local Education Agency FFS Claim_Type '0'Children's Developmental Services Agencies FFS Claim_Type 'V'Excluded Optical Services (Eyeglasses andFittings)
FFS Billing Provider NPI = 1376576777 (Nash Optical Lab) ORProcedure Codes = 92340, 92341, 92342, 92353, 92370
Excluded PCMH Payments FFS Claim_Type ‘M’ AND not identified as an included PCMHPayment below
Covered Services
COS DescriptionCOS DetailedDescription Data Source Coding Logic
Included PCMHPayments
Medical HomePayments
FFS Claim_Type ‘M’ AND BILL_PRVDR_ATYP_NPI is Null ANDpaid amount is: $1.00 OR $2.50 OR $5.00
OBCM Payments FFS Claim_Type 'M' AND BILL_PRVDR_ATYP_NPI is NOT NullAND paid amount is: $4.96 or $4.71
CC4C Payments FFS Claim_Type 'M' AND BILL_PRVDR_ATYP_NPI is NOT NullAND -For all months: paid amount is $4.56 -For only September 2015: paid amount $4.56 or $4.33
Therapies Therapies FFS Claim_type '2'Dental (limited) Dental (limited) FFS Procedure codes D0145 OR D1206, when billed without
claim type ‘D’Inpatient — PH Inpatient — PH FFS [State COS = 0015 (HOSP INPT-GENERAL) OR
0019 (HOSP INPT-SPECIALITY) OR0051 (HOSP INPT-GEN XOVERS) OR0040 (HOSP INPT-INDIAN)]
Inpatient — BH Inpatient — BH LME/MCOEncounters
Revenue code 101–182, 184–219
Emergency Room Emergency Room FFS Revenue code 0450 - 0459 OR CPT codes 99281 - 99285State COS = 0050 (HOSP OUTPT-EMER. ROOM)Note: If claim has Inpatient bill type, dollars should beassigned to Inpatient regardless of Emergency Roomrevenue code or Emergency Room State COS.
LME/MCOEncounters
Revenue code 0450 - 0459 OR CPT codes 99281 - 99285Note: If claim has Inpatient bill type, dollars should beassigned to Inpatient regardless of Emergency Roomrevenue code.
182 of 197Prepared by Mercer GovernmentHuman Services Consulting
RFP 30-190029-DHBSection IX. Medicaid Managed Care Draft Rate Book (SFY 2020)

COS DescriptionCOS DetailedDescription Data Source Coding Logic
Outpatient Hospital— PH
Outpatient Hospital— PH
FFS [State COS = 0016 (HOSP OUTPT-GENERAL) OR0045 (HOSP OUTPT-SPECIALITY) OR0048 (AMBULATORY SURG CENTER) OR0052 (HOSP OUTPT-GEN XOVERS) OR0042 (HOSP OUTPT-INDIAN)]
Outpatient Hospital— BH
Outpatient Hospital— BH
LME/MCOEncounters
Procedure codes 90785, 90791, 90792, 90801–90899,96100, 96101, 96110, 96111, 96115–96118, G0431, G0434,H0001, H0002, H0004, H0005, H0010, H0012–H0015,H0020, H0031, H2035, Q3014, S9485, T1023, covered E/Mcodes (99xxx) or Revenue codes 450–459, 900–910, 912–918
LTSS — ICF/IID andNursing Home
ICF/IID FFS State COS = 0021 (LTC-ICF MRC, SO) OR0047 (LTC-ICF MRC, NSO)
LME/MCOEncounters
Revenue code 100 or 183
Nursing Home FFS State COS = 0020 (LTC-ICF SO AND NSO) OR0022 (NF-ICF SWING BEDS) OR0035 (LTC-SNF SO AND NSO) OR0036 (NF-SNF SWING BEDS) OR0039 (NF-INDIAN HEALTH) OR0049 (HOSP LONG TERM CARE) OR0071 (NF-HEAD LEVEL OF CARE) OR0072 (NF-VENT LEVEL OF CARE)
Other BH Services PsychiatricResidentialTreatment Facility(PRTF)
FFS State COS = 0017 (HOSP INPT-MTL,SO < 21) OR0041 (HOSP INPT-MTL,NSO < 21)
LME/MCOEncounters
Revenue code 911 or 919
Other BH Services FFS State COS = 0070 (PRACTITIONER-NON PHYS) OR0084 (HIGH RISK INTERVENTION)
Assertive CommunityTreatment (ACT)
LME/MCOEncounters
Procedure code H0040
Community Support LME/MCOEncounters
Procedure code H0036, [H2015 AND COA other thanInnovations]
Crisis Services LME/MCOEncounters
Procedure code S9484, [H2011 AND COA other thanInnovations]
Intensive In-HomeServices (IIHS)
LME/MCOEncounters
Procedure code H2022
MultisystemicTherapy (MST)
LME/MCOEncounters
Procedure code H2033
Outpatient (includingpsychotherapy andlimited alcohol/drugservices)
LME/MCOEncounters
Procedure codes 90785, 90791, 90792, 90801–90899,96100, 96101, 96110, 96111, 96115–96118, G0431, G0434,H0001, H0002, H0004, H0005, H0010, H0012–H0015,H0020, H0031, H2035, Q3014, S9485, T1023, covered E/Mcodes (99xxx) or Revenue codes 450–459, 900–910, 912–919
Partial Hosp/Day Tx LME/MCOEncounters
Procedure code H0035, H2012
Psych Rehab LME/MCOEncounters
Procedure code H2017
BH Long-termResidential
LME/MCOEncounters
Procedure code H0019, H0046, H2020, S5145
183 of 197Prepared by Mercer GovernmentHuman Services Consulting
RFP 30-190029-DHBSection IX. Medicaid Managed Care Draft Rate Book (SFY 2020)
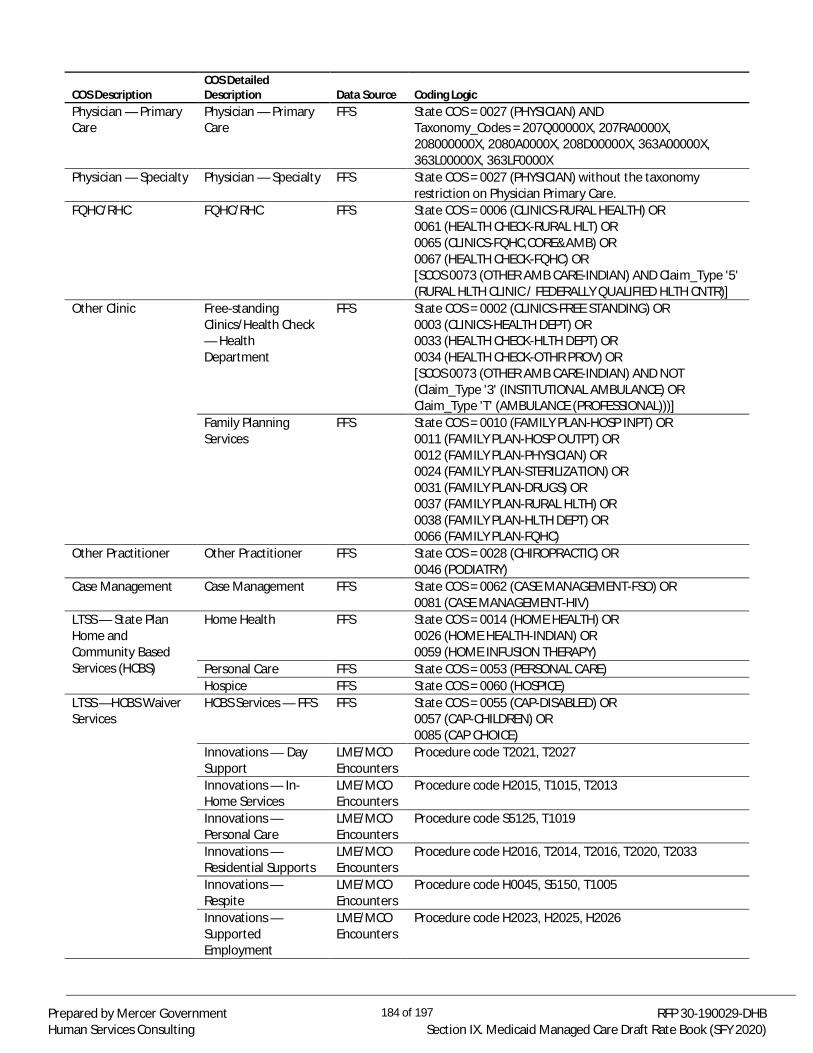
COS DescriptionCOS DetailedDescription Data Source Coding Logic
Physician — PrimaryCare
Physician — PrimaryCare
FFS State COS = 0027 (PHYSICIAN) ANDTaxonomy_Codes = 207Q00000X, 207RA0000X,208000000X, 2080A0000X, 208D00000X, 363A00000X,363L00000X, 363LF0000X
Physician — Specialty Physician — Specialty FFS State COS = 0027 (PHYSICIAN) without the taxonomyrestriction on Physician Primary Care.
FQHC/RHC FQHC/RHC FFS State COS = 0006 (CLINICS-RURAL HEALTH) OR0061 (HEALTH CHECK-RURAL HLT) OR0065 (CLINICS-FQHC,CORE&AMB) OR0067 (HEALTH CHECK-FQHC) OR[SCOS 0073 (OTHER AMB CARE-INDIAN) AND Claim_Type '5'(RURAL HLTH CLINIC / FEDERALLY QUALIFIED HLTH CNTR)]
Other Clinic Free-standingClinics/Health Check— HealthDepartment
FFS State COS = 0002 (CLINICS-FREE STANDING) OR0003 (CLINICS-HEALTH DEPT) OR0033 (HEALTH CHECK-HLTH DEPT) OR0034 (HEALTH CHECK-OTHR PROV) OR[SCOS 0073 (OTHER AMB CARE-INDIAN) AND NOT(Claim_Type '3' (INSTITUTIONAL AMBULANCE) ORClaim_Type 'T' (AMBULANCE (PROFESSIONAL)))]
Family PlanningServices
FFS State COS = 0010 (FAMILY PLAN-HOSP INPT) OR0011 (FAMILY PLAN-HOSP OUTPT) OR0012 (FAMILY PLAN-PHYSICIAN) OR0024 (FAMILY PLAN-STERILIZATION) OR0031 (FAMILY PLAN-DRUGS) OR0037 (FAMILY PLAN-RURAL HLTH) OR0038 (FAMILY PLAN-HLTH DEPT) OR0066 (FAMILY PLAN-FQHC)
Other Practitioner Other Practitioner FFS State COS = 0028 (CHIROPRACTIC) OR0046 (PODIATRY)
Case Management Case Management FFS State COS = 0062 (CASE MANAGEMENT-FSO) OR0081 (CASE MANAGEMENT-HIV)
LTSS — State PlanHome andCommunity BasedServices (HCBS)
Home Health FFS State COS = 0014 (HOME HEALTH) OR0026 (HOME HEALTH-INDIAN) OR0059 (HOME INFUSION THERAPY)
Personal Care FFS State COS = 0053 (PERSONAL CARE)Hospice FFS State COS = 0060 (HOSPICE)
LTSS —HCBS WaiverServices
HCBS Services — FFS FFS State COS = 0055 (CAP-DISABLED) OR0057 (CAP-CHILDREN) OR0085 (CAP CHOICE)
Innovations — DaySupport
LME/MCOEncounters
Procedure code T2021, T2027
Innovations — In-Home Services
LME/MCOEncounters
Procedure code H2015, T1015, T2013
Innovations —Personal Care
LME/MCOEncounters
Procedure code S5125, T1019
Innovations —Residential Supports
LME/MCOEncounters
Procedure code H2016, T2014, T2016, T2020, T2033
Innovations —Respite
LME/MCOEncounters
Procedure code H0045, S5150, T1005
Innovations —SupportedEmployment
LME/MCOEncounters
Procedure code H2023, H2025, H2026
184 of 197Prepared by Mercer GovernmentHuman Services Consulting
RFP 30-190029-DHBSection IX. Medicaid Managed Care Draft Rate Book (SFY 2020)

COS DescriptionCOS DetailedDescription Data Source Coding LogicInnovations — Other LME/MCO
EncountersProcedure code H2011, S5110, S5111, S5165, T1999, T2025,T2029, T2034, T2038, T2039, T2041 or [B4100–B4162 AND[age_group] = 21+]
FFS InnovationsServices
FFS State COS = 0056 (CAP-MENTALLY RETARDED)
B3 Services B3 Services LME/MCOEncounters
Procedure code 99241 U4, 99242 U4, 99244 U4, H0038,S5151, T1012, H2022 U4, [(H0045, H2016, H2023, H2025-H2026, S5110, S5111, S5125, S5150, S5165, T1005, T1015,T1019, T2013, T2014, T2020, T2021, T2025, T2027, T2029,T2034, T2038, T2039 or T2041) AND COA other thanInnovations]
Prescribed Drugs Prescribed Drugs FFS State COS = 0032 (PRESCRIBED DRUGS)Durable MedicalEquipment
Durable MedicalEquipment
FFS State COS = 0013 (HEARING AIDS) OR0054 (DURABLE MEDICAL EQUIP)
Optical Optical FFS State COS = 0029 (OPTICAL SUPPLIES) OR0030 (OPTICAL)
Lab and X-ray Lab and X-ray FFS State COS = 0023 (LAB AND X-RAY)Transportation Transportation FFS State COS = 0001 (AMBULANCE) OR
[SCOS 0073 (OTHER AMB CARE-INDIAN) AND (Claim_Type'3' (INSTITUTIONAL AMBULANCE) OR Claim_Type 'T'(AMBULANCE (PROFESSIONAL)))]
Transportation NEMT FFS State COS = 0088 (TRANSPORTATION-COUNTY)
185 of 197Prepared by Mercer GovernmentHuman Services Consulting
RFP 30-190029-DHBSection IX. Medicaid Managed Care Draft Rate Book (SFY 2020)

APPENDIX E — BH I/DD TAILORED PLAN CRITERIAThe criteria utilized to summarize beneficiaries eligible for the BH I/DD Tailored Plan is outlined below and isbased on DHHS’ initially proposed approach from the Fall of 2018. S.L. 2018-48 put forth additional criteria forBH I/DD Tailored Plan eligibility which will be evaluated and considered in final capitation rate development. Alldiagnosis codes provided in Appendix E will be reviewed for final rate development to ensure consistency withfinal program requirements.
Mercer identified beneficiaries eligible for a BH I/DD Tailored Plan by reviewing historical data for beneficiariesmeeting the clinical criteria at least once during a SFY (July 1 through June 30). The Foster Children and AdoptedChildren, CAP/C, CAP/DA and NFLOC population groups were not categorized as BH I/DD Tailored Plan unlessthey were enrolled in the Innovations waiver. The clinical condition criteria are applied as a hierarchy such thatbeneficiaries only fall within one of the clinical condition categories in a given year. The following populationswould be included in the BH I/DD Tailored Plan:
· I/DD· Serious Emotional Disturbance (SED)/Serious and Persistent Mental Illness (SPMI)· SUD
Beneficiaries enrolled in the TBI waiver and those with historical utilization of State-funded mental healthservices will also be eligible for BH I/DD Tailored Plans. However, the TBI waiver was not in effect during thebase time period, so claims data for TBI waiver enrollees was not available. Additionally, the identification logicwas limited to Medicaid and NC Health Choice claims data, and thus did not capture State-funded mental healthservice recipients. Children with complex needs, children ages 0 to 3 years old at risk for developmental delay ordisability, and children/youth involved with the Division of Juvenile Justice of the Department of Public Safetywho meet certain criteria may also be included in the BH I/DD Tailored Plans. However, these groups have notbeen separately identified for purposes of summarizing the BH I/DD Tailored Plan population at this time.
I/DD CriteriaThis group will be eligible for the BH I/DD Tailored Plan, and exempt from Standard Plan enrollment. In order toidentify qualifying beneficiaries, Mercer used the available claims and eligibility information to identify the I/DDgroup; specifically, beneficiaries were assigned if they met at least one of the following criteria:
· Innovations — Special Coverage Code of CM, C2 or IN (Innovations eligibility indicators).· ICF/IID — FFS data claim type Q (Mental Health) and FFS COS 0021 (LTC-ICF MRC, SO) or 0047 (LTC-ICF
MRC, NSO). Encounter data claim experience with revenue codes 100 (room and board, all-inclusive plusancillary) or 183 (therapeutic leave) used by the LME/MCOs to reimburse for ICF/IID services.
· B3 — One or more claims falling under the B3 COS.· Innovations Waitlist — Beneficiaries who were included on the waitlist for the Innovations waiver
provided by DHHS.· Transition to Community Living Initiative (TCLI) — Beneficiaries who were included on the TCLI roster
provided by DHHS.· Diagnosis — List of I/DD diagnosis codes (all diagnosis positions) supplied by DHHS.
A list of qualifying I/DD ICD-10 diagnosis codes supplied by DHHS is provided in the table below. These diagnoseswill be reviewed for final rate development for consistency with final program requirements.
Code Description Code DescriptionD82.10 Di George's syndrome F84.90 Pervasive Developmental Disorder, UnspecifiedE70.00 Classical phenylketonuria F88.00 Other disorders of psychological developmentE75.02 Tay-Sachs disease F89.00 Unspecified disorder of psychological developmentE75.19 Other Gangliosidosis G31.81 Alpers disease
186 of 197Prepared by Mercer GovernmentHuman Services Consulting
RFP 30-190029-DHBSection IX. Medicaid Managed Care Draft Rate Book (SFY 2020)
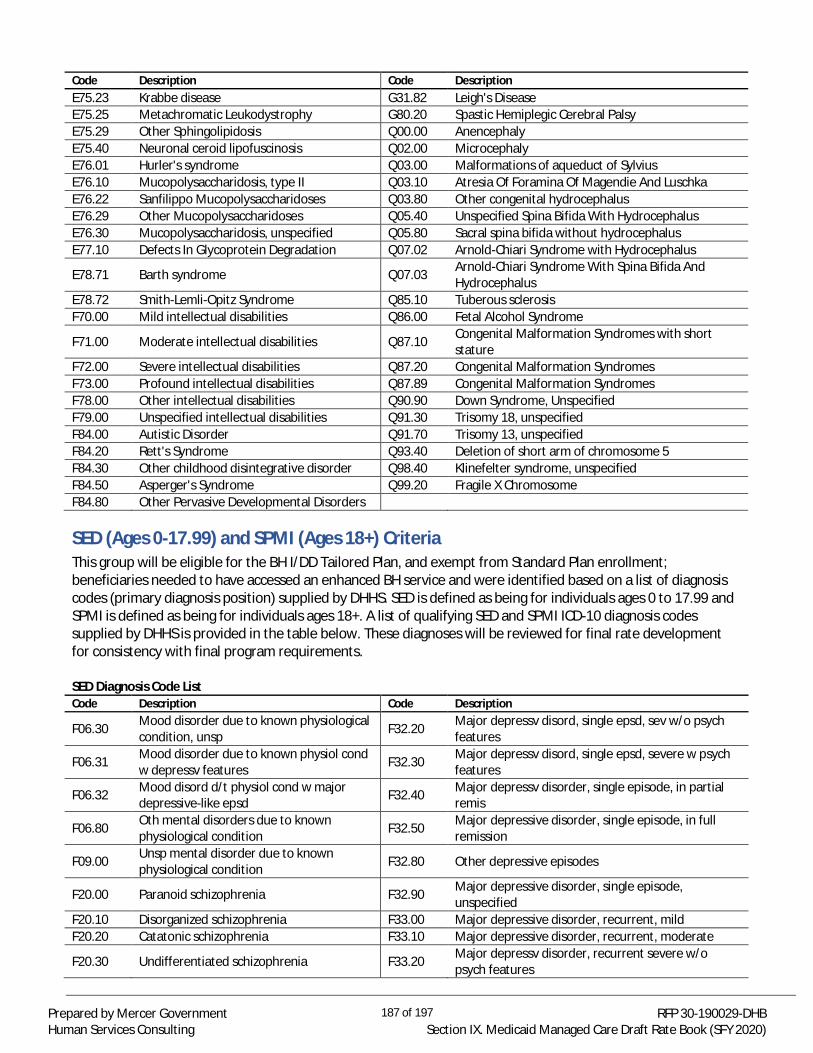
Code Description Code DescriptionE75.23 Krabbe disease G31.82 Leigh's DiseaseE75.25 Metachromatic Leukodystrophy G80.20 Spastic Hemiplegic Cerebral PalsyE75.29 Other Sphingolipidosis Q00.00 AnencephalyE75.40 Neuronal ceroid lipofuscinosis Q02.00 MicrocephalyE76.01 Hurler's syndrome Q03.00 Malformations of aqueduct of SylviusE76.10 Mucopolysaccharidosis, type II Q03.10 Atresia Of Foramina Of Magendie And LuschkaE76.22 Sanfilippo Mucopolysaccharidoses Q03.80 Other congenital hydrocephalusE76.29 Other Mucopolysaccharidoses Q05.40 Unspecified Spina Bifida With HydrocephalusE76.30 Mucopolysaccharidosis, unspecified Q05.80 Sacral spina bifida without hydrocephalusE77.10 Defects In Glycoprotein Degradation Q07.02 Arnold-Chiari Syndrome with Hydrocephalus
E78.71 Barth syndrome Q07.03 Arnold-Chiari Syndrome With Spina Bifida AndHydrocephalus
E78.72 Smith-Lemli-Opitz Syndrome Q85.10 Tuberous sclerosisF70.00 Mild intellectual disabilities Q86.00 Fetal Alcohol Syndrome
F71.00 Moderate intellectual disabilities Q87.10 Congenital Malformation Syndromes with shortstature
F72.00 Severe intellectual disabilities Q87.20 Congenital Malformation SyndromesF73.00 Profound intellectual disabilities Q87.89 Congenital Malformation SyndromesF78.00 Other intellectual disabilities Q90.90 Down Syndrome, UnspecifiedF79.00 Unspecified intellectual disabilities Q91.30 Trisomy 18, unspecifiedF84.00 Autistic Disorder Q91.70 Trisomy 13, unspecifiedF84.20 Rett's Syndrome Q93.40 Deletion of short arm of chromosome 5F84.30 Other childhood disintegrative disorder Q98.40 Klinefelter syndrome, unspecifiedF84.50 Asperger's Syndrome Q99.20 Fragile X ChromosomeF84.80 Other Pervasive Developmental Disorders
SED (Ages 0-17.99) and SPMI (Ages 18+) CriteriaThis group will be eligible for the BH I/DD Tailored Plan, and exempt from Standard Plan enrollment;beneficiaries needed to have accessed an enhanced BH service and were identified based on a list of diagnosiscodes (primary diagnosis position) supplied by DHHS. SED is defined as being for individuals ages 0 to 17.99 andSPMI is defined as being for individuals ages 18+. A list of qualifying SED and SPMI ICD-10 diagnosis codessupplied by DHHS is provided in the table below. These diagnoses will be reviewed for final rate developmentfor consistency with final program requirements.
SED Diagnosis Code ListCode Description Code Description
F06.30 Mood disorder due to known physiologicalcondition, unsp F32.20 Major depressv disord, single epsd, sev w/o psych
features
F06.31 Mood disorder due to known physiol condw depressv features F32.30 Major depressv disord, single epsd, severe w psych
features
F06.32 Mood disord d/t physiol cond w majordepressive-like epsd F32.40 Major depressv disorder, single episode, in partial
remis
F06.80 Oth mental disorders due to knownphysiological condition F32.50 Major depressive disorder, single episode, in full
remission
F09.00 Unsp mental disorder due to knownphysiological condition F32.80 Other depressive episodes
F20.00 Paranoid schizophrenia F32.90 Major depressive disorder, single episode,unspecified
F20.10 Disorganized schizophrenia F33.00 Major depressive disorder, recurrent, mildF20.20 Catatonic schizophrenia F33.10 Major depressive disorder, recurrent, moderate
F20.30 Undifferentiated schizophrenia F33.20 Major depressv disorder, recurrent severe w/opsych features
187 of 197Prepared by Mercer GovernmentHuman Services Consulting
RFP 30-190029-DHBSection IX. Medicaid Managed Care Draft Rate Book (SFY 2020)

Code Description Code Description
F20.50 Residual schizophrenia F33.30 Major depressv disorder, recurrent, severe w psychsymptoms
F20.81 Schizophreniform disorder F33.40 Major depressive disorder, recurrent, in remission,unsp
F20.89 Other schizophrenia F33.41 Major depressive disorder, recurrent, in partialremission
F20.90 Schizophrenia, unspecified F33.42 Major depressive disorder, recurrent, in fullremission
F22.00 Delusional disorders F33.80 Other recurrent depressive disordersF23.00 Brief psychotic disorder F33.90 Major depressive disorder, recurrent, unspecifiedF24.00 Shared psychotic disorder F34.10 Dysthymic disorderF25.00 Schizoaffective disorder, bipolar type F34.80 Other persistent mood [affective] disordersF25.10 Schizoaffective disorder, depressive type F34.90 Persistent mood [affective] disorder, unspecifiedF25.80 Other schizoaffective disorders F39.00 Unspecified mood [affective] disorderF25.90 Schizoaffective disorder, unspecified F40.00 Agoraphobia, unspecified
F28.00 Oth psych disorder not due to a sub orknown physiol cond F40.01 Agoraphobia with panic disorder
F29.00 Unsp psychosis not due to a substance orknown physiol cond F40.02 Agoraphobia without panic disorder
F30.10 Manic episode without psychoticsymptoms, unspecified F40.10 Social phobia, unspecified
F30.11 Manic episode without psychoticsymptoms, mild F40.11 Social phobia, generalized
F30.12 Manic episode without psychoticsymptoms, moderate F40.80 Other phobic anxiety disorders
F30.13 Manic episode, severe, without psychoticsymptoms F41.00 Panic disorder without agoraphobia
F30.20 Manic episode, severe with psychoticsymptoms F41.10 Generalized anxiety disorder
F30.30 Manic episode in partial remission F41.30 Other mixed anxiety disordersF30.40 Manic episode in full remission F41.80 Other specified anxiety disordersF30.80 Other manic episodes F41.90 Anxiety disorder, unspecifiedF30.90 Manic episode, unspecified F42.00 Obsessive-compulsive disorder
F31.00 Bipolar disorder, current episodehypomanic F43.10 Post-traumatic stress disorder, unspecified
F31.10 Bipolar disord, crnt episode manic w/opsych features, unsp F43.12 Post-traumatic stress disorder, chronic
F31.11 Bipolar disord, crnt episode manic w/opsych features, mild F44.89 Other dissociative and conversion disorders
F31.12 Bipolar disord, crnt episode manic w/opsych features, mod F50.00 Anorexia nervosa, unspecified
F31.13 Bipolar disord, crnt epsd manic w/o psychfeatures, severe F50.01 Anorexia nervosa, restricting type
F31.20 Bipolar disord, crnt episode manic severew psych features F50.02 Anorexia nervosa, binge eating/purging type
F31.30 Bipolar disord, crnt epsd depress, mild ormod severt, unsp F50.20 Bulimia nervosa
F31.31 Bipolar disorder, current episodedepressed, mild F50.80 Other eating disorders
F31.32 Bipolar disorder, current episodedepressed, moderate F50.90 Eating disorder, unspecified
F31.40 Bipolar disord, crnt epsd depress, sev, w/opsych features F63.10 Pyromania
188 of 197Prepared by Mercer GovernmentHuman Services Consulting
RFP 30-190029-DHBSection IX. Medicaid Managed Care Draft Rate Book (SFY 2020)

Code Description Code Description
F31.50 Bipolar disord, crnt epsd depress, severe,w psych features F63.30 Trichotillomania
F31.60 Bipolar disorder, current episode mixed,unspecified F63.81 Intermittent explosive disorder
F31.61 Bipolar disorder, current episode mixed,mild F63.89 Other impulse disorders
F31.62 Bipolar disorder, current episode mixed,moderate F84.00 Autistic disorder
F31.63 Bipolar disord, crnt epsd mixed, severe,w/o psych features F84.50 Asperger's syndrome
F31.64 Bipolar disord, crnt episode mixed, severe,w psych features F90.00 Attn-defct hyperactivity disorder, predom
inattentive type
F31.70 Bipolar disord, currently in remis, mostrecent episode unsp F90.10 Attn-defct hyperactivity disorder, predom
hyperactive type
F31.71 Bipolar disord, in partial remis, most recentepsd hypomanic F90.20 Attention-deficit hyperactivity disorder, combined
type
F31.72 Bipolar disord, in full remis, most recentepisode hypomanic F90.80 Attention-deficit hyperactivity disorder, other type
F31.73 Bipolar disord, in partial remis, most recentepisode manic F90.90 Attention-deficit hyperactivity disorder, unspecified
type
F31.74 Bipolar disorder, in full remis, most recentepisode manic F91.00 Conduct disorder confined to family context
F31.75 Bipolar disord, in partial remis, most recentepsd depress F91.10 Conduct disorder, childhood-onset type
F31.76 Bipolar disorder, in full remis, most recentepisode depress F91.20 Conduct disorder, adolescent-onset type
F31.77 Bipolar disord, in partial remis, most recentepisode mixed F91.30 Oppositional defiant disorder
F31.78 Bipolar disorder, in full remis, most recentepisode mixed F91.80 Other conduct disorders
F31.81 Bipolar II disorder F91.90 Conduct disorder, unspecifiedF31.89 Other bipolar disorder F94.10 Reactive attachment disorder of childhoodF31.90 Bipolar disorder, unspecified F94.20 Disinhibited attachment disorder of childhood
F32.00 Major depressive disorder, single episode,mild F98.80 Oth behav/emotn disord w onset usly occur in
chldhd and adol
F32.10 Major depressive disorder, single episode,moderate F99.00 Mental disorder, not otherwise specified
SPMI Diagnosis Code ListCode Description Code DescriptionF20.81 Schizophreniform disorder F32.10 Major depressive disorder, single episode, moderate
F20.90 Schizophrenia, unspecified F32.20 Major depressv disord, single epsd, sev w/o psychfeatures
F21.00 Schizotypal disorder F32.30 Major depressv disord, single epsd, severe w psychfeatures
F25.00 Schizoaffective disorder, bipolar type F32.40 Major depressv disorder, single episode, in partialremis
F25.10 Schizoaffective disorder, depressive type F32.90 Major depressive disorder, single episode,unspecified
F29.00 Unsp psychosis not due to a substance orknown physiol cond F33.00 Major depressive disorder, recurrent, mild
F31.00 Bipolar disorder, current episodehypomanic F33.10 Major depressive disorder, recurrent, moderate
189 of 197Prepared by Mercer GovernmentHuman Services Consulting
RFP 30-190029-DHBSection IX. Medicaid Managed Care Draft Rate Book (SFY 2020)

Code Description Code Description
F31.11 Bipolar disord, crnt episode manic w/opsych features, mild F33.20 Major depressv disorder, recurrent severe w/o
psych features
F31.12 Bipolar disord, crnt episode manic w/opsych features, mod F33.30 Major depressv disorder, recurrent, severe w psych
symptoms
F31.13 Bipolar disord, crnt epsd manic w/o psychfeatures, severe F33.41 Major depressive disorder, recurrent, in partial
remission
F31.20 Bipolar disord, crnt episode manic severew psych features F33.90 Major depressive disorder, recurrent, unspecified
F31.31 Bipolar disorder, current episodedepressed, mild F40.00 Agoraphobia, unspecified
F31.32 Bipolar disorder, current episodedepressed, moderate F41.00 Panic disorder without agoraphobia
F31.40 Bipolar disord, crnt epsd depress, sev, w/opsych features F41.10 Generalized anxiety disorder
F31.50 Bipolar disord, crnt epsd depress, severe,w psych features F42.00 Obsessive-compulsive disorder
F31.73 Bipolar disord, in partial remis, most recentepisode manic F43.10 Post-traumatic stress disorder, unspecified
F31.75 Bipolar disord, in partial remis, most recentepsd depress F44.00 Dissociative amnesia
F31.81 Bipolar II disorder F44.10 Dissociative fugueF31.89 Other bipolar disorder F44.81 Dissociative identity disorderF31.90 Bipolar disorder, unspecified F44.89 Other dissociative and conversion disorders
F32.00 Major depressive disorder, single episode,mild F44.90 Dissociative and conversion disorder, unspecified
SUD CriteriaThis group will be eligible for the BH I/DD Tailored Plan, and exempt from Standard Plan enrollment;beneficiaries needed to have accessed an enhanced BH service and were identified based on a list of diagnosiscodes (primary diagnosis position) supplied by DHHS along with beneficiaries with a qualifying SUD drug claim. Alist of qualifying SUD ICD-10 diagnosis codes supplied by DHHS for both non-severe and dependence-levelconditions is provided in the tables below. These diagnoses will be reviewed for final rate development forconsistency with final program requirements.
SUD Non-Severe Diagnosis Code ListCode Description Code Description
F10.10 Alcohol abuse, uncomplicated F13.10 Sedative, hypnotic or anxiolytic abuse,uncomplicated
F10.121 Alcohol abuse with intoxication delirium F13.231 Sedatv/hyp/anxiolytc dependence w withdrawaldelirium
F10.221 Alcohol dependence with intoxicationdelirium F13.232 Sedatv/hyp/anxiolytc depend w w/drawal w
perceptual disturb
F10.231 Alcohol dependence with withdrawaldelirium F13.239 Sedatv/hyp/anxiolytc dependence w withdrawal,
unsp
F10.232 Alcohol dependence w withdrawal withperceptual disturbance F14.10 Cocaine abuse, uncomplicated
F10.239 Alcohol dependence with withdrawal,unspecified F14.23 Cocaine dependence with withdrawal
F10.921 Alcohol use, unspecified with intoxicationdelirium F15.10 Other stimulant abuse, uncomplicated
F11.10 Opioid abuse, uncomplicated F15.23 Other stimulant dependence with withdrawalF11.120 Opioid abuse with intoxication, F15.929 Other stimulant use, unsp with intoxication,
190 of 197Prepared by Mercer GovernmentHuman Services Consulting
RFP 30-190029-DHBSection IX. Medicaid Managed Care Draft Rate Book (SFY 2020)

Code Description Code Descriptionuncomplicated unspecified
F11.129 Opioid abuse with intoxication, unspecified F15.93 Other stimulant use, unspecified with withdrawalF11.23 Opioid dependence with withdrawal F16.10 Hallucinogen abuse, uncomplicatedF11.90 Opioid use, unspecified, uncomplicated F17.203 Nicotine dependence unspecified, with withdrawalF11.93 Opioid use, unspecified with withdrawal F18.10 Inhalant abuse, uncomplicatedF12.10 Cannabis abuse, uncomplicated F19.10 Other psychoactive substance abuse, uncomplicated
F12.288 Cannabis dependence with other cannabis-induced disorder F19.231 Oth psychoactive substance dependence w
withdrawal delirium
F12.90 Cannabis use, unspecified, uncomplicated F19.239 Oth psychoactive substance dependence withwithdrawal, unsp
SUD Dependence-Level Diagnosis Code ListCode Description Code Description
F10.20 Alcohol dependence, uncomplicated F19.220 Oth psychoactive substance dependence wintoxication, uncomp
F11.20 Opioid dependence, uncomplicated F19.24 Oth psychoactive substance dependence w mooddisorder
F12.20 Cannabis dependence, uncomplicated F19.259 Oth psychoactv substance depend w psychoticdisorder, unsp
F13.20 Sedative, hypnotic or anxiolyticdependence, uncomplicated F19.26 Oth psychoactv substance depend w persist
amnestic disorder
F14.20 Cocaine dependence, uncomplicated F19.280 Oth psychoactive substance dependence w anxietydisorder
F15.20 Other stimulant dependence,uncomplicated F19.281 Oth psychoactive substance dependence w sexual
dysfunction
F16.20 Hallucinogen dependence, uncomplicated F19.282 Oth psychoactive substance dependence w sleepdisorder
F18.20 Inhalant dependence, uncomplicated F19.288 Oth psychoactive substance dependence w othdisorder
F19.20 Other psychoactive substancedependence, uncomplicated F19.29 Oth psychoactive substance dependence w unsp
disorder
F19.21 Other psychoactive substancedependence, in remission
191 of 197Prepared by Mercer GovernmentHuman Services Consulting
RFP 30-190029-DHBSection IX. Medicaid Managed Care Draft Rate Book (SFY 2020)

APPENDIX F — BH I/DD TAILORED PLAN POPULATIONPursuant to S.L. 2015-245, as amended, DHHS will contract with BH I/DD Tailored Plans for individuals with highBH needs. The BH I/DD Tailored Plans are expected to launch no sooner than one year after the implementationof Standard Plans. The majority of Medicaid and NC Health Choice beneficiaries, including adults and childrenwith lower BH needs, will receive services through the Standard Plan upon launch of managed care. Prior tolaunch of the BH I/DD Tailored Plans, individuals with higher BH needs that meet certain eligibility criteria willcontinue to receive coverage through their current delivery system, and have the option to enroll in a StandardPlan. Following launch of the BH I/DD Tailored Plans, eligible beneficiaries will be enrolled into the BH I/DDTailored Plans with the option to enroll in a Standard Plan. Please see the Behavioral Health andIntellectual/Developmental Disability Tailored Plan Medicaid Managed Care Proposed Concept Paper, releasedon November 9, 2017 for additional information on the proposed BH I/DD Tailored Plan design.22 Additionalinformation is included in S.L. 2018-48 legislation. Information outlined below does not reflect legislativechanges made during the 2018 session.
Population Eligible for BH I/DD Tailored PlanDetailed logic used for identifying the population eligible for BH I/DD Tailored Plans that were excluded from theStandard Plan population for purposes of draft rate development is outlined in Appendix E. This logic will bereviewed for final rate development for consistency with final program requirements.
The tables below illustrate the PMPM and average monthly member count for the Standard Plan population, aswell as various sub-populations of the BH I/DD Tailored Plan group. The BH I/DD Tailored Plan columns are alsosummarized by Standard Plan rate cells to illustrate what population group these members would be included inif they opt out of the BH I/DD Tailored Plan (or their current delivery system prior to BH I/DD Tailored Planlaunch). Approximately 10.0% of the I/DD population represents Innovations waiver participants and ICF/IIDusers who are not expected to opt out of the BH I/DD Tailored Plan as these services will only be availablethrough the BH I/DD Tailored Plan. These individuals are included in the I/DD figures below.
Standard Plan and Non-Dual BH I/DD Tailored Plan Population PMPM Summary (based on SFY 2017 experience)
COAStandard Plan
Population
BH I/DD Tailored Plan Population
I/DD SPMI/SED SUDTotal BH I/DD Tailored
Plan PopulationABD $993.02 $2,707.27 $2,314.62 $1,643.31 $2,594.58TANF, Newborn (<1) $388.12 $2,146.91 $2,064.69 $1,786.54 $2,146.65TANF, Child (1-20) $110.47 $666.82 $1,666.39 $499.46 $1,013.98TANF, Adult (21+) $292.20 $1,211.15 $1,257.40 $893.45 $1,069.22Maternity Event $4,991.76 $8,822.83 $8,198.65 $6,356.14 $7,466.61Total $240.91 $1,942.30 $1,829.09 $1,070.28 $1,831.13
Standard Plan and Non-Dual BH I/DD Tailored Plan Population Average Monthly Member Count
COAStandard Plan
Population
BH I/DD Tailored Plan Population
I/DD SPMI/SED SUDTotal BH I/DD Tailored
Plan PopulationABD 132,816 33,330 7,062 1,870 42,262TANF, Newborn (<1) 70,808 1,289 2 1 1,292TANF, Child (1-20) 1,111,653 19,237 10,962 920 31,118TANF, Adult (21+) 242,395 2,032 3,435 5,318 10,785Maternity Event 4,456 30 39 62 130Total 1,557,672 55,888 21,460 8,108 85,456
22 Behavioral Health and I/DD Tailored Plan Concept Paper. November 9, 2017. https://files.nc.gov/ncdhhs/documents/files/BH-IDD-TailoredPlan_ConceptPaper_20181109.pdf?CkZhWxchGeNGBa2wXQSrSwWPrqi41aVP
192 of 197Prepared by Mercer GovernmentHuman Services Consulting
RFP 30-190029-DHBSection IX. Medicaid Managed Care Draft Rate Book (SFY 2020)

As shown above, the non-dual BH I/DD Tailored Plan population assumed for draft capitation rate developmentis approximately eight times costlier, on a per member basis, compared to the Standard Plan population. Whennarrowing this comparison to non-I/DD non-dual BH I/DD Tailored Plan members, this sub-population isapproximately seven times costlier, on a per member basis, compared to the Standard Plan population.However, it is important to note that overall the Standard Plan has a significantly larger membership base. Thetotal non-dual BH I/DD Tailored Plan population exempt from Standard Plan enrollment representsapproximately 5.5% of the total combined Standard Plan and non-dual BH I/DD Tailored Plan members on astatewide basis.
Standard Plan Beneficiaries Demonstrating Potential Need for BH I/DD Tailored PlansBeneficiaries who are enrolled in a Standard Plan will have the ability to opt in to the BH I/DD Tailored Plan (orFFS and LME/MCO prior to the launch of the BH I/DD Tailored Plans) if they demonstrate a need for a serviceoffered only through the BH I/DD Tailored Plan (or LME/MCO). Given the potential for individuals to shiftbetween the Standard Plan and BH I/DD Tailored Plan, Mercer will continue to evaluate the cost profiles ofthese different populations to understand potential impact to capitation rates. No considerations have beenmade in the draft rates for any shifting expectation. Mercer and DHHS will continue to discuss this issue and mayincorporate consideration into risk adjustment or an adjustment into final rate development.
Information related to the BH I/DD Tailored Plan population does not reflect legislative changes made duringthe 2018 session.
193 of 197Prepared by Mercer GovernmentHuman Services Consulting
RFP 30-190029-DHBSection IX. Medicaid Managed Care Draft Rate Book (SFY 2020)

APPENDIX G – APPROACH TO MEDICAID HOSPITAL PAYMENTS AFTER THE TRANSITION TO MANAGEDCARE
North Carolina’s Department of Health and Human Services (DHHS) and North Carolina hospitals, working through the North Carolina HospitalAssociation (NCHA), participated in a collaborative process to develop an approach to non-behavioral health-related hospital payments as part of theState’s transition to managed care.23 The table below outlines the approach agreed to by all parties, which will be incorporated in the final PHP rate-setting methodology.24
Key Issue ApproachHospital payment rate floors undermanaged care
· Require PHPs to reimburse hospitals no less than the applicable Medicaid fee-for-service (FFS) rate,unless the PHP and hospital have mutually agreed to an alternative reimbursement amount ormethodology, for the following durations:
o Five contract years to all critical access hospitals and all hospitals located in economicallydistressed counties as defined by the Department.
o Three contract years to all other hospitals.
Inpatient payment methodology · Each hospital assigned unique DRG base rate that applies in Medicaid FFS and serves as the basis forrate floor under managed care25.
o Base rate calculated to ensure all hospitals in a class of providers receive the same portion oftotal inpatient Medicaid and uninsured costs covered; base rate for hospitals owned by UNCHealth Care and for Vidant Medical Center set according to same methodology
o Inpatient base rates for critical access hospitals (CAHs) calculated to approximate each CAH’scurrent FFS per-discharge reimbursement
· The rate floor for PHPs includes Medicaid case weights and outlier methodologies used in calculatinginpatient payments to hospitals under FFS.
· Each hospital’s DRG base rate will be increased annually by the Medicare inpatient hospital PPS marketbasket update less the productivity adjustment, as published in the Medicare Hospital Inpatient
23 Hospitals currently negotiate behavioral health reimbursement with LME/MCOs and will continue to negotiate behavioral health reimbursement with PHPs after themanaged care transition. Additionally, the FFS reimbursement methodology for behavioral health claims will remain unchanged.24 Note that many categories include special treatment for hospitals owned by UNC Health Care and for Vidant Medical Center in order to maintain current net paymentlevels and reflecting the fact that these hospitals have historically been treated differently under fee-for-service Medicaid.25 Hospital rate floor requirements are prescribed in the PHP contract.
194 of 197Prepared by Mercer GovernmentHuman Services Consulting
RFP 30-190029-DHBSection IX. Medicaid Managed Care Draft Rate Book (SFY 2020)

Key Issue ApproachProspective Payment System (IPPS) and Long Term Acute Care Hospital (LTCH) Prospective PaymentSystem Final Rule (called “Medicare market basket update minus productivity adjustment” throughoutremainder of document)26
· PHPs make additional, utilization based, directed payments to hospitals owned by UNC Health Care andVidant Medical Center to maintain current net payment levels (in combination with other payments).
Outpatient payment methodology · Each hospital paid defined percentage of charges that approximates 100% of outpatient costs
· Applies in Medicaid FFS and serves as the rate floor under managed care27.
· For purposes of the outpatient payment methodology, charges will not be permitted to increase bymore than the Medicare market basket update minus productivity adjustment.
· PHPs make additional, utilization based, directed payments to hospitals owned by UNC Health Care andVidant Medical Center to maintain current net payment levels and in combination with otherpayments).
Graduate Medical Education · DHHS will make Medicaid GME payments directly to hospitals; GME payments excluded in developinghospital-specific inpatient DRG base rates (see above)
· Direct graduate medical education payments (DGME) calculated using statewide per-resident averageof salary/fringe benefit costs, multiplied by each hospital’s number of residents (not subject toMedicare resident caps) and adjusted for hospital’s share of Medicaid days
o For UNC Hospitals and Vidant Medical Center (as the primary affiliated teaching hospitals foreach University of North Carolina medical school), DGME payments will be calculated usinghospital-specific fully-loaded salary/fringe benefit costs, multiplied by each hospital’s numberof residents and adjusted for hospital’s share of Medicaid days
· Indirect medical education (IME) calculated using Medicare formula (excluding Medicare residentcaps), multiplied by each hospital’s number of Medicaid discharges and CMI
o UNC Hospitals and Vidant Medical Center will calculate IME according to the same
26 “Medicare Hospital Inpatient Prospective Payment System (IPPS) and Long Term Acute Care Hospital (LTCH) Prospective Payment System Final Rule,” available at:https://www.federalregister.gov/documents/2017/08/14/2017-16434/medicare-program-hospital-inpatient-prospective-payment-systems-for-acute-care-hospitals-and-the. CMS also tracks quarterly changes in the market basket update. The Final Rule incorporates this data in setting the annual market basket update. Quarterlymarket basket data is available at: https://www.cms.gov/Research-Statistics-Data-and-Systems/Statistics-Trends-and-Reports/MedicareProgramRatesStats/MarketBasketData.html.27 Hospital rate floor requirements are prescribed in the PHP contract.
195 of 197Prepared by Mercer GovernmentHuman Services Consulting
RFP 30-190029-DHBSection IX. Medicaid Managed Care Draft Rate Book (SFY 2020)
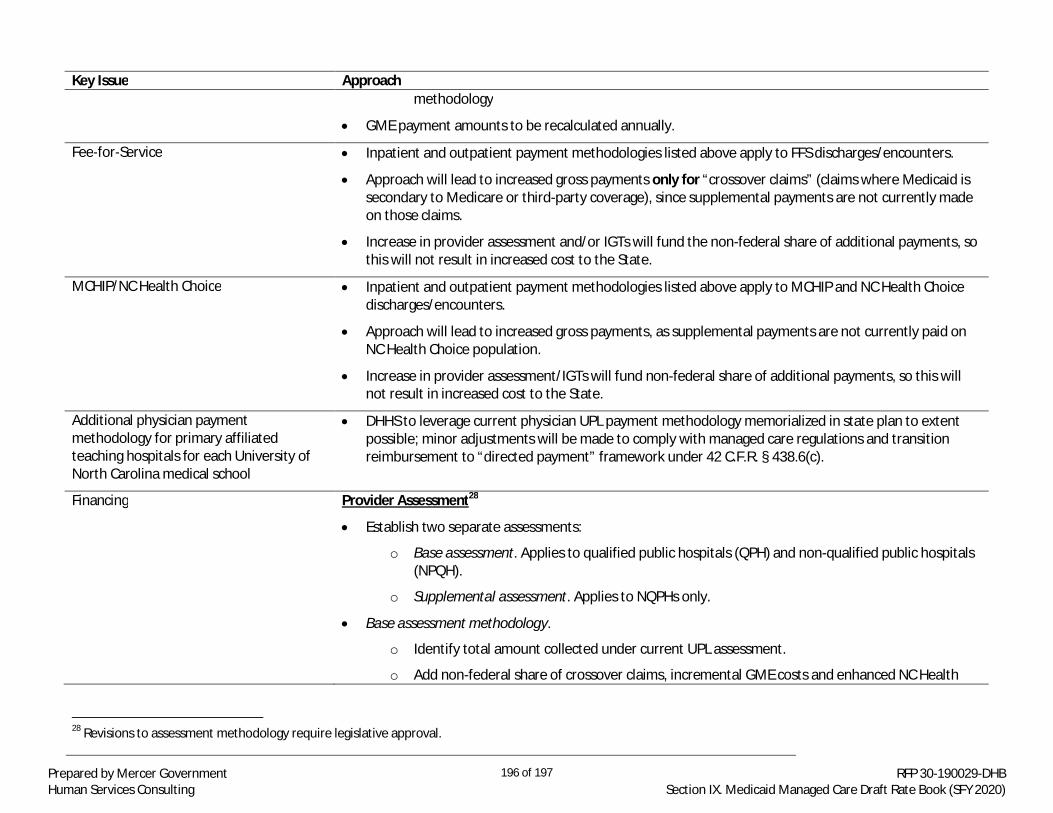
Key Issue Approachmethodology
· GME payment amounts to be recalculated annually.
Fee-for-Service · Inpatient and outpatient payment methodologies listed above apply to FFS discharges/encounters.
· Approach will lead to increased gross payments only for “crossover claims” (claims where Medicaid issecondary to Medicare or third-party coverage), since supplemental payments are not currently madeon those claims.
· Increase in provider assessment and/or IGTs will fund the non-federal share of additional payments, sothis will not result in increased cost to the State.
MCHIP/NC Health Choice · Inpatient and outpatient payment methodologies listed above apply to MCHIP and NC Health Choicedischarges/encounters.
· Approach will lead to increased gross payments, as supplemental payments are not currently paid onNC Health Choice population.
· Increase in provider assessment/IGTs will fund non-federal share of additional payments, so this willnot result in increased cost to the State.
Additional physician paymentmethodology for primary affiliatedteaching hospitals for each University ofNorth Carolina medical school
· DHHS to leverage current physician UPL payment methodology memorialized in state plan to extentpossible; minor adjustments will be made to comply with managed care regulations and transitionreimbursement to “directed payment” framework under 42 C.F.R. § 438.6(c).
Financing Provider Assessment28
· Establish two separate assessments:
o Base assessment. Applies to qualified public hospitals (QPH) and non-qualified public hospitals(NPQH).
o Supplemental assessment. Applies to NQPHs only.
· Base assessment methodology.
o Identify total amount collected under current UPL assessment.
o Add non-federal share of crossover claims, incremental GME costs and enhanced NC Health
28 Revisions to assessment methodology require legislative approval.
196 of 197Prepared by Mercer GovernmentHuman Services Consulting
RFP 30-190029-DHBSection IX. Medicaid Managed Care Draft Rate Book (SFY 2020)

Key Issue ApproachChoice payments.
o Divide amount by total hospital costs for all hospitals subject to the base assessment.
· Supplemental assessment methodology.
o Identify dollar amount collected under current equity assessment.
o Divide amount by total hospital costs for all hospitals subject to the supplemental assessment.
· State retains $140 million annually, trended annually based on the Medicare market basket indexminus productivity adjustment, from assessment proceeds. Remainder of proceeds used to fund PHPcapitation payments, Medicaid and CHIP FFS inpatient and outpatient hospital payments and GMEpayments.
· State to recalculate assessment rates annually to account for changes in Medicaid hospital payments,GME slots, and Medicaid/CHIP federal matching rates, among other factors.
· Hospitals currently exempt from the provider assessment under NC 108A-122 will remain exempt fromthe assessment under the new hospital payment plan.
Intergovernmental Transfers (IGTs)
· All hospitals that currently make IGTs will continue to make IGTs after the transition to managed care.
· Aggregate IGT amounts will be calculated to approximate total IGTs made in the 2018 MRI/GAP plan,adjusted to account for increased crossover claims, incremental GME costs, enhanced NC HealthChoice payments, and any other payment increases, and will be adjusted annually to account forchanges in Medicaid hospital payments.
197 of 197Prepared by Mercer GovernmentHuman Services Consulting
RFP 30-190029-DHBSection IX. Medicaid Managed Care Draft Rate Book (SFY 2020)