sector sample slides ruby consulting
TRANSCRIPT

SECTOR SAMPLE SLIDES RUBY CONSULTINGStrictly Private & ConfidentialFor Corporate & Investor Presentation Purpose
2Sample Document I Not For Circulation
This Sector Sample Slides (“Sample Document”) is being delivered with the intention to assist the recipient in deciding whether to proceed with a further discussion in respect of thematters stated herein (the “Business”). This Sample Document does not purport to be all-inclusive or to necessarily contain all the information that a prospective client may desire in.This Sample Document does not constitute an offer or form part of any offer for sale of Ruby Consulting (the “Company”) or of securities of the Company or otherwise, nor will anyinformation contained herein will form the basis of any contract. The content of this Sample Document should not be considered as any investment advice or recommendation.Reliance on any content of this Sample Document for the purpose of engaging in any speculative activity may expose the recipient to a significant risk of losing all of the property orother assets invested. Recipient should inform themselves as to the legal requirements applicable to them for any of the activities contemplated under this Sample Document.Further, the recipients should carry out their own investigations and analysis of the Company/Business and of the data referred to in this Sample Document and should consult theirown advisors.
By accepting this Sample Document, the recipient agrees to keep permanently the information confidential which is contained herein or made available in connection with any furtherdiscussion of the Business. This Presentation may not be photocopied, reproduced, or distributed to others at any time without the prior written consent of the Company. Theinformation contained in this Sample Document is intended solely for the recipient and may not be further distributed by the recipient. The Company accept no liability whatsoeverfor the actions of third parties.
This Sample Document does not contain any direct, indirect and/or deemed offer of any securities to the public as such or otherwise and does not constitute or form part of any offeror invitation to subscribe for, underwrite or purchase securities. Any such offer will be made strictly on a private placement basis by means of an information memorandum to beissued in compliance with applicable securities laws, which information memorandum will contain information about the issuer, its business operations and its management.
This Sample Document has been prepared for information purposes only and upon the express understanding that it will be used only for the purposes set forth above. The Companydoes not make any express or implied representation or warranty as to the accuracy or completeness or adequacy of the information contained herein or made available inconnection with any further investigation of the Business, or any investment decision made. The Company expressly disclaims any and all liability which may be based on suchinformation, errors therein or omissions there from. The recipient shall be entitled to rely solely on the representation and warranties made to it in any final definitive agreements.
The recipient assumes the entire risk arising from any use made of this information. In furnishing this Sample Document, the Company does not undertake any obligation to providethe recipient with access to any additional information. This Sample Document shall not be deemed to be an indication of the state of affairs of the Company/Business nor shall itconstitute an indication that there has been no change in the business or affairs of the Company/Business since the date hereof. The Sample Document includes certain statements,estimates and projections with respect to the anticipated future. Such statements, estimates and projections reflect various judgments and assumptions, which may or may not proveto be correct. Accordingly, there can be no assurance that the projected results will be attained.
Notwithstanding anything contained in this Sample Document, no responsibility or liability whatsoever is accepted for any loss or damage including any lost profits or savings orspecial, incidental, or consequential damage howsoever arising that you may directly or indirectly suffer as a result of this Sample Document and any and all responsibility and liabilityis expressly disclaimed by the Company and their respective directors, partners, officers, affiliates, employees, advisors or agents.

3Sample Document I Not For Circulation
America
• Processes like purchasing, warehousing, and inventory management handled separately
• Not much coordination between function
Early
• Internal integration within the company
• Better coordination between functions
• Individual contracts given for transportation, storage, forwarding etc
• Shift from godowns to function warehouses
Growth
• Greater external integration
• Bundling of services with the help of 3PL players
• Companies focus on core competencies and outsource logistics requirements to 3PL players
• World class warehouse higher automation
Consolidation• Strategic focus on reducing
cost redundancies and customers
• Supply chain management
• Global operations
• Single operator managing the supply chain of multiple geographies
• Move towards 4PL’s and 7PL’s
Mature
Under-Developed
India
China
Evolution of Logistics Industry
4Sample Document I Not For Circulation
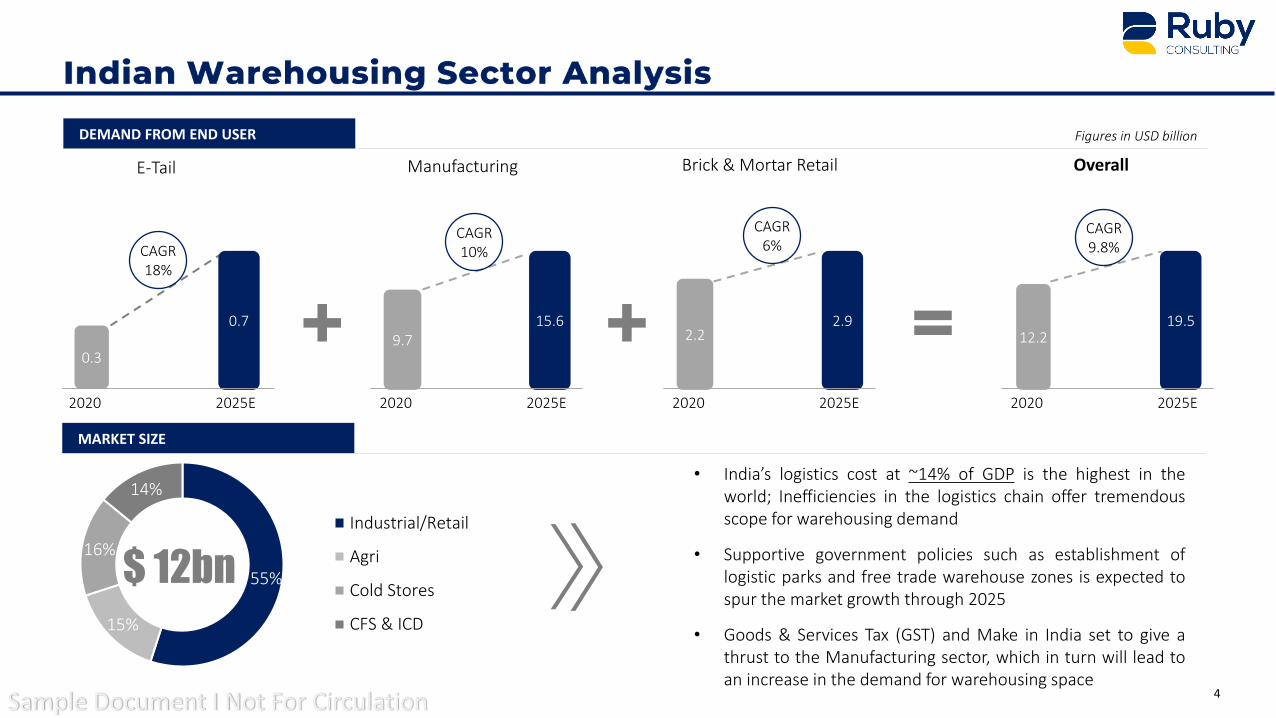
0.3
0.7
CAGR18%
12.219.5
CAGR9.8%
9.715.6
CAGR10%
2.22.9
CAGR6%
+ + =
Overall E-Tail Manufacturing Brick & Mortar Retail
2020 2025E 2020 2025E2020 2025E 2020 2025E
55%
15%
16%
14%
Industrial/Retail
Agri
Cold Stores
CFS & ICD
DEMAND FROM END USER
• India’s logistics cost at ~14% of GDP is the highest in theworld; Inefficiencies in the logistics chain offer tremendousscope for warehousing demand
• Supportive government policies such as establishment oflogistic parks and free trade warehouse zones is expected tospur the market growth through 2025
• Goods & Services Tax (GST) and Make in India set to give athrust to the Manufacturing sector, which in turn will lead toan increase in the demand for warehousing space
$ 12bn
MARKET SIZE
Figures in USD billion

5Sample Document I Not For Circulation
USD 95 Bn
15%
150x
2 ZETTABYTES
60%
8.4%

6Sample Document I Not For Circulation
• • • •
•
•
•
•
•
•

7Sample Document I Not For Circulation
Digital Contribution to Middle East Economy is Low Compared with Benchmarks
Source: Mckinsey Report
18.0
15.2
8.4
United States Europe Middle East
13.6
7.6 6.6
16.4
11.5
8.2
14.9
Bahrain Kuwait Egypt UAE Saudi Arabia Oman Qatar
8.06.2
4.1
United States Europe Middle East
8.0
5.1 4.4 4.3 3.8
0.9 0.4
Bahrain Kuwait Egypt UAE Saudi Arabia Oman Qatar
Share of Digital Contribution to GDP (%)
Source: Mckinsey Report
Digital Contribution to Middle East Economy is Low Compared with Benchmarks
The Middle East captures just a fraction of its Digital Potential
Captured Digital Potential by Country (%)

8Sample Document I Not For Circulation
36
47
50
61
97
Source: Mckinsey Report Source: Mckinsey Report

9Sample Document I Not For Circulation
$50bn
2020
$200bn
2030
15% CAGR
Global Market Size
54%46%
2020
Worldwide Share of Infrastructure Hardware Spending for Cloud and
Traditional Environments
• Pandemic induced Digital Transformation
• Growth of Big Data
• Use of cloud-based services by SMEs
• Rollout of 5G
• Artificial Intelligence & IoT in major sectors
• Higher consumption of data by consumers through e-commerce and social media platforms
Demand Drivers
Source: Global Market Insights, Internal Analysis, IDC
US$ 128 bn
2024
US$ 168 bn
Traditional Infrastructure
Cloud Infrastructure
Increasing need to store & process massive data generated globally will drive the need for Data Center colocation services
63%
37%

10Sample Document I Not For Circulation
$3.1bn
2019
$3.7bn
2025
MENA Market Revenue
3% CAGR
Source: Business Insider
The IoT revenue in the Middle East is expected to grow at a CAGR of over 15% by 2025
Adoption of 5G networks and provision for high-capacity connection up to 10gp/s
Increase in smart city initiatives is expected to develop the demand for edge computing and edge data centers among countries in GCC
Renewable Energy Powered Facilities to grow in Middle East
Cloud Adoption fueling Data Center Investments
Increased Government Support to Boost Digital Economy in Middle East

11Sample Document I Not For Circulation
-0.6
-0.3
0
0.3
0.6
0.9
1.2
1.5
1.8
2016-2020 2020-2025 2025-2030 2030-2035 2035-2040
Average Annual Oil Demand Growth (in Mb/d)
Eurasia DCs (excl China and India) China India OECD World
0%
20%
40%
60%
80%
100%
America(2016)
America(2040)
Europe (2016) Europe (2040) Asia Oceania(2016)
Asia Oceania(2040)
China (2016) China (2040)
Composition of New Passenger Car Sales by Technology
Conventional NGV HEV Electric FCV
Source: World Oil Outlook (2017)Note: Mb/d is Million Barrels per Day
Source: World Oil Outlook (2017)Note: NGV is Natural Gas Vehicle, HEV is Hybrid Electric Vehicle, FCV is Fuel Cell Vehicle
Expected decline in demand along with the conscious effort by countries to shift to environmentally friendly alternatives to oil would force GCC countries to diversify revenue sources

12Sample Document I Not For Circulation
0
1
2
3
4
US Brazil Canada Russia Kazakhystan Norway
Contributors to Non-OPEC Incremental Supply Change, 2016-2022 (Mb/d)
Source: World Oil Outlook (2017)Note: Mb/d is Million Barrels per Day
150
200
250
300
2010 2011 2012 2013 2014 2015 2016 2017
Drilling Cost of Oil and Gas Wells in the US – 2004 Base of 100
Source: World Oil Outlook (2017)Note: Cost of drilling was adjusted to 100 in 2004 and then the cost for latter years was based on that
• Non-OPEC supply is expected to increase due to recovery and improved outlook for US oil production
• Growth is heavily concentrated geographically as more than 75% is from US on the back of a resurgence in tight oil production
• Due to advancement in technology, more wells can be drilled faster, more cheaply and with higher individual output levels
• Hence, rig counts in US have rebounded sharply, more than doubling from a low of 332 in 2016

13Sample Document I Not For Circulation
2021: ↓ 8% in elec consumption and ↓ 14% in peak demand
Renewable Energy Targets
Energy Efficiency Targets
2020: 3.45 GW2023: 9.5 GW 2030: 30% of generation from renewables and others (mainly nuclear)
Saudi Arabia
2020: ↑ 5% generation efficiency2030: ↑ 15% generation efficiency and ↓ 30% energy consumption
2030: 15% of electricity generation
Kuwait
2025: ↓ 6% electricity consumption
2025: 5% of electricity generation2035: 10% of electricity generation
Bahrain
2030: Dubai: ↓ 30% electricity consumption2050: ↓ 40% electricity consumption
2020: Abu Dhabi: 7% of capacity2020: Dubai: 7% of electricity generation2021: 27% clean energy2040: Ras Al Khaimah 25%-30% clean energy2050: 44% of capacity
UAE
Source: IRENA GCC (2019)

14Sample Document I Not For CirculationSource: Global Market Insights, Internal Analysis, IDC
1Strategic Vision 2030 Initiatives• Saudi Arabia has categorized its milestones for achieving its Vision 2030• Focus is to increase the penetration of ICT programs into the oil and non-oil sectors• Initiatives to focus on improving the ranking in ease of doing business, Healthcare & Tourism sector and plot itself as Global Hub attracting investments
2Strong ICT Ecosystem• Nationwide 90% 4G network, with plans to increase Internet speed by 300% and fiber-optic coverage by 7%• Saudi Arabia’s ICT sector plays an important role in its economy and accounts for 6% of its GDP and 10% of non-oil GDP and is focused on gaining more
through implementation of Vision 2030
3Highly Skilled Labour• Almost 75% of the Saudi population is under 29, which presents a huge opportunity to provide a young workforce with skills and capabilities • Around 94.4% of population is literate and the government has set aside $51 Bn for education sector to eradicate illiteracy by 2024 in view of Vision 2030• About 60% of population are well versed with Digital environment with a sharp increase in e-literacy Y-o-Y
4Liberal Business Environment• Extensive incentives for foreign investors like - No restriction on repatriation of capital, Tax incentives on registering the company in less developed
economic cities, lower minimum capital requirements• 100% foreign ownership of property and companies allowed in certain industries

15Sample Document I Not For Circulation
Even With Aggressive Fuel Switching By 2035, Oil And Gas Are Expected To Maintain Dominance in Energy Consumption
34%
23%
28%
4%7% 4%
FY17 FY35
29%
26%
21%
4%
7%
13%
Oil Gas Coal RenewablesNuclear Hydro
Oil & Gas (57%):~7,700 MTOE
Source: BP Energy Outlook, 2019
Primary Energy Consumption – Breakdown by Fuel Type
Oil & Gas (55%):~9,200 MTOE
Renewable energy is the fastest growing source of energy with its share in primary energy expected to increase from 4% to 13% by 2035
Oil consumption is expected to slow down and grow at low single digits by 2035 – Growth primarily led by developing economies
Gas consumption expected to grow faster than oil and expected to overtake coal as 2nd
largest source of global energy1 2 3
16Sample Document I Not For Circulation
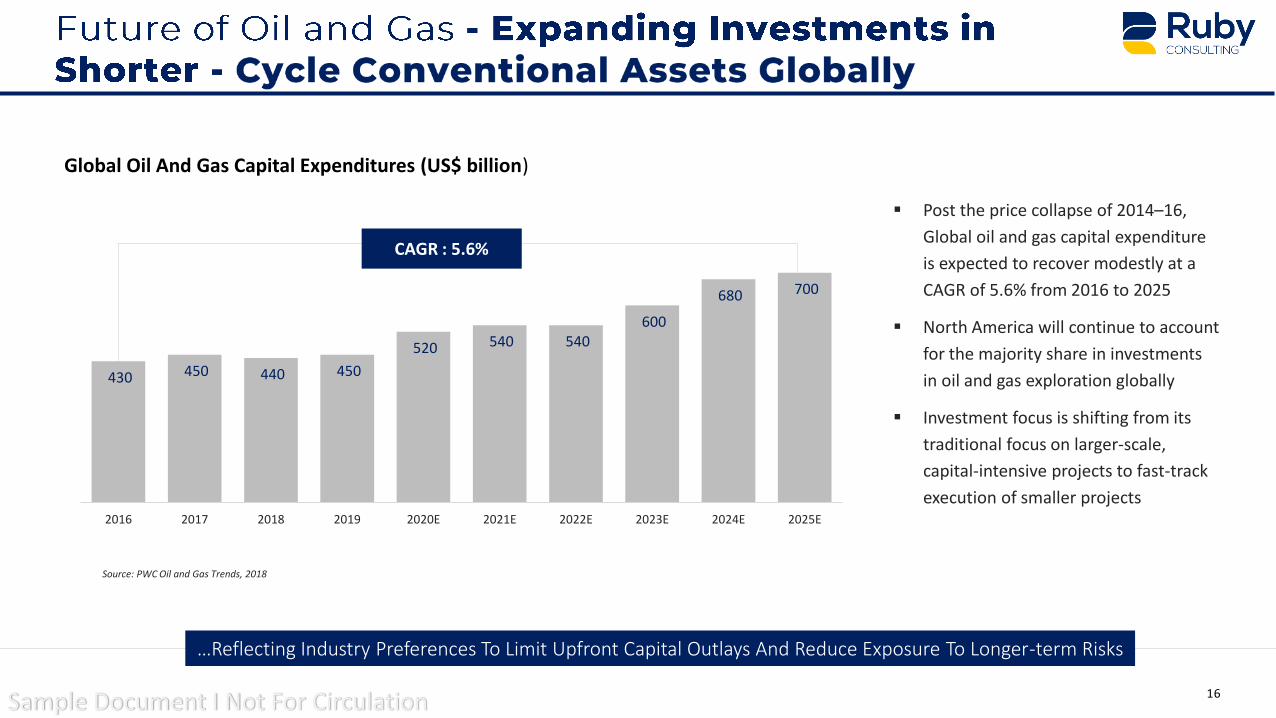
Global Oil And Gas Capital Expenditures (US$ billion)
430 450 440 450
520 540 540 600
680 700
2016 2017 2018 2019 2020E 2021E 2022E 2023E 2024E 2025E
▪ Post the price collapse of 2014–16,
Global oil and gas capital expenditure
is expected to recover modestly at a
CAGR of 5.6% from 2016 to 2025
▪ North America will continue to account
for the majority share in investments
in oil and gas exploration globally
▪ Investment focus is shifting from its
traditional focus on larger-scale,
capital-intensive projects to fast-track
execution of smaller projects
CAGR : 5.6%
Source: PWC Oil and Gas Trends, 2018
…Reflecting Industry Preferences To Limit Upfront Capital Outlays And Reduce Exposure To Longer-term Risks

17Sample Document I Not For Circulation
97.7 110
2.6
3.5
1.60.6 (1.6) 0.6
1.32.3
1.4
20
17
Ch
ina
India
Re
st
of A
sia
No
rth
Am
eri
ca
Euro
pe
Ru
ssia
an
dC
asp
ian
La
tin
Am
erica
Mid
dle
Ea
st
Afr
ica
20
35
Source: Wood Mackenzie
Growth in Oil Demand : 2017-2035Primary Energy Growth : 2017 – 2035
4.3%
3.5%
2.4%2.1%
1.3%
0.3%
Ind
ia
Afr
ica
Bra
zil
Mid
dle
East
Ch
ina
Ru
ssia
India Leads the Way
➢ India is expected to be the world’s largest oil demand growth centre in the next ~20 years
➢ Government of India is promoting aggressive domestic oil production for meeting excess demand and to reduce import imbalance
➢ Energy consumption growth in India during 2017-2035 is expected to be 3x of global average growth
➢ Rapid growth in India’s energy demand backed by robust economic growth
➢ India 2nd biggest driver of global energy consumption in 2019
(Million b/d)(Annualized %)
Source: BP Energy Outlook, 2019
18Sample Document I Not For Circulation
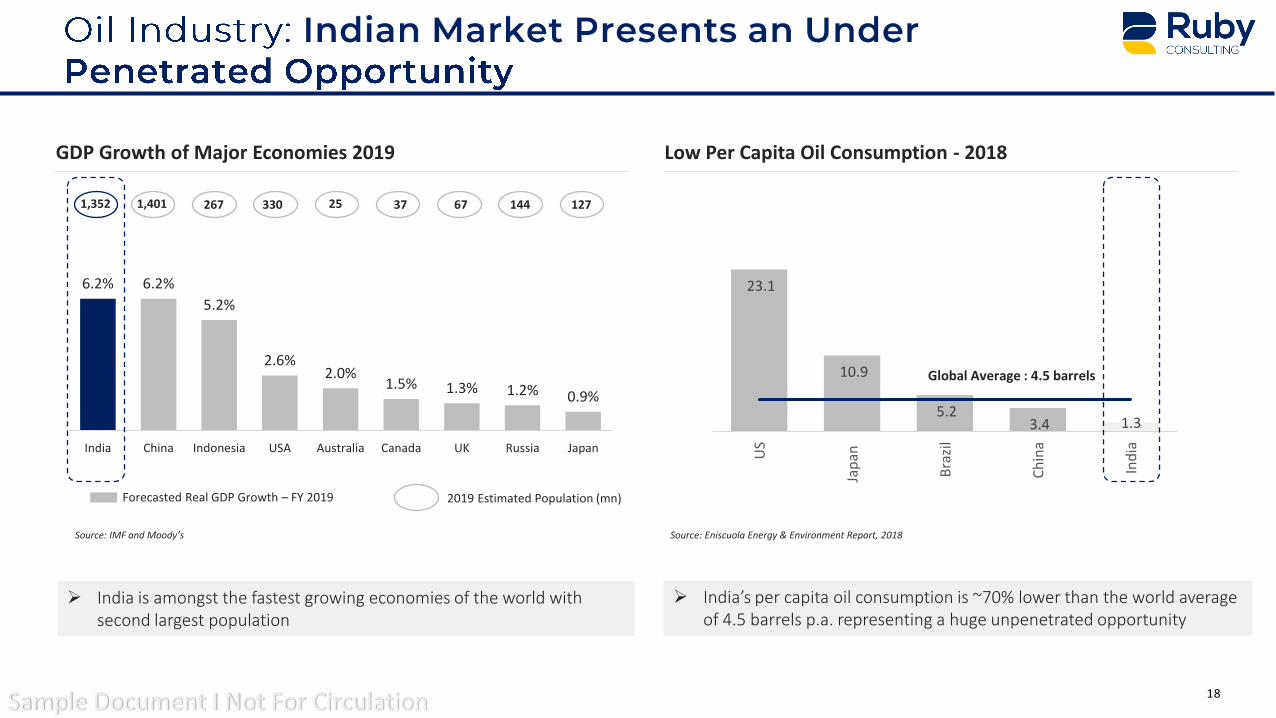
127
Low Per Capita Oil Consumption - 2018
23.1
10.9
5.2 3.4 1.3
US
Jap
an
Bra
zil
Ch
ina
Ind
ia
Source: Eniscuola Energy & Environment Report, 2018
GDP Growth of Major Economies 2019
6.2% 6.2%
5.2%
2.6%2.0%
1.5% 1.3% 1.2% 0.9%
India China Indonesia USA Australia Canada UK Russia Japan
Forecasted Real GDP Growth – FY 2019 2019 Estimated Population (mn)
1,352 1,401 267 330 3725 67 144
Source: IMF and Moody’s
Global Average : 4.5 barrels
➢ India’s per capita oil consumption is ~70% lower than the world average of 4.5 barrels p.a. representing a huge unpenetrated opportunity
➢ India is amongst the fastest growing economies of the world with second largest population

19Sample Document I Not For Circulation
Strategic Positioning of the Company
Small
E&P
CLIENT
Serv
ice
s
Medium Large
Revenue - $5 Bn+Revenue - $100-5,000 mnRevenue up to $100mn
Selan Exploration
Dolphin Offshore
(1)
(1)
• Very few companies offering E&P + Services +Retailing Play
• Client aims to create plays in opportunistic & low-risk smaller onshore oil blocks and specialized series, thereby creating a unique business model
Note 1: Only considered Oil & Gas related businesses of these companies

20Sample Document I Not For Circulation
Business momentum continues to be very strong
Large addressable market in China and overseas
• Addressable market in China expected to grow at 15 – 20% annually over the next few years from US$3.0BN in 2020E to US$5.7Bn in 2025E
– Chinese technology giant Huawei-3Com currently holds 31% market share in Global telecom equipment revenue
• Global router and LAN switch market is close to US$45Bn in size, growing at mid-single-digit growth rates
– Benefits from rapid growth in enterprise sector
Tremendous room for further growth
Strong growth track record enhanced by comprehensive product portfolio
• Revenues expected to grow from US$1.46 Bn in 2017, based on rapid increases in China sales and increasing traction in overseas markets
• Highest growth (19.2% CAGR) in the data networking industry, outperforming all major global competitors
• Expanding product portfolio which has grown from routers and LAN switches to voice/VoIP, data security and data storage
Enables Huawei-3Com to continue to out-compete its rivals
Long-term competitive cost advantage
• R&D cost per head is on average approximately 80% less than its U.S. competitors (US$47.3K vs. US$238.4K for Cisco)
– Still consistently spends around 14% of sales in R&D in line with peers
– R&D headcount has been grown to 2,500 from 700 in 2016, while R&D/Sales has been maintained in line with peers at 14% of sales
A highly regarded brand name in the industry
Strong brand recognition in China, and increasingly, globally
• Benefits from Huawei ownership, the leading network equipment player in China
• Provides strong reputational sponsorship to Huawei-3Com in the China and overseas markets and a captive market through OEM business
Strong earnings and cash flow outlook results in rapid delivering
Improving profit margins and strong cash flow generation capability
• Operating cash flow has significantly increased with scale from US$(20.5)MM in 2020 to US$141.0MM in 2026E
• Driven by low capex requirements and relatively short working capital cycle, cash flow generation capability continues to improve
• Rapid delevering from 6.5x Total Debt / EBITDA at launch to 3.8x by 2020E
Sustainable business modelUnique industry dynamics • Cisco, given dominant market position, sets a “pricing umbrella” to maintain its own gross margins
• Allows JV to set prices ~30% lower (which they are able to given low-cost structure)
– JV wins businesses on compelling price for quality products
– Cisco will not react and bring down all its prices globally
• The market is looking for a “Cisco alternative”

21Sample Document I Not For Circulation
PRODUCT VARIANT SELECTED VENDORS PRODUCT USE PRODUCT VARIANT SELECTED VENDORS PRODUCT USE
• Alcoholic• Non-Alcoholic
• Medline Inc.-USA• 3M Co- USA• Aqua Chem Industry Co.
Ltd- China
• Used for disinfecting surfaces and decontamination
• Alcoholic• Non-Alcoholic
• Medline Inc.-USA• P&G Co- USA• Hangzhou Special
Nonwovens-China
• Handheld• Backpack
• Medline Inc.-USA• Clorox Co- USA• Xiamen-China
• Alcoholic and Latex• Non-Alcoholic and Latex
Free
• Medline Inc.-USA• Kimberly Clark- USA• Oriental Enterprises.-
India
• McKesson.-USA• Surgo- Canada• ASP Medical-Malaysia
• Single Pouch• Multiple Pouch
• Cardinal Health.-USA• Medline Inc.- USA• Yantai Bagmart
Packaging Co-China
• Used for isolation of patient specimen documents
• Automatic• Manual
• Cardinal Health-USA• J&J Inc.- USA• Biobase Biotech Co Ltd-
China
• AAMI Level 3• AAMI Level 4
• Provides comfortable attire for executing medical operations
• Used for treating Wounds and highly infectious disease cases
• Reduce cross-contamination and smell, cleanup after patient Sickness
• Ideal for sanitizing, disinfecting, odor control and more
• Safe fluid system to transport infectious waste into sanitary sewer
• Used for disinfecting surfaces and decontamination
• Cardinal Health.-USA• Medline Inc- USA• Vi Pha Co-Vietnam
• High Density• Low Density
Disinfective Wipes
Emesis Bags
Specimen Bags
Electrostatic Sprayer
Fluid Management Devices
Surgical Drapes & Gowns
Bleach SolutionCritical Response Cleansing Cloth

22Sample Document I Not For Circulation
Global Market Size
Key Growth Drivers
• High incidence of hospital-acquired infections
• Increasing number of surgical procedures;
• Growing geriatric population and increasing incidence of chronic diseases;
• Growing focus on food sterilization and disinfection
• Technological advancements in sterilization equipment; and the increasing outsourcing of sterilization services among pharmaceutical companies, hospitals, and medical device manufacturers.
US$ 44.7 bn
US$ 52.7 bn
2021 2026
• Geographically, North America dominates the global infection control market, followed by Europe and Asia-Pacific
• However, Asia-Pacific is expected to grow at the fastest CAGR during the forecast period
• Based on product type, the cleaning & disinfection segment is estimated to account for the largest share of the overall infection control market
• On the other hand, the endoscope reprocessing products segment is expected to grow at the fastest growth rate due to the growing importance of diagnostic and therapeutic endoscopy procedures
• Based on end user, the hospitals & clinics segment is estimated to command the largest share of the overall infection control market
CAGR: 3.4%
Source: Markets & Markets

23Sample Document I Not For Circulation
Renewable Electricity
Fossil Fuels 73.8%Hydropower 45%
Geothermal power, Nuclear CSP & Ocean
13%
Solar PV
Global Energy Composition %
26.2%
31%
6%
Bio-Power 5% Wind
Source:– International Energy Agency
ESTIMATED RENEWABLE ENERGY SHARE OF GLOBAL ELECTRICITY PRODUCTION, 2018 RENEWABLE POWER CAPACITIES (GW) IN WORLD ,TOP TEN COUNTRIES, 2020
Source: International Energy Agency
925.2
311.3
150 138.9 137.1 123.3 101.462.4 59.2 57.1
Ch
ina
USA
Brazil
Ind
ia
Ge
rman
y
Japan
Can
ada
Spain
Italy
France
Inst
alle
d C
apac
ity
(GW
)

24Sample Document I Not For Circulation
Investment2013 2020($ bn p.a.)
CapacityAddition
2013 2020(GW p.a.)
15.67
25
9.1
18.7
GLOBAL OFFSHORE MARKET (CAPACITY IN MW)
0.411
1.6
13
0 0.5 0.012
Denmark 1,706.7(4.8%)
Sweden 201(0.57%)
N’lands 2441(6.9%)
UK 10,237 (29%)
Belgium 2300 (6.51%)
Germany 7766 (22%)
China 9884 (28%)
Existing Offshore
Plans for Offshore
No Activity
Europe Europe
Asia-Pac Asia-Pac
North-Am North-Am
Currently concentrated in NW Europe, China catching up
25Sample Document I Not For Circulation
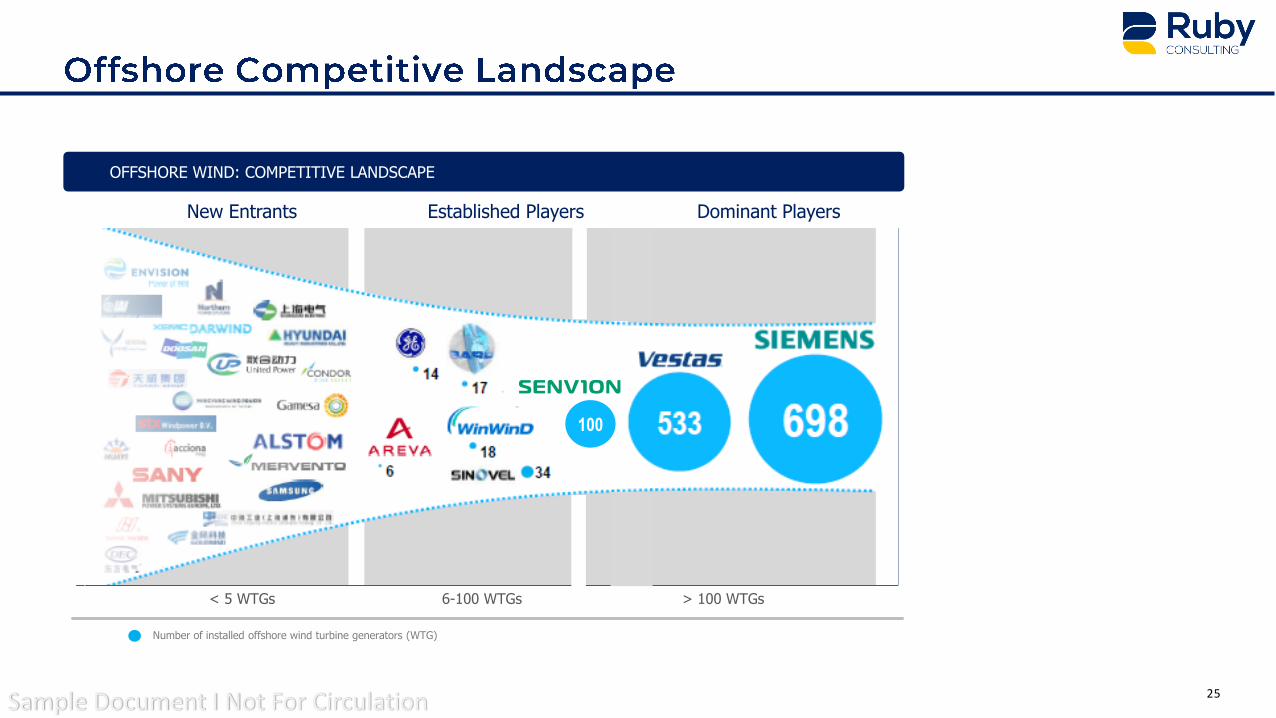
New Entrants Established Players Dominant Players
< 5 WTGs 6-100 WTGs > 100 WTGs
OFFSHORE WIND: COMPETITIVE LANDSCAPE
Number of installed offshore wind turbine generators (WTG)
100

26Sample Document I Not For Circulation
18%
20%
30%
40%
56%
80%85%
India China Indonesia Thailand Malaysia UK US
Source: IBEF, January 2021; Business Insider; Planet Retail and Technopack Advisors, 2019
ORGANISED RETAIL PENETRATION PROJECIONS 2021(%)
15 Mn
Mom & Pop shops in India
20-25%
Organised Retail CAGR
24%
Organised Retail share in Total Retail by 2020
Indian Retail is highly Unorganized and Lagging Behind Global Counterparts
Note: Organized retail includes modern grocery retailing, home shopping, Internet retailing and direct selling
INDIAN RETAIL STATS
Source: Delloite

27Sample Document I Not For Circulation
Rising Disposable Income and Discretionary Spending
Increasing Penetration of Mobile and Television
Growing Acceptance of Virtual Shopping by Indian Consumers
Improving Logistics and Payment Methods
Increasing Demand for Innovative Products and Brand Consciousness

50+ $1 bn+
C o re Divis ions Why Us
C o n t a c t Us
Corporate Finance Support
Investment Research
Business Analytics & Reporting
Consulting Support
Team Members
Global Clients
300+Assignments
Executed
1000+Transactions Supported
Deep Expertise
Global Delivery Capabilities
Flexible Engagement Models
Standardised Processes