sectoral job effects of trade – an input-output analysis for …€¦ · · 2016-04-14an...
TRANSCRIPT
1. Maren Lurweg, Centre for Applied Economic Research Münster, Am Stadtgraben 9, 48143 Münster, [email protected]. 2. Jens Oelgemöller, Centre for Applied Economic Research Münster, Am Stadtgraben 9, 48143 Münster, [email protected].
Sectoral Job Effects of Trade – An Input-Output Analysis for Germany
CAWM Discussion Paper No 19
This draft: March 5, 2010
by
Maren Lurweg1
Jens Oelgemöller2
Andreas Westermeier
Abstract
The current globalisation process is characterized by the emergence of global value chains. That is, production processes are becoming increasingly geographically fragmented. Not only are final goods traded internationally, but in particular, trade in intermediate goods and services has increased significantly over time.
In the industrialised countries, the manufacturing sectors were the first that were compelled to face the challenges of globalisation. When services were still consid-ered non-tradable, manufacturing firms had already decided to relocate their produc-tion sites to developing or emerging economies, due to lower wage levels abroad and increasing price competition domestically.
In this paper, we use input-output analysis to explore the relationship between trade and both job creation and job destruction in the German manufacturing industry in 2005. The results show that being integrated into the world economy is advanta-geous for the German economy. In 2005, the net exports of the manufacturing indus-tries led to trade-induced job gains of around 2,400,000. This figure is equivalent to 6.2 per cent of total German employment. Furthermore, the job effects of trade were positive for a large majority of countries. The greatest job gains resulted from trade with the United States, the United Kingdom and France. Interestingly, even trade with the new EU Member States is beneficial in terms of job creation.
JEL-CLASSIFICATION: F14, F16, C67
KEYWORDS: input-output analysis, international trade, employment

2
Introduction
The current globalisation process is characterized by the emergence of global value chains. That is, production processes are becoming increasingly fragmented in geo-graphical terms. Revolutionary advances in information and communication technol-ogy and decreasing transportation costs have led to the tradability of formerly un-tradeable goods and services. Thus, firms can exploit factor price disparities between countries without sacrificing the gains from specialisation. Not only are final goods traded internationally, but in particular, trade in intermediate goods and services has increased significantly over time.1
In the industrialised countries, the manufacturing sectors were the first that were compelled to face the challenges of globalisation. When services were still consid-ered non-tradable, manufacturing firms had already decided to relocate their produc-tion sites to developing or emerging economies, due to lower wage levels abroad and increasing price competition domestically. This process had already started in Ger-many in the 1970s, when many jobs in the textile industry were relocated to South-east Asia.2 The fall of the “iron curtain” at the end of the 1980s further accelerated the increasing fragmentation of production. At present, manufactured goods are almost infinitely tradable.
The transnational and often world-wide relocation of jobs is often discussed under the designation “offshore outsourcing” or “offshoring”.3 Many people fear that, due to the increased competitiveness of low-wage countries, jobs in their home country are endangered. Concerns about workers losing jobs to international competition are widespread. Not only are blue-collar jobs relocated, but also white-collar jobs are in-creasingly at risk of being offshored. The number of German manufacturing firms en-gaging in offshoring has indeed increased over time. According to a study conducted by the Federal Statistical Office in 2008,4 36.4 per cent of those manufacturing firms, which engaged in offshoring activities until 2006, did so before 2001, 45.6 per cent from 2001 to 2003 and 68.6 per cent from 2004 to 2006. Core business activities are more likely to be offshored than auxiliary functions, but the differences are marginal. This finding emphasizes the notion that trade in tasks is of growing importance.5
According to a study of the Kiel Institute for the World Economy (2009), around 63 per cent of all jobs in the German manufacturing sector are potentially offshorable. This result is alarming, given that 22 per cent of the German work force are employed
1 See Grossman and Rossi-Hansberg (2006) and Feenstra and Hanson (2003). 2 From 1970 to 2007, the number of employees in the German textile industry decreased from
379,000 to 88,000. See Kruber Meyer (2008). 3 These two terms refer to the purchase of goods and services that were previously produced inside
the purchasing company, from foreign companies. Therefore, offshoring includes off-shore/international outsourcing and captive offshoring/international insourcing. In the latter case, foreign affiliates of domestic parent companies export goods and services to their parent compa-nies. The cross-border aspect is the distinguishing feature of offshoring. See Molnar, Pain and Tag-lioni (2007).
4 See Statistisches Bundesamt (2008). 5 See Grossman/Rossi-Hansberg (2006).
3
in the secondary sector. If firms decided to relocate these jobs, this would have a ma-jor impact on the domestic labour market.
In this paper, we use input-output analysis to explore the relationship between trade and both job creation and job destruction in the German manufacturing industry in 2005. The work is based on two premises. First, the offshoring of jobs is regarded as another form of import activity rather than as a completely new phenomenon. Sec-ond, not only the jobs lost to imports are measured, but also the jobs created through the production of exports.6
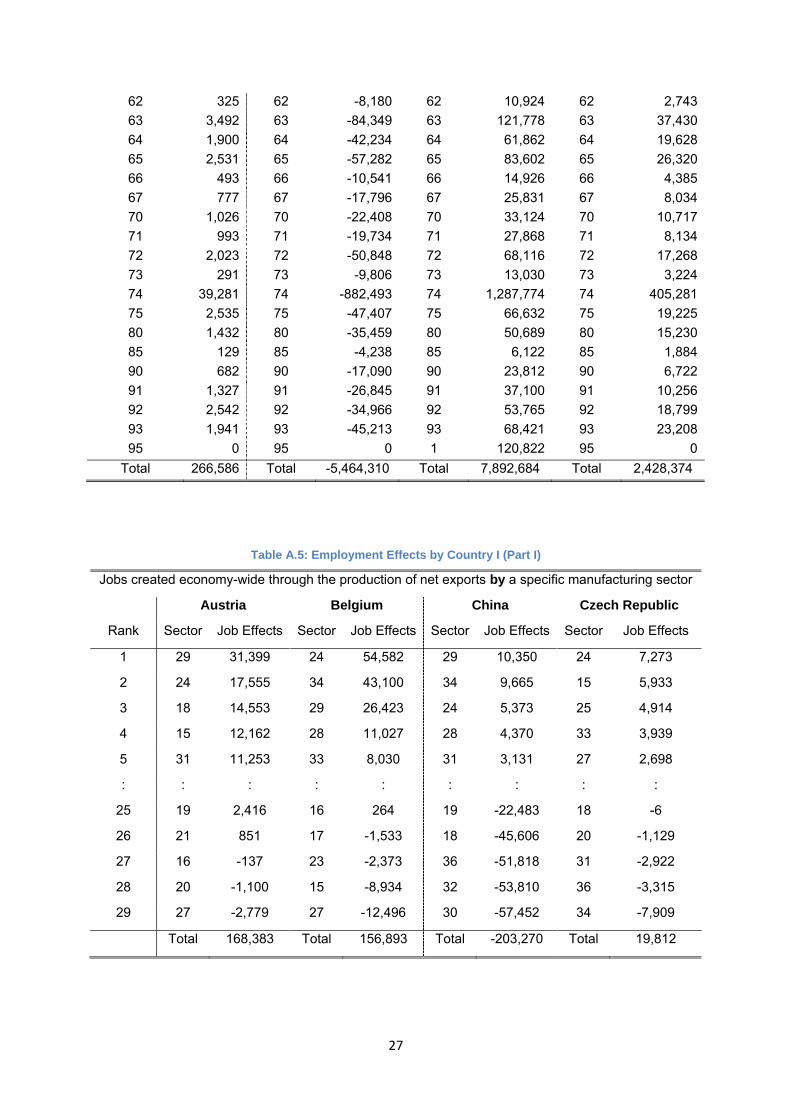
The manufacturing sectors are ranked according to their trade-induced employment effect.7 We also show which sectors benefit most from trade relations of the manufac-turing sectors, in terms of job creation. This ranking also includes service sectors, because, due to the net exports of the manufacturing sectors, jobs are created in the service sectors as well. This bipartite analysis (jobs created economy-wide through the production of net exports by a specific manufacturing sector and jobs created in a specific sector due to the net exports of all manufacturing industries) is also con-ducted for Germany’s most important trade partners.
The results are then compared to the findings of a Revealed Comparative Advan-tage-Analysis (RCA)8. Do the sectors with the greatest trade-induced employment effect also possess a comparative cost advantage?
Sectoral Job Effects of Trade: A Literature Overview
A substantial body of both theoretical and empirical research has been undertaken on the relationship between trade and both aggregate and sectoral employment.9
Traditional trade theory suggests that, if resources are reallocated in accordance with the principles of comparative advantage, they can be used more effectively and cre-ate gains from trade for everyone involved. These comparative advantages can be due either to relative technology differences (as stated in Ricardian models) or differ-ent factor endowments (as stated in Heckscher-Ohlin models). The competitiveness of each sector, at the global level, is therefore determined by the existence of com-parative advantages.
On the one hand, the reshuffling of production factors can lead to job losses, due to firm closures in comparatively disadvantaged sectors, which can be identified as im-
6 In a previous paper by Lurweg and Westermeier (2009), a measure of the net effect of trade on
Germany’s employment was calculated for the period 1995 to 2006. We had two main findings. First, in an autarkic situation, 7.0 per cent of total German jobs would not have existed in 2006. Second, the manufacturing sector contributed most to this positive job effect. However, also in the service sector, many jobs were retained through trade.
7 One has to keep in mind that net exports from the manufacturing sectors not only lead to job crea-tion in the secondary sector, but in the primary and tertiary sector as well. The production process in the manufacturing industries depends on intermediate inputs provided by the service sectors, such as by the sector “business services”.
8 See Oelgemöller and Westermeier (2009). 9 See Jansen and Lee (2007) for an overview.

4
port-competing sectors. Displaced workers suffer phases of unemployment or inactiv-ity. On the other hand, new companies are established in highly competitive sectors and existing firms invest in increased production and therefore augment labour de-mand. These are the exporting sectors. An increase in trade is therefore associated with both job destruction and job creation.
In neoclassical models, the level of economic activity and thus employment can fluc-tuate in the short run, but in the long run, the labour market will clear, in the absence of distortions. Workers who have been laid-off, automatically move into new jobs meaning that trade cannot lead to increased unemployment. The equilibrium wage is determined by the intersection of supply and demand. Therefore, trade can affect workers through a mere change (a decrease or an increase) in equilibrium wages. This restrictive assumption of full employment has often been criticized.10
The suitability of traditional trade models for predicting the job effects of trade is lim-ited for two additional reasons.11 First, traditional trade models do not consider the possibility of FDI. In contrast to trade with finished goods, FDI induces preceding capital flows to the destination country. Second, traditional trade models concentrate on trade with finished goods, whereas trade in intermediate goods and the offshoring of services gain in importance. One can assume that trade in intermediates may even have a greater impact on aggregate and sectoral employment than trade in final goods. This is due to the fact that labour demand in an open economy is affected not only in import-competing industries, but in all industries using foreign inputs to pro-duce final goods.12
Theoretical research on the job effects of trade has developed over time. Some mod-els treat labour as a homogeneous factor, others allow for different skill levels among workers. Feenstra and Hanson (1996) study an economy in which a single manufac-tured good is produced from a continuum of intermediate inputs, which are in turn produced by skilled workers, unskilled workers and capital. One country (the “South”), produces and exports a range of intermediate inputs up to a critical ratio of skilled to unskilled labour, while the other country, (the “North”), produces the remain-ing inputs. The inputs produced by the North are skilled-labour intensive, such as R&D and marketing, whereas unskilled-labour intensive activities are offshored to the South. Feenstra and Hanson show that any increase in the capital stock of the South relative to the North, or neutral technological progress in the South, will result in higher relative wages of skilled workers in both countries, due to a shift in more skilled-labour intensive production activities to the South.
Grossman and Rossi-Hansberg (2006) develop a theoretical model to consider how improvements in offshoring affect the wages of different types of labour. They identify a productivity effect, resulting from improvements in the technology for trading tasks. A decline in the cost of task trade directly augments the productivity of the factor whose tasks become easier to offshore. The authors conclude that all domestic par- 10 See, for example, Hoekman and Winters (2005). 11 See Schöller (2006). 12 See Hijzen, Görg and Hine (2005).

5
ties can gain, due to improved opportunities for offshoring, if the ensuing adjustment in relative prices or its impact on factor prices is not excessive.
Different models predict different effects of trade on employment. Therefore, the ef-fects of trade on employment need to be tested empirically. Empirical studies on the labour market effects of trade can be classified into two groups: trade in finished goods and trade in intermediate inputs. The latter comprises material offshoring and service offshoring.13 Because our analysis focuses on trade in intermediate goods or material offshoring, studies on service offshoring are not cited.
Trade in finished goods
According to studies on the effect of international trade on aggregate employment, trade can lead to adjustment costs, because workers are forced to move between different sectors and occupations. Some studies conclude that net imports and ag-gregate employment in goods-producing industries in the importing economy are negatively correlated.14 However, trade is not the only determinant of employment changes; the influence of technological change is considered to exert an even more significant impact on employment structures.
Hoekman and Winters (2005) point out that the effects of trade on wages and em-ployment depend on labour market institutions, the efficiency of capital markets, so-cial policies and the mobility of factors across sectors. Employment is expected to return to its long-run sustainable level, if relative factor prices and relative factor de-mands are able to adjust fully, and if labour markets are not segmented in the import-ing economy. Nevertheless, trade has an impact on the relative price of factors that are used intensively in import-competing sectors – their price will be lower than be-fore. If the adjustment process is hampered by market restrictions, the adjustment of relative factor prices will be reduced, and factor demands will decrease in the long-run. This will result in increasing unemployment.
According to the OECD (2005), the different levels of market regulation in Europe and the United States can be regarded as one reason for the observed difference in labour market outcomes. Empirical evidence suggests that re-employment rates fol-lowing displacement are considerably lower in Europe than in the United States. Yet, earnings changes between the old and the new job vary less widely in Europe than in the United States.
Trade in intermediate goods
According to findings from the OECD (2007), the share of imported intermediates in total output has increased in most OECD economies, although the degree of material offshoring varies significantly.15 Between 1995 and 2000, material offshoring grew in 13 See Lurweg and Westermeier (2009). 14 See Baldwin (1995), Greenaway and Nelson (2001) and OECD (2005). 15 The selected OECD economies are: Australia, Austria, Belgium, Canada, Denmark, Finland,
France, Germany, Greece, Italy, Netherlands, Norway, Portugal, Spain, Sweden, the United King-dom and the United States. Material offshoring is most pronounced in Belgium, with a share of total output of 15.6 per cent, and least pronounced in the United States, with a share of just 2.8 per cent.

6
13 out of 17 economies.16 Even if the rate of increase of material offshoring seems to have slowed down during the second half of the 1990s and service offshoring has gained in importance, intermediate goods still account for most of the trade in inter-mediates.
There are many empirical studies dealing with the employment effects of trade in in-termediate goods. Falk and Wolfmayr (2005) distinguish between materials imported from low-wage countries and those imported from high-wage countries into seven EU member States (Austria, Denmark, Finland, Germany, Italy, Netherlands and Swe-den). The authors conclude that imported materials from low-wage countries exert a significant negative impact on total employment in the economies in question. This effect is most pronounced in manufacturing industries. Falk and Wolfmayr estimate that the increase in imported materials from low-wage countries has decreased em-ployment by at least 0.26 percentage points per year over the period 1995-2000. Conversely, the share of imported inputs from high-wage countries has a positive impact on aggregate employment. Therefore, imports from high-wage countries and domestic employment seem to be complements rather than substitutes.17
Some studies have found evidence that the international sourcing of intermediate goods may affect the skill structure of labour demand in the home country. For in-stance, Hijzen, Görg and Hine (2005) investigate the link between international sourcing and the skill structure of labour demand in the United Kingdom.18 The au-thors find that narrow outsourcing19 has a negative effect on the demand for all types of labour. However, the impact of international sourcing on aggregate employment is stronger the lower the level of skills. Therefore, international sourcing can explain part of the changing skill structure in the United Kingdom. The other important reason for the trend towards the use of more skilled labour is technological change induced by research and development activities.
According to Geishecker (2004), international outsourcing is of very little importance for determining the relative demand for low-skilled workers in German manufacturing industries as a whole. In only four industries (electrical engineering, chemicals, office machinery/computers and paper and pulp) international outsourcing had a negative impact on the relative demand for low-skilled labour between 1978 and 1993. In these four industries, between 14 per cent and 47 per cent of the decrease in the low-skilled cost share could be explained by increased imports of intermediate inputs.
Marin (2004) finds evidence suggesting that German multinationals tend to offshore skill and R&D intensive activities to Eastern Europe. Almost 60 per cent of total in-vestment in Eastern Europe is allocated to manufacturing industries. According to the
16 Material offshoring decreased in Denmark, Greece, Norway and in the United Kingdom. 17 In a later study, Falk and Wolfmayr concentrate on the employment effects of service outsourcing.
But they find again a significant negative impact of imported materials from low-wage countries on manufacturing employment in Austria, Finland, Germany, Italy and the Netherlands. See Falk and Wolfmayr (2008).
18 They estimate relative demand functions for skilled workers, based on a translog cost function. 19 Only the imported intermediates in a given industry, from the same industry abroad, are taken into
account.

7
author’s econometric analysis, offshoring activities have helped to create jobs in Germany. Offshoring has enabled German firms to save 65 to 80 per cent of their labour costs, helping them to remain competitive in a highly competitive environment.
Methodology and Data
In order to determine the job effects of international trade flows of the German manu-facturing sector, we apply an input-output approach.20 Using input-output tables is advantageous for two main reasons. First, input-output tables offer insights into the globalization of value chains, through providing information on the value of interme-diate goods and services that have been imported from companies external to the country of the sourcing company. Second, indirect effects that are associated with impacts on other sectors are accounted for.21
The Federal Statistical Office (Destatis) provides an input-output matrix for 71 sectors (8 primary sectors, 36 secondary sectors and 27 tertiary sectors).22 Data on imports and exports, classified by trading partners and sectors, is also available from the Federal Statistical Office.23 Since the data for imports and exports with Germany’s trade partners is only available for 22 manufacturing sectors, some manufacturing sectors of the original input-output matrix had to be aggregated.24
The core element of our analysis is the following equation:
(I-A)-1 is the inverse Leontief matrix.25 The values lij of this matrix, the so called in-verse input coefficients, show how many units of intermediate production of sector i are needed to produce one unit of final demand for goods of sector j directly and indi-rectly. The production is therefore described as a function of final demand. The val-ues in a column correspond to the direct and indirect requirements of a specific sec-tor, in order to deliver an increase of one unit of output to final demand.26
LC is a diagonal matrix having the labour coefficients as diagonal entries. The labour coefficient for each sector illustrates how many jobs are needed to produce one unit
20 See Groshen, Hobijn and McConnell (2005), De Backer and Yamano (2008) and Lurweg and Wes-
termeier (2009). For further information on input-output tables see also Bleses (2007) and Kowa-lewski (2009)..
21 See De Backer and Yamano (2008). 22 The input-output matrix can be downloaded free of charge from www.destatis.de. 23 Data source: “Imports and exports (special trade) by division of the national Product Classification
for Production Statistics”. 24 For this occurrence, we also aggregated some service sectors. Our analysis therefore encom-
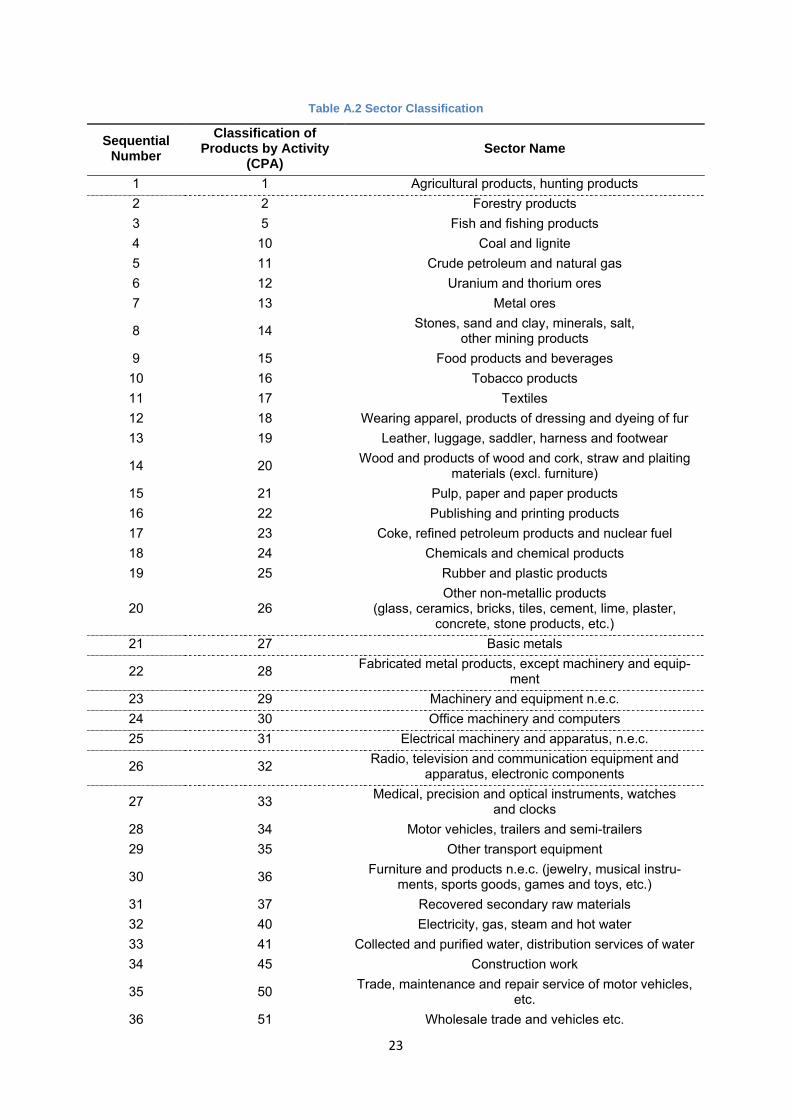
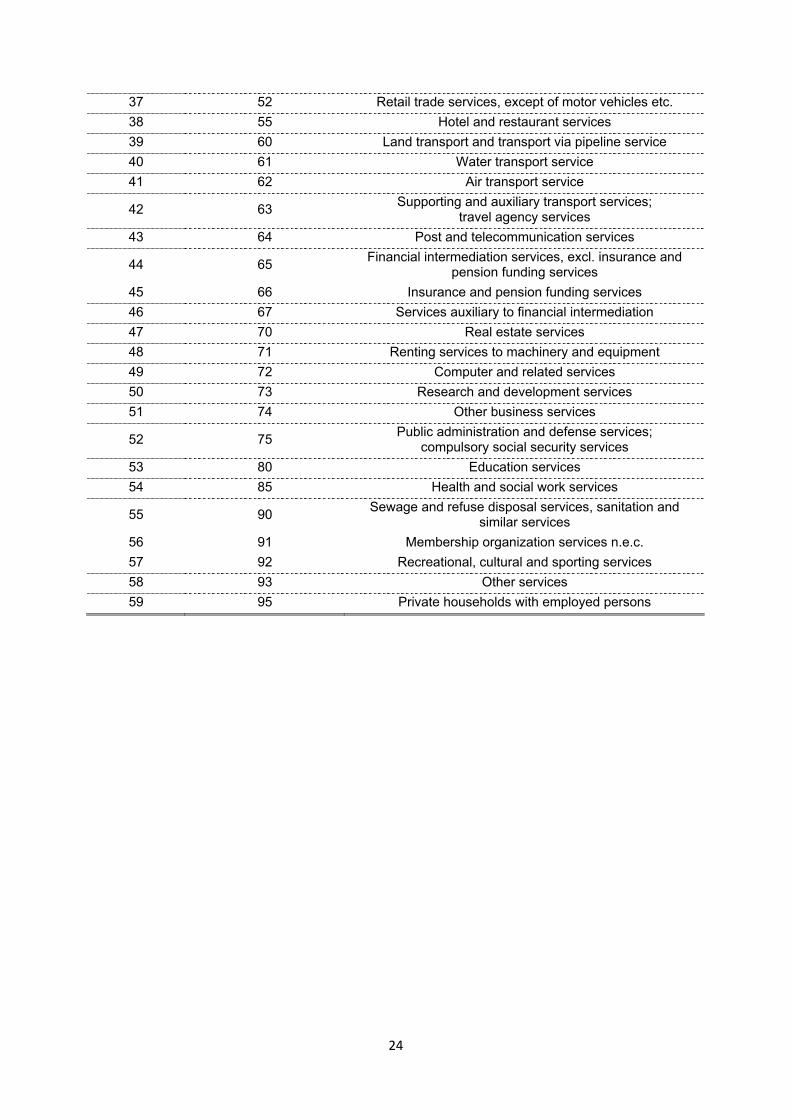
passes 59 sectors. For the specific sectors, see the appendix (manufacturing sectors: sequential numbers 9-30; CPA 15-36). The 59 sectors are in accordance with the 59 sectors at the two-digit level of the European System of Accounts (ESA) 95. At the two digit level, the “Classification of Products by Activity” (CPA) corresponds with the “General Industrial Classification of Economic Ac-tivities within the European Communities” (NACE).
25 The inverse Leontief matrix is published each year by the Federal Statistical Office (Input-Output-Rechnung, Tabelle 2.3).
26 To calculate the employment loss due to imports of goods and services, we used the input coeffi-cients from the Input Coefficients Table (Domestic Production) and multiplied them by the imports.

8
of output. Therefore, the labour coefficient for a specific sector i is calculated as fol-lows: employmenti/outputi. The input-output matrix provides data on employment (persons in employment) and output for each sector.27 By multiplying the diagonal matrix LC by (I-A)-1, the number of jobs which are directly and indirectly needed for the production of one unit of final demand is calculated for each sector. The multipli-cation yields a 59 x 59 matrix (see Figure 1).
Figure 1 Matrix connotation I
⎥⎥⎥⎥
⎦
⎤
⎢⎢⎢⎢
⎣
⎡
59,591,59
1,2
59 1,2,11,1
aa
aaaa
L
MOM
MO
L
For example, the entry a2,1 represents the number of jobs which are necessary in Sector 2 as an intermediate input for Sector 1, if the latter produces one unit of output for final demand. Therefore, the sum of Column 1 stands for the number of jobs that are directly and indirectly required in all sectors of the economy, if Sector 1 produces one unit of output for final demand. The sum of Row 1 represents the number of jobs that are created in Sector 1, if all sectors of the economy produce one unit of output for final demand.
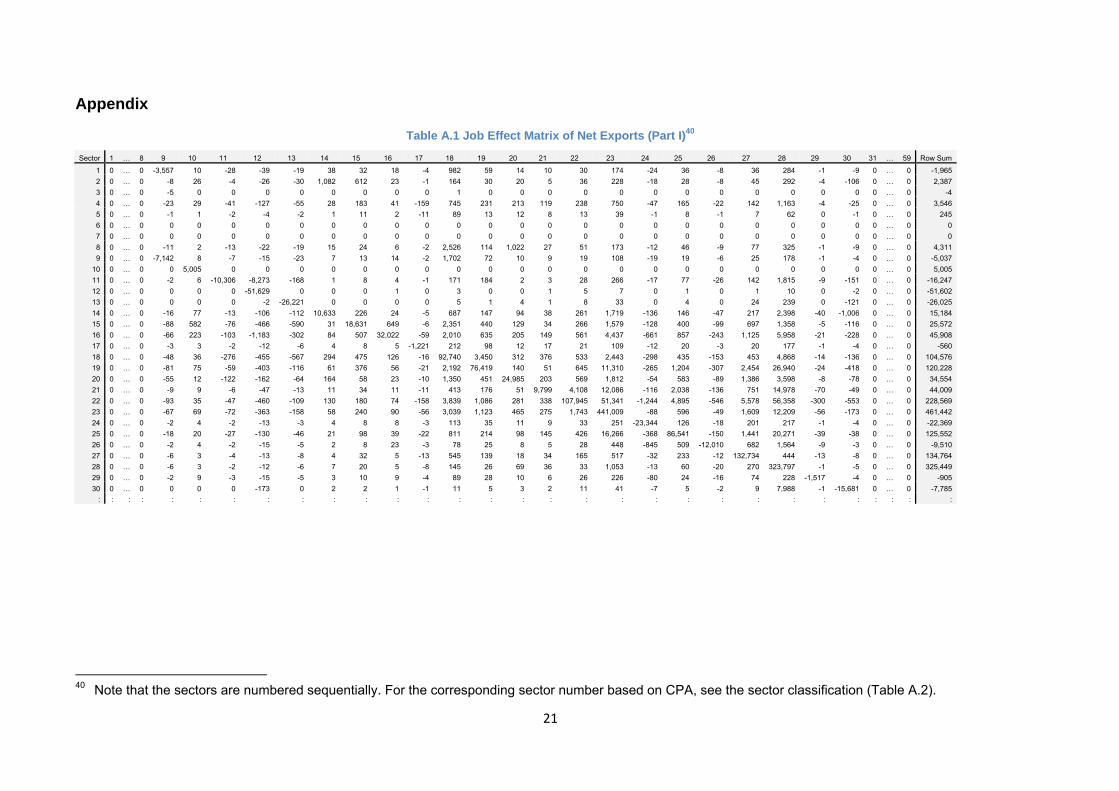
Finally, the matrix LC * (I-A)-1 is multiplied by TM (trade matrix). TM is a diagonal ma-trix having, as entries, for example, the net exports of each sector.28 By multiplying LC* (I-A)-1 by TM, we obtain a measure of the number of jobs needed to produce net exports (see Figure 2).
Figure 2 Matrix connotation II29
⎥⎥⎥⎥
⎦
⎤
⎢⎢⎢⎢
⎣
⎡
599,59511,59
11,2
5959,122,111,1
* *
*
NEa NEa
NEa*NEa *NEa *NEa
L
MOM
MO
L
27 We calculated the output of each sector by subtracting the final uses of imported products (Input-
Output-Rechnung, Tabelle 1.2) from the total uses of products (Input-Output-Rechnung, Tabelle 1.1).
28 We also calculate the job effects of gross imports (that are negative) and the job effects of gross exports (that are positive) for each sector, but our analysis focuses on the net effect of trade on sector employment.
29 The matrix containing the real values is shown in the appendix (Table A.1).

9
The sum of Row 130 represents the number of jobs created in Sector 1 through the net exports of all sectors. The sum of Column 131 represents the number of jobs cre-ated in all sectors of the economy, due to the net exports of Sector 1.32
The analysis is limited by the assumptions that underlie the input-output tables:33
• We assume constant-factor input shares, in order to calculate the input re-quirements for each industry. Therefore, there are no increasing economies of scale.
• The data does not account for qualitative differences between traded and non-traded goods.
• It is assumed implicitly that the technologies for import and export goods and services are identical. This is due to the fact that the manufacturing technolo-gies of the country are assumed to be constant, when calculating the jobs em-bodied in imports and exports.
• Furthermore, imports and domestic production are assumed to be perfectly in-terchangeable, without any costs.
• Dynamic gains of trade, defined as trade-related changes in the long-run rate of productivity growth, are not taken into account. Four possible channels through which trade can have a positive impact on productivity levels can be identified: more efficient resource allocation, a greater division of labour, greater returns on investment and technology spillovers.34
Due to these rather restrictive assumptions, the results must be interpreted with cau-tion.
Results
In order to analyze the job effects in the German manufacturing sector that are due to the production of net exports, and to identify interdependencies between the sectors, we assume an export-increase of one billion Euros in each manufacturing sector. This increase can be interpreted as an exogenous demand-shock. The manufactur-ing sectors are then ranked according to their export-induced employment effect. In the next step, we determine how many of the created jobs remain in the same sector.
Table 1 shows the ten sectors with the highest economy-wide job effects. If the ex-port-induced production of Sector 15 (food products and beverages) increases by one billion Euros, 18,020 jobs will be created in Germany. Only 43.37 per cent of
30 The sum of Row 1 is calculated as follows:
ii iNEa∑ =
591 ,1
* 31 The sum of Column 1 is calculated as follows: ∑ =
591 11,
*i iNEa
32 Note that the sectors are numbered sequentially from 1 to 59. For the corresponding CPA (Classifi-
cation of Products by Activity) number, see the appendix. In the following analysis – if not otherwise specified – the sectors are numbered on basis of the CPA.
33 See De Backer and Yamano (2008). 34 See Nordås, Miroudot and Kowalski (2006).

10
these new jobs remain in Sector 15. Production in other sectors is far less job-intensive. In Sector 23 (coke, refined petroleum products and nuclear fuel) only 1,939 jobs will be created if production increases by one billion Euros, and in Sector 30 (of-fice machinery and computers), about 7,380 jobs. This may indicate a high degree of mechanization and a low intensity of labour.
Table 1 Production-induced employment effects
Source: own calculations, Data: Federal Statistical Office.
In Table 2, the sectors are ranked according to the share of jobs created within the same sector. In Sector 28 (fabricated metal products, excluding machinery and equipment) and Sector 17 (textiles), around 70 per cent of jobs remain in the sector. Therefore, production in these sectors does not depend highly on intermediate inputs provided by other sectors. The other extreme is Sector 23 (coke, refined petroleum products and nuclear fuel): the share is less than 20 per cent. However, the share of Sector 16 (tobacco products) is already around 10 percentage points higher (27.80 per cent).
Employment effects induced by an increase in production of one billion Euros
Pos. Sector Job effects
% of jobs created within sector
Pos. Sector Job effects
% of jobs created within sector
1 Food products and beverages 18,020 43,37 6 Textiles 13,400 69,16
2 Publishing and printing products 16,403 64,39 7 Leather and lug-
gage 13,107 63,39
3 Wood products 15,809 60,59 8 Medical, precision
and optical instruments
12,883 65,18
4 Furniture and products n.e.c. 14,602 58,65 9 Rubber and plastic
products 11,843 63,01
5 Fabricated metal products 13,925 70,93 10 Machinery and
equipment 11,709 54,66

11
Table 2 Production-induced employment effects within the sectors
Employment effects induced by an increase in production of one billion Euros within sectors
highest shares lowest shares
Sector job effects
% of jobs created within sector
Sector job effects
% of jobs created within sector
Fabricated metal products 13,925 70,93 Office machinery and
computers 7,380 40,41
Textiles 13,392 69,21 Motor vehicles, trailers and semi-trailers 9,495 38,84
Medical, precision and optical instruments 12,871 65,24 Chemicals and chemical
products 8,207 35,85
Publishing and printing products 16,403 64,39 Tobacco products 9,598 27,80
Leather and luggage 13,095 63,45 Coke, refined petroleum products and nuclear fuel 1,965 18,08
Source: own calculations, Data: Federal Statistical Office.
We then calculated the employment effects that arise in a specific sector, due a si-multaneous increase in production of one billion Euros in each manufacturing sector. Table 3 shows which sectors benefit most, in terms of job creation, from the output of the various manufacturing sectors. This ranking also includes primary and service sectors because, due to interdependencies, jobs are created there too.
Not surprisingly, Sector 74 (other business services) benefits most from increased production by the manufacturing industries (39,281 jobs are created in this sector). In a highly competitive environment, many firms focus on core business activities and therefore decide to outsource auxiliary functions. Service activities (e.g. services pro-vided by the sectors “other business activities” and “wholesale trade and vehicles”) can be considered as auxiliary functions of manufacturing firms. These two sectors are the only service sectors among the first ten with the highest job effects. The sec-ond highest job effect occurs in Sector 28 (fabricated metal products) with 14,579 jobs created when each manufacturing sector increases production.

12
Table 3 Sectoral employment effects
Sectoral employment effects induced by a simultaneous increase in production of one billion Euros in each manufacturing sector
Position Sector Job effects Position Sector Job effects
1 Other business services 39,281 6 Textiles 10,529
2 Fabricated metal products 14,579 7 Rubber and plastic
products 9,286
3 Wholesale trade and vehicles 14,128 8 Furniture and products
n.e.c. 8,692
4 Publishing and printing products 12,345 9 Other non-metallic
products 8,660
5 Wood products 10,676 10 Medical, precision and optical instruments 8,614
Source: own calculations, Data: Federal Statistical Office.
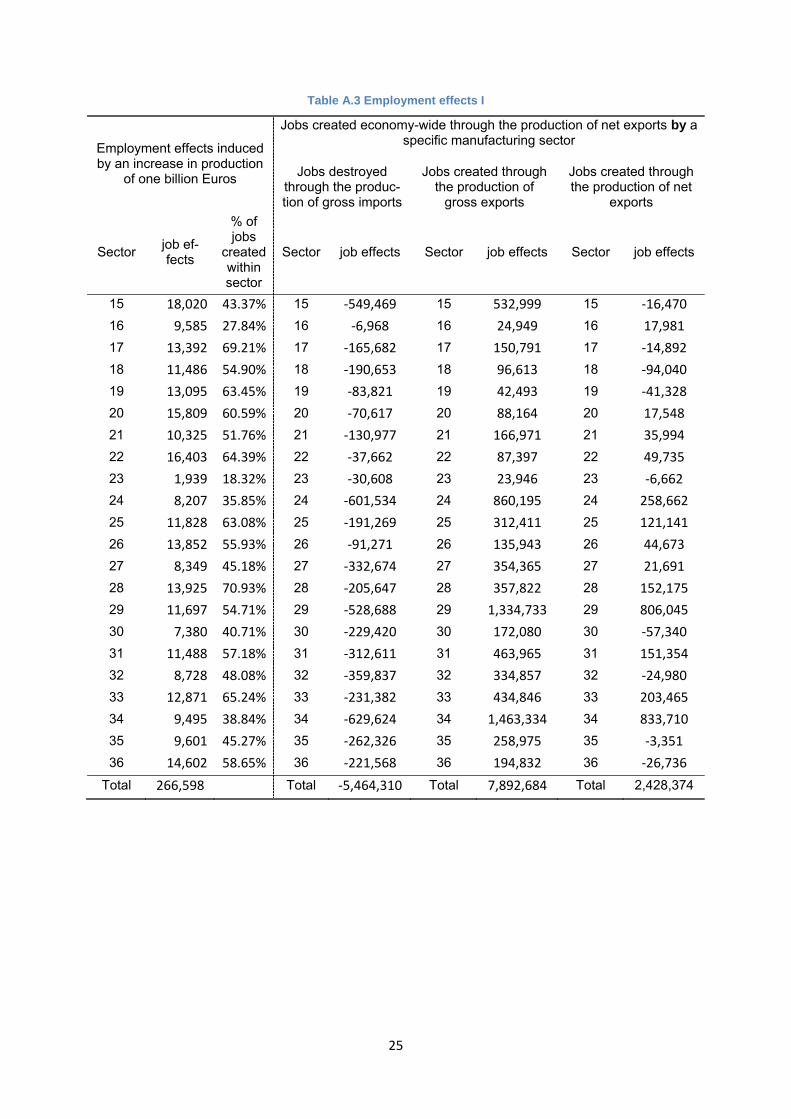
In order to determine the job effects of the international trade of German manufactur-ing industries, we now calculate how many German workers, at current wages, prices, and productivity levels, would be needed to produce the goods imported by Germany. This provides a measure of “employment loss” due to international trade, under the assumption that all imported goods would be produced domestically. We then calculate the “employment gain” due to international trade, by computing the number of manufacturing jobs needed to produce the exports. By subtracting the first figure from the second, a net measure of the employment effect of trade relations is obtained. In the following analysis, we concentrate on the employment effects of net exports.
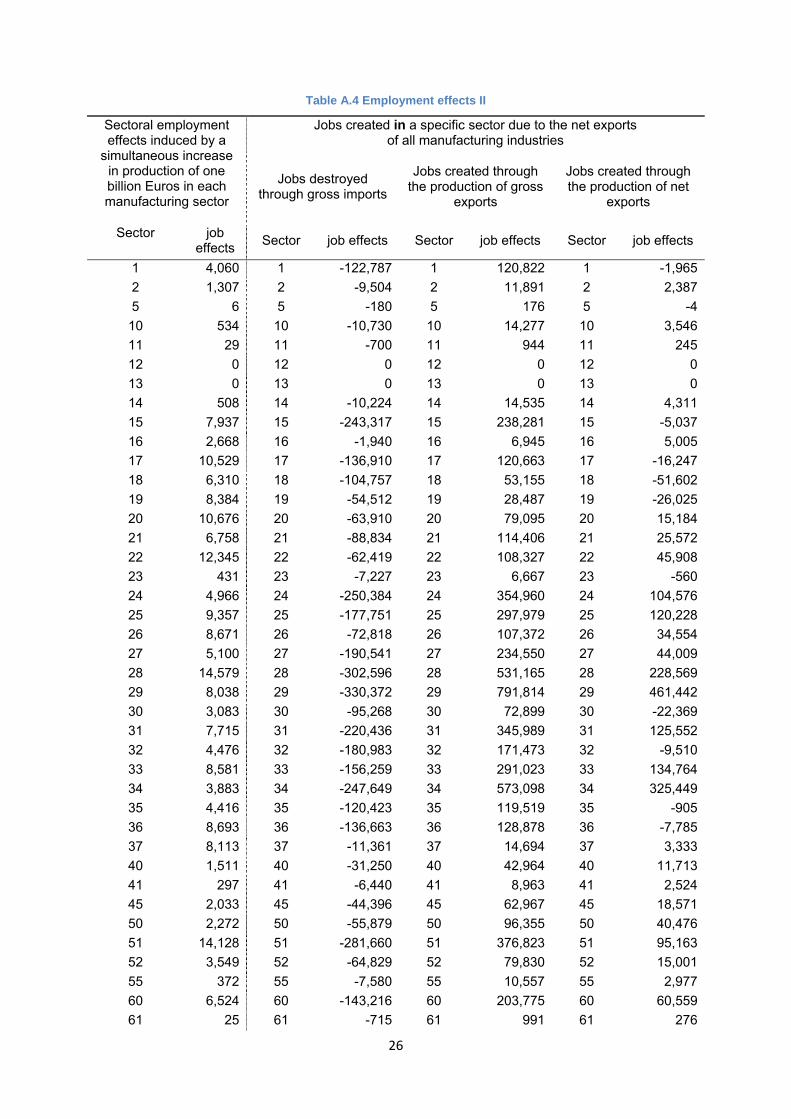
Our analysis is bipartite: the number of jobs created economy-wide, through the pro-duction of net exports by a specific manufacturing sector, is shown in Table 4. The number of jobs created in a specific sector, due to the net exports of all manufactur-ing industries, is given in Table 5.
The job effects of net exports are by far the greatest in Sector 34 (motor vehicles, trailers and semi-trailers) and in Sector 29 (machinery and equipment). These two sectors are responsible for around two thirds of the total number of jobs created by the net exports of all manufacturing industries. Sector 24 (chemicals and chemical products) follows in third place with 258,662 trade-induced job gains.
However, there are also sectors which have negative trade-induced employment ef-fects. “Wearing apparel”, “office machinery and computers”, “leather and leather products”, “furniture, other manufactured goods” and “radio, television and telecom-munication equipment” account for a loss of 90,000 German jobs. This means that the number of jobs created through the production of exports is overcompensated by the number of jobs that are destroyed due to imports. The manufactured goods from these sectors are, in general, not particularly skill-intensive and can, therefore, be produced cheaper abroad.
In total, the input-output-analysis indicates that more than 2.4 million jobs depend on the production of net exports. On the one hand, this result is evidence of the high in-

13
ternational competitiveness of the German manufacturing sector and confirms the hypothesis that being integrated into the world economy is advantageous for the do-mestic economy. On the other hand, the sharp decrease in trade volumes in the cur-rent economic crisis is hitting the German economy extremely hard; a distinct in-crease in unemployment will be the consequence.
Table 4 Trade-induced employment effects I
Jobs created economy-wide through the production of net exports by a specific manufacturing sector
Jobs destroyed through gross imports
Jobs created through the production of gross exports
Jobs created through the production of net exports
Sector job effects Sector job effects Sector job effects
Motor vehicles, trailers and semi-trailers -629,624
Motor vehi-cles, trailers and semi-
trailers
1,463,334 Motor vehi-cles, trailers and semi-
trailers 833,710
Chemicals and chemical products -601,534 Machinery and
equipment 1,334,733 Machinery and equipment 806,045
Food products and beverages -549,469 Chemicals
and chemical products
860,195 Chemicals and chemical
products 258,662
Machinery and equipment -528,688 Food products
and beverages 532,999
Medical, pre-cision and
optical instru-ments
203,465 Radio, televi-
sion and communication
equipment -359,837 Electrical ma-
chinery and apparatus 463,965 Fabricated
metal products 152,175 Total -5,464,310 Total 7,892,684 Total 2,428,374
Source: own calculations, Data: Federal Statistical Office.
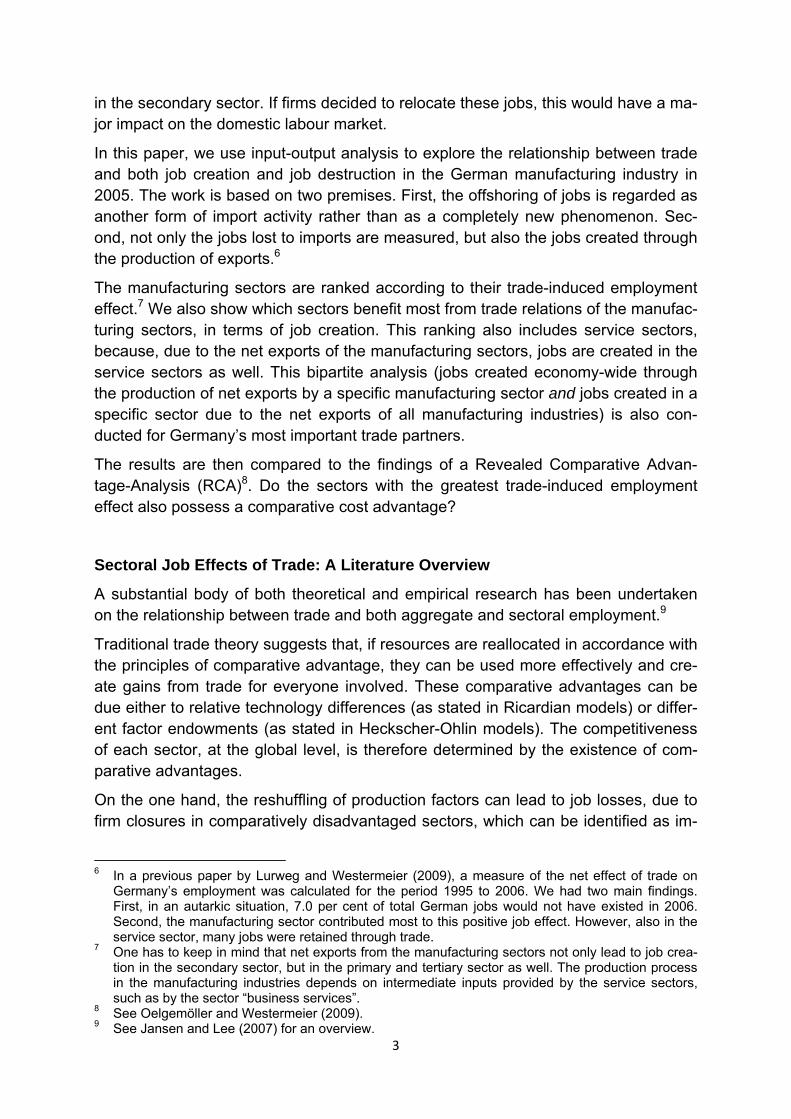
Table 5 presents the number of jobs created in a specific sector due to the net ex-ports of all manufacturing industries. Sector 29 (machinery and equipment) gains most from the net exports of the manufacturing industries; almost half a million jobs are created in this sector. As Table 3 reveals, Sector 74 (other business services) is the non-manufacturing sector which benefits the most from manufacturing export. Around 405,000 jobs are necessary to produce intermediate inputs for the net ex-ports of the manufacturing industries.
Eleven sectors face a job decrease due to net exports of the manufacturing sectors, yielding a total job destruction of 142,007 jobs. The sectors “wearing apparel”, “leather and leather products” and “office machinery and computers” suffer the great-est trade-induced job destruction. They lose the most from structural changes in-duced by globalization. Production sites are relocated to areas where production costs are cheaper than in Germany, especially to developing and emerging econo-mies.
14
Table 5 Trade-induced employment effects II
Jobs created in a specific sector due to the net exports of all manufacturing industries
Jobs destroyed through gross imports
Jobs created through the production of gross exports
Jobs created through the production of net exports
Sector job effects Sector job effects Sector job effects
Other busi-ness services -882,493 Other busi-
ness services 1,287,774 Machinery and equipment 461,442
Machinery and equipment -330,372 Machinery and
equipment 791,814 Other busi-ness services 405,281
Fabricated metal products -302,596
Motor vehi-cles, trailers and semi-
trailers 573,098
Motor vehi-cles, trailers and semi-
trailers 325,449
Wholesale trade and vehicles -281,660 Fabricated
metal products 531,165 Fabricated metal products 228,569
Chemicals and chemical
products -250,384 Wholesale trade and vehicles 376,823
Medical, pre-cision and
optical instru-ments
134,764
Total -5,464,310 Total 7,892,684 Total 2,428,374
Source: own calculations, Data: Federal Statistical Office.
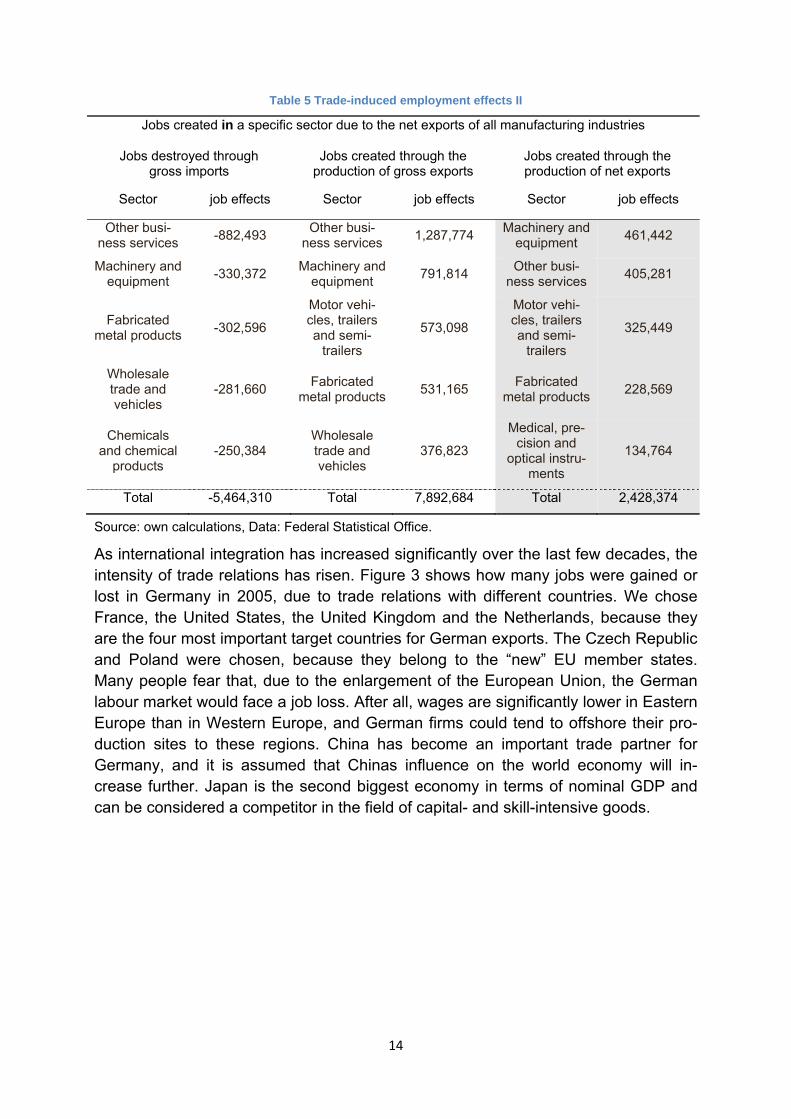
As international integration has increased significantly over the last few decades, the intensity of trade relations has risen. Figure 3 shows how many jobs were gained or lost in Germany in 2005, due to trade relations with different countries. We chose France, the United States, the United Kingdom and the Netherlands, because they are the four most important target countries for German exports. The Czech Republic and Poland were chosen, because they belong to the “new” EU member states. Many people fear that, due to the enlargement of the European Union, the German labour market would face a job loss. After all, wages are significantly lower in Eastern Europe than in Western Europe, and German firms could tend to offshore their pro-duction sites to these regions. China has become an important trade partner for Germany, and it is assumed that Chinas influence on the world economy will in-crease further. Japan is the second biggest economy in terms of nominal GDP and can be considered a competitor in the field of capital- and skill-intensive goods.

15
Figure 3 Job effects of trade relations with selected countries
Source: own calculations, Data: Federal Statistical Office.
The job effects of trade are positive for a large majority of countries. The greatest job gains result from trade relations to the United States (325,065 jobs created through the production of net exports), the United Kingdom (307,674 jobs) and France (269,679 jobs). Interestingly, even trade relations with the new EU Member States are beneficial in terms of job creation. This shows that the process of EU enlarge-ment, the subject of substantial controversy in Germany, is indeed beneficial for the domestic economy. However, job losses due to trade relations can be found for Ja-pan (-71,620 jobs) and China (-203,565 jobs). The negative job effects of trade for Germany with China are remarkable.
Interestingly, the job effects of the sectors “office machinery and computers” and “ra-dio, television and communication equipment” are negative for Germany’s net ex-ports with China and Japan. This negative effect is not surprising for Japan, because the country has been a leading producer of electronic devices for many years. The sectors “machinery and equipment” (52,944 jobs) and “motor vehicles, trailers and semi-trailers” (20,266 jobs) have the highest positive job effect of manufacturing trade with China. Due to the high capital- and skill-intensity of these goods, the German manufacturing industries are able to remain competitive. For Japan, the positive job effects of the sectors “chemicals and chemical products” (6,578 jobs) and “food prod-ucts and beverages” (3,253 jobs) are rather marginal.
The positive job effect of trade with Poland is achieved mainly by the sectors “ma-chinery and equipment” and “chemicals and chemical products”. The greatest trade-induced job loss occur due to trade by the sector “furniture, other manufactured goods”. This finding indicates that labour-intensive production is increasingly being relocated to countries with relatively low labour costs, while the production of those goods that depend on human capital and high technology, remain in industrialized countries like Germany.
‐203,565
‐71,620
19,572
52,125
119,207
269,679
307,674
325,065
‐250,000 ‐150,000 ‐50,000 50,000 150,000 250,000 350,000
China
Japan
Czech Republic
Poland
Netherlands
France
United Kingdom
United States

16
Comparison with the sectors with comparative cost advantages for Germany
Our final step is to compare the sectors which Oelgemöller and Westermeier (2009)35 identified as those in which Germany has comparative cost advantages, with those sectors yielding the greatest job effects. They took the Balassa-indicator36
,1 RCA ⎥⎦
⎤⎢⎣
⎡+−
=ii
ii
i MXMX
the value of which ranges from -1 to +1. Here, a value above zero indicates compara-tive cost advantages. The second indicator they chose is another RCA-index con-structed by Bela Balassa:37
,
X
2
ij
⎥⎥⎥⎥⎥⎥⎥
⎦
⎤
⎢⎢⎢⎢⎢⎢⎢
⎣
⎡
=
∑∑∑
∑
i jij
jij
iij
i
X
X
XRCA
This indicator ranges from zero to infinity, with values above one indicating compara-tive cost advantages. Following the trade theory of David Ricardo, a country should concentrate its production on those sectors with comparative advantages. As the theory suggests and as Oelgemöller and Westermeier demonstrated,38 Germany’s advantageous sectors are capital-intensive manufacturing, related to human and fi-nancial capital. While a RCA 1-index indicates a high positive job effect, the RCA 2-index does not. It might be possible having a high RCA 2-value while having negative net exports for a specific sector and therefore a negative job effect.39
As we established, those sectors with the greatest job-creating effects yield compara-tive cost advantages (see Table 6). Some problems occur in the analysis of Sector 24. Here, the Unctad differentiates between chemical (24a) and pharmaceutical (24b) production, while Destatis does not. Nonetheless, this trade sector remains one of the important in Germany, although its RCA-2 indicator does not suggest that this is the case. All in all, the present investigation shows that Germany has a sound trade performance and structure, but it is important to invest substantially in human capital and research and development, in order to raise innovative capacity. This is neces-
35 Oelgemöller and Westermeier used trade data from the Unido, while this examination is based on
data from the Destatis. The sector-aggregation is not perfectly congruent, but the results are none-theless comparable. The RCA-analysis is done for Western Europe. A high RCA-value indicates revealed comparative advantages compared to Western Europe trade.
36 See Balassa (1986). 37 See Balassa (1965, 1979). 38 The results are consistent with the analysis of the DIW (2006). 39 The RCA 2-index does not consider imports. Therefore, it is possible for a country to have a sector
with a high RCA 2-value, even though this country imports more goods from this sector than it ex-ports. The RCA 2-index ranges between 0 and ∞. An RCA 2-value between 0 and 1 indicates that this sector contributes a smaller share to the country exports, than the aggregate level for all sec-tors. An RCA 2-value from 1 to ∞ indicates that exports from this sector are dominant for the coun-try, while the exports are less important at the aggregate level.

17
sary, in order to deal effectively with growing international competition, particularly from the new global players of India and China.
Table 6 RCA-values
Source: own calculations, Data: Federal Statistical Office, Unido.
Concluding Remarks
In this paper, we use input-output analysis to explore the relationship between trade and both job creation and job destruction in the German manufacturing industry in 2005. Our analysis is bipartite, entailing a calculation of the number of jobs created economy-wide through the production of net exports by a specific manufacturing sec-tor, and the number of jobs created in a specific sector, due to the net exports of all manufacturing industries.
The results show that being integrated in the world economy is advantageous for the German economy. In 2005, the net exports of the manufacturing industries led to trade-induced job gains of around 2,400,000. This figure is equivalent to 6.2 per cent of total German employment. The positive job effects of trade were achieved mainly by net exports from the sectors “motor vehicles, trailers and semi-trailers” (833,710 jobs) and “machinery and equipment” (806,045 jobs). The sectors “machinery and equipment” and “other business services” benefited most from the net exports of the manufacturing industries: 461,442 jobs and 405,281 jobs respectively were neces-sary to produce intermediate inputs for the production of net exports of the manufac-turing industries. We then show that those sectors with the greatest job-creating ef-fects yield comparative cost advantages.
The job effects of trade are positive for a large majority of countries. The greatest job gains result from trade with the United States, the United Kingdom and France. Inter-estingly, even trade relations with the new EU Member States are beneficial in terms
Sector Jobs createdby sector
Jobs createdwithin sector
RCA 1 RCA 2
Motor vehicles, trailersand semi-trailers
833,710 325,449 0,33 > 0 1,27 > 1
Machinery andequipment
806,045 461,442 0,36 > 0 1,27 > 1
Chemicals andchemical products
258,662 104,576 Chemical production:
0,18 > 0
Chemical production:
1,09 > 1
Pharmaceuticalproduction:
0,17 > 0
Pharmaceuticalproduction:
0,88 < 1
Medical, precision andoptical instruments
203,465 134,764 0,24 > 0 1,11 > 1
Fabricated metalproducts
152,175 228,569 0,27 > 0 1,06 > 1

18
of job creation. This demonstrates that the process of EU enlargement, the subject of substantial controversy in Germany, is indeed beneficial for the domestic economy.
However, the fact that more than two thirds of the jobs created through the produc-tion of net exports by all manufacturing industries depend on the two sectors “motor vehicles, trailers and semi-trailers” and “machinery and equipment”, shows that the German economy is extremely vulnerable to business fluctuations in these two sec-tors. The worldwide crisis of the automobile sector and the worldwide decline in in-dustrial production might, therefore, lead to a dramatic reduction in GDP and an in-creasing rate of unemployment in Germany. Concentration might be advantageous in a constantly growing world economy, but it can become problematic in times of crisis. A stronger diversification of the production structure could, therefore, help to smooth out economic cycles.
19
References
Balassa, B. (1965): Trade liberalisation and “revealed” comparative advantages. The Manchester School of Economic and Social Studies, Vol. 33, pp. 99-123.
Balassa, B. (1979): The Changing Pattern of Comparative Advantage in Manufac-tured Goods. Review of Economics and Statistics, Vol. 61(2), pp. 259-266.
Balassa, B. (1986): Comparative Advantage in Manufactured Goods: A reprisal. Re-view of Economics and Statistics, Vol. 68(2), pp. 315-319.
Baldwin, R. E. (1995): The Effect of Trade and Foreign Direct Investment on Em-ployment and Relative Wages. OECD Economic Studies, No. 23, pp. 7-54.
Bleses, P. (2007): Input-Output-Rechnung. Wirtschaft und Statistik 1/2007, pp. 86-96.
De Backer, K. and Yamano, N. (2007): The Measurement of Globalisation using In-ternational Imput-Outpout Tables. OECD Science, technology and Industry Working Papers, 2007/8.
DIW (2006): Exportnation Deutschland – Zukunftsfähigkeit sichern. DIW-Wochenbericht No. 41/2006, pp. 545-551.
Eurostat (2008): Eurostat Manual of Supply, Use and Input-Output Tables. eurostat Methodology and Working papers.
Falk, M. and Wolfmayr, Y. (2005): Employment Effects of Outsourcing to Low Wage Countries: Empirical Evidence for EU Countries. WIFO Working Papers No. 262.
Falk, M. and Wolfmayr, Y. (2008): Services and materials outsourcing to low-wage countries and employment: Empirical evidence from EU countries. Structural Change and Economic Dynamics, Vol. 19, pp. 38-52.
Feenstra, R. C. and Hanson, G. H. (1996): Globalisation, Outsourcing and Wage Inequality. American Economic Review, Vol. 86(2), pp. 240-245.
Feenstra, R. C. and Hanson, G. H. (2003): Global Production Sharing and Rising Inequality: A Survey of Trade and Wages. In: Choi, E. K. and Harrigan, J. (eds.): Handbook of International Trade. Oxford: Basil-Blackwell.
Geishecker, I. (2004): Outsourcing and the Demand for Low-skilled Labour: Exem-plary Evidence from German Manufacturing Industries. In: Meulders, D., Plas-man, R. and Rycx, F. (eds.): Minimum Wages, Low Pay and Unemployment. Palgrave Macmillan: Basingstoke/New York.
Greenaway, D. and Nelson, D. (2001): Globalisation and Labour Markets: Literature Review and Synthesis. The University of Nottingham Globalisation and Labour Markets Programme Research Paper Series No. 2001/29.
Groshen, E. L., Hobijn, B. and McConnell, M. M. (2005): U.S. Jobs Gained and Lost through Trade: A Net Measure. Current Issues in Economics and Finance Vol. 11, No. 8, August 2005, Federal Reserve Bank of New York.

20
Grossman, G. M. and Rossi-Hansberg, E. (2006): Trading Tasks: A Simple Theory of Offshoring. NBER Working Paper Series No. 12721.
Hijzen, A., Görg, H. and Hine, R. C. (2005): International Outsourcing and the Skill Structure of Labour Demand in the United Kingdom. Economic Journal, Vol. 115, No. 506, pp. 860-878.
Hoekman, B. and Winters, A. (2005): Trade and Employment: Stylized Facts and Re-search Findings. Policy Research Working Paper 3676, Washington, DC: World Bank.
Jansen, M. and Lee, E. (2007): Trade and Employment: Challenges for Policy Re-search. A joint study of the International Labour Office and the Secretariat of the World Trade Organization.
Kowalewski, J. (2009): Methodology of the Input-Output Analysis. HWWI Research Paper 1-25.
Kruber-Meyer (2008): Theoretische Grundlagen des internationalen Handels. Infor-mationen zur politischen Bildung, Heft 299.
Lurweg, M. and Westermeier, A. (2009): Jobs Gained and Lost through Trade: The Case of Germany. CAWM Discussion Paper No. 18.
Marin, D. (2004): ‘A Nation of Poets and Thinkers’ – Less So with Eastern Enlarge-ment? Austria and Germany. Discussion Paper 2004-06, Department of Eco-nomics, University of Munich.
Molnar, M., Pain, N. and Taglioni, D. (2007): The Internationalisation of Production, International Outsourcing and Employment in the OECD. OECD Economics Department Working Papers No. 561.
Nordås, H. K., Miroudot, S. and Kowalski, P. (2006): Dynamic Gains from Trade. OECD Trade Policy Working Papers, No. 43.
OECD (2005): Trade-adjustment Costs in OECD Labour Markets: A Mountain or a Molehill? OECD Employment Outlook 2005, Chapter 1.
OECD (2007): OECD Workers in the Global Economy: Increasingly Vulnerable? OECD Employment Outlook 2007, Chapter 3.
Oelgemöller, J. and Westermeier, A. (2009): RCAs within Western Europa. cege Dis-cussion Paper No. 79.
Schöller, D. (2006): Service Offshoring: A Challenge for Employment? Evidence for Germany. Schriftenreihe des Promotionsschwerpunkts Globalisierung und Be-schäftigung Nr. 23/2006, Universität Hohenheim.
Statistisches Bundesamt (2008): Verlagerung wirtschaftlicher Aktivitäten – Ergebnis-se der Piloterhebung. Wiesbaden.
21
Appendix
Table A.1 Job Effect Matrix of Net Exports (Part I)40
Sector 1 … 8 9 10 11 12 13 14 15 16 17 18 19 20 21 22 23 24 25 26 27 28 29 30 31 … 59 Row Sum
1 0 … 0 -3,557 10 -28 -39 -19 38 32 18 -4 982 59 14 10 30 174 -24 36 -8 36 284 -1 -9 0 … 0 -1,965 2 0 … 0 -8 26 -4 -26 -30 1,082 612 23 -1 164 30 20 5 36 228 -18 28 -8 45 292 -4 -106 0 … 0 2,387 3 0 … 0 -5 0 0 0 0 0 0 0 0 1 0 0 0 0 0 0 0 0 0 0 0 0 0 … 0 -4 4 0 … 0 -23 29 -41 -127 -55 28 183 41 -159 745 231 213 119 238 750 -47 165 -22 142 1,163 -4 -25 0 … 0 3,546 5 0 … 0 -1 1 -2 -4 -2 1 11 2 -11 89 13 12 8 13 39 -1 8 -1 7 62 0 -1 0 … 0 245 6 0 … 0 0 0 0 0 0 0 0 0 0 0 0 0 0 0 0 0 0 0 0 0 0 0 0 … 0 0 7 0 … 0 0 0 0 0 0 0 0 0 0 0 0 0 0 0 0 0 0 0 0 0 0 0 0 … 0 0 8 0 … 0 -11 2 -13 -22 -19 15 24 6 -2 2,526 114 1,022 27 51 173 -12 46 -9 77 325 -1 -9 0 … 0 4,311 9 0 … 0 -7,142 8 -7 -15 -23 7 13 14 -2 1,702 72 10 9 19 108 -19 19 -6 25 178 -1 -4 0 … 0 -5,037
10 0 … 0 0 5,005 0 0 0 0 0 0 0 0 0 0 0 0 0 0 0 0 0 0 0 0 0 … 0 5,005 11 0 … 0 -2 6 -10,306 -8,273 -168 1 8 4 -1 171 184 2 3 28 266 -17 77 -26 142 1,815 -9 -151 0 … 0 -16,247 12 0 … 0 0 0 0 -51,629 0 0 0 1 0 3 0 0 1 5 7 0 1 0 1 10 0 -2 0 … 0 -51,602 13 0 … 0 0 0 0 -2 -26,221 0 0 0 0 5 1 4 1 8 33 0 4 0 24 239 0 -121 0 … 0 -26,025 14 0 … 0 -16 77 -13 -106 -112 10,633 226 24 -5 687 147 94 38 261 1,719 -136 146 -47 217 2,398 -40 -1,006 0 … 0 15,184 15 0 … 0 -88 582 -76 -466 -590 31 18,631 649 -6 2,351 440 129 34 266 1,579 -128 400 -99 697 1,358 -5 -116 0 … 0 25,572 16 0 … 0 -66 223 -103 -1,183 -302 84 507 32,022 -59 2,010 635 205 149 561 4,437 -661 857 -243 1,125 5,958 -21 -228 0 … 0 45,908 17 0 … 0 -3 3 -2 -12 -6 4 8 5 -1,221 212 98 12 17 21 109 -12 20 -3 20 177 -1 -4 0 … 0 -560 18 0 … 0 -48 36 -276 -455 -567 294 475 126 -16 92,740 3,450 312 376 533 2,443 -298 435 -153 453 4,868 -14 -136 0 … 0 104,576 19 0 … 0 -81 75 -59 -403 -116 61 376 56 -21 2,192 76,419 140 51 645 11,310 -265 1,204 -307 2,454 26,940 -24 -418 0 … 0 120,228 20 0 … 0 -55 12 -122 -162 -64 164 58 23 -10 1,350 451 24,985 203 569 1,812 -54 583 -89 1,386 3,598 -8 -78 0 … 0 34,554 21 0 … 0 -9 9 -6 -47 -13 11 34 11 -11 413 176 51 9,799 4,108 12,086 -116 2,038 -136 751 14,978 -70 -49 0 … 0 44,009 22 0 … 0 -93 35 -47 -460 -109 130 180 74 -158 3,839 1,086 281 338 107,945 51,341 -1,244 4,895 -546 5,578 56,358 -300 -553 0 … 0 228,569 23 0 … 0 -67 69 -72 -363 -158 58 240 90 -56 3,039 1,123 465 275 1,743 441,009 -88 596 -49 1,609 12,209 -56 -173 0 … 0 461,442 24 0 … 0 -2 4 -2 -13 -3 4 8 8 -3 113 35 11 9 33 251 -23,344 126 -18 201 217 -1 -4 0 … 0 -22,369 25 0 … 0 -18 20 -27 -130 -46 21 98 39 -22 811 214 98 145 426 16,266 -368 86,541 -150 1,441 20,271 -39 -38 0 … 0 125,552 26 0 … 0 -2 4 -2 -15 -5 2 8 23 -3 78 25 8 5 28 448 -845 509 -12,010 682 1,564 -9 -3 0 … 0 -9,510 27 0 … 0 -6 3 -4 -13 -8 4 32 5 -13 545 139 18 34 165 517 -32 233 -12 132,734 444 -13 -8 0 … 0 134,764 28 0 … 0 -6 3 -2 -12 -6 7 20 5 -8 145 26 69 36 33 1,053 -13 60 -20 270 323,797 -1 -5 0 … 0 325,449 29 0 … 0 -2 9 -3 -15 -5 3 10 9 -4 89 28 10 6 26 226 -80 24 -16 74 228 -1,517 -4 0 … 0 -905 30 0 … 0 0 0 0 -173 0 2 2 1 -1 11 5 3 2 11 41 -7 5 -2 9 7,988 -1 -15,681 0 … 0 -7,785
: : : : : : : : : : : : : : : : : : : : : : : : : : : : : :
40 Note that the sectors are numbered sequentially. For the corresponding sector number based on CPA, see the sector classification (Table A.2).

22
Table A.1 Job Effect Matrix of Net Exports (Part II)
Sector 1 … 8 9 10 11 12 13 14 15 16 17 18 19 20 21 22 23 24 25 26 27 28 29 30 31 … 59 Row Sum
: : : : : : : : : : : : : : : : : : : : : : : : : : : : : : 31 0 … 0 -5 17 -14 -29 -22 5 489 19 -1 334 397 122 357 170 577 -12 97 -10 68 785 -3 -9 0 … 0 3,333 32 0 … 0 -69 75 -135 -442 -190 96 540 142 -72 2,197 781 458 328 811 2,535 -164 564 -77 480 3,956 -14 -87 0 … 0 11,713 33 0 … 0 -24 17 -17 -76 -32 8 110 24 -9 575 110 75 50 156 625 -25 104 -26 102 791 -2 -14 0 … 0 2,524 34 0 … 0 -104 152 -107 -677 -257 120 335 349 -107 2,904 786 375 367 893 4,910 -507 1,028 -197 959 7,517 -19 -149 0 … 0 18,571 35 0 … 0 -125 97 -56 -486 -183 167 312 219 -89 1,891 557 474 200 750 4,416 -555 654 -148 753 31,809 -29 -152 0 … 0 40,476 36 0 … 0 -801 649 -649 -8,034 -3,811 1,077 1,854 1,000 -123 14,682 3,299 2,408 1,639 7,028 38,968 -4,869 6,767 -1,130 7,706 29,342 -153 -1,686 0 … 0 95,163 37 0 … 0 -203 168 -175 -4,902 -2,018 248 595 347 -36 3,150 751 293 108 974 5,440 -265 1,290 -204 2,645 7,217 -59 -361 0 … 0 15,001 38 0 … 0 -10 36 -12 -65 -56 15 43 225 -14 509 113 38 25 126 911 -263 126 -61 270 1,047 -4 -22 0 … 0 2,977 39 0 … 0 -354 376 -191 -1,529 -696 368 1,466 735 -1,241 8,043 2,605 2,090 1,416 2,281 15,410 -1,307 1,931 -426 3,127 27,287 -45 -786 0 … 0 60,559 40 0 … 0 -1 1 -1 -8 -3 1 4 1 -4 91 8 8 10 12 57 -6 8 -1 7 96 0 -1 0 … 0 276 41 0 … 0 -7 43 -14 -64 -18 13 40 42 -13 383 115 34 19 104 1,134 -449 103 -87 390 997 -5 -16 0 … 0 2,743 42 0 … 0 -330 138 -139 -1,201 -521 218 390 233 -147 3,855 1,334 742 419 1,311 12,723 -1,868 1,301 -329 1,654 18,054 -31 -377 0 … 0 37,430 43 0 … 0 -65 112 -76 -540 -173 89 274 702 -110 2,586 872 279 141 952 6,547 -941 1,425 -248 1,394 6,550 -23 -119 0 … 0 19,628 44 0 … 0 -152 242 -117 -692 -178 170 387 428 -210 3,275 1,131 430 238 1,241 7,758 -913 1,552 -267 1,570 10,669 -35 -205 0 … 0 26,320 45 0 … 0 -30 44 -16 -102 -44 43 109 84 -33 940 293 114 52 168 988 -113 171 -41 202 1,615 -5 -55 0 … 0 4,385 46 0 … 0 -43 65 -29 -175 -58 55 132 121 -53 1,306 372 142 73 307 1,966 -219 981 -69 386 2,852 -9 -67 0 … 0 8,034 47 0 … 0 -52 95 -50 -315 -107 59 150 191 -35 1,262 403 158 80 471 2,983 -363 660 -110 529 4,812 -13 -93 0 … 0 10,717 48 0 … 0 -61 39 -22 -144 -81 85 192 228 -26 1,227 467 216 89 428 2,036 -439 454 -104 549 3,076 -8 -68 0 … 0 8,134 49 0 … 0 -48 127 -42 -279 -125 59 201 361 -66 2,796 640 237 187 1,175 6,099 -3,426 1,263 -225 1,051 7,429 -33 -115 0 … 0 17,268 50 0 … 0 -2 2 -5 -11 -9 5 10 4 -1 1,177 259 65 23 35 312 -253 147 -79 78 1,496 -26 -4 0 … 0 3,224 51 0 … 0 -2,156 7,594 -1,420 -7,874 -2,977 1,413 4,857 7,238 -1,985 70,911 16,738 6,124 3,167 11,629 120,428 -9,778 26,785 -6,109 24,445 139,619 -588 -2,777 0 … 0 405,281 52 0 … 0 -107 302 -111 -567 -365 151 508 250 -108 3,968 1,191 569 280 938 4,014 -524 1,185 -204 962 7,075 -22 -160 0 … 0 19,225 53 0 … 0 -64 117 -59 -391 -195 77 142 167 -119 2,813 644 207 169 643 4,111 -674 817 -186 831 6,313 -28 -105 0 … 0 15,230 54 0 … 0 -42 7 -3 -12 -7 3 7 18 -1 506 114 6 4 12 254 -8 42 -9 43 954 0 -3 0 … 0 1,884 55 0 … 0 -41 33 -22 -103 -119 51 412 51 -13 2,881 285 93 127 265 1,034 -67 136 -23 140 1,639 -4 -31 0 … 0 6,722 56 0 … 0 -73 105 -84 -431 -185 54 188 226 -115 1,850 510 232 120 447 2,642 -466 582 -135 651 4,242 -14 -89 0 … 0 10,256 57 0 … 0 -95 869 -52 -333 -117 51 189 2,690 -65 2,613 567 203 109 401 4,011 -350 875 -202 826 6,732 -19 -102 0 … 0 18,799 58 0 … 0 -91 211 -55 -395 -135 160 263 365 -67 2,922 598 290 195 646 4,731 -684 1,250 -291 1,445 12,019 -19 -150 0 … 0 23,208 59 0 … 0 0 0 0 0 0 0 0 0 0 0 0 0 0 0 0 0 0 0 0 0 0 0 0 … 0 0
Column Sum
0 … 0 -16,470 17,981 -14,892 -94,040 -41,328 17,548 35,994 49,735 -6,662 258,662 121,141 44,673 21,691 152,175 806,045 -57,340 151,354 -24,980 203,465 833,710 -3,351 -26,736 0 … 0 2,428,374
23
Table A.2 Sector Classification
Sequential Number
Classification of Products by Activity
(CPA) Sector Name
1 1 Agricultural products, hunting products 2 2 Forestry products 3 5 Fish and fishing products 4 10 Coal and lignite 5 11 Crude petroleum and natural gas 6 12 Uranium and thorium ores 7 13 Metal ores
8 14 Stones, sand and clay, minerals, salt, other mining products
9 15 Food products and beverages 10 16 Tobacco products 11 17 Textiles 12 18 Wearing apparel, products of dressing and dyeing of fur 13 19 Leather, luggage, saddler, harness and footwear
14 20 Wood and products of wood and cork, straw and plaiting materials (excl. furniture)
15 21 Pulp, paper and paper products 16 22 Publishing and printing products 17 23 Coke, refined petroleum products and nuclear fuel 18 24 Chemicals and chemical products 19 25 Rubber and plastic products
20 26 Other non-metallic products
(glass, ceramics, bricks, tiles, cement, lime, plaster, concrete, stone products, etc.)
21 27 Basic metals
22 28 Fabricated metal products, except machinery and equip-ment
23 29 Machinery and equipment n.e.c. 24 30 Office machinery and computers 25 31 Electrical machinery and apparatus, n.e.c.
26 32 Radio, television and communication equipment and apparatus, electronic components
27 33 Medical, precision and optical instruments, watches and clocks
28 34 Motor vehicles, trailers and semi-trailers 29 35 Other transport equipment
30 36 Furniture and products n.e.c. (jewelry, musical instru-ments, sports goods, games and toys, etc.)
31 37 Recovered secondary raw materials 32 40 Electricity, gas, steam and hot water 33 41 Collected and purified water, distribution services of water 34 45 Construction work
35 50 Trade, maintenance and repair service of motor vehicles, etc.
36 51 Wholesale trade and vehicles etc.
24
37 52 Retail trade services, except of motor vehicles etc. 38 55 Hotel and restaurant services 39 60 Land transport and transport via pipeline service 40 61 Water transport service 41 62 Air transport service
42 63 Supporting and auxiliary transport services; travel agency services
43 64 Post and telecommunication services
44 65 Financial intermediation services, excl. insurance and pension funding services
45 66 Insurance and pension funding services 46 67 Services auxiliary to financial intermediation 47 70 Real estate services 48 71 Renting services to machinery and equipment 49 72 Computer and related services 50 73 Research and development services 51 74 Other business services
52 75 Public administration and defense services; compulsory social security services
53 80 Education services 54 85 Health and social work services
55 90 Sewage and refuse disposal services, sanitation and similar services
56 91 Membership organization services n.e.c. 57 92 Recreational, cultural and sporting services 58 93 Other services 59 95 Private households with employed persons
25
Table A.3 Employment effects I
Employment effects induced by an increase in production
of one billion Euros
Jobs created economy-wide through the production of net exports by a specific manufacturing sector
Jobs destroyed through the produc-tion of gross imports
Jobs created through the production of
gross exports
Jobs created through the production of net
exports
Sector job ef-fects
% of jobs
created within sector
Sector job effects Sector job effects Sector job effects
15 18,020 43.37% 15 ‐549,469 15 532,999 15 ‐16,470
16 9,585 27.84% 16 ‐6,968 16 24,949 16 17,981
17 13,392 69.21% 17 ‐165,682 17 150,791 17 ‐14,892
18 11,486 54.90% 18 ‐190,653 18 96,613 18 ‐94,040
19 13,095 63.45% 19 ‐83,821 19 42,493 19 ‐41,328
20 15,809 60.59% 20 ‐70,617 20 88,164 20 17,548
21 10,325 51.76% 21 ‐130,977 21 166,971 21 35,994
22 16,403 64.39% 22 ‐37,662 22 87,397 22 49,735
23 1,939 18.32% 23 ‐30,608 23 23,946 23 ‐6,662
24 8,207 35.85% 24 ‐601,534 24 860,195 24 258,662
25 11,828 63.08% 25 ‐191,269 25 312,411 25 121,141
26 13,852 55.93% 26 ‐91,271 26 135,943 26 44,673
27 8,349 45.18% 27 ‐332,674 27 354,365 27 21,691
28 13,925 70.93% 28 ‐205,647 28 357,822 28 152,175
29 11,697 54.71% 29 ‐528,688 29 1,334,733 29 806,045
30 7,380 40.71% 30 ‐229,420 30 172,080 30 ‐57,340
31 11,488 57.18% 31 ‐312,611 31 463,965 31 151,354
32 8,728 48.08% 32 ‐359,837 32 334,857 32 ‐24,980
33 12,871 65.24% 33 ‐231,382 33 434,846 33 203,465
34 9,495 38.84% 34 ‐629,624 34 1,463,334 34 833,710
35 9,601 45.27% 35 ‐262,326 35 258,975 35 ‐3,351
36 14,602 58.65% 36 ‐221,568 36 194,832 36 ‐26,736
Total 266,598 Total ‐5,464,310 Total 7,892,684 Total 2,428,374
26
Table A.4 Employment effects II
Sectoral employment effects induced by a
simultaneous increase in production of one billion Euros in each manufacturing sector
Jobs created in a specific sector due to the net exports of all manufacturing industries
Jobs destroyed through gross imports
Jobs created through the production of gross
exports
Jobs created through the production of net
exports
Sector job effects Sector job effects Sector job effects Sector job effects
1 4,060 1 -122,787 1 120,822 1 -1,9652 1,307 2 -9,504 2 11,891 2 2,3875 6 5 -180 5 176 5 -410 534 10 -10,730 10 14,277 10 3,54611 29 11 -700 11 944 11 24512 0 12 0 12 0 12 013 0 13 0 13 0 13 014 508 14 -10,224 14 14,535 14 4,31115 7,937 15 -243,317 15 238,281 15 -5,03716 2,668 16 -1,940 16 6,945 16 5,00517 10,529 17 -136,910 17 120,663 17 -16,24718 6,310 18 -104,757 18 53,155 18 -51,60219 8,384 19 -54,512 19 28,487 19 -26,02520 10,676 20 -63,910 20 79,095 20 15,18421 6,758 21 -88,834 21 114,406 21 25,57222 12,345 22 -62,419 22 108,327 22 45,90823 431 23 -7,227 23 6,667 23 -56024 4,966 24 -250,384 24 354,960 24 104,57625 9,357 25 -177,751 25 297,979 25 120,22826 8,671 26 -72,818 26 107,372 26 34,55427 5,100 27 -190,541 27 234,550 27 44,00928 14,579 28 -302,596 28 531,165 28 228,56929 8,038 29 -330,372 29 791,814 29 461,44230 3,083 30 -95,268 30 72,899 30 -22,36931 7,715 31 -220,436 31 345,989 31 125,55232 4,476 32 -180,983 32 171,473 32 -9,51033 8,581 33 -156,259 33 291,023 33 134,76434 3,883 34 -247,649 34 573,098 34 325,44935 4,416 35 -120,423 35 119,519 35 -90536 8,693 36 -136,663 36 128,878 36 -7,78537 8,113 37 -11,361 37 14,694 37 3,33340 1,511 40 -31,250 40 42,964 40 11,71341 297 41 -6,440 41 8,963 41 2,52445 2,033 45 -44,396 45 62,967 45 18,57150 2,272 50 -55,879 50 96,355 50 40,47651 14,128 51 -281,660 51 376,823 51 95,16352 3,549 52 -64,829 52 79,830 52 15,00155 372 55 -7,580 55 10,557 55 2,97760 6,524 60 -143,216 60 203,775 60 60,55961 25 61 -715 61 991 61 276
27
62 325 62 -8,180 62 10,924 62 2,74363 3,492 63 -84,349 63 121,778 63 37,43064 1,900 64 -42,234 64 61,862 64 19,62865 2,531 65 -57,282 65 83,602 65 26,32066 493 66 -10,541 66 14,926 66 4,38567 777 67 -17,796 67 25,831 67 8,03470 1,026 70 -22,408 70 33,124 70 10,71771 993 71 -19,734 71 27,868 71 8,13472 2,023 72 -50,848 72 68,116 72 17,26873 291 73 -9,806 73 13,030 73 3,22474 39,281 74 -882,493 74 1,287,774 74 405,28175 2,535 75 -47,407 75 66,632 75 19,22580 1,432 80 -35,459 80 50,689 80 15,23085 129 85 -4,238 85 6,122 85 1,88490 682 90 -17,090 90 23,812 90 6,72291 1,327 91 -26,845 91 37,100 91 10,25692 2,542 92 -34,966 92 53,765 92 18,79993 1,941 93 -45,213 93 68,421 93 23,20895 0 95 0 1 120,822 95 0
Total 266,586 Total -5,464,310 Total 7,892,684 Total 2,428,374
Table A.5: Employment Effects by Country I (Part I)
Jobs created economy-wide through the production of net exports by a specific manufacturing sector
Austria Belgium China Czech Republic
Rank Sector Job Effects Sector Job Effects Sector Job Effects Sector Job Effects
1 29 31,399 24 54,582 29 10,350 24 7,273
2 24 17,555 34 43,100 34 9,665 15 5,933
3 18 14,553 29 26,423 24 5,373 25 4,914
4 15 12,162 28 11,027 28 4,370 33 3,939
5 31 11,253 33 8,030 31 3,131 27 2,698
: : : : : : : : :
25 19 2,416 16 264 19 -22,483 18 -6
26 21 851 17 -1,533 18 -45,606 20 -1,129
27 16 -137 23 -2,373 36 -51,818 31 -2,922
28 20 -1,100 15 -8,934 32 -53,810 36 -3,315
29 27 -2,779 27 -12,496 30 -57,452 34 -7,909
Total 168,383 Total 156,893 Total -203,270 Total 19,812

28
Table A.5: Employment Effects by Country I (Part II)
Jobs created economy-wide through the production of net exports by a specific manufacturing sector
France Hungary Italy Japan
Rank Sector Job Effects Sector Job Effects Sector Job Effects Sector Job Effects
1 29 60,931 29 7,953 34 71,348 24 6,576
2 34 35,410 24 5,693 24 34,888 15 3,248
3 33 20,638 28 4,300 33 17,589 34 1,546
4 24 19,896 25 3,739 32 16,524 27 1,132
5 28 19,871 17 1,853 29 14,914 20 8,62
: : : : : : : : :
25 22 3,668 36 -2,600 26 -2,561 35 -5,129
26 19 1,517 30 -2,906 18 -5,183 29 -7,065
27 23 688 33 -3,334 36 -7,922 31 -14,458
28 16 34 34 -5,845 19 -10,552 30 -20,408
29 15 -6,599 32 -7,483 17 -11,732 32 -33,444
Total 268,542 Total 3,822 Total 177,117 Total -71,549
Table A.5: Employment Effects by Country I (Part III)
Jobs created economy-wide through the production of net exports by a specific manufacturing sector
Netherlands Poland Russia Spain
Rank Sector Job Effects Sector Job Effects Sector Job Effects Sector Job Effects
1 29 34,398 29 19,294 29 48,901 34 50,678
2 34 29,078 24 18,210 34 18,242 29 44,851
3 33 12,458 32 7,533 32 14,028 32 19,546
4 31 12,251 25 7,042 24 13,888 24 17,724
5 28 11,668 17 5,169 15 13,044 31 15,834
: : : : : : : : :
25 30 -2,387 35 -1,096 19 1,367 20 2,115
26 24 -4,336 20 -2,649 16 377 22 1,495
27 32 -4,942 18 -3,598 20 -1,109 23 1,418
28 23 -11,738 15 -7,504 23 -2,524 26 697
29 15 -12,763 36 -18,888 27 -18,594 19 -814
Total 117,990 Total 52,466 Total 145,028 Total 225,150

29
Table A.5: Employment Effects by Country I (Part IV)
Jobs created economy-wide through the production of net exports by a specific manufacturing sector
Sweden Switzerland United Kingdom United States
Rank Sector Job Effects Sector Job Effects Sector Job Effects Sector Job Effects
1 34 21,176 34 22,123 34 107,188 34 179,976
2 29 18,422 22 9,971 29 49,740 29 96,392
3 15 9,201 36 8,731 15 26,526 33 21,241
4 31 8,409 30 8,272 28 18,540 31 19,914
5 33 6,016 18 7,313 32 17,430 28 15,380
: : : : : : : : :
25 16 62 21 -2,228 16 54 22 398
26 23 -348 32 -2,540 27 39 16 -87
27 20 -379 24 -3,130 23 -285 30 -12,070
28 27 -3,133 29 -8,985 35 -913 32 -15,066
29 21 -18,628 33 -10,767 24 -5,138 35 -46,026
Total 71,874 Total 53,000 Total 307,311 Total 324,792
Table A.6: Employment Effects by Country II (Part I)41
Jobs created in a specific sector due to the net exports of all manufacturing industries
Austria Belgium China Czech Republic
Rank Sector Job Effects Sector Job Effects Sector Job Effects Sector Job Effects
1 74 25,532 74 29,830 29 28,342 74 3,782
2 29 18,143 24 20,067 34 7,860 25 2,985
3 28 11,707 34 16,805 27 5,422 24 2,823
4 51 8,365 29 15,902 35 5,076 15 2,626
5 25 8,123 28 13,803 33 1,091 33 2,596
: : : : : : : : :
55 61 18 23 -376 30 -23,431 50 -114
56 5 4 17 -659 18 -25,042 20 -757
57 27 -31 1 -1,688 74 -26,450 31 -1,735
58 16 -38 15 -3,495 32 -26,676 36 -2,019
59 20 -54 27 -3,903 36 -30,287 34 -3,052
Total 168,383 Total 156,893 Total -203,270 Total 19,812
41 The sectors 12 (uranium and thorium ores), 13 (metal ores) and 59 (private households) always
have an employment effect of zero and are therefore not stated in the tables.

30
Table A.6: Employment Effects by Country II (Part II)
Jobs created in a specific sector due to the net exports of all manufacturing industries
France Hungary Italy Japan
Rank Sector Job Effects Sector Job Effects Sector Job Effects Sector Job Effects
1 74 41,147 29 4,374 74 36,152 24 1,958
2 29 35,146 28 2,863 34 27,814 15 1,433
3 28 23,564 25 2,176 24 13,171 1 703
4 34 13,926 24 2,139 33 11,651 34 554
5 33 13,691 17 1,203 29 9,926 19 507
: : : : : : : : :
55 11 28 30 -1,186 26 -612 29 -4,024
56 16 9 36 -1,582 18 -2,843 30 -8,347
57 5 -2 33 -2,159 36 -3,965 31 -8,759
58 1 -1,252 34 -2,264 19 -6,706 74 -13,799
59 15 -2,676 32 -3,658 17 -8,432 32 -16,453
Total 268,542 Total 3,832 Total 177,117 Total -71,549
Table A.6: Employment Effects by Country II (Part III)
Jobs created in a specific sector due to the net exports of all manufacturing industries
Netherlands Poland Russia Spain
Rank Sector Job Effects Sector Job Effects Sector Job Effects Sector Job Effects
1 29 19,707 74 11,592 29 27,420 74 39,557
2 28 13,276 29 10,915 74 23,408 29 26,134
3 74 12,844 24 6,935 28 11,043 34 19,814
4 34 11,360 25 4,906 25 7,255 28 15,127
5 25 9,149 28 4,735 34 7,168 31 11,667
: : : : : : : : :
55 30 -929 1 -1,534 11 4 85 144
56 23 -2,125 18 -1,976 37 -125 61 24
57 32 -2,244 20 -2,156 20 -240 11 23
58 1 -2,722 15 -3,121 23 -437 5 1
59 15 -5,535 36 -11,046 27 -6,816 19 -472
Total 117,990 Total 52,466 Total 145,028 Total 225,150

31
Table A.6: Employment Effects by Country II (Part IV)
Jobs created in a specific sector due to the net exports of all manufacturing industries
Sweden Switzerland United Kingdom United States
Rank Sector Job Effects Sector Job Effects Sector Job Effects Sector Job Effects
1 74 11,141 22 8,587 74 45,410 34 70,079
2 29 10,592 74 6,986 34 41,770 29 55,492
3 34 8,259 22 6,796 29 29,627 74 47,064
4 28 7,199 36 5,349 28 25,504 28 26,470
5 31 5,803 18 4,016 51 13,531 31 17,381
: : : : : : : : :
55 20 -94 15 -731 11 22 5 2
56 37 -224 21 -908 16 15 16 -24
57 2 -303 32 -1,083 5 9 30 -4,800
58 27 -384 29 -4,402 23 6 32 -7,003
59 21 -9,358 33 -6,994 35 -321 35 -20,759
Total 71,874 Total 53,000 Total 307,311 Total 324,792