securing your cloud transformation - seeking alpha
TRANSCRIPT

Securing your Digital Transformation
Corporate IR PresentationFebruary 2021

©2021 Zscaler, Inc. All rights reserved. 2 Securing your cloud transformation
Safe Harbor
Forward-Looking Statements
This presentation has been prepared by Zscaler, Inc. (“Zscaler”) for informational purposes only and not for any other purpose. Nothing contained
in this presentation is, or should be construed as, a recommendation, promise or representation by the presenter or Zscaler or any officer, director,
employee, agent or advisor of Zscaler. This presentation does not purport to be all-inclusive or to contain all of the information you may desire.
This presentation contains forward-looking statements. All statements other than statements of historical fact, including statements regarding our
planned products and upgrades, business strategy and plans and objectives of management for future operations of Zscaler are forward-looking
statements. These statements involve known and a significant number of unknown risks, uncertainties, assumptions and other factors that could
cause results to differ materially from statements made in this message, including any performance or achievements expressed or implied by the
forward-looking statements. Moreover, we operate in a very competitive and rapidly changing environment, and new risks may emerge from time
to time. It is not possible for us to predict all risks, nor can we assess the impact of all factors on our business or the extent to which any factor, or
combination of factors, may cause actual results or outcomes to differ materially from those contained in any forward-looking statements we may
make, including but not limited to the duration and global impact of COVID-19 on our business, operations and financial results and the economy
in general; our ability as an organization to acquire and integrate other companies, products or technologies in a successful manner. Additional
risks and uncertainties that could affect our financial and operating results are included in our most recent filings with the Securities and Exchange
Commission (“SEC”). You can locate these reports though our website at http://ir.zscaler.com or on the SEC website at www.sec.gov.
In some cases, you can identify forward-looking statements by terms such as “anticipate,” “believe,” “continues,” “contemplate,” “could,” “estimate,”
“expect,” “explore,” “intend,” “likely,” “may,” “plan,” “potential,” “predict,” “project,” “should,” “target,” “will” or “would” or the negative of these terms
or other similar words. Zscaler based these forward-looking statements largely on its current expectations and projections about future events that
it believes may affect its business. Actual outcomes and results may differ materially from those contemplated by these forward-looking
statements. All forward-looking statements in this message are based on information available to us as of the date hereof, and we do not assume
any obligation to update the forward-looking statements provided to reflect events that occur or circumstances that exist after the date on which
they were made.

3 ©2021 Zscaler, Inc. All rights reserved. SECURING YOUR DIGITAL TRANSFORMATION
Pioneer and leader
in Cloud Security
>5,000 customers (1) | 500 of the Forbes Global
2000 (1) | ~50% international revenue (2)
Serving a large addressable market
Estimated $72 Billion in Market SAM(3)
Secular tailwinds creating
significant opportunity
cloud shift, mobility, IoT, rising threats, legacy
consolidation and simplification
Experienced, founder-led team with the conviction to build a lasting
company that redefines network security
Cloud platform with scale,
sustainable competitive differentiation
200+ patents issued and pending,
150+ data centers | 150B+ requests/day
Preventing 7B incident & policy violations/day(4)
Attractive profile:
recurring subscription,
rapid growth, compelling GM
~$536M LTM revenue(5) | ~50% historical growth per year (6)
~80% Gross Profit Margin (7)
1) Total customers, Forbes Global 2000 customers as of January 31, 2021.
2) International revenue by geography as of FY20,
3) Based on our analysis of IDC estimates, including Worldwide Network Security Forecast 2018-2022 (August 2018), Worldwide IT Security Products Forecast, 2018 - 2022 (August 2018), and Security Spending Guide Forecast 2017’H2 (July 2018).
4) Based on January 2021 data.
5) Last Twelve Months(“LTM”) revenue ended January 31, 2021.
6) Revenue Compound Annual Growth Rate (“CAGR”) for FY18, FY19 and FY20.
7) Gross profit margin for FY20.
Zscaler Highlights: Transformative SaaS Enabling the Digital Transition
3
Secure digital transformation is
accelerating. Top of mind in C-Suite.
Delivering world-class sales
execution, which we believe will drive
sustainable long-term growth
Architecture Matters!
Cloud-Native, Multi-Tenant From Start
Comprehensive
User Protection
Protecting
App & Data

4 ©2021 Zscaler, Inc. All rights reserved. SECURING YOUR DIGITAL TRANSFORMATION
ZERO TRUST EXCHANGEAny-to-any connectivity
NETWORK SECURITYPerimeter defenses
Trusted Network
DC
DC DC
Castle-and-Moat Security
Hub-and-Spoke Network
Driving Transition from Legacy On Prem to Cloud / Mobile Standard
4
ZERO TRUST
EXCHANGE
Workforce Customers
Data Center
OTIoT
Factory
Corporate network
Public Internet

5 ©2021 Zscaler, Inc. All rights reserved. SECURING YOUR DIGITAL TRANSFORMATION
Hub & Spoke NetworksOptimized to connect users to apps in the data center
Outbound Gateway
Inbound Gateway
Castle & Moat SecurityPerimeter security appliances to protect the network
Trusted Network
Workforce Customers
Traditional IT: Worked Well When Apps Resided in the Data Center, and Employees Showed Up to the Office
FW / IPS
URL Filter
Antivirus
DLP
SSL
Sandbox
DNS
Global LB
DDoS
Ext. FW/IPS
RAS (VPN)
Internal FW
Internal LB
EU
DC
NA
DC
Corporate network
Public Internet

6 ©2021 Zscaler, Inc. All rights reserved. SECURING YOUR DIGITAL TRANSFORMATION
Cloud Breaks Legacy Networks and Security
NotPetya
The cloud is the new
data center
Backhaul trafficBranch: MPLS / Mobile: VPN Poor user experience
Natural path Direct-to-Cloud
MPLS backhaul costs
Security risk
But, security is still
sitting in the DC

7 ©2021 Zscaler, Inc. All rights reserved. SECURING YOUR DIGITAL TRANSFORMATION
Zscaler: Powering Digital Transformation
500 of the Forbes Global 2000 (1)
Market Leader
10 years in a rowGartner MQ Leader
Industry Leader
150B+Daily transactions150 data centers10x Google searches
Global Scale
10+years running an inline security cloud
Operational Excellence
35xFewer Infected
Machines
70%Infrastructure
Cost Reduction
80%Faster User
Experience
1) As of January 31, 2021, based on the 2020, Forbes Global 2000.
ZERO TRUST
EXCHANGE
Workforce Customers
Data Center
OTIoT
Factory

8 ©2021 Zscaler, Inc. All rights reserved. SECURING YOUR DIGITAL TRANSFORMATION
Denver
Toronto
New YorkParis
LondonAmsterdam
Brussels
StockholmMoscow
Mumbai
Singapore
SydneyCape Town
Madrid
Johannesburg
Atlanta Dallas
Frankfurt
Sao Paulo
LagosKuala Lumpur
Tel Aviv
Washington DC
Chicago
Los Angeles
Copenhagen
Melbourne
Milan
Hong Kong Taipei
Zurich
Chennai
TianjinTokyo
Qatar
UAE
Miami
Saudi Arabia
Warsaw
Seattle
Oslo
Shanghai
Auckland
SeoulSan Francisco
Beijing
Manchester
Rouen
Vienna
New DelhiOsaka
Nuevo Lared
Global Footprint Delivers Better Security & User Experience
Operational Excellence
Transactions / Day
150B+ 200K+Security Updates / DayData Centers
150Enforcements / Day
7B+
Availability SLA 99.999%
75% Renewable Energy
Proven Elasticity & Scale
Security Hardened
Operational Compliance
*Map shows major cities where Zscaler has data center. This map does not show a comprehensive list of Zscaler’s total global footprint of over 150 data center locations.

9 ©2021 Zscaler, Inc. All rights reserved. SECURING YOUR DIGITAL TRANSFORMATIONSECURING YOUR DIGITAL TRANSFORMATION
10 years in a row Gartner MQ LeaderIn Secure Web Gateway
Industry Leader
Have you seen a vendor map like this? Zscaler is now the only leader in Gartner’s MQ
The Only Leader
Market Leadership
Firewall vendors were not considered due to lack of proxy architecture: Firewalls are designed to build a moat around the castle, wrong architecture for securing users
SWG requires Proxy architecture
SWG solutions include CASB, zero trust network
access, FWaaS and remote browser isolation
Recognized Leader in Security

10 ©2021 Zscaler, Inc. All rights reserved. SECURING YOUR DIGITAL TRANSFORMATION
Simplify IT and reduce costs by consolidating and eliminating point products
Workforce Customers
Data Center
OTIoT
Factory
ZERO TRUST
EXCHANGE
Zscaler Internet Access
Secure Internet and SaaS access
User to Internet
Zscaler Private Access
Secure Private App Access
User to Private App
Zscaler Digital Experience
User Experience
User to App Experience
1 2
3
User Protection and ExperienceWorkload and Server Protection
Zscaler Innovation: Zero Trust Exchange Platform
Technology Differentiation
Zscaler Cloud Protection
Secure Apps and Workloads
App to App
4

11 ©2021 Zscaler, Inc. All rights reserved. SECURING YOUR DIGITAL TRANSFORMATION
Innovation Engine and Extensible Platform
Comprehensive Platform to Deliver Zero-Trust Security
Data Protection
Cloud Firewall
URL Filtering
Bandwidth Control
DNS Resolution
Access ControlThreat Prevention
Proxy (Native SSL)
Advanced Threat Protection
Cloud Sandbox
DNS Security
Cloud DLP
Exact Data Match
CASB
Browser Isolation
Zscaler Internet Access (ZIA)Protect against threats and data leakage
GSLB
App Health Monitoring
App Discovery
Discovery/AvailabilityZero-Trust Network Access
Anti-VPN
Anti-Firewall
Anti-DDoS
Anti-network segmentation
App / Device Access
Browser Isolation
Private Service Edge
Zscaler Private Access (ZPA)Protect apps/data; only allow authorized access
Policy Compliance
Configuration Mgt
Security Posture/CSPMWorkload Communication
Cloud to Internet
Cloud to Data Center
Cloud to Cloud
Microsegmentation
Software Identity
App segmentation
Zscaler Cloud Protection (ZCP)Extends zero-trust security to public cloud
Device PostureNetwork Path Analysis App Performance
Zscaler Digital Experience (ZDX)Identify and resolve device and network issues
Hop-by-hop Network Analytics Device Health Metrics App Response Times

12 ©2021 Zscaler, Inc. All rights reserved. SECURING YOUR DIGITAL TRANSFORMATION
ZCP: Automating, simplifying and securing workload communications
ZERO TRUST EXCHANGE
Data Center
WFA Workforce
3rd Party
ContractorCustomer /
Supplier
East
West East
Internet / SaaS
Secure user to cloud access (ZPA)1
Secure cloud to data center
communications (ZPA)2
Secure cloud to internet
communications (ZIA)4
Secure cloud to cloud
communications (ZPA) 3
Simplified, flexible traffic forwarding within
and across clouds via Cloud Connector
ZIA and ZPA policy engines enforce
easy to manage business level policies
ZIA enforces policy, security and data
protection for workload to internet comms
ZPA delivers zero trust for secure:
• user-cloud
• cloud-cloud
• cloud-DC
• 3rd party file exchange access

13 ©2021 Zscaler, Inc. All rights reserved. SECURING YOUR DIGITAL TRANSFORMATION
Ecosystem blueprint for secure digital transformation Select a best-of-breed platform over best-of-breed point products
Endpoint Protection and Management
Branch Router / SD-WAN
Cloud ProvidersIdentity Management API
API
API
API
API
Security Operations
Workforce Customers
Data Center
OTIoT
Factory
ZERO TRUST
EXCHANGE

14 ©2021 Zscaler, Inc. All rights reserved. SECURING YOUR DIGITAL TRANSFORMATION
Driving Value
Through Lifecycle
Engagement With
Customers
Enabling Digital Transformation Requires a Unique Sales Process
Identify pain points (Transformation Team -ex CXOs)
Architectural Demonstration (Solution Architects)
ROI Demonstration (Business Value Analysts)
Deployment Success(Services Engagement)
Quarterly Business Reviews
(Customer Success Managers)
Top-of-the-funnel initiatives (CXO Events)
Lead Gen (SI/SP/VARs)
Executive Briefings (Roadmap & Architecture
Workshops)
Customer
Focus:
NPS 76vs. 30 SaaS
Average

15 ©2021 Zscaler, Inc. All rights reserved. SECURING YOUR DIGITAL TRANSFORMATION
Exploring Opportunities in Commercial: via Distribution/MSP models, which are zero to low touch
• Partners asking for our help to service this market
Expanding To Enterprise SegmentNew Investment:
• Specific marketing program dollars towards
<6k employee companies.
• Specific Strategy & Enablement programs/playbooks
for this segment
Attractive Market Segment:
• Expands TAM significantly
• Shorter sales cycle
• Leverage: Channel plays a bigger role in the segment
Winning with Majors & Large Enterprises
Scaling with Majors & Large Enterprises, While Expanding To Smaller Enterprises
Commercial
<2k employeesTAM: 9.8M orgs with 267M employees
Low-touch
Inside sales
+ VAR driven
Majors
40k+ employees
TAM: 1.1k orgs with 171M employees
Large Enterprise
6k-40k employees
TAM: 6.2k orgs with 110M employees
High-touch
Zscaler sales led,
SP/SI supported
Enterprise
2k-6k employeesTAM: 12.6k orgs with 54M employees
Medium-touch
Jointly led: Zscaler
sales and SP/SI/VAR
Targeted account-based sale with
focus on enterprises
Total Addressable Market (TAM) for Majors, Large enterprise, Enterprise and Commercial segments are based on data from ZoomInfo for total Global Parent Companies and their Total Employees, rounded to nearest digit, as of December 23, 2020.

16 ©2021 Zscaler, Inc. All rights reserved. SECURING YOUR DIGITAL TRANSFORMATION
Our Audacious Goal: Securing the Next…
New CustomersNew relationships
in existing verticals
Upsell Increase penetration with
existing customers
Customers
Expanded FunctionalityDrive leadership in the space and
improve core offering
Technology InnovationNew platform solutions
to secure any connectivity:
Users, Devices & Workloads
Platform
New GeographiesGrowing presence in
Japan and LatAm
New Markets
New SegmentsExpand to smaller
enterprises and Federal vertical
100M Workloads200M Users +

17 ©2021 Zscaler, Inc. All rights reserved. SECURING YOUR DIGITAL TRANSFORMATION
Secular Tailwinds Fueling Progress Towards Our Audacious Goal
Work from Anywhere
IaaS/ Public Cloud(Azure / AWS)
Direct-to-Cloud Network Transformation
Internet / SaaSOffice 365
IoT/OT
5G
Secure & fast access
Enabling safe edge computing
Secure cloud workload, app-to-app communication
Bring zero-trust to IoT/OT
Fast and secure access to applications
Secures local breakouts that SD-WAN provides

18 ©2021 Zscaler, Inc. All rights reserved. SECURING YOUR DIGITAL TRANSFORMATION
Customer Phased Journey to Zero-Trust
Direct-to-Internet for
Work-From-Anywhere
Network security → user
and data protection
Accelerating M&A
Integration
Empower & secure
workforce
ZIA, ZPA and ZDX
Phase 1 Phase 2
Protect data
in the cloud
Accelerating Cloud Migration
Direct Access to Multi-Clouds
Eliminating Attack-Surface
ZCP
Phase 3
Enable supply chainSecure supplier and B2B
customers’ access
B2B Digital Services
Exchange
Secure third-party access
to private applications
ZPA and ZB2B
Phase 4
Secure IOT and OT
Machine-to-Machine use case
Edge Computing/5G
Standardize security
architecture across the
company
ZCP and future products
Enabling Zero-Trust Architecture and Cloud-based Business Agility for Digital Transformation

19 ©2021 Zscaler, Inc. All rights reserved. SECURING YOUR DIGITAL TRANSFORMATION
• Market moving to Zero-Trust with Digital Transformation
• Trusted partner to CXOs of largest global organizations
• Strategic position - handling & securing enterprise-wide traffic
• Multi-tenant cloud scalability and Cloud effect
• GTM that can consistently sell value and drive larger deals
• Experienced team driving culture of excellence
• Strong balance sheet and attractive unit economics
Why We Will Win
Well Positioned for Success!
Financial Overview
Remo Canessa - Chief Financial Officer

21 ©2021 Zscaler, Inc. All rights reserved. SECURING YOUR DIGITAL TRANSFORMATION
Leading the World of Zero Trust Cloud Security
1) Total number of public data centers, transactions per day, policy and incident prevention per day and support ticket per billion transactions as of December 2020.
2) Billings growth year-over-year, revenue growth year-over-year, dollar-based net retention rate (NRR) and non-GAAP operating margin for Q2’21. Total customers and Forbes Global 2000 customers as of January 31, 2021.
3) Licensed user seats and Net Promoter Score as of FY’20 ending.
>20 millionLicensed seats (3)
>5,000Customers (2)
76 NPS vs. 30 SaaS
Company avg (3)
>500G2K customers (2)
Driving customer value...
>150 Data centers
globally
150BTransactions per day
>10x Google
at an unparalleled scale(1) …
2.7 Support tickets per
billion transactions
7 BillionSecurity incidents &
policy violations
prevented per day
127%Dollar-based
NRR
71%Billings growth
YoY
9%Operating
margin
55% Revenue growth
YoY
while delivering growth(2)
$$$
22 ©2021 Zscaler, Inc. All rights reserved. SECURING YOUR DIGITAL TRANSFORMATION
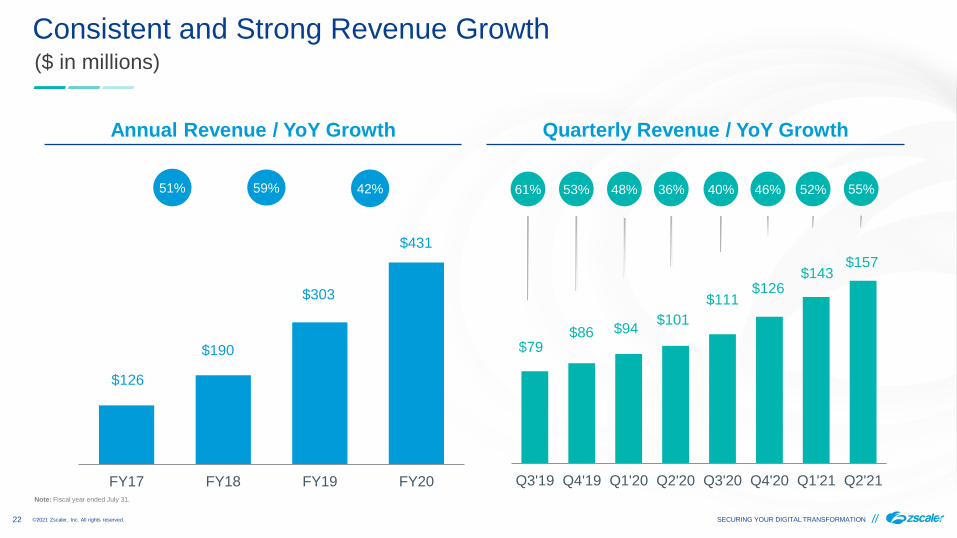
Consistent and Strong Revenue Growth($ in millions)
22
$126
$190
$303
$431
FY17 FY18 FY19 FY20
$79 $86 $94
$101
$111 $126
$143 $157
Q3'19 Q4'19 Q1'20 Q2'20 Q3'20 Q4'20 Q1'21 Q2'21
40%53% 48% 36%51% 59% 61% 46% 52%
Note: Fiscal year ended July 31.
Annual Revenue / YoY Growth Quarterly Revenue / YoY Growth
55%42%

23 ©2021 Zscaler, Inc. All rights reserved. SECURING YOUR DIGITAL TRANSFORMATION
Strong YoY Growth in Calculated Billings ($ in millions)
23
$156
$258
$390
$550
FY17 FY18 FY19 FY20
Annual Billings / Growth
65% 51%
$85
$126
$88
$135 $131
$195
$145
$232
Q3'19 Q4'19 Q1'20 Q2'20 Q3'20 Q4'20 Q1'21 Q2'21
Quarterly Billings / YoY Growth
18%*55%41%
32% 37% 55% 55% 71%64%
Note: Fiscal year ended July 31.
* Comparative prior year fiscal quarter (Q2 FY19) includes one large customer choosing to pay up-front for a multi-year, private cloud subscription of $11.0 million.

24 ©2021 Zscaler, Inc. All rights reserved. SECURING YOUR DIGITAL TRANSFORMATION
Annual Pricing Model Provides Significant Expansion Opportunities
Business Bundle: ~1.5x
Transformation Bundle: ~3x
$45 +$30 +$45 +$25
Pro Bundle: 1x
CSPM Workload SegmentationWorkload
Communication+$60 +$55$40
User
Protection
$145
per user(1)
$155per
workload(4)
ZIA(2) ZIA Add-ons ZPA ZDX(3)
Workload
Protection
1) Per user pricing for individual products is effective annual prices to Zscaler for customers of 5,000 seats (also referred to as ARPU, or average revenue per user), except for new products including API CASB, Browser Isolation and ZDX, where we calculate
ARPU based on closed deals with high volume purchases.
2) ZIA Professional Bundle includes Secure Web Gateway. Business Bundle includes all Professional Bundle functionality, plus SSL inspection, Advanced Threat Protection, inline Cloud Application Control, Bandwidth Control, and more.
Transformation Bundle includes all Business Bundle functionality, plus Cloud Sandbox and Cloud Firewall.
3) ZIA Add-ons include Data Loss Prevention, Exact Data Match, API CASB and Browser Isolation.
4) Per workload pricing applies to Zscaler Cloud Protection (ZCP) products, including CSPM, Workload Segmentation and Workload Communication.
As ZCP products have been available for a short period of time, pricing per workload is effective annual prices to Zscaler in closed deals with high volume purchases, as well as Zscaler’s estimate for current deals in progress.

25 ©2021 Zscaler, Inc. All rights reserved. SECURING YOUR DIGITAL TRANSFORMATION
Serviceable Users of 335M
335M Serviceable
Users(1)
(current target market of ~20k
organizations with 2k+ employees)
267M Incremental Users(1)
(Commercial <2k employees)
>600M Potential B2B Users(2)
(3rd party vendors and customers of customers)
Users
150M Serviceable
Workloads(3)
(current target of workloads
at top public clouds)
338M Incremental
Workloads(3)
Workloads & OT/IOT Devices
Billions of OT/IoT
1) Based on Zscaler’s analysis of worldwide organization and employee data from ZoomInfo.
2) Zscaler’s estimate of potential B2B Users is based on assuming a similar number of users as total worldwide workforce. We consider B2B users to include third-party vendors and customers of our customer.
and Serviceable Workloads of 150M
3) Based on Zscaler’s analysis of workload market forecast for 2020 from 650 Research.
26 ©2021 Zscaler, Inc. All rights reserved. SECURING YOUR DIGITAL TRANSFORMATION
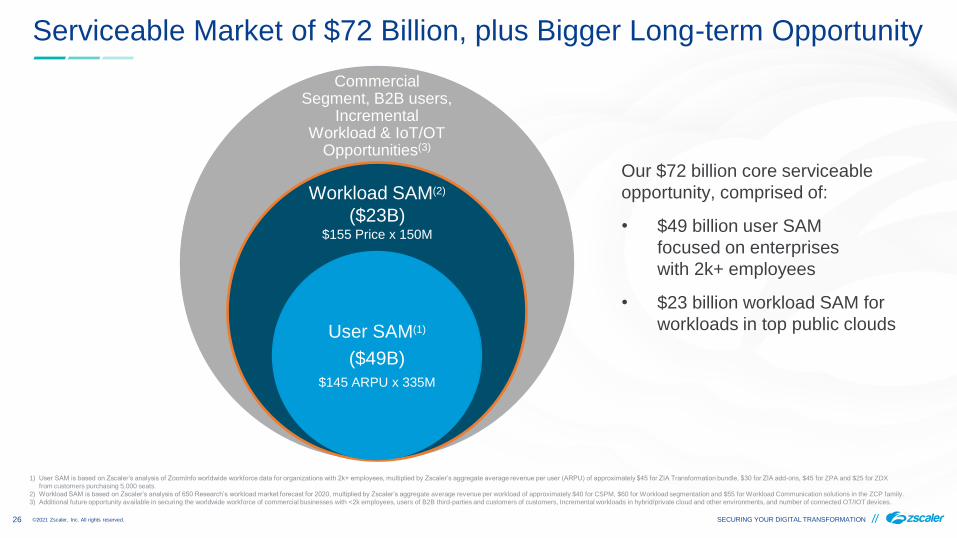
Serviceable Market of $72 Billion, plus Bigger Long-term Opportunity
Commercial Segment, B2B users,
Incremental Workload & IoT/OT
Opportunities(3)
User SAM(1)
($49B)
$145 ARPU x 335M
Our $72 billion core serviceable
opportunity, comprised of:
• $49 billion user SAM
focused on enterprises
with 2k+ employees
• $23 billion workload SAM for
workloads in top public clouds
1) User SAM is based on Zscaler’s analysis of ZoomInfo worldwide workforce data for organizations with 2k+ employees, multiplied by Zscaler’s aggregate average revenue per user (ARPU) of approximately $45 for ZIA Transformation bundle, $30 for ZIA add-ons, $45 for ZPA and $25 for ZDX
from customers purchasing 5,000 seats.
2) Workload SAM is based on Zscaler’s analysis of 650 Research’s workload market forecast for 2020, multiplied by Zscaler’s aggregate average revenue per workload of approximately $40 for CSPM, $60 for Workload segmentation and $55 for Workload Communication solutions in the ZCP family.
3) Additional future opportunity available in securing the worldwide workforce of commercial businesses with <2k employees, users of B2B third-parties and customers of customers, Incremental workloads in hybrid/private cloud and other environments, and number of connected OT/IOT devices.
Workload SAM(2)
($23B)$155 Price x 150M

27 ©2021 Zscaler, Inc. All rights reserved. SECURING YOUR DIGITAL TRANSFORMATION
>6xUpsell Opportunityon ZIA and ZPA alone
with existing customers*
*Upsell opportunity analysis based on Annual Recurring Revenue (ARR) of customers with 100 ZIA seats or more, as of Q1’21 ending October 31, 2020; this process eliminates paid trials and other smaller
deployments, which if included would increase upsell potential further. Our analysis also excludes OEM agreements and end customers with deals primarily based on traffic/usage. Including all adjustments as noted,
Adjusted ARR represents over 95% of Total ARR.
We calculate total Upsell Opportunity as total incremental ARR from selling additional seats to cover total employees and additional ZIA and ZPA product functionality at their existing subscription prices, and then
applying an incremental discount of 35% on the upsell. Our analysis excludes newly introduced products, including ZB2B, API CASB, Browser Isolation, ZDX and ZCP.
We determine Incremental ARR by calculating the potential value of: 1) additional ZIA seat subscriptions for customers that have purchased ZIA for none or for a subset of total employees, assuming purchase of
equivalent product functionality/bundles as existing ZIA subscription, or ZIA Transformation Bundle where no prior ZIA subscription was purchased, for remaining employees, 2) additional product functionality in high-
end Transformation Bundle, where customers purchased Professional or Business Bundles, 3) add-on subscriptions for Data Protection products, including DLP and Exact Data Match, and 4) additional ZPA seat
subscription for customers that have purchased ZPA for none or for a subset of total employees, assuming purchase of equivalent product functionality/bundles as existing ZPA subscription, or ZPA Business Suite
where no prior ZPA subscription was purchased, for remaining employees.
Total employee count for existing customers is Zscaler internal data based on various sources including customer-supplied information, public filings with SEC, Hoover’s, Dun & Bradstreet, Discover.org and ZoomInfo.
1x
>6x
+ZIA users
+High-end Bundle
+Data Protection
+ZPA for all users
Adjusted Current ARR*, asof 10/31/20
Incremental ARR from allemployees adopting ZIA
Incremental ARR from allemployees upgrading to
the Transformation Bundle
Incremental ARR from allemployees purchasing
Data Protection
Incremental ARR from allemployees adopting ZPA
Business Suite
Potential ARR with existingcustomers

28 ©2021 Zscaler, Inc. All rights reserved. SECURING YOUR DIGITAL TRANSFORMATION
Significant International Revenue
Historically, approximately 50% of our
revenue has come from outside Americas
28
Revenue by geographyEarly big wins in Europe
Continued investment after early success with G2000
customers including Siemens and Schneider Electric
Early investment in international sales
Replicated size of U.S. sales team internationally
Global SP partners
Focused on partnering with global service providers
including BT, OBS, others to efficiently expand our reach
Asia Pacific11%
Americas51%
Europe, Middle East and Africa
38%
Based on Q2’21 revenue

29 ©2021 Zscaler, Inc. All rights reserved. SECURING YOUR DIGITAL TRANSFORMATION
Attractive Cloud Gross Margins
29
Note: Financials presented are non-GAAP; refer to the non-GAAP to GAAP reconciliation in Appendix.
1) Non-GAAP gross margin is defined as GAAP gross margin, excluding stock-based compensation expense and related payroll taxes and amortization expense of acquired intangible assets.
78%
80% 81%
80%
FY17 FY18 FY19 FY20
Non-GAAP gross margin(1)
Purpose-built, multi-tenant architecture
Each subsystem optimized for high throughput,
reducing the number of servers needed
Cloud operations
Highly automated, which requires lower head
count to operate the cloud
Peering with content and service
providers at internet exchanges
Reduces bandwidth cost

30 ©2021 Zscaler, Inc. All rights reserved. SECURING YOUR DIGITAL TRANSFORMATION
Investing for Growth to Capture Large Opportunity
Key factors
Non-GAAP expenses (1) as % of revenue
Building sales team to drive
growth and penetrationRamping marketing efforts to
build brand and create demand
Investing in R&D to
enhance functionality 1) Non-GAAP expenses exclude stock-based compensation expenses and related payroll taxes, amortization expense of acquired intangible assets,
asset impairment related to facility exits, amortization of debt discount and issuance costs and certain litigation-related expenses. Refer to the GAAP to
non-GAAP reconciliation in Appendix A.
100%
11% 11% 9% 8%
22% 19%15% 15%
61%59%
46% 48%
22%20%
18% 20%
115%108%
89% 91%
FY17 FY18 FY19 FY20
Scale of our multi-tenant cloud benefits COGS
COGS
Accelerated investments for long-term leverage
Sales & Marketing
Global centers in Silicon Valley & India
R&D
Significant presence in IndiaG&A

Appendix

32 ©2021 Zscaler, Inc. All rights reserved. SECURING YOUR DIGITAL TRANSFORMATION
Explanation of Non-GAAP Financial Measures
In addition to our results determined in accordance with generally accepted accounting principles in the United States of America (“GAAP”), we believe that the presentation of non-
GAAP financial information provides important supplemental information to management and investors regarding financial and business trends relating to our financial condition and
results of operations. However, non-GAAP financial information is presented for supplemental informational purposes only and should not be considered in isolation or as a
substitute for financial information presented in accordance with GAAP. Investors are cautioned that there are a number of limitations associated with the use of non-GAAP financial
measures and key metrics as analytical tools. Investors are encouraged to review these reconciliations, and not to rely on any single financial measure to evaluate our business.
Expenses Excluded from Non-GAAP Measures
Stock-based compensation expense is excluded primarily because they are non-cash expenses that management believes are not reflective of our ongoing operational
performance. Effective August 1, 2020, the beginning of our fiscal year ending July 31, 2021, we have presented employer payroll taxes related to employee equity award
transactions, which is a cash expense, as part of stock-based compensation expense in our non-GAAP results. These payroll taxes have been excluded from our non-GAAP results
as these are tied to the timing and size of the exercise or vesting of the underlying equity awards and the price of our common stock at the time of vesting or exercise, which may
vary from period to period independent of the operating performance of our business. Prior period amounts have been recasted to conform to this presentation. Amortization
expense of acquired intangible assets is excluded because these are considered by management to be outside of our core business operating performance. Asset impairments
related to facility exit costs are excluded because such charges are not reflective of our ongoing operational performance. Amortization of debt discount and issuance costs from the
convertible senior notes is excluded because they are non-cash expenses and are not reflective of our ongoing operational performance. We also exclude certain litigation-related
expenses consisting of professional fees and related costs incurred by us in defending against significant claims that we deem not to be in the ordinary course of our business and,
if applicable, actual losses and accruals related to estimated losses in connection with these claims. There are many uncertainties and potential outcomes associated with any
litigation, including the expense of litigation, timing of such expenses, court rulings, unforeseen developments, complications and delays, each of which may affect our results of
operations from period to period, as well as the unknown magnitude of the potential loss relating to any lawsuit, all of which are inherently subject to change, difficult to predict and
could adversely affect our results of operations. We estimate the tax effect of these items on our non-GAAP results and may adjust our GAAP provision for income taxes, if such
effects have a material impact to our non-GAAP results.
Key Non-GAAP Financial Measures Included within this Presentation:
• Non-GAAP Gross Profit and Non-GAAP Gross Margin (*)
• Non-GAAP Income from Operations and Non-GAAP Operating Margin (*)
• Free Cash Flow and Free Cash Flow Margin (*)
(*) Non-GAAP to GAAP reconciliations shown on the following slides.

33 ©2021 Zscaler, Inc. All rights reserved. SECURING YOUR DIGITAL TRANSFORMATION
Appendix A: Non-GAAP to GAAP reconciliation($ in thousands)
FY'20 YTD FY'21
Non-GAAP
Stock-based comp. expense & payroll taxes
Amortization of acquired intangible
assetsLitigation-related
expenses
Asset Impairment related to facility
exit
Amortization of debt discount and
issuance costs
Income tax expense effects GAAP Non-GAAP
Stock-based comp. expense & payroll taxes
Amortization of acquired intangible
assetsLitigation-related
expenses
Asset impairment related to facility
exit
Amortizationof debt
discount and issuance
costs GAAP
Revenue $ 431,269 $ 431,269 $ 299,622 $ 299,622
YOY Growth 42% 42 % 54% 54 %
Cost of revenue 85,852 7,851 2,030 95,733 56,281 6,574 3,007 65,862
Gross Profit 345,417 (7,851) (2,030) 355,536 243,341 (6,574) (3,007) 233,760
Gross Margin 80% 78 % 81% 78 %
Sales and marketing
206,439 71,468 74 277,981 140,628 66,518 146 207,292
% of revenue 48% 64 % 47% 69 %
Research and development
64,662 31,937 1,280 97,879 44,874 32,647 — 77,521
% of revenue 15% 23 % 15% 26 %
General and administrative
36,150 18,380 18,356 746 73,632 23,393 21,703 — 416 45,512
% of revenue 8% 17 % 8% 15 %
Total operating expenses
307,251 121,785 1,354 18,356 746 449,492 208,895 120,868 146 — 416 330,325
% of revenue 71% 104 % 70% 110 %
Income (loss) from operations
38,166 (129,636) (3,384) (18,356) (746) (113,956) 34,446 (127,442) (3,153) — (416) (96,565)
Operating margin
9% (26)% 11% (32)%
Interest income 6,477 6,477 1,695 1,695
Interest expense
(140) (4,885) (5,025) (722) (25,572) (26,294)
Other income (expense), net
(224) (224) 786 786
Provision for income taxes
(3,498) 1,110 (2,388) (2,169) (2,169)
Net income (loss)
40,781 $ (129,636) $ (3,384) $ (18,356) $ (746) $ (4,885) $ 1,110 $ (115,116) $ 34,036 $ (127,442) $ (3,153) $ — $ (416) $ (25,572) $ (122,547)

34 ©2021 Zscaler, Inc. All rights reserved. SECURING YOUR DIGITAL TRANSFORMATION
Appendix A: Non-GAAP to GAAP reconciliation($ in thousands)
FY'20 YTD FY'21
Free cash flow $ 27,508 $ 60,261
Revenue 431,269 299,622
Free cash flow margin 6% 20%
Net cash provided by operating activities $ 79,317 $ 83,936
Less: Purchases of property, equipment and other assets (43,072) (19,403)
Less: Capitalized internal-use software (8,737) (4,272)
Free cash flow $ 27,508 $ 60,261
Net cash provided by operating activities, as a percentage of revenue 18 % 28 %
Less: Purchases of property, equipment and other assets, as a percentage of revenue (10)% (7)%
Less: Capitalized internal-use software, as a percentage of revenue (2)% (1)%
Free cash flow margin 6 % 20 %