securities and exchange...
TRANSCRIPT
UNITED STATESSECURITIES AND EXCHANGE COMMISSION
Washington, D.C. 20549____________________________________________________________________________
FORM 10-K(Mark One)
x ANNUAL REPORT PURSUANT TO SECTION 13 OR 15(d) OF THE SECURITIES EXCHANGE ACT OF 1934
For the fiscal year ended January 28, 2017
OR
o TRANSITION REPORT PURSUANT TO SECTION 13 OR 15(d) OF THE SECURITIES EXCHANGE ACT OF 1934
For the transition period from to Commission file number 1-9595
________________________________
BEST BUY CO., INC.(Exact name of registrant as specified in its charter)
Minnesota 41-0907483State or other jurisdiction ofincorporation or organization
(I.R.S. EmployerIdentification No.)
7601 Penn Avenue SouthRichfield, Minnesota
55423(Zip Code)
(Address of principal executive offices) Registrant's telephone number, including area code 612-291-1000
Securities registered pursuant to Section 12(b) of the Act:
Title of each class Name of each exchange on which registered
Common Stock, par value $.10 per share New York Stock ExchangeSecurities registered pursuant to Section 12(g) of the Act: None
____________________________________________________________________________Indicate by check mark if the registrant is a well-known seasoned issuer, as defined in Rule 405 of the Securities Act. xYes oNoIndicate by check mark if the registrant is not required to file reports pursuant to Section 13 or Section 15(d) of the Act. oYes xNoIndicate by check mark whether the registrant (1) has filed all reports required to be filed by Section 13 or 15(d) of the Securities Exchange Act of 1934 during the preceding12 months (or for such shorter period that the registrant was required to file such reports), and (2) has been subject to such filing requirements for the past 90 days. xYes oNoIndicate by check mark whether the registrant has submitted electronically and posted on its corporate website, if any, every Interactive Data File required to be submitted andposted pursuant to Rule 405 of Regulation S-T (§ 232.405 of this chapter) during the preceding 12 months (or for such shorter period that the registrant was required to submitand post such files). xYes oNoIndicate by check mark if disclosure of delinquent filers pursuant to Item 405 of Regulation S-K (§ 229.405 of this chapter) is not contained herein, and will not be contained, tothe best of registrant's knowledge, in definitive proxy or information statements incorporated by reference in Part III of this Form 10-K or any amendment to this Form 10-K. xIndicate by check mark whether the registrant is a large accelerated filer, an accelerated filer, a non-accelerated filer, or a smaller reporting company. See the definitions of"large accelerated filer," "accelerated filer" and "smaller reporting company" in Rule 12b-2 of the Exchange Act. (Check one):
Large accelerated filer x Accelerated filer o Non-accelerated filer o Smaller reporting company o
Indicate by check mark whether the registrant is a shell company (as defined in Rule 12b-2 of the Act) oYes xNoThe aggregate market value of the voting and non-voting common equity held by non-affiliates of the registrant as of July 29, 2016 , was approximately $7.8 billion , computedby reference to the price of $33.60 per share, the price at which the common equity was last sold on July 29, 2016 , as reported on the New York Stock Exchange-CompositeIndex. (For purposes of this calculation all of the registrant's directors and executive officers are deemed affiliates of the registrant.)As of March 20, 2017 , the registrant had 309,110,840 shares of its Common Stock issued and outstanding.
Table of Contents
DOCUMENTS INCORPORATED BY REFERENCE
Portions of the registrant's definitive Proxy Statement relating to its 2017 Regular Meeting of Shareholders ("Proxy Statement") are incorporated by reference intoPart III. The Proxy Statement will be filed with the U.S. Securities and Exchange Commission within 120 days after the end of the fiscal year to which this reportrelates.
CAUTIONARY STATEMENT PURSUANT TO THEPRIVATE SECURITIES LITIGATION REFORM ACT OF 1995
Section 27A of the Securities Act of 1933, as amended ("Securities Act"), and Section 21E of the Securities Exchange Act of 1934, as amended ("Exchange Act"),provide a "safe harbor" for forward-looking statements to encourage companies to provide prospective information about their companies. With the exception ofhistorical information, the matters discussed in this Annual Report on Form 10-K are forward-looking statements and may be identified by the use of words such as"anticipate," "assume," "believe," "estimate," "expect," "intend," "foresee," "outlook," "plan," "project," and other words and terms of similar meaning. Suchstatements reflect our current view with respect to future events and are subject to certain risks, uncertainties and assumptions. A variety of factors could cause ourfuture results to differ materially from the anticipated results expressed in such forward-looking statements. Readers should review Item 1A, Risk Factors, of thisAnnual Report on Form 10-K for a description of important factors that could cause our future results to differ materially from those contemplated by the forward-looking statements made in this Annual Report on Form 10-K. Our forward-looking statements speak only as of the date of this report or as of the date they aremade, and we undertake no obligation to update our forward-looking statements.

BEST BUY FISCAL 2017 FORM 10-K
TABLE OF CONTENTS
PART I 4Item 1. Business. 4Item 1A. Risk Factors. 7Item 1B. Unresolved Staff Comments. 16Item 2. Properties. 17Item 3. Legal Proceedings. 19Item 4. Mine Safety Disclosures. 19 Executive Officers 20 PART II 22Item 5. Market for Registrant's Common Equity, Related Stockholder Matters and Issuer Purchases of Equity Securities. 22Item 6. Selected Financial Data. 24Item 7. Management's Discussion and Analysis of Financial Condition and Results of Operations. 25Item 7A. Quantitative and Qualitative Disclosures About Market Risk. 49Item 8. Financial Statements and Supplementary Data. 50Item 9. Changes in and Disagreements With Accountants on Accounting and Financial Disclosure. 91Item 9A. Controls and Procedures. 91Item 9B. Other Information. 91 PART III 92Item 10. Directors, Executive Officers and Corporate Governance. 92Item 11. Executive Compensation. 92Item 12. Security Ownership of Certain Beneficial Owners and Management and Related Stockholder Matters. 93Item 13. Certain Relationships and Related Transactions, and Director Independence. 93Item 14. Principal Accounting Fees and Services. 93 PART IV 94Item 15. Exhibits, Financial Statement Schedules. 94Item 16. Form 10-K Summary 96 Signatures 96 Schedule II 98

Table of Contents
PART I
Item 1. Business.
Unless the context otherwise requires, the use of the terms "we," "us" and "our" in this Annual Report on Form 10-K refers to Best Buy Co., Inc. and, as applicable,its consolidated subsidiaries. Any references to our website addresses do not constitute incorporation by reference of the information contained on the websites.
Description of Business
We were incorporated in the state of Minnesota in 1966. Today, we are a leading provider of technology products, services and solutions. We offer these productsand services to customers who visit our stores, engage with Geek Squad agents or use our websites or mobile applications. We have operations in the U.S., Canadaand Mexico.
Information About Our Segments and Geographic Areas
We have two reportable segments: Domestic and International. The Domestic segment is comprised of the operations in all states, districts and territories of theU.S., under various brand names including Best Buy, bestbuy.com, Best Buy Mobile, Best Buy Direct, Best Buy Express, Geek Squad, Magnolia Home Theaterand Pacific Kitchen and Home.
The International segment is comprised of all operations in Canada and Mexico under the brand names Best Buy, bestbuy.com.ca, bestbuy.com.mx, Best BuyExpress, Best Buy Mobile and Geek Squad.
In March 2015, we decided to consolidate Future Shop and Best Buy stores and websites in Canada under the Best Buy brand. This resulted in permanently closing66 Future Shop stores and converting 65 Future Shop stores to the Best Buy brand. Additional information on these changes is included in Item 7, Management'sDiscussion and Analysis of Financial Condition and Results of Operations , and Note 4, Restructuring Charges , of the Notes to Consolidated FinancialStatements, included in Item 8, Financial Statements and Supplementary Data , of this Annual Report on Form 10-K.
Financial information about our segments and geographic areas is included in Item 7, Management's Discussion and Analysis of Financial Condition and Resultsof Operations , and Note 11, Segment and Geographic Information , of the Notes to Consolidated Financial Statements, included in Item 8, Financial Statementsand Supplementary Data , of this Annual Report on Form 10-K.
Operations
Our Domestic and International segments are managed by leadership teams responsible for all areas of the business. Both segments operate an omni-channelplatform that provides customers the ability to shop when and where they want.
Domestic Segment
Development of merchandise and services offerings, pricing and promotions, procurement and supply chain, online and mobile application operations, marketingand advertising and labor deployment across all channels are centrally managed at our corporate headquarters. In addition, support capabilities (for example,human resources, finance and real estate management) are generally performed at our corporate headquarters. We also have field operations that support retailteams from our corporate headquarters and regional locations. Our retail stores have procedures for inventory management, asset protection, transactionprocessing, customer relations, store administration, product sales and services, staff training and merchandise display that are largely standardized within eachstore brand. All stores within each store brand generally operate under standard procedures with a degree of flexibility for store management to address certainlocal market characteristics.
International Segment
Our Canada and Mexico store operations are similar to those in our Domestic segment.
Merchandise and Services
Our Domestic and International segments have offerings in six revenue categories: Consumer Electronics, Computing and Mobile Phones, Entertainment,Appliances, Services and Other. The key components of each revenue category are as follows:
4

Table of Contents
• Consumer Electronics - home theater, home automation, digital imaging, health and fitness and portable audio;• Computing and Mobile Phones - computing and peripherals, networking, tablets, mobile phones (including related mobile network carrier
commissions), wearables (including smart watches) and e-readers;• Entertainment - gaming hardware and software, movies, music, technology toys and other software;• Appliances - major appliances (for example, refrigeration, dishwashers, ovens, laundry, etc.) and small appliances (for example, coffee makers, blenders,
etc.);• Services - consultation, design, delivery, installation, set-up, protection plans, repair, technical support and educational classes; and• Other - snacks, beverages and other sundry items.
Distribution
Domestic Segment
U.S. Best Buy online merchandise sales are typically either picked up at U.S. Best Buy stores or delivered directly to customers from a distribution center or retailstore. The ship-from-store capability allows us to improve product availability and delivery times for customers. Most merchandise is shipped directly frommanufacturers to our distribution centers located throughout the U.S. In order to meet release dates for certain products, merchandise may be shipped directly toour stores from suppliers.
International Segment
Our Canada and Mexico distribution model is similar to our Domestic segment model.
Suppliers and Inventory
Our Domestic and International segments purchase merchandise from a variety of suppliers. In fiscal 2017, our 20 largest suppliers accounted for approximately77% of the merchandise we purchased, with five suppliers – Apple, Samsung, Sony, Hewlett-Packard, and LG Electronics – representing approximately 53% oftotal merchandise purchased. We generally do not have long-term written contracts with our vendors that would require them to continue supplying us withmerchandise or secure any of the key terms of our arrangements.
We carefully monitor and manage our inventory levels in an effort to match quantities on hand with consumer demand as closely as possible. Key elements to ourinventory management process include the following: continuous monitoring of historical and projected consumer demand, continuous monitoring and adjustmentof inventory receipt levels, agreements with vendors relating to reimbursement for the cost of markdowns or sales incentives and agreements with vendors relatingto return privileges for certain products.
We also have a global sourcing operation to design, develop, test and contract-manufacture our exclusive brand products.
Store Development
We had approximately 1,200 large-format and 400 small-format stores at the end of fiscal 2017 throughout our Domestic and International segments. Our storesare a vital component of our omni-channel strategy and represent an important competitive advantage. In the U.S., we have the ability to ship from all of our BestBuy stores. Customers may also elect to pick up orders initiated online in any of our stores. In recent years, we have opened vendor store-within-a-store concepts toallow closer vendor partnership and a better quality customer experience. In fiscal 2018 and beyond, we will continue to look for opportunities to optimize ourstore space, renegotiating leases and selectively opening or closing locations to support our operations.
In March 2015, we made a decision to consolidate Future Shop and Best Buy stores and websites in Canada under the Best Buy brand. This resulted inpermanently closing 66 Future Shop stores and converting 65 Future Shop stores to the Best Buy brand.
Refer to Item 7, Management's Discussion and Analysis of Financial Condition and Results of Operations, for tables reconciling our Domestic and Internationalsegment stores open at the end of each of the last three fiscal years.
5

Table of Contents
Intellectual Property
We own or have the right to use valuable intellectual property such as trademarks, service marks and tradenames, including, but not limited to, Best Buy, Best BuyMobile, Dynex, Geek Squad, Insignia, Magnolia, Modal, My Best Buy, Pacific Sales, Rocketfish , Platinum and our Yellow Tag logo.
We have secured domestic and international trademark and service mark registrations for many of our brands. We have also secured patents for many of ourinventions. We believe our intellectual property has significant value and is an important factor in the marketing of our company, our stores, our products and ourwebsites.
Seasonality
Our business, like that of many retailers, is seasonal. A higher proportion of our revenue and earnings is generated in the fiscal fourth quarter, which includes themajority of the holiday shopping season in the U.S., Canada and Mexico.
Working Capital
We fund our business operations through a combination of available cash and cash equivalents, short-term investments and cash flows generated from operations.In addition, our revolving credit facilities are available for additional working capital needs, for general corporate purposes and investment and growthopportunities. Our working capital needs typically increase in the months leading up to the holiday shopping season as we purchase inventory in advance ofexpected sales.
Competition
Our competitors are primarily multi-channel retailers, internet-based businesses, technology service providers, traditional store-based retailers and vendors andmobile network carriers, who offer their products and services directly to customers. We believe our ability to deliver a high quality customer experience offers usa key competitive advantage. Some of our competitors have low cost operating structures and seek to compete for sales primarily on price. In addition, in the U.S.,online-only operators are exempt from collecting sales taxes in certain states. We believe this advantage will continue to be eroded as sales tax rules are re-evaluated at both the state and federal levels. We carefully monitor pricing offered by other retailers, and maintaining price competitiveness is one of our ongoingpriorities. In addition, we have a price-matching policy in the U.S. that allows customers to request that we match a price offered by certain retail store and onlineoperators. In order to allow this, we are focused on maintaining efficient operations and leveraging the economies of scale available to us through our globalvendor partnerships. We believe our dedicated and knowledgeable people, integrated online and retail assets, broad product assortment, strong vendorrelationships, range of focused service and support offerings, distinct store formats, brand marketing strategies and supply chain are important ways in which wemaintain this advantage.
Environmental Matters
Best Buy is committed to positively impacting the environment and our communities. We believe that effectively managing our environmental impacts, settingsustainability goals and advancing energy-efficient consumer solutions create long-term value for all of our stakeholders. We are continuously looking for cost-effective solutions to minimize carbon emissions in our operations. In fiscal year 2016, we set a new goal to reduce our owncarbon emissions by 45 percent by 2020 (over a 2009 baseline), from both operational reductions and renewable sourcing. See our Best Buy Corporate Responsibility & Sustainability Report for further information on environmental performance.
Number of Employees
At the end of fiscal 2017, we employed approximately 125,000 full-time, part-time and seasonal employees in the U.S., Canada, Mexico and our sourcing office inChina. We consider our employee relations to be good. We offer our employees a wide array of company-paid benefits that vary within our company due tocustomary local practices and statutory requirements, which we believe are competitive locally and in the aggregate relative to others in our industry.
6
Table of Contents
Available Information
We are subject to the reporting requirements of the Securities Exchange Act of 1934 (the "Exchange Act") and its rules and regulations. The Exchange Act requiresus to file reports, proxy statements and other information with the U.S. Securities and Exchange Commission ("SEC"). We make available, free of charge on ourwebsite, our Annual Reports on Form 10-K, Quarterly Reports on Form 10-Q, Current Reports on Form 8-K and amendments to these reports filed or furnishedpursuant to Section 13(a) or 15(d) of the Exchange Act, as soon as reasonably practicable after we electronically file these documents with, or furnish them to, theSEC. These documents are posted on our website at www.investors.bestbuy.com . In addition, the public may read and copy any materials we file with the SEC atthe SEC’s Public Reference Room at 100 F Street, NE, Washington, DC 20549. The public may obtain information on the operation of the Public Reference Roomby calling the SEC at 1-800-SEC-0330. The SEC also maintains a website that contains reports, proxy and information statements, and other information regardingissuers, including us, that file electronically with the SEC at www.sec.gov .
We also make available, free of charge on our website, our Amended and Restated Articles of Incorporation, Amended and Restated By-laws, the CorporateGovernance Principles of our Board of Directors ("Board") and our Code of Business Ethics adopted by our Board, as well as the charters of all of our Board'scommittees: Audit Committee; Compensation and Human Resources Committee; Finance and Investment Policy Committee; and Nominating, CorporateGovernance and Public Policy Committee. These documents are posted on our website at www.investors.bestbuy.com .
Copies of any of the above-referenced documents will also be made available, free of charge, upon written request to Best Buy Co., Inc. Investor RelationsDepartment at 7601 Penn Avenue South, Richfield, MN 55423-3645.
Item 1A. Risk Factors.
Described below are certain risks that we believe apply to our business and the industry in which we operate. You should carefully consider each of the followingrisk factors in conjunction with other information provided in this Annual Report on Form 10-K and in our other public disclosures. The risks described belowhighlight potential events, trends or other circumstances that could adversely affect our business, financial condition, results of operations, cash flows, liquidity oraccess to sources of financing and, consequently, the market value of our common stock and debt instruments. These risks could cause our future results to differmaterially from historical results and from guidance we may provide regarding our expectations of future financial performance. The risks described below are notan exhaustive list of all the risks we face. There may be others that we have not identified or that we have deemed to be immaterial. All forward-looking statementsmade by us or on our behalf are qualified by the risks described below.
We face strong competition from multi-channel retailers, e-commerce businesses, technology service providers, traditional store-based retailers andvendors and mobile network carriers that offer their products and services directly to customers, which directly affects our revenue and profitability.
The retail business is highly competitive. Price is of great importance to most customers, and price transparency and comparability continues to increase,particularly as a result of digital technology. The ability of consumers to compare prices on a real-time basis puts additional pressure on us to maintain competitiveprices. We compete with many other local, regional, national and international retailers and technology service providers, as well as certain of our vendors andmobile network carriers that offer products directly to consumers. Some of our competitors have greater financial resources than us and may be able to offer lowerprices than us for a sustained period of time. The retail industry continues to experience a trend towards an increase in sales initiated online and using mobileapplications, and some online-only businesses have lower operating costs than us and are not required to collect and remit sales taxes in all U.S. states, which cannegatively impact the ability of multi-channel retailers to be price competitive on a tax-included basis. Online and multi-channel retailers continue to focus ondelivery services, with customers increasingly seeking faster, guaranteed delivery times and low-price or free shipping. Our ability to be competitive on deliverytimes and delivery costs depends on many factors, and our failure to successfully manage these factors and offer competitive delivery options could negativelyimpact the demand for our products and our profit margins. Because our business strategy is based on offering superior levels of customer service and a full rangeof services to complement the products we offer, our cost structure is higher than some of our competitors, and this, in conjunction with price transparency, putspressure on our margins.
As these and related competitive factors evolve, we may experience material adverse pressure on our revenue and profitability.
Many of the products we sell are highly susceptible to technological advancement, product life cycle fluctuations and changes in consumer preferences.
7

Table of Contents
In general, consumer electronics product life cycles (which begin with initial market launch and conclude with maturity or obsolescence) have become shorter andless predictable. This is largely due to rapid technological advancement and innovation and generally faster adoption by consumers. Consumer preferences havealso become susceptible to rapid change, and this adds to the unpredictability of our business. These factors affect us in a number of ways, for example:
• the emergence of new products and categories (for example, virtual reality);• the rapid maturity and decline of relatively new categories (for example, tablets);• cannibalization of categories (for example, the effect of smart phones on demand for GPS, mobile audio, digital imaging devices, etc.);• intense consumer interest in high-profile product updates (for example, smartphone model updates) which concentrates purchasing activity around new
launch dates and can often lead to shortages of merchandise;• unpredictable consumer adoption rates (for example, contrasting adoption rates of 3D and Ultra-HD televisions);• rapidly declining price-points in many categories (for example, digital imaging, Ultra-HD televisions, etc.); and• availability of content (for example, Ultra-HD programming, online streaming services, sporting events or other broadcast programming).
The effects of these factors can also be exacerbated by the competitive environment and the ease with which customers can research and compare product featuresand price. If we fail to interpret, predict and react to these factors in a timely and effective manner, the consequences can include:
• not offering the products and services that our customers want;• having excess inventory, which may require heavy discounting or liquidation;• not securing adequate access to brands or products for which consumer demand exceeds supply;• delays in adapting our merchandising, marketing or supply chain capabilities to accommodate changes in product trends; and• damage to our brand and reputation.
These and other similar factors could have a material adverse impact on our revenues and profitability.
Our reliance on key vendors and mobile network carriers subjects us to various risks and uncertainties which could affect our revenue and profitability.
We source the products we sell from a wide variety of domestic and international vendors. In fiscal 2017, our 20 largest suppliers accounted for approximately77% of the merchandise we purchased (75% in fiscal 2016), with 5 suppliers – Apple, Samsung, Sony, Hewlett-Packard, and LG Electronics – representingapproximately 53% of total merchandise purchased (51% in fiscal 2016). We generally do not have long-term written contracts with our vendors that would requirethem to continue supplying us with merchandise. Our profitability depends on us securing acceptable terms with our vendors for, among other things, the price ofmerchandise we purchase from them, funding for various forms of promotional programs, payment terms, allocations of merchandise, development of compellingassortments of products, operation of vendor-focused shopping experiences within our stores and terms covering returns and factory warranties. To varyingdegrees, our vendors may be able to leverage their competitive advantages -- for example, their financial strength, the strength of their brand with customers, theirown stores or online channels or their relationships with other retailers -- to our commercial disadvantage. The potential adverse impact of these factors can beamplified by price transparency (which can limit our flexibility to modify selling prices) and a highly competitive retail environment. Generally, our ability tonegotiate favorable terms with our vendors is more difficult with vendors where our purchases represent a smaller proportion of their total revenues, consequentlyimpacting our profitability from such vendor relationships.
We are also dependent on a relatively small number of mobile carriers to allow us to offer mobile devices with carrier connections. The competitive strategiesutilized by mobile network carriers can have a material impact on our business. For example, if carriers change the structure of customer contracts, customerupgrade terms, customer qualification requirements, monthly fee plans, cancellation fees or service levels, the volume of upgrades and new contracts we sign withcustomers may be reduced, adversely affecting our revenues and profitability. In addition, our carriers also may serve customers through their own stores, websites,mobile applications and call centers or through other competing retail channels. Carriers may decide to cease allowing us to offer their contracts or certaincategories of their contracts, focus their marketing efforts on alternative channels or make unfavorable changes to our commissions or other terms. Each of thesefactors could have a materially adverse impact on our revenue and profitability.
We have internal standards that we require all of our vendors to meet. Our ability to find qualified vendors who can supply products in a timely and efficientmanner that meet our standards of quality and safety can be difficult, especially with respect
8

Table of Contents
to goods sourced from outside the U.S. Political or financial instability, merchandise quality issues, product safety concerns, cross-border trade restrictions ortariffs, work stoppages, port delays, foreign currency exchange rate fluctuations, transportation capacity and costs, inflation, civil unrest, natural disasters,outbreaks of pandemics and other factors relating to foreign trade are beyond our control. These and other related issues could materially adversely affect ourfinancial results.
Product safety and quality concerns could have a material adverse impact on our revenue and profitability.
If the products we sell fail to meet applicable safety standards or our customers' expectations regarding safety and quality, we could be exposed to increased legalrisk and our reputation may be damaged. Failure to take appropriate actions in relation to product recalls could lead to breaches in laws and regulations and leaveus susceptible to government enforcement actions or private litigation. Recalls of products, particularly when combined with lack of available alternatives or ourdifficulty in sourcing sufficient volumes of replacement products, could also have a material adverse impact on our revenue and profitability.
Our focus on services as a strategic priority exposes us to certain risks that could have a material adverse impact on our revenue and profitability as wellas our reputation.
We offer a full range of services that complement our product offerings, including consultation, design, delivery, installation, set-up, protection plans, repair,technical support and educational classes. Designing, marketing and executing these services is subject to incremental risks. These risks include, for example:
• increased labor expense to fulfill our customer promises, which may be higher than the related revenue;• unpredictable warranty failure rates and related expenses;• employees in transit using company vehicles to visit customer locations and employees being present in customer homes, which may increase our scope
of liability;• the potential for increased scope of liability relating to managed services offerings;• employees having access to customer devices, including the information held on those devices, which may increase our responsibility for the security of
those devices and the data they hold; and• the engagement of third parties to assist with some aspects of construction and installation and the potential responsibility for the actions they take and for
compliance with building codes and related regulations.
In addition, as customers increasingly migrate to websites and mobile applications to initiate transactions, it is inherently more difficult to demonstrate and explainthe features and benefits of our service offerings, which can lead to a lower revenue mix of these services. If, for these or other reasons, we fail to design andmarket services effectively to our customers or fail to meet our customers’ expectations in the execution of these services, our reputation, revenue and profitabilitycould be adversely affected.
Macroeconomic pressures in the markets in which we operate could adversely affect consumer spending and our financial results.
To varying degrees, our products and services are sensitive to changes in macroeconomic conditions that impact consumer spending. As a result, consumers maybe affected in many different ways, including, for example:
• whether or not they make a purchase;• their choice of brand, model or price-point;• how frequently they upgrade or replace their devices; and• their appetite for complementary services (for example, protection plans).
Consumer confidence, inflation, employment levels, oil prices, interest rates, tax rates, availability of consumer financing, housing market conditions, foreigncurrency exchange rate fluctuations, costs for items such as fuel and food and other macroeconomic trends can adversely affect consumers' demand for theproducts and services that we offer. Our future results could be significantly adversely impacted by these factors.
Interruptions and other factors affecting our supply chain, including in-bound deliveries from our vendors, may adversely affect our business.
Our supply chain is a critical part of our operations, particularly in light of recent industry trends and initiatives such as ship-from-store and the emphasis on fastand free delivery when purchasing online. We depend on our vendors' ability to deliver
9

Table of Contents
products to us at the right location, right time and in the right quantities. We also depend on third parties for the operation of certain aspects of our supply chainnetwork. The factors that can adversely affect these aspects of our operations include:
• interruptions to our delivery capabilities;• failure of third parties to meet our standards or commitments;• disruptions to our systems and implementation of new systems;• limitations in capacity;• consolidation or business failures in the transportation and distribution sectors;• labor strikes or slow-downs impacting ports or any other aspect of our supply chain;• damages or other loss to products; and• costs that are excessive.
The risks associated with our dependence on third parties are greater for small parcel home deliveries, because of the relatively small number of carriers with thescope and capacity required by our business. The continuing growth of e-commerce increases our exposure to these risks. If we fail to manage these riskseffectively, we could experience a material adverse impact on our reputation, revenue and profitability.
If we fail to attract, retain and engage appropriately qualified employees, including employees in key positions, our operations and profitability may beharmed. Changes in market compensation rates may adversely affect our profitability.
Our performance is highly dependent on attracting, retaining and engaging appropriately qualified employees in our stores, service centers, distribution centers,field and corporate offices. Our strategy of offering high quality services and assistance for our customers requires a highly trained and engaged workforce. Theturnover rate in the retail industry is relatively high, and there is an ongoing need to recruit and train new employees. Factors that affect our ability to maintainsufficient numbers of qualified employees include employee morale, our reputation, unemployment rates, competition from other employers, availability ofqualified personnel and our ability to offer appropriate compensation packages. We operate in a competitive labor market and there is a risk that market increasesin compensation could have a material adverse effect on our profitability. Failure to recruit or retain qualified employees in the future may impair our efficiencyand effectiveness and our ability to pursue growth opportunities. In addition, a significant amount of turnover of our executive team or other employees in keypositions with specific knowledge relating to us, our operations and our industry may negatively impact our operations.
Demand for the products and services we sell could decline if we fail to maintain positive brand perception and recognition.
We operate a portfolio of brands with a commitment to customer service and innovation. We believe that recognition and the reputation of our brands are key toour success. The ubiquity of social media means that customer feedback and other information about our company are shared with a broad audience in a mannerthat is easily accessible and rapidly disseminated. Damage to the perception or reputation of our brands could result in, among other things, declines in customerloyalty, decreases in gift card and service plan sales, lower employee retention and productivity and vendor relationship issues, all of which could materially affectour revenue and profitability.
Our success is dependent on the design and execution of appropriate business strategies.
We operate in a highly-competitive and ever-changing commercial environment. Our success is dependent on our ability to identify, develop and executeappropriate strategies within this environment. Strategies that have proved successful in the past may not be successful in the future. Our current strategy includescontinuous improvement of our business and the pursuit of new growth opportunities. It is possible that our strategies may be ineffective and that we may need tomake substantial changes to them in the future. It is also possible that we will be unsuccessful in executing our strategies or that they expose us to additional risks.Our results could be materially adversely affected if we fail to develop and execute appropriate strategies. The market value of our common stock and debtinstruments could be materially adversely affected if investors are uncertain about the appropriateness of our strategies or our ability to execute them.
Refer to Item 7, Management's Discussion and Analysis of Financial Condition and Results of Operations , for further information regarding our strategies.
Failure to effectively manage our real estate portfolio may negatively impact our operating results.
10

Table of Contents
Effective management of our real estate portfolio is critical to our multi-channel strategy. Most of our properties are subject to long-term leases. As such, it isessential that we effectively evaluate a range of factors that may influence the success of our long-term real estate strategy. Such factors include, for example:
• changing patterns of customer consumption and behavior, particularly in light of an evolving omni-channel environment;• the appropriate number of stores in our portfolio;• the formats and sizes of our stores;• the locations of our stores;• the interior layouts of our stores;• the trade area demographics and economic data of each of our stores;• the local competitive positioning in and around our stores;• the primary term lease commitment for each store;• the long-term lease option coverage for each store;• the occupancy cost of our stores relative to market rents;• our supply chain network strategy; and• our ongoing network of service locations.
If we fail to effectively evaluate these factors or negotiate appropriate terms or if unforeseen changes arise, the consequences could include, for example:
• having to close stores and abandon the related assets, while retaining the financial commitments of the leases;• incurring significant costs to remodel or transform our stores;• having stores, supply chain or service locations that no longer meet the needs of our business; and• bearing excessive lease expenses.
These consequences could have a materially adverse impact on our profitability, cash flows and liquidity.
For leased property, the financial impact of exiting a location can vary greatly depending on, among other factors, the terms of the lease, the condition of the localreal estate market, demand for the specific property, our relationship with the landlord and the availability of potential sub-lease tenants. It is difficult for us toinfluence some of these factors, and the costs of exiting a property can be significant. In addition to rent, we are still responsible for the maintenance, taxes,insurance and common area maintenance charges for vacant properties until the lease commitment expires or is terminated. Similarly, when we enter into acontract with a tenant to sub-lease property, we usually retain our obligations as the master lessor. This leaves us at risk for any remaining liability in the event ofdefault by the sub-lease tenant.
Failure to effectively manage our costs could have a material adverse effect on our profitability.
Some of our operating costs are fixed and/or are subject to multi-year contracts. Some elements of our costs may be higher than our competitors, because of, forexample, our differential service offerings or levels of customer service. As discussed above, our revenues are susceptible to volatility from various sources, whichcan lead to periods of flat or declining revenues. Accordingly, our ongoing drive to reduce cost and increase efficiency represents a strategic imperative. Failure tosuccessfully manage our costs could have a material adverse impact on our profitability and curtail our ability to fund our growth or other critical initiatives.
Our liquidity may be materially adversely affected by constraints in the capital markets or our vendor credit terms.
We need sufficient sources of liquidity to fund our working capital requirements, service our outstanding indebtedness and finance business opportunities. Withoutsufficient liquidity, we could be forced to curtail our operations, or we may not be able to pursue business opportunities. The principal sources of our liquidity arefunds generated from operating activities, available cash and liquid investments, credit facilities, other debt arrangements and trade payables. Our liquidity couldbe materially adversely impacted if our vendors reduce payment terms and/or impose tighter credit limits. If our sources of liquidity do not satisfy ourrequirements, we may need to seek additional financing. The future availability of financing will depend on a variety of factors, such as economic and marketconditions, the regulatory environment for banks and other financial institutions, the availability of credit and our credit ratings and our reputation with potentiallenders. These factors could materially adversely affect our costs of borrowing and our ability to pursue business opportunities, and threaten our ability to meet ourobligations as they become due.
Changes in our credit ratings may limit our access to capital and materially increase our borrowing costs.
11

Table of Contents
Our credit ratings and outlooks at March 20, 2017 , are summarized below. In fiscal 2017, Standard & Poor's Rating Services upgraded its long-term credit ratingfrom BB+ to BBB- with a Stable outlook; Moody's Investors Service, Inc. affirmed its long-term credit rating of Baa1 with a Stable outlook; and Fitch RatingsLimited affirmed its long-term credit rating of BBB- with a Stable outlook.
Rating Agency Rating Outlook
Standard & Poor's BBB- StableMoody's Baa1 StableFitch BBB- Stable
Any future downgrades to our credit ratings and outlook could negatively impact the perception of our credit risk and thus our access to capital markets, borrowingcosts, vendor terms and lease terms. Our credit ratings are based upon information furnished by us or obtained by a rating agency from its own sources and aresubject to revision, suspension or withdrawal by one or more rating agencies at any time. Rating agencies may change the ratings assigned to us due todevelopments that are beyond our control, including the introduction of new rating practices and methodologies.
We are highly dependent on the cash flows and net earnings we generate during our fourth fiscal quarter, which includes the majority of the holidayshopping season. Approximately one-third of our revenue and more than one-half of our net earnings have historically been generated in our fourth fiscal quarter, which includes themajority of the holiday shopping season in the U.S., Canada and Mexico. In addition, the holiday shopping season also incorporates many other unpredictablefactors, such as the level of competitive promotional activity and customer buying patterns, which makes it difficult to forecast and react to these factors quickly.Unexpected events or developments such as natural or man-made disasters, economic factors, product sourcing issues, failure or interruption of managementinformation systems or disruptions in services or systems provided or managed by third-party vendors could significantly disrupt our operations. As a result ofthese factors, there is a risk that our fourth quarter and annual results could be adversely affected.
Failure to effectively manage strategic ventures, alliances or acquisitions could have a negative impact on our business.
We may decide to enter into new joint ventures, partnerships, alliances or acquisitions with third parties (collectively, "new ventures"). Assessing the viability ofnew ventures is typically subject to significant uncertainty and the success of such new ventures can be adversely affected by many factors, including, for example:
• different and incremental business risks of the new venture;• failure to motivate and retain key employees of the new venture;• uncertainty of forecasting financial performance;• failure to integrate aspects of the new venture into our existing business, such as new product or service offerings or information technology systems;• failure to maintain appropriate internal control over financial reporting;• failure to generate expected synergies such as cost reductions;• unforeseen changes in the business environment of the new venture;• disputes or strategic differences with other third party participants in the new venture; and• adverse impacts on relationships with vendors and other key partners of our existing business or the new venture.
If new ventures are unsuccessful, our liquidity and profitability could be materially adversely affected, and we may be required to recognize material impairmentsto goodwill and other assets acquired. New ventures may also divert our financial resources and management's attention from other important areas of our business.
Failure to protect or effectively respond to breach of the integrity, security and confidentiality of our employee and customer data could expose us tolitigation costs and materially damage our standing with our employees or customers.
The use and handling of personally identifiable data by our business, our business associates and third parties is regulated at the state, federal and internationallevels. We are also contractually obligated to comply with certain industry standards regarding payment card information. Increasing costs associated withinformation security, such as increased investment in technology and qualified staff, the costs of compliance and costs resulting from fraud could cause ourbusiness and results of operations to suffer materially. Additionally, the success of our online operations depends upon the secure transmission of customer andother
12

Table of Contents
confidential information over public networks, including the use of cashless payments. While we take significant steps to protect this information, lapses in ourcontrols or the intentional or negligent actions of employees, business associates or third parties or failure to effectively respond to such compromises, mayundermine our security measures. As a result, unauthorized parties may obtain access to our data systems and misappropriate employee, customer and otherconfidential data. Advances in computer capabilities, new discoveries in the field of cryptography or other developments may not prevent the compromise of ourcustomer transaction processing capabilities and customer personal data. Furthermore, because the methods used to obtain unauthorized access change frequentlyand may not be immediately detected, we may be unable to anticipate these methods or promptly implement preventative measures. Any such compromise of oursecurity or the security of information residing with our business associates or third parties could have a material adverse effect on our reputation or ourrelationship with our employees, which may in turn have a negative impact on our revenue, and may expose us to material costs, penalties and compensationclaims. In addition, any compromise of our data security may materially increase the costs we incur to protect against such breaches and could subject us toadditional legal risk.
Catastrophic events could adversely affect our operating results.
The risk or actual occurrence of various catastrophic events could materially adversely affect our financial performance. Such events may be caused by, forexample:
• natural disasters or extreme weather events;• diseases or epidemics that may affect our employees, customers or partners;• floods, fire or other catastrophes affecting our properties; or• terrorism, civil unrest or other conflicts.
Such events can adversely affect our work force and prevent employees and customers from reaching our stores and properties and can disrupt or disable portionsof our supply chain and distribution network. As a consequence of these or other catastrophic events, we may endure interruption to our operations or losses ofproperty, equipment or inventory, which would adversely affect our revenue and profitability.
Our exclusive brands products are subject to several additional product, supply chain and legal risks that could affect our operating results.
Sales of our exclusive brands products, which include Insignia, Modal, Dynex, Init, Platinum and Rocketfish branded products, represent an important componentof our product offerings and our revenue and profitability. Most of these products are manufactured by contract manufacturers based in southeastern Asia. Thisarrangement exposes us to the following additional potential risks, which could materially adversely affect our operating results:
• we have greater exposure and responsibility to consumers for warranty replacements and repairs as a result of exclusive brand product defects, and ourrecourse to contract manufacturers for such warranty liabilities may be limited in foreign jurisdictions;
• we may be subject to regulatory compliance and/or product liability claims relating to personal injury, death or property damage caused by exclusivebrand products, some of which may require us to take significant actions such as product recalls;
• we may experience disruptions in manufacturing or logistics due to inconsistent and unanticipated order patterns, our inability to develop long-termrelationships with key manufacturers or unforeseen natural disasters;
• we may not be able to locate manufacturers that meet our internal standards, whether for new exclusive brand products or for migration of themanufacturing of products from an existing manufacturer;
• we are subject to developing and often-changing labor and environmental laws for the manufacture of products in foreign countries, and we may beunable to conform to new rules or interpretations in a timely manner;
• we may be subject to claims by technology or other intellectual property owners if we inadvertently infringe upon their patents or other intellectualproperty rights, or if we fail to pay royalties owed on our exclusive brand products;
• we may be unable to obtain or adequately protect patents and other intellectual property rights on our exclusive brand products or manufacturingprocesses; and
• regulations regarding disclosure of efforts to identify the country of origin of “conflict minerals” in certain portions of our supply chain could increase thecost of doing business and, depending on the findings of our country of origin inquiry, could have an adverse effect on our reputation.
Maintaining consistent quality, availability and competitive pricing of our exclusive brands products helps us build and maintain customer loyalty, generaterevenue and achieve acceptable margins. Failure to maintain these factors could have a significant adverse impact on the demand for exclusive brand products andthe profits we are able to generate from them.
13

Table of Contents
We are subject to certain statutory, regulatory and legal developments which could have a material adverse impact on our business.
Our statutory, regulatory and legal environments expose us to complex compliance and litigation risks that could materially adversely affect our operations. Someof the most significant compliance and litigation risks we face are:
• the difficulty of complying with sometimes conflicting statutes and regulations in local, national or international jurisdictions;• the potential for unexpected costs related to compliance with new or existing environmental legislation or international agreements affecting energy,
carbon emissions, electronics recycling and water or product materials;• ensuring compliance with applicable product compliance laws and regulations with respect to both the products we sell and contract to manufacture,
including laws and regulation related to product safety and product transport;• the impact of new regulations governing data privacy and security, whether imposed as a result of increased cyber-security risks or otherwise;• the impact of other new or changing statutes and regulations including, but not limited to, financial reform, National Labor Relations Board rule changes,
health care reform, corporate governance matters, escheatment rules and/or other as yet unknown legislation, that could affect how we operate andexecute our strategies as well as alter our expense structure;
• the impact of the potential implementation of more restrictive trade policies or the renegotiation of existing trade agreements in the U.S. or countrieswhere we sell our products and services or procure products;
• the impact of potential changes in U.S. or other countries tax laws and regulations, including the imposition of the border adjustment tax on importedproducts as is currently being discussed by U.S. Congress that could increase the cost of the products we sell because a significant portion of the productswe sell in the U.S. are sourced from outside of the country; and
• the impact of litigation trends, including class action lawsuits involving consumers and shareholders, and labor and employment matters.
Regulatory activity focused on the retail industry has grown in recent years, increasing the risk of fines and additional operating costs associated with compliance.Additionally, defending against lawsuits and other proceedings may involve significant expense and divert management's attention and resources from othermatters.
Changes to labor or employment laws or regulations could have an adverse impact on our costs and impair the viability of our operating model.
As an employer of approximately 125,000 people in a large number of different jurisdictions, we are subject to risks related to employment laws and regulationsincluding, for example:
• unionization and related regulations that affect the nature of labor relations, the organization of unions and union elections; in the U.S. the National LaborRelations Board continually considers changes to such regulations; as of January 28, 2017, none of our U.S. operations had employees represented bylabor unions or working under collective bargaining agreements;
• laws that impact the relationship between the company and independent contractors; and• laws that impact minimum wage, sick time, paid leave and scheduling requirements, that could directly or indirectly increase our payroll costs and/or
impact the level of service we are able to provide.
Changes to laws and regulations such as these could adversely impact our reputation, our ability to continue operations and our profitability.
Economic, regulatory and other developments could adversely affect our ability to offer attractive promotional financing to our customers and adverselyaffect the profits we generate from these programs. We offer promotional financing and credit cards issued by third-party banks that manage and directly extend credit to our customers. Customers choosingpromotional financing can receive extended payment terms and low- or no-interest financing on qualifying purchases. We believe our financing programs generateincremental revenue from customers who prefer the financing terms to other available forms of payment or otherwise need access to financing in order to makepurchases. Approximately 23% of our fiscal 2017 revenue was transacted using one of the company's branded cards. In addition, we earn profit-share income fromour banking partners based on the performance of the programs. The income we earn in this regard is subject to numerous factors, including the volume and valueof transactions, the terms of promotional financing offers, bad debt
14

Table of Contents
rates, interest rates, the regulatory and competitive environment and expenses of operating the program. Adverse changes to any of these factors could impair ourability to offer these programs to customers and reduce customer purchases and our ability to earn income from sharing in the profits of the programs. We rely heavily on our information technology systems for our key business processes. Any failure or interruption in these systems could have a materialadverse impact on our business. The effective and efficient operation of our business is dependent on our management information systems. We rely heavily on our management informationsystems to manage all key aspects of our business, including demand forecasting, purchasing, supply chain management, point-of-sale processing, servicesfulfillment, staff planning and deployment, website offerings, financial management, reporting and forecasting and safeguarding critical and sensitive information.The failure of our management information systems to perform as we anticipate (whether from internal or external factors), or to meet the continuously evolvingneeds of our business, could significantly disrupt our business and cause, for example, higher costs and lost revenues and could threaten our ability to remain inoperation.
We utilize complex information technology platforms to operate our websites and mobile applications. Disruptions to these services, such as those caused byunforeseen traffic levels, malicious attacks or other technical difficulties, could cause us to forgo material revenues, incur material costs and adversely affect ourreputation with consumers. We utilize third-party vendors for certain aspects of our business operations. We engage key third-party business partners to support various functions of our business, including but not limited to, information technology, web hosting andcloud-based services, human resource operations, customer loyalty programs, promotional financing and customer loyalty credit cards, gift cards, customerwarranty, technical support, transportation and insurance programs. Any material disruption in our relationship with key third-party business partners or anydisruption in the services or systems provided or managed by third parties could impact our revenues and cost structure and hinder our operations, particularly if adisruption occurs during peak revenue periods.
Our international activities are subject to many of the same risks as described above, as well as to risks associated with the legislative, judicial, regulatory,political and economic factors specific to the countries or regions in which we operate. We operate retail locations in Canada and Mexico. In addition, we have wholly owned legal entities registered in various other foreign countries, includingBermuda, China, Germany, Hong Kong, Luxembourg, the Republic of Mauritius, Turks and Caicos, and the U.K. During fiscal 2017, our International segment'soperations generated 8% of our revenue. In general, the risk factors identified above also have relevance to our International operations. In addition, ourInternational operations also expose us to other risks, including those related to, for example:
• political conditions;• economic conditions, including monetary and fiscal policies and tax rules;• legal and regulatory environments;• rules governing international trade and potential changes to trade policies or trade agreements and ownership of foreign entities;• risks associated with foreign currency exchange rates;• cultural differences that we may be unable to anticipate or respond to appropriately;• difficulties in enforcing intellectual property rights; and• difficulties encountered in exerting appropriate management oversight to operations in remote locations.
These factors could significantly disrupt our International operations and have a material adverse effect on our revenue and profitability and could lead to usincurring material impairments and other exit costs.
Failure to meet the financial performance guidance or other forward-looking statements we have provided to the public could result in a decline in ourstock price. We may provide public guidance on our expected financial results or other forward-looking information for future periods. Although we believe that this guidanceprovides investors and analysts with a better understanding of management's expectations for the future and is useful to our existing and potential stockholders,such guidance is comprised of forward-looking statements subject to the risks and uncertainties described in this report and in our other public filings and publicstatements. Our actual results may not be in line with guidance we have provided. If our financial results for a particular period
15

Table of Contents
do not meet our guidance or the expectations of market participants or if we reduce our guidance for future periods, the market price of our common stock maydecline.
Item 1B. Unresolved Staff Comments.
Not applicable.
16

Table of Contents
Item 2. Properties.
Stores, Distribution Centers, Service Centers and Corporate Facilities
Domestic Segment
The following table summarizes the location and total square footage of our Domestic segment stores at the end of fiscal 2017 :
U.S. Best Buy
Stores
U.S. Best Buy Mobile Stand-Alone
Stores Pacific Sales
Stores
Alabama 15 3 —
Alaska 2 — —
Arizona 23 2 —
Arkansas 9 4 —
California 118 18 28
Colorado 21 4 —
Connecticut 12 5 —
Delaware 3 1 —
District of Columbia 2 — —
Florida 64 31 —
Georgia 28 10 —
Hawaii 2 — —
Idaho 5 2 —
Illinois 49 11 —
Indiana 23 10 —
Iowa 11 1 —
Kansas 9 3 —
Kentucky 9 7 —
Louisiana 16 4 —
Maine 4 — —
Maryland 21 10 —
Massachusetts 24 10 —
Michigan 32 9 —
Minnesota 22 11 —
Mississippi 8 1 —
Missouri 19 9 —
Montana 3 — —
Nebraska 5 3 —
Nevada 10 4 —
New Hampshire 6 3 —
New Jersey 27 8 —
New Mexico 5 3 —
New York 53 13 —
North Carolina 32 9 —
North Dakota 4 1 —
Ohio 37 10 —
Oklahoma 13 4 —
Oregon 12 2 —
Pennsylvania 37 12 —
Puerto Rico 3 — —
Rhode Island 1 — —
South Carolina 14 4 —
South Dakota 2 1 —
Tennessee 16 8 —
Texas 103 30 —
Utah 10 — —
Vermont 1 — —

Virginia 34 8 —
Washington 19 8 —
West Virginia 5 — —
Wisconsin 22 11 —
Wyoming 1 1 —
Total 1,026 309 28
Square footage (in thousands) 39,662 429 737
Average square feet per store (in thousands) 39 1 26
17

Table of Contents
The following table summarizes the ownership status of our Domestic segment store locations at the end of fiscal 2017 :
U.S. Best Buy
Stores
U.S. Best Buy Mobile Stand- Alone
Stores Pacific Sales
Stores
Owned store locations 25 — —
Owned buildings and leased land 36 — —
Leased store locations 965 309 28
The following table summarizes the location, ownership status and total square footage of space utilized for distribution centers, service centers and corporateoffices of our Domestic segment at the end of fiscal 2017 :
Square Footage (in thousands)
Location Leased Owned
Distribution centers 24 locations in 18 U.S. states 7,844 3,168
Geek Squad service centers (1) Louisville, Kentucky 237 —
Principal corporate headquarters (2) Richfield, Minnesota — 1,452
Territory field offices 12 locations throughout the U.S. 109 —
Pacific Sales corporate office space Torrance, California 12 —
(1) The leased space utilized by our Geek Squad operations is used primarily to service notebook and desktop computers.
(2) Our principal corporate headquarters consists of four interconnected buildings. Certain vendors who provide us with a variety of corporate services occupy a portion of our principalcorporate headquarters. We also sublease a portion of our principal corporate headquarters to unaffiliated third parties.
International Segment
The following table summarizes the location and total square footage of our International segment stores at the end of fiscal 2017 :
Best Buy
Stores
Best Buy Mobile Stores
Best Buy Express Stores
Canada Alberta 19 9 —
British Columbia 22 9 —
Manitoba 4 — —
New Brunswick 3 — —
Newfoundland 1 — —
Nova Scotia 3 1 —
Ontario 54 29 —
Prince Edward Island 1 — —
Quebec 23 5 —
Saskatchewan 4 — — Square footage (in thousands) 3,783 50 —
Average square feet per store (in thousands) 28 1 —
Mexico Coahuila — — 1
Estado de Mexico 3 — —
Distrito Federal 7 — 3
Guanajuato 1 — —
Jalisco 4 — —
Nuevo Leon 2 — 1
Michoacan 1 — —
Veracruz 1 — —
San Luis Potosi 1 — — Square footage (in thousands) 670 — 8
Average square feet per store (in thousands) 34 — 2
Total store count 154 53 5

18
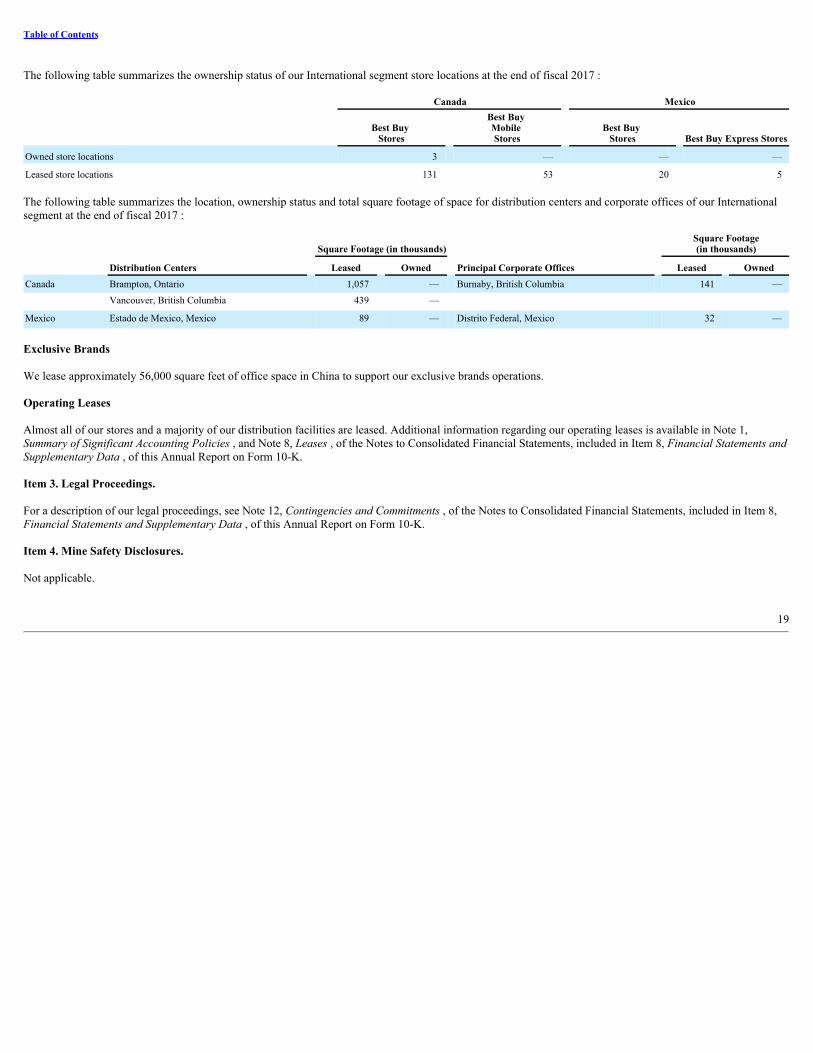
Table of Contents
The following table summarizes the ownership status of our International segment store locations at the end of fiscal 2017 :
Canada Mexico
Best Buy
Stores
Best Buy Mobile Stores
Best Buy Stores Best Buy Express Stores
Owned store locations 3 — — —
Leased store locations 131 53 20 5
The following table summarizes the location, ownership status and total square footage of space for distribution centers and corporate offices of our Internationalsegment at the end of fiscal 2017 :
Square Footage (in thousands) Square Footage(in thousands)
Distribution Centers Leased Owned Principal Corporate Offices Leased OwnedCanada Brampton, Ontario 1,057 — Burnaby, British Columbia 141 — Vancouver, British Columbia 439 — Mexico Estado de Mexico, Mexico 89 — Distrito Federal, Mexico 32 —
Exclusive Brands
We lease approximately 56,000 square feet of office space in China to support our exclusive brands operations.
Operating Leases
Almost all of our stores and a majority of our distribution facilities are leased. Additional information regarding our operating leases is available in Note 1,Summary of Significant Accounting Policies , and Note 8, Leases , of the Notes to Consolidated Financial Statements, included in Item 8, Financial Statements andSupplementary Data , of this Annual Report on Form 10-K.
Item 3. Legal Proceedings.
For a description of our legal proceedings, see Note 12, Contingencies and Commitments , of the Notes to Consolidated Financial Statements, included in Item 8,Financial Statements and Supplementary Data , of this Annual Report on Form 10-K.
Item 4. Mine Safety Disclosures.
Not applicable.
19

Table of Contents
Executive Officers of the Registrant(As of March 20, 2017 )
Name Age Position With the Company
YearsWith theCompany
Hubert Joly 57 Chairman and Chief Executive Officer 4Corie Barry 42 Chief Financial Officer 17Paula F. Baker 49 Chief Human Resources Officer 13Shari L. Ballard 50 President, Multi-channel Retail and Operations 24R. Michael (Mike) Mohan 49 Chief Merchandising and Marketing Officer 13Keith J. Nelsen 53 General Counsel and Secretary 11Asheesh Saksena 52 Chief Strategic Growth Officer 1Trish Walker 50 President, Services 1Mathew R. Watson 46 Chief Accounting Officer 11
Hubert Joly is our Chairman and Chief Executive Officer. He was appointed as President and Chief Executive Officer and a Director in September 2012 and asChairman in June 2015. Mr. Joly was previously the President and Chief Executive Officer of Carlson, Inc., a worldwide hospitality and travel company based inMinneapolis, Minnesota, from 2008 until he joined Best Buy. Prior to becoming Chief Executive Officer of Carlson, Mr. Joly was President and Chief ExecutiveOfficer of Carlson Wagonlit Travel, a business travel management company, from 2004 until 2008. He held several senior executive positions with Vivendi S.A., aFrench multinational media and telecommunications company, from 1999 to 2004. Prior to that time, Mr. Joly worked in the technology sector at Electronic DataSystems (now part of Hewlett-Packard Company) from 1996 to 1999 and at McKinsey & Company, Inc. from 1983 to 1996. Mr. Joly is currently a member of theBoard of Directors of Ralph Lauren Corporation, a leader in the design, marketing and retailing of premier lifestyle products. He also serves on the Board ofDirectors for the Retail Industry Leaders Association, the Executive Committee of the Minnesota Business Partnership and on the Board of Trustees of theMinneapolis Institute of Arts and the Minnesota Orchestra. Mr. Joly previously served as a Director of Carlson, Inc.; Chair of the Board of Directors of the RezidorHotel Group; Chair of the Board of Directors of Carlson Wagonlit Travel; Chair of the Travel Facilitation Sub-Committee of the U.S. Department of CommerceTravel and Tourism Advisory Board; on the executive committee of the World Travel and Tourism Council; and on the board of overseers of the Carlson School ofManagement.
Corie Barry was appointed our Chief Financial Officer in June 2016. In this role, she is responsible for overseeing all aspects of global finance, as well asinformation technology, information security, audit, procurement and pricing functions. Ms. Barry joined Best Buy in 1999 and has held a variety of financial andoperational roles within the organization, both in the field and at the corporate campus. She most recently was our Chief Strategic Growth Officer and the InterimLeader of Best Buy’s Services Organization from 2015 until 2016. Prior to that dual-role, she served as Senior Vice President of Domestic Finance from 2013 until2015; Vice President, Chief Financial Officer and business development of our Home Business Group from 2012 to 2013; and Vice President, Finance of theHome Customer Solutions Group from 2010 until 2012. Prior to Best Buy, Ms. Barry worked at Deloitte & Touche LLP.
Paula F. Baker was appointed our Chief Human Resources Officer in March 2016. In her role, Ms. Baker oversees talent development and the health and well-being of the more than 125,000 Best Buy employees worldwide. Prior to her current role, she served as Vice President, Territory General Manager for theSoutheast region of the United States, responsible for 172 stores and more than 10,000 employees, since 2012. Prior to that, Ms. Baker was a Territory HumanResources Director from 2010 to 2012. She has also previously held District Manager and General Manager roles from 2004 to 2010. Before joining Best Buy in2004, Ms. Baker worked at Books-A-Million, a large chain bookstore in the southeast, Golfsmith International, a retail golf superstore, and St. Andrews GolfCompany, a premier golf club manufacturer and retailer, in retail leadership roles. Ms. Baker serves as a board member on the Richard M. Schulze Foundation andon the Quality Committee of Children’s Hospital of Minnesota.
Shari L. Ballard is our President, Multi-channel Retail and Operations. She was named President, U.S. Retail and Chief Human Resources Officer in 2014 and inMarch 2016 transitioned out of her human resources responsibilities to focus primarily on our store operations. In March 2017, she added responsibility for E-commerce and will now focus primarily on maximizing the multi-channel customer experience. Previously, she served as President, International and ChiefHuman Resources Officer from 2013 to 2014; Executive Vice President and President, International from 2012 to 2013; Executive Vice
20
Table of Contents
President, President - Americas from March 2010 until 2012; Executive Vice President - Retail Channel Management from 2007 to 2010; and Executive VicePresident - Human Resources and Legal from 2004 to 2007. Ms. Ballard joined us in 1993 and has served as Senior Vice President, Vice President, and Generaland Assistant Store Manager. Ms. Ballard serves on the board of directors for the University of Minnesota Foundation. She previously served on the board ofdirectors of the Delhaize Group, a Belgian-based international food retailer.
R. Michael (Mike) Mohan is our Chief Merchandising and Marketing Officer. He was appointed our Chief Merchandising Officer in January 2014 and in March2017 added responsibility for our marketing organization. In this role, he manages the category management supply chain, merchandising and marketing functionsfor our U.S. business, including our category growth strategies, vendor relationships, private label business, merchandise assortment and marketing strategy,branding and execution. Previously, Mr. Mohan served as President, Home since June 2013 until his current appointment; Senior Vice President, General Manager- Home Business Group from 2011 to June 2013; Senior Vice President, Home Theater from 2008 to 2011; and Vice President, Home Entertainment from 2006 to2008. Prior to joining Best Buy in 2004 as Vice President, Digital Imaging, Mr. Mohan was Vice President and General Merchandising manager for Good Guys,an audio/video specialty retailer in the western United States. Mr. Mohan also previously worked at Future Shop in Canada from 1988 to 1997, prior to ouracquisition of the company, where he served in various merchandising roles. Mr. Mohan serves as a trustee for the Boys & Girls Clubs of America.
Keith J. Nelsen has served as our General Counsel and Secretary since 2011. In this role, he manages our enterprise legal and risk management functions, as wellas acts as Secretary to our Board of Directors. Previously, in addition to his current role, he also served as Chief Risk Officer from 2012 to 2013. He was appointedExecutive Vice President, General Counsel in May 2011 and Secretary of the Company in June 2011 and served as Senior Vice President, Commercial andInternational General Counsel from 2008 until his current appointment. Mr. Nelsen joined Best Buy in 2006 as Vice President, Operations and InternationalGeneral Counsel. Prior to joining us, he worked at Danka Business Systems PLC, an office products supplier, from 1997 to 2006 and served in various roles,including chief administration officer and general counsel. Prior to his time at Danka, Mr. Nelsen held the role of Vice President, Legal from 1995 to 1997 atNordicTrack, Inc., a provider of leisure equipment products. Mr. Nelsen began his career in 1989 as a practicing attorney with Best and Flanagan, LLP, a law firmlocated in Minneapolis, Minnesota. Mr. Nelsen is a member of the board of directors of NuShoe, Inc., a privately held shoe repair facility in San Diego, Californiaand serves on the boards of the Children's Cancer Research Fund and the Chad Greenway Lead the Way Foundation.
Asheesh Saksena was appointed our Chief Strategic Growth Officer in June 2016. In this role, he leads our efforts to refine and implement our growth strategy.Mr. Saksena is a highly strategic leader with more than 20 years of experience in creating and leading strategic growth. Prior to joining Best Buy, he served from2011 to 2016 as the Executive Vice President of Strategy and New Business Development at Cox Communications, one of the nation’s leading cable televisionproviders. Prior to that, he was the Deputy Chief Strategy Officer for Time Warner Cable from 2008 to 2011. He has also held leadership roles at Accenture andTata Group.
Trish Walker was appointed our President of Services in April 2016. In this role, she oversees our Geek Squad services in stores, online and in customers’ homes.Before joining Best Buy, Ms. Walker spent 27 years at Accenture, most recently serving as Senior Managing Director leading the North America retail practiceand global client account lead. Prior to leading the retail practice, she held numerous leadership positions in Accenture’s retail practice, including marketing,operations, SAP and change management. Ms. Walker also serves on the advisory board of iOwn, LLC, a computer software development company.
Mathew R. Watson has served as our Vice President, Controller and Chief Accounting Officer since April 2015. Mr. Watson is responsible for our controllershipand external reporting functions. Mr. Watson has served in the role of Vice President, Finance - Controller since 2014. Prior to that role, he was Vice President -Finance, Domestic Controller from 2013 to 2014. Mr. Watson was also Senior Director, External Reporting and Corporate Accounting from 2010 to 2013 andDirector, External Reporting and Corporate Accounting beginning in 2007. Prior to joining us in 2005, Mr. Watson worked at KPMG, a professional audit,advisory and tax firm, from 1995 to 2005. He serves on the board of directors of AchieveMpls.
21
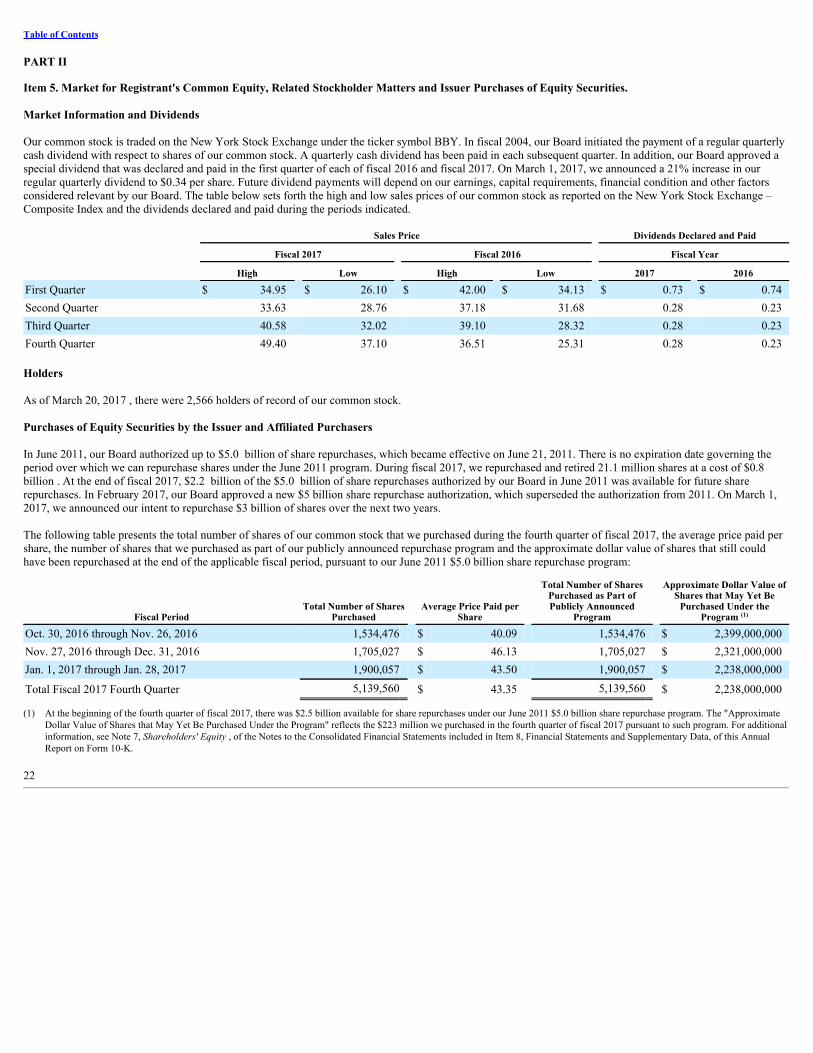
Table of Contents
PART II
Item 5. Market for Registrant's Common Equity, Related Stockholder Matters and Issuer Purchases of Equity Securities.
Market Information and Dividends
Our common stock is traded on the New York Stock Exchange under the ticker symbol BBY. In fiscal 2004, our Board initiated the payment of a regular quarterlycash dividend with respect to shares of our common stock. A quarterly cash dividend has been paid in each subsequent quarter. In addition, our Board approved aspecial dividend that was declared and paid in the first quarter of each of fiscal 2016 and fiscal 2017. On March 1, 2017, we announced a 21% increase in ourregular quarterly dividend to $0.34 per share. Future dividend payments will depend on our earnings, capital requirements, financial condition and other factorsconsidered relevant by our Board. The table below sets forth the high and low sales prices of our common stock as reported on the New York Stock Exchange –Composite Index and the dividends declared and paid during the periods indicated.
Sales Price Dividends Declared and Paid
Fiscal 2017 Fiscal 2016 Fiscal Year
High Low High Low 2017 2016
First Quarter $ 34.95 $ 26.10 $ 42.00 $ 34.13 $ 0.73 $ 0.74Second Quarter 33.63 28.76 37.18 31.68 0.28 0.23Third Quarter 40.58 32.02 39.10 28.32 0.28 0.23Fourth Quarter 49.40 37.10 36.51 25.31 0.28 0.23 Holders
As of March 20, 2017 , there were 2,566 holders of record of our common stock.
Purchases of Equity Securities by the Issuer and Affiliated Purchasers
In June 2011, our Board authorized up to $5.0 billion of share repurchases, which became effective on June 21, 2011. There is no expiration date governing theperiod over which we can repurchase shares under the June 2011 program. During fiscal 2017, we repurchased and retired 21.1 million shares at a cost of $0.8billion . At the end of fiscal 2017, $2.2 billion of the $5.0 billion of share repurchases authorized by our Board in June 2011 was available for future sharerepurchases. In February 2017, our Board approved a new $5 billion share repurchase authorization, which superseded the authorization from 2011. On March 1,2017, we announced our intent to repurchase $3 billion of shares over the next two years.
The following table presents the total number of shares of our common stock that we purchased during the fourth quarter of fiscal 2017, the average price paid pershare, the number of shares that we purchased as part of our publicly announced repurchase program and the approximate dollar value of shares that still couldhave been repurchased at the end of the applicable fiscal period, pursuant to our June 2011 $5.0 billion share repurchase program:
Fiscal PeriodTotal Number of Shares
Purchased Average Price Paid per
Share
Total Number of SharesPurchased as Part ofPublicly Announced
Program
Approximate Dollar Value ofShares that May Yet Be
Purchased Under theProgram (1)
Oct. 30, 2016 through Nov. 26, 2016 1,534,476 $ 40.09 1,534,476 $ 2,399,000,000Nov. 27, 2016 through Dec. 31, 2016 1,705,027 $ 46.13 1,705,027 $ 2,321,000,000Jan. 1, 2017 through Jan. 28, 2017 1,900,057 $ 43.50 1,900,057 $ 2,238,000,000
Total Fiscal 2017 Fourth Quarter 5,139,560 $ 43.35 5,139,560 $ 2,238,000,000
(1) At the beginning of the fourth quarter of fiscal 2017, there was $2.5 billion available for share repurchases under our June 2011 $5.0 billion share repurchase program. The "ApproximateDollar Value of Shares that May Yet Be Purchased Under the Program" reflects the $223 million we purchased in the fourth quarter of fiscal 2017 pursuant to such program. For additionalinformation, see Note 7, Shareholders' Equity , of the Notes to the Consolidated Financial Statements included in Item 8, Financial Statements and Supplementary Data, of this AnnualReport on Form 10-K.
22

Table of Contents
Best Buy Stock Comparative Performance Graph
The information contained in this Best Buy Stock Comparative Performance Graph section shall not be deemed to be "soliciting material" or "filed" orincorporated by reference in future filings with the SEC, or subject to the liabilities of Section 18 of the Exchange Act, except to the extent that we specificallyincorporate it by reference into a document filed under the Securities Act or the Exchange Act.
The graph below compares the cumulative total shareholder return on our common stock for the last five fiscal years with the cumulative total return on theStandard & Poor's 500 Index ("S&P 500"), of which we are a component, and the Standard & Poor's Retailing Group Industry Index ("S&P Retailing Group"), ofwhich we are also a component. The S&P Retailing Group is a capitalization-weighted index of domestic equities traded on the NYSE and NASDAQ and includeshigh-capitalization stocks representing the retail sector of the S&P 500.
The graph assumes an investment of $100 at the close of trading on March 2, 2012, the last trading day of fiscal 2012, in our common stock, the S&P 500 and theS&P Retailing Group.
COMPARISON OF 5 YEAR CUMULATIVE TOTAL RETURN*Among Best Buy Co., Inc., the S&P 500 and the S&P Retailing Group
Fiscal Year 2012 2013 2014 2015 2016 2017
Best Buy Co., Inc. $ 100.00 $ 68.66 $ 102.94 $ 157.58 $ 129.90 $ 211.63
S&P 500 100.00 111.94 136.02 155.37 154.34 185.27
S&P Retailing Group 100.00 123.88 156.39 188.05 221.02 261.85
* Cumulative total return assumes dividend reinvestment.
Source: Research Data Group, Inc.
23

Table of Contents
Item 6. Selected Financial Data.
The following table presents our selected financial data. The table should be read in conjunction with Item 7, Management's Discussion and Analysis of FinancialCondition and Results of Operations , and Item 8, Financial Statements and Supplementary Data , of this Annual Report on Form 10-K.
Five-Year Financial Highlights
$ in millions, except per share amounts
12-Month 11-Month
Fiscal Year 2017 (1) 2016 (2) 2015 (3) 2014 (4) 2013 (5)(6)
Consolidated Statements of Earnings Data Revenue $ 39,403 $ 39,528 $ 40,339 $ 40,611 $ 38,252Operating income 1,854 1,375 1,450 1,144 90Net earnings (loss) from continuing operations 1,207 807 1,246 695 (259)Gain (loss) from discontinued operations 21 90 (11) (172) (161)Net earnings (loss) including noncontrolling interests 1,228 897 1,235 523 (420)Net earnings (loss) attributable to Best Buy Co., Inc. shareholders 1,228 897 1,233 532 (441)
Per Share Data Net earnings (loss) from continuing operations $ 3.74 $ 2.30 $ 3.53 $ 2.00 $ (0.76)Net gain (loss) from discontinued operations 0.07 0.26 (0.04) (0.47) (0.54)Net earnings (loss) 3.81 2.56 3.49 1.53 (1.30)Cash dividends declared and paid 1.57 1.43 0.72 0.68 0.66Common stock price: High 49.40 42.00 40.03 44.66 27.95Low 26.10 25.31 22.30 13.83 11.20
Operating Statistics Comparable sales gain (decline) (7) 0.3% 0.5% 0.5% (1.0)% (2.7)%Gross profit rate 24.0% 23.3% 22.4% 23.1 % 23.6 %Selling, general and administrative expenses rate 19.2% 19.3% 18.8% 20.0 % 20.7 %Operating income rate 4.7% 3.5% 3.6% 2.8 % 0.2 %
Year-End Data Current ratio (8) 1.5 1.4 1.5 1.4 1.1Total assets $ 13,856 $ 13,519 $ 15,245 $ 13,990 $ 16,774Debt, including current portion 1,365 1,734 1,613 1,647 2,290Total equity 4,709 4,378 5,000 3,989 3,715Number of stores Domestic 1,363 1,415 1,448 1,495 1,503International 212 216 283 284 276Total 1,575 1,631 1,731 1,779 1,779
Retail square footage (000s) Domestic 40,828 41,216 41,716 42,051 42,232International 4,511 4,543 6,470 6,636 6,613Total 45,339 45,759 48,186 48,687 48,845
(1) Included within net earnings (loss) from continuing operations and net earnings (loss) attributable to Best Buy Co., Inc. shareholders for fiscal 2017 includes $161 million ($100 million netof taxes) due to cathode ray tube (CRT) and LCD litigation settlements reached, net of related legal fees and costs. Settlements relate to products purchased and sold in prior fiscal years.Refer to Note 12, Contingencies and Commitments , in the Notes to the Consolidated Financial Statements included in Item 8, Financial Statements and Supplementary Data, of thisAnnual Report on Form 10-K.
24

Table of Contents
(2) Included within operating income and net earnings (loss) from continuing operations for fiscal 2016 is $201 million ($159 million net of taxes) of restructuring charges from continuingoperations recorded in fiscal 2016 related to measures we took to restructure our business. Net earnings (loss) attributable to Best Buy Co., Inc. shareholders for fiscal 2016 includesrestructuring charges (net of tax and noncontrolling interest) from continuing operations. Refer to Note 4, Restructuring Charges , in the Notes to the Consolidated Financial Statementsincluded in Item 8, Financial Statements and Supplementary Data, of this Annual Report on Form 10-K.
(3) Included within net earnings (loss) from continuing operations and net earnings (loss) attributable to Best Buy Co., Inc. shareholders for fiscal 2015 includes $353 million due to a discretebenefit related to reorganizing certain European legal entities.
(4) Included within operating income and net earnings (loss) from continuing operations for fiscal 2014 is $149 million ($95 million net of taxes) of restructuring charges from continuingoperations recorded in fiscal 2014 related to measures we took to restructure our business. Net earnings (loss) attributable to Best Buy Co., Inc. shareholders for fiscal 2014 includesrestructuring charges (net of tax and noncontrolling interest) from continuing operations.
(5) Fiscal 2013 (11-month) included 48 weeks. All other periods presented included 52 weeks.
(6) Included within our operating income and net earnings (loss) from continuing operations for fiscal 2013 (11-month) is $415 million ($268 million net of taxes) of restructuring chargesfrom continuing operations recorded in fiscal 2013 (11-month) related to measures we took to restructure our business. Also included in net earnings (loss) from continuing operations forfiscal 2013 (11-month) is $614 million (net of taxes) of goodwill impairment charges primarily related to Best Buy Canada. Included in gain (loss) from discontinued operations is $23million (net of taxes) of restructuring charges primarily related to Best Buy Europe and $207 million (net of taxes) of goodwill impairment charges related to Five Star. Net earnings (loss)attributable to Best Buy Co., Inc. shareholders for fiscal 2013 (11-month) includes restructuring charges (net of tax and noncontrolling interest) from continuing operations and the net oftax goodwill impairment.
(7) Our comparable sales calculation compares revenue from stores, websites and call centers operating for at least 14 full months, as well as revenue related to certain other comparable saleschannels for a particular period to the corresponding period in the prior year. Relocated stores, as well as remodeled, expanded and downsized stores closed more than 14 days, areexcluded from the comparable sales calculation until at least 14 full months after reopening. Acquisitions are included in the comparable sales calculation beginning with the first fullquarter following the first anniversary of the date of the acquisition. The Canadian brand consolidation, which included the permanent closure of 66 Future Shop stores, the conversion of65 Future Shop stores to Best Buy stores and the elimination of the Future Shop website, had a material impact on a year-over-year basis on the remaining Canadian retail stores and thewebsite. As such, from the first quarter of fiscal 2016 through the third quarter of fiscal 2017, all Canadian store and website revenue was removed from the comparable sales base and theInternational segment no longer had a comparable metric. Therefore, Consolidated comparable sales equaled the Domestic segment comparable sales. Beginning in the fourth quarter offiscal 2017, we resumed reporting International comparable sales as revenue in the International segment was once again deemed to be comparable and, as such, Consolidated comparablesales are once again equal to the aggregation of Domestic and International comparable sales.
(8) The current ratio is calculated by dividing total current assets by total current liabilities.
Item 7. Management's Discussion and Analysis of Financial Condition and Results of Operations.
Management's Discussion and Analysis of Financial Condition and Results of Operations ("MD&A") is intended to provide a reader of our financial statementswith a narrative from the perspective of our management on our financial condition, results of operations, liquidity and certain other factors that may affect ourfuture results. Unless otherwise noted, transactions and other factors significantly impacting our financial condition, results of operations and liquidity arediscussed in order of magnitude. Our MD&A is presented in the following sections:
• Overview• Business Strategy• Best Buy 2020: Building the New Blue• Results of Operations• Liquidity and Capital Resources• Critical Accounting Estimates• New Accounting Pronouncements
Our MD&A should be read in conjunction with the Consolidated Financial Statements and related Notes included in Item 8, Financial Statements andSupplementary Data, of this Annual Report on Form 10-K.
Overview
We are a leading provider of technology products, services and solutions. We offer these products and services to customers who visit our stores, engage with GeekSquad agents or use our websites or mobile applications. We have operations in the U.S., Canada and Mexico. We operate two reportable segments: Domestic andInternational. The Domestic segment is comprised of all operations within the U.S. and its districts and territories. The International segment is comprised of alloperations outside the U.S. and its territories.
Our fiscal year ends on the Saturday nearest the end of January. Fiscal 2017, 2016 and 2015 each included 52 weeks, noting that fiscal 2018 will include 53weeks with the additional week included in the fourth quarter. Our business, like that of many
25

Table of Contents
retailers, is seasonal. A higher proportion of our revenue and earnings is generated in the fiscal fourth quarter, which includes the majority of the holiday shoppingseason in the U.S., Canada and Mexico ("Holiday").
Throughout this MD&A, we refer to comparable sales. Our comparable sales calculation compares revenue from stores, websites and call centers operating for atleast 14 full months, as well as revenue related to certain other comparable sales channels for a particular period to the corresponding period in the prior year.Relocated stores, as well as remodeled, expanded and downsized stores closed more than 14 days, are excluded from the comparable sales calculation until at least14 full months after reopening. Acquisitions are included in the comparable sales calculation beginning with the first full quarter following the first anniversary ofthe date of the acquisition. The calculation of comparable sales excludes the impact of revenue from discontinued operations and the effect of fluctuations inforeign currency exchange rates (applicable to our International segment only). The Canadian brand consolidation, which included the permanent closure of 66Future Shop stores, the conversion of 65 Future Shop stores to Best Buy stores and the elimination of the Future Shop website, had a material impact on a year-over-year basis on the remaining Canadian retail stores and the website. As such, from the first quarter of fiscal 2016 through the third quarter of fiscal 2017, allCanadian store and website revenue was removed from the comparable sales base and the International segment no longer had a comparable metric. Therefore,Consolidated comparable sales equaled the Domestic segment comparable sales. Beginning in the fourth quarter of fiscal 2017, we resumed reporting Internationalcomparable sales as revenue in the International segment was once again deemed to be comparable and, as such, Consolidated comparable sales are once againequal to the aggregation of Domestic and International comparable sales. However, we have not provided International comparable sales for fiscal 2017 as thecalculation would only include comparable revenue from the fourth quarter of fiscal 2017 and may be misleading in future periods when used for comparisonpurposes. The method of calculating comparable sales varies across the retail industry. As a result, our method of calculating comparable sales may not be the sameas other retailers' methods.
Non-GAAP Financial Measures
This MD&A includes financial information prepared in accordance with accounting principles generally accepted in the United States ("GAAP"), as well as certainadjusted or non-GAAP financial measures such as constant currency, non-GAAP operating income, non-GAAP effective tax rate, non-GAAP net earnings fromcontinuing operations, non-GAAP diluted earnings per share ("EPS") from continuing operations and non-GAAP debt to earnings before interest, income taxes,depreciation, amortization and rent ("EBITDAR") ratio. We believe that non-GAAP financial measures, when reviewed in conjunction with GAAP financialmeasures, can provide more information to assist investors in evaluating current period performance and in assessing future performance. For these reasons, ourinternal management reporting also includes non-GAAP measures. Generally, our non-GAAP measures include adjustments for items such as restructuringcharges, goodwill impairments, non-restructuring asset impairments and gains or losses on investments. In addition, certain other items may be excluded from non-GAAP financial measures when we believe this provides greater clarity to management and our investors. These non-GAAP financial measures should beconsidered in addition to, and not superior to or as a substitute for, GAAP financial measures. We strongly encourage investors and shareholders to review ourfinancial statements and publicly-filed reports in their entirety and not to rely on any single financial measure. Non-GAAP measures as presented herein may notbe comparable to similarly titled measures used by other companies.
In our discussions of the operating results of our consolidated business and our International segment, we sometimes refer to the impact of changes in foreigncurrency exchange rates or the impact of foreign currency exchange rate fluctuations, which are references to the differences between the foreign currencyexchange rates we use to convert the International segment’s operating results from local currencies into U.S. dollars for reporting purposes. We also use the term"constant currency", which represents results adjusted to exclude foreign currency impacts. We calculate those impacts as the difference between the current periodresults translated using the current period currency exchange rates and using the comparable prior period currency exchange rates. We believe the disclosure ofrevenue changes in constant currency provides useful supplementary information to investors in light of significant fluctuations in currency rates and our inabilityto report comparable store sales for the International segment in fiscal 2016 as a result of the Canadian brand consolidation.
Refer to the Non-GAAP Financial Measures section below for the detailed reconciliation of items that impacted the non-GAAP operating income, non-GAAPeffective tax rate, non-GAAP net earnings from continuing operations and non-GAAP diluted EPS from continuing operations in the presented periods.
Refer to the Other Financial Measures section below for the detailed reconciliation of items that impacted the non-GAAP debt to EBITDAR ratio. Managementbelieves this ratio is an important indicator of our creditworthiness. Furthermore, we believe that our non-GAAP debt to EBITDAR ratio is important forunderstanding our financial position and provides meaningful additional information about our ability to service our long-term debt and other fixed obligations andto fund our future growth. We also believe our non-GAAP debt to EBITDAR ratio is relevant because it enables investors to compare our indebtedness to
26

Table of Contents
that of retailers who own, rather than lease, their stores. Our decision to own or lease real estate is based on an assessment of our financial liquidity, our capitalstructure, our desire to own or to lease the location, the owner’s desire to own or to lease the location and the alternative that results in the highest return to ourshareholders.
Business Strategy
During fiscal 2017, we executed against the three priorities we shared at the beginning of the year:
1. Build on our strong industry position and multi-channel capabilities to drive the existing business;2. Drive cost reduction and efficiencies; and3. Advance key initiatives to drive future growth and differentiation.
Below is summary of our progress against these priorities:
• We believe we continued to gain market share in most of our product categories. We believe the total market for our product categories was down low-single digits in calendar 2016 and that our market share gains helped us offset the market decline;
• We increased our Net Promoter Score by over 350 basis points;• We grew the Domestic segment online revenue with comparable sales of 20.8% in fiscal 2017;• The successful Canadian brand consolidation was the primary driver of operating income of $90 million in our International segment for fiscal 2017
compared to a loss of $210 million in fiscal 2016;• We continued to progress against our three-year target to reduce cost and optimize gross profit by $400 million and achieved $350 million cumulative
savings by the end of fiscal 2017; these savings enable us to invest in customer experience improvements while maintaining near flat SG&A;• As for the third priority, fiscal 2017 was a year of exploration and experimentation, and we are continuing to test several concepts around the country that
we believe have the potential to be compelling customer experiences; we expect to launch some of these concepts in fiscal 2018.
Best Buy 2020: Building the New Blue
In November 2012, we introduced our transformation strategy called Renew Blue . Since then we have stabilized comparable sales and increased our profitability.A little more than four years later, we have now completed Renew Blue and unveiled a new strategy: Best Buy 2020: Building the New Blue.
Our customers are at the core of Best Buy 2020. Technology continues to evolve, creating more excitement and opening up an increasing range of possibilities forour customers. It is also creating more complexity and we believe many of our customers need our help. Our purpose is to help customers pursue their passions andenrich their lives with the help of technology. We want to play two roles for them: be their trusted adviser and solution provider; and be their source for technologyservices for their home. Our customer value proposition is to be the leading technology expert who makes it easy for our customers to learn about and confidentlyenjoy the best technology.
From a financial standpoint, we seek to gradually grow our revenue, pursue ongoing cost savings necessary to both offset inflationary pressures and fundinvestments and build a more predictable set of revenue streams built on more recurring revenues and stickier customer relationships. There are three growthpillars we will be pursuing as part of Best Buy 2020:
1. Maximize the multi-channel retail business by continuing to enhance the customer experience, investing in growth of certain key product categories anddeveloping broader and stickier customer relationships;
2. Provide services and solutions that solve real customer needs and help us build deeper customer relationships - for example, by meeting the significanttechnical support needs of our customers and providing more complete solutions such as security monitoring and home automation services as well as theassociated products; and
3. Accelerate growth in our International segment, which consists of Canada and Mexico.
With the launch of Best Buy 2020, fiscal 2018 will revolve around the following four priorities:
1. Driving growth from the pillars described above; for example:
• We will continue to innovate our digital capabilities to effectively help our customers in their shopping journey;
27

Table of Contents
• We will pursue growth around key product categories, including emerging product categories like connected home, appliances where we believe we cancontinue to grow revenue and mobile where we have the opportunity to return to growth by providing a more compelling experience to our customers;
• We plan to expand our in-home advisor program ("IHA") to more markets. With our IHA program, customers receive a free in-home consultation withan experienced technology advisor who can identify their needs, design personalized solutions and become a personal resource over time;
• We will continue to test new concepts around the country that have the potential to be compelling customer experiences. We have a pipeline ofopportunities, some of which we will expect to expand later in fiscal 2018; and
• We will pursue growth in our International segment by continuing to drive our online channel and by expanding the launch of the successful storeremodels in Canada and opening nine new stores in Mexico over the next two years.
2. The second priority is to improve our execution in key areas. We believe we continue to have significant opportunities from improving our saleseffectiveness and proficiency, our supply chain for large product fulfillment and small package delivery and our services fulfillment capabilities.
3. The third priority is to continue to reduce costs and drive efficiencies through the business. As stated previously, we have achieved $350 million of ourcurrent $400 million cost reduction target. We are working on the next phase of cost savings and will provide updates on the next goal once we completeour current program.
4. The fourth priority is to build the capabilities necessary to deliver on the first three priorities, which will involve making investments in people and systemsto drive growth, execution and efficiencies.
Results of Operations
In order to align our fiscal reporting periods and comply with statutory filing requirements, we consolidate the financial results of our Mexico operations on a one-month lag. Consistent with such consolidation, the financial and non-financial information presented in our MD&A relative to these operations is also presented ona lag. Our policy is to accelerate the recording of events occurring in the lag period that significantly affect our consolidated financial statements. No such eventswere identified for the periods presented.
The results of Jiangsu Five Star Appliance Co., Limited ("Five Star"), in our International segment, are presented as discontinued operations in our ConsolidatedStatements of Earnings. Unless otherwise stated, financial results discussed herein refer to continuing operations.
28

Table of Contents
Consolidated Results
The following table presents selected consolidated financial data for each of the past three fiscal years ($ in millions, except per share amounts):
Consolidated Performance Summary 2017 2016 2015
Revenue $ 39,403 $ 39,528 $ 40,339Revenue % decline (0.3)% (2.0)% (0.7)%Comparable sales % gain (1) 0.3 % 0.5 % 0.5 %Comparable sales % gain (decline), excluding estimated impact of installment billing(1)(2) n/a (0.1)% — %Restructuring charges - cost of goods sold $ — $ 3 $ —Gross profit $ 9,440 $ 9,191 $ 9,047Gross profit as a % of revenue (3) 24.0 % 23.3 % 22.4 %SG&A $ 7,547 $ 7,618 $ 7,592SG&A as a % of revenue 19.2 % 19.3 % 18.8 %Restructuring charges $ 39 $ 198 $ 5Operating income $ 1,854 $ 1,375 $ 1,450Operating income as a % of revenue 4.7 % 3.5 % 3.6 %Net earnings from continuing operations $ 1,207 $ 807 $ 1,246Gain (loss) from discontinued operations (4) $ 21 $ 90 $ (13)Net earnings attributable to Best Buy Co., Inc. shareholders $ 1,228 $ 897 $ 1,233Diluted earnings per share from continuing operations $ 3.74 $ 2.30 $ 3.53Diluted earnings per share $ 3.81 $ 2.56 $ 3.49
(1) The Canadian brand consolidation that was initiated in the first quarter of fiscal 2016 had a material impact on a year-over-year basis on the Canadian retail stores and website. As such,beginning in the first quarter of fiscal 2016 through the third quarter of fiscal 2017, all store and website revenue was removed from the comparable sales base, and an Internationalsegment (comprised of Canada and Mexico) comparable sales metric has not been provided. Therefore, Consolidated comparable sales for fiscal 2017 include revenue from continuingoperations in the Domestic segment for the full year and the International segment for the fourth quarter only, and Consolidated comparable sales for fiscal 2016 equal the Domesticsegment comparable sales.
(2) Represents comparable sales, excluding the estimated revenue benefit from installment billing. In fiscal 2015, we began selling installment billing plans offered by mobile carriers to ourcustomers to complement the more traditional two-year plans. While the two types of contracts have broadly similar overall economics, installment billing plans typically generate higherrevenues due to higher proceeds for devices and higher cost of sales due to lower device subsidies. As we increased our mix of installment billing plans, we had an associated increase inrevenue and cost of goods sold and a decrease in gross profit rate, with gross profit dollars relatively unaffected. This change in plan offer did not impact our International segment.Beginning in fiscal 2017, we no longer reported comparable sales, excluding the estimated revenue benefit from installment billing, as the mix of installment billing plans becamecomparable on a year-over-year basis.
(3) Because retailers vary in how they record costs of operating their supply chain between cost of goods sold and SG&A, our gross profit rate and SG&A rate may not be comparable to otherretailers' corresponding rates. For additional information regarding costs classified in cost of goods sold and SG&A, refer to Note 1, Summary of Significant Accounting Policies , of theNotes to Consolidated Financial Statements, included in Item 8, Financial Statements and Supplementary Data , of this Annual Report on Form 10-K.
(4) Includes both gain (loss) from discontinued operations and net earnings from discontinued operations attributable to noncontrolling interests.
In addition, we generated $2.5 billion in operating cash flow in fiscal 2017 , compared to $1.3 billion in fiscal 2016 , and we ended fiscal 2017 with $3.9 billion ofcash, cash equivalents and short-term investments, compared to $3.3 billion at the end of fiscal 2016 . During fiscal 2017 , we made four regular dividend and onespecial dividend payments totaling $1.57 per share, or $505 million in the aggregate.
29

Table of Contents
Fiscal 2017 Results Compared With Fiscal 2016
Consolidated revenue of $39.4 billion in fiscal 2017 decreased 0.3% compared to fiscal 2016. The components of the 0.3% revenue decrease in fiscal 2017 were asfollows:
Impact of foreign currency exchange rate fluctuations (0.2)%Non-comparable sales (1) (0.3)%Comparable sales impact 0.2 %
Total revenue decrease (0.3)%
(1) Non-comparable sales reflects the impact of revenue in our International segment for the first through third quarters of fiscal 2017, net store opening and closing activity, as well as, theimpact of revenue streams not included within our comparable sales calculation, such as profit share revenue, certain credit card revenue, gift card breakage and sales of merchandise towholesalers and dealers, as applicable.
Our gross profit rate increased 0.7% of revenue in fiscal 2017 . Our Domestic segment contributed a rate increase of 0.5% of revenue, while our Internationalsegment contributed 0.2%. For further discussion of each segment's gross profit rate changes, see Segment Performance Summary , below.
The SG&A rate remained flat on a year-over-year basis with both our Domestic and International segments contributing flat year-over-year SG&A as a percentageof revenue. For further discussion of each segment's SG&A rate changes, see Segment Performance Summary, below.
SG&A restructuring charges decreased from $198 million in fiscal 2016 to $39 million in fiscal 2017. The fiscal 2017 activity primarily related to our Domesticsegment, while our fiscal 2016 activity was driven by our International segment. For further discussion of each segment's SG&A restructuring charges, seeSegment Performance Summary, below.
Our operating income increased $479 million , and our operating income as a percent of revenue increased to 4.7% of revenue in fiscal 2017 , compared tooperating income of 3.5% of revenue in fiscal 2016 . The increase in our operating income was primarily due to an increase in our gross profit rate and a decreasein our restructuring activity.
Fiscal 2016 Results Compared With Fiscal 2015
The components of the 2.0% revenue decrease in fiscal 2016 were as follows:
Impact of foreign currency exchange rate fluctuations (1.3)%Non-comparable sales (1) (1.1)%Comparable sales impact 0.4 %
Total revenue decrease (2.0)%
(1) Non-comparable sales reflects the impact of revenue in our International segment, net store opening and closing activity, as well as, the impact of revenue streams not included within ourcomparable sales calculation, such as profit share revenue, certain credit card revenue, gift card breakage and sales of merchandise to wholesalers and dealers, as applicable.
Our gross profit rate increased 0.9% of revenue in fiscal 2016 . Our Domestic segment contributed a rate increase of 0.9% of revenue and there was no change inour International segment. For further discussion of each segment's gross profit rate changes, see Segment Performance Summary , below.
The SG&A rate increased 0.5% of revenue in fiscal 2016 . Our Domestic segment contributed a rate increase of 0.5% of revenue and there was no change in ourInternational segment. For further discussion of each segment's SG&A rate changes, see Segment Performance Summary, below.
SG&A restructuring charges increased from $5 million in fiscal 2015 to $198 million in fiscal 2016. Our International segment drove this increase. For furtherdiscussion of each segment’s SG&A restructuring charges, see Segment Performance Summary , below.
Our operating income decreased $75 million, and our operating income as a percent of revenue decreased to 3.5% of revenue in fiscal 2016 , compared tooperating income of 3.6% of revenue in fiscal 2015 . The decrease in our operating income was primarily due to an increase in restructuring charges partially offsetby net CRT/LCD legal settlement proceeds received in fiscal 2016.
30

Table of Contents
Segment Performance Summary Domestic Segment
The following table presents selected financial data for our Domestic segment for each of the past three fiscal years ($ in millions):
Domestic Segment Performance Summary 2017 2016 2015
Revenue $ 36,248 $ 36,365 $ 36,055Revenue % gain (decline) (0.3)% 0.9 % 0.6%Comparable sales % gain (1) 0.2 % 0.5 % 1.0%Comparable sales % gain (decline), excluding the estimated impact of installmentbilling (1)(2) n/a (0.1)% 0.5%Gross profit $ 8,650 $ 8,484 $ 8,080Gross profit as % of revenue 23.9 % 23.3 % 22.4%SG&A $ 6,855 $ 6,897 $ 6,639SG&A as % of revenue 18.9 % 19.0 % 18.4%Restructuring charges $ 31 $ 2 $ 4Operating income $ 1,764 $ 1,585 $ 1,437Operating income as % of revenue 4.9 % 4.4 % 4.0% Selected Online Revenue Data:
Online revenue as a % of total segment revenue 13.4 % 11.0 % 9.8%
Comparable online sales % gain (1) 20.8 % 13.5 % 16.7%
(1) Comparable online sales gain is included in the total comparable sales gain (decline).
(2) Represents comparable sales, excluding the estimated revenue benefit from installment billing. In fiscal 2015, we began selling installment billing plans offered by mobile carriers to ourcustomers to complement the more traditional two-year plans. While the two types of contracts have broadly similar overall economics, installment billing plans typically generate higherrevenues due to higher proceeds for devices and higher cost of sales due to lower device subsidies. As we increased our mix of installment billing plans, we had an associated increase inrevenue and cost of goods sold and a decrease in gross profit rate, with gross profit dollars relatively unaffected. Beginning in fiscal 2017, we no longer reported comparable sales,excluding the estimated revenue benefit from installment billing, as the mix of installment billing plans became comparable on a year-over-year basis.
The following table reconciles our Domestic segment stores open at the end of each of the last three fiscal years:
Fiscal 2015 Fiscal 2016 Fiscal 2017
Total Storesat End of
Fiscal Year Stores
Opened StoresClosed
Total Storesat End of
Fiscal Year Stores
Opened StoresClosed
Total Storesat End of
Fiscal Year
Best Buy 1,050 — (13) 1,037 — (11) 1,026Best Buy Mobile stand-alone 367 — (17) 350 — (41) 309Pacific Sales 29 — (1) 28 — — 28Magnolia Audio Video 2 — (2) — — — —
Total Domestic segment stores 1,448 — (33) 1,415 — (52) 1,363
We continuously monitor store performance. As we approach the expiration date of our stores leases, we evaluate various options for each location, includingwhether a store should remain open.
Fiscal 2017 Results Compared With Fiscal 2016
Domestic segment revenue of $36.2 billion in fiscal 2017 decreased 0.3% compared to the prior year. The components of the 0.3% revenue decrease in theDomestic segment in fiscal 2017 were as follows:
Comparable sales impact 0.2 %Non-comparable sales (1) (0.5)%
Total revenue decrease (0.3)%
31

Table of Contents
(1) Non-comparable sales reflects the impact of net store opening and closing activity, as well as the impact of revenue streams not included within our comparable sales calculation, such asprofit share revenue, credit card revenue, gift card breakage, commercial sales and sales of merchandise to wholesalers and dealers.
The net store changes did not have a material impact on our revenue in fiscal 2017, as the majority of closures related to our small-format Best Buy Mobile stand-alone stores. The closing of small-format Best Buy Mobile stores have a significantly smaller impact given their smaller size and limited category focus comparedto our large-format stores.
The profit-share revenue included in our non-comparable sales relate to our extended warranty protection plans that are managed by a third party underwriter. Wemay be eligible to receive profit-sharing payments, depending on the performance of the portfolio. When performance of the portfolio is strong and the claims costto the third party underwriter declines, we are entitled to share in the excess premiums. In fiscal 2017, we recognized $110 million of such profit-share revenue,with an equal impact to gross profit and operating income. In fiscal 2016, we recognized $148 million. The fiscal 2017 profit-share revenue decrease from fiscal2016 reflects reductions to the premiums that we pay to the third party underwriter. In light of the continued impact of these lower premiums, we expect the profitshare payments to continue to decrease in future periods.
In fiscal 2017, Domestic segment online revenue of $4.8 billion increased 20.8% on a comparable basis primarily due to higher conversion rates and increasedtraffic. As a percentage of total Domestic revenue, online revenue increased 240 basis points to 13.4% versus 11.0% last year.
The following table presents the Domestic segment's revenue mix percentages and comparable sales percentage changes by revenue category in fiscal 2017 and2016 :
Revenue Mix Summary Comparable Sales Summary
Year Ended Year Ended
January 28, 2017 January 30, 2016 January 28, 2017 January 30, 2016
Consumer Electronics 34% 32% 5.0 % 4.7 %Computing and Mobile Phones 45% 46% (1.8)% (2.6)%Entertainment 7% 8% (13.8)% (3.6)%Appliances 9% 8% 7.8 % 15.4 %Services 5% 5% (3.3)% (11.6)%Other —% 1% n/a n/a
Total 100% 100% 0.2 % 0.5 %
The following is a description of the notable comparable sales changes in our Domestic segment by revenue category:
• Consumer Electronics: The 5.0% comparable sales increase was primarily due to an increase in the sales of connected home products, streaming devicesand large screen televisions.
• Computing and Mobile Phones: The 1.8% comparable sales decline was primarily due to continued industry declines in tablets and product constraintsin, and to a lesser effect, lower sales of mobile phones. This decline was partially offset by an increase in the sale of computers.
• Entertainment: The 13.8% comparable sales decrease was driven by declines in gaming, music and movies due to continued industry declines.• Appliances: The 7.8% comparable sales gain was a result of continued growth in both large and small appliance sales.• Services: The 3.3% comparable sales decline was primarily due to lower reimbursement revenue from our third party underwriter on extended protection
plan claims. This trend, which primarily related to mobile phones, was a reflection of changes to the design of our extended protection plans in fiscal2016, improvements to our repair and fulfillment operations and industry trends.
Our Domestic segment experienced an increase in gross profit rate to 23.9% in fiscal 2017 from 23.3% in fiscal 2016. This rate increase was primarily due to (1)rate improvements in computing hardware, and (2) an increase in CRT legal settlements, partially offset by (1) lower margins from mobile phones due to changesin device mix, and (2) a decrease in our periodic profit share revenue as described above.
Our Domestic segment SG&A rate slightly decreased to 18.9% of revenue in fiscal 2017 compared to 19.0% of revenue in the prior year. The decrease in rate wasprimarily driven by cost reductions and lower incentive compensation, partially offset by investments in growth initiatives.
32

Table of Contents
Our Domestic segment recorded $31 million of restructuring charges in fiscal 2017 and incurred $2 million of restructuring charges in fiscal 2016 . Therestructuring charges in fiscal 2017 related to the Renew Blue Phase 2 plan that began in the first quarter of fiscal 2017. Refer to Note 4, Restructuring Charges , ofthe Notes to Consolidated Financial Statements, included in Item 8, Financial Statements and Supplementary Data , of this Annual Report on Form 10-K forfurther information about our restructuring activities. Our Domestic segment’s operating income increased $179 million in fiscal 2017 compared to fiscal 2016 . In addition, the operating income rate increased to 4.9%of revenue in fiscal 2017 compared to 4.4% of revenue in the prior year. The increase was driven by the revenue, gross profit rate and SG&A rate improvementsdescribed above. Fiscal 2016 Results Compared With Fiscal 2015
Domestic segment revenue of $36.4 billion in fiscal 2016 increased 0.9% compared to the prior year. This increase was primarily driven by a comparable salesgrowth of 0.5% , which included an estimated 0.6% of revenue benefit associated with installment billing, and a periodic profit sharing benefit based onperformance of our externally managed extended service plan portfolio.
Similar to fiscal 2017, we recognized $148 million of profit-share revenue in fiscal 2016, with an equal impact to gross profit and operating income. The amountrecognized in fiscal 2016 was substantially higher than for prior periods. The unusually strong performance of the portfolio for fiscal 2016, which particularlyrelated to mobile phones, was due to changes to the design of our extended service plans, improvements to our repair and fulfillment operations and industrytrends. These trends have also led to lower revenues from repairs we undertake on behalf of the insurers, as discussed further below.
Domestic segment online revenue of $4.0 billion increased 13.5% on a comparable basis primarily due to higher conversion rates and increased traffic. As apercentage of total Domestic revenue, online revenue increased 120 basis points to 11.0% versus 9.8% in fiscal 2015.
The components of the 0.9% revenue increase in the Domestic segment in fiscal 2016 were as follows:
Comparable sales impact 0.5%Non-comparable sales (1) 0.4%
Total revenue increase 0.9%
(1) Non-comparable sales reflects the impact of revenue streams not included within our comparable sales calculation, such as credit card revenue, gift card breakage, commercial sales andsales of merchandise to wholesalers and dealers.
The net store changes did not have a material impact on our revenue in fiscal 2016, as the majority of closures occurred in the fourth quarter and related to oursmall-format Best Buy Mobile stand-alone stores. The closing of small-format Best Buy Mobile stores have a significantly smaller impact given their smaller sizeand limited category focus compared to our large-format stores.
The following table presents the Domestic segment's revenue mix percentages and comparable sales percentage changes by revenue category in fiscal 2016 and2015 :
Revenue Mix Summary Comparable Sales Summary
Year Ended Year Ended
January 30, 2016 January 31, 2015 January 30, 2016 January 31, 2015
Consumer Electronics 32% 31% 4.7 % 3.7 %Computing and Mobile Phones 46% 47% (2.6)% (0.6)%Entertainment 8% 9% (3.6)% 4.5 %Appliances 8% 7% 15.4 % 7.5 %Services 5% 5% (11.6)% (11.1)%Other 1% 1% n/a n/a
Total 100% 100% 0.5 % 1.0 %
The following is a description of the notable comparable sales changes in our Domestic segment by revenue category:
33

Table of Contents
• Consumer Electronics: The 4.7% comparable sales increase was primarily due to an increase in the sales of large screen televisions, the expansion ofMagnolia Design Center stores-within-a-store, and expanded assortment of streaming devices. This increase was partially offset by industry declines inpoint and shoot cameras and lower sales in small and mid-size televisions.
• Computing and Mobile Phones: The 2.6% comparable sales decline was primarily due to continued industry declines in tablets and to a lesser extentlower demand for mobile phones.
• Entertainment: The 3.6% comparable sales decrease was driven by declines in music and movies due to continued industry declines as well as declinesin gaming hardware.
• Appliances: The 15.4% comparable sales gain was a result of continued growth in major appliances sales as well as the expansion of Pacific Kitchen &Home stores-within-a-store.
• Services: The 11.6% comparable sales decline was primarily due to lower repair revenue from extended protection plan claims. This trend, whichprimarily related to mobile phones, was a reflection of changes to the design of our extended protection plans, improvements to our repair and fulfillmentoperations and industry trends.
Our Domestic segment experienced an increase in gross profit of $ 404 million , or 5.0% , in fiscal 2016 compared to fiscal 2015 . Excluding the $88 million ofCRT/LCD litigation settlement proceeds received in fiscal 2016, we experienced an increase in gross profit of $316 million, or 3.9%. Refer to Note 12,Contingencies and Commitments , in the Notes to the Consolidated Financial Statements, included in Item 8, Financial Statements and Supplementary Data , ofthis Annual Report on Form 10-K for additional information. This rate increase was primarily due to (1) the periodic profit-share revenue described above; (2) rateimprovements in computing hardware driven by our more disciplined promotional strategy; (3) an additional positive mix shift due to significantly decreasedrevenue in the lower-margin tablet category; (4) the positive impact of lower repair revenue (as discussed above), which typically earns a low gross profit rate; (5)an increased mix of higher-margin large screen televisions; and (6) positive revenue impact related to our credit card portfolio. These increases were partiallyoffset by (1) lower rates related to large appliances; (2) a lower rate in the mobile category driven by increased sales of higher priced iconic mobile phones, whichhave higher gross profit dollars but carry a lower gross profit rate; (3) decrease in margin for portable audio products; (4) a decreased mix of higher-margin digitalimaging products; (5) an increased mix of lower-margin wearable devices; and (6) an investment in services pricing.
Our Domestic segment's SG&A increased $ 258 million , or 3.9% , in fiscal 2016 compared to fiscal 2015 . In addition, the SG&A rate increased to 19.0% ofrevenue compared to 18.4% of revenue in the prior year. The increases in SG&A and SG&A rate were primarily driven by investments in growth initiatives, agreater portion of our vendor funding being recorded as an offset to cost of goods sold rather than SG&A and higher incentive compensation. This increase waspartially offset by the implementation of Renew Blue Phase 2 cost reductions. Our Domestic segment recorded $2 million of restructuring charges in fiscal 2016 and incurred $4 million of restructuring charges in fiscal 2015 . Therestructuring charges had an immaterial impact on our operating income rate in fiscal 2016 and fiscal 2015. Refer to Note 4, Restructuring Charges , of the Notesto Consolidated Financial Statements, included in Item 8, Financial Statements and Supplementary Data , of this Annual Report on Form 10-K for furtherinformation about our restructuring activities. Our Domestic segment’s operating income increased $ 148 million in fiscal 2016 compared to fiscal 2015 . In addition, the operating income rate increased to4.4% of revenue in fiscal 2016 compared to 4.0% of revenue in the prior year. The increase was driven by higher revenue and margin and $75 million in netCRT/LCD litigation settlement proceeds received in fiscal 2016, partially offset by the increase in SG&A as described above.
International Segment
During the first quarter of fiscal 2016, we consolidated the Future Shop and Best Buy stores and websites in Canada under the Best Buy brand. This resulted in thepermanent closure of 66 Future Shop stores and the conversion of the remaining 65 Future Shop stores to the Best Buy brand. The costs of implementing thesechanges primarily consisted of lease exit costs, a tradename impairment, property and equipment impairments, employee termination benefits and inventory write-downs.
34

Table of Contents
The following table presents selected financial data for our International segment for each of the past three fiscal years ($ in millions):
International Segment Performance Summary 2017 2016 2015
Revenue $ 3,155 $ 3,163 $ 4,284Revenue decline % (0.3)% (26.2)% (10.4)%Comparable sales % decline (1) n/a n/a (3.5)%Restructuring charges - cost of goods sold $ — $ 3 $ —Gross profit $ 790 $ 707 $ 967Gross profit as % of revenue 25.0 % 22.4 % 22.6 %SG&A $ 692 $ 721 $ 953SG&A as % of revenue 21.9 % 22.8 % 22.2 %Restructuring charges $ 8 $ 196 $ 1Operating income (loss) $ 90 $ (210) $ 13Operating income (loss) as % of revenue 2.9 % (6.6)% 0.3 %
(1) The Canadian brand consolidation has a material impact on a year-over-year basis on the Canadian retail stores and the website. As such, beginning in the first quarter of fiscal 2016through the third quarter of fiscal 2017, all store and website revenue was removed from the comparable sales base, and an International segment (comprised of Canada and Mexico)comparable sales metric for the full year has not been provided. International comparable sales for the fourth quarter of fiscal 2017 was 0.9%.
The following table reconciles our International segment stores open at the end of each of the last three fiscal years:
Fiscal 2015 Fiscal 2016 Fiscal 2017
Total Stores at End of
Fiscal Year Stores Opened
Stores Closed
StoresConverted
Total Stores at End of
Fiscal Year Stores Opened
Stores Closed
Total Stores at End of
Fiscal Year
Canada Future Shop 133 — (68) (65) — — — — Best Buy 71 3 (3) 65 136 — (2) 134 Best Buy Mobile 56 — — — 56 1 (4) 53
Mexico Best Buy 18 — — 18 2 — 20 Express 5 1 — — 6 — (1) 5
Total International segment stores 283 4 (71) — 216 3 (7) 212
Fiscal 2017 Results Compared With Fiscal 2016
International segment revenue of $3.2 billion in fiscal 2017 decreased 0.3% compared to the prior year. The components of the 0.3% revenue decrease in theInternational segment in fiscal 2017 were as follows:
Non-comparable sales (1) 1.8 %Comparable sales impact 0.3 %Impact of foreign currency exchange rate fluctuations (2.4)%
Total revenue decrease (0.3)%
(1) Non-comparable sales reflects the impact of net store opening and closing activity, including the Canadian brand consolidation activity in the first three quarters of fiscal 2017, as well asthe impact of revenue streams not included within our comparable sales calculation, such as certain credit card revenue, gift card breakage and sales of merchandise to wholesalers anddealers, as applicable.
35

Table of Contents
The following table presents the International segment's revenue mix percentages by revenue category in fiscal 2017 and 2016 :
Revenue Mix Summary Year Ended
January 28, 2017 January 30, 2016
Consumer Electronics 31% 31%Computing and Mobile Phones 48% 48%Entertainment 7% 9%Appliances 6% 5%Services 7% 6%Other 1% 1%
Total 100% 100%
As noted above, comparable sales information has not been provided for the International segment for fiscal 2017 or 2016 due to the Canadian brand consolidation.As such, it is also impractical to provide such information on a revenue category basis. However, as noted above, the revenue mix by category has not changedsignificantly from fiscal 2016.
Our International segment experienced a gross profit increase of $83 million , or 11.7% , in fiscal 2017 compared to fiscal 2016 . Excluding the impact of foreigncurrency exchange rate fluctuations, the increase in gross profit was $98 million. The gross profit rate increased to 25.0% in fiscal 2017 from 22.4% of revenue infiscal 2016. This increase was primarily due to the increased promotional activity in fiscal 2016 as a result of the Canada brand consolidation which did not reoccurand to a lesser extent rate growth in computing and home theater.
Our International segment's SG&A decreased $29 million , or 4.0% , in fiscal 2017 compared to the prior year. Excluding the impact of foreign currency exchangerate fluctuations, the decrease in SG&A was $9 million. The SG&A rate decreased to 21.9% in fiscal 2017 from 22.8% of revenue in fiscal 2016. The decrease inSG&A rate was driven by year-over-year sales leverage.
Our International segment recorded $8 million of restructuring charges in fiscal 2017 and incurred $199 million of restructuring charges in fiscal 2016 . The fiscal2017 restructuring charges related to adjustments to our vacant space liabilities outstanding as a result of the Canadian brand consolidation and the Renew Blueplan. The adjustments were due to changes in estimates related to sublease income. The fiscal 2016 restructuring charges primarily related to the Canadian brandconsolidation and consisted of facility closure costs, tradename impairments, property and equipment impairments, and employee termination benefits. Refer toNote 4, Restructuring Charges , of the Notes to Consolidated Financial Statements, included in Item 8, Financial Statements and Supplementary Data , of thisAnnual Report on Form 10-K for further information about our restructuring activities.
Our International segment operating income was $90 million in fiscal 2017 compared to a loss of $210 million in the prior-year period. The improvement inoperating income was primarily driven by lower restructuring costs and gross profit and SG&A rate improvements.
Fiscal 2016 Results Compared With Fiscal 2015
In our International segment, revenue declined 26.2% to $3.2 billion in fiscal 2016 due to (1) the loss of revenue associated with closed stores as part of theCanadian brand consolidation; (2) a negative foreign currency impact of 12.5%; and (3) ongoing softness in the Canadian economy and consumer electronicsindustry.
The components of the International segment's 26.2% revenue decrease in fiscal 2016 were as follows:
Impact of foreign currency exchange rate fluctuations (12.5)%Non-comparable sales (1) (13.7)%
Total revenue decrease (26.2)%
(1) Non-comparable sales reflects the impact of net store opening and closing activity, including the Canadian brand consolidation activity, as well as the impact of revenue streams notincluded within our comparable sales calculation, such as certain credit card revenue, gift card breakage and sales of merchandise to wholesalers and dealers, as applicable.
36

Table of Contents
The following table presents the International segment's revenue mix percentages by revenue category in fiscal 2016 and 2015 :
Revenue Mix Summary Year Ended
January 30, 2016 January 31, 2015
Consumer Electronics 31% 30%Computing and Mobile Phones 48% 49%Entertainment 9% 9%Appliances 5% 5%Services 6% 6%Other 1% 1%
Total 100% 100%
As noted above, comparable sales information has not been provided for the International segment for fiscal 2016 due to the Canadian brand consolidation. Assuch, it is also impractical to provide such information on a revenue category basis. However, as noted above, the revenue mix by category has not changedsignificantly from fiscal 2015.
Our International segment experienced a gross profit decline of $ 260 million , or 26.9% , in fiscal 2016 compared to fiscal 2015 . Excluding the impact of foreigncurrency exchange rate fluctuations, the decrease in gross profit was $141 million. The gross profit rate declined to 22.4% of revenue in fiscal 2016 from 22.6% ofrevenue in fiscal 2015. This decline was primarily due to the disruptive impacts from the Canadian brand consolidation and increased promotional activity inCanada.
Our International segment's SG&A decreased $ 232 million , or 24.3% , in fiscal 2016 compared to the prior year. Excluding the impact of foreign currencyexchange rate fluctuations, the decrease in SG&A was $115 million. However, the SG&A expense rate increased to 22.8% of revenue in fiscal 2016 from 22.2% ofrevenue in fiscal 2015. The decrease in SG&A expense was driven by the elimination of expenses associated with closed stores as part of the Canadian brandconsolidation. The increase in the SG&A rate was driven by year-over-year sales deleverage.
Our International segment recorded $199 million of restructuring charges in fiscal 2016 and incurred $1 million of restructuring charges in fiscal 2015 . The fiscal2016 restructuring charges primarily related to the Canadian brand consolidation and consisted of facility closure costs, tradename impairments, property andequipment impairments, and employee termination benefits. The restructuring charges in fiscal 2015 had an immaterial impact on our operating income rate. Referto Note 4, Restructuring Charges , of the Notes to Consolidated Financial Statements, included in Item 8, Financial Statements and Supplementary Data , of thisAnnual Report on Form 10-K for further information about our restructuring activities.
Our International segment operating loss was $210 million in fiscal 2016 compared to income of $13 million in the prior-year period. The decline in operatingincome was driven primarily by a decrease in revenue and gross profit rate and restructuring charges, partially offset by lower SG&A expenses as described above.
Additional Consolidated Results
Other Income (Expense)
In fiscal 2017, our gain on sale of investments was $3 million compared to $2 million and $13 million in fiscal 2016 and fiscal 2015, respectively. These gainswere due to the sale of cost-based investments.
In fiscal 2017, our investment income and other was $31 million, compared to $13 million in fiscal 2016. The increase in fiscal 2017 was primarily due to higherinterest rates in the U.S. In fiscal 2016, our investment income and other was $13 million, compared to $14 million in fiscal 2015. The decrease in fiscal 2016 wasprimarily due to lower interest rates in Canada and the unfavorable impact of foreign currency translation.
Interest expense was $72 million in fiscal 2017, compared to $80 million in fiscal 2016 due to a lower debt balance for a majority of the year caused by the March2016 payment of our $350 million principal amount notes. Interest expense was $80 million in fiscal 2016, compared to $90 million in fiscal 2015. The decrease ininterest expense was primarily due to swapping a portion of our fixed rate debt to floating rate, which was lower than our fixed rate. Refer to Note 6, DerivativeInstruments , of the Notes to Consolidated Financial Statements, included in Item 8, Financial Statements and Supplementary Data , of this Annual Report onForm 10-K for additional information.
37

Table of Contents
Income Tax Expense
Income tax expense increased to $609 million in fiscal 2017, compared to $503 million in fiscal 2016, primarily as a result of an increase in pre-tax earnings,partially offset by a higher mix of pre-tax income from foreign operations and the resolution of certain tax matters in the current year. Our effective income tax rate("ETR") for fiscal 2017 was 33.5%, compared to a rate of 38.4% in fiscal 2016. The decrease in the ETR was primarily due to a higher mix of pre-tax income fromforeign operations and the resolution of certain tax matters in the current year.
Income tax expense increased to $503 million in fiscal 2016, compared to a tax expense of $141 million in fiscal 2015, primarily due to a $353 million discretebenefit related to reorganizing certain European legal entities in fiscal 2015, as well as a lower mix of pre-tax earnings from foreign operations in fiscal 2016,partially offset by a decrease in pre-tax earnings in fiscal 2016. Our ETR for fiscal 2016 was 38.4%, compared to a rate of 10.1% in fiscal 2015. Excluding theimpact of reorganizing certain European legal entities, the ETR would have been 35.6% in fiscal 2015. Refer to Note 10, Income Taxes , of the Notes toConsolidated Financial Statements, included in Item 8, Financial Statements and Supplementary Data , of this Annual Report on Form 10-K for additionalinformation.
Our consolidated ETR is impacted by the statutory income tax rates applicable to each of the jurisdictions in which we operate. As our foreign earnings aregenerally taxed at lower statutory rates than the 35.0% U.S. federal statutory rate, changes in the proportion of our consolidated taxable earnings originating inforeign jurisdictions impact our consolidated effective rate. Our foreign earnings have been indefinitely reinvested outside the U.S. and are not subject to currentU.S. income tax.
Discontinued Operations
Discontinued operations are primarily comprised of Five Star within our International segment. Gain from discontinued operations in fiscal 2017 was $21 millionprimarily related to the sale of the remaining Five Star property assets that were held for sale as of January 30, 2016. Gain from discontinued operations in fiscal2016 of $90 million was primarily related to the gain recognized on the sale of Five Star. Loss from discontinued operations of $11 million in fiscal 2015 wasdriven by other charges related to Five Star.
38

Table of Contents
Non-GAAP Financial Measures
The following table reconciles operating income, effective tax rate, net earnings from continuing operations and diluted earnings per share from continuingoperations (GAAP financial measures) for the periods presented to non-GAAP operating income, non-GAAP effective tax rate, non-GAAP net earnings fromcontinuing operations and non-GAAP diluted earnings per share from continuing operations (non-GAAP financial measures) for the periods presented ($ inmillions, except per share amounts):
Fiscal Year
2017 2016 2015
Operating income $ 1,854 $ 1,375 $ 1,450 Net CRT/LCD settlements (1) (161) (77) — Restructuring charges - COGS (2) — 3 — Other Canada brand consolidation charges - SG&A (3) 1 6 — Non-restructuring asset impairments - SG&A (4) 26 61 42 Restructuring charges (2) 39 198 5
Non-GAAP operating income $ 1,759 $ 1,566 $ 1,497
Income tax expense $ 609 $ 503 $ 141 Effective tax rate 33.5% 38.4% 10.1% Income tax impact of Europe legal entity reorganization (5) — — 353 Income tax impact of Non-GAAP adjustments (6) (38) 30 11
Non-GAAP income tax expense $ 571 $ 533 $ 505
Non-GAAP effective tax rate 33.2% 35.4% 35.5% Net earnings from continuing operations $ 1,207 $ 807 $ 1,246 Net CRT/LCD settlements (1) (161) (77) — Restructuring charges - COGS (2) — 3 — Other Canada brand consolidation charges - SG&A (3) 1 6 — Non-restructuring asset impairments - SG&A (4) 26 61 42 Restructuring charges (2) 39 198 5 (Gain) loss on sale of investments (2) 5 (11) Income tax impact of Europe legal entity reorganization (5) — — (353) Income tax impact of Non-GAAP adjustments (6) 38 (30) (11)
Non-GAAP net earnings from continuing operations $ 1,148 $ 973 $ 918
Diluted earnings per share from continuing operations $ 3.74 $ 2.30 $ 3.53 Per share impact of net CRT/LCD settlements (1) (0.50) (0.22) — Per share impact of restructuring charges - COGS (2) — 0.01 — Per share impact of other Canada brand consolidation charges - SG&A (3) 0.01 0.02 — Per share impact of non-restructuring asset impairments - SG&A (4) 0.08 0.17 0.12 Per share impact of restructuring charges (2) 0.12 0.58 0.01 Per share impact of (gain) loss on sale of investments (0.01) 0.01 (0.03) Per share income tax effect of Europe legal entity reorganization (5) — — (1.00) Per share income tax impact of Non-GAAP adjustments (6) 0.12 (0.09) (0.03)
Non-GAAP diluted earnings per share from continuing operations $ 3.56 $ 2.78 $ 2.60
(1) Represents cathode ray tube ("CRT") and LCD litigation settlements reached, net of related legal fees and costs. Settlements related to products purchased and sold in prior fiscal years. Forthe fiscal year ended January 28, 2017, the full balance related to the United States. For the fiscal year ended January 30, 2016, $75 million related to the United States and $2 millionrelated to Canada. Refer to Note 12, Contingencies and Commitments , in the Notes to Consolidated Financial Statements, included in Item 8, Financial Statements and SupplementaryData , of this Annual Report on Form 10-K for further information.
39

Table of Contents
(2) Refer to Note 4, Restructuring Charges , in the Notes to Consolidated Financial Statements, included in Item 8, Financial Statements and Supplementary Data , of this Annual Report onForm 10-K for additional information regarding the nature of these charges. For the fiscal year ended January 28, 2017, $31 million related to the United States and $8 million related toCanada. For the fiscal year ended January 30, 2016, $2 million related to the United States and $199 million related to Canada. For the fiscal year ended January 31, 2015, $4 millionrelated to the United States and $1 million related to Canada.
(3) Represents charges related to the Canadian brand consolidation initiated in the first quarter of fiscal 2016, primarily due to retention bonuses and other store-related costs that were a directresult of the consolidation but did not qualify as restructuring charges.
(4) Refer to Note 3, Fair Value Measurements , in the Notes to Consolidated Financial Statements, included in Item 8, Financial Statements and Supplementary Data , of this Annual Reporton Form 10-K for additional information regarding the nature of these charges. For the fiscal year ended January 28, 2017, $24 million related to the United States and $2 million related toCanada. For the fiscal year ended January 30, 2016, $58 related to the United States and $3 million related to Canada. For the fiscal year ended January 31, 2015, $31 million related to theUnited States and $11 million related to Canada.
(5) Represents the acceleration of a non-cash tax benefit of $353 million as a result of reorganizing certain European legal entities to simplify our overall structure in the first quarter of fiscal2015.
(6) Income tax impact of non-GAAP adjustments is the summation of the calculated income tax charge related to each non-GAAP non-income tax adjustment. The non-GAAP adjustmentsrelate primarily to adjustments in the United States and Canada. As such, the income tax charge is calculated using the statutory rates of 38.0% for the United States and 26.4% for Canada,applied to the Non-GAAP adjustments of each country.
Non-GAAP operating income for fiscal 2017 increased $193 million compared to fiscal 2016, and non-GAAP operating income as a percent of revenue increasedto 4.5%. The increase was driven by increased Consolidated gross profit rate and continued SG&A cost reductions in both segments primarily due to the realizationof our Renew Blue Phase 2 cost reduction initiatives and tighter expense management. The increase in non-GAAP operating income resulted in a year-over-yearincrease in non-GAAP net earnings from continuing operations and non-GAAP diluted earnings per share from continuing operations in fiscal 2016 compared tofiscal 2015.
Non-GAAP operating income for fiscal 2016 increased $69 million compared to fiscal 2015. The increase was driven by increased revenue in the Domesticsegment, increased Consolidated gross profit rate and continued SG&A cost reductions in both segments primarily due to the realization of our Renew Blue Phase2 cost reduction initiatives and tighter expense management. The increase in non-GAAP operating income resulted in a year-over-year increase in non-GAAP netearnings from continuing operations and non-GAAP diluted earnings per share from continuing operations in fiscal 2016 compared to fiscal 2015.
Liquidity and Capital Resources
Summary
We closely manage our liquidity and capital resources. Our liquidity requirements depend on key variables, including the level of investment required to supportour business strategies, the performance of our business, capital expenditures, credit facilities and short-term borrowing arrangements and working capitalmanagement. Capital expenditures and share repurchases are a component of our cash flow and capital management strategy which, to a large extent, we can adjustin response to economic and other changes in our business environment. We have a disciplined approach to capital allocation, which focuses on investing in keypriorities that support our Renew Blue and Best Buy 2020: Building the New Blue strategies.
The following table summarizes our cash and cash equivalents and short-term investments at January 28, 2017, and January 30, 2016 ($ in millions):
January 28, 2017 January 30, 2016
Cash and cash equivalents $ 2,240 $ 1,976Short-term investments 1,681 1,305
Total cash and cash equivalents and short-term investments $ 3,921 $ 3,281
Existing cash and cash equivalents and short-term investments as well as cash generated from operations were sufficient to fund share repurchases, capitalexpenditures, dividends and repayment of our 2016 Notes in fiscal 2017 without the need to utilize our credit facilities or other debt arrangements.
40

Table of Contents
Cash Flows
The following table summarizes our cash flows from operating, investing and financing activities for each of the past three fiscal years ($ in millions):
2017 2016 2015
Total cash provided by (used in): Operating activities $ 2,545 $ 1,322 $ 1,935Investing activities (887) (419) (1,712)Financing activities (1,404) (1,515) (223)Effect of exchange rate changes on cash 10 (38) (52)
Increase (decrease) in cash and cash equivalents $ 264 $ (650) $ (52)
Operating Activities
The increase in cash provided by operating activities in fiscal 2017 compared to fiscal 2016 was primarily due to the timing of inventory purchasing and paymentsand increased earnings. During fiscal 2017 we purchased and paid for inventory later in the Holiday season than in the prior year, discussed below, positivelyimpacting operating cash flows. This was partially offset by the timing of collection of receivables.
The decrease in cash provided by operating activities in fiscal 2016 compared to fiscal 2015 was primarily due to the timing of inventory receipts and income taxpayments. During fiscal 2016, we decided to bring Holiday inventory in early and the Super Bowl shifted to the first quarter of fiscal 2016, which caused us to holdour inventory longer and settle our accounts payable related to that inventory prior to year-end. In addition, we paid more income taxes in fiscal 2016 primarily dueto the timing of when payments were made.
Investing Activities
The increase in cash used in investing activities in fiscal 2017 compared to fiscal 2016 was primarily due to an increase in the net investment into short-terminvestments in fiscal 2017.
The decrease in cash used in investing activities in fiscal 2016 compared to fiscal 2015 was primarily due to increased sales of short-term investments partiallyoffset by capital expenditures (see Capital Expenditures below).
Financing Activities
The decrease in cash used in financing activities in fiscal 2017 compared to fiscal 2016 was primarily due to a decline in the number of shares repurchased, whichwas substantially offset by the repayment of our $350 million principal amount of notes due March 15, 2016.
The increase in cash used by financing activities in fiscal 2016 compared to fiscal 2015 was primarily due to share repurchases and dividend payments. In fiscal2016, we purchased $1.0 billion of common stock as part of our June 2011 share repurchase program. In addition, we increased our normal dividend from 2015 to2016 and paid a special dividend in 2016.
Sources of Liquidity
Funds generated by operating activities, available cash and cash equivalents, short-term investments, our credit facilities, and other debt arrangements are our mostsignificant sources of liquidity. We believe our sources of liquidity will be sufficient to fund operations and anticipated capital expenditures, strategic initiatives,share repurchases and dividends. However, in the event our liquidity is insufficient, we may be required to limit our spending. There can be no assurance that wewill continue to generate cash flows at or above current levels or that we will be able to maintain our ability to borrow under our existing credit facilities or obtainadditional financing, if necessary, on favorable terms.
On June 26, 2016, we entered into a $1.25 billion five-year senior unsecured revolving credit facility (the "Five-Year Facility Agreement") with a syndicate ofbanks. The Five-Year Facility Agreement replaced the previous $1.25 billion unsecured revolving credit facility (the "Previous Facility"), which was originallyscheduled to expire in June 2019, but was terminated on June 27, 2016. The Five-Year Facility Agreement permits borrowings up to $1.25 billion and expires inJune 2021. At January
41

Table of Contents
28, 2017, and January 30, 2016, we had no borrowings outstanding under the Five-Year Facility Agreement nor its predecessor the Previous Facility. Refer to Note5, Debt , of the Notes to Consolidated Financial Statements, included in Item 8, Financial Statements and Supplementary Data , of this Annual Report on Form 10-K for further information about our credit facilities.
Our ability to access our revolving credit facility under the Five-Year Facility Agreement is subject to our compliance with the terms and conditions of the facility,including financial covenants. The financial covenants require us to maintain certain financial ratios. At January 28, 2017 , we were in compliance with all suchfinancial covenants. If an event of default were to occur with respect to any of our other debt, it would likely constitute an event of default under our facilities aswell.
An interest coverage ratio represents the ratio of pre-tax earnings before fixed charges (interest expense and the interest portion of rent expense) to fixed charges.Our interest coverage ratio, calculated as reported in Exhibit No. 12.1 of this Annual Report on Form 10-K, was 6.97 and 5.16 in fiscal 2017 and fiscal 2016 ,respectively. Our credit ratings and outlooks at March 20, 2017 , are summarized below. In fiscal 2017, Standard & Poor's Rating Services upgraded its long-term credit ratingfrom BB+ to BBB- with a Stable outlook; Moody's Investors Service, Inc. affirmed its long-term credit rating of Baa1 with a Stable outlook; and Fitch RatingsLimited affirmed its long-term credit rating of BBB- with a Stable outlook.
Rating Agency Rating Outlook
Standard & Poor's BBB- StableMoody's Baa1 StableFitch BBB- Stable Credit rating agencies review their ratings periodically and, therefore, the credit rating assigned to us by each agency may be subject to revision at any time.Accordingly, we are not able to predict whether our current credit ratings will remain as disclosed above. Factors that can affect our credit ratings include changesin our operating performance, the economic environment, conditions in the retail and consumer electronics industries, our financial position and changes in ourbusiness strategy. If further changes in our credit ratings were to occur, they could impact, among other things, interest costs for certain of our credit facilities, ourfuture borrowing costs, access to capital markets, vendor financing terms and future new-store leasing costs. Restricted Cash Our liquidity is also affected by restricted cash balances that are pledged as collateral or restricted to use for general liability insurance and workers' compensationinsurance. Restricted cash and cash equivalents related to our continuing operations, which are included in other current assets, remained relatively flat at $193million and $185 million at January 28, 2017 , and January 30, 2016 , respectively. Capital Expenditures Our capital expenditures typically include investments in our stores, distribution capabilities and information technology enhancements (including e-commerce).During fiscal 2017, we invested $582 million in property and equipment, primarily related to upgrading our information technology systems and capabilities andstore-related projects. The following table presents our capital expenditures for each of the past three fiscal years ($ in millions):
2017 2016 2015
New stores $ 3 $ 5 $ 3Store-related projects (1) 208 241 177E-commerce and information technology 371 390 355Other — 13 16
Total capital expenditures (2)(3) $ 582 $ 649 $ 551
(1) Includes store remodels and various merchandising projects.
(2) Excludes $10 million for fiscal 2015 related to Five Star.
(3) Total capital expenditures exclude non-cash capital expenditures of $48 million , $92 million and $14 million for fiscal 2017 , fiscal 2016 and 2015 , respectively. Non-cash capitalexpenditures are comprised of capitalized leases, as well as additions to property and equipment included in accounts payable.
42

Table of Contents
In fiscal 2018, we estimate cash capital expenditures of approximately $650 million to $700 million, with the focus on retail store, e-commerce and informationtechnology projects.
Debt and Capital
In March 2016, we repaid our $350 million principal amount of notes due March 15, 2016 (the "2016 Notes"), using existing cash resources. As of January 28,2017, we have $500 million principal amount of notes due August 1, 2018 (the "2018 Notes") and $650 million principal amount of notes due March 15, 2021 (the"2021 Notes") outstanding. Refer to Note 5, Debt , in the Notes to Consolidated Financial Statements, included in Item 8, Financial Statements and SupplementaryData , of this Annual Report on Form 10-K for further information about our 2016 Notes, 2018 Notes and 2021 Notes.
Share Repurchases and Dividends
We repurchase our common stock and pay dividends pursuant to programs approved by our Board of Directors ("Board"). Our long-term capital allocation strategyis to first fund operations and investments in growth and then return excess cash over time to shareholders through dividends and share repurchases whilemaintaining investment grade credit metrics.
On March 1, 2017, we announced our intent to repurchase $3.0 billion shares over the next two years. In order to execute this plan, our Board approved a new $5.0billion share repurchase authorization in February 2017. This share repurchase program supersedes the previous $5.0 billion authorization dated June 2011, whichhad $2.2 billion remaining as of January 28, 2017. There is no expiration date governing the period over which we can repurchase shares under the February 2017share repurchase program. Repurchased shares are retired and constitute authorized but unissued shares.
The following table presents our share repurchase history for each of the past three fiscal years (in millions, except per share amounts):
2017 2016 (1) 2015
Total cost of shares repurchased $ 751 $ 1,000 $ —Average price per share $ 35.54 $ — $ —
Number of shares repurchased21.1 32.8 —
(1) Share repurchases included the use of an accelerated share repurchase contract. Refer to Note 7, Shareholders' Equity , of the Notes to Consolidated Financial Statements, included in Item8, Financial Statements and Supplementary Data , of this Annual Report on Form 10-K for further information.
In fiscal 2004, our Board initiated the payment of a regular quarterly cash dividend on common stock. A quarterly cash dividend has been paid in each subsequentquarter. The payment of cash dividends is subject to customary legal and contractual restrictions. The following table presents our dividend activity for each of thepast three fiscal years (in millions, except per share amounts):
2017 2016 2015
Regular quarterly cash dividends per share $ 1.12 $ 0.92 $ 0.72Special cash dividends per share (1) 0.45 0.51 —
Total cash dividends per share $ 1.57 $ 1.43 $ 0.72
Cash dividends declared and paid $ 505 $ 499 $ 251(1) Special cash dividends are authorized by our Board of Directors and issued upon their discretion. Dividend paid in fiscal 2017 related to the net after-tax proceeds from certain legal
settlements and asset disposals, while the dividends paid in fiscal 2016 related to the net after-tax proceeds from LCD-related legal settlements.
Dividends declared and paid in fiscal 2017 were relatively unchanged from fiscal 2016, noting that the quarterly dividend per share increased from $0.23 in fiscal2016 to $0.28 in fiscal 2017. The increase in the regular dividend rate was substantially offset by fewer common shares, due to a return of capital to shareholdersthrough share repurchases, and a smaller special dividend. Dividends declared and paid in fiscal 2016 increased compared to the prior year due to an increase in thequarterly dividend per share increase from $0.18 in fiscal 2015 to $0.23 in fiscal 2016 and the payment of a special dividend in fiscal 2016.
On March 1, 2017, we announced a 21.0% increase in the regular quarterly dividend to $0.34 per share.
43

Table of Contents
Other Financial Measures
Our current ratio, calculated as current assets divided by current liabilities, was 1.5 as of January 28, 2017, compared to 1.4 at the end of fiscal 2016. The highercurrent ratio in fiscal 2017 was driven by an increase in cash and short-term investments, related to our higher earnings, and a decrease in current portion of long-term debt related to the payment of our 2016 Notes, partially offset by an increase in accounts payable related to the timing of our inventory purchases.
Our debt to earnings ratio was 1.1 as of January 28, 2017 , compared to 2.1 as of January 30, 2016 , due to higher earnings in the current year and a reduction indebt related to the payment of our 2016 Notes. Our non-GAAP debt to EBITDAR ratio, which includes capitalized operating lease obligations in its calculation,was 1.6 and 1.8 as of January 28, 2017 , and January 30, 2016 , respectively. The decrease in the ratio was due to a decrease in debt and capitalized operating leaseobligations and an increase in earnings.
Commencing in fiscal 2017, we modified the multiple used to calculate our estimated capitalized operating lease obligation included in our non-GAAP debtcalculation. Due to changes in the average remaining lease life of our operating lease portfolio, we have lowered the multiple used from eight times annual rentexpense to five times annual rent expense. The multiple of five aligns with the multiple used by one of the nationally recognized credit rating agencies whenevaluating the creditworthiness of companies within the retail sector. Prior periods presented have been adjusted to use this new multiple.
Our non-GAAP debt to EBITDAR ratio is calculated as follows:
Non-GAAP debt to EBITDAR =Non-GAAP debt
Non-GAAP EBITDAR
The most directly comparable GAAP financial measure to our non-GAAP debt to EBITDAR ratio is our debt to net earnings ratio, which excludes capitalizedoperating lease obligations from debt in the numerator of the calculation and does not adjust net earnings in the denominator of the calculation.
The following table presents a reconciliation of our debt to net earnings ratio to our non-GAAP debt to EBITDAR ratio for continuing operations ($ in millions):
2017 (1) 2016 (1)
Debt (including current portion) $ 1,365 $ 1,734Capitalized operating lease obligations (5 times rental expense) (2) 3,872 3,916
Non-GAAP debt $ 5,237 $ 5,650
Net earnings from continuing operations $ 1,207 $ 807Other income (expense) (including interest expense, net) 38 65Income tax expense 609 503Depreciation and amortization expense 654 656Rental expense 774 783Restructuring charges and other (3) 65 263
Non-GAAP EBITDAR $ 3,347 $ 3,077
Debt to net earnings ratio 1.1 2.1Non-GAAP debt to EBITDAR ratio 1.6 1.8
(1) Debt is reflected as of the balance sheet dates for each of the respective fiscal periods, while rental expense and the other components of non-GAAP EBITDAR represent activity for the12 months ended January 28, 2017 and January 30, 2016 .
(2) The multiple of five times annual rental expense in the calculation of our capitalized operating lease obligations is the multiple used for the retail sector by one of the nationally recognizedcredit rating agencies that rate our creditworthiness, and we consider it to be an appropriate multiple for our lease portfolio. Historically, we used a capitalized lease multiple of eight timesannual rent expense; however, due to changes in the average remaining lease life of our operating leases, we have lowered the multiple to five. The prior period calculation has beenupdated to reflect the use of the changes.
(3) Includes the impact of restructuring charges and non-restructuring asset impairments. Refer to Note 3, Fair Value Measurements , and Note 4, Restructuring Charges , in the Notes toConsolidated Financial Statements, included in Item 8, Financial Statements and Supplementary Data , of this Annual Report on Form 10-K for additional information regarding the natureof these charges.
44

Table of Contents
Off-Balance-Sheet Arrangements and Contractual Obligations
Other than operating leases, we do not have any off-balance-sheet financing. A summary of our operating lease obligations by fiscal year is included in the"Contractual Obligations" table below. Additional information regarding our operating leases is available in Item 2, Properties , and Note 8, Leases , of the Notesto Consolidated Financial Statements, included in Item 8, Financial Statements and Supplementary Data , of this Annual Report on Form 10-K.
The following table presents information regarding our contractual obligations as of January 28, 2017, with payments due by period ($ in millions):
Payments Due by Period
Contractual Obligations Total Less Than
1 Year 1-3 Years 3-5 Years More Than
5 Years
Long-term debt obligations (1) $ 1,150 $ — $ 500 $ 650 $ —Capital lease obligations 36 9 11 5 11Financing lease obligations 226 46 76 48 56Interest payments (2) 192 60 87 45 —Operating lease obligations (3) 3,125 803 1,222 696 404Purchase obligations (4) 1,797 1,752 43 2 —Unrecognized tax benefits (5) 374 Deferred compensation (6) 31
Total $ 6,931 $ 2,670 $ 1,939 $ 1,446 $ 471
Note: For additional information refer to Note 5, Debt ; Note 8, Leases ; Note 10, Income Taxes ; and Note 12, Contingencies and Commitments , of the Notes to Consolidated FinancialStatements, included in Item 8, Financial Statements and Supplementary Data , of this Annual Report on Form 10-K.
(1) Represents principal amounts only and excludes interest rate swap valuation adjustments.
(2) Interest payments related to our 2018 Notes and 2021 Notes include the fixed interest rate payments for the balances not impacted by our interest rate swap and the variable interest ratepayments for the balances included in our interest rate swap. For additional information refer to Note 6, Derivative Instruments , of the Notes to Consolidated Financial Statements,included in Item 8, Financial Statements and Supplementary Data , of this Annual Report on Form 10-K.
(3) Operating lease obligations do not include payments to landlords covering real estate taxes and common area maintenance. These charges, if included, would increase total operating leaseobligations by $1.0 billion at January 28, 2017 .
(4) Purchase obligations include agreements to purchase goods or services that are enforceable, are legally binding and specify all significant terms, including fixed or minimum quantities tobe purchased; fixed, minimum or variable price provisions; and the approximate timing of the transaction. Purchase obligations do not include agreements that are cancelable withoutpenalty. Additionally, although they are not legally binding agreements, we included open purchase orders in the table above. Substantially all open purchase orders are fulfilled within30 days.
(5) Unrecognized tax benefits relate to uncertain tax positions. As we are not able to reasonably estimate the timing of the payments or the amount by which the liability will increase ordecrease over time, the related balances have not been reflected in the "Payments Due by Period" section of the table.
(6) Included in long-term liabilities on our Consolidated Balance Sheet at January 28, 2017 , was a $ 31 million obligation for deferred compensation. As the specific payment dates for thedeferred compensation are unknown, the related balances have not been reflected in the "Payments Due by Period" section of the table.
Additionally, we have $1.25 billion in undrawn capacity on our credit facilities at January 28, 2017 , which if drawn upon, would be included as short-term debt inour Consolidated Balance Sheets.
Critical Accounting Estimates
Our consolidated financial statements are prepared in accordance with GAAP. The preparation of our financial statements requires us to make assumptions andestimates about future events and apply judgments that affect the reported amounts of assets, liabilities, revenue, expenses and the related disclosures. We base ourassumptions, estimates and judgments on historical experience, current trends and other factors that management believes to be relevant at the time ourconsolidated financial statements are prepared. On a regular basis, we review the accounting policies, assumptions, estimates and judgments to ensure that ourfinancial statements are presented fairly and in accordance with GAAP. However, because future events and their effects cannot be determined with certainty,actual results could differ from our assumptions and estimates, and such differences could be material.
45

Table of Contents
Our significant accounting policies are discussed in Note 1, Summary of Significant Accounting Policies , of the Notes to Consolidated Financial Statements,included in Item 8, Financial Statements and Supplementary Data , of this Annual Report on Form 10-K. We believe that the following accounting estimates arethe most critical to aid in fully understanding and evaluating our reported financial results. These estimates require our most difficult, subjective or complexjudgments, because they relate to matters that are inherently uncertain. We have reviewed these critical accounting estimates and related disclosures with the AuditCommittee of our Board.
Except where noted, we have not made any material changes to the accounting methodologies for the areas described below.
Inventory
We value our inventory at the lower of cost or market through the establishment of markdown and inventory loss adjustments. Markdown adjustments reflect theexcess of cost over the net proceeds we expect to realize from the ultimate sale or other disposal of inventory and establish a new cost basis. Subsequent changes infacts or circumstances do not result in the reversal of previously recorded markdowns or an increase in that newly established cost basis. Markdown adjustmentsinvolve uncertainty because the calculations require management to make assumptions and to apply judgment regarding factors such as forecast consumer demand,the promotional environment and technological obsolescence.
We do not believe there is a reasonable likelihood that there will be a material change in the future estimates or assumptions we use to calculate our markdownadjustments. However, if actual outcomes are different than we anticipated, we may be exposed to losses or gains that could be material. A 10% change in ourmarkdown adjustment at January 28, 2017 , would have affected net earnings by approximately $8 million in fiscal 2017 .
Vendor Allowances
We receive allowances from certain vendors through a variety of programs and arrangements. We treat a substantial majority of these allowances as an offset to thecost of the product or services provided. Sell-through allowances are collected when inventory is sold to customers and recognized as a reduction in cost of sales atthat time. Certain other types of funding, most notably receipt-based allowances, are collected when we take receipt of inventory and deferred as a reduction ofinventory until inventory is sold. The estimation of the deferral for these types of funding is complex and requires detailed analysis of factors such as product andvendor mix, inventory turn and a range of allowance programs.
We do not believe there is a reasonable likelihood that there will be a material change in the estimates or assumptions we use to calculate our vendor fundingdeferral. A 10% difference in our vendor funding deferral at January 28, 2017 , would have affected net earnings by approximately $23 million in fiscal 2017 .
We also receive vendor allowances for achieving certain volume targets. These vendor allowances are accrued as earned over the incentive period, based onestimates of purchases or sales. Amounts accrued throughout the program year could require adjustment if actual purchase or sales volumes differ from projectedvolumes, especially in the case of programs that provide for increased funding when graduated volume tiers are met. We believe that our estimate of vendorallowances earned based on expected volume of purchases or sales over the incentive period is an accurate reflection of the ultimate allowances to be receivedfrom our vendors. Since most volume-based programs apply to a calendar year or our fiscal year, the amount of judgment required as of any fiscal year end isminimal.
Property and Equipment Impairments
Property and equipment assets are evaluated for impairment whenever events or changes in circumstances indicate that the carrying value may not be recoverable.
When evaluating property and equipment assets with impairment indicators for potential impairment, we first compare the carrying value of the asset to itsestimated undiscounted future cash flows. If the sum of the estimated undiscounted future cash flows is less than the carrying value of the asset, we calculate animpairment loss. The impairment loss calculation compares the carrying value of the asset to its estimated fair value, which is typically based on estimateddiscounted future cash flows. We recognize an impairment loss if the amount of the asset's carrying value exceeds the asset's estimated fair value. If we recognizean impairment loss, the adjusted carrying amount of the asset becomes its new cost basis. For a depreciable asset, the new cost basis is depreciated over theremaining useful life of that asset.
When reviewing property and equipment assets for impairment, we group assets with other assets at the lowest level for which identifiable cash flows are largelyindependent of the cash flows of other assets and liabilities. For assets deployed at store
46

Table of Contents
locations, we review for impairment at the individual store level. These reviews involve comparing the carrying value of all property and equipment located at eachstore to the net cash flow projections for each store. In addition, we conduct separate impairment reviews at other levels as appropriate. For example, a shared assetsuch as a distribution center or an IT asset would be evaluated by reference to the aggregate assets and projected cash flows of all areas of the businesses utilizingthose shared assets.
Our impairment loss calculations require management to make assumptions and to apply judgment in order to estimate fair values, including estimating cash flowsand useful lives and selecting a discount rate that reflects the risk inherent in future cash flows. If actual results are not consistent with our estimates andassumptions we may be exposed to impairments that could be material. We do not believe there is a reasonable likelihood that there will be a material change inthe estimates or assumptions we use to calculate property and equipment asset impairment losses.
Goodwill
Goodwill is not amortized but is evaluated for impairment annually in the fiscal fourth quarter or whenever events or changes in circumstances indicate thecarrying value may not be recoverable.
We test for goodwill impairment at the reporting unit level and our reporting units are the components of operating segments which constitute businesses for whichdiscrete financial information is available and is regularly reviewed by segment management. Our detailed impairment testing involves comparing the fair value ofeach reporting unit to its carrying value, including goodwill. Fair value reflects the price a market participant would be willing to pay in a potential sale of thereporting unit and is based on discounted cash flows or relative market-based approaches. If the fair value exceeds carrying value, then it is concluded that nogoodwill impairment has occurred. If the carrying value of the reporting unit exceeds its fair value, a second step is required to measure possible goodwillimpairment loss. The second step includes hypothetically valuing the tangible and intangible assets and liabilities of the reporting unit as if the reporting unit hadbeen acquired in a business combination. Then, the implied fair value of the reporting unit's goodwill is compared to the carrying value of that goodwill. If thecarrying value of the reporting unit's goodwill exceeds the implied fair value of the goodwill, we recognize an impairment loss in an amount equal to the excess,not to exceed the carrying value.
The carrying value of goodwill at January 28, 2017 , was $425 million, which related entirely to our Domestic segment. In fiscal 2017 , we determined that theexcess of fair value over carrying value was substantial. We do not believe there is a reasonable likelihood that there will be a material change in the futureestimates or assumptions we use to test for impairment losses on goodwill. However, if actual results are not consistent with our estimates or assumptions, we maybe exposed to an impairment charge that could be material.
Tax Contingencies
Our income tax returns, like those of most companies, are periodically audited by domestic and foreign tax authorities. These audits include questions regardingour tax filing positions, including the timing and amount of income and deductions and the allocation of income among various tax jurisdictions. At any time,many tax years are subject to audit by various tax authorities. In evaluating the exposures associated with our various tax filing positions, we may record a liabilityfor such exposures. A number of years may elapse before a particular matter, for which we have established a liability, is audited and fully resolved or clarified.We adjust our liability for unrecognized tax benefits and income tax provisions in the period in which an uncertain tax position is effectively settled, the statute oflimitations expires for the relevant taxing authority to examine the tax position or when more information becomes available.
Our liability for unrecognized tax benefits contains uncertainties because management is required to make assumptions and apply judgment to estimate theexposures associated with our various filing positions.
Our effective income tax rate is also affected by changes in tax law, the tax jurisdiction of new stores or business ventures, the level of earnings and the results oftax audits.
Although we believe that the judgments and estimates discussed herein are reasonable, actual results could differ, and we may be exposed to losses or gains thatcould be material.
To the extent we prevail in matters for which a liability has been established, or are required to pay amounts in excess of our established liability, our effectiveincome tax rate in a given financial statement period could be materially affected. An unfavorable tax settlement generally would require use of our cash and mayresult in an increase in our effective income tax
47

Table of Contents
rate in the period of resolution. A favorable tax settlement may reduce our effective income tax rate and would be recognized in the period of resolution.
Revenue Recognition
The following accounting estimates relating to revenue recognition contain uncertainty because they require management to make assumptions and to applyjudgment regarding the effects of future events.
Returns – We recognize revenue, net of estimated returns and sales incentives or allowances, at the time the customer takes possession of merchandise or receivesservices. We estimate the liability for sales returns with a corresponding reduction to revenue and cost of sales based on historical return data. We believe that ourestimate for sales returns, which represents the estimated gross margin impact of returns, is a reasonable reflection of future returns and financial impacts.However, if our estimates are significantly below or above the actual return amounts, our reported revenue and cost of sales could be impacted. A 10% differencein our returns reserve at January 28, 2017 , would have affected net earnings by approximately $2 million in fiscal 2017 .
Gift Card Breakage – We sell gift cards to customers in our retail stores, through our websites and through select third parties. A liability is initially established forthe value of the gift card when sold. We recognize revenue from gift cards when the card is redeemed by the customer. For unredeemed gift cards, we recognizebreakage when the likelihood of the gift card being redeemed by the customer is deemed remote, and we determine that we do not have a legal obligation to remitthe value of the unredeemed gift cards to a relevant jurisdiction. We determine the breakage rate based on historical redemption patterns and record projectedbreakage 24 months after card issuance. We do not believe there is a reasonable likelihood that there will be a material change in the future estimates orassumptions we use to record breakage. However, if actual results are not consistent with our estimates or assumptions, we may be exposed to a charge that couldbe material.
Customer Loyalty Programs – We have customer loyalty programs which allow members to earn points for each purchase completed with us or when using ourco-branded credit cards. Points earned enable members to receive a certificate that may be redeemed on future purchases. The value of points earned by our loyaltyprogram members is included in accrued liabilities and recorded as a reduction in revenue at the time the points are earned, based on the value of points that areprojected to be redeemed. Our estimate of the amount and timing of redemptions of certificates is based primarily on historical data. A 10% difference in ourcustomer redemption rates at January 28, 2017 , would have affected net earnings by approximately $13 million in fiscal 2017 .
We do not believe there is a reasonable likelihood that there will be a material change in the future estimates or assumptions of our revenue recognition criticalaccounting estimates. However, if actual results are not consistent with our estimates or assumptions, we may be exposed to losses or gains that could be material.
New Accounting Pronouncements
For a description of new applicable accounting pronouncements, see Note 1, Summary of Significant Accounting Policies , of the Notes to Consolidated FinancialStatements, included in Item 8, Financial Statements and Supplementary Data , of this Annual Report on Form 10-K.
48

Table of Contents
Item 7A. Quantitative and Qualitative Disclosures About Market Risk.
In addition to the risks inherent in our operations, we are exposed to certain market risks.
Interest Rate Risk
We are exposed to changes in short-term market interest rates and these changes in rates will impact our net interest expense. Our cash and short-term investmentsgenerate interest income that will vary based on changes in short-term interest rates. In addition, we have swapped a portion of our fixed-rate debt to floating-ratesuch that the interest expense on this debt will vary with short-term interest rates. Refer to Note 5, Debt , and Note 6, Derivative Instruments , of the Notes toConsolidated Financial Statements, included in Item 8, Financial Statements and Supplementary Data , of this Annual Report on Form 10-K for furtherinformation regarding our interest rate swaps.
As of January 28, 2017, we had $3.9 billion of cash and short-term investments and $750 million of debt that has been swapped to floating rate. Therefore, we hadnet cash and short-term investments of $3.2 billion generating income, which is exposed to interest rate changes. As of January 28, 2017, a 50 basis point increasein short-term interest rates would lead to an estimated $16 million reduction in net interest expense, and conversely a 50 basis point decrease in short-term interestrates would lead to an estimated $16 million increase in net interest expense.
Foreign Currency Exchange Rate Risk
We have market risk arising from changes in foreign currency exchange rates related to our International segment operations. On a limited basis, we utilize foreignexchange forward contracts to manage foreign currency exposure to certain forecasted inventory purchases, recognized receivable and payable balances and ourinvestment in our Canadian operations. Our primary objective in holding derivatives is to reduce the volatility of net earnings and cash flows, as well as net assetvalue associated with changes in foreign currency exchange rates. Our foreign currency risk management strategy includes both hedging instruments andderivatives that are not designated as hedging instruments, which generally have terms of up to 12 months. Refer to Note 6, Derivative Instruments , of the Notes toConsolidated Financial Statements, included in Item 8, Financial Statements and Supplementary Data , of this Annual Report on Form 10-K for furtherinformation regarding our these instruments.
The strength of the U.S. dollar compared to the Canadian dollar and Mexican peso compared to the prior-year period had a negative overall impact on our revenueas these currencies translated into fewer U.S. dollars. We estimate that foreign currency exchange rate fluctuations had a net unfavorable impact on our revenue infiscal 2017 of approximately $76 million and a net favorable impact on earnings of $4 million . In fiscal 2016, the impact of foreign currency exchange ratefluctuations had a net unfavorable impact on our revenue of approximately $534 million and a net favorable impact on earnings of $20 million .
49
Table of Contents
Item 8. Financial Statements and Supplementary Data.
Management's Report on the Consolidated Financial Statements
Our management is responsible for the preparation, integrity and objectivity of the accompanying consolidated financial statements and the related financialinformation. The consolidated financial statements have been prepared in conformity with GAAP and necessarily include certain amounts that are based onestimates and informed judgments. Our management also prepared the related financial information included in this Annual Report on Form 10-K and isresponsible for its accuracy and consistency with the consolidated financial statements.
The accompanying consolidated financial statements have been audited by Deloitte & Touche LLP, an independent registered public accounting firm, whichconducted its audits in accordance with the standards of the Public Company Accounting Oversight Board (United States). The independent registered publicaccounting firm's responsibility is to express an opinion as to whether such consolidated financial statements present fairly, in all material respects our financialposition, results of operations and cash flows in accordance with GAAP.
Management's Report on Internal Control Over Financial Reporting
Our management is responsible for establishing and maintaining adequate internal control over financial reporting (as defined in Rule 13a-15(f) under theExchange Act). Our internal control over financial reporting is designed under the supervision of our principal executive officer and principal financial officer, andeffected by our Board, management and other personnel, to provide reasonable assurance regarding the reliability of financial reporting and the preparation offinancial statements for external purposes in accordance with GAAP, and includes those policies and procedures that:
(1) Pertain to the maintenance of records that in reasonable detail accurately and fairly reflect our transactions and the dispositions of our assets;
(2) Provide reasonable assurance that our transactions are recorded as necessary to permit preparation of financial statements in accordance with GAAP andthat our receipts and expenditures are being made only in accordance with authorizations of our management and Board; and
(3) Provide reasonable assurance regarding prevention or timely detection of unauthorized acquisition, use or disposition of our assets that could have amaterial effect on our financial statements.
Because of its inherent limitations, internal control over financial reporting may not prevent or detect misstatements. Therefore, even those systems determined tobe effective can provide only reasonable assurance with respect to financial statement preparation and presentation.
Under the supervision and with the participation of our management, including our principal executive officer and principal financial officer, we assessed theeffectiveness of our internal control over financial reporting as of January 28, 2017 , using the criteria set forth by the Committee of Sponsoring Organizations ofthe Treadway Commission (COSO) in Internal Control — Integrated Framework (2013). Based on our assessment, we have concluded that our internal controlover financial reporting was effective as of January 28, 2017 . During our assessment, we did not identify any material weaknesses in our internal control overfinancial reporting. Deloitte & Touche LLP, the independent registered public accounting firm that audited our consolidated financial statements for the year endedJanuary 28, 2017 , included in Item 8, Financial Statements and Supplementary Data, of this Annual Report on Form 10-K, has issued an unqualified attestationreport on our internal control over financial reporting as of January 28, 2017 .
Hubert JolyChairman and Chief Executive Officer
(duly authorized and principal executive officer)
Corie BarryChief Financial Officer
(duly authorized and principal financial officer)
50

Table of Contents
REPORT OF INDEPENDENT REGISTERED PUBLIC ACCOUNTING FIRM
To the Board of Directors and Shareholders ofBest Buy Co., Inc.Richfield, Minnesota
We have audited the accompanying consolidated balance sheets of Best Buy Co., Inc. and subsidiaries (the “Company”) as of January 28, 2017 and January 30,2016, and the related consolidated statements of earnings, comprehensive income, changes in shareholders’ equity, and cash flows for each of the three years in theperiod ended January 28, 2017. Our audits also included the financial statement schedule listed in the Index at Item 15. These financial statements and financialstatement schedule are the responsibility of the Company’s management. Our responsibility is to express an opinion on the financial statements and financialstatement schedule based on our audits.
We conducted our audits in accordance with the standards of the Public Company Accounting Oversight Board (United States). Those standards require that weplan and perform the audit to obtain reasonable assurance about whether the financial statements are free of material misstatement. An audit includes examining,on a test basis, evidence supporting the amounts and disclosures in the financial statements. An audit also includes assessing the accounting principles used andsignificant estimates made by management, as well as evaluating the overall financial statement presentation. We believe that our audits provide a reasonable basisfor our opinion.
In our opinion, such consolidated financial statements present fairly, in all material respects, the financial position of Best Buy Co., Inc. and subsidiaries as ofJanuary 28, 2017 and January 30, 2016, and the results of their operations and their cash flows for each of the three years in the period ended January 28, 2017, inconformity with accounting principles generally accepted in the United States of America. Also, in our opinion, such financial statement schedule, whenconsidered in relation to the basic consolidated financial statements taken as a whole, present fairly, in all material respects, the information set forth therein.
We have also audited, in accordance with the standards of the Public Company Accounting Oversight Board (United States), the Company’s internal control overfinancial reporting as of January 28, 2017, based on the criteria established in Internal Control-Integrated Framework (2013) issued by the Committee ofSponsoring Organizations of the Treadway Commission and our report dated March 24, 2017, expressed an unqualified opinion on the Company’s internal controlover financial reporting.
Minneapolis, MinnesotaMarch 24, 2017
51

Table of Contents
REPORT OF INDEPENDENT REGISTERED PUBLIC ACCOUNTING FIRM
To the Board of Directors and Shareholders ofBest Buy Co., Inc.Richfield, Minnesota
We have audited the internal control over financial reporting of Best Buy Co., Inc. and subsidiaries (the “Company”), as of January 28, 2017, based on criteriaestablished in Internal Control-Integrated Framework (2013) issued by the Committee of Sponsoring Organizations of the Treadway Commission. TheCompany’s management is responsible for maintaining effective internal control over financial reporting and for its assessment of the effectiveness of internalcontrol over financial reporting, included in the accompanying Management’s Report on Internal Control Over Financial Reporting. Our responsibility is toexpress an opinion on the Company’s internal control over financial reporting based on our audit.
We conducted our audit in accordance with the standards of the Public Company Accounting Oversight Board (United States). Those standards require that weplan and perform the audit to obtain reasonable assurance about whether effective internal control over financial reporting was maintained in all material respects.Our audit included obtaining an understanding of internal control over financial reporting, assessing the risk that a material weakness exists, testing and evaluatingthe design and operating effectiveness of internal control based on the assessed risk, and performing such other procedures as we considered necessary in thecircumstances. We believe that our audit provides a reasonable basis for our opinion.
A company’s internal control over financial reporting is a process designed by, or under the supervision of, the company’s principal executive and principalfinancial officers, or persons performing similar functions, and effected by the company’s board of directors, management, and other personnel to providereasonable assurance regarding the reliability of financial reporting and the preparation of financial statements for external purposes in accordance with generallyaccepted accounting principles. A company’s internal control over financial reporting includes those policies and procedures that (1) pertain to the maintenance ofrecords that, in reasonable detail, accurately and fairly reflect the transactions and dispositions of the assets of the company; (2) provide reasonable assurance thattransactions are recorded as necessary to permit preparation of financial statements in accordance with generally accepted accounting principles, and that receiptsand expenditures of the company are being made only in accordance with authorizations of management and directors of the company; and (3) provide reasonableassurance regarding prevention or timely detection of unauthorized acquisition, use, or disposition of the company’s assets that could have a material effect on thefinancial statements.
Because of the inherent limitations of internal control over financial reporting, including the possibility of collusion or improper management override of controls,material misstatements due to error or fraud may not be prevented or detected on a timely basis. Also, projections of any evaluation of the effectiveness of theinternal control over financial reporting to future periods are subject to the risk that the controls may become inadequate because of changes in conditions, or thatthe degree of compliance with the policies or procedures may deteriorate.
In our opinion, the Company maintained, in all material respects, effective internal control over financial reporting as of January 28, 2017, based on the criteriaestablished in Internal Control-Integrated Framework (2013) issued by the Committee of Sponsoring Organizations of the Treadway Commission.
We have also audited, in accordance with the standards of the Public Company Accounting Oversight Board (United States), the consolidated financial statementsand financial statement schedule as of and for the year ended January 28, 2017, of the Company and our report dated March 24, 2017 expressed an unqualifiedopinion on those financial statements and financial statement schedule.
Minneapolis, MinnesotaMarch 24, 2017
52

Table of Contents
Consolidated Balance Sheets
$ in millions, except per share and share amounts
January 28, 2017 January 30, 2016Assets Current Assets Cash and cash equivalents $ 2,240 $ 1,976
Short-term investments 1,681 1,305
Receivables, net 1,347 1,162
Merchandise inventories 4,864 5,051
Other current assets 384 392
Total current assets 10,516 9,886
Property and Equipment Land and buildings 618 613
Leasehold improvements 2,227 2,220
Fixtures and equipment 4,998 5,002
Property under capital and financing leases 300 272
8,143 8,107
Less accumulated depreciation 5,850 5,761
Net property and equipment 2,293 2,346
Goodwill 425 425
Other Assets 622 831
Non-current assets held for sale — 31
Total Assets $ 13,856 $ 13,519
Liabilities and Equity Current Liabilities Accounts payable $ 4,984 $ 4,450
Unredeemed gift card liabilities 427 409
Deferred revenue 418 357
Accrued compensation and related expenses 358 384
Accrued liabilities 865 802
Accrued income taxes 26 128
Current portion of long-term debt 44 395
Total current liabilities 7,122 6,925
Long-Term Liabilities 704 877
Long-Term Debt 1,321 1,339
Contingencies and Commitments (Note 12) Equity Best Buy Co., Inc. Shareholders' Equity Preferred stock, $1.00 par value: Authorized — 400,000 shares; Issued and outstanding — none — —Common stock, $0.10 par value: Authorized — 1.0 billion shares; Issued and outstanding — 311,108,000 and323,779,000 shares, respectively 31 32
Prepaid share repurchase — (55)
Additional paid-in capital — —
Retained earnings 4,399 4,130
Accumulated other comprehensive income 279 271
Total equity 4,709 4,378
Total Liabilities and Equity $ 13,856 $ 13,519
See Notes to Consolidated Financial Statements.
53

Table of Contents
Consolidated Statements of Earnings
$ and shares in millions, except per share amounts
Fiscal Years Ended January 28, 2017 January 30, 2016 January 31, 2015
Revenue $ 39,403 $ 39,528 $ 40,339Cost of goods sold 29,963 30,334 31,292Restructuring charges — cost of goods sold — 3 —Gross profit 9,440 9,191 9,047Selling, general and administrative expenses 7,547 7,618 7,592Restructuring charges 39 198 5Operating income 1,854 1,375 1,450Other income (expense)
Gain on sale of investments 3 2 13Investment income and other 31 13 14Interest expense (72) (80) (90)
Earnings from continuing operations before income tax expense 1,816 1,310 1,387Income tax expense 609 503 141Net earnings from continuing operations 1,207 807 1,246
Gain (loss) from discontinued operations (Note 2), net of tax expense of $7, $1 and $0 21 90 (11)Net earnings including noncontrolling interests 1,228 897 1,235
Net earnings from discontinued operations attributable to noncontrolling interests — — (2)
Net earnings attributable to Best Buy Co., Inc. shareholders $ 1,228 $ 897 $ 1,233
Basic earnings (loss) per share attributable to Best Buy Co., Inc. shareholders Continuing operations $ 3.79 $ 2.33 $ 3.57Discontinued operations 0.07 0.26 (0.04)
Basic earnings per share $ 3.86 $ 2.59 $ 3.53
Diluted earnings (loss) per share attributable to Best Buy Co., Inc. shareholders Continuing operations $ 3.74 $ 2.30 $ 3.53Discontinued operations 0.07 0.26 (0.04)
Diluted earnings per share $ 3.81 $ 2.56 $ 3.49
Weighted-average common shares outstanding Basic 318.5 346.5 349.5Diluted 322.6 350.7 353.6
See Notes to Consolidated Financial Statements.
54
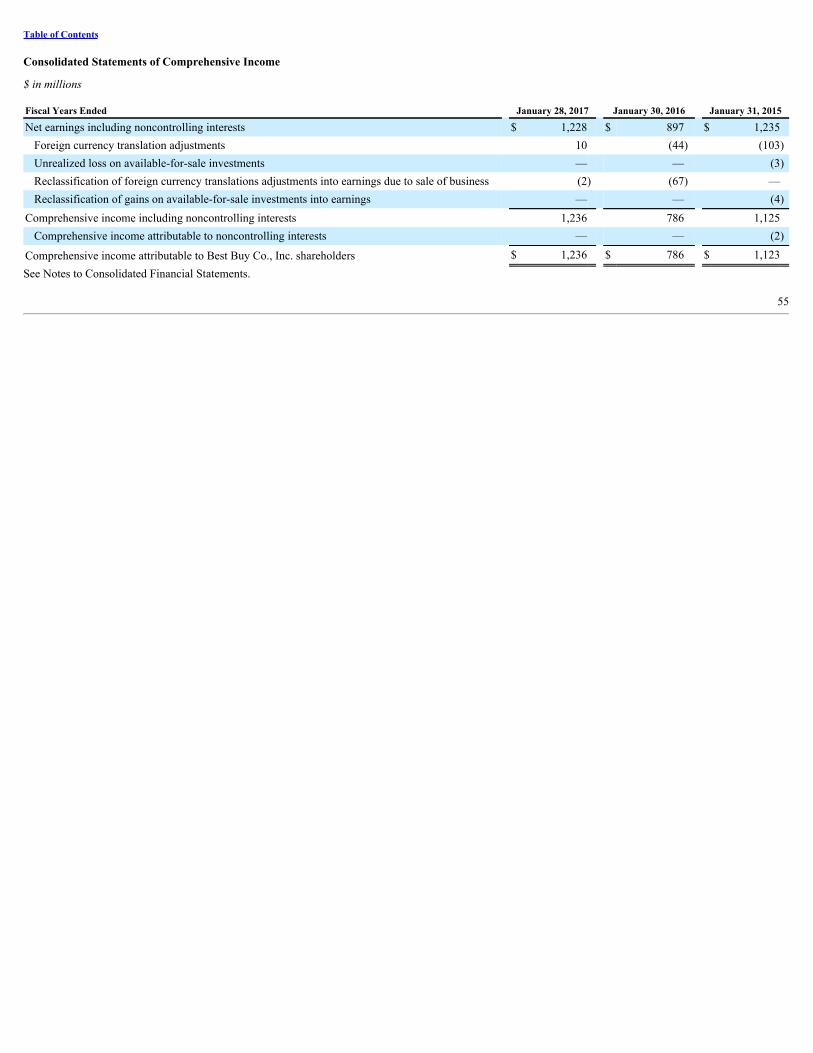
Table of Contents
Consolidated Statements of Comprehensive Income
$ in millions
Fiscal Years Ended January 28, 2017 January 30, 2016 January 31, 2015
Net earnings including noncontrolling interests $ 1,228 $ 897 $ 1,235Foreign currency translation adjustments 10 (44) (103)Unrealized loss on available-for-sale investments — — (3)Reclassification of foreign currency translations adjustments into earnings due to sale of business (2) (67) —Reclassification of gains on available-for-sale investments into earnings — — (4)
Comprehensive income including noncontrolling interests 1,236 786 1,125Comprehensive income attributable to noncontrolling interests — — (2)
Comprehensive income attributable to Best Buy Co., Inc. shareholders $ 1,236 $ 786 $ 1,123See Notes to Consolidated Financial Statements.
55

Table of Contents
Consolidated Statements of Cash Flows
$ in millions
Fiscal Years Ended January 28, 2017 January 30, 2016 January 31, 2015
Operating Activities Net earnings including noncontrolling interests $ 1,228 $ 897 $ 1,235
Adjustments to reconcile net earnings to total cash provided by operating activities: Depreciation 654 657 656Restructuring charges 39 201 23Gain on sale of business — (99) (1)Stock-based compensation 108 104 87Deferred income taxes 201 49 (297)Other, net (31) 38 8
Changes in operating assets and liabilities: Receivables (185) 123 (19)Merchandise inventories 193 86 (141)Other assets 10 36 29Accounts payable 518 (536) 434Other liabilities 23 (140) (164)Income taxes (213) (94) 85
Total cash provided by operating activities 2,545 1,322 1,935Investing Activities Additions to property and equipment, net of $48, $92 and $14 of non-cash capitalexpenditures (582) (649) (561)
Purchases of investments (3,045) (2,281) (2,804)Sales of investments 2,689 2,427 1,580Proceeds from sale of business, net of cash transferred — 103 39Proceeds from property disposition 56 — —Change in restricted assets (8) (47) 29Other, net 3 28 5Total cash used in investing activities (887) (419) (1,712)
Financing Activities Repurchase of common stock (698) (1,000) —Prepayment of accelerated share repurchase — (55) —Issuance of common stock 171 47 50Dividends paid (505) (499) (251)Repayments of debt (394) (28) (24)Other, net 22 20 2Total cash used in financing activities (1,404) (1,515) (223)
Effect of Exchange Rate Changes on Cash 10 (38) (52)Increase (Decrease) in Cash and Cash Equivalents 264 (650) (52)Cash and Cash Equivalents at Beginning of Period, excluding held for sale 1,976 2,432 2,678Cash and Cash Equivalents at Beginning of Period - held for sale — 194 —Cash and Cash Equivalents at End of Period 2,240 1,976 2,626Cash and Cash Equivalents at End of Period - held for sale — — (194)
Cash and Cash Equivalents at End of Period, excluding held for sale $ 2,240 $ 1,976 $ 2,432
Supplemental Disclosure of Cash Flow Information Income taxes paid $ 628 $ 550 $ 355Interest paid 76 77 81
See Notes to Consolidated Financial Statements.
56
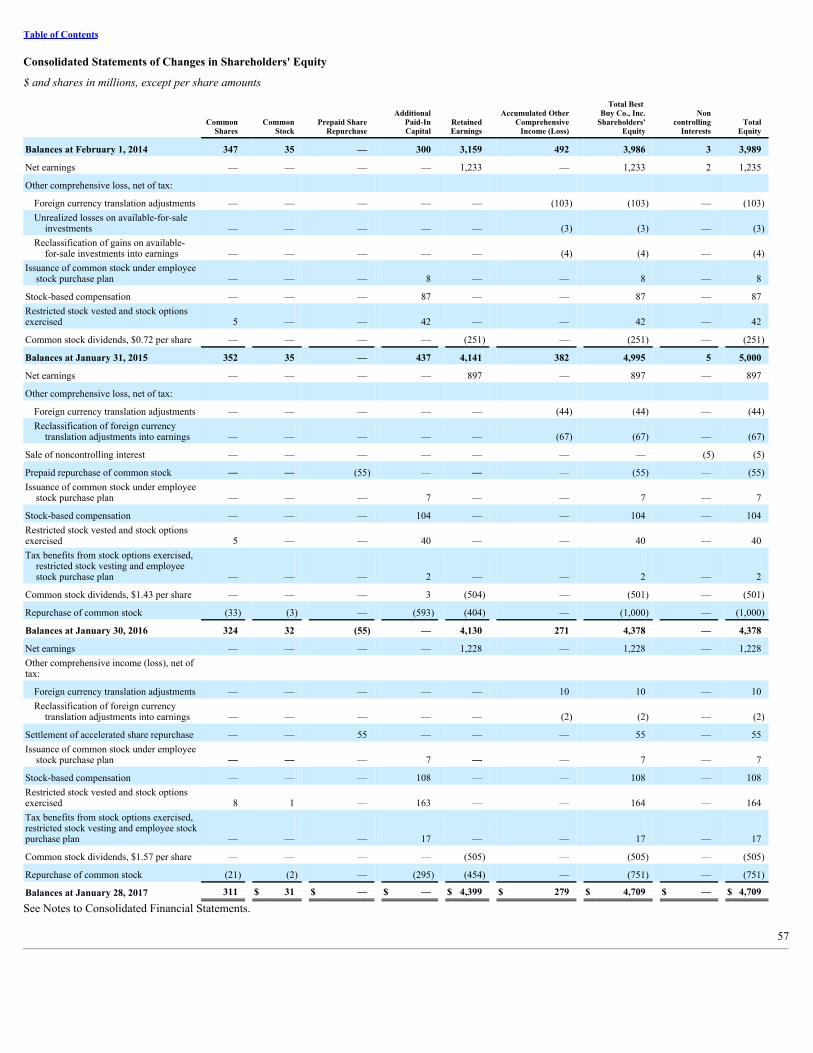
Table of Contents
Consolidated Statements of Changes in Shareholders' Equity
$ and shares in millions, except per share amounts
CommonShares Common
Stock Prepaid ShareRepurchase
AdditionalPaid-InCapital Retained
Earnings Accumulated Other
ComprehensiveIncome (Loss)
Total Best Buy Co., Inc.
Shareholders'Equity
Noncontrolling
Interests TotalEquity
Balances at February 1, 2014 347 35 — 300 3,159 492 3,986 3 3,989
Net earnings — — — — 1,233 — 1,233 2 1,235
Other comprehensive loss, net of tax:
Foreign currency translation adjustments — — — — — (103) (103) — (103)Unrealized losses on available-for-saleinvestments — — — — — (3) (3) — (3)
Reclassification of gains on available-for-sale investments into earnings — — — — — (4) (4) — (4)
Issuance of common stock under employeestock purchase plan — — — 8 — — 8 — 8
Stock-based compensation — — — 87 — — 87 — 87Restricted stock vested and stock optionsexercised 5 — — 42 — — 42 — 42
Common stock dividends, $0.72 per share — — — — (251) — (251) — (251)
Balances at January 31, 2015 352 35 — 437 4,141 382 4,995 5 5,000
Net earnings — — — — 897 — 897 — 897
Other comprehensive loss, net of tax:
Foreign currency translation adjustments — — — — — (44) (44) — (44)Reclassification of foreign currencytranslation adjustments into earnings — — — — — (67) (67) — (67)
Sale of noncontrolling interest — — — — — — — (5) (5)
Prepaid repurchase of common stock — — (55) — — — (55) — (55)Issuance of common stock under employeestock purchase plan — — — 7 — — 7 — 7
Stock-based compensation — — — 104 — — 104 — 104Restricted stock vested and stock optionsexercised 5 — — 40 — — 40 — 40Tax benefits from stock options exercised,restricted stock vesting and employeestock purchase plan — — — 2 — — 2 — 2
Common stock dividends, $1.43 per share — — — 3 (504) — (501) — (501)
Repurchase of common stock (33) (3) — (593) (404) — (1,000) — (1,000)
Balances at January 30, 2016 324 32 (55) — 4,130 271 4,378 — 4,378
Net earnings — — — — 1,228 — 1,228 — 1,228Other comprehensive income (loss), net oftax: Foreign currency translation adjustments — — — — — 10 10 — 10Reclassification of foreign currencytranslation adjustments into earnings — — — — — (2) (2) — (2)
Settlement of accelerated share repurchase — — 55 — — — 55 — 55Issuance of common stock under employeestock purchase plan — — — 7 — — 7 — 7
Stock-based compensation — — — 108 — — 108 — 108Restricted stock vested and stock optionsexercised 8 1 — 163 — — 164 — 164Tax benefits from stock options exercised,restricted stock vesting and employee stockpurchase plan — — — 17 — — 17 — 17
Common stock dividends, $1.57 per share — — — — (505) — (505) — (505)
Repurchase of common stock (21) (2) — (295) (454) — (751) — (751)
Balances at January 28, 2017 311 $ 31 $ — $ — $ 4,399 $ 279 $ 4,709 $ — $ 4,709
See Notes to Consolidated Financial Statements.
57

Table of Contents
Notes to Consolidated Financial Statements
1. Summary of Significant Accounting Policies
Unless the context otherwise requires, the use of the terms "Best Buy," "we," "us" and "our" in these Notes to Consolidated Financial Statements refers to Best BuyCo., Inc. and, as applicable, its consolidated subsidiaries.
Description of Business
We are a leading provider of technology products, services and solutions. We offer these products and services to the customers who visit our stores, engage withGeek Squad agents or use our websites or mobile applications. We have operations in the U.S., Canada and Mexico. We have two reportable segments: Domesticand International. The Domestic segment is comprised of the operations in all states, districts and territories of the U.S., under various brand names includingBest Buy, bestbuy.com, Best Buy Mobile, Best Buy Direct, Best Buy Express, Geek Squad, Magnolia Home Theater and Pacific Kitchen and Home. TheInternational segment is comprised of all operations in Canada and Mexico under the brand names Best Buy, bestbuy.com.ca, bestbuy.com.mx, Best Buy Express,Best Buy Mobile and Geek Squad.
Basis of Presentation
The consolidated financial statements include the accounts of Best Buy Co., Inc. and its consolidated subsidiaries. All intercompany balances and transactions areeliminated upon consolidation.
In order to align our fiscal reporting periods and comply with statutory filing requirements, we consolidate the financial results of our Mexico operations on a one -month lag. Our policy is to accelerate recording the effect of events occurring in the lag period that significantly affect our consolidated financial statements. Nosignificant intervening event occurred in these operations that would have materially affected our financial condition, results of operations, liquidity or otherfactors had it been recorded during fiscal 2017, 2016 or 2015.
In preparing the accompanying consolidated financial statements, we evaluated the period from January 28, 2017, through the date the financial statements wereissued for material subsequent events requiring recognition or disclosure. Other than as described in Note 7, Shareholders' Equity , no such events were identifiedfor this period.
Discontinued Operations
On February 13, 2015, we sold Jiangsu Five Star Appliance Co., Limited ("Five Star"). The results of Five Star are presented as discontinued operations for allperiods. See Note 2, Discontinued Operations , for further information.
Use of Estimates in the Preparation of Financial Statements
The preparation of financial statements in conformity with accounting principles generally accepted in the U.S. ("GAAP") requires us to make estimates andassumptions. These estimates and assumptions affect the reported amounts in the consolidated financial statements, as well as the disclosure of contingentliabilities. Future results could be materially affected if actual results were to differ from these estimates and assumptions.
Fiscal Year
Our fiscal year ends on the Saturday nearest the end of January. Fiscal 2017, 2016 and 2015 each included 52 weeks.
New Accounting Pronouncements
In May 2014, the Financial Accounting Standards Board ("FASB") issued Accounting Standards Update ("ASU") 2014-09, Revenue from Contracts withCustomers . The new guidance establishes a single comprehensive model for entities to use in accounting for revenue and supersedes most current revenuerecognition guidance. It introduces a five-step process for revenue recognition that focuses on transfer of control, as opposed to transfer of risk and rewards undercurrent guidance. It also requires significantly expanded disclosures regarding revenues.
Based on our preliminary assessment, we believe the impact of adopting the new guidance will be immaterial to our annual and interim financial statements. Webelieve that the impact will be limited to minor changes to the timing of recognition of revenues related to gift cards and loyalty programs.
58

Table of Contents
We plan to adopt this standard in the first quarter of our fiscal 2019, using the modified retrospective method. Under this method, we will recognize the cumulativeeffect of the changes in retained earnings at the date of adoption, but will not restate prior periods.
In July 2015, the FASB issued ASU 2015-11, Inventory: Simplifying the Measurement of Inventory. The new guidance replaces the current inventory measurementrequirement of lower of cost or market with the lower of cost or net realizable value. Based on the effective dates, we will prospectively adopt this standard in thefirst quarter of our fiscal 2018. We do not expect a material impact to our financial statements.
In February 2016, the FASB issued ASU 2016-02, Leases. The new guidance was issued to increase transparency and comparability among companies byrequiring most leases to be included on the balance sheet and by expanding disclosure requirements. Based on the effective dates, we expect to adopt the newguidance in the first quarter of fiscal 2020 using the modified retrospective method. While we expect adoption to lead to a material increase in the assets andliabilities recorded on our balance sheet, we are still evaluating the overall impact on our financial statements.
In March 2016, the FASB issued ASU 2016-09, Compensation-Stock Compensation: Improvements to Employee Share-Based Payment Accounting. The newguidance changes certain aspects of accounting for share-based payments including accounting for income taxes, forfeitures and classifications in the statement ofcash flows. We plan to adopt this standard in the first quarter of fiscal 2018, which aligns with the required adoption date. As allowed by ASU 2016-09, we plan tochange our accounting for forfeitures from our current method of estimating the number of awards that are expected to vest to recording forfeitures as they occur.This will require a cumulative-effect adjustment to equity as of the beginning of fiscal 2018. We do not expect this adjustment to be material to our financialstatements. In addition, we do not expect the remaining changes caused by ASU 2016-09 to have a material impact to our financial statements.
In August 2016, the FASB issued ASU 2016-15, Statement of Cash Flows: Classification of Certain Cash Receipts and Cash Payments , and in November 2016,the FASB issued ASU 2016-18, Statement of Cash Flows: Restricted Cash . ASU 2016-15 provides classification requirements for specific transactions within thestatement of cash flows, while ASU 2016-18 requires restricted cash balances be included in the beginning and ending cash balance within the statement of cashflows. We plan to retrospectively adopt these standards in the first quarter of our fiscal 2018, which is one year earlier than required. The adoption will increase ourbeginning and ending cash balance within our statement of cash flows by our restricted cash balances (see Restricted Assets section below) and will require a newdisclosure to reconcile the cash balances within our statement of cash flows to the balance sheets. We do not expect any other material impacts to our financialstatements.
Cash and Cash Equivalents
Cash primarily consists of cash on hand and bank deposits. Cash equivalents consist of money market funds, commercial paper, corporate bonds and time depositswith an original maturity of 3 months or less when purchased. The amounts of cash equivalents at January 28, 2017 , and January 30, 2016 , were $1,531 millionand $1,208 million , respectively, and the weighted-average interest rates were 0.5% and 0.5% , respectively.
Receivables
Receivables consist principally of amounts due from mobile phone network operators for device sales and commissions; banks for customer credit card and debitcard transactions; and vendors for various vendor funding programs.
We establish allowances for uncollectible receivables based on historical collection trends and write-off history. Our allowances for uncollectible receivables were$52 million and $49 million at January 28, 2017 , and January 30, 2016 , respectively.
Merchandise Inventories
Merchandise inventories are recorded at the lower of cost, using the average cost, or market. In-bound freight-related costs from our vendors are included as part ofthe net cost of merchandise inventories. Also included in the cost of inventory are certain vendor allowances that are not a reimbursement of specific, incrementaland identifiable costs to promote a vendor's products. Other costs associated with acquiring, storing and transporting merchandise inventories to our retail storesare expensed as incurred and included in cost of goods sold.
59

Table of Contents
Our inventory valuation reflects adjustments for anticipated physical inventory losses (e.g., theft) that have occurred since the last physical inventory. Physicalinventory counts are taken on a regular basis to ensure that the inventory reported in our consolidated financial statements is properly stated.
Our inventory valuation also reflects markdowns for the excess of the cost over the amount we expect to realize from the ultimate sale or other disposal of theinventory. Markdowns establish a new cost basis for our inventory. Subsequent changes in facts or circumstances do not result in the reversal of previouslyrecorded markdowns or an increase in the newly established cost basis.
Restricted Assets
Restricted cash totaled $193 million and $185 million at January 28, 2017 , and January 30, 2016 , respectively, and is included in other current assets in ourConsolidated Balance Sheet. Such balances are pledged as collateral or restricted to use for general liability insurance and workers' compensation insurance.
Property and Equipment
Property and equipment are recorded at cost. We compute depreciation using the straight-line method over the estimated useful lives of the assets. Leaseholdimprovements are depreciated over the shorter of their estimated useful lives or the period from the date the assets are placed in service to the end of the lease term,which includes optional renewal periods if they are reasonably assured. Accelerated depreciation methods are generally used for income tax purposes.
When property is retired or otherwise disposed of, the cost and accumulated depreciation are removed from our Consolidated Balance Sheets and any resultinggain or loss is reflected in our Consolidated Statements of Earnings.
Repairs and maintenance costs are charged directly to expense as incurred. Major renewals or replacements that substantially extend the useful life of an asset arecapitalized and depreciated.
Costs associated with the acquisition or development of software for internal use are capitalized and amortized over the expected useful life of the software,generally from two to seven years. A subsequent addition, modification or upgrade to internal-use software is capitalized to the extent that it enhances thesoftware's functionality or extends its useful life. Capitalized software is included in fixtures and equipment. Software maintenance and training costs are expensedin the period incurred.
Property under capital and financing leases is comprised of buildings and equipment used in our operations. These assets are typically depreciated over the shorterof the useful life of the asset or the term of the lease. The carrying value of property under capital and financing leases was $166 million and $165 million atJanuary 28, 2017 , and January 30, 2016 , respectively, net of accumulated depreciation of $134 million and $107 million , respectively.
Estimated useful lives by major asset category are as follows:
Asset Life
(in years)
Buildings 5-35Leasehold improvements 3-15Fixtures and equipment 2-15Property under capital and financing leases 4-5
In fiscal 2017, we removed from our fixed asset balance $345 million of fully depreciated assets that were no longer in service. This asset adjustment was basedprimarily on an analysis of our fixed asset records and certain other validation procedures and had no material net impact to our fiscal 2017 Consolidated FinancialStatements. The impact of this adjustment on amounts previously reported was determined to be immaterial to the Consolidated Financial Statements.
Impairment of Long-Lived Assets and Costs Associated With Exit Activities
Long-lived assets are evaluated for impairment whenever events or changes in circumstances indicate the carrying value of an asset may not be recoverable.Factors considered important that could result in an impairment review include, but are not
60

Table of Contents
limited to, significant under-performance relative to historical or planned operating results, significant changes in the manner of use or expected life of the assets orsignificant changes in our business strategies. An impairment loss is recognized when the estimated undiscounted cash flows expected to result from the use of theasset plus net proceeds expected from the disposition of the asset, if any, are less than the carrying value of the asset net of other liabilities. When an impairmentloss is recognized, the carrying amount of the asset is reduced to its estimated fair value using valuation techniques such as discounted cash flow analysis.
When reviewing long-lived assets for impairment, we group long-lived assets with other assets and liabilities at the lowest level for which identifiable cash flowsare largely independent of the cash flows of other assets and liabilities. For example, long-lived assets deployed at store locations are reviewed for impairment atthe individual store level, which involves comparing the carrying value of all land, buildings, leasehold improvements, fixtures and equipment located at each storeto the net cash flow projections for each store. In addition, we conduct separate impairment reviews at other levels as appropriate, for example, to evaluatepotential impairment of assets shared by several areas of operations, such as information technology systems. Refer to Note 3, Fair Value Measurements , forfurther information associated with the long-lived assets impairments, including valuation techniques used, impairment charges incurred and remaining carryingvalues.
The present value of costs associated with vacated properties, primarily future lease costs net of expected sublease income, are charged to earnings when we ceaseusing the property. We accelerate depreciation on property and equipment we expect to retire when a decision is made to abandon a property.
At January 28, 2017 , and January 30, 2016 , the obligation associated with vacant properties included in accrued liabilities in our Consolidated Balance Sheets was$29 million and $44 million , respectively, and the obligation associated with vacant properties included in long-term liabilities in our Consolidated Balance Sheetswas $37 million and $54 million , respectively. The obligation associated with vacant properties at January 28, 2017 , and January 30, 2016 , included amountsassociated with our restructuring activities as further described in Note 4, Restructuring Charges .
Leases
We conduct the majority of our retail and distribution operations from leased locations. The leases generally require payment of real estate taxes, insurance andcommon area maintenance, in addition to rent. The terms of our new lease agreements for large-format stores are generally less than 10 years, although we haveexisting leases with terms up to 20 years. Small-format stores generally have lease terms that are half the length of large-format stores. Most of the leases containrenewal options and escalation clauses, and certain store leases require contingent rents based on factors such as specified percentages of revenue or the consumerprice index.
For leases that contain predetermined fixed escalations of the minimum rent, we recognize the related rent expense on a straight-line basis from the date we takepossession of the property to the end of the initial lease term. We record any difference between the straight-line rent amounts and amounts payable under theleases as part of deferred rent, in accrued liabilities or long-term liabilities, as appropriate.
Cash or lease incentives received upon entering into certain store leases ("tenant allowances") are recognized on a straight-line basis as a reduction to rent from thedate we take possession of the property through the end of the initial lease term. We record the unamortized portion of tenant allowances as a part of deferred rent,in accrued liabilities or long-term liabilities, as appropriate.
At January 28, 2017 , and January 30, 2016 , deferred rent included in accrued liabilities in our Consolidated Balance Sheets was $33 million and $36 million ,respectively, and deferred rent included in long-term liabilities in our Consolidated Balance Sheets was $121 million and $139 million , respectively.
In addition, we have financing leases for agreements when we are deemed the owner of the leased buildings, typically due to significant involvement during theconstruction period, and do not qualify for sales recognition under the sale-leaseback accounting guidance. We record the cost of the building in property andequipment, with the related short-term liability recorded in accrued liabilities and the longer-term liability recorded in long-term debt. At January 28, 2017 , andJanuary 30, 2016 , we had $177 million and $178 million , respectively, outstanding under financing lease obligations. Refer to Note 8, Leases , for maturitydetails.
Assets acquired under capital and financing leases are depreciated over the shorter of the useful life of the asset or the lease term, including renewal periods, ifreasonably assured.
61

Table of Contents
Goodwill and Intangible Assets
Goodwill
Goodwill is the excess of the purchase price over the fair value of identifiable net assets acquired in business combinations. We test goodwill for impairmentannually, as of the first day of the fiscal fourth quarter, or when indications of potential impairment exist. We monitor the existence of potential impairmentindicators throughout the fiscal year. We test for goodwill impairment at the reporting unit level and our reporting units are the components of operating segmentswhich constitute businesses for which discrete financial information is available and is regularly reviewed by segment management. No components wereaggregated in arriving at our reporting units. Our only reporting unit with a goodwill balance at the beginning of fiscal 2017 was our Domestic segment.
Our detailed impairment testing involves comparing the fair value of each reporting unit to its carrying value, including goodwill. Fair value reflects the price amarket participant would be willing to pay in a potential sale of the reporting unit and is based on discounted cash flows or relative market-based approaches. If thefair value exceeds carrying value, then it is concluded that no goodwill impairment has occurred. If the carrying value of the reporting unit exceeds its fair value, asecond step is required to measure possible goodwill impairment loss. The second step includes hypothetically valuing the tangible and intangible assets andliabilities of the reporting unit as if the reporting unit had been acquired in a business combination. Then, the implied fair value of the reporting unit's goodwill iscompared to the carrying value of that goodwill. If the carrying value of the reporting unit's goodwill exceeds the implied fair value of the goodwill, we recognizean impairment loss in an amount equal to the excess, not to exceed the carrying value. In fiscal 2017, we determined that the fair value of the Best Buy Domesticreporting unit exceeded its carrying value, and as a result, no goodwill impairment was recorded in fiscal 2017. No goodwill impairment was recorded in fiscal2016.
Tradenames
We have an indefinite-lived tradename related to Pacific Sales included within our Domestic segment, which is recorded within other assets in our ConsolidatedBalance Sheets. As of the end of fiscal 2017, we have no indefinite-lived tradenames within our International segment.
Our valuation of identifiable intangible assets acquired is based on information and assumptions available to us at the time of acquisition, using income and marketapproaches to determine fair value. We do not amortize our indefinite-lived tradenames, but test for impairment annually, or when indications of potentialimpairment exist. We utilize the relief from royalty method to determine the fair value of each of our indefinite-lived tradenames. If the carrying value exceeds thefair value, we recognize an impairment loss in an amount equal to the excess. In fiscal 2017, we determined that the fair value of the tradename exceeded itscarrying value, and as a result, no impairment was recorded in fiscal 2017. In fiscal 2016, as a part of the Canada brand restructuring, we fully impaired theindefinite-lived Future Shop tradename. Refer to Note 4, Restructuring Charges , for additional information. No other impairments were identified during fiscal2016.
The changes in the carrying amount of goodwill and indefinite-lived tradenames by segment were as follows in fiscal 2017 , 2016 and 2015 ($ in millions):
Goodwill Indefinite-Lived Tradenames
Domestic Domestic International Total
Balances at February 1, 2014 $ 425 $ 19 $ 82 $ 101Sale of business (1) — — (37) (37)Impairments — (1) — (1)Changes in foreign currency exchange rates — — (6) (6)
Balances at January 31, 2015 425 18 39 57Canada brand restructuring (2) — — (40) (40)Changes in foreign currency exchange rates — — 1 1
Balances at January 30, 2016 425 18 — 18
Balances at January 28, 2017 $ 425 $ 18 $ — $ 18
(1) Primarily represents the Five Star indefinite-lived tradenames classified as held for sale at January 31, 2015.
62
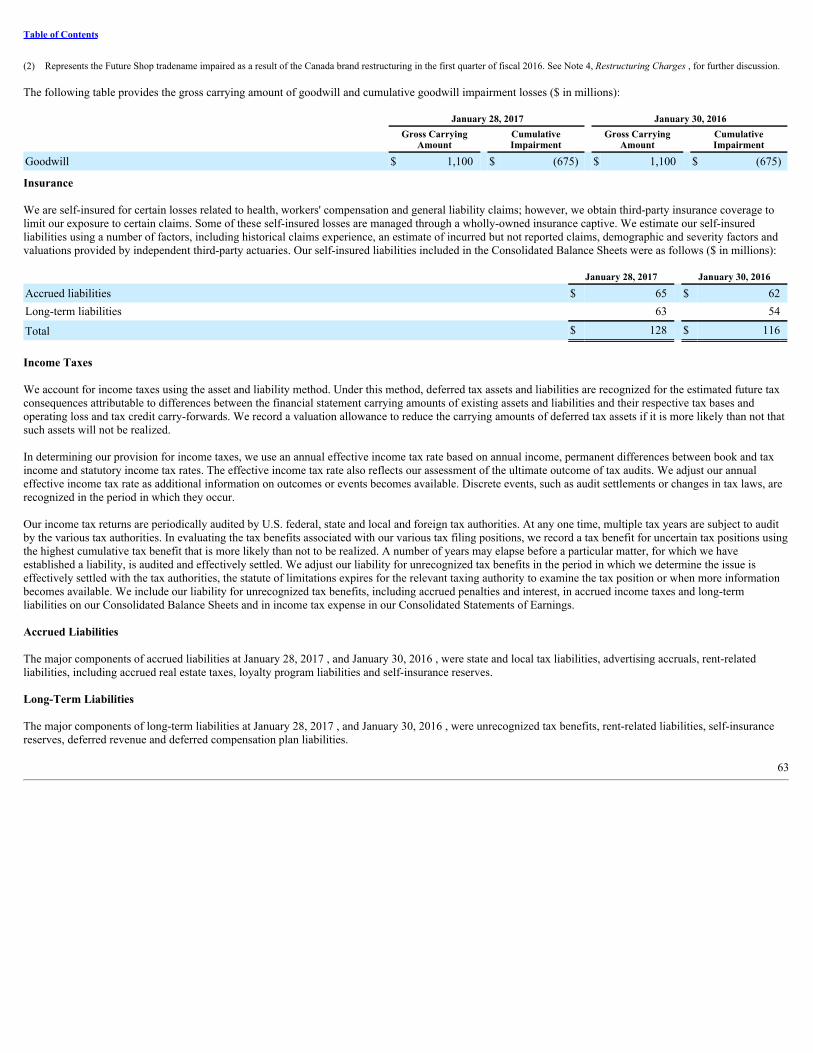
Table of Contents
(2) Represents the Future Shop tradename impaired as a result of the Canada brand restructuring in the first quarter of fiscal 2016. See Note 4, Restructuring Charges , for further discussion. The following table provides the gross carrying amount of goodwill and cumulative goodwill impairment losses ($ in millions):
January 28, 2017 January 30, 2016
Gross Carrying
Amount CumulativeImpairment
Gross CarryingAmount
CumulativeImpairment
Goodwill $ 1,100 $ (675) $ 1,100 $ (675)
Insurance We are self-insured for certain losses related to health, workers' compensation and general liability claims; however, we obtain third-party insurance coverage tolimit our exposure to certain claims. Some of these self-insured losses are managed through a wholly-owned insurance captive. We estimate our self-insuredliabilities using a number of factors, including historical claims experience, an estimate of incurred but not reported claims, demographic and severity factors andvaluations provided by independent third-party actuaries. Our self-insured liabilities included in the Consolidated Balance Sheets were as follows ($ in millions):
January 28, 2017 January 30, 2016
Accrued liabilities $ 65 $ 62Long-term liabilities 63 54
Total $ 128 $ 116
Income Taxes
We account for income taxes using the asset and liability method. Under this method, deferred tax assets and liabilities are recognized for the estimated future taxconsequences attributable to differences between the financial statement carrying amounts of existing assets and liabilities and their respective tax bases andoperating loss and tax credit carry-forwards. We record a valuation allowance to reduce the carrying amounts of deferred tax assets if it is more likely than not thatsuch assets will not be realized.
In determining our provision for income taxes, we use an annual effective income tax rate based on annual income, permanent differences between book and taxincome and statutory income tax rates. The effective income tax rate also reflects our assessment of the ultimate outcome of tax audits. We adjust our annualeffective income tax rate as additional information on outcomes or events becomes available. Discrete events, such as audit settlements or changes in tax laws, arerecognized in the period in which they occur.
Our income tax returns are periodically audited by U.S. federal, state and local and foreign tax authorities. At any one time, multiple tax years are subject to auditby the various tax authorities. In evaluating the tax benefits associated with our various tax filing positions, we record a tax benefit for uncertain tax positions usingthe highest cumulative tax benefit that is more likely than not to be realized. A number of years may elapse before a particular matter, for which we haveestablished a liability, is audited and effectively settled. We adjust our liability for unrecognized tax benefits in the period in which we determine the issue iseffectively settled with the tax authorities, the statute of limitations expires for the relevant taxing authority to examine the tax position or when more informationbecomes available. We include our liability for unrecognized tax benefits, including accrued penalties and interest, in accrued income taxes and long-termliabilities on our Consolidated Balance Sheets and in income tax expense in our Consolidated Statements of Earnings.
Accrued Liabilities
The major components of accrued liabilities at January 28, 2017 , and January 30, 2016 , were state and local tax liabilities, advertising accruals, rent-relatedliabilities, including accrued real estate taxes, loyalty program liabilities and self-insurance reserves.
Long-Term Liabilities
The major components of long-term liabilities at January 28, 2017 , and January 30, 2016 , were unrecognized tax benefits, rent-related liabilities, self-insurancereserves, deferred revenue and deferred compensation plan liabilities.
63
Table of Contents
Foreign Currency
Foreign currency denominated assets and liabilities are translated into U.S. dollars using the exchange rates in effect at our Consolidated Balance Sheet date. Foroperations reported on a one -month lag, we use the exchange rates in effect one month prior to our Consolidated Balance Sheet date. Results of operations andcash flows are translated using the average exchange rates throughout the period. The effect of exchange rate fluctuations on the translation of assets and liabilitiesis included as a component of shareholders' equity in accumulated other comprehensive income. Gains and losses from foreign currency transactions, which areincluded in SG&A, have not been significant in any of the periods presented.
Revenue Recognition
We recognize revenue when the sales price is fixed or determinable, collection is reasonably assured and the customer takes possession of the merchandise, or inthe case of services, the service has been provided. Revenue excludes sales taxes collected. Revenue from merchandise sales and services is reported net of salesreturns, which includes an estimate of future returns based on historical return rates, with a corresponding reduction to cost of sales. Our sales returns reserve,which represents the estimated gross margin impact of returns, was $28 million and $25 million at January 28, 2017 , and January 30, 2016 , respectively.
For revenue transactions that involve multiple deliverables, we defer the revenue associated with any undelivered elements. The amount of revenue deferred inconnection with the undelivered elements is determined using the relative fair value of each element, which is generally based on each element's relative retailprice.
Our deferred revenues primarily relate to merchandise not yet delivered to customers, services not yet completed and technical support contracts not yet completed.Short-term deferred revenue was $418 million and $357 million as of January 28, 2017 , and January 30, 2016 , respectively. At January 28, 2017 , and January 30,2016 , deferred revenue included within long-term liabilities in our Consolidated Balance Sheets was $34 million and $45 million , respectively.
Merchandise revenue
Revenue is recognized for store sales when the customer receives and pays for merchandise. In the case of items paid for in store but subsequently delivered to thecustomer, revenue is recognized once delivery has been completed.
For transactions initiated online, customers choose whether to collect merchandise from one of our stores (“in-store pick up”) or have it delivered to them(typically using third party parcel delivery companies). For in-store pick up, we recognize revenue once the customer has taken possession of merchandise. Foritems delivered directly to the customer, we recognize revenue when delivery has been completed. Any fees charged to customers for delivery are also recognizedwhen delivery has been completed.
Services
Revenue related to consultation, design, installation, set-up, repair and educational classes are recognized once the service is complete. We sell various protectionplans with extended warranty coverage for merchandise and technical support to assist customers in using their devices. Such plans have terms typically rangingfrom one month to five years. For extended warranty protection, third party underwriters assume the risk associated with the coverage and are deemed to be thelegal obligor. We record the net commissions we receive (the amount charged to the customer less the premiums remitted to the underwriter) as revenue when thecorresponding merchandise revenue is recognized. In addition, we are eligible to receive profit sharing payments, which are dependent upon the performance of theportfolio. We record such profit share as revenue once the portfolio period to which it relates is complete, and we have sufficient evidence to estimate the amount.Service and commission revenues earned from the sale of extended warranties represented 2.2% , 2.3% and 2.1% of revenue in fiscal 2017 , 2016 and 2015 ,respectively. These percentages include $133 million , $158 million and $19 million , in fiscal 2017 , 2016 and 2015 , respectively, of profit share revenue.
For technical support contracts, we assume responsibility for fulfilling the support to customers and we recognize the associated revenue either on a straight-linebasis over the life of the contracts, or, if sufficient history is available, on a consumption basis.
Credit card revenue
64
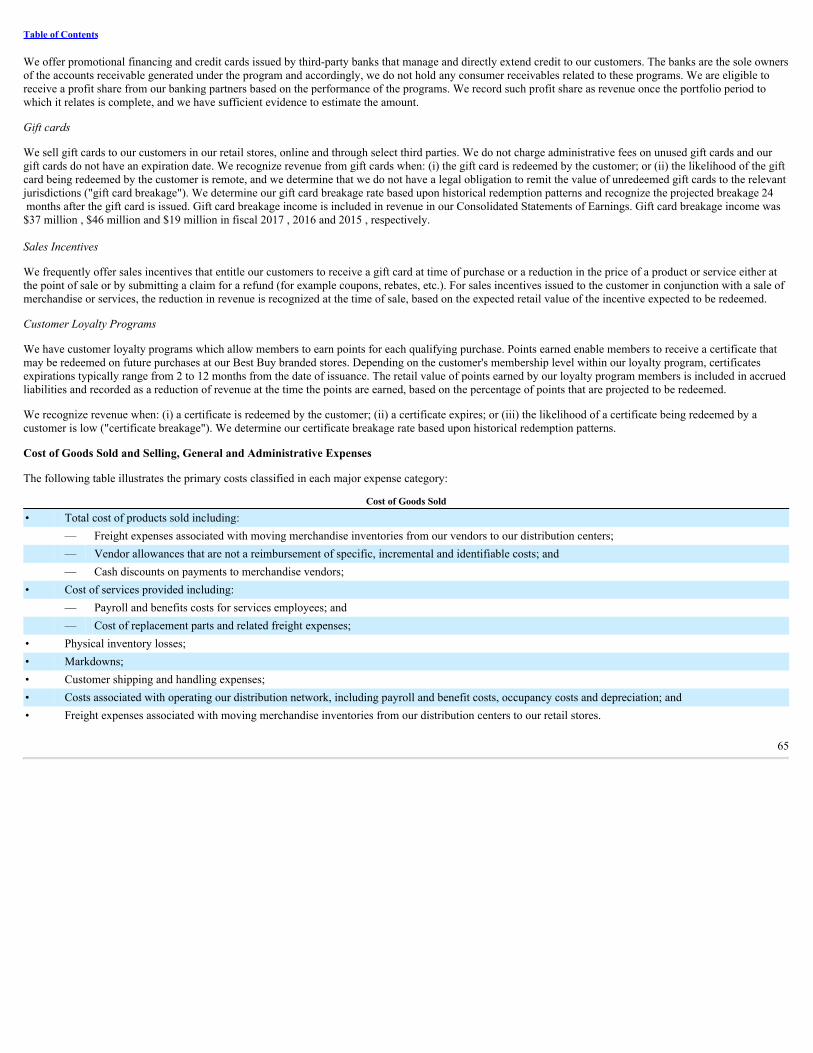
Table of Contents
We offer promotional financing and credit cards issued by third-party banks that manage and directly extend credit to our customers. The banks are the sole ownersof the accounts receivable generated under the program and accordingly, we do not hold any consumer receivables related to these programs. We are eligible toreceive a profit share from our banking partners based on the performance of the programs. We record such profit share as revenue once the portfolio period towhich it relates is complete, and we have sufficient evidence to estimate the amount.
Gift cards
We sell gift cards to our customers in our retail stores, online and through select third parties. We do not charge administrative fees on unused gift cards and ourgift cards do not have an expiration date. We recognize revenue from gift cards when: (i) the gift card is redeemed by the customer; or (ii) the likelihood of the giftcard being redeemed by the customer is remote, and we determine that we do not have a legal obligation to remit the value of unredeemed gift cards to the relevantjurisdictions ("gift card breakage"). We determine our gift card breakage rate based upon historical redemption patterns and recognize the projected breakage 24 months after the gift card is issued. Gift card breakage income is included in revenue in our Consolidated Statements of Earnings. Gift card breakage income was$37 million , $46 million and $19 million in fiscal 2017 , 2016 and 2015 , respectively.
Sales Incentives
We frequently offer sales incentives that entitle our customers to receive a gift card at time of purchase or a reduction in the price of a product or service either atthe point of sale or by submitting a claim for a refund (for example coupons, rebates, etc.). For sales incentives issued to the customer in conjunction with a sale ofmerchandise or services, the reduction in revenue is recognized at the time of sale, based on the expected retail value of the incentive expected to be redeemed.
Customer Loyalty Programs
We have customer loyalty programs which allow members to earn points for each qualifying purchase. Points earned enable members to receive a certificate thatmay be redeemed on future purchases at our Best Buy branded stores. Depending on the customer's membership level within our loyalty program, certificatesexpirations typically range from 2 to 12 months from the date of issuance. The retail value of points earned by our loyalty program members is included in accruedliabilities and recorded as a reduction of revenue at the time the points are earned, based on the percentage of points that are projected to be redeemed.
We recognize revenue when: (i) a certificate is redeemed by the customer; (ii) a certificate expires; or (iii) the likelihood of a certificate being redeemed by acustomer is low ("certificate breakage"). We determine our certificate breakage rate based upon historical redemption patterns.
Cost of Goods Sold and Selling, General and Administrative Expenses
The following table illustrates the primary costs classified in each major expense category:
Cost of Goods Sold
• Total cost of products sold including: — Freight expenses associated with moving merchandise inventories from our vendors to our distribution centers; — Vendor allowances that are not a reimbursement of specific, incremental and identifiable costs; and — Cash discounts on payments to merchandise vendors;• Cost of services provided including: — Payroll and benefits costs for services employees; and — Cost of replacement parts and related freight expenses;• Physical inventory losses;• Markdowns;• Customer shipping and handling expenses;• Costs associated with operating our distribution network, including payroll and benefit costs, occupancy costs and depreciation; and• Freight expenses associated with moving merchandise inventories from our distribution centers to our retail stores.
65

Table of Contents
SG&A
• Payroll and benefit costs for retail and corporate employees;• Occupancy and maintenance costs of retail, services and corporate facilities;• Depreciation and amortization related to retail, services and corporate assets;• Advertising costs;• Vendor allowances that are a reimbursement of specific, incremental and identifiable costs to promote a vendor's products;• Tender costs, including bank charges and costs associated with credit and debit card interchange fees;• Charitable contributions;• Outside and outsourced service fees;• Long-lived asset impairment charges; and• Other administrative costs, such as supplies, travel and lodging.
Vendor Allowances We receive allowances from certain vendors through a variety of programs and arrangements intended to offset our costs of promoting and selling merchandiseinventories. Vendor allowances are primarily in the form of receipt-based funds or sell-through credits. Receipt-based funds are generally determined at an agreedpercentage of purchase price and are initially deferred and recorded as a reduction of merchandise inventories. The deferred amounts are then included as areduction of cost of goods sold when the related product is sold. Sell-through credits are generally calculated using an agreed upon amount for each unit sold andare recognized when the related product is sold. Vendor allowances provided as a reimbursement of specific, incremental and identifiable costs, such as specializedstore labor or training costs, are included in SG&A as an expense reduction when the cost is incurred. Advertising Costs Advertising costs, which are included in SG&A, are expensed when the advertisement runs. Advertising costs consist primarily of digital, print and televisionadvertisements, as well as promotional events. Advertising expenses were $743 million , $742 million and $711 million in fiscal 2017 , 2016 and 2015 ,respectively. Stock-Based Compensation We apply the fair value recognition provisions of accounting guidance as they relate to our stock-based compensation, which requires us to recognize expense forthe fair value of our stock-based compensation awards. Compensation expense is recognized over the period in which services are required. It is recognized on astraight-line basis, except where there are performance awards that vest on a graded basis in which case the expense for these awards is front-loaded, or recognizedon a graded attribution basis. 2. Discontinued Operations
Discontinued operations are primarily comprised of Jiangsu Five Star Appliance Co., Limited ("Five Star") within our International segment. During the fourthquarter of fiscal 2015, we entered into a definitive agreement to sell our Five Star business to Yingtan City Xiangyuan Investment Limited Partnership andZhejiang Jiayuan Real Estate Group Co. On February 13, 2015, we completed the sale of Five Star and recognized a gain on sale of $99 million . Following thesale of Five Star, we continued to hold as available for sale one retail property in Shanghai, China. The assets of this property were classified as held for sale in theConsolidated Balance Sheets and were $31 million as of January 30, 2016. In May 2016, we completed the sale of the property and recognized a gain, net ofincome tax, of $16 million . The gain on sale of the property is included in other, net within operating activities in the Consolidated Statements of Cash Flows.
66

Table of Contents
The aggregate financial results of all discontinued operations for fiscal 2017 , 2016 and 2015 were as follows ($ in millions):
2017 2016 2015
Revenue $ — $ 217 $ 1,564Restructuring charges (1) — 1 18Gain (loss) from discontinued operations before income tax expense 28 (8) (12)Income tax expense (7) (1) —Gain on sale of discontinued operations — 99 1Net earnings (loss) from discontinued operations including noncontrolling interests 21 90 (11)Net earnings from discontinued operations attributable to noncontrolling interests — — (2)
Net earnings (loss) from discontinued operations attributable to Best Buy Co., Inc. shareholders $ 21 $ 90 $ (13)
(1) See Note 4, Restructuring Charges , for further discussion of the restructuring charges associated with discontinued operations.
3. Fair Value Measurements
Fair value is the price that would be received to sell an asset or paid to transfer a liability (an exit price) in the principal or most advantageous market for the assetor liability in an orderly transaction between market participants on the measurement date. To measure fair value, we use a three-tier valuation hierarchy basedupon observable and non-observable inputs:
Level 1 — Unadjusted quoted prices that are available in active markets for identical assets or liabilities at the measurement date.
Level 2 — Significant other observable inputs available at the measurement date, other than quoted prices included in Level 1, either directly or indirectly,including:
• Quoted prices for similar assets or liabilities in active markets;• Quoted prices for identical or similar assets in non-active markets;• Inputs other than quoted prices that are observable for the asset or liability; and• Inputs that are derived principally from or corroborated by other observable market data.
Level 3 — Significant unobservable inputs that cannot be corroborated by observable market data and reflect the use of significant management judgment. Thesevalues are generally determined using pricing models for which the assumptions utilize management's estimates of market participant assumptions.
Assets and Liabilities that are Measured at Fair Value on a Recurring Basis
The fair value hierarchy requires the use of observable market data when available. In instances in which the inputs used to measure fair value fall into differentlevels of the fair value hierarchy, the fair value measurement has been determined based on the lowest level input that is significant to the fair value measurementin its entirety. Our assessment of the significance of a particular item to the fair value measurement in its entirety requires judgment, including the consideration ofinputs specific to the asset or liability.
67

Table of Contents
The following table sets forth by level within the fair value hierarchy, our financial assets and liabilities that were accounted for at fair value on a recurring basis atJanuary 28, 2017 , and January 30, 2016 , according to the valuation techniques we used to determine their fair values ($ in millions):
Fair Value at
Fair Value Hierarchy January 28, 2017 January 30, 2016
Assets Cash and cash equivalents Money market funds Level 1 $ 290 $ 51Commercial paper Level 2 — 265Time deposits Level 2 15 306
Short-term investments Corporate bonds Level 2 — 193Commercial paper Level 2 349 122Time deposits Level 2 1,332 990
Other current assets Money market funds Level 1 7 —Commercial paper Level 2 60 —Foreign currency derivative instruments Level 2 2 18Time deposits Level 2 100 79
Other assets Interest rate swap derivative instruments Level 2 13 25Auction rate securities Level 3 — 2Marketable securities that fund deferred compensation Level 1 96 96
Liabilities Accrued Liabilities Foreign currency derivative instruments Level 2 3 1
There were no transfers between levels during fiscal 2017 and 2016. During fiscal 2017, our remaining investments in auction rate securities ("ARS") were calledat par, which resulted in proceeds of $2 million and no realized gain or loss. As of January 28, 2017, we had no items measured at fair value on a recurring basisthat used significant unobservable inputs (Level 3). For the periods ended January 30, 2016 there were no changes in the beginning and ending balances of itemsmeasured at fair value on a recurring basis that used significant unobservable inputs (Level 3).
The following methods and assumptions were used to estimate the fair value of each class of financial instrument:
Money Market Funds. Our money market fund investments were measured at fair value as they trade in an active market using quoted market prices and,therefore, are classified as Level 1.
Commercial Paper. Our investments in commercial paper were measured using inputs based upon quoted prices for similar instruments in active markets and,therefore, were classified as Level 2.
Time Deposits. Our time deposits are balances held with banking institutions that cannot be withdrawn for specified terms without a penalty. Time deposits areheld at face value plus accrued interest, which approximates fair value, and are classified as Level 2.
Corporate Bonds. Our corporate bond investments were measured at fair value using quoted market prices. They were classified as Level 2 as they trade in anon-active market for which bond prices are readily available.
Foreign Currency Derivative Instruments. Comprised primarily of foreign currency forward contracts and foreign currency swap contracts, our foreigncurrency derivative instruments were measured at fair value using readily observable market inputs, such as quotations on forward foreign exchange pointsand foreign interest rates. Our foreign currency derivative
68

Table of Contents
instruments were classified as Level 2 as these instruments are custom, over-the-counter contracts with various bank counterparties that are not traded in anactive market.
Interest Rate Swap Derivative Instruments. Our interest rate swap contracts were measured at fair value using readily observable inputs, such as the LIBORinterest rate. Our interest rate swap derivative instruments were classified as Level 2 as these instruments are custom, over-the-counter contracts with variousbank counterparties that are not traded in an active market. Auction Rate Securities. Our investments in auction rate securities ("ARS") were classified as Level 3 as quoted prices were unavailable. Due to limitedmarket information, we utilized a discounted future cash flows ("DCF") model to derive an estimate of fair value. The assumptions we used in preparing theDCF model include estimates with respect to the amount and timing of future interest and principal payments, forward projections of the interest ratebenchmarks, the probability of full repayment of the principal considering the credit quality and guarantees in place, and the rate of return required byinvestors to own such securities given the current liquidity risk associated with ARS. Marketable Securities that Fund Deferred Compensation. The assets that fund our deferred compensation consist of investments in mutual funds. Theseinvestments were classified as Level 1 as the shares of these mutual funds trade with sufficient frequency and volume to enable us to obtain pricinginformation on an ongoing basis.
Assets and Liabilities that are Measured at Fair Value on a Nonrecurring Basis Assets and liabilities that are measured at fair value on a nonrecurring basis relate primarily to our tangible fixed assets, goodwill and other intangible assets, whichare remeasured when the derived fair value is below carrying value on our Consolidated Balance Sheets. For these assets, we do not periodically adjust carryingvalue to fair value, except in the event of impairment. When we determine that impairment has occurred, the carrying value of the asset is reduced to fair value andthe difference is recorded within operating income in our Consolidated Statements of Earnings. There were no fair value remeasurements for non-restructuring property and equipment impairments and restructuring activities related to discontinued operationsrecorded in fiscal 2017 and 2016 . The following table summarizes the fair value remeasurements for non-restructuring property and equipment impairments andrestructuring activities related to continuing operations recorded in fiscal 2017 and 2016 ($ in millions):
2017 2016
Impairments Remaining Net
Carrying Value (1) Impairments Remaining Net
Carrying Value (1)
Property and equipment (non-restructuring) $ 28 $ — $ 61 $ 15Restructuring activities (2) Property and equipment 8 — 30 —Tradename — — 40 —
Total $ 36 $ — $ 131 $ 15
(1) Remaining net carrying value approximates fair value. Because assets subject to long-lived asset impairment are not measured at fair value on a recurring basis, certain fair valuemeasurements presented in the table may reflect values at earlier measurement dates and may no longer represent the fair values at January 28, 2017, and January 30, 2016.
(2) See Note 4, Restructuring Charges , for additional information.
All of the fair value remeasurements included in the table above were based on significant unobservable inputs (Level 3). Fixed asset fair values were derivedusing a DCF model to estimate the present value of net cash flows that the asset or asset group is expected to generate. The key inputs to the DCF model generallyincluded our forecasts of net cash generated from revenue, expenses and other significant cash outflows, such as capital expenditures, as well as an appropriatediscount rate. In the case of assets for which the impairment was the result of restructuring activities, no future cash flows have been assumed as the assets willcease to be used and expected sale values are nominal.
Fair Value of Financial Instruments
Our financial instruments, other than those presented in the disclosures above, include cash, receivables, other investments, accounts payable, other payables andlong-term debt. The fair values of cash, receivables, accounts payable and other payables
69

Table of Contents
approximated carrying values because of the short-term nature of these instruments. If these instruments were measured at fair value in the financial statements,they would be classified as Level 1 in the fair value hierarchy. Fair values for other investments held at cost are not readily available, but we estimate that thecarrying values for these investments approximate fair value. See Note 5, Debt , for information about the fair value of our long-term debt.
4. Restructuring Charges Summary Restructuring charges incurred in fiscal 2017 , 2016 and 2015 were as follows ($ in millions):
2017 2016 2015
Continuing operations Renew Blue Phase 2 $ 26 $ — $ —Canadian brand consolidation 3 200 —Renew Blue (1) 5 (2) 11Other restructuring activities (2) 5 3 (6)Total continuing operations 39 201 5
Discontinued operations Renew Blue (1) — — 18
Total $ 39 $ 201 $ 23(1) Represents activity related to our remaining termination benefits and vacant space liabilities, primarily in our International segment, for our Renew Blue restructuring program, which beganin the fourth quarter of fiscal 2013. Continuing operations charges related to the Domestic segment were $0 million , benefit of $1 million and $10 million for fiscal 2017, 2016 and 2015,respectively; and to the International segment were $5 million , benefit of $1 million and $1 million for fiscal 2017, 2016 and 2015, respectively. All discontinued operations charges related tothe International segment. As of January 28, 2017, the termination benefits liability was $0 million and the remaining vacant space liability was $ 9 million . We may continue to incurimmaterial adjustments to the vacant space liability for charges in sublease assumptions or potential lease buyouts. In addition, lease payments for vacated stores will continue until leases expireor are terminated.
(2) Represents activity related to our remaining vacant space liability for U.S. large-format store closures in fiscal 2013. We may continue to incur immaterial adjustments to the liability forchanges in sublease assumptions or potential lease buyouts. In addition, lease payments for vacated stores will continue until leases expire or are terminated. The remaining vacant space liabilitywas $14 million at January 28, 2017.
Renew Blue Phase 2
In the first quarter of fiscal 2017, we took several strategic actions to eliminate and simplify certain components of our operations and restructure certain field andcorporate teams as part of our Renew Blue Phase 2 plan. In fiscal 2017, we incurred $ 26 million of restructuring charges related to implementing these changes,which primarily consisted of employee termination benefits and property and equipment impairments. All restructuring charges related to this plan are fromcontinuing operations and are presented in restructuring charges in our Consolidated Statement of Earnings.
The composition of the restructuring charges we incurred during fiscal 2017 for Renew Blue Phase 2 was as follows ($ in millions):
Domestic 2017
Property and equipment impairments $ 8Termination benefits 18
Total Renew Blue Phase 2 restructuring charges $ 26
70

Table of Contents
The following table summarizes our restructuring accrual activity during fiscal 2017 related to termination benefits as a result of Renew Blue Phase 2 ($ inmillions):
Termination
BenefitsBalances at January 30, 2016 $ —Charges 19Cash payments (17)Adjustments (2)
Balances at January 28, 2017 $ —
Canadian Brand Consolidation
In the first quarter of fiscal 2016, we consolidated the Future Shop and Best Buy stores and websites in Canada under the Best Buy brand. This resulted in thepermanent closure of 66 Future Shop stores and the conversion of the remaining 65 Future Shop stores to the Best Buy brand. In fiscal 2017, we incurred $ 3million of restructuring charges related to lease exit costs. During fiscal 2016, we incurred $ 200 million of restructuring charges, which primarily consisted oflease exit costs, a tradename impairment, property and equipment impairments, employee termination benefits and inventory write-downs. The inventory write-downs related to our Canadian brand consolidation are presented in restructuring charges – cost of goods sold in our Consolidated Statements of Earnings, and theremainder of the restructuring charges are presented in restructuring charges in our Consolidated Statements of Earnings.
The composition of the restructuring charges we incurred for this program in fiscal 2017 and 2016 , as well as the cumulative amount incurred through the end offiscal 2017 , was as follows ($ in millions):
International
2017 2016 Cumulative Amount
Continuing operations Inventory write-downs $ — $ 3 $ 3Property and equipment impairments — 30 30Tradename impairment — 40 40Termination benefits — 25 25Facility closure and other costs 3 102 105
Total continuing operations $ 3 $ 200 $ 203
The following tables summarize our restructuring accrual activity during the fiscal 2017 and 2016, related to termination benefits and facility closure and othercosts associated with Canadian brand consolidation ($ in millions):
Termination
Benefits
FacilityClosure andOther Costs Total
Balances at January 31, 2015 $ — $ — $ —Charges 28 113 141Cash payments (24) (47) (71)Adjustments (1) (2) 5 3Changes in foreign currency exchange rates — (7) (7)
Balances at January 30, 2016 $ 2 $ 64 $ 66Charges — 1 1Cash payments (2) (37) (39)Adjustments (1) — 2 2Changes in foreign currency exchange rates — 4 4
Balances at January 28, 2017 $ — $ 34 $ 34(1) The adjustments related to termination benefits relate to higher-than-expected employee retention. Adjustments to facility closure and other costs represent changes in sublease assumptions.
71
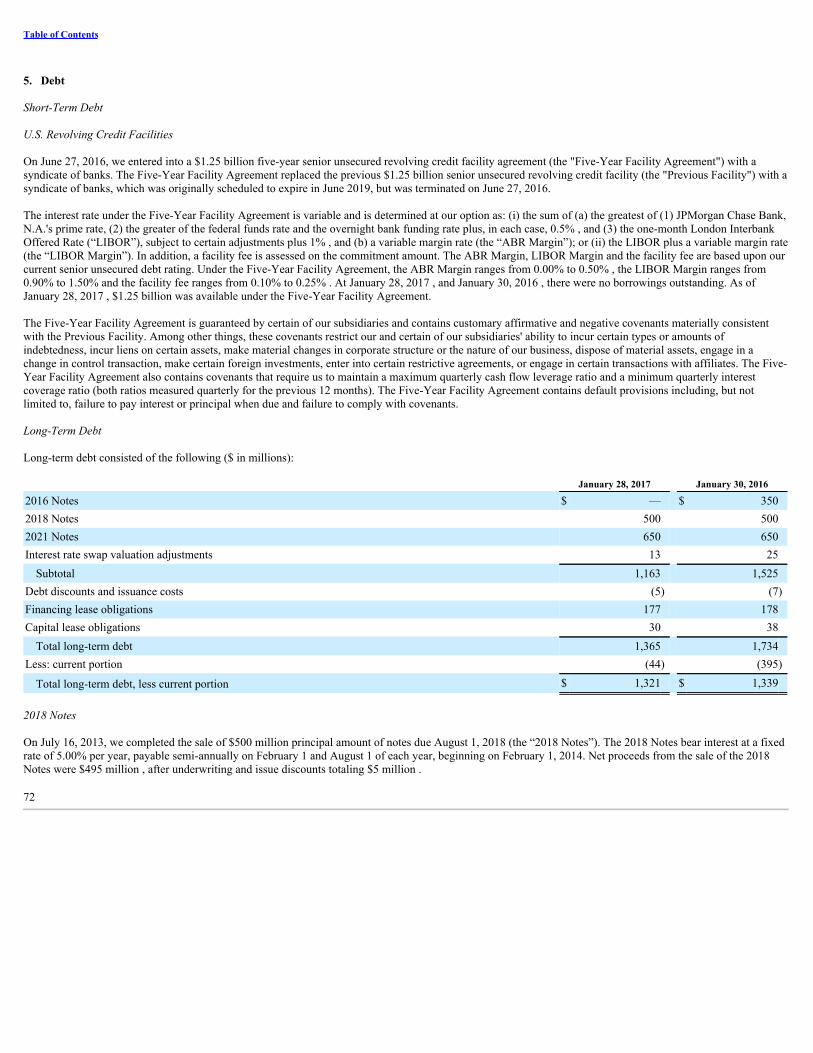
Table of Contents
5. Debt Short-Term Debt
U.S. Revolving Credit Facilities
On June 27, 2016, we entered into a $1.25 billion five-year senior unsecured revolving credit facility agreement (the "Five-Year Facility Agreement") with asyndicate of banks. The Five-Year Facility Agreement replaced the previous $1.25 billion senior unsecured revolving credit facility (the "Previous Facility") with asyndicate of banks, which was originally scheduled to expire in June 2019, but was terminated on June 27, 2016.
The interest rate under the Five-Year Facility Agreement is variable and is determined at our option as: (i) the sum of (a) the greatest of (1) JPMorgan Chase Bank,N.A.'s prime rate, (2) the greater of the federal funds rate and the overnight bank funding rate plus, in each case, 0.5% , and (3) the one-month London InterbankOffered Rate (“LIBOR”), subject to certain adjustments plus 1% , and (b) a variable margin rate (the “ABR Margin”); or (ii) the LIBOR plus a variable margin rate(the “LIBOR Margin”). In addition, a facility fee is assessed on the commitment amount. The ABR Margin, LIBOR Margin and the facility fee are based upon ourcurrent senior unsecured debt rating. Under the Five-Year Facility Agreement, the ABR Margin ranges from 0.00% to 0.50% , the LIBOR Margin ranges from0.90% to 1.50% and the facility fee ranges from 0.10% to 0.25% . At January 28, 2017 , and January 30, 2016 , there were no borrowings outstanding. As ofJanuary 28, 2017 , $1.25 billion was available under the Five-Year Facility Agreement. The Five-Year Facility Agreement is guaranteed by certain of our subsidiaries and contains customary affirmative and negative covenants materially consistentwith the Previous Facility. Among other things, these covenants restrict our and certain of our subsidiaries' ability to incur certain types or amounts ofindebtedness, incur liens on certain assets, make material changes in corporate structure or the nature of our business, dispose of material assets, engage in achange in control transaction, make certain foreign investments, enter into certain restrictive agreements, or engage in certain transactions with affiliates. The Five-Year Facility Agreement also contains covenants that require us to maintain a maximum quarterly cash flow leverage ratio and a minimum quarterly interestcoverage ratio (both ratios measured quarterly for the previous 12 months). The Five-Year Facility Agreement contains default provisions including, but notlimited to, failure to pay interest or principal when due and failure to comply with covenants.
Long-Term Debt Long-term debt consisted of the following ($ in millions):
January 28, 2017 January 30, 2016
2016 Notes $ — $ 3502018 Notes 500 5002021 Notes 650 650Interest rate swap valuation adjustments 13 25Subtotal 1,163 1,525
Debt discounts and issuance costs (5) (7)Financing lease obligations 177 178Capital lease obligations 30 38Total long-term debt 1,365 1,734
Less: current portion (44) (395)
Total long-term debt, less current portion $ 1,321 $ 1,339
2018 Notes On July 16, 2013, we completed the sale of $500 million principal amount of notes due August 1, 2018 (the “2018 Notes”). The 2018 Notes bear interest at a fixedrate of 5.00% per year, payable semi-annually on February 1 and August 1 of each year, beginning on February 1, 2014. Net proceeds from the sale of the 2018Notes were $495 million , after underwriting and issue discounts totaling $5 million .
72

Table of Contents
We may redeem some or all of the 2018 Notes at any time, at a redemption price equal to the greater of (1) 100% of the principal amount of the 2018 Notes to beredeemed and (2) the sum of the present values of each remaining scheduled payment of principal and interest on the 2018 Notes to be redeemed discounted to theredemption date on a semi-annual basis at the Treasury Rate plus 50 basis points. Furthermore, if a change of control triggering event occurs, we will be required tooffer to purchase the remaining unredeemed 2018 Notes at a price equal to 101% of their principal amount, plus accrued and unpaid interest to the purchase date. The 2018 Notes are unsecured and unsubordinated obligations and rank equally with all of our other unsecured and unsubordinated debt. The 2018 Notes containcovenants that, among other things, limit our ability and the ability of our subsidiaries to incur debt secured by liens and enter into sale and lease-back transactions. 2016 and 2021 Notes In March 2011, we issued $350 million principal amount of notes due March 15, 2016 (the “2016 Notes”) and $650 million principal amount of notes due March15, 2021 (the “2021 Notes” and, together with the 2016 Notes, the “Notes”). In March 2016, we repaid the 2016 Notes using existing cash resources. The 2016Notes bore interest at a fixed rate of 3.75% per year, while the 2021 Notes bear interest at a fixed rate of 5.50% per year. Interest on the 2021 Notes is payablesemi-annually on March 15 and September 15 of each year, beginning on September 15, 2011. The 2021 Notes were issued at a slight discount to par, which whencoupled with underwriting discounts of $6 million , resulted in net proceeds from the sale of the Notes of $990 million . We may redeem some or all of the 2021 Notes at any time at a redemption price equal to the greater of (i) 100% of the principal amount and (ii) the sum of thepresent values of each remaining scheduled payment of principal and interest discounted to the redemption date on a semiannual basis, plus accrued and unpaidinterest on the principal amount to the redemption date as described in the indenture (including the supplemental indenture) relating to the 2021 Notes.Furthermore, if a change of control triggering event occurs, we will be required to offer to purchase the remaining unredeemed 2021 Notes at a price equal to 101%of their principal amount, plus accrued and unpaid interest to the purchase date.
The 2021 Notes are unsecured and unsubordinated obligations and rank equally with all of our other unsecured and unsubordinated debt. The 2021 Notes containcovenants that, among other things, limit our ability to incur debt secured by liens or to enter into sale and lease-back transactions. Fair Value and Future Maturities The fair value of long-term debt, excluding debt discounts and issuance costs and financing and capital lease obligations, approximated $1,240 million and $1,543million at January 28, 2017 , and January 30, 2016 , respectively, based primarily on the quoted market prices, compared to carrying values of $1,163 million and$1,525 million , respectively. If our long-term debt was recorded at fair value, it would be classified as Level 2 in the fair value hierarchy. At January 28, 2017 , the future maturities of long-term debt, excluding debt discounts and issuance costs and financing and capital lease obligations (see Note 8,Leases , for the future lease obligation maturities), consisted of the following ($ in millions):
Fiscal Year
2018 $ —2019 5112020 —2021 —2022 652Thereafter —
Total long-term debt $ 1,163
6. Derivative Instruments
We manage our economic and transaction exposure to certain risks through the use of foreign currency derivative instruments and interest rate swaps. Ourobjective in holding derivatives is to reduce the volatility of net earnings, cash flows and net asset
73

Table of Contents
value associated with changes in foreign currency exchange rates and interest rates. We do not hold derivative instruments for trading or speculative purposes. Wehave no derivatives that have credit risk-related contingent features, and we mitigate our credit risk by engaging with financial institutions with investment gradecredit ratings as our counterparties.
We record all derivative instruments on our Consolidated Balance Sheet at fair value and evaluate hedge effectiveness prospectively and retrospectively whenelecting to apply hedge accounting. We formally document all hedging relations at inception for derivative hedges and the underlying hedged items, as well as therisk management objectives and strategies for undertaking the hedge transaction. In addition, we have derivatives which are not designated as hedging instruments.
Net Investment Hedges
We use foreign exchange forward contracts to hedge against the effect of Canadian dollar exchange rate fluctuations on a portion of our net investment in ourCanadian operations. The contracts have terms up to 12 months. For a net investment hedge, we recognize changes in the fair value of the derivative as acomponent of foreign currency translation within other comprehensive income to offset a portion of the change in translated value of the net investment beinghedged, until the investment is sold or liquidated. We limit recognition in net earnings of amounts previously recorded in other comprehensive income tocircumstances such as complete or substantially complete liquidation of the net investment in the hedged foreign operation. We report the ineffective portion of thegain or loss, if any, in net earnings.
Interest Rate Swaps
We use "receive fixed-rate, pay variable-rate" interest rate swaps to mitigate the effect of interest rate fluctuations on a portion of our 2018 Notes and 2021 Notes.Our interest rate swap contracts are considered perfect hedges because the critical terms and notional amounts match those of our fixed-rate debt being hedged andare therefore accounted as a fair value hedge using the shortcut method. Under the shortcut method, we recognize the change in the fair value of the derivativeswith an offsetting change to the carrying value of the debt. Accordingly, there is no impact on our Consolidated Statements of Earnings from the fair value of thederivatives.
Derivatives Not Designated as Hedging Instruments
We use foreign currency forward contracts to manage the impact of fluctuations in foreign currency exchange rates relative to recognized receivable and payablebalances denominated in non-functional currencies. The contracts generally have terms of up to 12 months. These derivative instruments are not designated inhedging relationships and, therefore, we record gains and losses on these contracts directly to net earnings.
Summary of Derivative Balances
The following table presents the gross fair values for outstanding derivative instruments and the corresponding classification at January 28, 2017 , and January 30,2016 :
January 28, 2017 January 30, 2016
Contract Type Assets Liabilities Assets Liabilities
Derivatives designated as net investment hedges (1) $ 2 $ 2 $ 15 $ 1Derivatives designated as interest rate swaps (2) 13 — 25 —No hedge designation (foreign exchange forward contracts) (1) — 1 3 —
Total $ 15 $ 3 $ 43 $ 1
(1) The fair value is recorded in other current assets or accrued liabilities.
(2) The fair value is recorded in other assets or long-term liabilities.
74
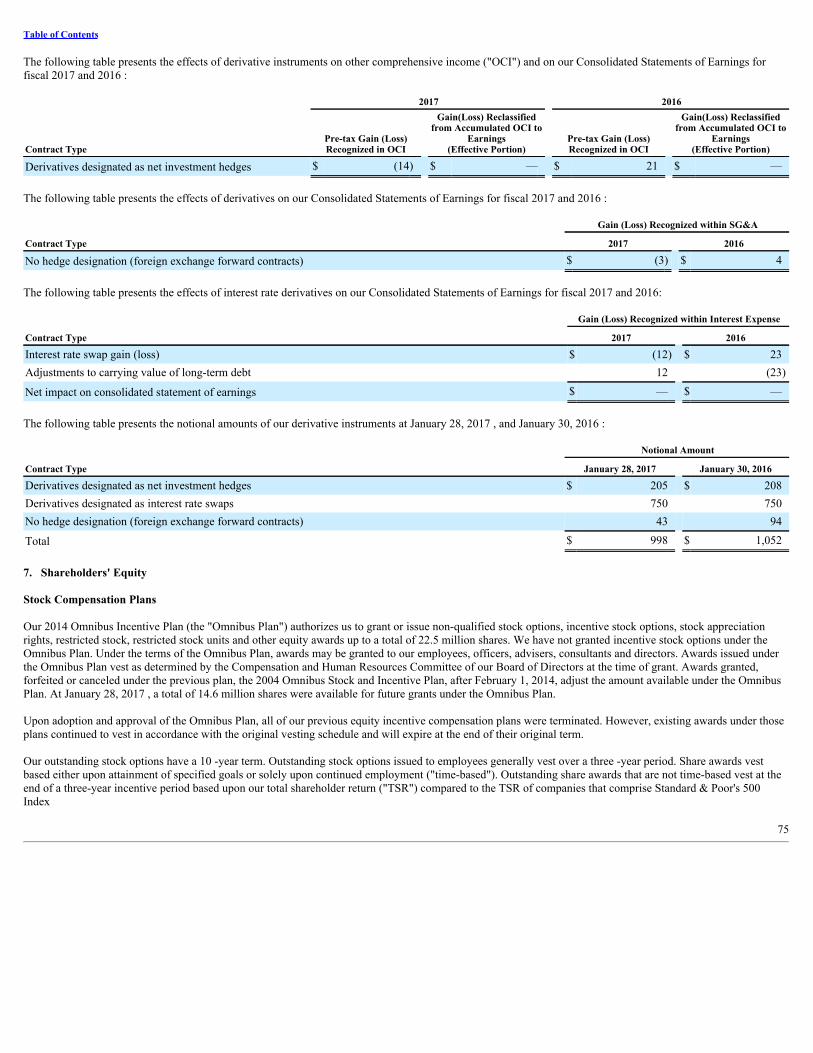
Table of Contents
The following table presents the effects of derivative instruments on other comprehensive income ("OCI") and on our Consolidated Statements of Earnings forfiscal 2017 and 2016 :
2017 2016
Contract TypePre-tax Gain (Loss)Recognized in OCI
Gain(Loss) Reclassifiedfrom Accumulated OCI to
Earnings(Effective Portion)
Pre-tax Gain (Loss)Recognized in OCI
Gain(Loss) Reclassifiedfrom Accumulated OCI to
Earnings(Effective Portion)
Derivatives designated as net investment hedges $ (14) $ — $ 21 $ —
The following table presents the effects of derivatives on our Consolidated Statements of Earnings for fiscal 2017 and 2016 :
Gain (Loss) Recognized within SG&A
Contract Type 2017 2016
No hedge designation (foreign exchange forward contracts) $ (3) $ 4
The following table presents the effects of interest rate derivatives on our Consolidated Statements of Earnings for fiscal 2017 and 2016:
Gain (Loss) Recognized within Interest Expense
Contract Type 2017 2016
Interest rate swap gain (loss) $ (12) $ 23Adjustments to carrying value of long-term debt 12 (23)
Net impact on consolidated statement of earnings $ — $ —
The following table presents the notional amounts of our derivative instruments at January 28, 2017 , and January 30, 2016 :
Notional Amount
Contract Type January 28, 2017 January 30, 2016
Derivatives designated as net investment hedges $ 205 $ 208Derivatives designated as interest rate swaps 750 750No hedge designation (foreign exchange forward contracts) 43 94
Total $ 998 $ 1,052
7. Shareholders' Equity
Stock Compensation Plans
Our 2014 Omnibus Incentive Plan (the "Omnibus Plan") authorizes us to grant or issue non-qualified stock options, incentive stock options, stock appreciationrights, restricted stock, restricted stock units and other equity awards up to a total of 22.5 million shares. We have not granted incentive stock options under theOmnibus Plan. Under the terms of the Omnibus Plan, awards may be granted to our employees, officers, advisers, consultants and directors. Awards issued underthe Omnibus Plan vest as determined by the Compensation and Human Resources Committee of our Board of Directors at the time of grant. Awards granted,forfeited or canceled under the previous plan, the 2004 Omnibus Stock and Incentive Plan, after February 1, 2014, adjust the amount available under the OmnibusPlan. At January 28, 2017 , a total of 14.6 million shares were available for future grants under the Omnibus Plan.
Upon adoption and approval of the Omnibus Plan, all of our previous equity incentive compensation plans were terminated. However, existing awards under thoseplans continued to vest in accordance with the original vesting schedule and will expire at the end of their original term.
Our outstanding stock options have a 10 -year term. Outstanding stock options issued to employees generally vest over a three -year period. Share awards vestbased either upon attainment of specified goals or solely upon continued employment ("time-based"). Outstanding share awards that are not time-based vest at theend of a three-year incentive period based upon our total shareholder return ("TSR") compared to the TSR of companies that comprise Standard & Poor's 500Index
75

Table of Contents
("market-based") or upon the achievement of company performance goals ("performance-based"). We have time-based share awards that vest in their entirety atthe end of three -year periods, time-based share awards where 25% of the award vests on the date of grant and 25% vests on each of the three anniversary datesthereafter and time-based share awards to directors that vest one year from the grant date.
Our Employee Stock Purchase Plan, as amended, permits employees to purchase our common stock at a 5% discount from the market price at the end of semi-annual purchase periods and is non-compensatory. Employees are required to hold the common stock purchased for 12 months. In fiscal 2017 , 2016 and 2015 , 0.2million , 0.2 million and 0.3 million shares, respectively, were purchased through our employee stock purchase plans. At January 28, 2017 , and January 30, 2016 ,plan participants had accumulated $2 million and $2 million , respectively, to purchase our common stock pursuant to these plans.
Stock-based compensation expense was as follows in fiscal 2017 , 2016 and 2015 ($ in millions):
2017 2016 2015
Stock options $ 9 $ 15 $ 17Share awards
Market-based 15 16 10Performance-based 6 — —Time-based 78 73 60
Total $ 108 $ 104 $ 87 Stock Options Stock option activity was as follows in fiscal 2017 :
Stock
Options Weighted-Average
Exercise Price per Share
Weighted-AverageRemaining Contractual
Term(in years)
Aggregate Intrinsic Value
(in millions)
Outstanding at January 30, 2016 14,242,000 $ 36.51 Granted 224,000 $ 31.79 Exercised (5,273,000) $ 31.29 Forfeited/Canceled (2,206,000) $ 48.13
Outstanding at January 28, 2017 6,987,000 $ 36.61 4.3 $ 54
Vested or expected to vest at January 28, 2017 6,987,000 $ 36.61 4.3 $ 54Exercisable at January 28, 2017 5,858,000 $ 36.63 3.5 $ 46 The weighted-average grant-date fair value of stock options granted during fiscal 2017 , 2016 and 2015 was $8.04 , $11.59 and $9.09 , respectively, per share. Theaggregate intrinsic value of our stock options (the amount by which the market price of the stock on the date of exercise exceeded the exercise price of the option)exercised during fiscal 2017 , 2016 and 2015 , was $55 million , $14 million and $13 million , respectively. At January 28, 2017 , there was $8 million ofunrecognized compensation expense related to stock options that is expected to be recognized over a weighted-average period of 1.0 years. Net cash proceeds from the exercise of stock options were $164 million , $40 million and $42 million in fiscal 2017 , 2016 and 2015 , respectively.
There was $19 million , $5 million and $5 million of income tax benefits realized from stock option exercises in fiscal 2017 , 2016 and 2015 , respectively.
76
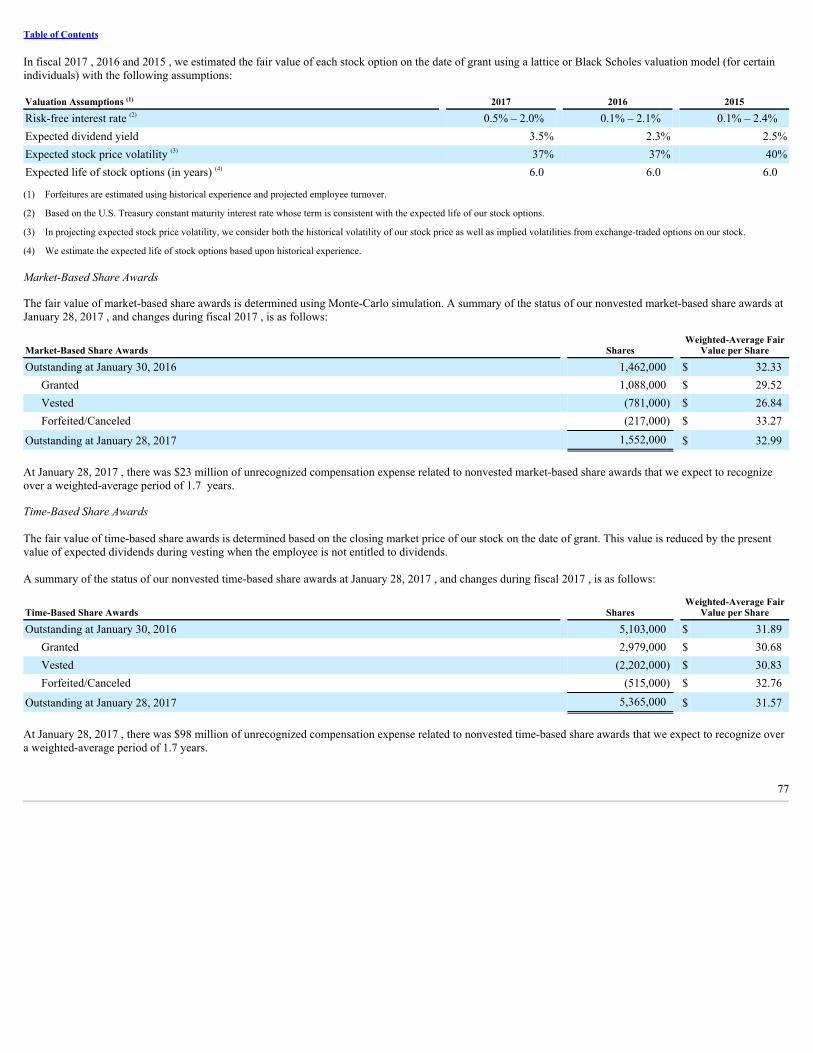
Table of Contents
In fiscal 2017 , 2016 and 2015 , we estimated the fair value of each stock option on the date of grant using a lattice or Black Scholes valuation model (for certainindividuals) with the following assumptions:
Valuation Assumptions (1) 2017 2016 2015
Risk-free interest rate (2) 0.5% – 2.0% 0.1% – 2.1% 0.1% – 2.4%Expected dividend yield 3.5% 2.3% 2.5%Expected stock price volatility (3) 37% 37% 40%Expected life of stock options (in years) (4) 6.0 6.0 6.0
(1) Forfeitures are estimated using historical experience and projected employee turnover.
(2) Based on the U.S. Treasury constant maturity interest rate whose term is consistent with the expected life of our stock options.
(3) In projecting expected stock price volatility, we consider both the historical volatility of our stock price as well as implied volatilities from exchange-traded options on our stock.
(4) We estimate the expected life of stock options based upon historical experience.
Market-Based Share Awards
The fair value of market-based share awards is determined using Monte-Carlo simulation. A summary of the status of our nonvested market-based share awards atJanuary 28, 2017 , and changes during fiscal 2017 , is as follows:
Market-Based Share Awards Shares Weighted-Average Fair
Value per Share
Outstanding at January 30, 2016 1,462,000 $ 32.33Granted 1,088,000 $ 29.52Vested (781,000) $ 26.84Forfeited/Canceled (217,000) $ 33.27
Outstanding at January 28, 2017 1,552,000 $ 32.99
At January 28, 2017 , there was $23 million of unrecognized compensation expense related to nonvested market-based share awards that we expect to recognizeover a weighted-average period of 1.7 years.
Time-Based Share Awards
The fair value of time-based share awards is determined based on the closing market price of our stock on the date of grant. This value is reduced by the presentvalue of expected dividends during vesting when the employee is not entitled to dividends.
A summary of the status of our nonvested time-based share awards at January 28, 2017 , and changes during fiscal 2017 , is as follows:
Time-Based Share Awards Shares Weighted-Average Fair
Value per Share
Outstanding at January 30, 2016 5,103,000 $ 31.89Granted 2,979,000 $ 30.68Vested (2,202,000) $ 30.83Forfeited/Canceled (515,000) $ 32.76
Outstanding at January 28, 2017 5,365,000 $ 31.57
At January 28, 2017 , there was $98 million of unrecognized compensation expense related to nonvested time-based share awards that we expect to recognize overa weighted-average period of 1.7 years.
77

Table of Contents
Performance-Based Share Awards
The fair value of performance-based share awards is determined based on the closing market price of our stock on the date of grant. This value is reduced by thepresent value of expected dividends during vesting when the employee is not entitled to dividends.
A summary of the status of our nonvested performance-based share awards at January 28, 2017 , and changes during fiscal 2017 , is as follows:
Performance-Based Share Awards Shares Weighted-Average Fair
Value per Share
Outstanding at January 30, 2016 — $ —Granted 513,000 $ 29.08Forfeited/Canceled (75,000) $ 29.66
Outstanding at January 28, 2017 438,000 $ 28.98
At January 28, 2017 , there was $5 million of unrecognized compensation expense related to nonvested performance-based share awards that we expect torecognize over a weighted-average period of 1.8 years.
Earnings per Share
We compute our basic earnings per share based on the weighted-average number of common shares outstanding, and our diluted earnings per share based on theweighted-average number of common shares outstanding adjusted by the number of additional shares that would have been outstanding had the potentially dilutivecommon shares been issued. Potentially dilutive securities include stock options, nonvested share awards and shares issuable under our employee stock purchaseplan. Nonvested market-based share awards and nonvested performance-based share awards are included in the average diluted shares outstanding each period ifestablished market or performance criteria have been met at the end of the respective periods.
At January 28, 2017 , options to purchase 7.0 million shares of common stock were outstanding as follows (shares in millions):
Exercisable Unexercisable Total
Shares %
Weighted-Average Price
per Share Shares %
Weighted-Average Price
per Share Shares %
Weighted-Average Price
per Share
In-the-money 2.3 39% $ 26.38 0.5 45% $ 30.84 2.8 40% $ 27.13Out-of-the-money 3.6 61% $ 43.45 0.6 55% $ 40.66 4.2 60% $ 43.01
Total 5.9 100% $ 36.64 1.1 100% $ 36.54 7.0 100% $ 36.61
The computation of dilutive shares outstanding excludes the out-of-the-money stock options because such outstanding options' exercise prices were greater thanthe average market price of our common shares and, therefore, the effect would be anti-dilutive (i.e., including such options would result in higher earnings pershare).
78

Table of Contents
The following table presents a reconciliation of the numerators and denominators of basic and diluted earnings per share from continuing operations attributable toBest Buy Co., Inc. in fiscal 2017 , 2016 and 2015 ($ and shares in millions, except per share amounts):
2017 2016 2015
Numerator (in millions): Net earnings from continuing operations attributable to Best Buy Co., Inc., shareholders $ 1,207 $ 807 $ 1,246
Denominator (in millions): Weighted-average common shares outstanding 318.5 346.5 349.5Effect of potentially dilutive securities: Stock options and other 4.1 4.2 4.1
Weighted-average common shares outstanding, assuming dilution 322.6 350.7 353.6Net earnings per share from continuing operations attributable to Best Buy Co., Inc.
shareholders Basic $ 3.79 $ 2.33 $ 3.57Diluted $ 3.74 $ 2.30 $ 3.53
Repurchase of Common Stock In June 2011, our Board of Directors authorized a $5.0 billion share repurchase program. There is no expiration date governing the period over which we canrepurchase shares under the June 2011 share repurchase program.
On January 22, 2016, we entered into a variable notional accelerated share repurchase agreement ("January 2016 ASR") with a third party financial institution torepurchase $150 million to $175 million of our common stock. Under the agreement, we paid $175 million at the beginning of the contract and received an initialdelivery of 4.4 million shares on January 25, 2016. We retired these shares and recorded a $120 million reduction to stockholders' equity. As of January 30, 2016,the remaining $55 million was included as a reduction of stockholders' equity as prepaid share repurchase on our Consolidated Balance Sheets. The January 2016ASR was settled on February 17, 2016, for a final notional amount of $165 million . Accordingly we received 1.6 million shares, which were retired, and a $10million cash payment from our counter-party equal to the difference between the $175 million up-front payment and the final notional amount. The cash receivedwas included as other, net within financing activities on our Consolidated Statements of Cash Flow. The final notional amount was determined based upon thevolume-weighted average share price of our common stock during the term of the January 2016 ASR agreement. The number of shares delivered was based uponthe final notional amount and the volume-weighted average share price of our common stock during the term of the agreement, less an agreed-upon discount.
79

Table of Contents
The following table presents information regarding the shares we repurchased and retired in fiscal 2017 and 2016 , noting that we had no repurchases andretirements in fiscal 2015 ($ and shares in millions, except per share amounts):
2017 2016
Total cost of shares repurchased Open market (1) $ 706 $ 880January 2016 ASR 45 120
Total $ 751 $ 1,000
Average price per share Open market $ 36.11 $ 31.03January 2016 ASR $ 28.55 $ 27.28
Average $ 35.54 $ 30.53
Number of shares repurchased and retired
Open market (1) 19.5 28.4January 2016 ASR 1.6 4.4
Total 21.1 32.8
(1) As of January 28, 2017 , $8 million , or 0.1 million shares, in trades remained unsettled. The liability for unsettled trades is included in accrued liabilities in the Consolidated BalanceSheets.
At January 28, 2017 , $2.2 billion remained available for additional purchases under the June 2011 share repurchase program. In February 2017, our Board ofDirectors authorized a new $5.0 billion share repurchase plan, which supersedes the June 2011 share repurchase program. There is no expiration date governing theperiod over which we can repurchase shares under the February 2017 share repurchase program. Repurchased shares have been retired and constitute authorizedbut unissued shares. Comprehensive Income (Loss) Comprehensive income (loss) is computed as net earnings plus certain other items that are recorded directly to shareholders' equity. In addition to net earnings, thesignificant components of comprehensive income (loss) include foreign currency translation adjustments and unrealized gains and losses, net of tax, on available-for-sale marketable equity securities. Foreign currency translation adjustments do not include a provision for income tax expense when earnings from foreignoperations are considered to be indefinitely reinvested outside the U.S.
80

Table of Contents
The following table provides a reconciliation of the components of accumulated other comprehensive income, net of tax, attributable to Best Buy Co., Inc.shareholders for fiscal 2017 , 2016 , and 2015 , respectively ($ in millions):
Foreign Currency
Translation Available-For-Sale
Investments (1) Total
Balances at February 1, 2014 $ 485 $ 7 $ 492Foreign currency translation adjustments (103) — (103)Unrealized gains on available-for-sale investments — (3) (3)Reclassification of losses on available-for-sale investments into earnings — (4) (4)
Balances at January 31, 2015 382 — 382Foreign currency translation adjustments (44) — (44)Reclassification of foreign currency translation adjustments into earnings due to saleof business (67) — (67)
Balances at January 30, 2016 271 — 271Foreign currency translation adjustments 10 — 10Reclassification of foreign currency translation adjustments into earnings (2) — (2)
Balances at January 28, 2017 $ 279 $ — $ 279(1) There were no material tax impacts to gains or losses on available-for-sale investments in the periods presented.
8. Leases
The composition of net rent expense for all operating leases, including leases of property and equipment, was as follows in fiscal 2017 , 2016 and 2015 ($ inmillions):
2017 2016 2015
Minimum rentals $ 789 $ 797 $ 848Contingent rentals 1 1 2Total rent expense 790 798 850
Less: sublease income (16) (15) (18)
Net rent expense $ 774 $ 783 $ 832
The future minimum lease payments under our capital, financing and operating leases by fiscal year (not including contingent rentals) at January 28, 2017 , were asfollows ($ in millions):
Fiscal Year CapitalLeases
FinancingLeases
OperatingLeases (1)
2018 $ 9 $ 46 $ 8032019 7 41 6762020 4 35 5462021 3 28 4112022 2 20 285Thereafter 11 56 404
Total minimum lease payments 36 226 $ 3,125
Less amount representing interest (6) (49) Present value of minimum lease payments 30 177
Less current maturities (8) (36)
Present value of minimum lease payments, less current maturities $ 22 $ 141
(1) Operating lease obligations do not include payments to landlords covering real estate taxes and common area maintenance. These charges, if included, would increase total operating leaseobligations by $1.0 billion at January 28, 2017 .
81

Table of Contents
Total minimum lease payments have not been reduced by minimum sublease rent income of approximately $79 million due under future noncancelable subleases.
9. Benefit Plans
We sponsor retirement savings plans for employees meeting certain eligibility requirements. Participants may choose from various investment options, including afund comprised of our company stock. Participants can contribute up to 50% of their eligible compensation annually as defined by the plan document, subject toInternal Revenue Service limitations. We match 100% of the first 3% of participating employees' contributions and 50% of the next 2% . Employer contributionsvest immediately. The total employer contributions were $56 million , $53 million and $60 million in fiscal 2017 , 2016 and 2015 , respectively.
We have a non-qualified, unfunded deferred compensation plan for highly compensated employees and members of our Board of Directors. Amounts contributedand deferred under our deferred compensation plan are credited or charged with the performance of investment options offered under the plan and elected by theparticipants. In the event of bankruptcy, the assets of the plan are available to satisfy the claims of general creditors. The liability for compensation deferred underthe plan was $31 million and $34 million at January 28, 2017 , and January 30, 2016 , respectively, and is included in long-term liabilities. We manage the risk ofchanges in the fair value of the liability for deferred compensation by electing to match our liability under the plan with investment vehicles that offset a substantialportion of our exposure. The fair value of the investment vehicles, which includes funding for future deferrals, was $96 million and $96 million at January 28, 2017, and January 30, 2016 , respectively, and is included in other assets.
10. Income Taxes
The following is a reconciliation of the federal statutory income tax rate to income tax expense in fiscal 2017 , 2016 and 2015 ($ in millions):
2017 2016 2015
Federal income tax at the statutory rate $ 635 $ 458 $ 485State income taxes, net of federal benefit 38 38 43(Benefit) expense from foreign operations (46) 5 (23)Other (18) 2 (11)Legal entity reorganization — — (353)
Income tax expense $ 609 $ 503 $ 141
Effective income tax rate 33.5% 38.4% 10.1%
Legal Entity Reorganization
In the fourth quarter of fiscal 2012, we purchased Carphone Warehouse Group plc's interest in the Best Buy Mobile profit share agreement for $1.3 billion (the“Mobile buy-out”). The Mobile buy-out completed by our U.K. subsidiary resulted in the $1.3 billion purchase price being assigned, for U.S. tax purposes only,to an intangible asset. The Mobile buy-out did not, however, result in a similar intangible asset in the U.K., as the Mobile buy-out was considered part of a tax-freeequity transaction for U.K. tax purposes.
Because the U.S. tax basis in the intangible asset was considered under U.S. tax law to be held by our U.K. subsidiary, which was regarded as a foreign corporationfor U.S. tax purposes, Accounting Standards Codification ("ASC") 740, Income Taxes , requires that no deferred tax asset may be recorded in respect of theintangible asset. ASC 740-30-25-9 also precludes the recording of a deferred tax asset on the outside basis difference of the U.K. subsidiary. As a result, theamortization of the U.S. tax basis in the intangible asset only resulted in a periodic income tax benefit by reducing the amount of the U.K. subsidiary’s income, ifany, that would otherwise have been subject to U.S. income taxes.
In the first quarter of fiscal 2015, we filed an election with the Internal Revenue Service to treat the U.K. subsidiary as a disregarded entity such that its assets arenow deemed to be assets held directly by a U.S. entity for U.S. tax purposes. This tax-only election, which resulted in the liquidation of the U.K. subsidiary forU.S. tax purposes, resulted in the elimination of our outside basis difference in the U.K. subsidiary. Additionally, the election resulted in the recognition of adeferred tax asset (and
82

Table of Contents
corresponding income tax benefit) for the remaining unrecognized inside tax basis in the intangible, in a manner similar to a change in tax status as provided inASC 740-10-25-32.
Earnings from continuing operations before income tax expense by jurisdiction was as follows in fiscal 2017 , 2016 and 2015 ($ in millions):
2017 2016 2015
United States $ 1,507 $ 1,310 $ 1,201Outside the United States 309 — 186
Earnings from continuing operations before income tax expense $ 1,816 $ 1,310 $ 1,387
Income tax expense was comprised of the following in fiscal 2017 , 2016 and 2015 ($ in millions):
2017 2016 2015
Current: Federal $ 317 $ 347 $ 354State 37 48 51Foreign 54 60 33
408 455 438Deferred:
Federal 163 65 (275)State 21 10 (26)Foreign 17 (27) 4
201 48 (297)
Income tax expense $ 609 $ 503 $ 141
Deferred taxes are the result of differences between the bases of assets and liabilities for financial reporting and income tax purposes. Deferred tax assets andliabilities were comprised of the following ($ in millions):
January 28, 2017 January 30, 2016
Accrued property expenses $ 91 $ 175Other accrued expenses 76 78Deferred revenue 104 99Compensation and benefits 43 99Stock-based compensation 64 86Goodwill and intangibles 210 253Loss and credit carryforwards 123 133Other 59 86
Total deferred tax assets 770 1,009Valuation allowance (94) (108)
Total deferred tax assets after valuation allowance 676 901Property and equipment (240) (296)Inventory (97) (69)Other (22) (26)
Total deferred tax liabilities (359) (391)
Net deferred tax assets $ 317 $ 510
Net deferred tax assets are included in our Consolidated Balance Sheets as other assets as of January 28, 2017, and January 30, 2016.
83

Table of Contents
At January 28, 2017 , we had total net operating loss carryforwards from international operations of $77 million , of which $70 million will expire in various yearsthrough 2036 and the remaining amounts have no expiration. Additionally, we had acquired U.S. federal net operating loss carryforwards of $17 million , whichexpire between 2023 and 2030 ; U.S. federal foreign tax credit carryforwards of $1 million , which expire between 2023 and 2026; U.S. federal capital losscarryforwards of $3 million , which expire in 2022 ; state credit carryforwards of $10 million , which expire in 2024 ; state capital loss carryforwards of $5 million, which expire in 2019 ; international credit carryforwards of $2 million , which have no expiration; and international capital loss carryforwards of $8 million ,which have no expiration.
At January 28, 2017 , a valuation allowance of $94 million had been established, of which $1 million is against U.S. federal foreign tax credit carryforwards; $16million is against international, U.S. federal and state capital loss carryforwards; $7 million is against state credit carryforwards and other state deferred tax assets;and $70 million is against certain international net operating loss carryforwards and other international deferred tax assets. The $14 million decrease fromJanuary 30, 2016 , is primarily due to the exchange rate impact on the valuation allowance against certain international net operating loss carryforwards.
We have not provided deferred taxes on unremitted earnings attributable to foreign operations that have been considered to be reinvested indefinitely. Theseearnings relate to ongoing operations and were $1.1 billion at January 28, 2017 . It is not practicable to determine the income tax liability that would be payable ifsuch earnings were not indefinitely reinvested.
The following table provides a reconciliation of changes in unrecognized tax benefits for fiscal 2017 , 2016 and 2015 ($ in millions):
2017 2016 2015
Balance at beginning of period $ 469 $ 410 $ 370Gross increases related to prior period tax positions 11 30 33Gross decreases related to prior period tax positions (144) (13) (88)Gross increases related to current period tax positions 55 59 114Settlements with taxing authorities (12) (9) (9)Lapse of statute of limitations (5) (8) (10)
Balance at end of period $ 374 $ 469 $ 410
Unrecognized tax benefits of $346 million , $337 million and $297 million at January 28, 2017 , January 30, 2016 , and January 31, 2015 , respectively, wouldfavorably impact our effective income tax rate if recognized.
We recognize interest and penalties (not included in the "unrecognized tax benefits" above), as well as interest received from favorable tax settlements, ascomponents of income tax expense. Interest income of $9 million was recognized in fiscal 2017 . At January 28, 2017 , January 30, 2016 , and January 31, 2015 ,we had accrued interest of $61 million , $89 million and $78 million , respectively, along with accrued penalties of $1 million , $1 million and $2 million atJanuary 28, 2017 , January 30, 2016 , and January 31, 2015 , respectively.
We file a consolidated U.S. federal income tax return, as well as income tax returns in various states and foreign jurisdictions. With few exceptions, we are nolonger subject to U.S. federal, state and local, or non-U.S. income tax examinations by tax authorities for years before fiscal 2007 .
Because existing tax positions will continue to generate increased liabilities for us for unrecognized tax benefits over the next 12 months, and since we areroutinely under audit by various taxing authorities, it is reasonably possible that the amount of unrecognized tax benefits will change during the next 12 months.An estimate of the amount or range of such change cannot be made at this time. However, we do not expect the change, if any, to have a material effect on ourconsolidated financial condition, results of operations or cash flows within the next 12 months.
11. Segment and Geographic Information Segment Information Our chief operating decision maker ("CODM") is our Chief Executive Officer. Our business is organized into two reportable segments: Domestic (which iscomprised of all operations within the U.S. and its territories) and International (which is
84

Table of Contents
comprised of all operations outside the U.S. and its districts and territories). Our CODM has ultimate responsibility for enterprise decisions. Our CODMdetermines, in particular, resource allocation for, and monitors performance of, the consolidated enterprise, the Domestic segment and the International segment.The Domestic segment managers and International segment managers have responsibility for operating decisions, allocating resources and assessing performancewithin their respective segments. Our CODM relies on internal management reporting that analyzes enterprise results to the net earnings level and segment resultsto the operating income level. We aggregate our Canada and Mexico businesses into one International operating segment. Our Domestic and International operating segments also represent ourreportable segments. The accounting policies of the segments are the same as those described in Note 1, Summary of Significant Accounting Policies .
85

Table of Contents
The following tables present our business segment information in fiscal 2017 , 2016 and 2015 ($ in millions):
2017 2016 2015
Revenue Domestic $ 36,248 $ 36,365 $ 36,055International 3,155 3,163 4,284
Total revenue $ 39,403 $ 39,528 $ 40,339
Percentage of revenue, by revenue category Domestic Consumer Electronics 34% 32% 31%Computing and Mobile Phones 45% 46% 47%Entertainment 7% 8% 9%Appliances 9% 8% 7%Services 5% 5% 5%Other —% 1% 1%
Total 100% 100% 100%
International Consumer Electronics 31% 31% 30%Computing and Mobile Phones 48% 48% 49%Entertainment 7% 9% 9%Appliances 6% 5% 5%Services 7% 6% 6%Other 1% 1% 1%
Total 100% 100% 100%
Operating income (loss) Domestic (1) $ 1,764 $ 1,585 $ 1,437International 90 (210) 13Total operating income 1,854 1,375 1,450
Other income (expense) Gain on sale of investments 3 2 13Investment income and other 31 13 14Interest expense (72) (80) (90)
Earnings from continuing operations before income tax expense $ 1,816 $ 1,310 $ 1,387
Assets (2) Domestic $ 12,496 $ 12,318 $ 12,987International 1,360 1,201 2,258
Total assets $ 13,856 $ 13,519 $ 15,245
Capital expenditures (2) Domestic $ 526 $ 602 $ 519International 56 47 42
Total capital expenditures $ 582 $ 649 $ 561
Depreciation (2) Domestic $ 613 $ 613 $ 575International 41 44 81
Total depreciation $ 654 $ 657 $ 656
(1) The Domestic segment operating income includes certain operations, which are based in foreign tax jurisdictions and primarily relate to sourcing products into the U.S.
86

Table of Contents
(2) For fiscal 2015, the International segment amounts for assets, capital expenditures and depreciation include amounts from Five Star.
Geographic Information
The following table presents our geographic information in fiscal 2017 , 2016 and 2015 ($ in millions):
2017 2016 2015
Net sales to customers United States $ 36,248 $ 36,365 $ 36,055Canada 2,899 2,917 4,047Other 256 246 237
Total revenue $ 39,403 $ 39,528 $ 40,339
Long-lived assets United States $ 2,120 $ 2,189 $ 2,100Canada 156 140 174Other 17 17 21
Total long-lived assets $ 2,293 $ 2,346 $ 2,295
12. Contingencies and Commitments
Contingencies
We are involved in a number of legal proceedings. Where appropriate, we have made accruals with respect to these matters, which are reflected in ourConsolidated Financial Statements. However, there are cases where liability is not probable or the amount cannot be reasonably estimated and, therefore, accrualshave not been made. We provide disclosure of matters where we believe it is reasonably possible the impact may be material to our Consolidated FinancialStatements.
Securities Actions In February 2011, a purported class action lawsuit captioned, IBEW Local 98 Pension Fund, individually and on behalf of all others similarly situated v. Best BuyCo., Inc., et al. , was filed against us and certain of our executive officers in the U.S. District Court for the District of Minnesota. This federal court action alleges,among other things, that we and the officers named in the complaint violated Sections 10(b) and 20A of the Exchange Act and Rule 10b-5 under the Exchange Actin connection with press releases and other statements relating to our fiscal 2011 earnings guidance that had been made available to the public. Additionally, inMarch 2011, a similar purported class action was filed by a single shareholder, Rene LeBlanc, against us and certain of our executive officers in the same court. InJuly 2011, after consolidation of the IBEW Local 98 Pension Fund and Rene LeBlanc actions, a consolidated complaint captioned, IBEW Local 98 Pension Fundv. Best Buy Co., Inc., et al. , was filed and served. We filed a motion to dismiss the consolidated complaint in September 2011, and in March 2012, subsequent tothe end of fiscal 2012, the court issued a decision dismissing the action with prejudice. In April 2012, the plaintiffs filed a motion to alter or amend the court'sdecision on our motion to dismiss. In October 2012, the court granted plaintiff's motion to alter or amend the court's decision on our motion to dismiss in part byvacating such decision and giving plaintiff leave to file an amended complaint, which plaintiff did in October 2012. We filed a motion to dismiss the amendedcomplaint in November 2012 and all responsive pleadings were filed in December 2012. A hearing was held on April 26, 2013. On August 5, 2013, the courtissued an order granting our motion to dismiss in part and, contrary to its March 2012 order, denying the motion to dismiss in part, holding that certain of thestatements alleged to have been made were not forward-looking statements and therefore were not subject to the “safe-harbor” provisions of the Private SecuritiesLitigation Reform Act. Plaintiffs moved to certify the purported class. By Order filed August 6, 2014, the court certified a class of persons or entities who acquiredBest Buy common stock between 10:00 a.m. EDT on September 14, 2010, and December 13, 2010, and who were damaged by the alleged violations of law. The8th Circuit Court of Appeals granted our request for interlocutory appeal. On April 12, 2016, the 8th Circuit held the trial court misapplied the law and reversed theclass certification order. IBEW petitioned the 8th Circuit for a rehearing en banc , which was denied on June 1, 2016. In October 2016, IBEW advised the trialcourt it will not seek review by the Supreme Court. The trial court held a January 2017 conference during which the parties were asked to submit briefs on theirrespective interpretations of the 8th Circuit Decision. Briefing is complete and we await a ruling as to the next phase of proceedings before the trial court. Wecontinue to believe that these allegations are without merit and intend to vigorously defend our company in this matter.
87

Table of Contents
In June 2011, a purported shareholder derivative action captioned, Salvatore M. Talluto, Derivatively and on Behalf of Best Buy Co., Inc. v. Richard M. Schulze, etal. , as Defendants and Best Buy Co., Inc. as Nominal Defendant, was filed against both present and former members of our Board of Directors serving during therelevant periods in fiscal 2011 and us as a nominal defendant in the U.S. District Court for the State of Minnesota. The lawsuit alleges that the director defendantsbreached their fiduciary duty, among other claims, including violation of Section 10(b) of the Exchange Act and Rule 10b-5 thereunder, in failing to correct publicmisrepresentations and material misstatements and/or omissions regarding our fiscal 2011 earnings projections and, for certain directors, selling stock while inpossession of material adverse non-public information. Additionally, in July 2011, a similar purported class action was filed by a single shareholder, DanielHimmel, against us and certain of our executive officers in the same court. In November 2011, the respective lawsuits of Salvatore M. Talluto and Daniel Himmelwere consolidated into a new action captioned, In Re: Best Buy Co., Inc. Shareholder Derivative Litigation , and a stay ordered pending the close of discovery inthe consolidated IBEW Local 98 Pension Fund v. Best Buy Co., Inc., et al. case. Additionally, in June 2015, a similar purported class action was filed by a singleshareholder, Khuong Tran, derivatively on behalf of Best Buy Co., Inc. against us and certain of our executive officers and directors in the same court. The KhuongTran lawsuit has also been stayed pending the close of discovery in IBEW.
The plaintiffs in the above securities actions seek damages, including interest, equitable relief and reimbursement of the costs and expenses they incurred in thelawsuits. As stated above, we believe the allegations in the above securities actions are without merit, and we intend to defend these actions vigorously. Based onour assessment of the facts underlying the claims in the above securities actions, their respective procedural litigation history and the degree to which we intend todefend our company in these matters, the amount or range of reasonably possible losses, if any, cannot be estimated.
Cathode Ray Tube Action
On November 14, 2011, we filed a lawsuit captioned In re Cathode Ray Tube Antitrust Litigation in the United States District Court for the Northern District ofCalifornia. We alleged that the defendants engaged in price fixing in violation of antitrust regulations relating to cathode ray tubes for the time period betweenMarch 1, 1995, through November 25, 2007. In connection with this action, we received settlement proceeds, net of legal expenses and costs, in the amount of $77million during fiscal 2016. In the first quarter of fiscal 2017, we settled with the remaining defendants for $161 million , net of legal expenses and costs, whichhave been fully paid as of January 28, 2017. Settlement proceeds were recognized in cost of goods sold with the associated legal expenses recorded in SG&A. Thismatter is now resolved.
Other Legal Proceedings We are involved in various other legal proceedings arising in the normal course of conducting business. For such legal proceedings, we have accrued an amountthat reflects the aggregate liability deemed probable and estimable, but this amount is not material to our consolidated financial position, results of operations orcash flows. Because of the preliminary nature of many of these proceedings, the difficulty in ascertaining the applicable facts relating to many of theseproceedings, the variable treatment of claims made in many of these proceedings and the difficulty of predicting the settlement value of many of these proceedings,we are not able to estimate an amount or range of any reasonably possible additional losses. However, based upon our historical experience, the resolution of theseproceedings is not expected to have a material effect on our consolidated financial position, results of operations or cash flows.
Commitments
We had outstanding letters of credit with an aggregate fair value of $89 million at January 28, 2017 .
88

Table of Contents
13. Quarterly Financial Information (Unaudited)
The following tables show selected operating results for each 3-month quarter and full year of fiscal 2017 and 2016 (unaudited) ($ in millions):
Quarter 12-Month
1st 2nd 3rd 4th 2017
Revenue $ 8,443 $ 8,533 $ 8,945 $ 13,482 $ 39,403Comparable sales % change (1) (0.1)% 0.8% 1.8% (0.7)% 0.3%Gross profit (2) $ 2,145 $ 2,062 $ 2,203 $ 3,030 $ 9,440Operating income (3) 372 289 312 881 1,854Net earnings from continuing operations 226 182 192 607 1,207Gain from discontinued operations, net of tax 3 16 2 — 21Net earnings attributable to Best Buy Co., Inc. shareholders 229 198 194 607 1,228Diluted earnings per share (4)
Continuing operations $ 0.69 $ 0.56 $ 0.60 $ 1.91 $ 3.74Discontinued operations 0.01 0.05 0.01 — 0.07Diluted earnings per share $ 0.70 $ 0.61 $ 0.61 $ 1.91 $ 3.81
Quarter 12-Month
1st 2nd 3rd 4th 2016
Revenue $ 8,558 $ 8,528 $ 8,819 $ 13,623 $ 39,528Comparable sales % change (1) 0.6% 3.8% 0.8% (1.7)% 0.5%Gross profit (5) $ 2,030 $ 2,098 $ 2,112 $ 2,951 $ 9,191Operating income (6) 86 288 230 771 1,375Net earnings from continuing operations 37 164 129 477 807Gain (loss) from discontinued operations, net of tax 92 — (4) 2 90Net earnings attributable to Best Buy Co., Inc. shareholders 129 164 125 479 897Diluted earnings (loss) per share (4)
Continuing operations $ 0.10 $ 0.46 $ 0.37 $ 1.39 $ 2.30Discontinued operations 0.26 — (0.01) 0.01 0.26Diluted earnings per share $ 0.36 $ 0.46 $ 0.36 $ 1.40 $ 2.56
(1) Our comparable sales calculation compares revenue from stores, websites and call centers operating for at least 14 full months, as well as revenue related to certain other comparable saleschannels for a particular period to the corresponding period in the prior year. Relocated stores, as well as remodeled, expanded and downsized stores closed more than 14 days, areexcluded from our comparable sales calculation until at least 14 full months after reopening. Acquisitions are included in the comparable sales calculation beginning with the first fullquarter following the first anniversary of the date of the acquisition. The Canadian brand consolidation, which included the permanent closure of 66 Future Shop stores, the conversion of65 Future Shop stores to Best Buy stores and the elimination of the Future Shop website, had a material impact on a year-over-year basis on the remaining Canadian retail stores and thewebsite. As such, from the first quarter of fiscal 2016 through the third quarter of fiscal 2017, all Canadian store and website revenue was removed from the comparable sales base and theInternational segment no longer had a comparable metric. Therefore, Consolidated comparable sales equaled the Domestic segment comparable sales. Beginning in the fourth quarter offiscal 2017, we resumed reporting International comparable sales as revenue in the International segment was once again deemed to be comparable and, as such, Consolidated comparablesales are once again equal to the aggregation of Domestic and International comparable sales.
(2) Includes $183 million of cathode ray tube ("CRT") litigation settlements reached and recorded in the fiscal first quarter and $183 million for the 12 months ended January 28, 2017, relatedto products purchased and sold in prior fiscal years.
(3) Includes $29 million , $0 million , $1 million and $9 million of restructuring charges recorded in the fiscal first, second, third and fourth quarters, respectively, and $39 million for the 12months ended January 28, 2017, related to measures we took to restructure our businesses. Also, includes $161 million of cathode ray tube litigation settlements, net of related legal feesand costs, recorded in the fiscal first quarter and in the 12 months ended January 28, 2017, related to products purchased and sold in prior fiscal years.
(4) The sum of our quarterly diluted earnings per share does not equal our annual diluted earnings per share due to differences in quarterly and annual weighted-average shares outstanding.
89

Table of Contents
(5) Includes $78 million , $10 million , $0 million and $2 million of CRT and LCD litigation settlements reached and recorded in the fiscal first, second, third and fourth quarters respectively,and $90 million for the 12 months ended January 30, 2016, related to products purchased and sold in prior fiscal years.
(6) Includes $186 million , $(4) million , $7 million and $12 million of restructuring charges recorded in the fiscal first, second, third and fourth quarters, respectively, and $201 million for the12 months ended January 30, 2016, related to measures we took to restructure our businesses. Also, includes $67 million , $8 million , $0 million and $2 million of CRT and LCD litigationsettlements, net of related legal fees and costs, recorded in the fiscal first, second, third and fourth quarters respectively, and $77 million for the 12 months ended January 30, 2016, relatedto products purchased and sold in prior fiscal years.
90

Table of Contents
Item 9. Changes in and Disagreements With Accountants on Accounting and Financial Disclosure.
None.
Item 9A. Controls and Procedures.
Disclosure Controls and Procedures
We maintain disclosure controls and procedures that are designed to ensure that information required to be disclosed by us in the reports we file or submit underthe Exchange Act is recorded, processed, summarized and reported within the time periods specified in the SEC's rules and forms, and that such information isaccumulated and communicated to our management, including our Chief Executive Officer (principal executive officer) and Chief Financial Officer (principalfinancial officer), to allow timely decisions regarding required disclosure. We have established a Disclosure Committee, consisting of certain members ofmanagement, to assist in this evaluation. Our Disclosure Committee meets on a quarterly basis and more often if necessary.
Our management, including our Chief Executive Officer and Chief Financial Officer, evaluated the effectiveness of our disclosure controls and procedures (asdefined in Rules 13a-15(e) and 15d-15(e) promulgated under the Exchange Act), as of January 28, 2017 . Based on that evaluation, our Chief Executive Officerand Chief Financial Officer concluded that, as of January 28, 2017 , our disclosure controls and procedures were effective.
Management's Report on Internal Control Over Financial Reporting
Management's report on our internal control over financial reporting is included in Item 8, Financial Statements and Supplementary Data , of this Annual Reporton Form 10-K.
Attestation Report of the Independent Registered Public Accounting Firm
The attestation report of Deloitte & Touche LLP, our independent registered public accounting firm, on the effectiveness of our internal control over financialreporting is included in Item 8, Financial Statements and Supplementary Data , of this Annual Report on Form 10-K.
Changes in Internal Control Over Financial Reporting
There were no changes in internal control over financial reporting during the fiscal fourth quarter ended January 28, 2017 , that have materially affected, or arereasonably likely to materially affect, our internal control over financial reporting.
Item 9B. Other Information.
There was no information required to be disclosed in a Current Report on Form 8-K during the fourth quarter of the fiscal year covered by this Annual Report onForm 10-K that was not reported.
91

Table of Contents
PART III
Item 10. Directors, Executive Officers and Corporate Governance.
Directors
The information provided under the caption "Director Nominees" in the Proxy Statement is incorporated herein by reference.
Executive Officers
Information regarding our executive officers is furnished in a separate item captioned "Executive Officers of the Registrant" included in Part I of this AnnualReport on Form 10-K.
Certain Relationships and Related Party Transactions
The nature of certain relationships and related party transactions between any director, executive officer or person nominated to become a director is stated underthe captions "Director Nominees" and "Certain Relationships and Related Party Transactions" in the Proxy Statement and is incorporated herein by reference.
Audit Committee Financial Expert and Identification of the Audit Committee
The information provided under the caption "Audit Committee Report" in the Proxy Statement, regarding the Audit Committee financial experts and theidentification of the Audit Committee members, is incorporated herein by reference.
Director Nomination Process
The information provided under the caption "Director Nomination Process" in the Proxy Statement is incorporated herein by reference. There have been nomaterial changes to the procedures by which shareholders may recommend nominees to our Board.
Compliance with Section 16(a) of the Exchange Act
The information provided under the caption "Section 16(a) Beneficial Ownership Reporting Compliance" in the Proxy Statement is incorporated herein byreference.
Code of Ethics
We adopted a Code of Business Ethics that applies to our directors and all of our employees, including our principal executive officer, our principal financialofficer and our principal accounting officer. Our Code of Business Ethics is available on our website, www.investors.bestbuy.com .
A copy of our Code of Business Ethics may also be obtained, without charge, upon written request to Best Buy Co., Inc. Investor Relations Department at 7601Penn Avenue South, Richfield, MN 55423-3645.
We intend to satisfy the disclosure requirement under Item 5.05 of Form 8-K regarding an amendment to, or a waiver from, a provision of our Code of BusinessEthics that applies to our principal executive officer, principal financial officer or principal accounting officer by posting such information within two businessdays of any such amendment or waiver on our website, www.investors.bestbuy.com .
Item 11. Executive Compensation.
The information set forth under the caption "Executive and Director Compensation" in the Proxy Statement is incorporated herein by reference.
92

Table of Contents
Item 12. Security Ownership of Certain Beneficial Owners and Management and Related Stockholder Matters.
Securities Authorized for Issuance Under Equity Compensation Plans
The following table provides information about our common stock that may be issued under our equity compensation plans as of January 28, 2017 :
Plan Category
Securities to Be IssuedUpon Exercise of
Outstanding Options andRights (1) (a)
Weighted Average ExercisePrice per Share of
Outstanding Options andRights (2)
(b)
Securities Available for FutureIssuance Under Equity
Compensation Plans (ExcludingSecurities Reflected in Column
(a)) (3)
(c)
Equity compensation plans approved by security holders 10,109,395 $ 36.61 18,722,125
(1) Includes grants of stock options and restricted stock units (which may be market-based, performance-based, or time-based) awarded under our 2004 Omnibus Stock and Incentive Plan, asamended, and our 2014 Omnibus Incentive Plan.
(2) Includes weighted-average exercise price of outstanding stock options only.
(3) Includes 4,142,376 shares of our common stock which have been reserved for issuance under our 2008 and 2003 Employee Stock Purchase Plans.
Security Ownership of Certain Beneficial Owners and Management
The information provided under the caption "Security Ownership of Certain Beneficial Owners and Management" in the Proxy Statement is incorporated herein byreference.
Item 13. Certain Relationships and Related Transactions, and Director Independence.
The information provided under the captions "Director Independence," "Director Nominees" and "Certain Relationships and Related Party Transactions" in theProxy Statement is incorporated herein by reference.
Item 14. Principal Accountant Fees and Services.
The information provided under the caption "Ratification of Appointment of our Independent Registered Public Accounting Firm — Principal Accountant Servicesand Fees" in the Proxy Statement is incorporated herein by reference.
93

Table of Contents
PART IV
Item 15. Exhibits, Financial Statement Schedules.
(a) The following documents are filed as part of this report:
1. Financial Statements:
All financial statements as set forth under Item 8 of this report.
2. Supplementary Financial Statement Schedules:
Schedule II — Valuation and Qualifying Accounts
Other schedules have not been included because they are not applicable or because the information is included elsewhere in this report.
3. Exhibits:
Exhibit Incorporated by Reference Filed
No. Exhibit Description Form Exhibit Filing Date Herewith
2.1
Implementation Agreement, dated April 29, 2013, by and among Best Buy Co., Inc., Best Buy UK Holdings LP, Best Buy Distributions Limited, New BBED Limitedand Carphone Warehouse Group, plc
8-K
2.1
4/30/2013
3.1 Amended and Restated Articles of Incorporation DEF 14A n/a 5/12/2009 3.2 Amended and Restated By-Laws 8-K 3.1 9/26/2013 4.1
Form of Indenture, to be dated as of March 11, 2011, between Best Buy Co., Inc.and U.S. Bank National Association, as successor trustee
S-3ASR
4.1
3/8/2011
4.2 Form of First Supplemental Indenture, to be dated as of March 11, 2011, betweenBest Buy Co., Inc. and U.S. Bank National Association, as successor trustee
8-K
4.2
3/11/2011
4.3
Second Supplement Indenture, dated as of July 16, 2013, to the Indenture dated asof March 11, 2011, between Best Buy Co., Inc. and U.S. Bank NationalAssociation, as successor trustee
8-K
4.1
7/16/2013
10.1
Five-Year Credit Agreement dated as of June 27, 2016, among Best Buy Co., Inc.,the Subsidiary Guarantors, the Lenders and JPMorgan Chase Bank, N.A., asadministrative agent
8-K
10.1
6/30/2016
*10.2 Best Buy Co., Inc. 2004 Omnibus Stock and Incentive Plan, as amended S-8 99 7/15/2011 *10.3 Best Buy Co., Inc. Short Term Incentive Plan, as approved by the Board of Directors DEF 14A n/a 5/26/2011 *10.4
2010 Long-Term Incentive Program Award Agreement, as approved by the Boardof Directors
10-K
10.7
4/28/2010
*10.5 Form of Long-Term Incentive Program Buy-Out Award Agreement datedSeptember 4, 2012, between Hubert Joly and Best Buy Co., Inc.
10-Q
10.3
9/6/2012
*10.6 Employment Agreement, dated November 9, 2012, between Sharon McCollam andBest Buy Co., Inc.
8-K
10.1
11/15/2012
*10.7 Employment Agreement, dated August 19, 2012, between Hubert Joly and Best BuyCo., Inc.
8-K
10.1
8/21/2012
*10.8
Letter Agreement, dated March 25, 2013, between Best Buy Co., Inc. and RichardM. Schulze
8-K
99.2
3/25/2013
94

Table of Contents
Exhibit Incorporated by Reference Filed
No. Exhibit Description Form Exhibit Filing Date Herewith
*10.9 Best Buy Mobile Performance Award Termination Agreement
10-K
10.18
3/28/2014
*10.10 Form of Best Buy Co., Inc. Long-Term Incentive Program Award
10-K
10.19
3/28/2014
*10.11 Form of Best Buy Co., Inc. Director Restricted Stock Unit Award Agreement 10-K 10.20 3/28/2014 *10.12 Form of Director Restricted Stock Unit Award Agreement for Non-U.S. Directors 10-K 10.21 3/28/2014 *10.13
Form of Best Buy Co., Inc. Long Term Incentive Program Award Agreement(2014)
10-Q
10.1
12/5/2014
*10.14 Best Buy Co., Inc. 2014 Omnibus Incentive Plan S-8 99 6/27/2014 *10.15
Form of Best Buy Co., Inc. Director Restricted Stock Unit Award Agreement(2014)
10-Q
10.1
9/10/2014
*10.16 Form of Director Restricted Stock Unit Award Agreement for Non-U.S. Directors(2014)
10-Q
10.2
9/10/2014
*10.17 Best Buy Sixth Amended and Restated Deferred Compensation Plan 10-K 10.19 3/31/2015 *10.18
Form of Best Buy Co., Inc. Long-Term Incentive Program Award Agreement forDirectors (2015)
10-Q
10.1
9/4/2015
*10.19 Form of Best Buy Co., Inc. Long-Term Incentive Program Award Agreement forNon-U.S. Directors (2015)
10-Q
10.2
9/4/2015
*10.20 Form of Best Buy Co., Inc. Long-Term Incentive Program Award Agreement(2016)
10-Q
10.1
6/9/2016
*10.21 Form of Best Buy Co., Inc. Long-Term Incentive Program Award Agreement forDirectors (2016)
10-Q
10.2
6/9/2016
*10.22 Form of Best Buy Co., Inc. Long-Term Incentive Program Award Agreement forNon-U.S. Directors (2016)
10-Q
10.1
9/30/2016
12.1 Statements re: Computation of Ratios X21.1 Subsidiaries of the Registrant X23.1 Consent of Deloitte & Touche LLP X31.1
Certification of the Chief Executive Officer pursuant to Rule 13a-14(a), as adoptedpursuant to Section 302 of the Sarbanes-Oxley Act of 2002
X
31.2 Certification of the Chief Financial Officer pursuant to Rule 13a-14(a), as adoptedpursuant to Section 302 of the Sarbanes-Oxley Act of 2002
X
32.1 Certification of the Chief Executive Officer pursuant to 18 U.S.C. Section 1350, asadopted pursuant to Section 906 of the Sarbanes-Oxley Act of 2002
X
32.2 Certification of the Chief Financial Officer pursuant to 18 U.S.C. Section 1350, asadopted pursuant to Section 906 of the Sarbanes-Oxley Act of 2002
X
101
The following financial information from our Annual Report on Form 10-K forfiscal 2017, filed with the SEC on March 24, 2017, formatted in ExtensibleBusiness Reporting Language (XBRL): (i) the consolidated balance sheets atJanuary 28, 2017, and January 30, 2016, (ii) the consolidated statements of earningsfor the years ended January 28, 2017, January 30, 2016, and January 31, 2015, (iii)the consolidated statements of comprehensive income for the years ended January28, 2017, January 30, 2016, and January 31, 2015, (iv) the consolidated statementsof cash flows for the years ended January 28, 2017, January 30, 2016, and January31, 2015, (v) the consolidated statements of changes in shareholders' equity for theyears ended January 28, 2017, January 30, 2016, and January 31, 2015, and (vi) theNotes to Consolidated Financial Statements.
* Management contracts or compensatory plans or arrangements required to be filed as exhibits pursuant to Item 15(b) of Form 10-K.
95

Table of Contents
Pursuant to Item 601(b)(4)(iii) of Regulation S-K under the Securities Act of 1933, as amended, the registrant has not filed as exhibits to this Annual Report onForm 10-K certain instruments with respect to long-term debt under which the amount of securities authorized does not exceed 10% of the total assets of theregistrant. The registrant hereby agrees to furnish copies of all such instruments to the SEC upon request.
The agreements and other documents filed as exhibits to this report are not intended to provide factual information or other disclosure other than with respect to theterms of the agreements or other documents themselves, and you should not rely on them for that purpose. In particular, any representations and warranties madeby us in these agreements or other documents were made solely within the specific context of the relevant agreement or document and may not describe the actualstate of affairs as of the date they were made or at any other time.
Item 16. Form 10-K Summary.
None
SIGNATURES
Pursuant to the requirements of Section 13 or 15(d) of the Securities Exchange Act of 1934, the registrant has duly caused this report to be signed on its behalf bythe undersigned, thereunto duly authorized.
Best Buy Co., Inc.(Registrant)By: /s/ Hubert Joly
Hubert JolyChairman and Chief Executive Officer
March 24, 2017
Pursuant to the requirements of the Securities Exchange Act of 1934, this report has been signed below by the following persons on behalf of the registrant and inthe capacities and on the dates indicated.
96

Table of Contents
Signature Title Date/s/ Hubert Joly Chairman and Chief Executive Officer March 24, 2017Hubert Joly (principal executive officer) /s/ Corie Barry Chief Financial Officer March 24, 2017Corie Barry (principal financial officer) /s/ Mathew R. Watson Vice President, Finance - Controller and Chief Accounting Officer March 24, 2017Mathew R. Watson (principal accounting officer) /s/ Lisa M. Caputo Director March 24, 2017Lisa M. Caputo /s/ J. Patrick Doyle Director March 24, 2017J. Patrick Doyle /s/ Russell P. Fradin Director March 24, 2017Russell P. Fradin /s/ Kathy J. Higgins Victor Director March 24, 2017Kathy J. Higgins Victor /s/ David W. Kenny Director March 24, 2017David W. Kenny /s/ Karen McLoughlin Director March 24, 2017Karen McLoughlin /s/ Thomas L. Millner Director March 24, 2017Thomas L. Millner /s/ Claudia F. Munce Director March 24, 2017Claudia F. Munce /s/ Gérard Vittecoq Director March 24, 2017Gérard Vittecoq
97

Table of Contents
Schedule II
Valuation and Qualifying Accounts($ in millions)
Balance atBeginningof Period
Charged toExpenses or
Other Accounts Other (1)
Balance atEnd ofPeriod
Year ended January 28, 2017 Allowance for doubtful accounts $ 49 $ 44 $ (41) $ 52Year ended January 30, 2016 Allowance for doubtful accounts $ 59 $ 30 $ (40) $ 49Year ended January 31, 2015 Allowance for doubtful accounts $ 104 $ 1 $ (46) $ 59
(1) Includes bad debt write-offs and recoveries, acquisitions and the effect of foreign currency fluctuations.
98


Exhibit 12.1
Statements re: Computation of Ratios$ in millions
12 Months Ended 11 Months Ended
January 28,
2017 January 30,
2016 January 31,
2015 February 1,
2014 February 2,
2013
Ratio of Earnings to Fixed Charges: Earnings: Earnings from continuing operations before income taxes,noncontrolling interests and equity in income (loss) ofaffiliates $ 1,816 $ 1,310 $ 1,387 1,083 $ 4
Fixed Charges: Interest portion of rental expense 232 235 250 254 238Interest expense 72 80 90 100 99
Total fixed charges 304 315 340 354 337
Earnings available for fixed charges $ 2,120 $ 1,625 $ 1,727 1,437 $ 341
Ratio of earnings to fixed charges 6.97 5.16 5.08 4.06 1.01

Exhibit 21.1
BEST BUY CO., INC.SUBSIDIARIES OF THE REGISTRANT AT JANUARY 28, 2017*
State or Other Jurisdiction ofIncorporation or Organization
BBC Investment Co. NevadaBBY Networks, Inc. Minnesota
BBC Property Co. MinnesotaBest Buy Stores, L.P. (1) Virginia
BBY Services, Inc. DelawareBestBuy.com, LLC VirginiaBest Buy Connect, LLC DelawareBest Buy Gov, LLC DelawareBest Buy Puerto Rico Holdings, LLC DelawareBest Buy Stores Puerto Rico, LLC Puerto Rico
Best Buy Texas.com, LLC (2) VirginiaBest Buy Warehousing Logistics, Inc. DelawareNichols Distribution, LLC Minnesota
Magnolia Hi-Fi, LLC (3) WashingtonPacific Sales Kitchen and Bath Centers, LLC (4) CaliforniaProTheo III, LLC Delaware
BBY Holdings International, Inc. MinnesotaBest Buy China Holdings, Ltd. Mauritius
Best Buy Shanghai, Ltd. ChinaBest Buy Enterprise Services, Inc. Minnesota
BBY Canada Finance, LLC DelawareBBY Solutions, Inc. MinnesotaBest Buy Asia Pacific Regional Holdings Limited Hong KongBest Buy Canada Ltd. / Magasins Best Buy LTEE (5) Canada+
6349021 Canada Ltd. Canada+FutureGard Reinsurance Ltd. Turks and Caicos
Best Buy China Ltd. BermudaBest Buy Purchasing LLC MinnesotaPartsearch Technologies, Inc. (6) DelawareProTheo, Inc. Delaware
ProTheo IV, LLC DelawareProTheo V, LLC DelawareBest Buy Distributions Limited United Kingdom
New CPWM Limited United KingdomCPW Mobile Limited United KingdomCPWCO 16 Limited United KingdomOval (2248) Limited United Kingdom
Best Buy Finance, Inc. MinnesotaBBY Global Connect (Mauritius I) Ltd. MauritiusBBY Global Connect (Mauritius II) Ltd. MauritiusBBY (Mauritius I) Ltd. MauritiusBBY (Mauritius II) Ltd. MauritiusBest Buy China % China
BBY (Mauritius III) Ltd. Mauritius

Best Buy (AsiaPacific) Limited ChinaBest Buy China UK, LLP United KingdomBest Buy International Finance, S.a.r.l. Luxembourg
Best Buy Enterprises, S. de R.L. de C.V. Mexico, Federal DistrictBest Buy Imports, S. de R.L. de C.V. Mexico, Federal DistrictBest Buy Stores, S. de R.L. de C.V. Mexico, Federal District
ExB Hong Kong Limited Hong KongFive Star Trust% ChinaGlobal Connect China% China
Best Buy Mobile (Nanjing) Management Consulting Co., Ltd. ChinaCCL Insurance Company VermontCP Gal Richfield, LLC DelawareProject Jaguar, Inc. Delaware
Retspan, LLC DelawareRetspan Deutschland GmbH Germany
Talkback, Inc. Washington_____________________________________________* Indirect subsidiaries are indicated by indentation.+ Federally chartered% China Business Trust
Also doing business as:
(1) Geek Squad, Best Buy Mobile, Best Buy Express, Magnolia Home Theater, TechLiquidators(2) BBY Texas.com, LLC(3) Magnolia Design Center(4) Pacific Sales, Kitchen, Bath & Electronics; Pacific Kitchen & Home; Pacific Sales; Pacific Sales, Kitchen & Home(5) Best Buy Mobile, Geek Squad, Reclaim(6) Andrews Electronics

Exhibit 23.1
CONSENT OF INDEPENDENT REGISTERED PUBLIC ACCOUNTING FIRM
We consent to the incorporation by reference in Registration Statement Nos. 333-49371, 333-80967, 3333-119472, 333-137483, 333-144957, 333-153801, 333-160247, 333-175609, 333-185587, 333-192412, and 333-196841 on Form S-8 of our reports dated March 24, 2017, relating to the consolidated financialstatements and financial statement schedule of Best Buy Co., Inc., and subsidiaries (“the Company”), and the effectiveness of the Company’s internal control overfinancial reporting, appearing in this Annual Report on Form 10-K of Best Buy Co., Inc. for the year ended January 28, 2017.
Minneapolis, MinnesotaMarch 24, 2017

Exhibit 31.1
CERTIFICATION PURSUANT TORULES 13a-14(a) AND 15d-14(a) UNDER THE SECURITIESEXCHANGE ACT OF 1934, AS ADOPTED PURSUANT TOSECTION 302 OF THE SARBANES-OXLEY ACT OF 2002
I, Hubert Joly, certify that: 1. I have reviewed this Annual Report on Form 10-K of Best Buy Co., Inc.; 2. Based on my knowledge, this report does not contain any untrue statement of a material fact or omit to state a material fact necessary to make the statements
made, in light of the circumstances under which such statements were made, not misleading with respect to the period covered by this report; 3. Based on my knowledge, the financial statements, and other financial information included in this report, fairly present in all material respects the financial
condition, results of operations and cash flows of the registrant as of, and for, the periods presented in this report; 4. The registrant's other certifying officer and I are responsible for establishing and maintaining disclosure controls and procedures (as defined in Exchange Act
Rules 13a-15(e) and 15d-15(e)) and internal control over financial reporting (as defined in Exchange Act Rules 13a-15(f) and 15d-15(f)) for the registrant andhave:
a) Designed such disclosure controls and procedures, or caused such disclosure controls and procedures to be designed under our supervision, to ensure that
material information relating to the registrant, including its consolidated subsidiaries, is made known to us by others within those entities, particularlyduring the period in which this report is being prepared;
b) Designed such internal control over financial reporting, or caused such internal control over financial reporting to be designed under our supervision, to
provide reasonable assurance regarding the reliability of financial reporting and the preparation of financial statements for external purposes inaccordance with generally accepted accounting principles;
c) Evaluated the effectiveness of the registrant's disclosure controls and procedures and presented in this report our conclusions about the effectiveness of
the disclosure controls and procedures, as of the end of the period covered by this report based on such evaluation; and d) Disclosed in this report any change in the registrant's internal control over financial reporting that occurred during the registrant's most recent fiscal
quarter (the registrant's fourth fiscal quarter in the case of an annual report) that has materially affected, or is reasonably likely to materially affect, theregistrant's internal control over financial reporting; and
5. The registrant's other certifying officer and I have disclosed, based on our most recent evaluation of internal control over financial reporting, to the registrant's
auditors and the audit committee of the registrant's board of directors (or persons performing equivalent functions):
a) All significant deficiencies and material weaknesses in the design or operation of internal control over financial reporting which are reasonably likely toadversely affect the registrant's ability to record, process, summarize and report financial information; and
b) Any fraud, whether or not material, that involves management or other employees who have a significant role in the registrant's internal control over
financial reporting.
Date: March 24, 2017 /s/ Hubert Joly
Hubert Joly
Chairman and Chief Executive Officer

Exhibit 31.2
CERTIFICATION PURSUANT TORULES 13a-14(a) AND 15d-14(a) UNDER THE SECURITIESEXCHANGE ACT OF 1934, AS ADOPTED PURSUANT TOSECTION 302 OF THE SARBANES-OXLEY ACT OF 2002
I, Corie Barry, certify that: 1. I have reviewed this Annual Report on Form 10-K of Best Buy Co., Inc.; 2. Based on my knowledge, this report does not contain any untrue statement of a material fact or omit to state a material fact necessary to make the statements
made, in light of the circumstances under which such statements were made, not misleading with respect to the period covered by this report; 3. Based on my knowledge, the financial statements, and other financial information included in this report, fairly present in all material respects the financial
condition, results of operations and cash flows of the registrant as of, and for, the periods presented in this report; 4. The registrant's other certifying officer and I are responsible for establishing and maintaining disclosure controls and procedures (as defined in Exchange Act
Rules 13a-15(e) and 15d-15(e)) and internal control over financial reporting (as defined in Exchange Act Rules 13a-15(f) and 15d-15(f)) for the registrant andhave:
a) Designed such disclosure controls and procedures, or caused such disclosure controls and procedures to be designed under our supervision, to ensure that
material information relating to the registrant, including its consolidated subsidiaries, is made known to us by others within those entities, particularlyduring the period in which this report is being prepared;
b) Designed such internal control over financial reporting, or caused such internal control over financial reporting to be designed under our supervision, to
provide reasonable assurance regarding the reliability of financial reporting and the preparation of financial statements for external purposes inaccordance with generally accepted accounting principles;
c) Evaluated the effectiveness of the registrant's disclosure controls and procedures and presented in this report our conclusions about the effectiveness of
the disclosure controls and procedures, as of the end of the period covered by this report based on such evaluation; and d) Disclosed in this report any change in the registrant's internal control over financial reporting that occurred during the registrant's most recent fiscal
quarter (the registrant's fourth fiscal quarter in the case of an annual report) that has materially affected, or is reasonably likely to materially affect, theregistrant's internal control over financial reporting; and
5. The registrant's other certifying officer and I have disclosed, based on our most recent evaluation of internal control over financial reporting, to the registrant's
auditors and the audit committee of the registrant's board of directors (or persons performing equivalent functions):
a) All significant deficiencies and material weaknesses in the design or operation of internal control over financial reporting which are reasonably likely toadversely affect the registrant's ability to record, process, summarize and report financial information; and
b) Any fraud, whether or not material, that involves management or other employees who have a significant role in the registrant's internal control over
financial reporting.
Date: March 24, 2017 /s/ Corie Barry
Corie Barry
Chief Financial Officer
Exhibit 32.1CERTIFICATION PURSUANT TO
18 U.S.C. SECTION 1350,AS ADOPTED PURSUANT TO
SECTION 906 OF THE SARBANES-OXLEY ACT OF 2002
Pursuant to 18 U.S.C. §1350 (adopted pursuant to §906 of the Sarbanes-Oxley Act of 2002), I, the undersigned Chairman and Chief Executive Officer of Best BuyCo., Inc. (the “Company”), hereby certify that the Annual Report on Form 10-K of the Company for the fiscal year ended January 28, 2017 (the “Report”), fullycomplies with the requirements of section 13(a) or 15(d) of the Securities Exchange Act of 1934, as amended, and that information contained in the Report fairlypresents, in all material respects, the financial condition and results of operations of the Company.
A signed original of this written statement required by Section 906 has been provided to the Company and will be retained by the Company and furnished to theSecurities and Exchange Commission or its staff upon request.
Date: March 24, 2017 /s/ Hubert Joly Hubert Joly Chairman and Chief Executive Officer

Exhibit 32.2
CERTIFICATION PURSUANT TO18 U.S.C. SECTION 1350,
AS ADOPTED PURSUANT TOSECTION 906 OF THE SARBANES-OXLEY ACT OF 2002
Pursuant to 18 U.S.C. §1350 (adopted pursuant to §906 of the Sarbanes-Oxley Act of 2002), I, the undersigned Chief Financial Officer of Best Buy Co., Inc. (the“Company”), hereby certify that the Annual Report on Form 10-K of the Company for the fiscal year ended January 28, 2017 (the “Report”), fully complies withthe requirements of section 13(a) or 15(d) of the Securities Exchange Act of 1934, as amended, and that information contained in the Report fairly presents, in allmaterial respects, the financial condition and results of operations of the Company. A signed original of this written statement required by Section 906 has been provided to the Company and will be retained by the Company and furnished to theSecurities and Exchange Commission or its staff upon request.
Date: March 24, 2017 /s/ Corie Barry
Corie Barry
Chief Financial Officer