securities and exchange commissions1.q4cdn.com/532426485/files/doc_financials/quarterly/...united...
TRANSCRIPT

UNITED STATESSECURITIES AND EXCHANGE COMMISSION
Washington, D.C. 20549FORM 10-Q
(Mark One) R QUARTERLY REPORT PURSUANT TO SECTION 13 OR 15(d) OF THE SECURITIES EXCHANGE ACT OF 1934 FOR THE QUARTERLYPERIOD ENDED MARCH 31, 2016
£ TRANSITION REPORT PURSUANT TO SECTION 13 OR 15(d) OF THE SECURITIES EXCHANGE ACT OF 1934
Commission file number 001-16445
Rockwell Collins, Inc .
(Exact name of registrant as specified in its charter)
Delaware 52-2314475(State or other jurisdiction (I.R.S. Employer
of incorporation or organization) Identification No.)
400 Collins Road NE Cedar Rapids, Iowa 52498
(Address of principal executive offices) (Zip Code)
Registrant's telephone number, including area code: (319) 295-1000
Indicate by check mark whether the registrant (1) has filed all reports required to be filed by Section 13 or 15(d) of the Securities Exchange Act of 1934 during thepreceding 12 months (or for such shorter period that the registrant was required to file such reports), and (2) has been subject to such filing requirements for thepast 90 days. Yes ý No o
Indicate by check mark whether the registrant has submitted electronically and posted on its corporate Web site, if any, every Interactive Data File required to besubmitted and posted pursuant to Rule 405 of Regulations S-T during the preceding 12 months (or for such shorter period that the registrant was required to submitand post such files). Yes ý No o
Indicate by check mark whether the registrant is a large accelerated filer, an accelerated filer, a non-accelerated filer or a smaller reporting company. See thedefinitions of "large accelerated filer," "accelerated filer" and "smaller reporting company" in Rule 12b-2 of the Exchange Act. (Check one):
Large accelerated filer R Accelerated filer £Non-accelerated filer £ (Do not check if a smaller reporting company) Smaller reporting company £
Indicate by check mark whether the registrant is a shell company (as defined in Rule 12b-2 of the Exchange Act). Yes £ No R
130,194,190 shares of the registrant's Common Stock were outstanding on April 18, 2016.
ROCKWELL COLLINS, INC.
INDEX
Page No. PART I . FINANCIAL INFORMATION
Item 1. Condensed Consolidated Financial Statements: Condensed Consolidated Statement of Financial Position (Unaudited) - March 31, 2016 and September 30, 2015 1
Condensed Consolidated Statement of Operations (Unaudited) - Three and Six Months Ended March 31, 2016 and2015 2
Condensed Consolidated Statement of Comprehensive Income (Unaudited) - Three and Six Months Ended March31, 2016 and 2015 3
Condensed Consolidated Statement of Cash Flows (Unaudited) - Six Months Ended March 31, 2016 and 2015 4
Condensed Consolidated Statement of Equity (Unaudited) - Six Months Ended March 31, 2016 and 2015 5
Notes to Condensed Consolidated Financial Statements (Unaudited) 6
Item 2. Management's Discussion and Analysis of Financial Condition and Results of Operations 25
Item 3. Quantitative and Qualitative Disclosures about Market Risk 40
Item 4. Controls and Procedures 41
PART II. OTHER INFORMATION:
Item 2. Unregistered Sales of Equity Securities and Use of Proceeds 42
Item 6. Exhibits 43
Signatures S-1
i

PART I. FINANCIAL INFORMATION
Item 1. Condensed Consolidated Financial Statements
ROCKWELL COLLINS, INC.CONDENSED CONSOLIDATED STATEMENT OF FINANCIAL POSITION
(Unaudited)(in millions, except per share amounts)
March 31,
2016 September 30,
2015ASSETS
Current Assets: Cash and cash equivalents $ 300 $ 252Receivables, net 1,088 1,038Inventories, net 1,968 1,824Other current assets 134 110
Total current assets 3,490 3,224 Property 991 964Goodwill 1,920 1,904Intangible Assets 693 703Deferred Income Taxes 103 165Other Assets 344 344
TOTAL ASSETS $ 7,541 $ 7,304
LIABILITIES AND EQUITY Current Liabilities:
Short-term debt $ 1,120 $ 448Accounts payable 460 487Compensation and benefits 206 273Advance payments from customers 303 365Accrued customer incentives 240 232Product warranty costs 84 89Other current liabilities 160 166
Total current liabilities 2,573 2,060 Long-term Debt, Net 1,383 1,680Retirement Benefits 1,356 1,466Other Liabilities 240 218 Equity:
Common stock ($0.01 par value; shares authorized: 1,000; shares issued: March 31, 2016, 143.8; September30, 2015, 183.8) 1 2Additional paid-in capital 1,485 1,519Retained earnings 2,991 5,124Accumulated other comprehensive loss (1,670) (1,699)Common stock in treasury, at cost (shares held: March 31, 2016, 13.4; September 30, 2015, 51.9) (824) (3,071)Total shareowners’ equity 1,983 1,875Noncontrolling interest 6 5
Total equity 1,989 1,880
TOTAL LIABILITIES AND EQUITY $ 7,541 $ 7,304See Notes to Condensed Consolidated Financial Statements.
1

ROCKWELL COLLINS, INC.CONDENSED CONSOLIDATED STATEMENT OF OPERATIONS
(Unaudited)(in millions, except per share amounts)
Three Months Ended Six Months Ended March 31 March 31 2016 2015 2016 2015Sales:
Product sales $ 1,101 $ 1,138 $ 2,069 $ 2,173Service sales 210 203 411 394
Total sales 1,311 1,341 2,480 2,567
Costs, expenses and other: Product cost of sales 760 794 1,451 1,512Service cost of sales 147 143 292 282Selling, general and administrative expenses 160 152 323 289Interest expense 17 15 32 30Other income, net (8) (4) (10) (5)
Total costs, expenses and other 1,076 1,100 2,088 2,108
Income from continuing operations before income taxes 235 241 392 459Income tax expense 63 78 87 127Income from continuing operations 172 163 305 332
Income (loss) from discontinued operations, net of taxes (1) (6) 1 (8)
Net income $ 171 $ 157 $ 306 $ 324
Earnings (loss) per share: Basic
Continuing operations $ 1.31 $ 1.23 $ 2.33 $ 2.50Discontinued operations — (0.04) — (0.06)
Basic earnings per share $ 1.31 $ 1.19 $ 2.33 $ 2.44
Diluted Continuing operations $ 1.30 $ 1.22 $ 2.30 $ 2.48Discontinued operations (0.01) (0.05) 0.01 (0.06)
Diluted earnings per share $ 1.29 $ 1.17 $ 2.31 $ 2.42
Weighted average common shares: Basic 130.8 132.2 131.1 132.6Diluted 132.3 133.7 132.7 134.1
Cash dividends per share $ 0.33 $ 0.30 $ 0.66 $ 0.60
See Notes to Condensed Consolidated Financial Statements.
2

ROCKWELL COLLINS, INC.CONDENSED CONSOLIDATED STATEMENT OF COMPREHENSIVE INCOME
(Unaudited)(in millions)
Three Months Ended Six Months Ended March 31 March 31 2016 2015 2016 2015Net income $ 171 $ 157 $ 306 $ 324Unrealized foreign currency translation adjustments 8 (22) — (36)Pension and other retirement benefits adjustments (net of taxes for the three and six months endedMarch 31, 2016 of $8 and $16, respectively; net of taxes for the three and six months ended March31, 2015 of $6 and $13, respectively) 13 12 26 23Foreign currency cash flow hedge adjustments (net of taxes for the three and six months endedMarch 31, 2016 of $1 and $1, respectively; net of taxes for the three and six months ended March31, 2015 of $1 and $(1), respectively) 2 1 3 (3)
Comprehensive income $ 194 $ 148 $ 335 $ 308
See Notes to Condensed Consolidated Financial Statements.
3
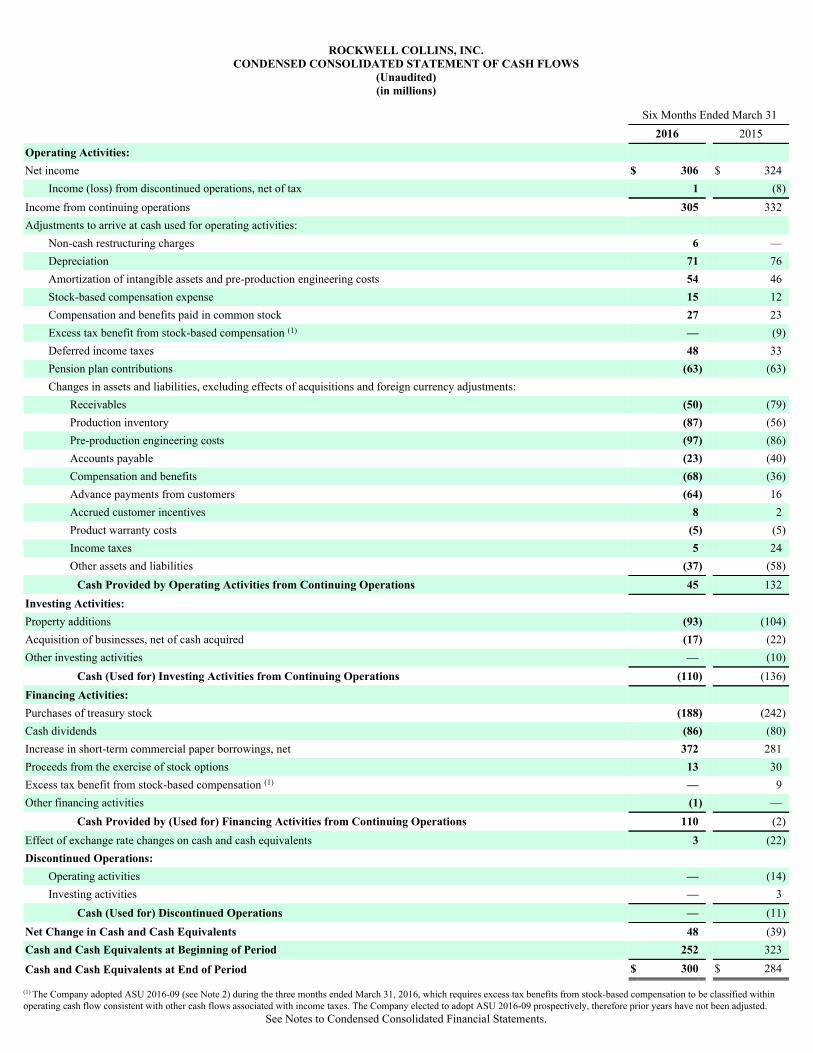
ROCKWELL COLLINS, INC.CONDENSED CONSOLIDATED STATEMENT OF CASH FLOWS
(Unaudited)(in millions)
Six Months Ended March 31 2016 2015Operating Activities: Net income $ 306 $ 324
Income (loss) from discontinued operations, net of tax 1 (8)Income from continuing operations 305 332Adjustments to arrive at cash used for operating activities:
Non-cash restructuring charges 6 —Depreciation 71 76Amortization of intangible assets and pre-production engineering costs 54 46Stock-based compensation expense 15 12Compensation and benefits paid in common stock 27 23Excess tax benefit from stock-based compensation (1) — (9)Deferred income taxes 48 33Pension plan contributions (63) (63)Changes in assets and liabilities, excluding effects of acquisitions and foreign currency adjustments:
Receivables (50) (79)Production inventory (87) (56)Pre-production engineering costs (97) (86)Accounts payable (23) (40)Compensation and benefits (68) (36)Advance payments from customers (64) 16Accrued customer incentives 8 2Product warranty costs (5) (5)Income taxes 5 24Other assets and liabilities (37) (58)
Cash Provided by Operating Activities from Continuing Operations 45 132Investing Activities: Property additions (93) (104)Acquisition of businesses, net of cash acquired (17) (22)Other investing activities — (10)
Cash (Used for) Investing Activities from Continuing Operations (110) (136)Financing Activities: Purchases of treasury stock (188) (242)Cash dividends (86) (80)Increase in short-term commercial paper borrowings, net 372 281Proceeds from the exercise of stock options 13 30Excess tax benefit from stock-based compensation (1) — 9Other financing activities (1) —
Cash Provided by (Used for) Financing Activities from Continuing Operations 110 (2)Effect of exchange rate changes on cash and cash equivalents 3 (22)Discontinued Operations:
Operating activities — (14)Investing activities — 3
Cash (Used for) Discontinued Operations — (11)Net Change in Cash and Cash Equivalents 48 (39)Cash and Cash Equivalents at Beginning of Period 252 323
Cash and Cash Equivalents at End of Period $ 300 $ 284
(1) The Company adopted ASU 2016-09 (see Note 2) during the three months ended March 31, 2016, which requires excess tax benefits from stock-based compensation to be classified withinoperating cash flow consistent with other cash flows associated with income taxes. The Company elected to adopt ASU 2016-09 prospectively, therefore prior years have not been adjusted.
See Notes to Condensed Consolidated Financial Statements.

4
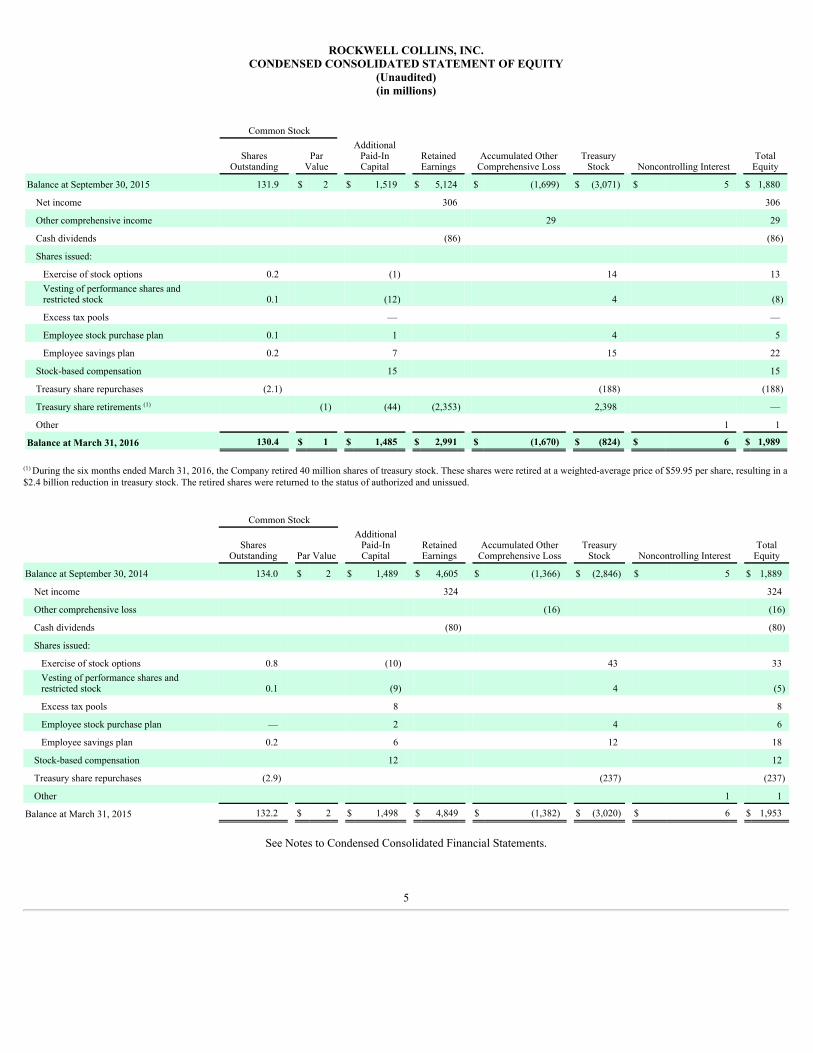
ROCKWELL COLLINS, INC.CONDENSED CONSOLIDATED STATEMENT OF EQUITY
(Unaudited)(in millions)
Common Stock
Shares
Outstanding Par
Value
AdditionalPaid-InCapital
RetainedEarnings
Accumulated OtherComprehensive Loss
TreasuryStock Noncontrolling Interest
TotalEquity
Balance at September 30, 2015 131.9 $ 2 $ 1,519 $ 5,124 $ (1,699) $ (3,071) $ 5 $ 1,880
Net income 306 306
Other comprehensive income 29 29
Cash dividends (86) (86)
Shares issued:
Exercise of stock options 0.2 (1) 14 13Vesting of performance shares andrestricted stock 0.1 (12) 4 (8)
Excess tax pools — —
Employee stock purchase plan 0.1 1 4 5
Employee savings plan 0.2 7 15 22
Stock-based compensation 15 15
Treasury share repurchases (2.1) (188) (188)
Treasury share retirements (1) (1) (44) (2,353) 2,398 —
Other 1 1
Balance at March 31, 2016 130.4 $ 1 $ 1,485 $ 2,991 $ (1,670) $ (824) $ 6 $ 1,989
(1) During the six months ended March 31, 2016, the Company retired 40 million shares of treasury stock. These shares were retired at a weighted-average price of $59.95 per share, resulting in a$2.4 billion reduction in treasury stock. The retired shares were returned to the status of authorized and unissued.
Common Stock
Shares
Outstanding Par Value
AdditionalPaid-InCapital
RetainedEarnings
Accumulated OtherComprehensive Loss
TreasuryStock Noncontrolling Interest
TotalEquity
Balance at September 30, 2014 134.0 $ 2 $ 1,489 $ 4,605 $ (1,366) $ (2,846) $ 5 $ 1,889
Net income 324 324
Other comprehensive loss (16) (16)
Cash dividends (80) (80)
Shares issued:
Exercise of stock options 0.8 (10) 43 33Vesting of performance shares andrestricted stock 0.1 (9) 4 (5)
Excess tax pools 8 8
Employee stock purchase plan — 2 4 6
Employee savings plan 0.2 6 12 18
Stock-based compensation 12 12
Treasury share repurchases (2.9) (237) (237)
Other 1 1
Balance at March 31, 2015 132.2 $ 2 $ 1,498 $ 4,849 $ (1,382) $ (3,020) $ 6 $ 1,953
See Notes to Condensed Consolidated Financial Statements.
5
ROCKWELL COLLINS, INC.
NOTES TO CONDENSED CONSOLIDATED FINANCIAL STATEMENTS(Unaudited)
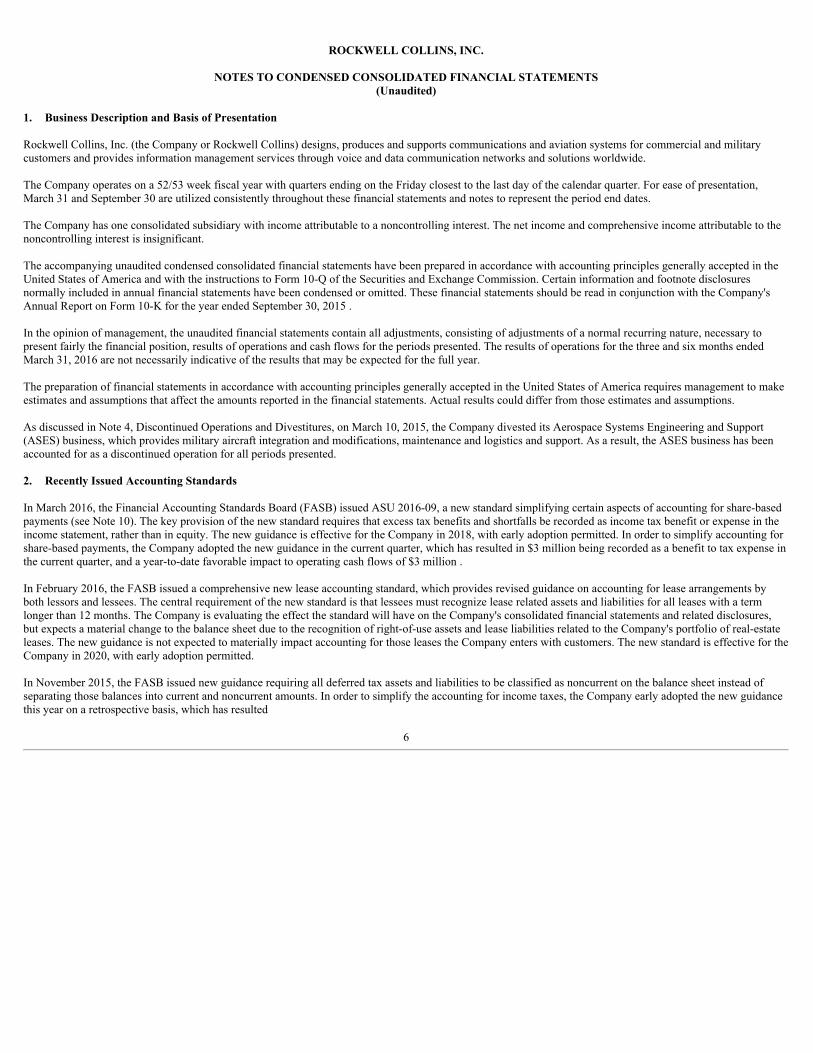
1. Business Description and Basis of Presentation
Rockwell Collins, Inc. (the Company or Rockwell Collins) designs, produces and supports communications and aviation systems for commercial and militarycustomers and provides information management services through voice and data communication networks and solutions worldwide.
The Company operates on a 52/53 week fiscal year with quarters ending on the Friday closest to the last day of the calendar quarter. For ease of presentation,March 31 and September 30 are utilized consistently throughout these financial statements and notes to represent the period end dates.
The Company has one consolidated subsidiary with income attributable to a noncontrolling interest. The net income and comprehensive income attributable to thenoncontrolling interest is insignificant.
The accompanying unaudited condensed consolidated financial statements have been prepared in accordance with accounting principles generally accepted in theUnited States of America and with the instructions to Form 10-Q of the Securities and Exchange Commission. Certain information and footnote disclosuresnormally included in annual financial statements have been condensed or omitted. These financial statements should be read in conjunction with the Company'sAnnual Report on Form 10-K for the year ended September 30, 2015 .
In the opinion of management, the unaudited financial statements contain all adjustments, consisting of adjustments of a normal recurring nature, necessary topresent fairly the financial position, results of operations and cash flows for the periods presented. The results of operations for the three and six months endedMarch 31, 2016 are not necessarily indicative of the results that may be expected for the full year.
The preparation of financial statements in accordance with accounting principles generally accepted in the United States of America requires management to makeestimates and assumptions that affect the amounts reported in the financial statements. Actual results could differ from those estimates and assumptions.
As discussed in Note 4, Discontinued Operations and Divestitures, on March 10, 2015, the Company divested its Aerospace Systems Engineering and Support(ASES) business, which provides military aircraft integration and modifications, maintenance and logistics and support. As a result, the ASES business has beenaccounted for as a discontinued operation for all periods presented.
2. Recently Issued Accounting Standards
In March 2016, the Financial Accounting Standards Board (FASB) issued ASU 2016-09, a new standard simplifying certain aspects of accounting for share-basedpayments (see Note 10). The key provision of the new standard requires that excess tax benefits and shortfalls be recorded as income tax benefit or expense in theincome statement, rather than in equity. The new guidance is effective for the Company in 2018, with early adoption permitted. In order to simplify accounting forshare-based payments, the Company adopted the new guidance in the current quarter, which has resulted in $3 million being recorded as a benefit to tax expense inthe current quarter, and a year-to-date favorable impact to operating cash flows of $3 million .
In February 2016, the FASB issued a comprehensive new lease accounting standard, which provides revised guidance on accounting for lease arrangements byboth lessors and lessees. The central requirement of the new standard is that lessees must recognize lease related assets and liabilities for all leases with a termlonger than 12 months. The Company is evaluating the effect the standard will have on the Company's consolidated financial statements and related disclosures,but expects a material change to the balance sheet due to the recognition of right-of-use assets and lease liabilities related to the Company's portfolio of real-estateleases. The new guidance is not expected to materially impact accounting for those leases the Company enters with customers. The new standard is effective for theCompany in 2020, with early adoption permitted.
In November 2015, the FASB issued new guidance requiring all deferred tax assets and liabilities to be classified as noncurrent on the balance sheet instead ofseparating those balances into current and noncurrent amounts. In order to simplify the accounting for income taxes, the Company early adopted the new guidancethis year on a retrospective basis, which has resulted
6
ROCKWELL COLLINS, INC.
NOTES TO CONDENSED CONSOLIDATED FINANCIAL STATEMENTS (Continued)(Unaudited)
in the reclassification of $9 million of current deferred tax assets and $84 million of current deferred tax liabilities to noncurrent as of September 30, 2015.
In May 2014, the FASB issued a comprehensive new revenue recognition standard that effectively replaces all current guidance on the topic and expandsdisclosures regarding revenue. The guidance permits use of either a retrospective or cumulative effect transition method. Based upon the FASB's decision toapprove a one year delay in implementation, the new standard is now effective for the Company in 2019, with early adoption permitted, but not earlier than 2018.The Company is evaluating the transition methods allowed under the new standard and the effect the standard will have on the Company's consolidated financialstatements and related disclosures. Given the new standard's impact on business processes, systems and internal controls, analysis of the new guidance will likelyextend over several future periods.
Other new accounting standards issued but not effective until after March 31, 2016 are not expected to have a material impact on the Company's financialstatements.
3. Acquisitions, Goodwill and Intangible Assets
AcquisitionsOn February 25, 2016, the Company acquired the Matrix series projector product line from Christie Digital Systems, a global visual, audio and collaborationsolutions company. The product line acquisition was accounted for as a business combination, and the purchase price, net of cash acquired, was $17 million . TheCompany is in the process of allocating the purchase price and performing a valuation for acquired intangible assets and their useful lives. Based on the Company'spreliminary allocation of the purchase price, $5 million has been allocated to goodwill and $12 million to intangible assets. All goodwill resulting from theacquisition is tax deductible. The excess purchase price over net assets acquired, including intangible assets, reflects the Company's view that this acquisition willenhance our industry-leading offerings for military and aviation simulation and training solutions.
On August 6, 2015, the Company acquired 100 percent of the outstanding shares of Newport News, Virginia-based International Communications Group, Inc.(ICG), a leading provider of satellite-based global voice and data communication products and services for the aviation industry. The purchase price, net of cashacquired, was $50 million . Additional post-closing consideration of up to $14 million may be paid, contingent upon the achievement of certain milestones. TheCompany recorded a $12 million liability on the acquisition date for the fair value of the contingent consideration. The Company is in the process of allocating thepurchase price and performing a valuation for acquired intangible assets and their useful lives. Based on the Company's preliminary allocation of the purchaseprice, $50 million has been allocated to goodwill and $23 million to intangible assets. All goodwill resulting from the acquisition is tax deductible. The excesspurchase price over net assets acquired, including intangible assets, reflects the Company's view that this acquisition will broaden the Company's flight deck andconnectivity portfolio.
On March 20, 2015, the Company acquired 100 percent of the outstanding shares of Pacific Avionics Pty. Limited (Pacific Avionics), a Singapore-based companyspecializing in technologies used for wireless information distribution, including in-flight entertainment and connectivity. The purchase price, net of cash acquired,was $24 million . In the fourth quarter of 2015, the purchase price allocation was finalized, with $10 million allocated to intangible assets and $15 million togoodwill, none of which is deductible for tax purposes. The excess purchase price over net assets acquired, including intangible assets, reflects the Company's viewthat this acquisition will further enhance the Company's cabin products and information management services portfolios.
The ICG and Pacific Avionics acquisitions are included in the Commercial Systems segment and the Matrix product line acquisition is included in the GovernmentSystems segment. The results of operations for all three acquisitions have been included in the Company's operating results for the periods subsequent to therespective acquisition dates. Pro-forma results of operations have not been presented, as the effect of the acquisitions are not material to the Company'sconsolidated results of operations.
7
ROCKWELL COLLINS, INC.
NOTES TO CONDENSED CONSOLIDATED FINANCIAL STATEMENTS (Continued)(Unaudited)
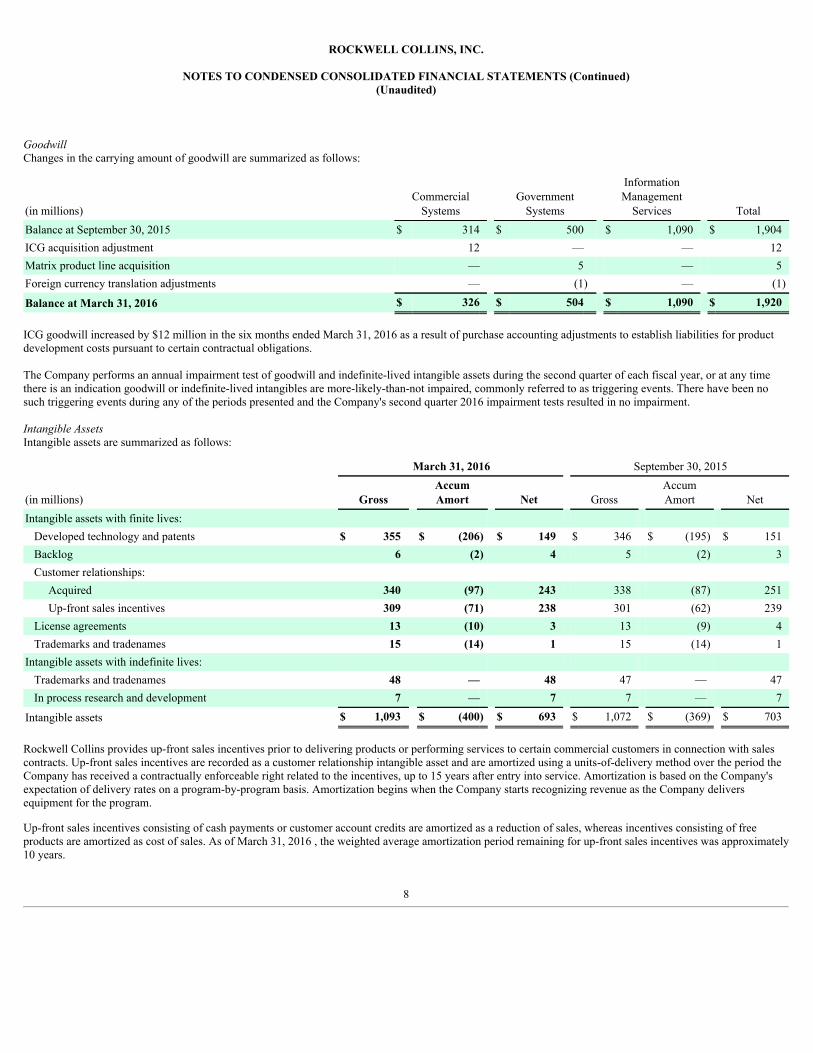
GoodwillChanges in the carrying amount of goodwill are summarized as follows:
(in millions)Commercial
Systems Government
Systems
InformationManagement
Services TotalBalance at September 30, 2015 $ 314 $ 500 $ 1,090 $ 1,904ICG acquisition adjustment 12 — — 12Matrix product line acquisition — 5 — 5Foreign currency translation adjustments — (1) — (1)
Balance at March 31, 2016 $ 326 $ 504 $ 1,090 $ 1,920
ICG goodwill increased by $12 million in the six months ended March 31, 2016 as a result of purchase accounting adjustments to establish liabilities for productdevelopment costs pursuant to certain contractual obligations.
The Company performs an annual impairment test of goodwill and indefinite-lived intangible assets during the second quarter of each fiscal year, or at any timethere is an indication goodwill or indefinite-lived intangibles are more-likely-than-not impaired, commonly referred to as triggering events. There have been nosuch triggering events during any of the periods presented and the Company's second quarter 2016 impairment tests resulted in no impairment.
Intangible AssetsIntangible assets are summarized as follows:
March 31, 2016 September 30, 2015
(in millions) Gross AccumAmort Net Gross
AccumAmort Net
Intangible assets with finite lives: Developed technology and patents $ 355 $ (206) $ 149 $ 346 $ (195) $ 151Backlog 6 (2) 4 5 (2) 3Customer relationships:
Acquired 340 (97) 243 338 (87) 251Up-front sales incentives 309 (71) 238 301 (62) 239
License agreements 13 (10) 3 13 (9) 4Trademarks and tradenames 15 (14) 1 15 (14) 1
Intangible assets with indefinite lives: Trademarks and tradenames 48 — 48 47 — 47In process research and development 7 — 7 7 — 7
Intangible assets $ 1,093 $ (400) $ 693 $ 1,072 $ (369) $ 703
Rockwell Collins provides up-front sales incentives prior to delivering products or performing services to certain commercial customers in connection with salescontracts. Up-front sales incentives are recorded as a customer relationship intangible asset and are amortized using a units-of-delivery method over the period theCompany has received a contractually enforceable right related to the incentives, up to 15 years after entry into service. Amortization is based on the Company'sexpectation of delivery rates on a program-by-program basis. Amortization begins when the Company starts recognizing revenue as the Company deliversequipment for the program.
Up-front sales incentives consisting of cash payments or customer account credits are amortized as a reduction of sales, whereas incentives consisting of freeproducts are amortized as cost of sales. As of March 31, 2016 , the weighted average amortization period remaining for up-front sales incentives was approximately10 years.
8
ROCKWELL COLLINS, INC.
NOTES TO CONDENSED CONSOLIDATED FINANCIAL STATEMENTS (Continued)(Unaudited)
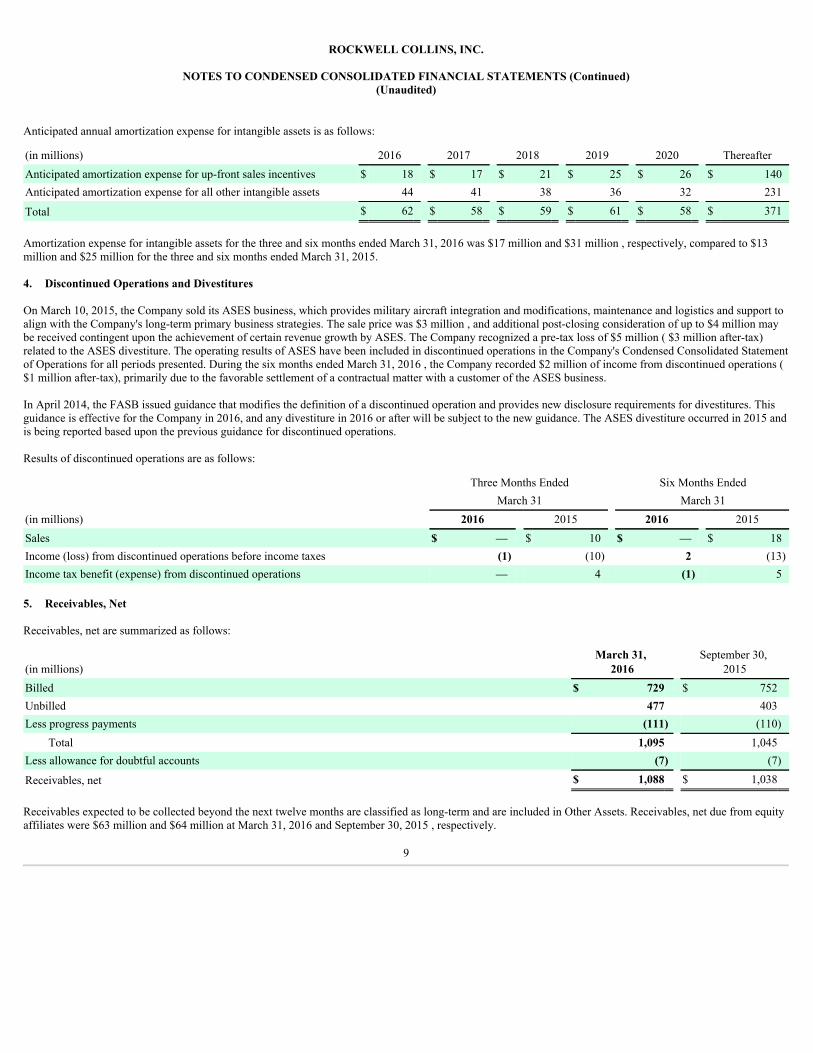
Anticipated annual amortization expense for intangible assets is as follows:
(in millions) 2016 2017 2018 2019 2020 ThereafterAnticipated amortization expense for up-front sales incentives $ 18 $ 17 $ 21 $ 25 $ 26 $ 140Anticipated amortization expense for all other intangible assets 44 41 38 36 32 231
Total $ 62 $ 58 $ 59 $ 61 $ 58 $ 371
Amortization expense for intangible assets for the three and six months ended March 31, 2016 was $17 million and $31 million , respectively, compared to $13million and $25 million for the three and six months ended March 31, 2015.
4. Discontinued Operations and Divestitures
On March 10, 2015, the Company sold its ASES business, which provides military aircraft integration and modifications, maintenance and logistics and support toalign with the Company's long-term primary business strategies. The sale price was $3 million , and additional post-closing consideration of up to $4 million maybe received contingent upon the achievement of certain revenue growth by ASES. The Company recognized a pre-tax loss of $5 million ( $3 million after-tax)related to the ASES divestiture. The operating results of ASES have been included in discontinued operations in the Company's Condensed Consolidated Statementof Operations for all periods presented. During the six months ended March 31, 2016 , the Company recorded $2 million of income from discontinued operations ($1 million after-tax), primarily due to the favorable settlement of a contractual matter with a customer of the ASES business.
In April 2014, the FASB issued guidance that modifies the definition of a discontinued operation and provides new disclosure requirements for divestitures. Thisguidance is effective for the Company in 2016, and any divestiture in 2016 or after will be subject to the new guidance. The ASES divestiture occurred in 2015 andis being reported based upon the previous guidance for discontinued operations.
Results of discontinued operations are as follows:
Three Months Ended Six Months Ended March 31 March 31(in millions) 2016 2015 2016 2015Sales $ — $ 10 $ — $ 18Income (loss) from discontinued operations before income taxes (1) (10) 2 (13)Income tax benefit (expense) from discontinued operations — 4 (1) 5
5. Receivables, Net
Receivables, net are summarized as follows:
(in millions)March 31,
2016 September 30,
2015Billed $ 729 $ 752Unbilled 477 403Less progress payments (111) (110)
Total 1,095 1,045Less allowance for doubtful accounts (7) (7)
Receivables, net $ 1,088 $ 1,038
Receivables expected to be collected beyond the next twelve months are classified as long-term and are included in Other Assets. Receivables, net due from equityaffiliates were $63 million and $64 million at March 31, 2016 and September 30, 2015 , respectively.
9
ROCKWELL COLLINS, INC.
NOTES TO CONDENSED CONSOLIDATED FINANCIAL STATEMENTS (Continued)(Unaudited)
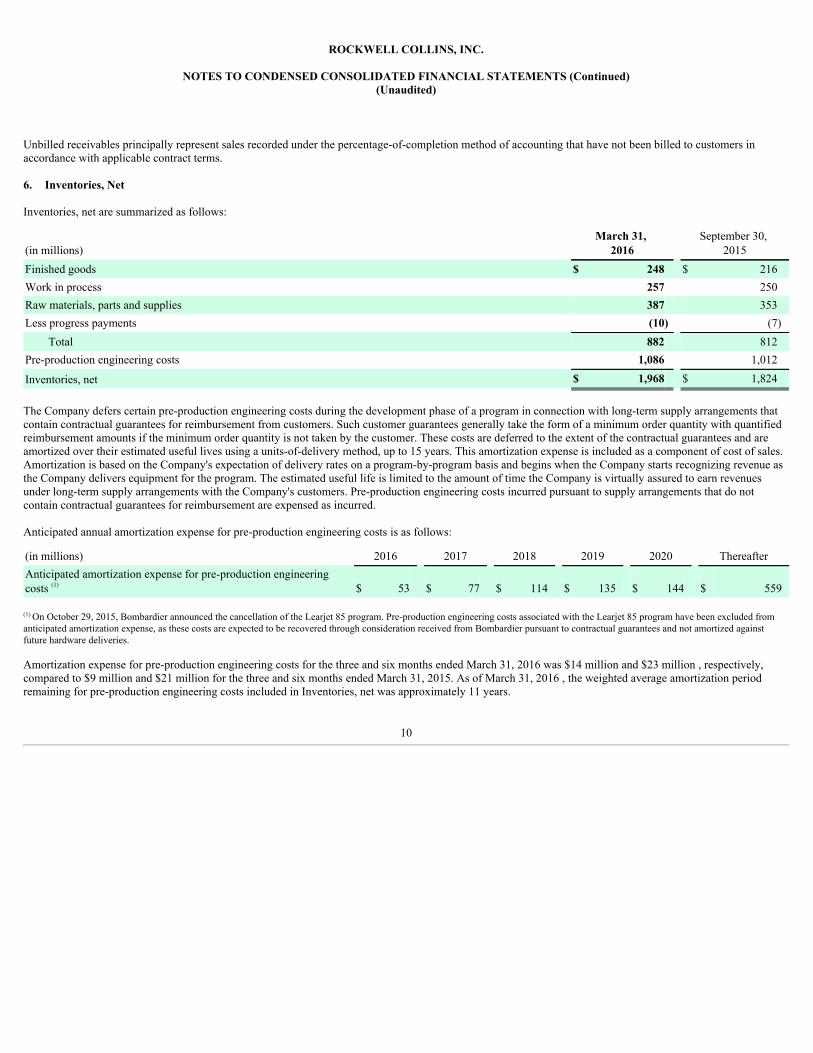
Unbilled receivables principally represent sales recorded under the percentage-of-completion method of accounting that have not been billed to customers inaccordance with applicable contract terms.
6. Inventories, Net
Inventories, net are summarized as follows:
(in millions)March 31,
2016 September 30,
2015Finished goods $ 248 $ 216Work in process 257 250Raw materials, parts and supplies 387 353Less progress payments (10) (7)
Total 882 812Pre-production engineering costs 1,086 1,012
Inventories, net $ 1,968 $ 1,824
The Company defers certain pre-production engineering costs during the development phase of a program in connection with long-term supply arrangements thatcontain contractual guarantees for reimbursement from customers. Such customer guarantees generally take the form of a minimum order quantity with quantifiedreimbursement amounts if the minimum order quantity is not taken by the customer. These costs are deferred to the extent of the contractual guarantees and areamortized over their estimated useful lives using a units-of-delivery method, up to 15 years. This amortization expense is included as a component of cost of sales.Amortization is based on the Company's expectation of delivery rates on a program-by-program basis and begins when the Company starts recognizing revenue asthe Company delivers equipment for the program. The estimated useful life is limited to the amount of time the Company is virtually assured to earn revenuesunder long-term supply arrangements with the Company's customers. Pre-production engineering costs incurred pursuant to supply arrangements that do notcontain contractual guarantees for reimbursement are expensed as incurred.
Anticipated annual amortization expense for pre-production engineering costs is as follows:
(in millions) 2016 2017 2018 2019 2020 ThereafterAnticipated amortization expense for pre-production engineeringcosts (1) $ 53 $ 77 $ 114 $ 135 $ 144 $ 559
(1) On October 29, 2015, Bombardier announced the cancellation of the Learjet 85 program. Pre-production engineering costs associated with the Learjet 85 program have been excluded fromanticipated amortization expense, as these costs are expected to be recovered through consideration received from Bombardier pursuant to contractual guarantees and not amortized againstfuture hardware deliveries.
Amortization expense for pre-production engineering costs for the three and six months ended March 31, 2016 was $14 million and $23 million , respectively,compared to $9 million and $21 million for the three and six months ended March 31, 2015. As of March 31, 2016 , the weighted average amortization periodremaining for pre-production engineering costs included in Inventories, net was approximately 11 years.
10
ROCKWELL COLLINS, INC.
NOTES TO CONDENSED CONSOLIDATED FINANCIAL STATEMENTS (Continued)(Unaudited)
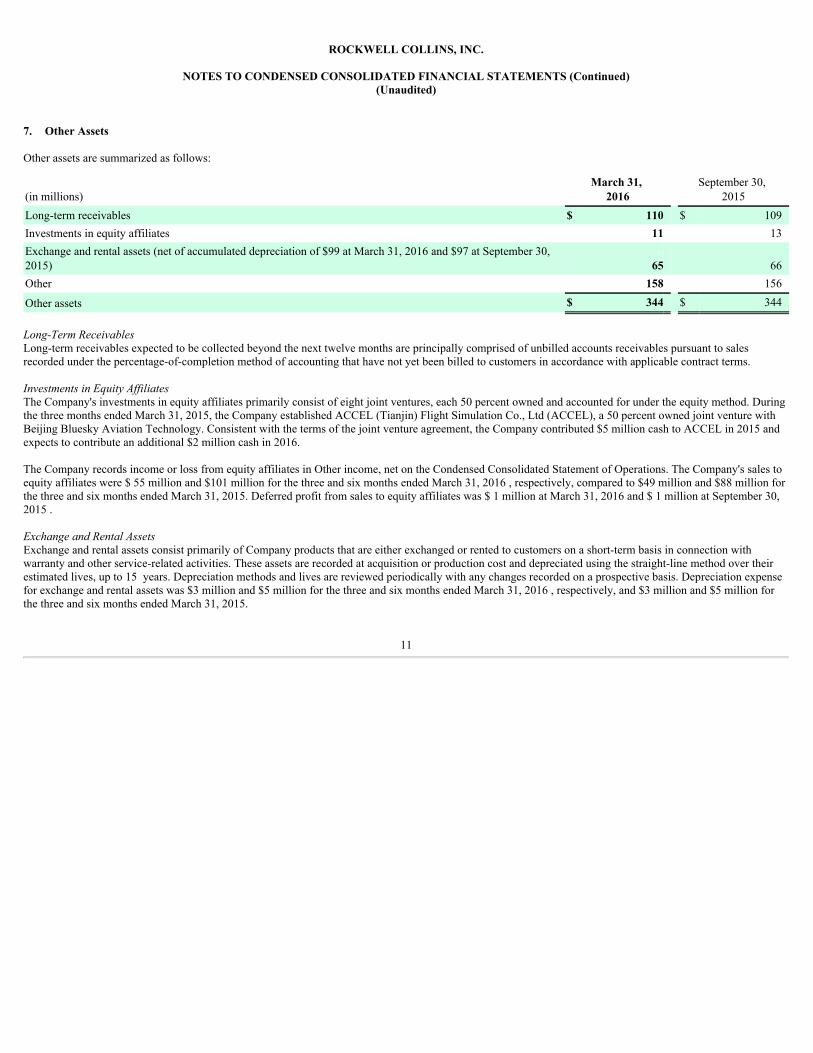
7. Other Assets
Other assets are summarized as follows:
(in millions)March 31,
2016 September 30,
2015Long-term receivables $ 110 $ 109Investments in equity affiliates 11 13Exchange and rental assets (net of accumulated depreciation of $99 at March 31, 2016 and $97 at September 30,2015) 65 66Other 158 156
Other assets $ 344 $ 344
Long-Term ReceivablesLong-term receivables expected to be collected beyond the next twelve months are principally comprised of unbilled accounts receivables pursuant to salesrecorded under the percentage-of-completion method of accounting that have not yet been billed to customers in accordance with applicable contract terms.
Investments in Equity AffiliatesThe Company's investments in equity affiliates primarily consist of eight joint ventures, each 50 percent owned and accounted for under the equity method. Duringthe three months ended March 31, 2015, the Company established ACCEL (Tianjin) Flight Simulation Co., Ltd (ACCEL), a 50 percent owned joint venture withBeijing Bluesky Aviation Technology. Consistent with the terms of the joint venture agreement, the Company contributed $5 million cash to ACCEL in 2015 andexpects to contribute an additional $2 million cash in 2016.
The Company records income or loss from equity affiliates in Other income, net on the Condensed Consolidated Statement of Operations. The Company's sales toequity affiliates were $ 55 million and $101 million for the three and six months ended March 31, 2016 , respectively, compared to $49 million and $88 million forthe three and six months ended March 31, 2015. Deferred profit from sales to equity affiliates was $ 1 million at March 31, 2016 and $ 1 million at September 30,2015 .
Exchange and Rental AssetsExchange and rental assets consist primarily of Company products that are either exchanged or rented to customers on a short-term basis in connection withwarranty and other service-related activities. These assets are recorded at acquisition or production cost and depreciated using the straight-line method over theirestimated lives, up to 15 years. Depreciation methods and lives are reviewed periodically with any changes recorded on a prospective basis. Depreciation expensefor exchange and rental assets was $3 million and $5 million for the three and six months ended March 31, 2016 , respectively, and $3 million and $5 million forthe three and six months ended March 31, 2015.
11
ROCKWELL COLLINS, INC.
NOTES TO CONDENSED CONSOLIDATED FINANCIAL STATEMENTS (Continued)(Unaudited)
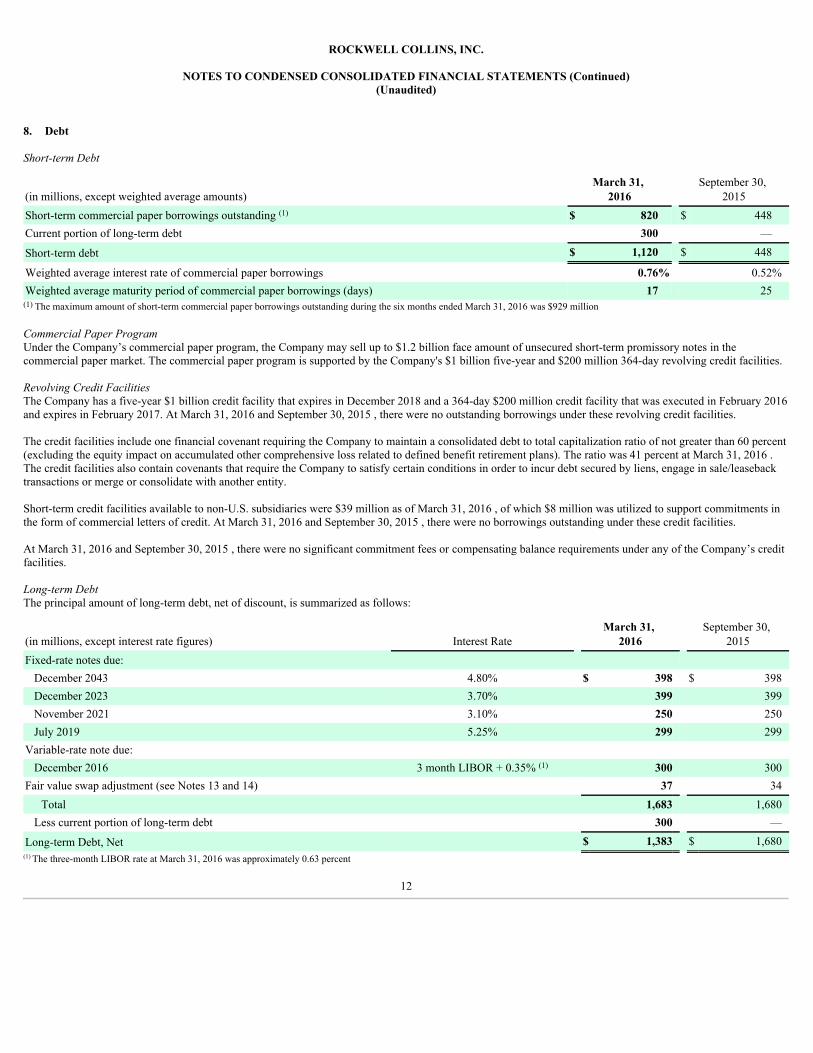
8. Debt
Short-term Debt
(in millions, except weighted average amounts)March 31,
2016 September 30,
2015Short-term commercial paper borrowings outstanding (1) $ 820 $ 448Current portion of long-term debt 300 —
Short-term debt $ 1,120 $ 448
Weighted average interest rate of commercial paper borrowings 0.76% 0.52%Weighted average maturity period of commercial paper borrowings (days) 17 25(1) The maximum amount of short-term commercial paper borrowings outstanding during the six months ended March 31, 2016 was $929 million
Commercial Paper ProgramUnder the Company’s commercial paper program, the Company may sell up to $1.2 billion face amount of unsecured short-term promissory notes in thecommercial paper market. The commercial paper program is supported by the Company's $1 billion five-year and $200 million 364-day revolving credit facilities.
Revolving Credit FacilitiesThe Company has a five-year $1 billion credit facility that expires in December 2018 and a 364-day $200 million credit facility that was executed in February 2016and expires in February 2017. At March 31, 2016 and September 30, 2015 , there were no outstanding borrowings under these revolving credit facilities.
The credit facilities include one financial covenant requiring the Company to maintain a consolidated debt to total capitalization ratio of not greater than 60 percent(excluding the equity impact on accumulated other comprehensive loss related to defined benefit retirement plans). The ratio was 41 percent at March 31, 2016 .The credit facilities also contain covenants that require the Company to satisfy certain conditions in order to incur debt secured by liens, engage in sale/leasebacktransactions or merge or consolidate with another entity.
Short-term credit facilities available to non-U.S. subsidiaries were $39 million as of March 31, 2016 , of which $8 million was utilized to support commitments inthe form of commercial letters of credit. At March 31, 2016 and September 30, 2015 , there were no borrowings outstanding under these credit facilities.
At March 31, 2016 and September 30, 2015 , there were no significant commitment fees or compensating balance requirements under any of the Company’s creditfacilities.
Long-term DebtThe principal amount of long-term debt, net of discount, is summarized as follows:
(in millions, except interest rate figures) Interest Rate March 31,
2016 September 30,
2015Fixed-rate notes due:
December 2043 4.80% $ 398 $ 398December 2023 3.70% 399 399November 2021 3.10% 250 250July 2019 5.25% 299 299
Variable-rate note due: December 2016 3 month LIBOR + 0.35% (1) 300 300
Fair value swap adjustment (see Notes 13 and 14) 37 34Total 1,683 1,680
Less current portion of long-term debt 300 —
Long-term Debt, Net $ 1,383 $ 1,680(1) The three-month LIBOR rate at March 31, 2016 was approximately 0.63 percent
12

ROCKWELL COLLINS, INC.
NOTES TO CONDENSED CONSOLIDATED FINANCIAL STATEMENTS (Continued)(Unaudited)
The notes listed above are included in the Condensed Consolidated Statement of Financial Position, net of any unamortized discount, within the caption Long-termDebt, Net. Debt issuance costs are capitalized within Other Assets on the Condensed Consolidated Statement of Financial Position. Debt issuance costs and anydiscounts are amortized over the life of the debt and recorded in Interest expense.
Interest paid on debt for the six months ended March 31, 2016 and 2015 was $28 million and $27 million , respectively.
9. Retirement Benefits
The Company sponsors defined benefit pension (Pension Benefits) and other postretirement (Other Retirement Benefits) plans which provide monthly pension andother benefits to eligible employees upon retirement.
Components of Expense (Income)The components of expense (income) for Pension Benefits and Other Retirement Benefits for the three and six months ended March 31, 2016 and 2015 aresummarized as follows:
Pension Benefits Other Retirement Benefits Three Months Ended Three Months Ended March 31 March 31(in millions) 2016 2015 2016 2015Service cost $ 3 $ 3 $ 1 $ 1Interest cost 31 39 2 3Expected return on plan assets (59) (61) (1) (1)Amortization:
Prior service credit (1) — — (1)Net actuarial loss 20 18 2 1
Net benefit expense (income) $ (6) $ (1) $ 4 $ 3
Pension Benefits Other Retirement Benefits Six Months Ended Six Months Ended March 31 March 31(in millions) 2016 2015 2016 2015Service cost $ 6 $ 6 $ 1 $ 1Interest cost 63 78 3 4Expected return on plan assets (119) (121) (1) (1)Amortization:
Prior service credit (1) (1) — (2)Net actuarial loss 39 36 4 3
Net benefit expense (income) $ (12) $ (2) $ 7 $ 5
Prior to 2016, the Company used a single-weighted average discount rate to calculate pension interest and service cost. Beginning in 2016, a "spot rate approach" isbeing used to calculate pension interest and service cost. The spot rate approach applies separate discount rates for each projected benefit payment in thecalculation of pension interest and service cost. This calculation change is considered a change in accounting estimate and is being applied prospectively in 2016.For the three and six months ended March 31, 2016, the use of the spot rate approach resulted in an increase to pension income and pre-tax earnings of $9 millionand $18 million , respectively, relative to the estimated pension income amount had the Company not changed its approach.
In October 2014, the Society of Actuaries published a new set of mortality tables (RP-2014) and a new mortality improvement scale (MP-2014), which update lifeexpectancy assumptions. The newly published tables generally reflect longer life
13

ROCKWELL COLLINS, INC.
NOTES TO CONDENSED CONSOLIDATED FINANCIAL STATEMENTS (Continued)(Unaudited)
expectancy than was projected by past tables. For the Company's 2015 year-end pension liability valuation, the Company used the RP-2014 tables with anadjustment for plan experience and the MP-2014 improvement scale adjusted to reflect convergence to an ultimate annual rate of mortality improvement of 0.75percent by 2022. For the three and six months ended March 31, 2016, these changes resulted in a decrease to pension income and pre-tax earnings of $4 million and$8 million , respectively, relative to the estimated pension income amount had the Company not used new mortality table and improvement scale assumptions.
Pension Plan FundingThe Company’s objective with respect to the funding of its pension plans is to provide adequate assets for the payment of future benefits. Pursuant to this objective,the Company will fund its pension plans as required by governmental regulations and may consider discretionary contributions as conditions warrant. In October2015, the Company voluntarily contributed $55 million to its U.S. qualified pension plans. There is no minimum statutory funding requirement for 2016 and theCompany does not currently expect to make any additional discretionary contributions during 2016 to its U.S. qualified pension plans. Any additional futurecontributions necessary to satisfy minimum statutory funding requirements are dependent upon actual plan asset returns, interest rates and actuarial assumptions.Contributions to the non-U.S. plans and the U.S. non-qualified pension plan are expected to total $13 million in 2016. During the six months ended March 31, 2016, the Company made contributions to the non-U.S. plans and the U.S. non-qualified pension plan of $8 million .
10. Stock-Based Compensation and Earnings Per Share
Stock-based compensation expense, which is calculated net of an assumed forfeiture rate, and related income tax benefit included within the CondensedConsolidated Statement of Operations is as follows:
Three Months Ended Six Months Ended March 31 March 31(in millions) 2016 2015 2016 2015Stock-based compensation expense included in:
Product cost of sales $ 3 $ 2 $ 5 $ 4Selling, general and administrative expenses 6 5 10 8
Total $ 9 $ 7 $ 15 $ 12
Income tax benefit $ 3 $ 2 $ 5 $ 4
The Company issued awards of equity instruments under the Company's various incentive plans for the six months ended March 31, 2016 and 2015 as follows:
Options Performance Shares Restricted Stock Units
(shares in thousands)NumberIssued
WeightedAverage Fair
Value NumberIssued
WeightedAverage Fair
Value NumberIssued
WeightedAverage Fair
ValueSix months ended March 31, 2016 628.9 $ 17.76 128.6 $ 85.05 68.3 $ 85.75Six months ended March 31, 2015 555.6 $ 19.60 129.7 $ 82.63 65.9 $ 84.23
The maximum number of shares of common stock that can be issued in respect of performance shares granted in 2016 based on the achievement of performancetargets for years 2016 through 2018 is approximately 306,000 .
The fair value of each option granted by the Company was estimated using a binomial lattice pricing model and the following weighted average assumptions:
2016 Grants 2015 GrantsRisk-free interest rate 0.8% - 2.5% 0.5% - 2.6%Expected dividend yield 1.5% - 1.6% 1.6%Expected volatility 20.0% 24.0%Expected life 7 years 7 years
14

ROCKWELL COLLINS, INC.
NOTES TO CONDENSED CONSOLIDATED FINANCIAL STATEMENTS (Continued)(Unaudited)
Employee Benefits Paid in Company StockDuring the six months ended March 31, 2016 and 2015 , 0.3 million and 0.3 million shares, respectively, of the Company's common stock were issued toemployees under the Company's employee stock purchase and defined contribution savings plans at a value of $27 million and $23 million for the respectiveperiods.
Earnings Per Share and Diluted Share EquivalentsThe computation of basic and diluted earnings per share is as follows:
Three Months Ended Six Months Ended March 31 March 31(in millions, except per share amounts) 2016 2015 2016 2015Numerator for basic and diluted earnings per share:
Income from continuing operations $ 172 $ 163 $ 305 $ 332Income (loss) from discontinued operations, net of taxes (1) (6) 1 (8)
Net income $ 171 $ 157 $ 306 $ 324
Denominator: Denominator for basic earnings per share – weighted average common shares 130.8 132.2 131.1 132.6Effect of dilutive securities:
Stock options 1.0 1.1 1.1 1.1Performance shares, restricted stock and restricted stock units 0.5 0.4 0.5 0.4Dilutive potential common shares 1.5 1.5 1.6 1.5
Denominator for diluted earnings per share – adjusted weighted average shares andassumed conversion 132.3 133.7 132.7 134.1
Earnings (loss) per share: Basic
Continuing operations $ 1.31 $ 1.23 $ 2.33 $ 2.50Discontinued operations — (0.04) — (0.06)
Basic earnings per share $ 1.31 $ 1.19 $ 2.33 $ 2.44
Diluted Continuing operations $ 1.30 $ 1.22 $ 2.30 $ 2.48Discontinued operations (0.01) (0.05) 0.01 (0.06)
Diluted earnings per share $ 1.29 $ 1.17 $ 2.31 $ 2.42
The Company adopted ASU 2016-09 (see Note 2) during the three months ended March 31, 2016. This standard requires excess tax benefits or deficienciesassociated with share-based payments to be recorded as a discrete income tax benefit or expense in the period incurred rather than within Additional paid-in capital.ASU 2016-09 also requires excess tax benefits and deficiencies to be excluded from assumed future proceeds in the calculation of diluted shares outstanding. TheCompany adopted the standard prospectively, resulting in a $3 million and $0.02 increase to net income from continuing operations and diluted earnings per sharefrom continuing operations, respectively, for the six months ended March 31, 2016.
The average outstanding diluted shares calculation excludes options with an exercise price that exceeds the average market price of shares during the period. Stockoptions excluded from the average outstanding diluted shares calculation for the three and six months ended March 31, 2016 were 0.6 million and 0 million ,respectively, compared to none for the three and six months ended March 31, 2015.
Earnings per share amounts are computed independently each quarter. As a result, the sum of each quarter's per share amount may not equal the total per shareamount for the full year.
15

ROCKWELL COLLINS, INC.
NOTES TO CONDENSED CONSOLIDATED FINANCIAL STATEMENTS (Continued)(Unaudited)
11. Accumulated Other Comprehensive Loss
Changes in accumulated other comprehensive loss (AOCL), net of tax, by component for the three and six months ended March 31, 2016 and 2015 are as follows:
Foreign ExchangeTranslationAdjustment
Pension and OtherPostretirementAdjustments (1)
Change in the FairValue of EffectiveCash Flow Hedges Total
Balance at December 31, 2015 $ (64) $ (1,624) $ (5) $ (1,693)Other comprehensive income before reclassifications 8 — — 8Amounts reclassified from accumulated other comprehensive loss — 13 2 15
Net current period other comprehensive income 8 13 2 23
Balance at March 31, 2016 $ (56) $ (1,611) $ (3) $ (1,670)
Balance at September 30, 2015 $ (56) $ (1,637) $ (6) $ (1,699)Other comprehensive loss before reclassifications — — (1) (1)Amounts reclassified from accumulated other comprehensive loss — 26 4 30
Net current period other comprehensive income — 26 3 29
Balance at March 31, 2016 $ (56) $ (1,611) $ (3) $ (1,670)
Balance at December 31, 2014 $ (29) $ (1,337) $ (7) $ (1,373)Other comprehensive loss before reclassifications (22) — — (22)Amounts reclassified from accumulated other comprehensive loss — 12 1 13
Net current period other comprehensive income (loss) (22) 12 1 (9)
Balance at March 31, 2015 $ (51) $ (1,325) $ (6) $ (1,382)
Balance at September 30, 2014 $ (15) $ (1,348) $ (3) $ (1,366)Other comprehensive loss before reclassifications (36) — (5) (41)Amounts reclassified from accumulated other comprehensive loss — 23 2 25
Net current period other comprehensive income (loss) (36) 23 (3) (16)
Balance at March 31, 2015 $ (51) $ (1,325) $ (6) $ (1,382)
(1) Reclassifications from AOCL to net income, related to the amortization of net actuarial losses and prior service credits for the Company's retirement benefit plans, were $21 million ( $13million net of tax) and $18 million ( $12 million net of tax) for the three months ended March 31, 2016 and 2015, respectively, and were $ 42 million ($ 26 million net of tax) and $36 million ($23 million net of tax) for the six months ended March 31, 2016 and 2015, respectively. The reclassifications are included in the computation of net benefit expense. See Note 9, RetirementBenefits, for additional details.
12. Income Taxes
At the end of each interim reporting period, the Company makes an estimate of the annual effective income tax rate. Tax items included in the annual effectiveincome tax rate are pro-rated for the full year and tax items discrete to a specific quarter are included in the effective income tax rate for that quarter. The estimateused in providing for income taxes on a year-to-date basis may change in subsequent interim periods.
16
ROCKWELL COLLINS, INC.
NOTES TO CONDENSED CONSOLIDATED FINANCIAL STATEMENTS (Continued)(Unaudited)
During the three months ended March 31, 2016 and 2015 , the effective income tax rate from continuing operations was 26.8 percent and 32.4 percent,respectively. The lower current year effective income tax rate from continuing operations was primarily due to the permanent extension of the Federal R&D TaxCredit, which had previously expired on December 31, 2014, and the early adoption of the new share-based compensation guidance. The new guidance requires therecognition of all excess tax benefits or shortfalls related to share-based compensation as a component of income tax expense, rather than in equity.
During the six months ended March 31, 2016 and 2015 , the effective income tax rate from continuing operations was 22.2 percent and 27.7 percent , respectively.The lower current year effective income tax rate from continuing operations was primarily due to the permanent extension of the Federal R&D Tax Credit and theearly adoption of the new share-based compensation guidance.
The Company's U.S. Federal income tax returns for the tax year ended September 30, 2011 and prior years have been audited by the IRS and are closed to furtheradjustments by the IRS. The IRS is currently auditing the Company's tax returns for the years ended September 30, 2012 and 2013. An acquired subsidiary is alsounder examination by the IRS for calendar years 2009 and 2012 legacy tax filings. The Company is also currently under audit in various U.S. states and non-U.S.jurisdictions. The U.S. states and non-U.S. jurisdictions have statutes of limitations generally ranging from 3 to 5 years. The Company believes it has adequatelyprovided for any tax adjustments that may result from the various audits.
The Company had net income tax payments of $31 million and $78 million during the six months ended March 31, 2016 and 2015 , respectively.
The Company has gross unrecognized tax benefits recorded within Other Liabilities in the Condensed Consolidated Statement of Financial Position of $47 millionand $39 million as of March 31, 2016 and September 30, 2015 , respectively. The total amount of unrecognized tax benefits that, if recognized, would affect theeffective income tax rate was $16 million and $11 million as of March 31, 2016 and September 30, 2015 , respectively. Although the timing and outcome of taxsettlements are uncertain, it is reasonably possible that during the next 12 months a reduction in unrecognized tax benefits may occur in the range of $0 to $13million , based on the outcome of tax examinations or as a result of the expiration of various statutes of limitations.
The Company includes interest and penalties related to unrecognized tax benefits in income tax expense. The total amount of interest and penalties recognizedwithin Other Liabilities in the Condensed Consolidated Statement of Financial Position was $2 million and $1 million as of March 31, 2016 and September 30,2015 , respectively. The total amount of interest and penalties recorded as an expense or (income) within Income tax expense in the Condensed ConsolidatedStatement of Operations was $0 million for each of the six months ended March 31, 2016 and 2015 .
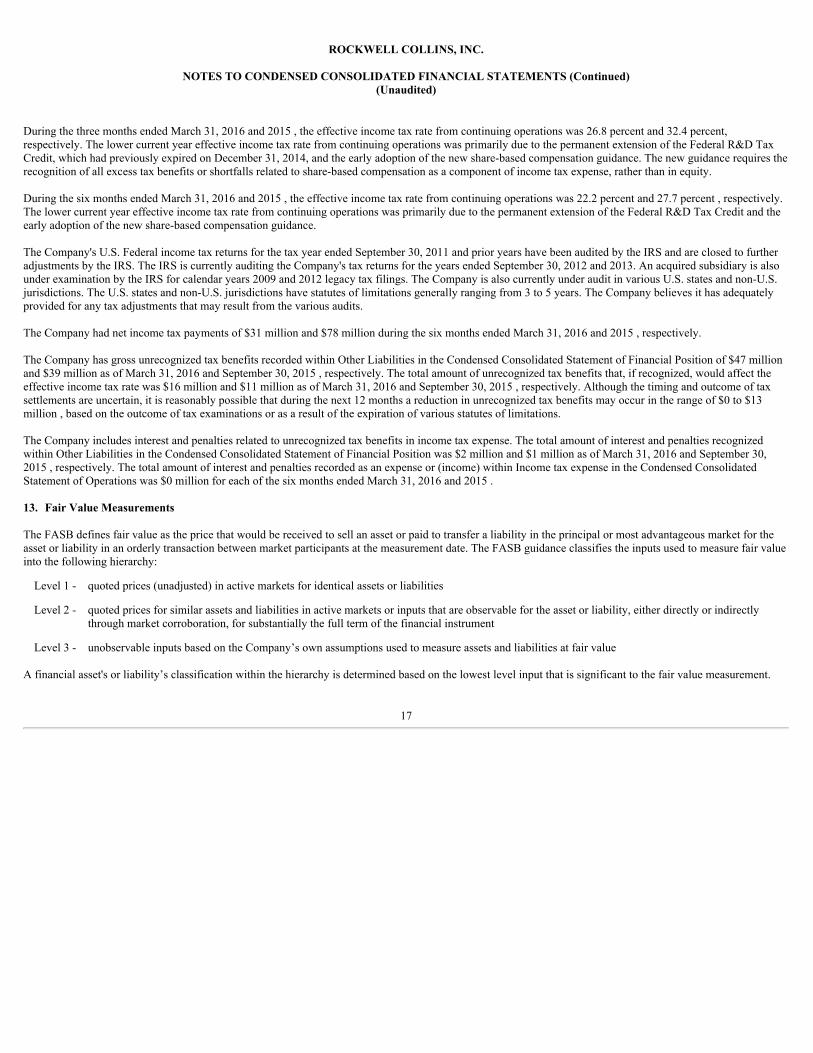
13. Fair Value Measurements
The FASB defines fair value as the price that would be received to sell an asset or paid to transfer a liability in the principal or most advantageous market for theasset or liability in an orderly transaction between market participants at the measurement date. The FASB guidance classifies the inputs used to measure fair valueinto the following hierarchy:
Level 1 - quoted prices (unadjusted) in active markets for identical assets or liabilities
Level 2 - quoted prices for similar assets and liabilities in active markets or inputs that are observable for the asset or liability, either directly or indirectlythrough market corroboration, for substantially the full term of the financial instrument
Level 3 - unobservable inputs based on the Company’s own assumptions used to measure assets and liabilities at fair value
A financial asset's or liability’s classification within the hierarchy is determined based on the lowest level input that is significant to the fair value measurement.
17
ROCKWELL COLLINS, INC.
NOTES TO CONDENSED CONSOLIDATED FINANCIAL STATEMENTS (Continued)(Unaudited)
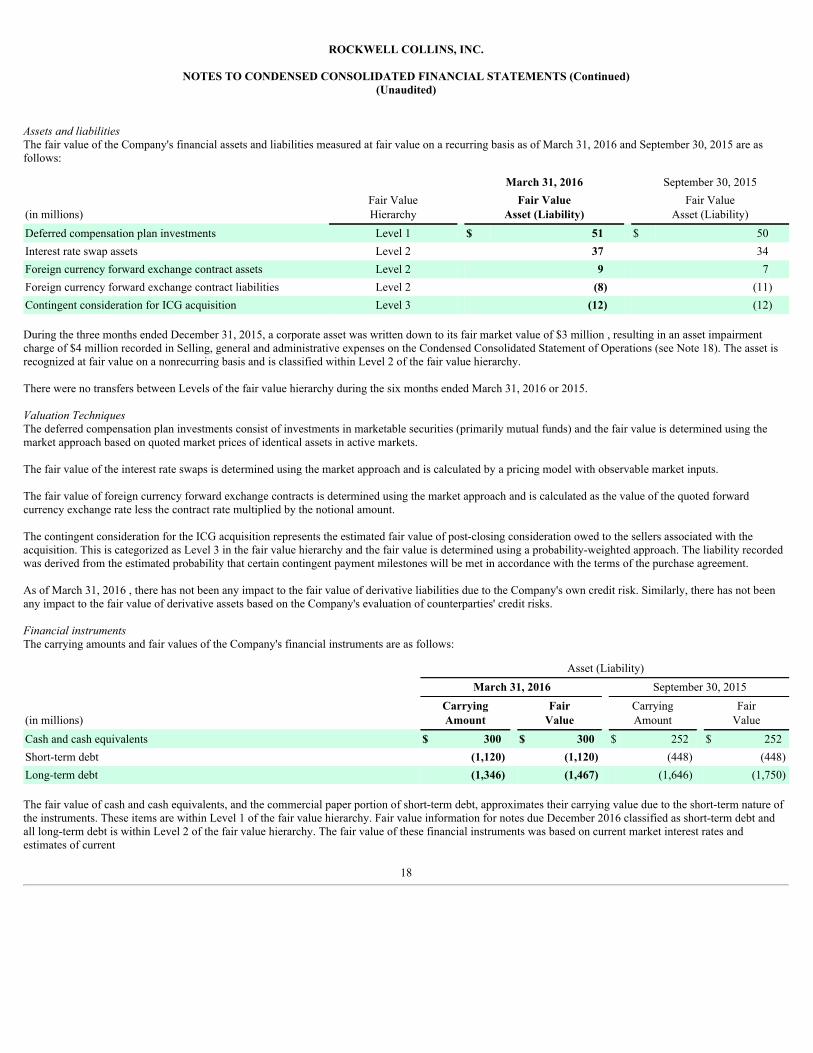
Assets and liabilitiesThe fair value of the Company's financial assets and liabilities measured at fair value on a recurring basis as of March 31, 2016 and September 30, 2015 are asfollows:
March 31, 2016 September 30, 2015
(in millions)Fair ValueHierarchy
Fair ValueAsset (Liability)
Fair ValueAsset (Liability)
Deferred compensation plan investments Level 1 $ 51 $ 50Interest rate swap assets Level 2 37 34Foreign currency forward exchange contract assets Level 2 9 7Foreign currency forward exchange contract liabilities Level 2 (8) (11)Contingent consideration for ICG acquisition Level 3 (12) (12)
During the three months ended December 31, 2015, a corporate asset was written down to its fair market value of $3 million , resulting in an asset impairmentcharge of $4 million recorded in Selling, general and administrative expenses on the Condensed Consolidated Statement of Operations (see Note 18). The asset isrecognized at fair value on a nonrecurring basis and is classified within Level 2 of the fair value hierarchy.
There were no transfers between Levels of the fair value hierarchy during the six months ended March 31, 2016 or 2015.
Valuation TechniquesThe deferred compensation plan investments consist of investments in marketable securities (primarily mutual funds) and the fair value is determined using themarket approach based on quoted market prices of identical assets in active markets.
The fair value of the interest rate swaps is determined using the market approach and is calculated by a pricing model with observable market inputs.
The fair value of foreign currency forward exchange contracts is determined using the market approach and is calculated as the value of the quoted forwardcurrency exchange rate less the contract rate multiplied by the notional amount.
The contingent consideration for the ICG acquisition represents the estimated fair value of post-closing consideration owed to the sellers associated with theacquisition. This is categorized as Level 3 in the fair value hierarchy and the fair value is determined using a probability-weighted approach. The liability recordedwas derived from the estimated probability that certain contingent payment milestones will be met in accordance with the terms of the purchase agreement.
As of March 31, 2016 , there has not been any impact to the fair value of derivative liabilities due to the Company's own credit risk. Similarly, there has not beenany impact to the fair value of derivative assets based on the Company's evaluation of counterparties' credit risks.
Financial instrumentsThe carrying amounts and fair values of the Company's financial instruments are as follows:
Asset (Liability) March 31, 2016 September 30, 2015
(in millions)CarryingAmount
FairValue
CarryingAmount
FairValue
Cash and cash equivalents $ 300 $ 300 $ 252 $ 252Short-term debt (1,120) (1,120) (448) (448)Long-term debt (1,346) (1,467) (1,646) (1,750)
The fair value of cash and cash equivalents, and the commercial paper portion of short-term debt, approximates their carrying value due to the short-term nature ofthe instruments. These items are within Level 1 of the fair value hierarchy. Fair value information for notes due December 2016 classified as short-term debt andall long-term debt is within Level 2 of the fair value hierarchy. The fair value of these financial instruments was based on current market interest rates andestimates of current
18

ROCKWELL COLLINS, INC.
NOTES TO CONDENSED CONSOLIDATED FINANCIAL STATEMENTS (Continued)(Unaudited)
market conditions for instruments with similar terms, maturities and degree of risk. The carrying amount and fair value of short-term and long-term debt excludesthe interest rate swaps fair value adjustment. These fair value estimates do not necessarily reflect the amounts the Company would realize in a current marketexchange.
14. Derivative Financial Instruments
Interest Rate SwapsThe Company manages its exposure to interest rate risk by maintaining a mix of fixed and variable rate debt, which over time should moderate the costs of debtfinancing. To help meet this objective, the Company may use financial instruments in the form of interest rate swaps. In January 2010, the Company entered intotwo interest rate swap contracts which expire on July 15, 2019 and effectively converted $150 million of the 2019 Notes to floating rate debt based on six-monthLIBOR plus 1.235 percent . In June 2015, the Company entered into two interest rate swap contracts which expire on July 15, 2019 and effectively converted theremaining $ 150 million of the 2019 Notes to floating rate debt based on three-month LIBOR plus 3.56 percent (collectively the 2019 Swaps).
In March 2014, the Company entered into three interest rate swap contracts (the 2023 Swaps) which expire on December 15, 2023 and effectively converted $200million of the 2023 Notes to floating rate debt based on one-month LIBOR plus 0.94 percent .
The Company designated both the 2019 and the 2023 Swaps (the Swaps) as fair value hedges. The Swaps are recorded within Other Assets at a fair value of $37million , offset by a fair value adjustment to Long-term Debt (Note 8) of $37 million at March 31, 2016 . At September 30, 2015 , the Swaps were recorded withinOther Assets at a fair value of $34 million , offset by a fair value adjustment to Long-term Debt (Note 8) of $34 million . Cash payments or receipts between theCompany and the counterparties to the Swaps are recorded as an adjustment to interest expense.
Foreign Currency Forward Exchange ContractsThe Company transacts business in various foreign currencies which subjects the Company’s cash flows and earnings to exposure related to changes in foreigncurrency exchange rates. These exposures arise primarily from purchases or sales of products and services from third parties and intercompany transactions.Foreign currency forward exchange contracts provide for the purchase or sale of foreign currencies at specified future dates at specified exchange rates and areused to offset changes in the fair value of certain assets or liabilities or forecasted cash flows resulting from transactions denominated in foreign currencies. As ofMarch 31, 2016 and September 30, 2015 , the Company had outstanding foreign currency forward exchange contracts with notional amounts of $278 million and$359 million , respectively. These notional values consist primarily of contracts for the European euro, British pound sterling and Japanese yen, and are stated inU.S. dollar equivalents at spot exchange rates at the respective dates.
Fair Value of Derivative InstrumentsFair values of derivative instruments in the Condensed Consolidated Statement of Financial Position as of March 31, 2016 and September 30, 2015 are as follows:
Asset Derivatives
(in millions) Classification March 31,
2016 September 30, 2015Foreign currency forward exchange contracts Other current assets $ 9 $ 7Interest rate swaps Other assets 37 34
Total $ 46 $ 41
Liability Derivatives
(in millions) Classification March 31,
2016 September 30, 2015Foreign currency forward exchange contracts Other current liabilities $ 8 $ 11
The fair values of derivative instruments are presented on a gross basis as the Company does not have any derivative contracts which are subject to master nettingarrangements. As of March 31, 2016 , there were undesignated foreign currency forward exchange contracts classified within Other current assets of $2 million andOther current liabilities of $1 million .
19

ROCKWELL COLLINS, INC.
NOTES TO CONDENSED CONSOLIDATED FINANCIAL STATEMENTS (Continued)(Unaudited)
The effect of derivative instruments on the Condensed Consolidated Statement of Operations for the three and six months ended March 31, 2016 and 2015 is asfollows:
Amount of Gain (Loss) Amount of Gain (Loss) Three Months Ended Six Months Ended March 31 March 31
(in millions)Location of Gain
(Loss) 2016 2015 2016 2015Derivatives Designated as Hedging Instruments: Fair Value Hedges
Interest rate swaps Interest expense $ 2 $ 2 $ 5 $ 5Cash Flow Hedges
Foreign currency forward exchange contracts: Amount of (loss) recognized in AOCL (effective portion, beforedeferred tax impact) AOCL — — (1) (7)Amount of (loss) reclassified from AOCL into income Cost of sales (3) (2) (5) (3)
Derivatives Not Designated as Hedging Instruments: Foreign currency forward exchange contracts Cost of sales (2) (3) (5) (5)
There was no significant impact to the Company’s earnings related to the ineffective portion of any hedging instruments during the six months ended March 31,2016 . In addition, there was no significant impact to the Company’s earnings when a hedged firm commitment no longer qualified as a fair value hedge or when ahedged forecasted transaction no longer qualified as a cash flow hedge during the three and six months ended March 31, 2016 .
The Company did not have any hedges with credit-risk-related contingent features or that required the posting of collateral as of March 31, 2016 . The cash flowsfrom derivative contracts are recorded in operating activities in the Condensed Consolidated Statement of Cash Flows.
The Company expects to reclassify approximately $2 million of AOCL losses from cash flow hedges into earnings over the next 12 months. The maximumduration of a foreign currency cash flow hedge contract at March 31, 2016 was 52 months.
15. Guarantees and Indemnifications
Product warranty costsAccrued liabilities are recorded to reflect the Company’s contractual obligations relating to warranty commitments to customers. Warranty coverage of variouslengths and terms is provided to customers depending on standard offerings and negotiated contractual agreements. An estimate for warranty expense is recorded atthe time of sale based on the length of the warranty and historical warranty return rates and repair costs.
20

ROCKWELL COLLINS, INC.
NOTES TO CONDENSED CONSOLIDATED FINANCIAL STATEMENTS (Continued)(Unaudited)
Changes in the carrying amount of accrued product warranty costs are summarized as follows:
Six Months Ended March 31(in millions) 2016 2015Balance at beginning of year $ 89 $ 104Warranty costs incurred (21) (24)Product warranty accrual 18 24Changes in estimates for prior years (2) (5)Foreign currency translation adjustments and other — (2)
Balance at March 31 $ 84 $ 97
Letters of creditThe Company has contingent commitments in the form of letters of credit. Outstanding letters of credit are issued by banks on the Company’s behalf to supportcertain contractual obligations to its customers. If the Company fails to meet these contractual obligations, these letters of credit may become liabilities of theCompany. Total outstanding letters of credit at March 31, 2016 were $ 251 million . These commitments are not reflected as liabilities on the Company’sCondensed Consolidated Statement of Financial Position.
IndemnificationsThe Company enters into indemnifications with lenders, counterparties in transactions such as administration of employee benefit plans and other customaryindemnifications with third parties in the normal course of business. The following are other than customary indemnifications based on the judgment ofmanagement:
In connection with agreements for the sale of portions of its business, the Company at times retains various liabilities of a business that relate to events occurringprior to its sale, such as tax, environmental, litigation and employment matters. The Company at times indemnifies the purchaser of a Rockwell Collins business inthe event a third party asserts a claim that relates to a liability retained by the Company.
The Company also provides indemnifications of varying scope and amounts to certain customers against claims of product liability or intellectual propertyinfringement made by third parties arising from the use of Company or customer products or intellectual property. These indemnifications generally require theCompany to compensate the other party for certain damages and costs incurred as a result of third party product liability or intellectual property claims arising fromthese transactions.
The amount the Company could be required to pay under its indemnification agreements is generally limited based on amounts specified in the underlyingagreements, or in the case of some agreements, the maximum potential amount of future payments that could be required is not limited. When a potential claim isasserted under these agreements, the Company considers such factors as the degree of probability of an unfavorable outcome and the ability to make a reasonableestimate of the amount of loss. A liability is recorded when a potential claim is both probable and estimable. The nature of these agreements prevents the Companyfrom making a reasonable estimate of the maximum potential amount it could be required to pay should counterparties to these agreements assert a claim; however,the Company currently has no material claims pending related to such agreements.
21
ROCKWELL COLLINS, INC.
NOTES TO CONDENSED CONSOLIDATED FINANCIAL STATEMENTS (Continued)(Unaudited)
16. Environmental Matters
The Company is subject to federal, state and local regulations relating to the discharge of substances into the environment, the disposal of hazardous wastes andother activities affecting the environment that have had and will continue to have an impact on the Company’s manufacturing operations. These environmentalprotection regulations may require the investigation and remediation of environmental impairments at current and previously owned or leased properties. Inaddition, lawsuits, claims and proceedings have been asserted on occasion against the Company alleging violations of environmental protection regulations, orseeking remediation of alleged environmental impairments, principally at previously owned or leased properties. As of March 31, 2016 , the Company is involvedin the investigation or remediation of seven sites under these regulations or pursuant to lawsuits asserted by third parties. Management estimates that the totalreasonably possible future costs the Company could incur for six of these sites is not significant. Management estimates that the total reasonably possible futurecosts the Company could incur from one of these sites to be approximately $ 12 million . The Company has recorded environmental reserves for this site of $ 6million as of March 31, 2016 , which represents management’s best estimate of the probable future cost for this site.
To date, compliance with environmental regulations and resolution of environmental claims has been accomplished without material effect on the Company’sliquidity and capital resources, competitive position or financial condition. Management believes that expenditures for environmental capital investment andremediation necessary to comply with present regulations governing environmental protection and other expenditures for the resolution of environmental claimswill not have a material effect on the Company’s business or financial position.
17. Legal Matters
The Company is subject to various lawsuits, claims and proceedings that have been or may be instituted or asserted against the Company relating to the conduct ofthe Company's business, including those pertaining to product liability, antitrust, intellectual property, safety and health, exporting and importing, contract,employment and regulatory matters. Although the outcome of these matters cannot be predicted with certainty and some lawsuits, claims or proceedings may bedisposed of unfavorably to the Company, management believes there are no material pending legal proceedings.
18. Restructuring and Asset Impairment Charges
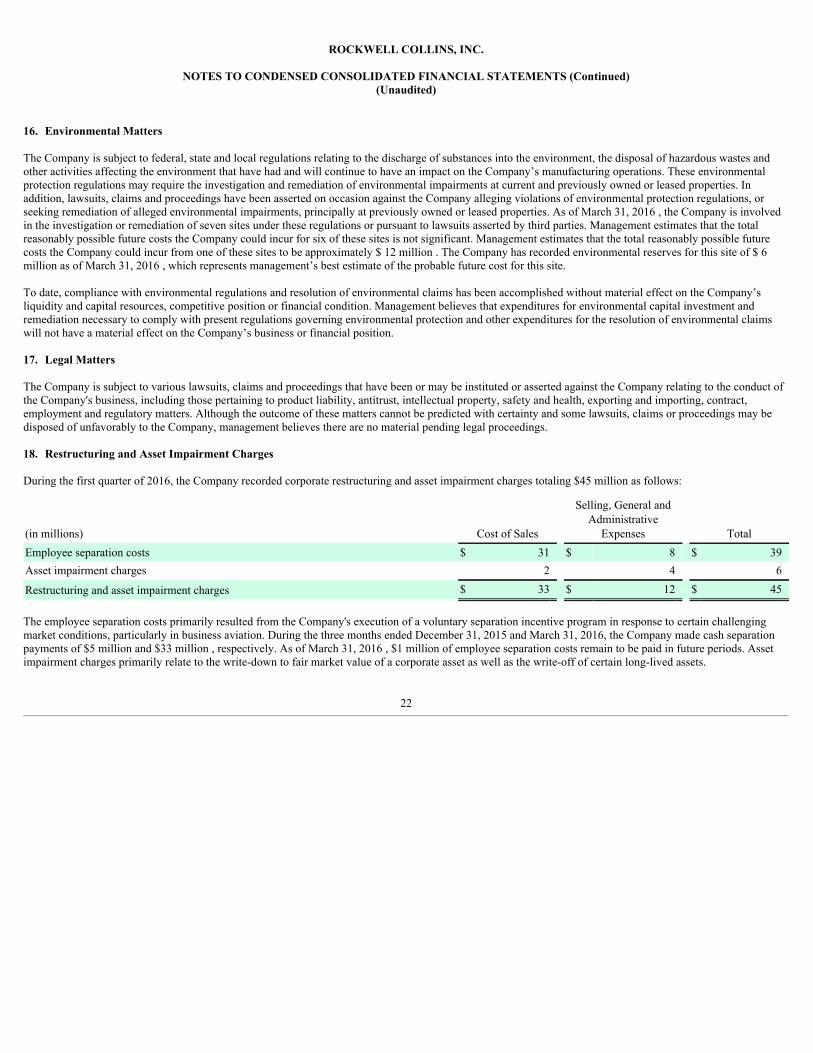
During the first quarter of 2016, the Company recorded corporate restructuring and asset impairment charges totaling $45 million as follows:
(in millions) Cost of Sales
Selling, General andAdministrative
Expenses TotalEmployee separation costs $ 31 $ 8 $ 39Asset impairment charges 2 4 6
Restructuring and asset impairment charges $ 33 $ 12 $ 45
The employee separation costs primarily resulted from the Company's execution of a voluntary separation incentive program in response to certain challengingmarket conditions, particularly in business aviation. During the three months ended December 31, 2015 and March 31, 2016, the Company made cash separationpayments of $5 million and $33 million , respectively. As of March 31, 2016 , $1 million of employee separation costs remain to be paid in future periods. Assetimpairment charges primarily relate to the write-down to fair market value of a corporate asset as well as the write-off of certain long-lived assets.
22

ROCKWELL COLLINS, INC.
NOTES TO CONDENSED CONSOLIDATED FINANCIAL STATEMENTS (Continued)(Unaudited)
19. Business Segment Information
Sales and earnings from continuing operations of the Company's operating segments are summarized as follows:
Three Months Ended Six Months Ended March 31 March 31(in millions) 2016 2015 2016 2015Sales: Commercial Systems $ 611 $ 619 $ 1,173 $ 1,187Government Systems 538 567 989 1,076Information Management Services 162 155 318 304
Total sales $ 1,311 $ 1,341 $ 2,480 $ 2,567
Segment operating earnings: Commercial Systems $ 135 $ 142 $ 260 $ 267Government Systems 108 114 194 220Information Management Services 29 22 53 43
Total segment operating earnings 272 278 507 530
Interest expense (17) (15) (32) (30)Stock-based compensation (9) (7) (15) (12)General corporate, net (11) (15) (23) (29)Restructuring and asset impairment charges — — (45) —
Income from continuing operations before income taxes 235 241 392 459Income tax expense (63) (78) (87) (127)
Income from continuing operations $ 172 $ 163 $ 305 $ 332
The Company evaluates performance and allocates resources based upon, among other considerations, segment operating earnings. The Company's definition ofsegment operating earnings excludes income taxes, stock-based compensation, unallocated general corporate expenses, interest expense, gains and losses from thedisposition of businesses, restructuring and asset impairment charges and other special items as identified by management from time to time. Intersegment sales arenot material and have been eliminated.
23
ROCKWELL COLLINS, INC.
NOTES TO CONDENSED CONSOLIDATED FINANCIAL STATEMENTS (Continued)(Unaudited)
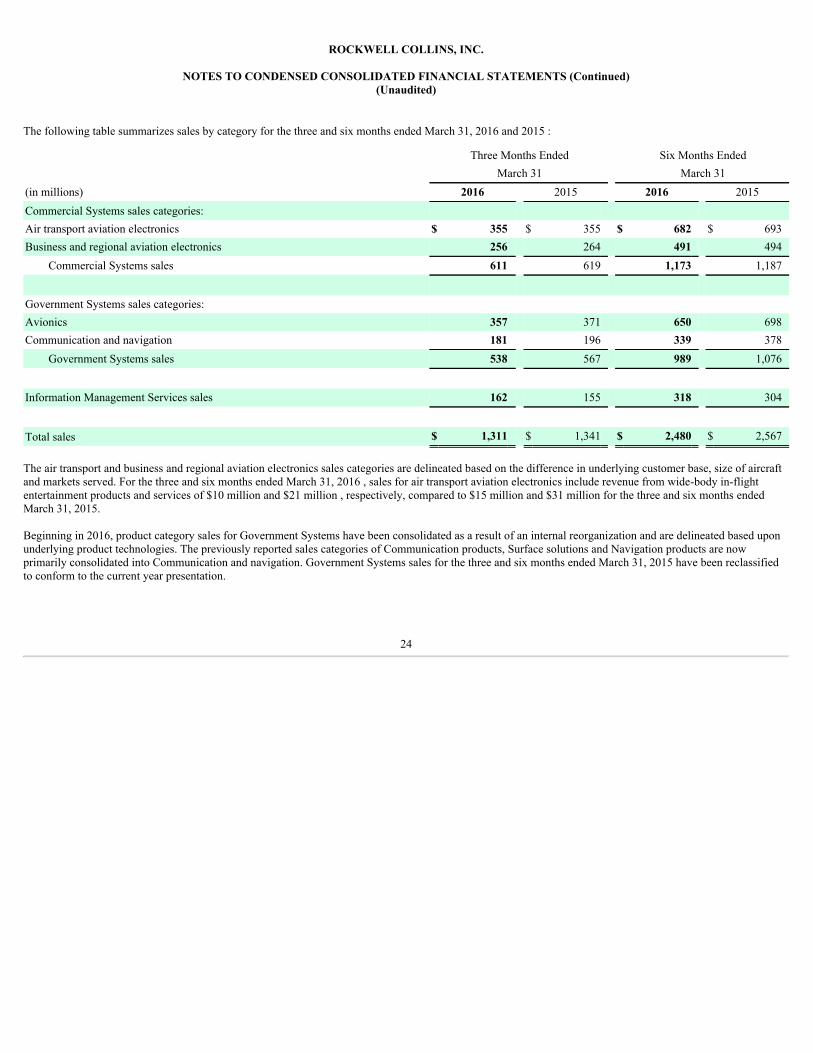
The following table summarizes sales by category for the three and six months ended March 31, 2016 and 2015 :
Three Months Ended Six Months Ended March 31 March 31(in millions) 2016 2015 2016 2015Commercial Systems sales categories: Air transport aviation electronics $ 355 $ 355 $ 682 $ 693Business and regional aviation electronics 256 264 491 494
Commercial Systems sales 611 619 1,173 1,187
Government Systems sales categories: Avionics 357 371 650 698Communication and navigation 181 196 339 378
Government Systems sales 538 567 989 1,076
Information Management Services sales 162 155 318 304
Total sales $ 1,311 $ 1,341 $ 2,480 $ 2,567
The air transport and business and regional aviation electronics sales categories are delineated based on the difference in underlying customer base, size of aircraftand markets served. For the three and six months ended March 31, 2016 , sales for air transport aviation electronics include revenue from wide-body in-flightentertainment products and services of $10 million and $21 million , respectively, compared to $15 million and $31 million for the three and six months endedMarch 31, 2015.
Beginning in 2016, product category sales for Government Systems have been consolidated as a result of an internal reorganization and are delineated based uponunderlying product technologies. The previously reported sales categories of Communication products, Surface solutions and Navigation products are nowprimarily consolidated into Communication and navigation. Government Systems sales for the three and six months ended March 31, 2015 have been reclassifiedto conform to the current year presentation.
24

Item 2. Management's Discussion and Analysis of Financial Condition and Results of Operations
OVERVIEW AND OUTLOOK
We have a diversified and balanced business, serving both commercial and government markets. Our Commercial Systems business supplies aviation electronicssystems, products and services to customers located throughout the world. The Commercial Systems customer base is comprised of commercial air transport andbusiness and regional aircraft OEMs, commercial airlines and business aircraft operators. The Government Systems business provides communication andnavigation products and avionics to the U.S. Department of Defense, state and local governments, other government agencies, civil agencies, defense contractorsand foreign ministries of defense around the world. These systems, products and services support airborne (fixed and rotary wing), ground and shipboardapplications. Our Information Management Services business enables mission-critical data and voice communications throughout the world to customers includingthe U.S. Federal Aviation Administration, commercial airlines, business aircraft operators, airport and critical infrastructure operators and major passenger andfreight railroads. These communications are enabled by our high-performance, high-quality and high-assurance proprietary radio and terrestrial networks,enhancing customer efficiency, safety and connectivity.
During the first six months of 2016, compared to the same period in the prior year, total revenues decreased 3 percent, driven primarily by an 8 percent reduction inGovernment Systems revenue. Total segment operating margins (1) decreased 20 basis points to 20.4 percent, primarily due to the lower sales volume. As a result ofcertain challenging market conditions, particularly in business aviation, we initiated restructuring actions in October of 2015. We recorded a $45 million pre-taxrestructuring charge in the three months ended December 31, 2015 associated with these actions, consisting primarily of employee separation costs.
On December 18, 2015, the Protecting Americans from Tax Hikes Act was enacted which permanently reinstated the Federal Research and Development TaxCredit (Federal R&D Tax Credit) retroactive to January 1, 2015. This favorable tax credit had previously expired on December 31, 2014. We expect our effectiveincome tax rate for 2016 to be in the range of 22 to 23 percent.
The following is a summary our company's segment guidance for 2016:
• Commercial Systems 2016 revenue is expected to increase low-single digits when compared with 2015
• Government Systems 2016 revenue is expected to be up low-single digits when compared to 2015
• Information Management Services sales are expected to grow mid to high-single digits when compared to 2015
The following table is a summary of our company's updated 2016 guidance for continuing operations:
• total sales in the range of $5.3 billion to $5.4 billion
• diluted earnings per share in the range of $5.45 to $5.65
• cash provided by operating activities in the range of $750 million to $850 million
• capital expenditures of about $200 million
• total research and development investment of about $1 billion (2)
(1) Total segment operating margins is a non-GAAP measure and is reconciled to the related GAAP measure, Income from continuing operations before income taxes, in Note 19 of the Notes toCondensed Consolidated Financial Statements. Total segment operating margins is calculated as total segment operating earnings divided by total sales.
(2) Total research and development (R&D) investment is comprised of company and customer-funded R&D expenditures and the net increase in pre-production engineering costs capitalizedwithin Inventory.
25

RESULTS OF OPERATIONS
The following management discussion and analysis of results of operations is based on reported financial results for the three and six months ended March 31,2016 and 2015 , and should be read in conjunction with our condensed consolidated financial statements and notes thereto in Item 1 of Part I of this quarterlyreport. As discussed in Note 4 of the Notes to Condensed Consolidated Financial Statements , the results of ASES have been accounted for as discontinued operationsfor all periods presented. Unless otherwise noted, disclosures pertain to our continuing operations.
Sales
Three Months Ended March 31 Six Months Ended March 31(in millions) 2016 2015 2016 2015Total sales $ 1,311 $ 1,341 $ 2,480 $ 2,567Percent decrease (2)% (3)%
Total sales decreased $30 million , or 2 percent , for the three months ended March 31, 2016 , as compared to the same period in the prior year. GovernmentSystems sales decreased by $29 million, Commercial Systems sales decreased by $8 million and Information Management Services sales increased by $7 million.
Total sales decreased $87 million , or 3 percent , for the six months ended March 31, 2016 , as compared to the same period in the prior year. Government Systemssales decreased by $87 million, Commercial Systems sales decreased by $14 million and Information Management Services sales increased by $14 million.
Refer to the Commercial Systems, Government Systems and Information Management Services sections of the Segment Financial Results below for detailed salesdiscussions.
Cost of Sales
Three Months Ended March 31 Six Months Ended March 31(in millions) 2016 2015 2016 2015Total cost of sales $ 907 $ 937 $ 1,743 $ 1,794Percent of total sales 69.2% 69.9% 70.3% 69.9%
Cost of sales consists of all costs incurred to design and manufacture our products and provide our services and includes R&D, raw material, labor, facility, productwarranty, depreciation, amortization, service and support and other related expenses.
For the three months ended March 31, 2016, total cost of sales decreased $30 million , or 3 percent , compared to the same period in the prior year, primarily due tothe following:
• a $26 million reduction in company-funded R&D expense, as detailed below
• an $10 million reduction from lower sales volume in Government Systems and Commercial Systems
• partially offset by increased amortization of intangible assets and pre-production engineering costs of $9 million
For the six months ended March 31, 2016, total cost of sales decreased $51 million , or 3 percent , compared to the same period in the prior year, primarily due tothe following:
26
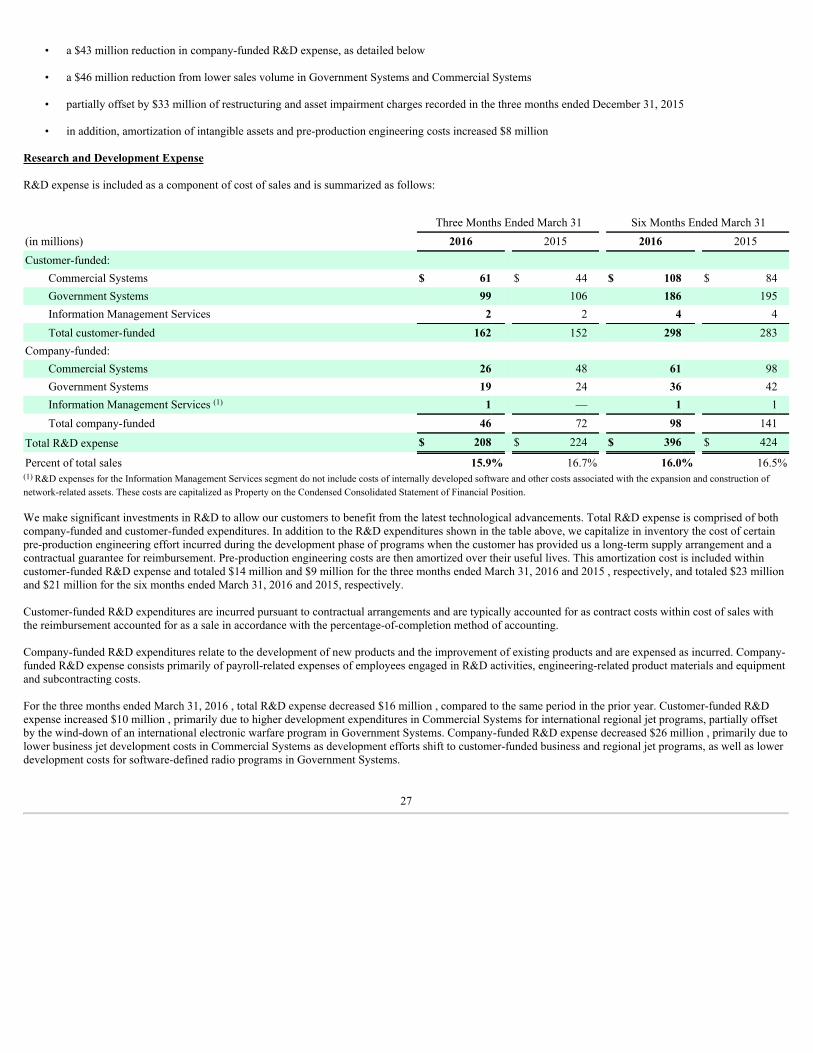
• a $43 million reduction in company-funded R&D expense, as detailed below
• a $46 million reduction from lower sales volume in Government Systems and Commercial Systems
• partially offset by $33 million of restructuring and asset impairment charges recorded in the three months ended December 31, 2015
• in addition, amortization of intangible assets and pre-production engineering costs increased $8 million
Research and Development Expense
R&D expense is included as a component of cost of sales and is summarized as follows:
Three Months Ended March 31 Six Months Ended March 31(in millions) 2016 2015 2016 2015Customer-funded:
Commercial Systems $ 61 $ 44 $ 108 $ 84Government Systems 99 106 186 195Information Management Services 2 2 4 4Total customer-funded 162 152 298 283
Company-funded: Commercial Systems 26 48 61 98Government Systems 19 24 36 42Information Management Services (1) 1 — 1 1Total company-funded 46 72 98 141
Total R&D expense $ 208 $ 224 $ 396 $ 424
Percent of total sales 15.9% 16.7% 16.0% 16.5%(1) R&D expenses for the Information Management Services segment do not include costs of internally developed software and other costs associated with the expansion and construction ofnetwork-related assets. These costs are capitalized as Property on the Condensed Consolidated Statement of Financial Position.
We make significant investments in R&D to allow our customers to benefit from the latest technological advancements. Total R&D expense is comprised of bothcompany-funded and customer-funded expenditures. In addition to the R&D expenditures shown in the table above, we capitalize in inventory the cost of certainpre-production engineering effort incurred during the development phase of programs when the customer has provided us a long-term supply arrangement and acontractual guarantee for reimbursement. Pre-production engineering costs are then amortized over their useful lives. This amortization cost is included withincustomer-funded R&D expense and totaled $14 million and $9 million for the three months ended March 31, 2016 and 2015 , respectively, and totaled $23 millionand $21 million for the six months ended March 31, 2016 and 2015, respectively.
Customer-funded R&D expenditures are incurred pursuant to contractual arrangements and are typically accounted for as contract costs within cost of sales withthe reimbursement accounted for as a sale in accordance with the percentage-of-completion method of accounting.
Company-funded R&D expenditures relate to the development of new products and the improvement of existing products and are expensed as incurred. Company-funded R&D expense consists primarily of payroll-related expenses of employees engaged in R&D activities, engineering-related product materials and equipmentand subcontracting costs.
For the three months ended March 31, 2016 , total R&D expense decreased $16 million , compared to the same period in the prior year. Customer-funded R&Dexpense increased $10 million , primarily due to higher development expenditures in Commercial Systems for international regional jet programs, partially offsetby the wind-down of an international electronic warfare program in Government Systems. Company-funded R&D expense decreased $26 million , primarily due tolower business jet development costs in Commercial Systems as development efforts shift to customer-funded business and regional jet programs, as well as lowerdevelopment costs for software-defined radio programs in Government Systems.
27

In addition to the R&D expenses above, development expenditures incurred for the Boeing 737 MAX platform, the Bombardier CSeries and Global 7000/8000programs and certain military transport programs during the three months ended March 31, 2016 resulted in a net $34 million increase to our investments in pre-production engineering programs capitalized within inventory. This net increase was equal to the $34 million net increase capitalized during the same period in theprior year as higher costs incurred for certain military transport programs in Government Systems were offset by lower costs incurred for the Airbus A350 programin Commercial Systems.
For the six months ended March 31, 2016 , total R&D expense decreased $28 million , compared to the same period in the prior year. Customer-funded R&Dexpense increased $15 million , primarily due to higher development expenditures in Commercial Systems for international regional jet programs, partially offsetby the wind-down of an international electronic warfare program in Government Systems. Company-funded R&D expense decreased $43 million , primarily due tolower business jet development costs in Commercial Systems as development efforts shift to customer-funded business and regional jet programs, as well as lowerdevelopment costs for software-defined radio programs in Government Systems.
For the six months ended March 31, 2016, development expenditures incurred on the Boeing 737 MAX platform, the Bombardier CSeries and Global 7000/8000programs and certain military transport programs resulted in a net $74 million increase to our investments in pre-production engineering programs capitalizedwithin inventory. This net increase was $9 million greater than the $65 million net increase capitalized during the same period in the prior year, primarily due tohigher costs incurred for a certain military program in Government Systems.
Refer to Note 6 of the Notes to Condensed Consolidated Financial Statements for further discussion of our incremental investments in pre-production engineeringeffort.
Selling, General and Administrative Expenses
Three Months Ended March 31 Six Months Ended March 31(in millions) 2016 2015 2016 2015Selling, general and administrative expenses $ 160 $ 152 $ 323 $ 289Percent of total sales 12.2% 11.3% 13.0% 11.3%
Selling, general and administrative (SG&A) expenses consist primarily of personnel, facility and other expenses related to employees not directly engaged inmanufacturing or R&D activities. These activities include marketing and business development, finance, legal, information technology and other administrativeand management functions.
For the three months ended March 31, 2016, total SG&A expenses increased $8 million compared to the same period in the prior year, primarily due to thefollowing:
• incremental costs associated with the acquisitions of Pacific Avionics, which was acquired in March 2015, and International Communications Group(ICG), which was acquired in August 2015
• higher costs from further expansion in international emerging markets
For the six months ended March 31, 2016, total SG&A expenses increased $34 million compared to the same period in the prior year, primarily due to thefollowing:
28

• $12 million of restructuring and asset impairment charges recorded in the three months ended December 31, 2015
• higher costs from further expansion in international emerging markets
• incremental costs associated with the acquisitions of Pacific Avionics and ICG
Interest Expense
Three Months Ended March 31 Six Months Ended March 31(in millions) 2016 2015 2016 2015Interest expense $ 17 $ 15 $ 32 $ 30
Interest expense increased by $2 million for the three and six months ended March 31, 2016, primarily due to increases in short-term borrowings.
See Note 8 of the Notes to Condensed Consolidated Financial Statements for more detail regarding outstanding debt.
Net Income and Diluted Earnings Per Share
Three Months Ended March 31 Six Months Ended March 31(in millions, except per share amounts) 2016 2015 2016 2015Income from continuing operations $ 172 $ 163 $ 305 $ 332Percent of sales 13.1% 12.2% 12.3% 12.9%
Income (loss) from discontinued operations, net of taxes (1) (6) 1 (8)
Net income $ 171 $ 157 $ 306 $ 324
Diluted earnings per share from continuing operations $ 1.30 $ 1.22 $ 2.30 $ 2.48Diluted income (loss) per share from discontinued operations (0.01) (0.05) 0.01 (0.06)
Diluted earnings per share $ 1.29 $ 1.17 $ 2.31 $ 2.42
Weighted average diluted common shares 132.3 133.7 132.7 134.1
For the three months ended March 31, 2016, income from continuing operations, net of taxes, was $172 million , up 6 percent , or $9 million , from the $163million reported in the same period in the prior year. Diluted earnings per share from continuing operations increased 7 percent to $1.30 during this same period.The rate of increase in diluted earnings per share from continuing operations was more than the rate of increase in income from continuing operations, net of taxes,because of the favorable impacts from our share repurchase program.
Income from continuing operations, net of taxes, and diluted earnings per share from continuing operations for the three months ended March 31, 2016 increasedprimarily due to:
• a $15 million decrease in income tax expense primarily due to the permanent extension of the Federal R&D Tax Credit and the early adoption of the newshare-based compensation guidance
• partially offset by a $6 million decrease in total segment operating earnings, as operating earnings decreased $6 million in Government Systems and $7million in Commercial Systems, partially offset by a $7 million increase in Information Management Services
For the six months ended March 31, 2016, income from continuing operations, net of taxes, was $305 million , down 8 percent , or $27 million , from the $332million reported in the same period in the prior year. Diluted earnings per share from continuing operations decreased 7 percent to $2.30 during this same period.The rate of decrease in diluted earnings per share from
29
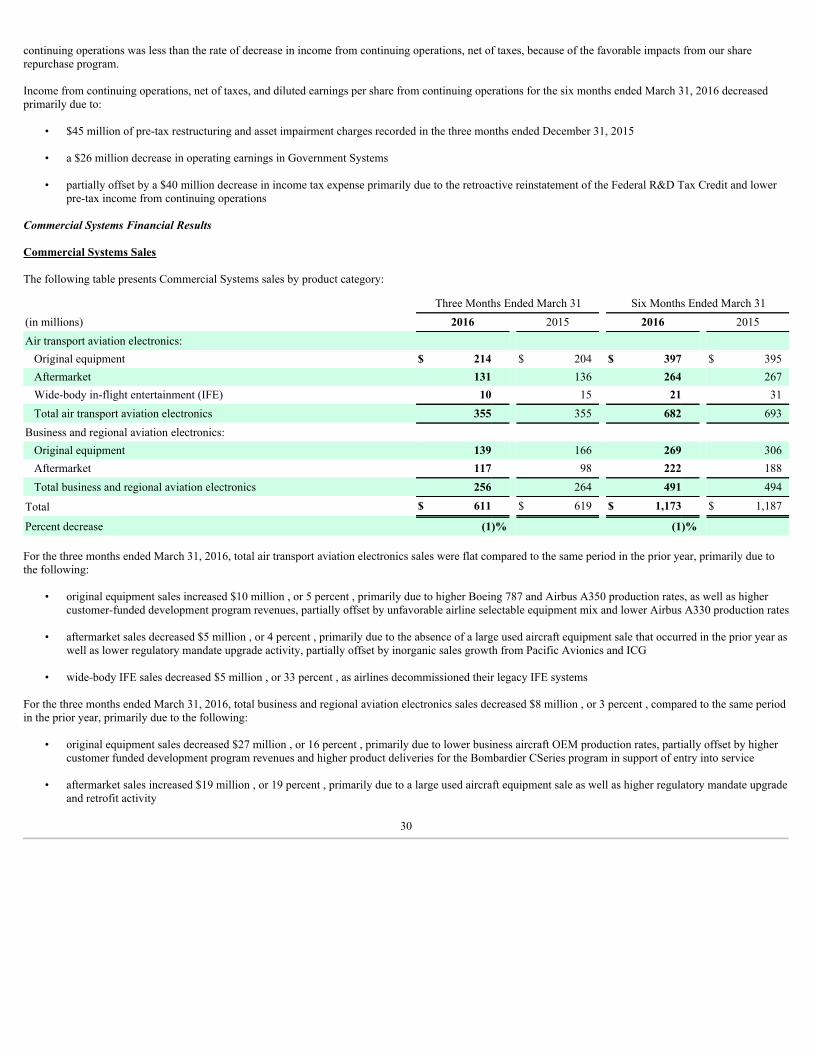
continuing operations was less than the rate of decrease in income from continuing operations, net of taxes, because of the favorable impacts from our sharerepurchase program.
Income from continuing operations, net of taxes, and diluted earnings per share from continuing operations for the six months ended March 31, 2016 decreasedprimarily due to:
• $45 million of pre-tax restructuring and asset impairment charges recorded in the three months ended December 31, 2015
• a $26 million decrease in operating earnings in Government Systems
• partially offset by a $40 million decrease in income tax expense primarily due to the retroactive reinstatement of the Federal R&D Tax Credit and lowerpre-tax income from continuing operations
Commercial Systems Financial Results
Commercial Systems Sales
The following table presents Commercial Systems sales by product category:
Three Months Ended March 31 Six Months Ended March 31(in millions) 2016 2015 2016 2015Air transport aviation electronics:
Original equipment $ 214 $ 204 $ 397 $ 395Aftermarket 131 136 264 267Wide-body in-flight entertainment (IFE) 10 15 21 31Total air transport aviation electronics 355 355 682 693
Business and regional aviation electronics: Original equipment 139 166 269 306Aftermarket 117 98 222 188Total business and regional aviation electronics 256 264 491 494
Total $ 611 $ 619 $ 1,173 $ 1,187
Percent decrease (1)% (1)%
For the three months ended March 31, 2016, total air transport aviation electronics sales were flat compared to the same period in the prior year, primarily due tothe following:
• original equipment sales increased $10 million , or 5 percent , primarily due to higher Boeing 787 and Airbus A350 production rates, as well as highercustomer-funded development program revenues, partially offset by unfavorable airline selectable equipment mix and lower Airbus A330 production rates
• aftermarket sales decreased $5 million , or 4 percent , primarily due to the absence of a large used aircraft equipment sale that occurred in the prior year aswell as lower regulatory mandate upgrade activity, partially offset by inorganic sales growth from Pacific Avionics and ICG
• wide-body IFE sales decreased $5 million , or 33 percent , as airlines decommissioned their legacy IFE systems
For the three months ended March 31, 2016, total business and regional aviation electronics sales decreased $8 million , or 3 percent , compared to the same periodin the prior year, primarily due to the following:
• original equipment sales decreased $27 million , or 16 percent , primarily due to lower business aircraft OEM production rates, partially offset by highercustomer funded development program revenues and higher product deliveries for the Bombardier CSeries program in support of entry into service
• aftermarket sales increased $19 million , or 19 percent , primarily due to a large used aircraft equipment sale as well as higher regulatory mandate upgradeand retrofit activity
30

For the six months ended March 31, 2016, total air transport aviation electronics sales decreased $11 million , or 2 percent , compared to the same period in theprior year, primarily due to the following:
• original equipment sales increased $2 million , primarily due to higher product deliveries for the Airbus A350 program and higher Boeing 787 productionrates, partially offset by unfavorable airline selectable equipment mix and lower Airbus A330 production rates
• aftermarket sales decreased $3 million , or 1 percent , primarily due to lower regulatory mandate upgrade activity and the absence of a large used aircraftequipment sale that occurred in the prior year, partially offset by inorganic sales growth from Pacific Avionics and ICG
• wide-body IFE sales decreased $10 million , or 32 percent , as airlines decommissioned their legacy IFE systems
For the six months ended March 31, 2016, total business and regional aviation electronics sales decreased $3 million , or 1 percent , compared to the same period inthe prior year, primarily due to the following:
• original equipment sales decreased $37 million , or 12 percent , primarily due to lower business aircraft OEM production rates, partially offset by highercustomer-funded development program revenues and higher product deliveries for the Bombardier CSeries and Embraer Legacy 500 programs
• aftermarket sales increased $34 million , or 18 percent , primarily due to higher regulatory mandate upgrade and retrofit activity as well as increased salesof used aircraft parts
Commercial Systems Segment Operating Earnings
Three Months Ended March 31 Six Months Ended March 31(in millions) 2016 2015 2016 2015Segment operating earnings $ 135 $ 142 $ 260 $ 267Percent of sales 22.1% 22.9% 22.2% 22.5%
For the three months ended March 31, 2016, Commercial Systems operating earnings decreased $7 million , or 5 percent , compared to the same period in the prioryear, primarily due to the following:
• operating earnings were negatively impacted by sales mix, as lower margin customer-funded development revenues increased and higher margin businessjet OEM sales decreased in the three months ended March 31, 2016 compared to the same period in the prior year
• a $6 million increase in SG&A costs resulting from the acquisition and integration of Pacific Avionics and ICG
• partially offset by a $22 million decrease in company-funded R&D expense
• in addition, Commercial Systems benefited from certain cost savings initiatives from previously announced restructuring plans
For the six months ended March 31, 2016, Commercial Systems operating earnings decreased $7 million , or 3 percent , compared to the same period in the prioryear, primarily due to the following:
• operating earnings were negatively impacted by sales mix, as lower margin customer-funded development revenues increased and higher margin businessjet OEM sales decreased in the six months ended March 31, 2016 compared to the same period in the prior year
31
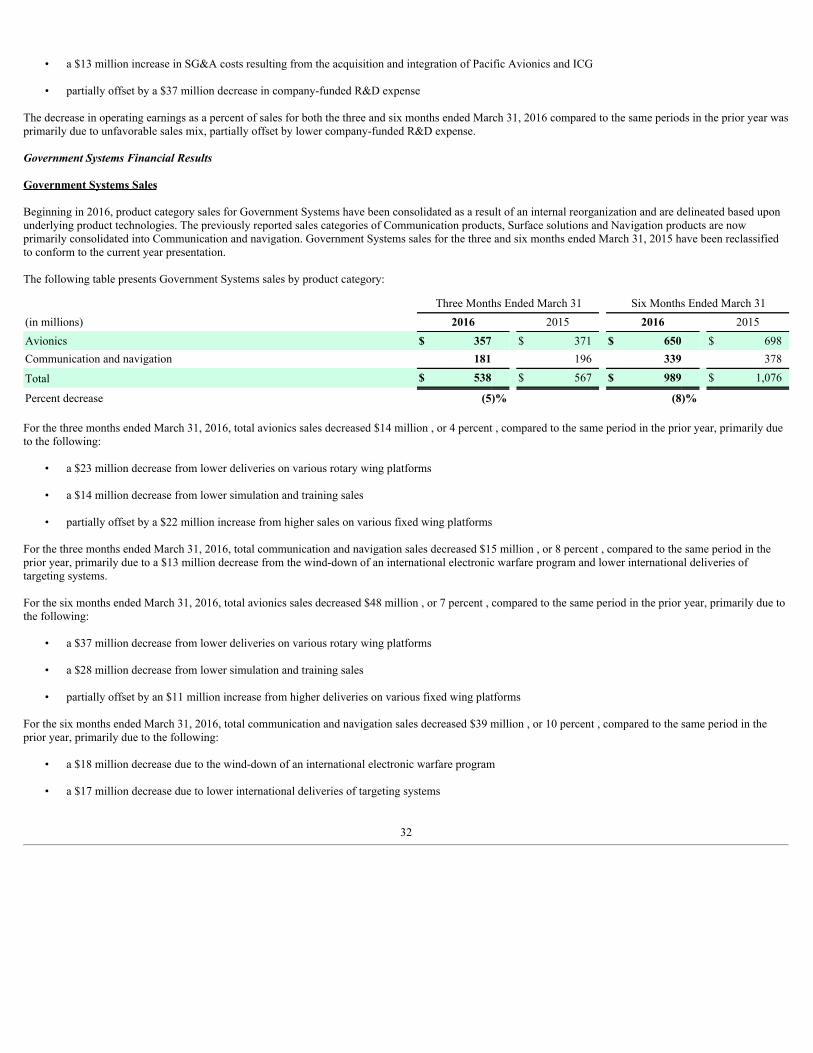
• a $13 million increase in SG&A costs resulting from the acquisition and integration of Pacific Avionics and ICG
• partially offset by a $37 million decrease in company-funded R&D expense
The decrease in operating earnings as a percent of sales for both the three and six months ended March 31, 2016 compared to the same periods in the prior year wasprimarily due to unfavorable sales mix, partially offset by lower company-funded R&D expense.
Government Systems Financial Results
Government Systems Sales Beginning in 2016, product category sales for Government Systems have been consolidated as a result of an internal reorganization and are delineated based uponunderlying product technologies. The previously reported sales categories of Communication products, Surface solutions and Navigation products are nowprimarily consolidated into Communication and navigation. Government Systems sales for the three and six months ended March 31, 2015 have been reclassifiedto conform to the current year presentation.
The following table presents Government Systems sales by product category:
Three Months Ended March 31 Six Months Ended March 31(in millions) 2016 2015 2016 2015Avionics $ 357 $ 371 $ 650 $ 698Communication and navigation 181 196 339 378
Total $ 538 $ 567 $ 989 $ 1,076
Percent decrease (5)% (8)%
For the three months ended March 31, 2016, total avionics sales decreased $14 million , or 4 percent , compared to the same period in the prior year, primarily dueto the following:
• a $23 million decrease from lower deliveries on various rotary wing platforms
• a $14 million decrease from lower simulation and training sales
• partially offset by a $22 million increase from higher sales on various fixed wing platforms
For the three months ended March 31, 2016, total communication and navigation sales decreased $15 million , or 8 percent , compared to the same period in theprior year, primarily due to a $13 million decrease from the wind-down of an international electronic warfare program and lower international deliveries oftargeting systems.
For the six months ended March 31, 2016, total avionics sales decreased $48 million , or 7 percent , compared to the same period in the prior year, primarily due tothe following:
• a $37 million decrease from lower deliveries on various rotary wing platforms
• a $28 million decrease from lower simulation and training sales
• partially offset by an $11 million increase from higher deliveries on various fixed wing platforms
For the six months ended March 31, 2016, total communication and navigation sales decreased $39 million , or 10 percent , compared to the same period in theprior year, primarily due to the following:
• a $18 million decrease due to the wind-down of an international electronic warfare program
• a $17 million decrease due to lower international deliveries of targeting systems
32

Changes in foreign currency exchange rates, primarily the strengthening of the U.S. dollar, resulted in a $7 million reduction to Government Systems sales for thesix months ended March 31, 2016 when compared to the same period in the prior year. This $7 million reduction is included within the Government Systems salescategories above.
Government Systems Segment Operating Earnings
Three Months Ended March 31 Six Months Ended March 31(in millions) 2016 2015 2016 2015Segment operating earnings $ 108 $ 114 $ 194 $ 220Percent of sales 20.1% 20.1% 19.6% 20.4%
For the three months ended March 31, 2016, Government Systems operating earnings decreased $6 million , or 5 percent , compared to the same period in the prioryear, primarily due to the following:
• the $29 million reduction in sales volume discussed in the Government Systems sales section above, which resulted in a $23 million decrease in cost and adecrease in earnings of $6 million, or 21 percent of the lower sales volume. The margins on the sales decline were favorably impacted by benefits fromcost savings initiatives from previously announced restructuring plans
• a $4 million increase in SG&A costs from further expansion in international emerging markets
• partially offset by a $5 million decrease in company-funded R&D expense
Operating earnings as a percent of sales were flat compared to the same period in the prior year as the unfavorable impact of lower sales was offset by benefitsfrom cost savings initiatives.
For the six months ended March 31, 2016, Government Systems operating earnings decreased $26 million , or 12 percent , compared to the same period in the prioryear, primarily due to the $87 million reduction in sales volume discussed in the Government Systems sales section above, which resulted in an $57 milliondecrease in cost and a decrease in earnings of $30 million, or 34 percent of the lower sales volume.
The decrease in operating earnings as a percent of sales, compared to the same period in the prior year, was primarily due to lower sales volumes, partially offsetby lower company-funded R&D expense.
Information Management Services Financial Results
Information Management Services Sales
The following table presents Information Management Services sales:
Three Months Ended March 31 Six Months Ended March 31(in millions) 2016 2015 2016 2015Sales $ 162 $ 155 $ 318 $ 304Percent increase 5% 5%
33
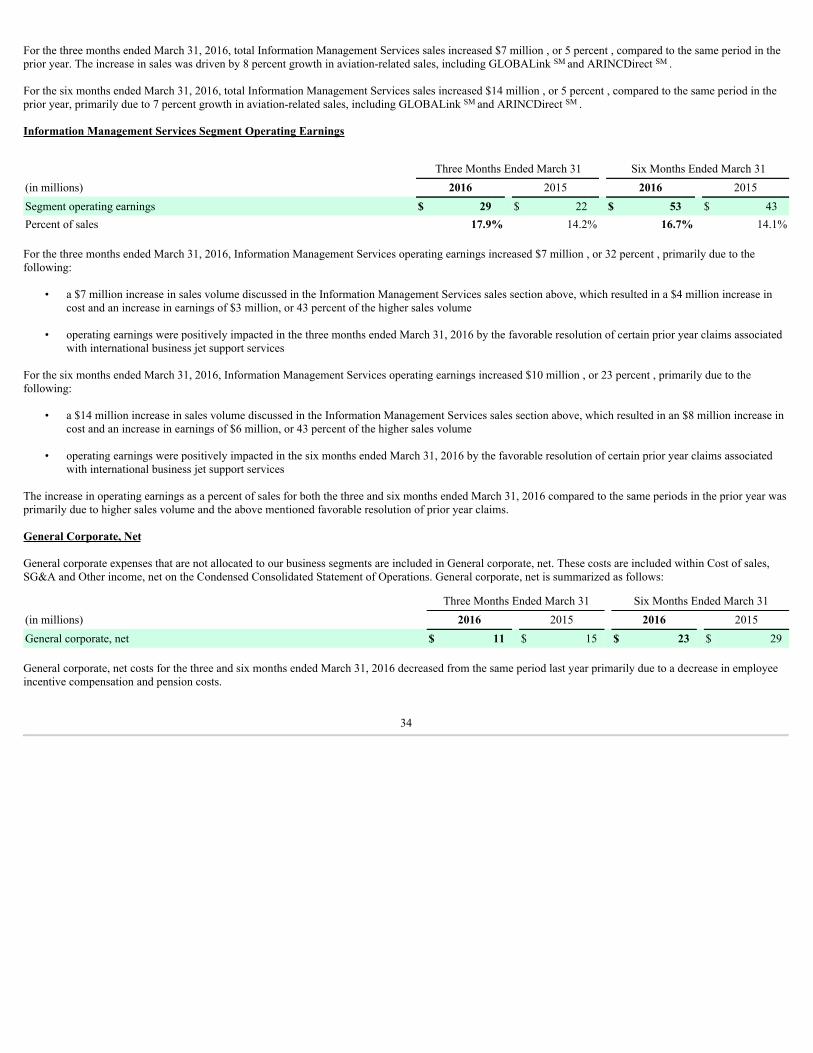
For the three months ended March 31, 2016, total Information Management Services sales increased $7 million , or 5 percent , compared to the same period in theprior year. The increase in sales was driven by 8 percent growth in aviation-related sales, including GLOBALink SM and ARINCDirect SM .
For the six months ended March 31, 2016, total Information Management Services sales increased $14 million , or 5 percent , compared to the same period in theprior year, primarily due to 7 percent growth in aviation-related sales, including GLOBALink SM and ARINCDirect SM .
Information Management Services Segment Operating Earnings
Three Months Ended March 31 Six Months Ended March 31(in millions) 2016 2015 2016 2015Segment operating earnings $ 29 $ 22 $ 53 $ 43Percent of sales 17.9% 14.2% 16.7% 14.1%
For the three months ended March 31, 2016, Information Management Services operating earnings increased $7 million , or 32 percent , primarily due to thefollowing:
• a $7 million increase in sales volume discussed in the Information Management Services sales section above, which resulted in a $4 million increase incost and an increase in earnings of $3 million, or 43 percent of the higher sales volume
• operating earnings were positively impacted in the three months ended March 31, 2016 by the favorable resolution of certain prior year claims associatedwith international business jet support services
For the six months ended March 31, 2016, Information Management Services operating earnings increased $10 million , or 23 percent , primarily due to thefollowing:
• a $14 million increase in sales volume discussed in the Information Management Services sales section above, which resulted in an $8 million increase incost and an increase in earnings of $6 million, or 43 percent of the higher sales volume
• operating earnings were positively impacted in the six months ended March 31, 2016 by the favorable resolution of certain prior year claims associatedwith international business jet support services
The increase in operating earnings as a percent of sales for both the three and six months ended March 31, 2016 compared to the same periods in the prior year wasprimarily due to higher sales volume and the above mentioned favorable resolution of prior year claims.
General Corporate, Net General corporate expenses that are not allocated to our business segments are included in General corporate, net. These costs are included within Cost of sales,SG&A and Other income, net on the Condensed Consolidated Statement of Operations. General corporate, net is summarized as follows:
Three Months Ended March 31 Six Months Ended March 31(in millions) 2016 2015 2016 2015General corporate, net $ 11 $ 15 $ 23 $ 29
General corporate, net costs for the three and six months ended March 31, 2016 decreased from the same period last year primarily due to a decrease in employeeincentive compensation and pension costs.
34
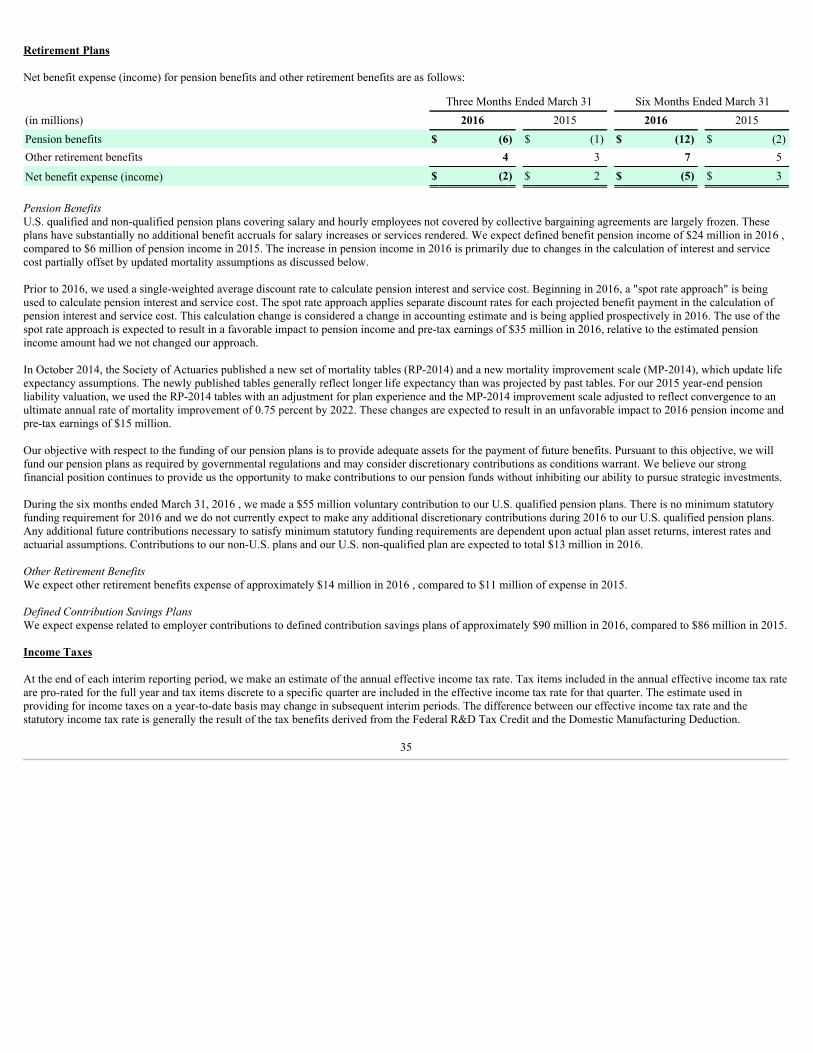
Retirement Plans
Net benefit expense (income) for pension benefits and other retirement benefits are as follows:
Three Months Ended March 31 Six Months Ended March 31(in millions) 2016 2015 2016 2015Pension benefits $ (6) $ (1) $ (12) $ (2)Other retirement benefits 4 3 7 5
Net benefit expense (income) $ (2) $ 2 $ (5) $ 3
Pension BenefitsU.S. qualified and non-qualified pension plans covering salary and hourly employees not covered by collective bargaining agreements are largely frozen. Theseplans have substantially no additional benefit accruals for salary increases or services rendered. We expect defined benefit pension income of $24 million in 2016 ,compared to $6 million of pension income in 2015. The increase in pension income in 2016 is primarily due to changes in the calculation of interest and servicecost partially offset by updated mortality assumptions as discussed below.
Prior to 2016, we used a single-weighted average discount rate to calculate pension interest and service cost. Beginning in 2016, a "spot rate approach" is beingused to calculate pension interest and service cost. The spot rate approach applies separate discount rates for each projected benefit payment in the calculation ofpension interest and service cost. This calculation change is considered a change in accounting estimate and is being applied prospectively in 2016. The use of thespot rate approach is expected to result in a favorable impact to pension income and pre-tax earnings of $35 million in 2016, relative to the estimated pensionincome amount had we not changed our approach.
In October 2014, the Society of Actuaries published a new set of mortality tables (RP-2014) and a new mortality improvement scale (MP-2014), which update lifeexpectancy assumptions. The newly published tables generally reflect longer life expectancy than was projected by past tables. For our 2015 year-end pensionliability valuation, we used the RP-2014 tables with an adjustment for plan experience and the MP-2014 improvement scale adjusted to reflect convergence to anultimate annual rate of mortality improvement of 0.75 percent by 2022. These changes are expected to result in an unfavorable impact to 2016 pension income andpre-tax earnings of $15 million.
Our objective with respect to the funding of our pension plans is to provide adequate assets for the payment of future benefits. Pursuant to this objective, we willfund our pension plans as required by governmental regulations and may consider discretionary contributions as conditions warrant. We believe our strongfinancial position continues to provide us the opportunity to make contributions to our pension funds without inhibiting our ability to pursue strategic investments.
During the six months ended March 31, 2016 , we made a $55 million voluntary contribution to our U.S. qualified pension plans. There is no minimum statutoryfunding requirement for 2016 and we do not currently expect to make any additional discretionary contributions during 2016 to our U.S. qualified pension plans.Any additional future contributions necessary to satisfy minimum statutory funding requirements are dependent upon actual plan asset returns, interest rates andactuarial assumptions. Contributions to our non-U.S. plans and our U.S. non-qualified plan are expected to total $13 million in 2016.
Other Retirement BenefitsWe expect other retirement benefits expense of approximately $14 million in 2016 , compared to $11 million of expense in 2015.
Defined Contribution Savings PlansWe expect expense related to employer contributions to defined contribution savings plans of approximately $90 million in 2016, compared to $86 million in 2015.
Income Taxes
At the end of each interim reporting period, we make an estimate of the annual effective income tax rate. Tax items included in the annual effective income tax rateare pro-rated for the full year and tax items discrete to a specific quarter are included in the effective income tax rate for that quarter. The estimate used inproviding for income taxes on a year-to-date basis may change in subsequent interim periods. The difference between our effective income tax rate and thestatutory income tax rate is generally the result of the tax benefits derived from the Federal R&D Tax Credit and the Domestic Manufacturing Deduction.
35

During the three months ended March 31, 2016 and 2015 , the effective income tax rate from continuing operations was 26.8 percent and 32.4 percent,respectively. The lower current year effective income tax rate from continuing operations was primarily due to the permanent extension of the Federal R&D TaxCredit, which had previously expired on December 31, 2014, and the early adoption of the new share-based compensation guidance. The new guidance requires therecognition of all excess tax benefits or shortfalls related to share-based compensation as a component of income tax expense, rather than in equity.
During the six months ended March 31, 2016 and 2015 , the effective income tax rate from continuing operations was 22.2 percent and 27.7 percent , respectively.The lower current year effective income tax rate from continuing operations was primarily due to the permanent extension of the Federal R&D Tax Credit and theearly adoption of the new share-based compensation guidance.
For fiscal year 2016, our effective income tax rate is projected to be in the range of 22 to 23 percent and includes a benefit from the permanent extension of theFederal R&D Tax Credit.
FINANCIAL CONDITION AND LIQUIDITY
Cash Flow Summary
Our ability to generate significant cash flow from operating activities, coupled with our expected ability to access the credit markets, enables us to execute ourgrowth strategies and return value to our shareowners. The timing of our cash inflows is historically heavily weighted towards the second half of our fiscal year,particularly our fourth quarter. We expect this trend to continue in the future.
Operating Activities
Six Months Ended March 31(in millions) 2016 2015Cash provided by operating activities from continuing operations $ 45 $ 132
The $87 million decrease in cash provided by operating activities during the six months ended March 31, 2016 , compared to the same period in the prior year, wasprimarily due to the following:
• cash receipts from customers decreased by $136 million to $2.369 billion in the six months ended March 31, 2016, compared to $2.505 billion in the sixmonths ended March 31, 2015. The decrease in cash receipts from customers was more than the sales volume decrease of $87 million due to the timing ofsales relative to advanced payments from customers
• payments for employee incentive pay increased $23 million. Incentive pay is expensed in the year incurred and then paid in the first fiscal quarter of thefollowing year. In the six months ended March 31, 2016, $137 million was paid for employee incentive pay costs expensed during 2015. This compares to$114 million paid during the six months ended March 31, 2015 for employee incentive pay costs expensed during 2014
• the above items were partially offset by lower payments for production inventory and other operating costs which decreased $27 million to $2.090 billionfor the six months ended March 31, 2016 compared to $2.117 billion during the six months ended March 31, 2015. The decreased payments for operatingcosts primarily resulted from lower sales volume
• cash payments for income taxes decreased $47 million to $31 million during the six months ended March 31, 2016, compared to $78 million during thesame period in the prior year. The decrease in cash used for income tax payments was primarily from the retroactive reinstatement of the Federal R&D taxcredit as a result of the Protecting Americans from Tax Hikes Act as well as lower pre-tax income from continuing operations
36

Investing Activities
Six Months Ended March 31(in millions) 2016 2015Cash (used for) investing activities from continuing operations $ (110) $ (136)
Cash used for investing activities for the six months ended March 31, 2016 decreased $26 million , compared to the six months ended March 31, 2015 , primarilydue to the following:
• an $11 million decrease in cash payments for property additions for the six months ended March 31, 2016 , compared to the same period in the prior year
• we paid $24 million for the March 2015 acquisition of Pacific Avionics
• the above items were partially offset by $17 million paid for the Matrix series projector product line acquisition in February 2016
Financing Activities
Six Months Ended March 31(in millions) 2016 2015Cash provided by (used for) financing activities from continuing operations $ 110 $ (2)
The $112 million increase in cash provided by financing activities during the six months ended March 31, 2016 , compared to the six months ended March 31,2015 , was primarily due to the following:
• net proceeds from short-term commercial paper borrowings increased $91 million
• cash repurchases of common stock decreased $54 million to $188 million during the six months ended March 31, 2016 , compared to $242 millionrepurchased during the same period in the prior year
• partially offset by a decrease in proceeds received from the exercise of stock options of $17 million
• also, cash dividend payments increased $6 million. During the six months ended March 31, 2016, $86 million of cash dividend payments were made toshareowners as compared to $80 million during the same period last year. The increase was primarily due to a 10 percent increase in our quarterly cashdividend paid on common stock to $0.33 per share, which was effective beginning with dividends paid in June 2015
37

Financial Condition and Liquidity
We maintain a capital structure that we believe enables us sufficient access to credit markets. When combined with our ability to generate strong levels of cashflow from our operations, this capital structure has provided the strength and flexibility necessary to pursue strategic growth opportunities and to return value to ourshareowners.
A comparison of key elements of our financial condition as of March 31, 2016 and September 30, 2015 are as follows:
(in millions)March 31,
2016 September 30,
2015Cash and cash equivalents $ 300 $ 252Short-term debt (1,120) (448)Long-term debt, net (1,383) (1,680)
Net debt (1) $ (2,203) $ (1,876)
Total equity $ 1,989 $ 1,880Debt to total capitalization (2) 56% 53%Net debt to total capitalization (3) 53% 50%
(1) Calculated as total of short-term and long-term debt, net (Total debt), less cash and cash equivalents(2) Calculated as Total debt divided by the sum of Total debt plus Total equity(3) Calculated as Net debt divided by the sum of Net debt plus Total equity
We primarily fund our contractual obligations, capital expenditures, small- to medium-sized acquisitions, dividends and share repurchases from cash generatedfrom operating activities. As of March 31, 2016 , approximately 91 percent of our cash and cash equivalents reside at non-U.S. locations and may not be readilyaccessible for use in the U.S., due to potential adverse income tax implications and other statutory limitations. We do not currently intend to repatriate cash andcash equivalents held at non-U.S. locations, as we anticipate utilizing this cash to fund foreign operations and international growth.
Due to the fluctuations of cash flows, we supplement our internally-generated cash flow from time to time by issuing short-term commercial paper. Under ourcommercial paper program, we may sell up to $1.2 billion face amount of unsecured short-term promissory notes in the commercial paper market. The commercialpaper notes have maturities of not more than 364 days from the date of issuance. At March 31, 2016 , short-term commercial paper borrowings outstanding were$820 million , with a weighted-average interest rate and maturity period of 0.76 percent and 17 days, respectively. At September 30, 2015, short-term commercialpaper borrowings outstanding were $448 million, with a weighted-average interest rate and maturity period of 0.52 percent and 25 days, respectively. Themaximum amount of short-term commercial paper borrowings outstanding during the six months ended March 31, 2016 was $929 million .
We have a five-year $1 billion credit facility that expires in December 2018 and a 364-day $200 million credit facility that was executed in February 2016 andexpires in February 2017. The credit facilities include one financial covenant requiring us to maintain a consolidated debt to total capitalization ratio of not greaterthan 60 percent (excluding the equity impact on accumulated other comprehensive loss related to defined benefit retirement plans). The ratio was 41 percent atMarch 31, 2016 .
In addition, alternative sources of liquidity could include funds available from the issuance of equity securities, debt securities and potential asset securitizationstrategies. To date, we have not raised capital through the issuance of equity securities, nor do we have any current plans to do so, as we prefer to use debtfinancing to lower our overall cost of capital and increase our return on shareowners' equity.
Credit ratings are a significant factor in determining our ability to access short-term and long-term financing, as well as the cost of such financing. Our strong creditratings have enabled continued access to both short- and long-term credit markets. If our credit ratings were to be adjusted downward by the rating agencies, theimplications of such actions could include impairment or elimination of our access to credit markets and an increase in the cost of borrowing.
38
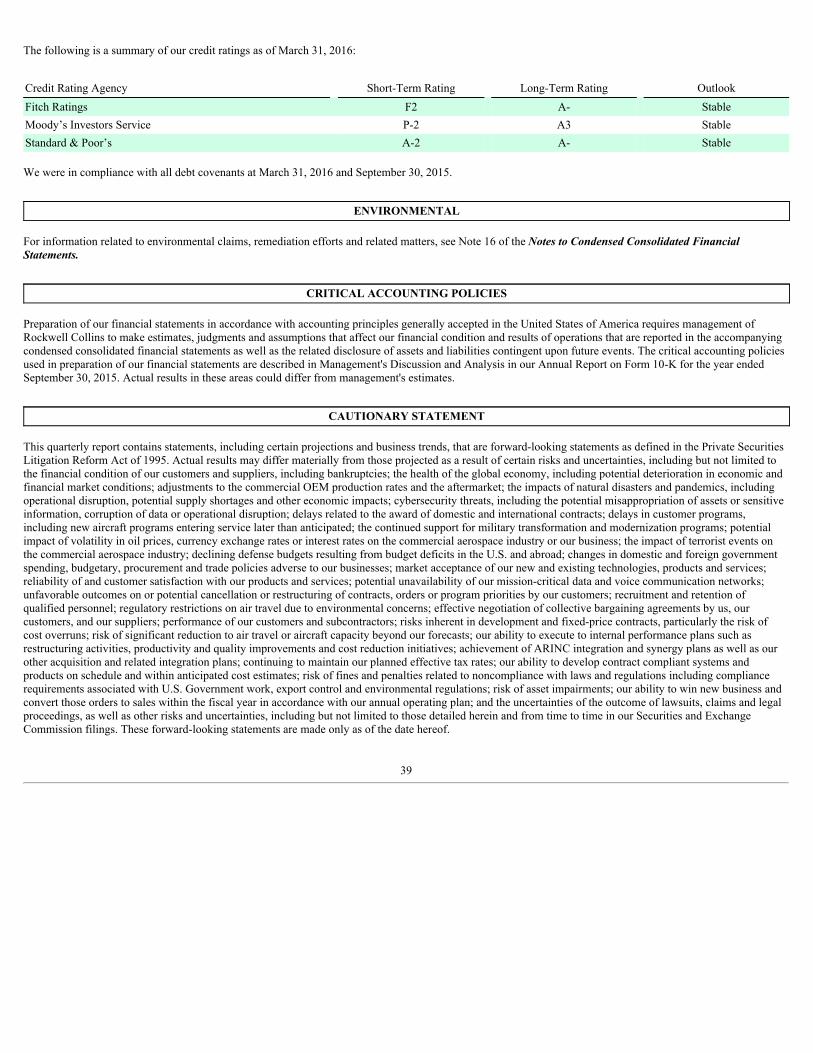
The following is a summary of our credit ratings as of March 31, 2016:
Credit Rating Agency Short-Term Rating Long-Term Rating OutlookFitch Ratings F2 A- StableMoody’s Investors Service P-2 A3 StableStandard & Poor’s A-2 A- Stable
We were in compliance with all debt covenants at March 31, 2016 and September 30, 2015.
ENVIRONMENTAL
For information related to environmental claims, remediation efforts and related matters, see Note 16 of the Notes to Condensed Consolidated FinancialStatements.
CRITICAL ACCOUNTING POLICIES
Preparation of our financial statements in accordance with accounting principles generally accepted in the United States of America requires management ofRockwell Collins to make estimates, judgments and assumptions that affect our financial condition and results of operations that are reported in the accompanyingcondensed consolidated financial statements as well as the related disclosure of assets and liabilities contingent upon future events. The critical accounting policiesused in preparation of our financial statements are described in Management's Discussion and Analysis in our Annual Report on Form 10-K for the year endedSeptember 30, 2015. Actual results in these areas could differ from management's estimates.
CAUTIONARY STATEMENT
This quarterly report contains statements, including certain projections and business trends, that are forward-looking statements as defined in the Private SecuritiesLitigation Reform Act of 1995. Actual results may differ materially from those projected as a result of certain risks and uncertainties, including but not limited tothe financial condition of our customers and suppliers, including bankruptcies; the health of the global economy, including potential deterioration in economic andfinancial market conditions; adjustments to the commercial OEM production rates and the aftermarket; the impacts of natural disasters and pandemics, includingoperational disruption, potential supply shortages and other economic impacts; cybersecurity threats, including the potential misappropriation of assets or sensitiveinformation, corruption of data or operational disruption; delays related to the award of domestic and international contracts; delays in customer programs,including new aircraft programs entering service later than anticipated; the continued support for military transformation and modernization programs; potentialimpact of volatility in oil prices, currency exchange rates or interest rates on the commercial aerospace industry or our business; the impact of terrorist events onthe commercial aerospace industry; declining defense budgets resulting from budget deficits in the U.S. and abroad; changes in domestic and foreign governmentspending, budgetary, procurement and trade policies adverse to our businesses; market acceptance of our new and existing technologies, products and services;reliability of and customer satisfaction with our products and services; potential unavailability of our mission-critical data and voice communication networks;unfavorable outcomes on or potential cancellation or restructuring of contracts, orders or program priorities by our customers; recruitment and retention ofqualified personnel; regulatory restrictions on air travel due to environmental concerns; effective negotiation of collective bargaining agreements by us, ourcustomers, and our suppliers; performance of our customers and subcontractors; risks inherent in development and fixed-price contracts, particularly the risk ofcost overruns; risk of significant reduction to air travel or aircraft capacity beyond our forecasts; our ability to execute to internal performance plans such asrestructuring activities, productivity and quality improvements and cost reduction initiatives; achievement of ARINC integration and synergy plans as well as ourother acquisition and related integration plans; continuing to maintain our planned effective tax rates; our ability to develop contract compliant systems andproducts on schedule and within anticipated cost estimates; risk of fines and penalties related to noncompliance with laws and regulations including compliancerequirements associated with U.S. Government work, export control and environmental regulations; risk of asset impairments; our ability to win new business andconvert those orders to sales within the fiscal year in accordance with our annual operating plan; and the uncertainties of the outcome of lawsuits, claims and legalproceedings, as well as other risks and uncertainties, including but not limited to those detailed herein and from time to time in our Securities and ExchangeCommission filings. These forward-looking statements are made only as of the date hereof.
39
Item 3. Quantitative and Qualitative Disclosures about Market Risk.
Interest Rate RiskIn addition to using cash provided by normal operating activities, we utilize a combination of short-term and long-term debt to finance operations. Our operatingresults and cash flows are exposed to changes in interest rates that could adversely affect the amount of interest expense incurred and paid on debt obligations inany given period. In addition, changes in interest rates can affect the fair value of our debt obligations. Such changes in fair value are only relevant to the extentthese debt obligations are settled prior to maturity. We manage our exposure to interest rate risk by maintaining an appropriate mix of fixed- and variable-rate debtand may employ financial instruments in the form of interest rate swaps to help meet this objective.
At March 31, 2016 , we had the following unsecured long-term and short-term notes outstanding:
March 31, 2016(in millions) Interest Rate Carrying Value Fair Value$400 Notes due 2043 4.80% $ 398 $ 447$400 Notes due 2023 3.70% 399 426$250 Notes due 2021 3.10% 250 261$300 Notes due 2019 5.25% 299 333$300 Notes due 2016 3 month LIBOR plus 0.35% 300 300
In June 2015, we entered into interest rate swap contracts which effectively converted $150 million of the Notes due 2019 to floating rate debt based on three-month LIBOR plus 3.56 percent.
In March 2014, we entered into interest rate swap contracts which effectively converted $200 million of the Notes due 2023 to floating rate debt based on one-month LIBOR plus 0.94 percent.
In January 2010, we entered into interest rate swap contracts which effectively converted $150 million of the Notes due 2019 to floating rate debt based on six-month LIBOR plus 1.235 percent.
A hypothetical 10 percent increase in average market interest rates would have decreased the fair value of our long-term fixed rate debt, exclusive of the effects ofthe interest rate swap contracts, by $26 million. A hypothetical 10 percent decrease in average market interest rates would have increased the fair value of our long-term fixed rate debt, exclusive of the effects of the interest rate swap contracts, by $27 million. The fair value of the $500 million notional value of interest rateswap contracts was a $37 million net asset at March 31, 2016 . A hypothetical 10 percent increase or decrease in average market interest rates would decrease orincrease the fair value of our interest rate swap contracts by $3 million. Our results of operations are affected by changes in market interest rates related to variablerate debt. Inclusive of the effect of the interest rate swaps, a hypothetical 10 percent increase or decrease in average market interest rates would not have a materialeffect on our operations or cash flows. For more information related to outstanding debt obligations and derivative financial instruments, see Notes 8, 13 and 14 inthe Notes to Condensed Consolidated Financial Statements .
Foreign Currency RiskWe transact business in various foreign currencies which exposes our cash flows and earnings to changes in foreign currency exchange rates. We attempt tomanage this exposure through operational strategies and the use of foreign currency forward exchange contracts (foreign currency contracts). All foreign currencycontracts are executed with banks we believe to be creditworthy and are primarily denominated in currencies of major industrial countries. The majority of ournon-functional currency firm and anticipated receivables and payables are hedged using foreign currency contracts. It is our policy not to manage exposure to netinvestments in non-U.S. subsidiaries or enter into derivative financial instruments for speculative purposes. Notional amounts of outstanding foreign currencycontracts were $278 million and $359 million at March 31, 2016 and September 30, 2015 , respectively. Notional amounts are stated in U.S. dollar equivalents atspot exchange rates at the respective dates. Principal currencies that are hedged include the European euro, British pound sterling and Japanese yen. The duration offoreign currency contracts is generally five years or less. The net fair value of these foreign currency contracts was a $1 million net asset at March 31, 2016 and a$4 million net liability at September 30, 2015 . A 10 percent increase in the value of the U.S. dollar against all currencies would decrease the fair value of ourforeign currency contracts at March 31, 2016 by $2 million. A 10 percent decrease in the value of the U.S. dollar against all currencies would increase the fairvalue of our foreign currency contracts at March 31, 2016 by $3 million. For more information related to outstanding foreign currency contracts, see Notes 13 and14 in the Notes to Condensed Consolidated Financial Statements .
40
Item 4. Controls and Procedures.
As required by Rule 13a-15(b) under the Securities Exchange Act of 1934, we carried out an evaluation of the effectiveness, as of March 31,2016 , of the design and operation of our disclosure controls and procedures. This evaluation was carried out under the supervision and with theparticipation of our management, including our Chief Executive Officer and Chief Financial Officer. Based on that evaluation, our Chief ExecutiveOfficer and Chief Financial Officer have concluded that our disclosure controls and procedures are effective as of March 31, 2016 to ensure thatinformation required to be disclosed in our reports filed or submitted under the Exchange Act is recorded, processed, summarized and reported withinthe time periods specified in SEC rules and forms. Disclosure controls and procedures include, without limitation, controls and procedures designedto ensure that information required to be disclosed by an issuer in reports that it files or submits under the Securities Exchange Act of 1934 isaccumulated and communicated to the issuer's management, including its principal executive and principal financial officers, or persons performingsimilar functions, as appropriate to allow timely decisions regarding required disclosure.
There were no changes in our internal control over financial reporting (as defined in Exchange Act Rule 13a-15(f)) that occurred during our last fiscal quarter thathave materially affected, or are reasonably likely to materially affect, our internal control over financial reporting.
41

PART II OTHER INFORMATION
Item 2. Unregistered Sales of Equity Securities and Use of Proceeds
The following table provides information about our purchases of shares of our common stock during the quarter, pursuant to our Board authorized stock repurchaseprogram:
PeriodTotal Number of Shares
Purchased
AveragePrice Paid per
Share
Total Number of SharesPurchased as Part of
Publicly Announced Plansor Programs
Maximum Number (orApproximate Dollar
Value) of Shares that MayYet Be Purchased Underthe Plans or Programs (1)
January 1, 2016 through January 31, 2016 275,500 $ 84.36 275,500 $ 267 millionFebruary 1, 2016 through February 29, 2016 477,000 $ 80.75 477,000 $ 228 millionMarch 1, 2016 through March 31, 2016 400,000 $ 90.60 400,000 $ 192 million
Total/Average 1,152,500 $ 85.03 1,152,500
(1) On September 19, 2014 our Board authorized the repurchase of an additional $500 million of our common stock. The authorization has no stated expiration.
42

EXHIBIT INDEX
Item 6. Exhibits
(a) ExhibitsExhibitNumber Description
31.1 Section 302 Certification of Chief Executive Officer.
31.2 Section 302 Certification of Chief Financial Officer.
32.1 Section 906 Certification of Chief Executive Officer.
32.2 Section 906 Certification of Chief Financial Officer.
101.INS XBRL Instance Document.
101.SCH XBRL Taxonomy Extension Schema.
101.CAL XBRL Taxonomy Extension Calculation Linkbase.
101.DEF XBRL Taxonomy Extension Definition Linkbase.
101.LAB XBRL Taxonomy Extension Label Linkbase.
101.PRE XBRL Taxonomy Extension Presentation Linkbase.
43
SIGNATURES
Pursuant to the requirements of the Securities Exchange Act of 1934, the registrant has duly caused this report to be signed on its behalf by the undersigned,thereunto duly authorized.
ROCKWELL COLLINS, INC. By /s/ Tatum J. Buse
Tatum J. Buse Vice President, Finance and Controller PrincipalAccounting Officer and an Authorized Officer
Dated: April 21, 2016
S-1
Exhibit 31.1
CERTIFICATION I, Robert K. Ortberg, Chairman, President and Chief Executive Officer of Rockwell Collins, Inc., certify that: 1. I have reviewed the quarterly report on Form 10-Q for the quarter ended March 31, 2016 of Rockwell Collins, Inc.;
2. Based on my knowledge, this report does not contain any untrue statement of a material fact or omit to state a material fact necessary to make thestatements made, in light of the circumstances under which such statements were made, not misleading with respect to the period covered by this report;
3. Based on my knowledge, the financial statements, and other financial information included in this report, fairly present in all material respects thefinancial condition, results of operations and cash flows of the registrant as of, and for, the periods presented in this report;
4. The registrant's other certifying officer and I are responsible for establishing and maintaining disclosure controls and procedures (as defined in ExchangeAct Rules 13a-15(e) and 15d-15(e)) and internal control over financial reporting (as defined in Exchange Act Rules 13a-15(f) and 15d-15(f)) for theregistrant and have:
a) Designed such disclosure controls and procedures, or caused such disclosure controls and procedures to be designed under our supervision, toensure that material information relating to the registrant, including its consolidated subsidiaries, is made known to us by others within thoseentities, particularly during the period in which this report is being prepared;
b) Designed such internal control over financial reporting, or caused such internal control over financial reporting to be designed under oursupervision, to provide reasonable assurance regarding the reliability of financial reporting and the preparation of financial statements forexternal purposes in accordance with generally accepted accounting principles;
c) Evaluated the effectiveness of the registrant's disclosure controls and procedures and presented in this report our conclusions about theeffectiveness of the disclosure controls and procedures, as of the end of the period covered by this report based on such evaluation; and
d) Disclosed in this report any change in the registrant’s internal control over financial reporting that occurred during the registrant’s most recentfiscal quarter (the registrant’s fourth fiscal quarter in the case of an annual report) that has materially affected, or is reasonably likely tomaterially affect, the registrant’s internal control over financial reporting;
5. The registrant's other certifying officer and I have disclosed, based on our most recent evaluation of internal control over financial reporting, to theregistrant's auditors and the audit committee of the registrant's board of directors (or persons performing the equivalent functions):
a) All significant deficiencies and material weaknesses in the design or operation of internal control over financial reporting which are reasonablylikely to adversely affect the registrant's ability to record, process, summarize and report financial information; and
b) Any fraud, whether or not material, that involves management or other employees who have a significant role in the registrant's internal controlover financial reporting.
Date: April 21, 2016 /s/ Robert K. Ortberg Robert K. Ortberg Chairman, President and Chief Executive Officer

Exhibit 31.2
CERTIFICATION I, Patrick E. Allen, Senior Vice President and Chief Financial Officer of Rockwell Collins, Inc., certify that:
1. I have reviewed the quarterly report on Form 10-Q for the quarter ended March 31, 2016 of Rockwell Collins, Inc.;
2. Based on my knowledge, this report does not contain any untrue statement of a material fact or omit to state a material fact necessary to make thestatements made, in light of the circumstances under which such statements were made, not misleading with respect to the period covered by this report;
3. Based on my knowledge, the financial statements, and other financial information included in this report, fairly present in all material respects thefinancial condition, results of operations and cash flows of the registrant as of, and for, the periods presented in this report;
4. The registrant's other certifying officer and I are responsible for establishing and maintaining disclosure controls and procedures (as defined in ExchangeAct Rules 13a-15(e) and 15d-15(e)) and internal control over financial reporting (as defined in Exchange Act Rules 13a-15(f) and 15d-15(f)) for theregistrant and have:
a) Designed such disclosure controls and procedures, or caused such disclosure controls and procedures to be designed under our supervision, toensure that material information relating to the registrant, including its consolidated subsidiaries, is made known to us by others within thoseentities, particularly during the period in which this report is being prepared;
b) Designed such internal control over financial reporting, or caused such internal control over financial reporting to be designed under oursupervision, to provide reasonable assurance regarding the reliability of financial reporting and the preparation of financial statements forexternal purposes in accordance with generally accepted accounting principles;
c) Evaluated the effectiveness of the registrant's disclosure controls and procedures and presented in this report our conclusions about theeffectiveness of the disclosure controls and procedures, as of the end of the period covered by this report based on such evaluation; and
d) Disclosed in this report any change in the registrant’s internal control over financial reporting that occurred during the registrant’s most recentfiscal quarter (the registrant’s fourth fiscal quarter in the case of an annual report) that has materially affected, or is reasonably likely tomaterially affect, the registrant’s internal control over financial reporting;
5. The registrant's other certifying officer and I have disclosed, based on our most recent evaluation of internal control over financial reporting, to theregistrant's auditors and the audit committee of the registrant's board of directors (or persons performing the equivalent functions):
a) All significant deficiencies and material weaknesses in the design or operation of internal control over financial reporting which are reasonablylikely to adversely affect the registrant's ability to record, process, summarize and report financial information; and
b) Any fraud, whether or not material, that involves management or other employees who have a significant role in the registrant's internal controlover financial reporting.
Date: April 21, 2016 /s/ Patrick E. Allen Patrick E. Allen Senior Vice President and Chief Financial Officer
Exhibit 32.1
CERTIFICATION BY CHIEF EXECUTIVE OFFICERPURSUANT TO 18 U.S.C. SECTION 1350,
AS ADOPTED PURSUANT TOSECTION 906 OF THE SARBANES-OXLEY ACT OF 2002
In connection with the Quarterly Report of Rockwell Collins, Inc. (the Company) on Form 10-Q for the quarter ended March 31, 2016 (the Report) filedwith the Securities and Exchange Commission, I, Robert K. Ortberg, Chairman, President and Chief Executive Officer of the Company, certify, pursuant to 18U.S.C. Section 1350, as adopted pursuant to Section 906 of the Sarbanes-Oxley Act of 2002, that:
(1) The Company’s Report fully complies with the requirements of section 13(a) or 15(d) of the Securities Exchange Act of 1934; and
(2) The information contained in the Report fairly presents, in all material respects, the financial condition and results of operations of the Company.
Date: April 21, 2016 /s/ Robert K. Ortberg Robert K. Ortberg Chairman, President and Chief Executive Officer

Exhibit 32.2
CERTIFICATION BY CHIEF FINANCIAL OFFICERPURSUANT TO 18 U.S.C. SECTION 1350,
AS ADOPTED PURSUANT TOSECTION 906 OF THE SARBANES-OXLEY ACT OF 2002
In connection with the Quarterly Report of Rockwell Collins, Inc. (the Company) on Form 10-Q for the quarter ended March 31, 2016 (the Report) filedwith the Securities and Exchange Commission, I, Patrick E. Allen, Senior Vice President and Chief Financial Officer of the Company, certify, pursuant to 18U.S.C. Section 1350, as adopted pursuant to Section 906 of the Sarbanes-Oxley Act of 2002, that:
(1) The Company’s Report fully complies with the requirements of section 13(a) or 15(d) of the Securities Exchange Act of 1934; and
(2) The information contained in the Report fairly presents, in all material respects, the financial condition and results of operations of the Company.
Date: April 21, 2016 /s/ Patrick E. Allen Patrick E. Allen Senior Vice President and Chief Financial Officer