security as a theoretical attribute constructbayuk.com/publications/bayuk-stac.pdf · security as a...
TRANSCRIPT

ww.sciencedirect.com
c om p u t e r s & s e c u r i t y x x x ( 2 0 1 3 ) 1e2 1
Available online at w
journal homepage: www.elsevier .com/locate/cose
Security as a theoretical attribute construct
Jennifer L. Bayuk*
Jennifer L Bayuk, LLC, 25 Redding Place, Towaco, NJ 07082, United States
a r t i c l e i n f o
Article history:
Received 21 July 2012
Received in revised form
11 February 2013
Accepted 13 March 2013
Keywords:
Security
Metric
Metrics
Framework
Verification
Validation
Survey
Information security
Cyber security
Mobile security
* Tel.: þ1 973 335 3530; fax: þ1 973 335 078E-mail address: [email protected].
Please cite this article in press as: Bayukdx.doi.org/10.1016/j.cose.2013.03.006
0167-4048/$ e see front matter ª 2013 Elsevhttp://dx.doi.org/10.1016/j.cose.2013.03.006
a b s t r a c t
This paper provides an overview of the field of security metrics and discusses results of a
survey of security experts on the topic. It describes a new framework for developing
security metrics that focuses on effectiveness measures while maintaining measures of
correctness. It introduces a view of security as a theoretical concept which encapsulates
multiple aspects of a system. Viewing security as a theoretical attribute construct pro-
motes the recognition that multiple characteristics and features of a system are required to
make it secure. The view also motivates a sharp focus on system aspects which exhibit a
measurable security attribute. The framework is illustrated with a case study.
ª 2013 Elsevier Ltd. All rights reserved.
1. Introduction effectiveness. “Correctness denotes assurance that the security-
Today’s security metrics are typically based on two assump-
tions: (i) there is a secure way to configure any system, and (ii)
the task of security management is to maintain that configu-
ration. However, today’s cyber attacks typically do not exploit
holes in configuration; they exploit application or system
functionality. The most skilled engineers with the most
sincere of intentions using state-of-the-art techniques may
create application and platform designs intended to accom-
plish security objectives, yet it is nevertheless often the case
that the resulting system architecture itself is vulnerable. So
attacks are successful even though security is configured as
designed.
The US National Institute of Standards and Technology
(NIST) has documented this distinction as correctness versus
9.
JL, Security as a theore
ier Ltd. All rights reserved
enforcing mechanisms have been rightly implemented
(i.e., they do exactly what they are intended to do, such as
performing some calculation).. Effectiveness requires ascer-
taining how well the security-enforcing components tie
together and work synergistically, the consequences of any
known or discovered vulnerabilities, and the usability of the
system.” (Jansen, 2009)
This distinction is not the same as one security pro-
fessionals may remember from the Orange Book, which had
made a distinction between security function and assurance
(DoD, 1985). The Orange Book distinction was criticized for
merging functionality and assurance into one scale, creating a
one-size-fits-all security model that changes in technology
had made obsolete before it was ever even fully instantiated.
To avoid the same criticism, Orange Book’s successor,
tical attribute construct, Computers & Security (2013), http://
.

c om p u t e r s & s e c u r i t y x x x ( 2 0 1 3 ) 1e2 12
the Common Criteria, focused on security devices and fea-
tures rather than system-wide security requirements. The
Common Criteria progressed the terms function and assurance
through time to refermore andmore exclusively to the security
functions of information technology systems and not to the
secure behavior of the system as a whole (CCRA, 2012). The
term assurance in the Orange Book and Common Criteria
literature refers to the assurance that a security function is
operating as designed, and both “function” and “assurance”
definitions fall into the category of “correctness verification”
side of the NIST distinction, which reserves “effectiveness” for
the emergent secure behavior at the system level.
From a systems engineering perspective, an equivalent to
the NIST distinction between correctness and effectiveness is:
“building the system right” versus “building the right system.”
(INCOSE, 2011) The way to measure building the system right
is called verification, while the measure of building the right
system is called validation. Note that validation refers to the
system’s ability to meet stakeholder needs in its target envi-
ronment. Validation strategies are often based on models
until the system has been verified to conform to specifica-
tions, but cannot be complete until the system is in fact being
operated by its target user community (Buede, 2009).
This paper presents a methodology for assessing the ade-
quacy of system security using metrics. The methodology
considers security as a theoretical attribute construct (“STAC”)
which encapsulates the multiple aspects of a system that
render it secure. By definition, the construct must incorporate
both verification and validation measures in a consistent and
unified metric for system security. The benefits of the STAC
framework are (i) that system security can be measured and
(ii) that the security of similar systems may be compared
using the same or similar measures.
2. Background
2.1. Related work
Like the assurance measures of the Orange Book and the
Common Criteria, most of the practical work in security
metrics addresses not security, but compliance to some
standard. In the case of the Orange Book and the Common
Criteria, it is compliance with a design for security. Subse-
quent topics for security standards included not just design
itself, but methodology for designing a secure system and
methodology for operating a secure data center. These created
additional set of metrics, for example, metrics designed to
show compliance with the System Security Engineering
Capability Maturing Model (SSE-CMM) and the Federal Com-
puter Security Handbook (which evolved into Recommended
Security Controls for Federal Information Systems) (NIST,
1995, 2007; ISO/IEC, 2002). Variants on these exemplar meth-
odologies have been adopted into enterprise security policies
and standards, and corresponding security metrics programs
internal to the enterprise have been established to demon-
strate compliance with such enterprise standards.
In 1997, this journal published a then-innovative and also
comprehensive application of management techniques,
including a variety of statistical and other quantitative
Please cite this article in press as: Bayuk JL, Security as a theoredx.doi.org/10.1016/j.cose.2013.03.006
measurement techniques, to the enterprise information se-
curity management practices that were based on such stan-
dards (Kovacich, 1997). In 2000, NIST began efforts to bring the
information security community together to create standards
for security metrics as its own field of study (Hancock, 2000).
The turn of the century also brought in the first Security In-
formation (Event) Management (SIM or SIEM) products, which
allowed automated collection of measurement data typically
used by enterprise security metrics programs.
Despite this standardization in enterprise security man-
agement, there have also been a plethora of cyber security
breaches in systems whose metrics had demonstrated such
verified design and operation. In the case of certified Payment
Card Industry Standard (PCIS) compliance, there are even
metrics on incidents that occurred in PCIS-compliant systems
(PCI, 2008; Mogull, 2009; Baker et al., 2012). This situation is
typically blamed on system security vulnerabilities in the
form of software bugs and design flaws, and this situation led
to a search for security metrics that could be used to certify
that a system was free of known vulnerabilities.
This search in turn motivated the creation of the National
Vulnerability Database (NVD) community of security metrics
researchers (MITRE, ongoing). The NVD is a common re-
pository for security researchers to catalog known software
vulnerabilities in a structured format. It facilitates security
software vendors’ ability to create tests that security practi-
tioners can use to verify that systems are not vulnerable to
known security threats. These are called penetration tests
(“pentests” for short), as the goal of the tester is typically to
break into the target system. The NVD effort begat the Com-
mon Vulnerability Scoring System (CVSS) (Mell et al., 2007), a
security metric that quantifies the degree to which a system is
vulnerable, given its technical composition and configuration
compared to publicly reported vulnerabilities (assuming its
technology is common enough to get reported to NVD). This
approach, because it counts bad things and not good things,
was mocked by McGraw as a “badness-ometer,” a scale on
which every measure is bad, so it is impossible to use it to tell
if security is good (McGraw, 2006). The NVD eventual answer
to this criticismwas the Common Configuration Enumeration
(CCE) component of the Security Content Automation Protocol
(SCAP) (NIST, 2010), a method to measure whether a system is
patched and configured to withstand the exploits enumerated
in the NVD. Such configuration management methodology
has long been a core component of the management metrics
approach (Bayuk, 2001).
These industry-wide activities begat security industry
metrics analysts, and culminated in the seminal text Security
Metrics, in which one such analyst thoroughly mapped the
ISACA Control Objectives for Information Technology (ISACA,
2007) to a recognizably relevant and available set of measures
for verifying that security functions are operating as designed
and also that systems are free of known vulnerabilities
(Jaquith, 2007). This blending of vulnerability and counter-
measure into a single management view was intended to call
attention to the role of metrics in security-related decision
support, or security risk management.
The way that a system had traditionally been decided to
exhibit a property called “security” is that its configuration
corresponded to the security manager’s design for security.
tical attribute construct, Computers & Security (2013), http://

c om p u t e r s & s e c u r i t y x x x ( 2 0 1 3 ) 1e2 1 3
The badness-ometers challenge that method of measuring
security, because management’s plan may have overlooked
the presence of a known vulnerability. Moreover, zero-day
threat metrics show that vulnerability exploits are active for
an average of 312 days before the vulnerability is identified
(Bilge and Dumitras, 2012). These findings have called into
question the entire process of maintaining patch levels
against known threats as a first line of defense. The role of
security metrics in risk management decision support, that is,
in deciding how to secure systems, is now clearly independent
of its role in deciding whether a systemmay be said to exhibit
a property called “security.”
Parallel to the efforts to usemanagementmetrics to achieve
security goals, security researchers had begun trying to mea-
sure security as a system property. Scattered through the se-
curity literature are articles that discuss how to measure
security in various system components, from network path
weighting to attack severity analysis (Amran et al., 2009; Wang
et al., 2010). There are also attempts to quantify security risk
based on stochastic or experimental models of a system’s
ability to deflect attacks. One proposal measures security by
charting out step-by-step attacks on behalf of potential ad-
versaries, assigning probabilities of attack-step success given
assumptions about adversary motives and skill sets, and then
calculating the system security score based on the attack
outcome (LeMay et al., 2011). Another attempts to assign
values to security services based on their contribution to sys-
tem value, and calculates a security value factor as the overall
system security score (Jones and Horowitz, 2012) Although
these approaches should be commended for their holistic,
system-level approach to security measurement, they have
generally been considered impractical by practitioners because
they are based on unfounded assumptions about system op-
erations, and/or unknowable probabilities (Hubbard, 2009).
Practitioner conference presenters routinely reduced these
approaches to absurdities using comparisons. For example,
they tell the story of three blind men measuring an elephant
when each has access to a different body part (India). Measures
of tusk, tail, and trunk do not combine to measure “elephant-
ness” even in combination. Similarly, security as a measurable
system attribute is an elusive concept. If there is anything
notable about these purely academic efforts to measure secu-
rity, it is the assumption that there is a quality to be achieved,
called security, and a conviction that this quality is a measur-
able attribute of systems. On the other hand, the distinction
between measuring system security effectiveness and enter-
prise security program correctness is critical to understanding
the field of security metrics. Going forward, the terms
“construct decision” and “assessment decision” are used to
differentiate thedecision on how to construct a secure system from
the decision on whether a system exhibits security as an attribute.
Suffice it to conclude from this summary of related work
that the topic of security metrics per se is an object of study
separate from the study of security itself. In fact, more thor-
ough treatments of the subject are available (Herrmann, 2007;
Bayuk and Mostashari, 2013). There are now numerous fo-
rums dedicated to various topics in security metrics (Forums,
ongoing). In addition to the topics discussed above, they
include efforts to standardize security incident descriptions,
efforts to quantify security risk, and how-tos on using various
Please cite this article in press as: Bayuk JL, Security as a theoredx.doi.org/10.1016/j.cose.2013.03.006
vendor tools to produce metrics reports. The Metricon work-
shop has drawn enthusiastic participants since 2006, andACM
launched an international version called MetriSec in 2009
(ACM, 2009; Metricon, ongoing). If there is a common view on
security metrics, it is that the field is immature and in need of
collaborative scrutiny. As one security practitioner-turned-
researcher succinctly put it, “Current approaches do not
generate all of the requisite measures and metrics, and those
that are produced are insufficient to make appropriate de-
cisions and take necessary actions.” (Axelrod, 2012, p. 152) A
common joke is that the accounting profession has been
working since 4000B.C. to come up with the Generally
Accepted Accounting Principles, yet there is an unrealistic
expectation that measures of control over technology will
fully materialize in our lifetime.
2.2. Security metrics taxonomy
A common theme in security metrics literature is that tax-
onomies of security metrics tend to address technical
configuration and operational process from the point of view
of security management rather than attempt to measure
progress toward business goals for security (Savola, 2007).
Even taxonomies that include governance in addition to
management tend to focus on the security management tasks
that are evidence of governance, and those metrics may also
be considered part of the enterprise security management
category (CISWG, 2005). These taxonomies reflect a bias to-
ward measuring whether management has correctly imple-
mented mechanisms chosen to effect security, rather than a
full assessment of whether thosemechanisms are effective. A
more comprehensive taxonomy of security metrics that in-
cludes all those discussed in Section 2.1 is in Fig. 1.
Content metrics are the most common security metric
amongpractitioners, andMetriconoften includespresentations
and panels wherein practitioners share their approaches to
ensuring that systems have been implemented according to
specifications tied to security requirements (Metricons,
ongoing). The label content denotes easily identifiable system
artifacts, such as configuration and log files in system compo-
nents. Content measures are typically automatically gathered
basedonan itemizedsystem inventory,whosenumbersmaybe
in flux, yet each item contains objects whose security attributes
are similarenough tobecomparable, suchaspassword strength
and authorized user accounts. There are three types of content
metrics: targets, monitors, and remediation.
Target metrics identify a set of devices or people, and test
each member of the set to see that it conforms to a given se-
curity specification. For example, Fig. 2 presents the result of
configuration tests of 100% of the devices in inventory by de-
vice operating system, and shows the percentage of each that
conform to secure configuration specifications. The secure
configuration specification may be enterprise specific, or may
follow a published specification such as the Security
Consensus Operational Readiness Evaluation (SCORE) oper-
ating system checklists (SANS Institute, ongoing). The number
of devices in inventory running the same operating system
provides the 100% target for each axis of Fig. 3. Call the
number of devices running Windows “X” and the number of
devices runningWindows that pass security configuration the
tical attribute construct, Computers & Security (2013), http://

Fig. 1 e Taxonomy of security metrics.
c om p u t e r s & s e c u r i t y x x x ( 2 0 1 3 ) 1e2 14
SCORE Windows checklist “Y”. Fig. 2 shows that Y/X is 0.8,
achieving an 80% compliance rate for Windows, while the
devices running UNIX are all compliant.
Monitor metrics also exhibit (in)correct content of security
implementation, but measure whether a specified process
designed to provide security is followed. For example, Fig. 3 is
a secure development process that may be measured in
multiple dimensions in order to produce a metric that shows
whether the process is followed. Each measure may be
quantitative, as follows:
Measure DM: identifier of development manager
Measure DMS: software products delivered by DM
Measure D: count of developers reporting to manager DM
Measure S: count of security-trained developers reporting
to DM
Measure V: number of known vulnerabilities identified by
pentests in quality assurance (QA) environment for DMS
Measure P: number of known vulnerabilities identified by
pentests in production environment for DMS
From these quantitative measures, an overall software
security metric may be produced for each development
manager, as in:
For each DM:
If (V ¼ 0) and (P ¼ 0) Then DM ¼ Produces Good Code
If (D > S) Then DM ¼ Takes Shortcuts
If (V > 0) Then DM ¼ Exhibits Negligence
If (P > 0) Then DM ¼ Produces Bad Code
Fig. 2 e Example operating system security target metric.
Please cite this article in press as: Bayuk JL, Security as a theoredx.doi.org/10.1016/j.cose.2013.03.006
These numbers would typically be accumulated for all
development managers in an organization, or for all devel-
opment managers in an enterprise, as illustrated in Fig. 4.
The reason why content metrics resolve to process metrics
as well as target metrics is that targets are achieved by people,
and if people do not behave in a manner dictated by process,
thenmanagement does not knowwhether targets would have
been achieved had process been followed. However, if man-
agement can verify that process was followed, and targets are
still not achieved, then this situation could mean that pro-
cesses are not working and should prompt consideration of
changes in process. Hence in practice, target and monitor
metrics are often combined. Fig. 5 shows the combination in
the service of firewall integrity monitoring. The measures
contributing to the presentation are:
Device Count: The number of firewall devices in operation.
Configs Collected: The number of firewall devices whose
configuration was retrieved in past 24 h by network manage-
ment system.
Configs Changed: The number of firewall devices configura-
tions that deviate from yesterday’s configuration.
Changes Verified: The number of deviant device configura-
tions where operations network can confirm that deviations
directly compare to authorized planned changes.
Verification Mistakes: The number of false negative compar-
isons by network operations staff.
In the example of Fig. 5, the dailymetric comparison shows
that the organization occasionally misses checking a config-
uration and also that some comparisons made by operations
find that updates were incorrectly performed. Moreover, the
added “Suspect Device” pointed to by the arrow was not part
of the auto-generated graph, but added after a monitoring
metric found a verification mistake by network operations
staff. Such a metric presentation shows problems both with
maintaining security and with metrics collection. As many
such security metrics are not mature enough to be reliable by
management control standards, it is important for decision-
makers to understand the detail behind any high level secu-
rity metrics presentation.
Where process to maintain secure configuration is broken
or is yet to be developed, projects are typically developed to
bring about a secure configuration and associated security
maintenance process. These projects are tracked using stan-
dard project management tools and security remediation metrics
may supplement such tracking. However, the extent of the
deviation from the desired security specification is often un-
known at the start of the project, andmilestones often have to
tical attribute construct, Computers & Security (2013), http://

Fig. 3 e Example secure development process.
Fig. 4 e Secure development process monitor metric.
c om p u t e r s & s e c u r i t y x x x ( 2 0 1 3 ) 1e2 1 5
Please cite this article in press as: Bayuk JL, Security as a theoredx.doi.org/10.1016/j.cose.2013.03.006
be revised in the course of the project execution. Fig. 6 shows
remediation metrics for a project designed to identify every
user in an enterprise and correlate that user with a record for
an authorized person in a central identity management sys-
tem. At the start of the project, it was estimated that there
were 800 authorized users in total, and that 15% had so far
been correlated. As the project continued, however, it was
discovered that the as yet uncorrelated users required addi-
tional entries to the central identity management system, and
the estimate of both the total number of users and the per-
centage of those as yet to be correlated increased. Remedia-
tion metrics are content measures because they provide
information on known deviations in implementation from the
specified secure design.
The security metrics taxonomy assessment category in-
cludes not only content metrics, but also behavior metrics.
tical attribute construct, Computers & Security (2013), http://

Fig. 5 e Example firewall combined target and monitor
metric.
c om p u t e r s & s e c u r i t y x x x ( 2 0 1 3 ) 1e2 16
Where content metrics show correct design configuration and
operation, but systems fail due to cyber attacks, they are
clearly not secure, and so the result of a security content
measures cannot be the sole component of evaluation metric.
Hence, security assessments should measure how systems
behave while under attack, and compare the measures to
criteria for secure behavior, which includes capability to
accomplish system functionality while under attack.
In order to know whether system performance has been
adversely impacted by attacks, it is important to first under-
stand what the system is supposed to accomplish whether or
not it is under attack. Most organizations that invest in se-
curitymetrics already have some program in place tomeasure
system performance. These measures are not security-
specific and are more thoroughly addressed in quality man-
agement literature dedicated to topic such as Six Sigma and
Software Quality Assurance (e.g.: Fenton and Pfleeger, 1997;
Pande et al., 2001). The reason they are components of secu-
rity assessment metrics is that integrity and availability are
major components of security, so when these metrics
degrade, a secure system should respond to fortify itself
against failure.
As the NVD contains readily available information on how
systems have been attacked in the past, due diligence requires
that security assessments measure whether exploit of these
Fig. 6 e Example identity management remediation
metrics.
Please cite this article in press as: Bayuk JL, Security as a theoredx.doi.org/10.1016/j.cose.2013.03.006
known system vulnerabilities will cause performance degra-
dation. This is the province of pentests, or badness-ometer
testing (Wilhelm, 2009). Such testing may measure, for
example, the count and NVD-rated severity of vulnerabilities
identified, the percent of vulnerable systems, the skill level
required to execute the test, and/or the system impact (IDART,
2008). Where attacks are not preventable, such as desktop
attacks on customers, due diligence requires that response
activities be put in place to detect and respond to security
breaches (FS-ISAC, 2011). Such response activities are typi-
cally measured by the time it takes to detect and/or thwart the
attack.
Where the methods to be employed by adversaries are not
yet known well enough to design corresponding vulnerability
tests, behavioral assessments should include more generic
resiliency measures. For example, Espenschied and Gunn
describe adversary activities in the abstract using general
military terms such as reconnaissance, foothold, lateral move-
ment, and acquire target, and encourage security decision-
makers to take a practical approach to constructing their en-
terprise security architecture to detect and respond to these
generic activities rather than only to NVD-cataloged attacks
(Espenschied and Gunn, 2012). A secure system should have
contingency plans that cover as yet unknown adversary
methods. These might be automated reconfiguration in the
form of patching, device failover, network path diversity, and/
or diverse architecture alternatives. Such resilient behavior is
measured with disaster recovery tests and/or table-top exer-
cises of simulated scenarios. To truly measure response to
unexpected events, these tests should be designed in the spirit
of the Netflix chaos monkey, which randomly takes down
system processes to measure systems capability to recover
without impact to its mission (Izrailevsky and Tseitlin,
ongoing).
On the construct side of the security metrics taxonomy are
all the metrics that practitioners have not yet figured out how
to use, or perhaps did not find useful, in assessing an already-
designed secure implementation. Many are nevertheless
invaluable in creating requirements for a secure system.
Measures of adversary motivation, skills, and justification, as
well as intelligence on their goals, methods, and victim se-
lection processes are of invaluable use in designing security
measures. Although subjective and ordinal, such as the
example in Fig. 7, they serve to focus systems engineers on the
types of attacks that a system is likely to experience so that
appropriate safeguards may be built into the system. Studies
such as the Carnegie Mellon Insider Threat (Cummings et al.,
2012) and the Verizon Data Breach (Baker et al., 2012) reports
are of use here, as well as the stochastic methods and
experimental models mentioned in Section 2.1.
Another source of metrics frequently used in construct
decisions are activity metrics. These do not measure any
known security property of the threat or system under attack,
but related aspects of the systems environment. When they
are taken internally, they are sometimes derisively referred to
as “busyness” metrics, because increases in the activity
measured does not actually add measurable value to the
business, nor make it more secure, yet it is important to
observe how busy security staff may become as their time is
devoted to routine tasks. Fig. 8 is an example of such metrics
tical attribute construct, Computers & Security (2013), http://

Fig. 7 e Example threat metrics.
c om p u t e r s & s e c u r i t y x x x ( 2 0 1 3 ) 1e2 1 7
related to the number and type of calls to an internal help
desk. This does not immediately contribute to a decision on
whether any given system is secure, but trends in this data
may motivate decisions to change security constructs. Inter-
nal activity metrics also typically include, though of course
not limited to, software version releases, customer complaint
handling and third party service connection requests.
When activity metrics are taken externally, they are some-
times referred to as “weather” metrics because they are ob-
servations of adversary-related activity that does not directly
touch the system of interest, but nevertheless provide useful
information about trends and potential storms on the system
horizon. Dan Geer had a series of columns in IEEE Security and
Privacy magazine whose content mostly fell into this category,
for example, the popular “The Owned Price Index,” which
calculated the salable value of cybercrime plunder such as so-
cial security numbers (Geer and Conway, 2009). Fig. 9 illustrates
an external activity metric, the relative frequency of failed at-
tempts to penetrate an Internet firewall by port number. Again,
this metric does not contribute to an immediate security
assessment, but, as Amoroso describes in his history of SQL
Slammer (Amoroso, 2010), adversary activity is often evident on
the Internet for months before successful attacks, and such
observations may over time provide security managers with
valuable information on where to place security resources.
Note that this summary of existing types of metrics is not
intended to include recommendations on how security met-
rics should be used in decision-making. By contrast, research
Fig. 8 e Security-related help desk internal activity metrics.
Please cite this article in press as: Bayuk JL, Security as a theoredx.doi.org/10.1016/j.cose.2013.03.006
in security riskmanagement is rich with quantitative decision
theory, and often replaces ordinal scales of the type in Fig. 7
with estimates of corresponding numeric ranges. These
studies typically also solicit expert opinions on probabilities of
both attack and defense strength, and combine a wide variety
of measurements in attempts to influence security spending
decisions. These activities, some of which were referred to as
models in Section 2.1, typically present far more controversial
material than the simple measurement-to-metric techniques
that have been described in this section.
2.3. Security metrics survey
The NIST quote in the introduction refers to “security-
enforcingmechanisms of the system” as if thesemechanisms
can be verified and validated distinct from the system opera-
tion itself. This seems to reflect an unstated assumption that
any system’s functionality may be constrained with security
mechanisms, and if we can verify and validate that those
mechanisms work, then we can measure security. Over the
past half century, this search for a “security system” has
created an industry of information security technology prod-
ucts and services.
However, security professionals are repeatedly quoted on
record as denying there is any such thing as a Holy Grail. As a
way of establishing an authoritative source for putting the
Holy Grail search to rest, a survey of highly experienced se-
curity professionals was conducted. An illustrative display of
the survey respondent’s experience and education appears in
Fig. 10. Following is a brief summary of the survey and results,
Fig. 9 e Security-related firewall external activity metrics.
tical attribute construct, Computers & Security (2013), http://

Fig. 10 e Survey demographics.
c om p u t e r s & s e c u r i t y x x x ( 2 0 1 3 ) 1e2 18
but interested readers will find both the raw survey data and
detailed description of analysis methods at (Bayuk, 2011).
The survey was designed to capture the most important
attributes of a system to measure in order to decide whether it
was secure. However, as there is no established ranking or even
comprehensive list of system security attributes, its first chal-
lenge was to answer prior studies’ concerns related to ambi-
guity and environment. Hence, the survey combined questions
on the relative importance of a wide variety of potential secu-
rity attributes, and mixed these with other, non-attribute
related questions so that experts could not easily discern, and
thus intentionally or unintentionally hinder, survey objectives.
Attribute-related questions were ranked using three methods:
Thurstone’smethod post-initial ranking, where the positioning
of items on the Thurstone scale can be found by averaging the
percentiles of the standard normal distribution corresponding
to the proportions of the respondents preferring one item over
each of the others (Thurstone, 1928), the One Number Method,
which was designed to register strong opinions (Reichheld,
2003), and a simple survey rating system based on propor-
tionate number of respondent selections. These rankings were
separated into four levels and sent to CISO-level survey re-
spondents who volunteered to be asked follow-up questions.
Survey questions referred to security as a property of a
system or as some aspect of a system’s component technol-
ogies. The goal was to justify, or not, a claim that system-level
security architecture attributes are more important than
component security mechanisms in a determination of
whether a system is secure. The claim was justified by the
survey results. The seasoned security professionals who took
the survey found this point obvious. The most important
attributes selected to measure included:
� Ability to articulate, maintain, andmonitor systemmission.
� System interfaces accept only valid input.
� Capability for incident detection and response.
� Ability to withstand targeted penetration attacks by skilled
attack teams.
Please cite this article in press as: Bayuk JL, Security as a theoredx.doi.org/10.1016/j.cose.2013.03.006
The least important attributes to measure included:
� Percentage of systems or components that have passed
security configuration tests.
� Ability to maintain values of standard security variables in
system technical configuration.
� Ability to pass security audit.
� Security standards used to set requirements.
The results were not surprising because it is evident from
the discussion in Section 2.2 that assessmentmetrics typically
used by practitioners are based on assumptions that the high
level system design provides security. Nevertheless, that
assumption is not currently supported with widespread
practicalmetrics while practitioner assessmentmetrics are for
the most part focused on what the survey revealed were the
least important attributes of security. These findings reflect
the reality that the security profession currently occupies a
legislative landscape heavily weighted toward the metrics of
low importance. The same set of detailed technology controls
are recommended for all systems, albeit with consideration of
perceived risk, but with no consideration for the higher-level
system architecture (Bayuk, 2010). These “best practices” are
actively lobbied for by security industry vendors, who have no
interest in addressing higher-level system security metrics
that may possibly make their products redundant. These
vendors now create a substantial part of the security literature,
which may be one reason why arguments for better security
metrics at the system architecture level rarely surface.
3. Security as a theoretical attributeconstruct (STAC)
After the survey results were analyzed and the ranking
was complete, the results fell roughly into four segments.
These were labeled, “Most important,” “Next Important,”
“Less Important,” and “Least Important.” The labels were
tical attribute construct, Computers & Security (2013), http://

c om p u t e r s & s e c u r i t y x x x ( 2 0 1 3 ) 1e2 1 9
meant to facilitate a quick sanity check with the CISO-level
subject matter experts to ensure that the survey results
were meaningful to them. Most of the experts who reviewed
the ranking result reshuffled the ranking of a few items, but a
few also objected to the label “Least Important.” For example,
“I find your ranking labels confuse importance. All are of great
importance. ‘Least important’ implies not important or immaterial. I
would label them as Most Important, Next Most Important, and
Important.” (Parker, 2011) This observation correctly reflects
the attacker’s advantage and defender’s dilemma in that any
weak link in the armor presents opportunity for attack
(Howard, 2002). Although measuring a detailed technology
control such as the percentage of systems or components that have
passed security configuration tests is not as useful a security
metric as a system-level attribute the ability to withstand tar-
geted penetration attacks by skilled attack teams, where the cor-
responding technology control contributes to the ability to
withstand an attack, such percentage verification is never-
theless important to system security maintenance. The chal-
lenge then became to create a system security metric that
emphasized system-level secure behavior over component
configuration, but also included component measures.
The challenge required a deep dive into systems thinking, a
systems engineering methodology that emphasizes struc-
turing the problem and modeling potential solutions in order
to test their efficacy in improving the problem situation
(Checkland, 1999). This exercise led to a view of security as a
theoretical concept which encapsulates multiple aspects of a
system. In physical theories, such as gravity, multiple mea-
sures, if consistent with the theory, do not disprove it, and
increasing methods of producing independent measures that
do not disprove it serve to make the theory stronger. Of
course, it is also true that one failed theory prediction serves
to disprove it. Viewing security as a theoretical attribute construct
allowed the identification of multiple aspects of a system that
made it secure, as well as focus on aspects which exhibit a
measurable attribute. The survey conclusion that system-
level aspects were most important established a priority to
consider attributes of effectiveness over correctness, but not
any reason to dismiss measurable attributes of correctness.
Combining the measures of these attributes paved the way to
produce a metric for Security as a Theoretical Attribute Construct,
the methodology now called STAC.
In computer security (as opposed to physical security), we
can comfortably refer to the thing to be secured as a given
system of interest, where system is a construct or collection of
different elements that together produce results not obtain-
able by the elements alone, and any given system, or a system
of interest, specifies the one under scrutiny as distinct from its
environment (INCOSE, 2011). Security is not solely an attribute
of a system, but the product of an interface between a system
and its operating environment. Systems that have hostile
adversaries need to devote more resources to deflecting
threats than systems that do not in order to achieve the same
attribute of security. Thus to be secure is an emergent prop-
erty. It is not the sum of parts, but emerges from the inter-
action between a system of interest and its environment. This
observation was reflected both in the literature on holistic
security attributes described in Section 2.1 and in the survey
results described in Section 2.3.
Please cite this article in press as: Bayuk JL, Security as a theoredx.doi.org/10.1016/j.cose.2013.03.006
Metrics for security at the system level are combinations of
measures of different focus. The elephant may be properly
measured from multiple angles as long as there is a theory of
the set dimensions outside which the elephantness property
disappears (e.g., inch-length nose, tail, and earsmeansmay be
it is a rhinoceros). Metrics that focus on verification that de-
signs are properly implemented are required only because, in
their absence, there is noway to knowwhat the system is that is
being measured. The content metrics used by today’s enter-
prise security programs thus form the basis of the theory that
a secure design enables a system to maintain security. How-
ever, a decision on whether or not the design does maintain
security must also include information on the system’s ability
to maintain its mission, so any system security metric must
include some evidence that the system can be used for its
intended purpose. To be secure is to maintain functionality in
the face of hostile adversaries who are expected to take full
advantage of the latest vulnerabilities and crimeware tech-
nologies. Hence, testing for those vulnerabilities with pene-
tration tests and other badness-ometers are also important
components of a system-level securitymetric. Yet neither can
such “vulntests” tell the whole story because there will always
be vulnerabilities which have not yet been cataloged. Hence,
another necessary component of a system-level security
metric is evidence that the system does indeed fulfill its
mission despite constant potential for damaging impact.
In summary, to construct a theory that any given system is
secure requires identification of these types of attributes:
1. Correct configuration, to allow for design verification.
2. Effective operation, to exhibit:
a. Ability to accomplish system purpose, or performance
validation.
b. Ability to deflect known threats, or vulntest validation.
c. Ability to adapt to unexpected harmful impact, or
resiliency validation.
The first of these criteria may be measured using content
metrics, the remainder may be measured using behavior met-
rics. Fig. 11 depicts the ontology of the STACmetrics formula.
Note that Fig. 11 mirrors the left side of Fig. 1. Both design
specification verification and design goal validation tech-
niques were discussed in Section 2. Techniques formeasuring
the first attribute, ascertaining correct configuration, are the
province of security content metrics. Techniques for
measuring ability to accomplish system purpose include the
same operational performance monitoring required for pro-
active maintenance. Techniques for measuring the ability to
deflect known threats are the province of vulnerability testing,
as well as measures of the time to respond and close detected
intrusions and fraud. Techniques for measuring resiliency in
the face of harmful impact have been motivated by avail-
ability requirements, and also include exercises of operational
capacity to adapt to unanticipated threats.
What is new in the STAC approach to security metrics is
that nothing can be said about the security of the system
unless a combination of all these types of attributes have been
constructed into a theory of what it means for a given system
to be secure. Moreover, if measures of all these types of at-
tributes simultaneously yield positive assessments of the
tical attribute construct, Computers & Security (2013), http://

Fig. 11 e STAC ontology.
c om p u t e r s & s e c u r i t y x x x ( 2 0 1 3 ) 1e2 110
system security, any security breach of the systemmeans that
the constructed theorywas incorrect, and the analysis that led
to it should be revisited. In effect, the process of creating se-
curity metrics should be viewed as creating a hypothesis that,
if all security attribute measures return positive results, then
the system is adequately secure.
For example, assume an enterprise risk assessment pro-
cess results in the deployment of an enterprise security ar-
chitecture comprised of logical access controls limiting data
access to insiders, a firewalled periphery monitored with
intrusion detection/prevention systems, fully encrypted
network traffic, and state-of-the-art security network opera-
tions processes to monitor and support the deployed design.
Target and monitor metrics confirm the design is imple-
mented correctly. Performance, vulntest, and resilience met-
rics confirm that the system is operating effectively. Assume
further that an authorized insider steals confidential infor-
mation and sold it to the highest bidder. Clearly, there was a
breakdown not in the assessment process, but in the design
process, and a forensic investigation in combination with
construct metrics may be expected to yield information on
which to base design improvements. Contrast this situation
with one wherein the logical access controls and network
traffic encryption capability were never fully functional nor
supported with remediation metrics. In this case, it would be
much harder to tell whether or not an insider was the culprit,
and also difficult to determine if the design would have
worked if it had been implemented. Without verification
metrics, validation measures may be rendered meaningless,
and visa versa.
System security should be treated like an empirical dis-
covery process rather than a moving target. In the field of
scientific validation, content validation implies that the full
domain of content is measurable, criterion validation implies
that the correspondence between the chosen behavioral
criteria and the attribute to be measured is exact, while
construct validation allows for a measure of the extent to
which a set of measures are consistent with a theoretically
derived hypothesis concerning the concepts being measured
(Carmines and Zeller, 1979).
Using these standards of scientific validity:
- specification verification measures may be considered
content valid because the full domain of system compo-
nents are measurable;
- behavioral measures should be considered criterion valid
when there is a direct correspondence between secure
systems and those that withstand attacks; and
- a theoretical model of a secure system may be used to
construct a combination of content and criterion
Please cite this article in press as: Bayuk JL, Security as a theoredx.doi.org/10.1016/j.cose.2013.03.006
measurements that provide evidence that a given system
conforms to the model.
Where there is evidence that a system conforms to a
theoretical model of security, then lack of security breaches
will support the theory, while a single security breach will
either disprove the theory or call the integrity of the mea-
surements into question.
A system-level security theory is important because it targets
the goal of a secure system, which is easier to envision than an
elusive property called security, which should somehowmake
availability, integrity, and confidentiality attributes visible.
Rather than attempt to make a security function the target, it
promotes a view of security as a property of the system of
interest that emerges from the way the system is designed,
configured, and operated. Moreover, assessments based on
STAC include design verification as an essential component.
Hence, incomplete verification does not simply inhibit one’s
ability to measure security, it implies that the system is not
secure because the definition of security includes the ability to
measure the extent to which design specifications are met.
Additionally, the validation measures in STAC allow two sys-
tems of different design with similar missions to be compared
to see if one is architecture is more secure than the other.
This point is important because a more interesting topic to
many researchers is how to use quantitative methods in
security-related decision-making. The purpose of this paper is
to bring recognition to the fact that there is much to be un-
derstood about how security is (and should be)measured prior
to relying on security metrics to support decisions. There is a
plethora of literature in security risk management that makes
the explicit assumption that there is a security expert some-
where that can adequately assess the security stature of a
system,aswellasestimate theprobability that itwill survivean
attack (e.g. somementioned inSection2.1aswell as:Cavusoglu
et al., 2008; Ioannidis et al., 2009; Eskins and Sanders, 2011).
Verendel provides agoodexampleof adisclaimer that typically
appears in these publications: “Even if suchmodeling is clearly
very challenging, in this paper wewill assume that a decision-
maker is provided with the result of security risk modeling.”
(Verendel, 2008) While the study of security decision theory is
of courseaworthyendeavor,until there is someconsensusona
security metrics framework such as STAC, the security deci-
sion theory field is, in some sense, an orphan.
Note that STAC itself is not a security risk management
framework, but a security measurement framework, which is
a prerequisite to security risk management. Recent NIST
guidance on the management of information security risk
clearly differentiates how risk assessment information is
framed and communicated from how risk assessment and
tical attribute construct, Computers & Security (2013), http://

c om p u t e r s & s e c u r i t y x x x ( 2 0 1 3 ) 1e2 1 11
response are conducted (NIST, 2011, p. 7). STAC addresses the
former problem, paving the way for more informed solutions
to the latter.
Fig. 13 e STAC security metric after breach.
4. Results
4.1. STAC metrics
Fig. 12 shows a securitymetric derived fromSTAC for a system
whose security has been thoroughly successfully measured.
Assume the system is negatively impacted by a security
breach. This means that the theory of system security relied
on resiliency features that were previously successfully
tested. The successful tests supported the theory at the time,
but the counterevidence of the breach later proved the theory
false. It means that, without any change in the system itself,
themetric readings change to lookmore like Fig. 13. That is, in
the case where the verification was performed correctly and
thus the theory is deemed false, a new theory should be
formed, the system should be redesigned, and then measures
must be redesigned as well before a newmetric is derived. On
the other hand, if a root cause of the investigation shows that
verification of correctness was previously performed inade-
quately, then the system’s security metric looks instead like
Fig. 14, and always should have. In that case, the theory may
still be true, because if the system had been implemented
correctly, then the resiliency features of the original design
may have worked to thwart the attack.
Each of the fourmeasurable components of the STACwill of
course be based on its own construct. For instance, the Design
Verification measure at the top of Fig. 12 is a composite of an
underlying set of measures that justifies the claim for 100%
verification of technology design specifications. This would
typically also include many of today’s management metrics,
customized to support the theory’s concept of secure operation.
A demonstration of these concepts requires example ar-
chitecture that is based on a theory that a set of system at-
tributes are sufficient to protect themission of a given system.
One such system security theory has been derived from the
nuclear regulatory model for maintaining system safety. In
that architecture, more fully described in (Bayuk et al., 2012)
and depicted in Fig. 15, the primary system control functions
are expected to maintain system stability, but signal sensors
independent of the primary control functions also constantly
measure stability using separate technology. If the
Fig. 12 e STAC security metric.
Please cite this article in press as: Bayuk JL, Security as a theoredx.doi.org/10.1016/j.cose.2013.03.006
independent sensors detect instability, they trigger a tripwire
that automatically deploys resources to reinforce functions
determined to be negatively impacted. Independent sensors
may also activate a separate security actuation feature that
detects negative impact and automatically triggers damage
control measures. In the event all of these mechanisms fail,
manual monitoring (e.g. visual inspection) and manually
activated controls provide secondary control functions inde-
pendent of the primary control functions. These can combine
with human acumen to recover system performance.
The security theory for the system is that both the primary
controls and independent sensors will detect and respond to
both known threats and damaging impact from unknown
sources, the technology diversity will allow the system to
continue to operate despite any subset of components suc-
cumbing to attack, and if the automation is defeated, human
operators supported by human security forces will be able to
safely shut down the system to avert damaging impact. If the-
ory is valid, and the system is implemented correctly, then the
system should be able to withstand both expected and unex-
pected attacks while maintaining a high level of performance.
In order for an STAC Design Verification measure to accu-
rately reflect correctness, each of the system componentsmust
be independently measured to ensure they are configured to
specification, and the interfaces between them and the system
operating environment must also be thoroughly measured.
These measures would have to verify manual as well as auto-
mated response features. Fig. 16 illustrates the desired view
when the measurement is complete. Anything less than 100%
compliance with design specifications in any component or
interface would be reflected in the Design Verification
Fig. 14 e STAC security metric after root cause analysis.
tical attribute construct, Computers & Security (2013), http://

Fig. 15 e Example secure system architecture.
c om p u t e r s & s e c u r i t y x x x ( 2 0 1 3 ) 1e2 112
dimension of Fig. 12. System-level metrics presentations
should be designed so that failed Design Verification di-
mensions such as those in Fig. 14 would drill down into figures
like Fig. 16 so the component failure impact on system-level
security may be analyzed and understood. In this case, the
architecture is composed of functional blocks designed to avoid
common mode failures, so the decomposition of verification
falls also along those lines. The 100% targets of these functional
blocks and interfaces should be supported by both target and
monitor metrics commensurate with the verification re-
quirements for the correct implementation of each component.
This is a top-down approach that allows a decision-maker to
mine the detail supporting the higher-level numbers.
Where any target or monitor metric fails 100% testing, a
remediation metric should be identified and its efficacy
assessed as part of an overall system security assessment.
Note that, although STAC does provide quantitativemeasures
used for decisions concerning security assessment, the
numbers generated by STAC, as in anymetric, merely support
a decision rather than replace it. Combined with an organi-
zational structure for accountability, the details could be used
to support decisions concerning security management as well
as security assessment.
Operation Validation metrics, by contrast, would not be
basedondecomposition intocomponent testing,butonsystem-
Fig. 16 e Example system architect
Please cite this article in press as: Bayuk JL, Security as a theoredx.doi.org/10.1016/j.cose.2013.03.006
wide measures of behavior in three very different types of sce-
narios: steady state, anticipated attack, and unanticipated
attack. These correspond to STAC performance, vulntest, and
resilience metrics, respectively. Performance metrics would be
based on expectations for system functionality, in this case, the
ability to deliver nuclear power. Vulntest metrics would be
based on documented attack scenarios enacted by a red team.
Resilience metrics would be based on a set of disaster recovery
exercises that provide closure on diverse combinations of
component failure, including total system failure.
4.2. Mobile security case study
To see that STAC can be practical and useful, consider an
enterprise mobile communications system designed to allow
company staff to access confidential company information via
a mobile device that is personally owned and operated by a
company employee or contractor. The systemof interest is the
collection of different elements whose combined architecture
allows staff to usemobile devices to access an application that
is supported by the company, and to send and receive infor-
mation to and from it. Figs. 17 and 18 illustrate alternative
architectures designed to accomplish the system purpose.
Mobile System A is designed for maximum ease of
deployment and use. It allows users to connect from the
Internet to register their devices and run the application from
any mobile device browser. Mobile System B requires that
users connect their devices to the enterprise intranet to reg-
ister for the application, and also to install a custom-built
software application on their mobile device. In both cases,
the theory of system security is that the ability for the appli-
cation server to automatically recognize the registeredmobile
device will minimize risk that application datawill be exposed
to unauthorized individuals, and that at worst case, data
exposure on lost or stolen devices would be limited to small
quantities of data of relatively low sensitivity. However, in the
first case, the theory considers user authentication from
external networks a valid identification mechanism, and in
the second case only user authentication from previously
identified access points is considered valid. Translated into
the high level security theoretical attributes described in
Section 3, Mobile System A would have these attributes:
ure design verification metrics.
tical attribute construct, Computers & Security (2013), http://
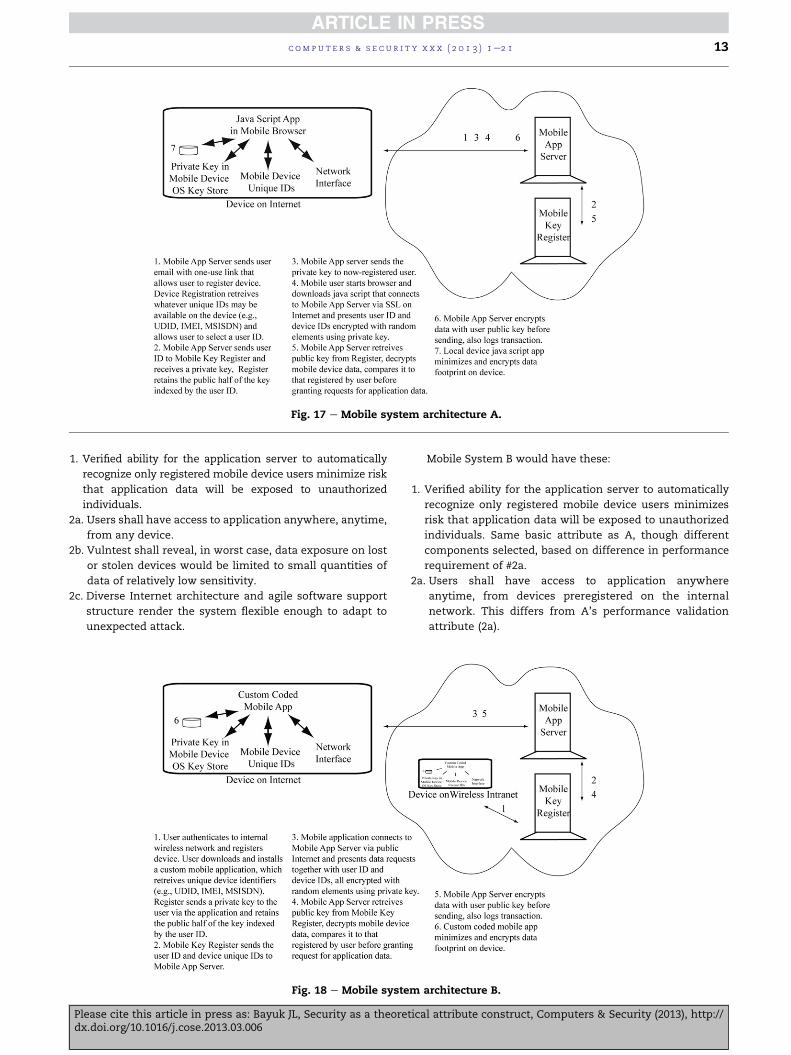
Fig. 17 e Mobile system architecture A.
c om p u t e r s & s e c u r i t y x x x ( 2 0 1 3 ) 1e2 1 13
1. Verified ability for the application server to automatically
recognize only registered mobile device users minimize risk
that application data will be exposed to unauthorized
individuals.
2a. Users shall have access to application anywhere, anytime,
from any device.
2b. Vulntest shall reveal, in worst case, data exposure on lost
or stolen devices would be limited to small quantities of
data of relatively low sensitivity.
2c. Diverse Internet architecture and agile software support
structure render the system flexible enough to adapt to
unexpected attack.
Fig. 18 e Mobile syste
Please cite this article in press as: Bayuk JL, Security as a theoredx.doi.org/10.1016/j.cose.2013.03.006
Mobile System B would have these:
1. Verified ability for the application server to automatically
recognize only registered mobile device users minimizes
risk that application data will be exposed to unauthorized
individuals. Same basic attribute as A, though different
components selected, based on difference in performance
requirement of #2a.
2a. Users shall have access to application anywhere
anytime, from devices preregistered on the internal
network. This differs from A’s performance validation
attribute (2a).
m architecture B.
tical attribute construct, Computers & Security (2013), http://

c om p u t e r s & s e c u r i t y x x x ( 2 0 1 3 ) 1e2 114
2b. Vulntest shall reveal, in worst case, data exposure on lost
or stolen devices would be limited to small quantities of
data of relatively low sensitivity. Same as A.
2c. Diverse Internet architecture and agile software support
structure render the system flexible enough to adapt to
unexpected attack. Same as A.
The corresponding system architecture design verification
metrics for these security theories might look like Figs. 17 and
18. Like the example in the previous section, it assumes that
an attempt has been made to ensure that functional block
components do not have common mode failures, can be
individually verified, and that interfaces between them are
well-defined. Requirements for each component would be
used to specify its configuration, and automated tests would
be designed to verify that the configuration is correct. For
example, in System B, the custom mobile app performs
several security features. The configuration supporting each
feature would combine with those of other features required
to be performed by the device into component-level security
metrics as in Fig. 19.
One of the features of Mobile System B is that a Custom
Mobile App is to minimize and encrypt the data on the mobile
device (Step #7 in Fig. 18, allocated to the “data handling rou-
tines” in Fig. 20). The requirements and configuration mea-
sures for the associated data handling routines may include a
set like the one in Fig. 21. Following STAC, positive results of
each configuration comparison would contribute one-eighth,
or 12.5%, of the total metric for the feature in the 100% aggre-
gated display for its associated component configuration
metric. In practice, security professionals often weight test
resultsusing some (subjective) assessment of the component’s
contribution to the overall objective of the feature.
Note that several of the configuration measures rely on a
human to perform a task. In any enterprise security architec-
ture, these taskswill be interdependent. Fig. 22 is anexampleof
how security process supports configuration targets to main-
tain system security for the mobile system. Each block of the
process diagram has three elements. The first is a label meant
to be a user-friendly way for those discussing the diagram to
refer to each step. In Fig. 22, the labels in the first element have
been selected to correspond generally to the domain of activity
workflow,andthereshouldbenoexpectation that thedomains
Fig. 19 e Mobile system des
Please cite this article in press as: Bayuk JL, Security as a theoredx.doi.org/10.1016/j.cose.2013.03.006
or numbers in the top third of each block indicate order of
execution, and indeed may occur simultaneously as different
incidents arise. The secondelement of eachblock identifies the
organization that is responsible for executing the activity
described in the third element.
Measures in rows 1, 4, and 8 of Fig. 21 are only as reliable as
the correct performance of task labeled SECURITY-1 in Fig. 22.
Measures in rows 2,3,5,6, and 7 of Fig. 21 rely on the correct
performance of task SECURITY-2 in Fig. 22. The triad “people,
process, and technology,” often repeated in security man-
agement literature, refers to the technology design, security
process, and investment in human capital that are compo-
nents of the security architect’s theory that the overall system
has been secured. Where human components are required to
maintain correct configuration, monitor metrics for these
critical tasks would also be devised. For simplicity’s sake in
this example, we assume that these measures yield no ex-
ceptions, so no remediation metrics are required.
Validation of operational performance is likely to be similar
for the twodifferentarchitectures.Measuresof conformance to
specifications suchas ease of install and speedofdata response
may show some deviation, but it is also assumed that the sys-
tem design meets requirements, so trade-offs, such as those
betweenCPU cycles and confidentiality requirements expected
to be met with encryption, have previously been worked out.
Vulntest validation, by contrast, may be expected to be
quite different. Vulntests may be expected to be based on
attack trees that decompose goals for exploiting the mobile
application into subgoals until the set of subgoals required to
accomplish themain goals may be achieved by activity within
the scope of adversary capabilities. Fig. 23 is an example of an
attack tree. It describes a general goal of “mobile application
exploit,” that is labeled as goal “A,” andmay be achieved if any
one of three subgoals is achieved. The subgoals are thus joined
by an “or” branch leading to “A.” They are labeled “B,” “C,” and
“D.” In turn, each subgoal may be achieved by achieving the
combination of subgoals below it. “And” and “Or” branches
denote whether subgoals must be achieved in combination or
present alternativemethods of achieving the goal above them,
respectively. A subgoal that has no subgoals is referred to as a
“leaf” of the attack tree, and are intended to be well enough
understood to form the basis for technical attack plans to
achieve them. In Fig. 23, each combination of leaf subgoals
ign verification metrics.
tical attribute construct, Computers & Security (2013), http://

Fig. 20 e Custom mobile app verification metrics.
c om p u t e r s & s e c u r i t y x x x ( 2 0 1 3 ) 1e2 1 15
which will achieve the highest level goal “A” is identified by
the path through the subgoals above it, and presented in bold.
(For more thorough explanations and instructions on creating
attack trees, see: Garcia, 2008.)
Fig. 21 e Data handling ro
Please cite this article in press as: Bayuk JL, Security as a theoredx.doi.org/10.1016/j.cose.2013.03.006
The attack tree in Fig. 23 has been crafted to apply to both
Mobile SystemArchitecture A andMobile SystemArchitecture
B. It shows that there are several attack paths that, if activities
designed to achieve the subgoals identified in the (bold) leaves
utine requirements.
tical attribute construct, Computers & Security (2013), http://
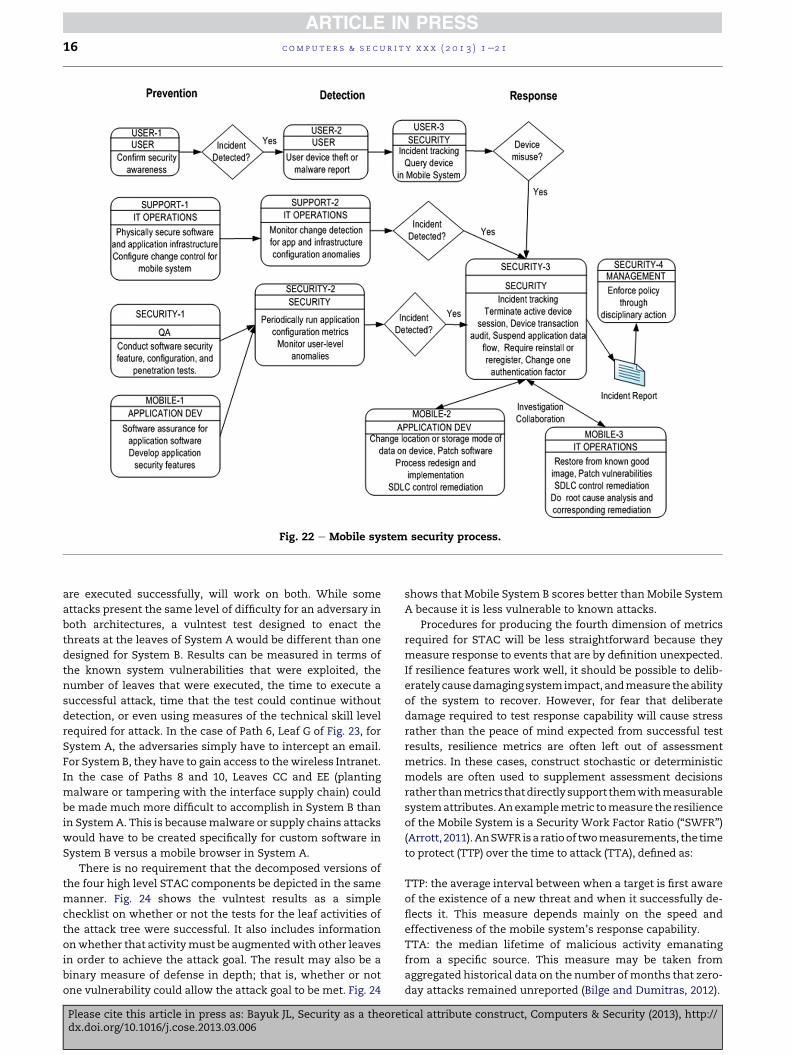
Fig. 22 e Mobile system security process.
c om p u t e r s & s e c u r i t y x x x ( 2 0 1 3 ) 1e2 116
are executed successfully, will work on both. While some
attacks present the same level of difficulty for an adversary in
both architectures, a vulntest test designed to enact the
threats at the leaves of System A would be different than one
designed for System B. Results can be measured in terms of
the known system vulnerabilities that were exploited, the
number of leaves that were executed, the time to execute a
successful attack, time that the test could continue without
detection, or even using measures of the technical skill level
required for attack. In the case of Path 6, Leaf G of Fig. 23, for
System A, the adversaries simply have to intercept an email.
For SystemB, they have to gain access to thewireless Intranet.
In the case of Paths 8 and 10, Leaves CC and EE (planting
malware or tampering with the interface supply chain) could
be made much more difficult to accomplish in System B than
in SystemA. This is becausemalware or supply chains attacks
would have to be created specifically for custom software in
System B versus a mobile browser in System A.
There is no requirement that the decomposed versions of
the four high level STAC components be depicted in the same
manner. Fig. 24 shows the vulntest results as a simple
checklist on whether or not the tests for the leaf activities of
the attack tree were successful. It also includes information
onwhether that activitymust be augmentedwith other leaves
in order to achieve the attack goal. The result may also be a
binary measure of defense in depth; that is, whether or not
one vulnerability could allow the attack goal to be met. Fig. 24
Please cite this article in press as: Bayuk JL, Security as a theoredx.doi.org/10.1016/j.cose.2013.03.006
shows that Mobile System B scores better than Mobile System
A because it is less vulnerable to known attacks.
Procedures for producing the fourth dimension of metrics
required for STAC will be less straightforward because they
measure response to events that are by definition unexpected.
If resilience features work well, it should be possible to delib-
erately causedamagingsystemimpact, andmeasure theability
of the system to recover. However, for fear that deliberate
damage required to test response capability will cause stress
rather than the peace of mind expected from successful test
results, resilience metrics are often left out of assessment
metrics. In these cases, construct stochastic or deterministic
models are often used to supplement assessment decisions
rather thanmetrics thatdirectly support themwithmeasurable
systemattributes.Anexamplemetric tomeasure the resilience
of the Mobile System is a Security Work Factor Ratio (“SWFR”)
(Arrott, 2011).AnSWFR isa ratioof twomeasurements, the time
to protect (TTP) over the time to attack (TTA), defined as:
TTP: the average interval between when a target is first aware
of the existence of a new threat and when it successfully de-
flects it. This measure depends mainly on the speed and
effectiveness of the mobile system’s response capability.
TTA: the median lifetime of malicious activity emanating
from a specific source. This measure may be taken from
aggregated historical data on the number ofmonths that zero-
day attacks remained unreported (Bilge and Dumitras, 2012).
tical attribute construct, Computers & Security (2013), http://

Fig. 24 e Example vulntest metrics for mobile system.
Fig. 23 e Mobile system attack tree.
c om p u t e r s & s e c u r i t y x x x ( 2 0 1 3 ) 1e2 1 17
To the extent the ratio TTP/TTA is minimized, the
defenders may be sufficiently resilient in thwarting attacks.
To the extent it increases, the attackers are more successful.
The goal of absolute security would be measured with a TTP/
TTA metric that is better as the ratio approached zero.
To measure whether an adversary goal of mobile applica-
tion exploit is thwarted, the TTP can be measured via timed
recovery exercises where the leaves in given attack paths are
declared to be accomplished. For example, attack path 8 in
Fig. 23 indicates that activities on leaves R and CC set the stage
for the attack path to be utilized. If the attacker hosts a proxy to
the mobile application site (leaf R) and plants malware on the
user device (leaf CC) that directs the user to the proxy rather
than the mobile application site, then the attacker may ach-
ieve the goal of mobile system exploit (node A) via the sub-
goals of spoofing the mobile app server (node B) and successfully
cyber-attacking the device (node H). To assign a TTP, the mo-
bile support team may be presented with this scenario and
asked to rearchitect the system in order to thwart it.
To assign a TTA, it may be possible to use historical data
taken from similar exploits. If it is thought that the exploit
would have to be especially innovative, it may be estimated
using the average of paradigm-shifting exploits over the past
decade.
If each known attack path can be assigned an SWFR based
on the minimum TTP/TTA for attack recovery, then the
resilience metric of the mobile system may be measured by
the TTP against all so-far identified threats. Assume P1through Pn are the paths on a rigorously devised attack tree for
Please cite this article in press as: Bayuk JL, Security as a theoredx.doi.org/10.1016/j.cose.2013.03.006
Mobile System M, and P1SWFR through PnSWFR are the cor-
responding SWFR ratios that an attack would take on each
path. The system-levelMSWFR is the longest of thoseminimum
values, calculated as:
MSWFR ¼ maxðP1SWFR.PnSWFRÞThe aggregate resiliency metric for inclusion in an STAC
presentation like Fig. 12 might be the percentage of known
attack paths for which the exercise results met a minimum
time threshold. This measure differs from the vulnerability
tical attribute construct, Computers & Security (2013), http://

c om p u t e r s & s e c u r i t y x x x ( 2 0 1 3 ) 1e2 118
test in that the system support team is challenged with
adapting the system operation to ensure that no successful
leaf exploits will result in systemdamage, despite the fact that
there is no known system vulnerability that would allow the
exploit. It measures flexible response. The vulnerability test,
by contrast, can only identify known vulnerabilities.
Trends will of course change continuously, so any security
resilience validation metric based on it will have to be
continuouslymonitored to ensure that themeasures evolve in
conjunction with changes in the threat environment. But in
general, assuming equivalently thorough attack trees, the
lower the MSWFR, the stronger the security metric. Given two
mobile environmentswith roughly equivalent threat surfaces,
a system with a lower MSWFR will be more resilient than one
with a higher MSWFR. For example, because Mobile System B
registers devices only on the internal network rather than
through the external interface used by Mobile System A, the
system support team may find it easier and faster to change a
breached device registration process, and so have a lower TTP
for leaf G, which could bring down its overallMSWFR compared
to Mobile System A.
For two systems with the same mission and purpose, the
performance, the vulntest and the resilience requirements
may be expected to be similar enough such that the best
metric score in each of these three areas would become the
100% mark for the purposed of STAC. Given that the Mobile
System A’s performance is unconstrained by the internal
network registration requirement, and that very feature
makes it vulnerable to known vulnerability tests, and that B’s
support team gains a resiliency advantage from this feature
differential, the STAC metrics of Mobile System A versus B
comparison would look like Fig. 25. Where a system is
measured in isolation, the performance, the vulntest and the
resilience requirements may instead be set by stakeholder
expectations.
5. Discussion
In Security Metrics, Jaquith described a tension between mod-
elers andmeasurers that often appears in the securitymetrics.
org mail list (Jaquith, 2007). The modelers aim to model se-
curity risk by abstracting away unknowns. The measurers,
who sometime humbly refer to themselves asmuddlers, mine
Fig. 25 e Mobile system
Please cite this article in press as: Bayuk JL, Security as a theoredx.doi.org/10.1016/j.cose.2013.03.006
an endless supply of security-related data in search of clues
with which to make progress. The modeler versus measurer
debate should end. The answer is that we need to do both.
Security metrics at the system level must include both veri-
fication and validationmeasures. The only way to do that is to
construct both a theory of what it means to be secure
(modeling) and methods to measure whether a given hy-
pothesis related to that theory is false (measuring).
The history of computer security is a search for security
mechanisms that will minimize, if not eliminate, a newly
discovered vulnerability in any system. Using STAC, the his-
torical approach of adding performance-hogging tools to
constrain system behavior is not an acceptable option. STAC
instead requires that security be validated with respect to
system mission and purpose, and performance-hogging tools
reduce the operation validation component of the STAC.
Computer security history also demonstrates that target
security metrics often are permitted to dip well below the
100% level. Using STAC, running at a 95% verification level and
accepting the risk that some unverified design component
creates a weak link is simply inadequate security manage-
ment. If your theory is that you don’t need to verify your
design in order to measure security, then you cannot also
claim that the implementation of your secure design provides
a measurable security attribute. That is, if you have planned a
security feature, but find that you don’t need to measure it to
demonstrate system correspondence to your theory of secu-
rity, then you did not need to include the security feature in
your theory or design. Security metrics need to include veri-
fication only for themechanisms you rely upon to secure your
system mission.
The requirement for relying on the design to produce
measurable security attributes changes the nature of the
problem space in systems security engineering. It becomes an
issue of how to change the way the system functions under
threat as opposed to the search for the next security fix. In the
Mobile System example, adding a hand-held authentication
factor to System A would not be an acceptable design change
because having to know the whereabouts of a token con-
strains the system purpose of mobile communication. That
would be a historical bolt-on approach. A design change in
line with STAC would be to change the software architecture
on the mobile device to eliminate dependency on the local
browser. This design change could have a direct impact on the
Metric comparison.
tical attribute construct, Computers & Security (2013), http://

Fig. 26 e Graphical illustration of change in vulnerable attributes.
c om p u t e r s & s e c u r i t y x x x ( 2 0 1 3 ) 1e2 1 19
vulntest metrics in Fig. 24 without a detrimental effect any
operation verificationmetrics. Fig. 26 illustrates the difference
in mindset between the bolt-on approach to security engi-
neering and the redesign approach.
STAC is not a risk metric. It measures security, not risk.
Risk analysis should be performed during system design and
specification, and should support construct decisions. Func-
tionality trade-spaces and costebenefit analysis should be
part of design process, not operations process. The
Fig. 27 e STAC overlaid onto textboo
Please cite this article in press as: Bayuk JL, Security as a theoredx.doi.org/10.1016/j.cose.2013.03.006
corresponding STAC theory and associated metrics should
also be created at a very early stage of the system engineering
process, and facilitate both construct and assessment de-
cisions. Fig. 27 illustrates how STAC should be integrated into
the systems engineering process as described in a popular
textbook (Buede, 2009). Once the method for ensuring system
security has been set, the metrics should be established, and
any implementation that cannot achieve a 100% metric sim-
ply does not meet the design goals, that is, it fails validation.
k system engineering lifecycle.
tical attribute construct, Computers & Security (2013), http://

c om p u t e r s & s e c u r i t y x x x ( 2 0 1 3 ) 1e2 120
The recommendation that security as a theoretical attri-
bute be constructed in the initial stages of a system lifecycle is
not meant to imply that STAC cannot be applied to a system in
operation. Instead, it means that, as a prerequisite to creating
security metrics, the current mission and purpose of the sys-
temmust bewell understood, and the system security features
must be evaluated on the basis of how well they fit that pur-
pose. It also implies that, if a system design has been decided
to be inadequate to achieve the attribute of security, then
decisions need to be made on changes in either technology or
operational process. The design change decisions should be
based on security risk analysis using construct metrics, and
the changes should be immediately and correctly imple-
mented. One does not achieve security goals incrementally as
a project plan moves components asymptotically toward a
desired system configuration. The need for remediation met-
rics indicates failed verification. The current widely adopted
approach of falling back on risk acceptance at the component
level is not a substitute for sound security management.
6. Conclusions
“Building security in” is not just a software development issue.
Given the escalating infrastructure dependence on software, it
is a fundamental requirement for systems of all shapes and
sizes: planes, powergrids, andwater treatment systemsaswell
as cyber networks.Moreover, operational process and physical
security have always been essential to systems security main-
tenance, and will become increasingly more important as
technology evolves. Security professionals cannot in good
conscience continue to present correct technology configura-
tionmeasures in lieu of effective security metrics.
In order to measure security, one must first understand
what it means for the system to be secure. The understanding
should be articulated in the form of a theory. The theoretical
attribute of security should be supported with a clearly
defined configuration, and also performance specifications,
expected threat environment, and clear criteria for mission
success. Adherence to STAC means that security is measured
using carefully selected metrics from each of these areas.
The contribution of this paper to existing literature in se-
curity is threefold: security metrics is a field distinct from
security assessment, security metrics must be customized to
consider system purpose, and security cannot be measured
using verification techniques alone. Although none of the
three statements should be particularly controversial, the
presentation of these ideas in combination with a taxonomy
of existing security metrics opens the door for a new thread in
security research. The STAC framework equips a security
researcher (or a systems engineer) to construct a theory of
security for a given system of interest that can be also tested
for validity. Because of the STAC focus on system security
validation, STACmetrics are also comprehensible to executive
decision-makers faced with trade-off decisions that affect
system security. That is, where the STAC framework is
correctly applied, resulting theories of system security are
both construct and face valid. This research thereby provides
a new paradigm for system security engineering. Using STAC
metrics will drive the industry toward behavior that is
Please cite this article in press as: Bayuk JL, Security as a theoredx.doi.org/10.1016/j.cose.2013.03.006
necessary for security technologies to strengthen, rather than
constrain, system operation.
r e f e r e n c e s
ACM. International workshop on security measurements andmetrics. Association for Computing Machinery. Metrisec waslast hosted at, http://metrisec2012.cs.nku.edu/history.html;2009 [last visited 11.01.12].
Amoroso E. Cyber attacks. Elsevier; 2010. p. 159e61.Amran AR, Phan R, Parish DJ. Metrics for network forensics
conviction evidence. In: International conference for internettechnology and secured transactions; 2009.
Arrott A. Work factor ratios. Post of June 9, 2011 [last accessed11.01.12], securitymetrics.org; 2011.
Axelrod CW. Engineering safe and secure software systems.Artech House; 2012.
Baker W, Verizon RISK Team, Australian Federal Police. DutchNational High Tech Crime Unit, Irish Reporting andInformation Security Service, UK Police Central e-Crime Unit,United States Secret Service, Data breach investigationsreport. http://www.verizonenterprise.com/resources/reports/rp_data-breach-investigations-report-2012-ebk_en_xg.pdf,2012: Verizon [Retrieved 4.6.13].
Bayuk J. Security metrics. Computer Security Journal 2001;XVII(1).Bayuk J. The utility of security standards. In: International
Carnahanconferenceonsecurity technology (ICCST). IEEE; 2010.Bayuk J, Horowitz B, Jones R. Security via related disciplines.
In: Conference on systems engineering research (CSER).Errata corrected at http://www.bayuk.com/publications/Bayuk-CSER.pdf; 2012 [retrieved 11.01.12].
Bayuk J, Mostashari A. Measuring systems security. SystemsEngineering 2013;16:1e14. http://dx.doi.org/10.1002/sys.21211.
Bayuk JL. Security subject matter expert survey on securitymetrics. Retrieved 11.01.12, from, http://www.bayuk.com/thesis; 2011.
Bilge L, Dumitras T. Before we knew it: an empirical study of zero-day attacks. In: The real world. Conference on computer andcommunications security. Raleigh, North Carolina: ACM; 2012.
Buede DM. The engineering design of systems, models andmethods. Wiley; 2009.
Carmines E, Zeller R. Reliability and validity assessment.Thousand Oaks, California: SAGE Publications; 1979.
Cavusoglu H, Raghunathan S, Yue WT. Decision-theoretic andgame-theoretic approaches to it security investment. Journalof Management Information Systems 2008;25(2):281e304.
CCRA. Common criteria for information technology securityevaluation. Version 4. Common Criteria RecognitionAgreement, http://www.commoncriteriaportal.org; 2012.
Checkland P. Systems thinking, systems practice. John Wiley &Sons; 1999.
CISWG. Report of the best practices and metrics teams. CorporateInformation Security Working Group, US House ofRepresentatives, Subcommittee on Technology, InformationPolicy, Intergovernmental Relations and the Census,Government Reform Committee; 2005.
Cummings A, Lewellen T, et al. Insider threat study: illicit cyberactivity involving fraud in the U.S. Financial Services Sector.Carnegie Mellon University; 2012.
DoD. The orange book, trusted computer system evaluationcriteria. Department of Defense; 1985 [supercedes first versionof 1983].
Eskins D, Sanders WH. The multiple-asymmetric-utility systemmodel: a framework for modeling cyber-human systems. In:Proceedings of the 8th international conference onquantitative evaluation of systems; 2011. pp. 233e42.
tical attribute construct, Computers & Security (2013), http://

c om p u t e r s & s e c u r i t y x x x ( 2 0 1 3 ) 1e2 1 21
Espenschied J, Gunn A. Threat genomics. Metricon 7.0. Bellevue,WA [retrieved 11.01.12], securitymetrics.org; 2012.
Fenton NE, Pfleeger SL. Software metrics, a rigorous and practicalapproach. 2nd ed. Boston, MA: PWS Publishing Company; 1997.
Forums (ongoing), www.securitymetrics.org, metrisec2012.cs.nku.edu/history.html, samate.nist.gov, www.societyinforisk.org, www.veriscommunity.net, www.cisecurity.org, weis2013.econinfosec.org [all last visited 11.01.12].
FS-ISAC. On-line fraud detection white paper, account takeovertask force. Financial Services Information Sharing andAnalysis Center; 2011.
Garcia ML. The design and analysis of physical protectionsystems. Amsterdam: Butterworth-Heinemann; 2008.
Geer DE, Conway DG. The owned price index. IEEE Security &Privacy 2009;7(1):86e7.
Hancock B. US Government Board setting up security metrics.Computers & Security 2000;19(7):580.
Herrmann D. The complete guide to security and privacy metrics.Boca Raton, FL: Auerbach Publications; 2007.
Howard M. Writing secure code. 2nd ed. Microsoft Press; 2002.Hubbard DW. The failure of risk management. Hoboken, NJ: John
Wiley & Sons; 2009.IDART. Information Design Assurance Red Team, Red Team
Metrics. Sandia National Labortories. http://www.idart.sandia.gov/training/Metrics.html; 2008 [last accessed 11.01.12].
INCOSE. INCOSE systems engineering handbook. Version 3.2.1 2011.India. Blind men and an elephant, from Wikipedia, the free
encyclopedia. Retrieved 11.01.12, from, http://en.wikipedia.org/wiki/Blind_men_and_an_elephant.
Ioannidis C, Pym D, Williams J. Investments and trade-offs in theeconomics of information security. In: Dingledine R, Golle P,editors. Financial cryptography and data security, vol. 5628.Berlin/Heidelberg: Springer; 2009. p. 148e66.
ISACA. Control objectives for information technology (COBIT).Rolling Meadows, IL: Information Systems Audit and ControlAssociation, IT Governance Institute; 2007.
ISO/IEC. Information technologydsystems securityengineeringdcapability maturity model (SSE-CMM, ISO/IEC28127). International Organization for Standardization (ISO)and International Electrotechnical Commission (IEC); 2002.
Izrailevsky Y, Tseitlin A. The Netflix Simian Army; ongoing, July19, 2011, http://techblog.netflix.com/2011/07/netflix-simian-army.html, http://techblog.netflix.com/2012/07/chaos-monkey-released-into-wild.html. The Netflix Tech Blog.Retrieved 11.01.12, from http://techblog.netflix.com/2011/07/netflix-simian-army.html.
JansenW.Directions in securitymetrics research.National Instituteof Standards and Technology; 2009. [Interagency report].
Jaquith A. Security metrics. Upper Saddle River, NJ: PearsonEducation; 2007. p. 13e5. Modeler versus measurer debate.
Jones RA, Horowitz BM. A system-aware cyber securityarchitecture. Systems Engineering 2012;15(2).
Kovacich G. Information systems security metrics management.Computers & Security 1997;16(7):610e8.
LeMay E, Ford MD, Keefe K, Sanders WH, Muehrcke C. Model-based security metrics using ADversary VIew securityevaluation. In: Proceedings of the 8th international conferenceon quantitative evaluation of systems. Aachen, Germany;2011. pp. 191e200.
McGraw G. Software security. Upper Saddle River, NJ: Addison-Wesley; 2006.
Mell P, Scarfone K, Romanosky S. A complete guide to thecommon vulnerability scoring system. Version 2.0. Forum ofIncident Response and Security Teams (FIRST); 2007.
Metricon (ongoing). Metricon is hosted at www.securitymetrics.org, a community website for security practitioners [lastaccessed 11.01.12].
Please cite this article in press as: Bayuk JL, Security as a theoredx.doi.org/10.1016/j.cose.2013.03.006
Metricons. (ongoing). Metricon 7.0, What we know to work insecurity metrics, Panel led by Anton Chuvakin (2011), Metricon6.5, Data Mining Methods for Enterprise Level Security, Panelled by Scott Crawford (2010), Metricon 5.0, Seiersen, Richard,Practical Security Metrics in the 4th Dimension (2009),Metricon 4.5, Krikken, Ramon, Security Metrics Field Research(2008), Metricon 3.0, Wong, Caroline, Metrics at Ebay (2008).Retrieved 11.01.12, from www.securitymetrics.com.
MITRE (ongoing). National Vulnerability Database, US NationalInstitute of Standards and Technology, http://nvd.nist.gov/[last accessed 11.01.12].
Mogull R. An open letter to Robert Carr, CEO of HeartlandPayment Systems. Securosis Blog; 2009. Securosis.
NIST. An introduction to computer security: the NIST handbook.National Institute of Standards and Technology; 1995.
NIST. Recommended security controls for federal informationsystems. SP 800-53 rev 2. National Institute of Standards andTechnology; 2007 [authors: Ross R, et al.].
NIST. The technical specification for the security contentautomation protocol (SCAP): SCAP version 1.1. SP800-126 rev.1. National Institute of Standards and Technology (US),Information Technology Laboratory, scap.nist.gov; 2010 [lastaccessed 11.01.12] [authors: Quinn S, et al.].
NIST. Managing information security risk. SP-800-39. NationalInstitute of Standards and Technology, Joint Task ForceTransformation Initiative Interagency Working Group; 2011.
Pande P, Neuman R, Cavanagh R. The six sigma way. McGraw-Hill; 2001.
Parker D. Re: system security metric survey follow-up request.Email correspondence; September 1, 2011.
PCI. Payment Card Industry (PCI) data security standard. Version1.2. Payment Card Industry (PCI) Security Standards Council;2008.
Reichheld FF. The one number you need to grow. HarvardBusiness Review; 2003.
SANS Institute (ongoing). Security consensus operationalreadiness evaluation, http://www.sans.org/score/. e.g. UNIXSecurity Checklist, http://www.sans.org/score/checklists/AuditingUnix.pdf.
Savola RM. Towards a taxonomy for information security metrics.In: International conference on software engineeringadvances (ICSEA). Cap Esterel, France: ACM; 2007.
Thurstone LL. Attitudes can be measured. American Journal ofSociology 1928;33(4):529e54.
Verendel V. A prospect theory approach to security. ChalmersUniversity of Technology: Goteborg University; 2008.
Wang H, Roy S, Das A, Paul S. A framework for securityquantification of networked machines. In: 2nd Internationalconference on communication systems and networks(COMSNETS); 2010, 1. pp. 5e9.
Wilhelm T. Professional penetration testing. Syngress; 2009.
Bayuk is an independent systems securityconsultant with professional experience in awide variety of cyber security management,architecture, academic, and advisory roles.Hernumerouspublicationsandpresentationson information security topics include 4 text-books and 2 edited compilations. She hasMasters degrees in Computer Science andPhilosophy, a PhD in Systems SecurityEngineering, Certifications in Information
Systems Audit, Information Systems Security, Information SecurityManagement, and ITGovernance (CISA,CISSP, CISM,CGEIT), andan
tical attribute const
NJ State Private Investigator’s License.
ruct, Computers & Security (2013), http://