security council. the gross shortfall in world supply
TRANSCRIPT

Offshore Oil and Gas Problems from International and IndustryPerspectives
Paul L. KellyRowan Companies, Inc.
There is an old Bedouin saying, "It is not every cloud that bringsrain." With less than three months having elapsed smce Iraq's invasion ofKuwait, it isdifficult todraw any long-term conclusions just yet. Nevertheless,we already know that everything is changed.
On 02 August 1990 the world was reminded that oil is the closestthing we have to industrial oxygen (Figure 1). Looking at some of the macrotrends, we see that crude oil prices in the United States have been over$40/barrel this month (Figure 2). Atthe same time, U.S. crude oil productionhas fallen dramatically by2 million barrels aday (mbd) smce 1985, from over9 mbdto about 7 mbd. The nation's dependence on foreign oil has increased60% since 1985 and foreign oil now accounts for half of U.S. consumption.
The combined oil production of Iraq and Kuwait was approximately4.8 mbd per day just before the embargo imposed by the United NationsSecurity Council. The gross shortfall in world supply caused by the embargois about 4mbd. While other OPEC members may have the potential tomakeup for a temporary shortage of up to 3.5 mbd, from a policy standpoint itseems unlikely that all countries will increase production to full capacity.
The Bush Administration's response to the supply shortfall can beseen in Table 1, which shows 607,500 barrels per day savings under thecategory of crude oil production increases and fuel switching, and another530,000 barrels per day saved by means of conservation and efficiencymeasures. Note that the Department of Energy's schedule refers to all theseitems as savings.goals. None ofthe savings is guaranteed and they all requiretime and a good deal of luck and volunteerism.
Going back to the decline in U.S. production, (Figure 4) whateveryone seems to be missing is the fact that there is absolutely no evidencethat this decline will cease. In fact, the current estimate is that we will loseanother 600,000 barrels per day of production in 1990, which will be onlypartially offset by those savings on the Bush Administration's wish list likelyto come about.
Successive government administrations, the Congress, and the mediahave missed the fact.that, had the invasion of Kuwait never occurred, wewould still have a ticking time bomb in our midst, namely, the rapid declinein domestic oil production initiated in 1986 with the shutting in orabandonment of marginal wells as the result of $15/barrel and lower oil
611

prices. Put another way, during the past five years we have been creating thedomestic equivalent of the Iraq/Kuwait embargo.
Figure 5 shows that the current rig count in the United States ofaround 1,000 rigs is not only well below the ten-year average of 2,500 rigsrunning, but also well below the fifty year average of 1,800 for theyears 1940-1989. Simultaneous with the production drop of 1986, therig count collapsed(Figure 6). Given the inevitable lag effect, the impact of that collapse wascertain to arrive. It did, three years later in 1989, when domestic crude oilproduction fell dramatically by600,000 barrels per day. This iswhy I think thegovernment's production projection for the 1990*s is excessively optimistic Idon't see how it ispossible to keep production essentially flat for seven yearswhen the number of rigs operating isbelow the fifty year average for all thistime. If one accepts the theory that 1989 was 1986 arriving, time-delayed, it isnot difficult to guess what the country has in store for 1990, 1991, and 1992since the rig count for 1987,1988, and 1989 is now history. We need to planonsimilar production drops for thenext several years. In fact, themost recent1990 domestic production figures only reinforce this fact. According to thelatest API figures, theU.S. oil production has finally slipped below 7 mbdandhas lost anadditional 400,000 barrels per day in the first sixmonths of 1990.The United States will run out of oil if we are not drilling for it.
Government policy makers and themedia have failed to separate thedecline inU.S. oil production caused bythelow rig count from thenotion thatthere are no more oil reserves to be found in this country. I'm sure you'veseen all the "no more oil" stories in the media in recent months The truthisthat there is still a lot more oil to be found in the United States if we justput rigs to work looking for it.
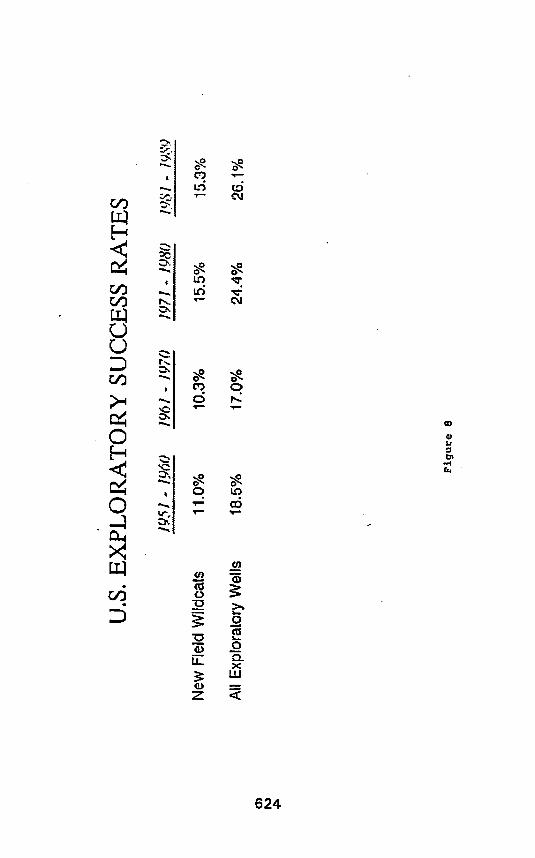
For example, if we look at the history of U.S. reserves found in thepast 125 years (Figure 7), we see that the average annual amount of oil andgas equivalent barrels found in the past 25 years far surpasses those found inthe first 100 years, 2.23 billion barrels per year to 1.83 billion barrels per yearAlso, the exploratory success ratio of 26.1% for the past eight years isbetterthan it was during the previous thirty years (Figure 8). Reserves added perexploratory rig has been essentially consistent (Figure 9) and average oilwellproductivity in 1989 was only slightly less than it was in the years between1947 -1989(Figure 10). Finally, drilling economics in constant dollars, i.e.thecost to drill and complete a well in the United States, was less in 1989 thanit was in 1977 (Figure 11).
Finding and developing oiland gas has always beena tough business,but there is nothing in all these figures to support the myth that the U.S.should be written off as a mature, high-cost producing area and that weshould allow our domestic oil and gas business to die gracefully.
612

The United States can never again beself-sufficient in energy (Figure12), but there is much we can do tostem the tide ofrising imports ifwe haverigs turning tothe right onshore and offshore. It is wishful thinking toassumethat, once the crisis in the Gulf is over, we will return to the halcyon days ofcheap foreign imports. For several years, oil analysts have beenunderestimating growing world demand and overestimating OPEC capacity.Also, the politics ofOPEC members abusing their quotas is forever changed.My guess is that, however the situation with Iraq and Kuwait is resolved, weare unlikely to see prices below $24 - $25 per barrel
From industry's perspective, it is difficult to comprehend how, as amatterof national policy, Congress and the BushAdministration have chosento brush aside offshore petroleum resources asasource of additional domesticsupply when about half of thenation's remaining proven reserves are locatedoff our shores.
The paradox of President Bush's action on 26 June 1990, and theaction ofthe House Appropriations Committee on 1October 1990 extendingleasing moratoriums even further, is apparent in the Energy InformationAdministration's recent report on U.S. crude oil reserves. While explainingthat, in 1989, U.S. proved reserves declined by 1.2%, or 324 million barrels,the report said, "Crude oil discoveries have been relatively low, reflecting asimilar trend in exploratory drilling following the crude oil price collapse of1986." The EIA report noted that most of the new field discoveries in 1989were in the Gulf of Mexico offshore, which accounted for 93 million barrels,or 83% ofall new discoveries! Need there be clearer evidence ofthe growingimportance of offshore oil and gas development? Yet, we have just placedmost of our offshore frontier areas off-limits to leasing for the next decade.Some estimates indicate the potentially economically recoverable hydrocarbonreserves intheareas removed from leasing onour East and Westcoasts couldbe as much as 4 billion barrels of oil equivalent
If we should expect import increases of the magnitude of 500,000barrels per day or more for the next several years, then we should also expectimport levels tobeatthe60 percent level sooner rather than later. What doesthis mean for those of us involved in coastal issues?
In a nutshell, the problem is that our hydrocarbon delivery system isdesigned around the assumption that we have a reliable base of around 8million barrels of daily domestic oil production, and alike amount of domesticgas production, coming from about 850,000 individual wells located in 29different states. When we allowed domestic drilling to hit bottom, we forgotthat we have to build anew plumbing system in order tosubstitute importedcrude oil for domestic crude coming from avariety ofU.S. locations. MatthewSimmons ofSimmons &Company International in Houston says, "In aword,this is the coming domestic embargo, which triggers at the point that U.S.
613

production sinks an incremental 100,000 barrels per day more than we havethe capacity to sustain this drop with imports." Mr. Simmons made afascinating presentation to the U.S. Department of the Interior's OuterContinental Shelf Policy Committee at its meeting inAnchorage inMay, 1990.If you have not read his analysis, you should.
I believe we are going to pay a heavy price for so cavalierlydisregarding our OCS oil and gas potential Later in the 1990's, the OCSregulatory issues we have all struggled with will seem minor compared to theissues inwhich state regulators and conservation organizations will beinvolvedas the result of rising imports.
Think of the import process as a series of links ina chain beginningwith tankers and product carriers. After tanker transportation comes theoffloading link in the chain, which includes lightering berths, offshoreterminals, and dockside unloading facilities. After this comes onshore storagetanks. Then, the right type ofrefinery capacity at water's edge, and finally, thepipeline systems needed totake crude from the few harbors presently capableof receiving imports to the 40% of our U.S. refineries that are not located onwater.
As MatthewSimmons points out,whileprecise data on eachof theselinks is hard to obtain, the data that are available indicatethat all these linksare near the limit of their capacity. More will have to be built.There willbemore oil spills from the higher volume of tanker traffic. When the crisisarrives we could see both a major effort to add import facilities and a costlyscramble for domestically produced crude oil. Congress and a large segmentof the public will blame the petroleum industry for inducing shortages toincrease prices. Industry will point the finger at the environmentalists forkeeping usout of the Arctic National Wildlife Refuge (ANWR) and the OCSfrontier areas. There will be plenty of blame for all of us to share, and if wehave the kind of mayhem I think we could have in the 1990's, I am not sureany of our interests will beserved bymaintaining thestatus quo as far as OCSdevelopment is concerned.
As a result of recent Presidential and Congressional actions limitingaccess to offshore lands, threats of increased taxes and expensive political andregulatory failures such as Point Arquello in California and Mobil's Manteoproject offshore North Carolina, the U.S. offshore petroleum industry israpidly becoming more internationally-oriented.
To give youanexample of howquickly the pace of foreign investmentbyU.S. oil companies isaccelerating, Salomon Brothers found initsJuly, 1990survey that budgeted increases in international exploration and productionexpenditures far exceed the projections made just last December. The 65companies in Salomon's survey, including independents and majors, nowplan
614

a 24.7% rise in their 1990 expenditures compared with a 12.6% increaseforecast by the same companies in December. Sixty percent of the totalactivity will be outside the United States. When I asked an oil companycustomer the other day if he expected this trend to continue next year, hereplied, "You have just seen the tip of the iceberg."
As the difficulty of conducting exploration and production in the U.S.grows, foreign governments have madesignificant policy movesto attract U.S.exploration and production investment. Since the oil price collapse in 1986,more than 25 countries have made changes in royalties, taxes, and contractterms which recognize the high costs and risks involved in petroleumexploration and, in onewayor another, reduce the government's take.Foreigngovernments, unlike our own government, realize that one of the realities inthe world petroleum arenais that governments must compete with each otherfor the finite capital of the petroleum industry. The high utilization of drillingrigs and the tremendous level of activity now going on in the U.K. sector ofthe North Sea is proof of the British government's ability to fine tune andadjust taxes and incentives to keep the industry moving forward withexploration and production in the North Sea. While some in the U.S.Congress criticize the petroleum industry, the British Energy Minister speaksof our industry as a national asset and a good, responsible neighbor; andmoreover, says openly that Britain intends to have London replace Houstonas the world energy capital.
Manyof ourmost technically advanced offshore drilling rigs, includingthose capable of drilling in a zero discharge mode, are leaving the U.S. forforeign waters where theyaremorewelcome. It is not an exaggeration to saycurrent U.S. government policy is driving exploration and production awayfrom the United States. Our current energy policy, which can be summed upas a reliance on cheap imported oil, is now being tested by the crisis in theMiddle East. To date, the response of Congress and the Administrationignores reality. Solutions like increasing the air pressure in the tires of ourcars just will not do the job alone.
Virtually all opposition to offshore drilling in the U.S. grows out ofenvironmental concerns. Yet offshore production throughout the world is.rising to the point where it is now responsible for 25% of the world'soil, andthere is no evidence that these operations are having any long-term,measurable negative impact on our oceans and seas. In fact, exploration,drilling, and producing operations create less pollution in our oceans thanriver runoff, atmospheric phenomena, municipal discharges, marinetransportation, and even natural seeps. Isn't it time we rethink our blindopposition to drilling on the U.S. Outer Continental Shelf?
The combined decline in U.S. oil production in 1990and 1991 alonewill be well over one million barrels, with that trend almost certain to
615

continue. What happens when our oil trade deficit exceeds $100 billion?Money used to buy foreign oil can be better used building a strong economyat home. Foreign credit used to finance much of our economic expansion inthe 1980's will not be as available in the 1990's because there will be too muchcompetition for this investment internationally. Investment alternatives inEastern Europe and better markets in Asia will lure German and Japaneseinvestment away from the United States. For this reason, rising interest ratescould be the order of the day in the U.S. in the 1990's.
A number of energy mega-projectsoutside the U.S. will demand hugeamounts of capital in the years ahead. For example, before the Kuwaitinvasion, OPEC President Subroto said in Houston that it would take $60billion of investment to boost OPEC production in the 1990's to meetanticipated world demand. A large part of this demand will come from therapidly growing Pacific Rim. We will need more tankers and LNG ships.Analysts say that $25-$30 billionwillbe investedin LNG projectsand another$10-$15 billion in LNG ships. A recent worldwide survey of oil companyoperators indicates that a total of 718 new potential offshore oilfields outsidethe United States have been marked for development during the years 1990to 1995.
There are tremendous economic forces at playwhich willhave a greatimpact on U.S. competitiveness in the global economy of the nineties. Energywill play an important part in this competition, and so far we seem obliviousto this fact. At some point, sooner rather than later, it will become apparentthat in the national interest, we can no longer put off frontier OCSdevelopment until after the turn of the century. When that happens, we willhave no choice but to work together.
The environmental record of the offshore petroleum industry is agood one. I believe that, sharing our technical and engineering data withcoastal regulators and conservationists, our industrycan develop more publicconfidence about the safety of our operations. U.S. offshore technology isbeing used to develop offshore oilfieldsthroughout the world, and it is reallysophisticated and exciting when you get into it. Indeed, we should be proudof this technology as a preeminent American product. I am convinced thateconomic changes will soon change the politics of the offshore oil issue andthat all of us will be required to respond to that change. When this occurs, Iam confident that, working together in good faith, we can develop moreenergy resources on our continental shelf while at the same time taking allprecautions to preserve our other coastal resources.
616

U.S.CRUDEOILPRICES
DollarsPerBL;Lower48Only
$35r-
$10-
$5iiiiiiiiiiimm11111iii!hmmi
87888990
Figure1

CO
U.S.CRUDEOILPRODUCTION
Millions01BBLPerDay
10.0i—EffectOfPriceDrop
I
Figure2
ArrivalOfRigCollapse
Loss012MMB/Day

. BUSH ADMINISTRATION, ;<)IL OFFSET INITIATIVESf • '"rtSavings toBarrels j>ct Day) ;£•- : - -.
CRUDE OL PRODUCTION/FUEL SWTTCHtNGSavings
Measure Goal'
bweasedPrudfioe Bay Production 100000New Alaska Produetiorf 100*000CaHomia Heavy Oil Production 100000Point Arguetlo Produclion 7s'oooIncreased State Allowance 30000Increased National Petroleum Reserve
Production 5000Utility/Industry Fuel Switching 100000Natural Gas PipeSne Projects ss'oooGreater "GasohoT Use i<j000President's OilandGas '
Tax Incentives 32,500
TO™- 607,500
Additional contemplated measures include dispalch oloil-fired generation, accelerated useof alternative fuels andwaste-to-energy permitfing,
EFFICIENCY MEASURESSavings
Measure Goal'
Better Driving Techniques 120,000Proper Toe Pressure 50000Car Pool/Van Pool go'oooIftffityflndustriaJ Conservation 7S.000CompBanee with Speed Limit 50.000Use of Lower Octane Gasoline 5000003Burr«Tttte4Jp/Rerjlaeement 45000Used More Efficient Car 40,000Federal Energy Conservation 10*000
TOTAL S30>000
'By December 1991.*Mafcuk andPoint Mdntyre fields.
Figure 3
619

too
U.S.CRUDEOILPRODUCTION
MillionsOfBBLPerDay
9.0r-
8.5
8.0
7.5
7.0
6.5
v?"
8788
1.1MBDLosl
SinceJanuary1987
IIIII[I!IIIIIIII89
Figure4
90

to
U.S.RIGCOUNT
Last53MonthsfiJtJ&J&jtfiJ&iMana(4/86-8/90)M/ftM/ftMI?03
0^-%18?arAVGra9eII11II11*.500
50-YearAverage(1940-1989)
FigureS
1,800

toto
PRODUCTIONVS.RIGCOUNTWithProjections•
BBOER'9Count8r-
HisloricProduction
Govt.Projection
HistoricRigCountProjectedRigCount
5000
4000
3000
2000
1000
IIIIIIIIIIII1111~198119831985,198719891991199319951997
ExcludesPntdhocRay
Figure6

toto
U.S. RESERVES FOUND: 1863 -1990(Excluding Alaska)
1863 - 1963 1963 -1989(100 Yean) (26 Years)
Wells Drilled 2 Million 1.2 Million
Reserves Added* 183 Billion 58 Billion
Billion Barrels/Yr. 1.83/Yr. 2.23/Yr.
Oil And Gas Equivalent Barrels.
Figure 7
o>to
U.S.EXPLORATORYSUCCESSRATES
mi-1960mi-momi-momi-i%v
NewFieldWildcats11.0%10.3%15.5%15.3%
AllExploratoryWells18.5%17.0%24.4%26.1%
Figure8

to
RESERVESADDEDPEREXPLORATORYRIG(a)
ThreeYearIncrements,ThreeYearLagMMBOE
20
15
10
MMBOEAdded/Expl.RigLinearRegression
7',u,ss/^"%*•*—-
47-4950-5253-5556-5859-6162-6465-6768-7071-7374-7877-7980-8283-85
(a)Hit}CountxllxpWellsx1.75lixdtnUaNorthMopi-
Figure9

CDtoCO
AVERAGEOILWELLPRODUCTIVITY(Non-Alaskan,Non-StripperWells)
1947-19891989
36.7Barrels/Day34Barrels/Day
Figure10

DRILLING ECONOMICS(Cost To Drill Complete U.S. Well)
Constant Dollars
1977 1989
Exploratory Well $560,000 $406,000
S Development Well $339,000 $264,000
Figure 11

to00
U.S.PETROLEUMIMPORTSASA
PERCENTOFDOMESTICDEMAND
60%r-
50%
40%
30%-
20%
Figure12

Neat-shore Berm SiteSelection and Construction: South Padre Island, Texas
T. Neil McLellan
U.S. Army Engineer Waterways Experiment Station
Abstract
The high cost ofbeach protection has led many coastal zone plannersto investigate effective lower-cost alternatives for shoreline stabilization. Onemethod currently being investigated by the U.S. Army Corps of Engineers isthe use of dredged material to construct nearshore berms to protect theshoreline and augment the beach profile. Several projects have recently beencompleted and are currently under study. One nearshore berm has recentlybeen constructed off the Gulf Coast of Texas near South Padre Island. Theberm was constructed using sandy dredged material from the Brazos-SantiagoPass Channel and placed downdrift of the channel. An extensive site selectionprocess was used to determine the most effective site to use. Site selectionwas critical to ensure cost-effective construction, aswell asaneffective berm.Currently, a monitoring program is being undertaken to evaluate the berm'seffectiveness in augmenting the existing beach profile. The monitoring planincludes bathymetry, sediment sampling, and seabed drifter (a bottom trailingdrogue) releases.
Background
Beach nourishment can be an effective method for augmenting,protecting, and repairing a beach. The placed material also provides stormand flood protection to the back beach area. To date, most beachnourishment projects involve placing suitable material from the dune area tothe swash zone. The expense of this type of beach nourishment often limitsthe quantity of material which can be placed on the beach. In addition, aswave action redistributes the material throughout the active beach zone,severe local erosion can occur. Within the last ten years, the construction ofseveral shallow-draft, split-hull hopper dredges has created the potential foreconomical and effective placement of sediment in the nearshore area.Placement in the nearshore area can be half the cost ofonshore placementand can provide several of the same benefits. Two types of berms can beconstructed inthenearshore region-a stable berm designed toattenuate waveenergy, or a feeder berm placed to augment the beach profile. Which type ofberm to construct can vary depending on factors such as wave characteristics,type of material, equipment availability, and overall berm intent.
Beach quality material placed within the littoral system can benefitthe shoreline by providing additional material in the beach profile. Thematerial has the potential for mitigating erosion problems by providing asacrificial source of sediment, a sill to reduce the movement of material
629

offshore, asource of sand for downdrift areas, and, during times of accretion,provide a sand source for the beach profile. Feeder berm erosion rates willdepend onwave climate, sediment grain size, depth of placement, andmounddimensions. By calculating andmonitoring the erosion rates, the berm canbenourished at appropriate intervals to provide a continuing source of sand. Inthe case of artificial beach nourishment, Bruun (1988) has described theimportance of placing material offshore to nourish the beach profile. Sincegrain size normally decreases with distance offshore, placement ofsuitably-sized material at the proper depth will increase stability and reducecosts comparedto similarmaterialplaced on the beach. Whatever the desiredobjectives, theproper equipment, location, and placement techniques must beselected.
Early attempts at beach nourishment through offshore placementwere not successful (McLellan 1990a). However, with the advent ofshallow-draft, split-hulled hopper dredges inthe1970's, the feasibility of usingconventional dredging and placement practices for berm construction becamea reality. Several projects have recently been completed by the U. S. ArmyCorps of Engineers demonstrating berm construction with conventionalequipment. In addition, several projects have been completed outside theUnited States with a high degree of success (McLellan 1990b).
Although several projects have been constructed, additionalsite-specific guidance is required for site selection, construction, andmonitoring. Site selection can be aided by examining long-term sedimenttransport trends. Bycollecting site-specific data about local inlets, bathymetry,structures, and anomalies that may effect sediment transport, anunderstanding of the area canbe acquired. Care must be taken to insurethatthe placement site is far enough downdrift ofan inlet sothat sediment movingoff the berm is not trapped by the jetties or returned into the channel. Thismust be accomplished while maintaining minimal travel distances for theoperating dredge. To better define a berm construction location forBrazos-Santiago Pass, Texas (Figure 1), a field study was designed andconducted for the downdrift side of the jetties (McLellan and Burke, 1988).The field study utilized seabed drifters (SBDs), supplemented by additionalinstrumentation and procedures, to delineate nearshore flow patterns inDecember, 1987. Approximately 1 year later, a nearshore berm wasconstructed using material dredged from the Brazos-Santiago Pass Channel.
Berm Site Selection
Brazos-Santiago Pass (BSP) Inlet is located just north of theTexas-Mexico border on the southern tip of Padre Island, Texas (Figure 1).Early attempts to maintain a navigable channel at BSP were unsuccessful(Morton andPieper, 1975) untilthe construction of the presentjetties in 1935.
630

The entrance channel is maintained at a -38 ft depth and a 300 ft width.South Padre Island has a history of erosion with exception of the extremesouthern tipof the island located next to the BSP jetties. Historical evidencedeveloped by Morton and Pieper (1975) shows that the predominate littoraldrift in this area is to thenorth but seasonal reversals occur during the wintermonths (October-February). Tides near south Padre Island are predominantlydiurnal with a frequent superimposed semidiurnal component which producestwo low waters of different elevation each day, resulting in a mixed cycle.Winds are predominately south-to-southeast throughout the year with theexception of December, whenwinds are predominately north-to-northwest.
The water depth at which sediment is an active part of the littoralsystem is dependent on wave height and period, and sediment composition.The complex littoral system extends from the back beach and dune to somedistance offshore. The distance offshore is depth-dependent; determinationof that depth will provide a boundary for the active portion of the beachprofile where sediment may be introduced into the littoral system.Hallermeier (1981) utilized lab data to develop an equation to predict thedepth at which significant amounts of sand are moved and can be consideredpart of the littoral system. The Hallermeier equation estimates the maximumdepthatwhich changes in thebeach profile occur for large stormevents basedon the wave period and the significant wave height which is exceeded 12 hrsa year. Using the significant wave height and period from the WaveInformation System, a20-year hindcast data base (McAneny 1985), the depthof closure for the south Padre Island area is estimated at 28 ft.
One thousand and seven hundred bright orange cap and stemWoodhead-type SBDs were released at9offshore stations for theBSP project(Woodhead and Lee, 1960). SBDsare inexpensive, disposable bottomcurrenttrailing drogues that can be used in all types of marine conditions and canreflect integrated bottom current paths and unobstructed sediment transportpaths. All the SBDs carried an attached extremely durable, sequentiallynumbered, self-addressed polyvinyl chloride (PVC) return card which askedspecific questions on return time, date, and location and had a map for easyrecovery location identification. Six locations were identified to evaluatepotential berm construction sites and two locations were identified to evaluatedrift patterns of the historical and proposed dredged material disposal sites.The ninth station was placed in the surfzoneto establish SBD drift patternswhen the SBDs entered the surf zone. Economical haul distance for adredging operation at BSP was determined to be 3 miles and loaded draft ofthevessel was at least 20 ft (Medina, 1987, personal communication). Releasesites for the berm were therefore limited to within three miles of the jettiesin a depth of at least 20 ft. Stations to determine the berm construction sitewere located approximately 1, 2, and 3 miles from the jetties approximately1/4 to 3/4 miles offshore on the 20 and 28 ft contours.
631

As of the writing of this report, 801 (47%) SBD cards of the 1700released have been returned, withthe sixpotential construction sitesreturningan average of 50% of those released. Seabed drifter returns ranged fromapproximately 18 miles north of the BSP jetties to 20 miles south of thejetties. In general, recovered drifter moved northward an average of 4 - 6miles from their release locations. The closer to shore the drifters werereleased, the greater the percentageof recoveriesand the shorter the distancetraveled along shore. All drifters wererecovered northof the jettieswith theexception of 10drifters collected in the bay or southof the jetties. These 10drifters were from release sites located one mile from the jetties and are anindication of the current influence caused by the inlet/jetty.
SBD returns from the 6 longshore locations suggest that the bermneeds to be constructed at least 1 mile north of the jetties. A bermconstructed closer to the jetties may be equally successful but sedimentsmoving off this berm stand a higher chance of returning to the channel orbeing trapped by the jetty. In addition, the historical wave data indicated thatthe berm should be within the 28 ft contour and that late winter/early springwas the best time for construction to take advantage of seasonal currentreversals.
Berm Construction and Monitoring
As shown in Figure 1, the berm construction site was approximately1 mile north of the jetties, located 1/4 to 3/4 miles offshore. Prior toconstruction, a pre- andpost-construction monitoring plan was established forthe BSP berm. The monitoring plan included bathymetric surveys, beachprofiling, sediment samples, diver cores, releases of SBDs and collection ofLittoral Environmental Observation (LEO) (Schneider 1981) to determinewave characteristics. Pre- andpost- construction surveys areto determine theoverall size and shape of the berm and measure berm changes with time.Beach profileswill document anychanges whichoccuron the beachface itselfandthe sediment samples will provide information on the sediment migrationin the area. Diver-collected cores can provide information on the depth ofmovement vertically into the sandy bottom. Additional releases of SBDsprovide a continuing data base for nearbottom currents.
North American Trailing Company was awarded the contract todredge 750,000 yd3 ofsand from the BSP entrance channel The split-hulledhopper dredge MANHATTAN ISLAND performed the dredging beginningin December, 1988. The MANHATTAN ISLAND has a 19 ft loaded draftand a3600 yd3 hopper. Approximately 1/2 the total dredged quantity was tobe placed in the berm site, with the remainder beingplaced in the designateddisposal site directly north of the channel. To limit exposing the dredgebroadside to waves during highenergy events, the actual placement times andvolume were left to the discretion of the dredge captain. Due to a relatively
632

stormy season, only 173trips to the site were made, resulting in the placementof 220,000 yd3 of material.
To ensure beach quality material was placed into the berm site,periodic sampleswere collected from the hopperdredge. Mean grain size ofbeach samples collected ranged from 2.40-2.62 phi, a fine sand typical ofTexas beaches (Folk, 1980). Material from the hopper ranged in size from3.08-3.15 phi, indicating fine to very fine sand. In addition, to determine theeffect of the mound on offshoreresources, sampleswere collectedbefore andafter placement in the berm construction area. Prior to berm construction,offshore phi sizes were 3.13-3.89, very fine sand. After placement of thedredged material, grain size increased to 2.6 phi in the vicinityof the berm.This shift to a coarser grain size was not evident in other samples collectedin the vicinity of the berm offshore, but outside of it's influence. The higherquality beach material in the vicinity of the berm is most likely due towinnowing of the finer-grained fraction of the sediments during the bermplacement operation.
Although analyses are continuing on the collected data, somepreliminary results are available. In addition to the pre-construction surveyin December, 1988 and post-construction surveyin January, 1989, surveyswereconducted in March and June, 1989. Additional surveyshave been done andare being analyzed. Comparison of the pre- and post-construction surveysindicate the berm rises to +4 ft above the natural bottom and is
approximately 3500 ft long. The berm is a shore-parallel feature constructedon the 26 ft pre-construction depth contour and contains approximately190,000 yds3 ofsand, slightly below the hopper estimates of 220,000 yds3 butwithin the accuracy of the bathymetric surveys. Figure 2 shows that,subsequent to placement, during the winter months (January-March, 1989),the berm moved approximately 300 ft shoreward. Historically, this is the mostenergetic time for the area and the maximum movement can be expected.From March to June, with lesserenergy in the environment, the berm movedlittle. Preliminary indications are that the berm is moving as a bar directlytowards shore, not in the longshore direction. There has been some erosionof the peak elevations, but there is still a well-defined feature evident. Theberm is expected to continue migrating towards shore as a bar, until itencounters the naturally forming bar,between the 14 to 18 ft contours. It willthen become assimilated into the littoral system and, from a monitoringstandpoint, become indistinguishable from the natural system. Additionalmonitoring and analyseswill determine the final result.
Summary
The U. S. Army Corps of Engineers Galveston District and theWaterways Experiment Station's Coastal Engineering Research Centercooperated on a project in the Gulf of Mexico nearthe Brazos-Santiago Pass
633

inlet to delineate nearshore flow patterns and evaluate possible sites forconstruction of a nearshore berm using dredged material. The projectincorporated the release of bottom trailing drogues called seabed drifters,collecting sediment samples, and reviewing historicalwind and wave data. Asite approximately 1 mile north of the jetties was selected for bermconstruction. Approximately 220,000 yd3 of sandy dredged material wasplaced as a nearshore berm. An extensive monitoring plan evaluated theberm's effectiveness. The berm's maximum elevationwas +4 ft above existingbottom elevations and the berm was3500 ft. long. Sediment samples from thedredge and the berm site indicated that the finer fraction of the dredgedsediment was winnowed out during the placement operation, leaving a higherbeach quality material. The berm has been moving as a bar shoreward duringthe first five months of its existence and is expected to continue its shorewardmigration until it is assimilated into the natural occurring bar system.
Acknowledgements
The field study and evaluations described in this report werecompleted through cooperation with the US Army Engineer District,Galveston (SWG) of the US Army Corps of Engineers. SWG arranged andprovided funding for the field study and related sample analyses. Permissionwas granted by the Chief of Engineers to publish this information.
634

References
Bruun, P. 1988. Profile nourishment: its background and economicadvantages. Journal of Coastal Research, 4(2):219-228.
Folk, R. L. 1980. Petrology of Sedimentary Rocks. Hemphill Publishing Co.Austin, TX.
Hallermeier, RJ. 1981. Seaward Limit of Significant Sand Transport byWaves: An Annual Zonation for Seasonal Profiles. Coastal EngineeringTechnical Aid No. 81-2, U.S. Army Corps of Engineers,Coastal EngineeringResearch Center, Vicksburg, MS.
McAneny, D.S. 1986. Sea-State Engineering Analysis System (SEAS),Supplement I. WIS Report 10, US Army Corps of Engineers, WaterwaysExperiment Station. Vicksburg, MS.
McLellan, T. N. 1990a. Nearshore moundconstruction usingdredgedmaterial.Journal of Coastal Research, Spec. Issue 7:99-107.
. 1990b. International Applications of Nearshore Berms. BeneficialUses of Dredged Material in the Western United States, US Army Corps ofEngineers, Waterways Experiment Station, Vicksburg, MS.
andC.E. Burke. 1988. Site SelectionforNearshore Berm Construction,South Padre Island, Texas. US Army Corps of Engineers, WaterwaysExperiment Station, Vicksburg, MS.
Medina, R. US Army Engineer District, Galveston. Galveston, TX.
Morton, RA and MJ. Pieper. 1975. Shoreline Changes on BrazosIsland andSouth Padre Island (Mansfield Channel to the Rio Grande); An Analysis ofHistorical Changes of the Texas GulfShoreline. Bureau of Economic Geology,The University of Texas at Austin, Austin, TX.
Schneider, C. 1981. The Littoral Environment Observation (LEO) DataCollection Program. Coastal Engineering Technical Aid No.81-5, U.S. ArmyCorps of Engineers, Coastal Engineering Research Center, Vicksburg, MS.
Woodhead, P.MJ. and AJ. Lee. 1960. A new instrument for measuringresidual currents near the sea-bed. International Council for the Explorationof the Sea, vol. 12.
635

FIgura 1. Haarahora ban conaeiuctlon alta, Bcazoa-Santiago Paas. TX
0 300 tOOO 1300 2000 2300 3009 3300DISTANCE (fO
FIgura 2. Croaa section Brazoa-Santlago Paas noarshora bora.
636

Distribution Analysis or Heavy Minerals on the Inner Continental Shelf ofVirginia
Hakan OzalpasanVirginia Institute of Marine Science
Abstract
Based on analysis of the 3-4 phisize (very fine sand) fraction of 129surficial heavy mineral samples, three different local source areas of heavyminerals were identified using Q-mode factor analysis. This area has a highpotential for heavymineral resources and is locatedwithin 15 km off shore ofthe Atlantic side of the southern Delmarva Peninsula. The heavy mineralanalyses were concerned only with the movable, non-cohesive, upper layer ofbenthic sediment (0-20 cm). Q-mode factor analysis was performed on theheavy mineral data matrix, which consisted of 129 samples (observations) and7 minerals (variables). A 3-factor solution accounted for 98.0% of the variancein the entire set of data and provided a geologically suitable model. The firstfactor (consisting mainly of amphibole, pyroxene, and epidote) indicatedChesapeake Bay as a possible source for amphibole, and pyroxene;concentrations of theseminerals decreased from inside the baymouth to offshore. Thesecond factor (consisting mainly of zircon, garnet, and amphibole)showed that the southern part of the bay mouth and approximately 4 kmsoutheast off Wachapreaque Inlet are potential sources for zircon andgarnet.The third factor (consisting of mainly garnet, amphibole, and zircon) indicateda bayward influx of sediments from the adjacent shelf, and also the easternshore of Delmarva Peninsula as a source for garnet, amphibole and zircon.This factor may be an indicator of the southerly long-shore drift of thesediments by current and wave action. Although 2-,4- and 5- factor solutionswere also applied to explain the regional variability and local source areas ofheavy minerals, a 3-factor solution was selected because better mathematicalresults were obtained from this solution to explain geologically meaningfuldistribution patterns.
Introduction
The heavy mineral associations in fluvial sedimentary sequences havebeenstudied asaguide to source rock lithologics, dispersal patterns, erosionalweathering, and tectonic history of their source area. Potentially economicconcentrations of placer heavy minerals have been reported in the innercontinental shelf deposits of the southern Delmarva Peninsula (Figure 1) byGoodwin and Thomas (1973), Grosz and Escowitz (1983), and Berquist andHobbs (1988). The objectives of this study are: (1) to determine the regionalvariations of heavy minerals in post-Wisconsinan sands of the inner shelf ofthe southern Delmarva Peninsula; (2) to establish the locations andinfluencesof multiple local sources (if any) of heavy minerals; and (3) to review
637

sediment transport pathways by examining distribution patterns of heavyminerals along the area of interest.
Physical Setting
The study area is located along the Middle Atlantic Bight in thevicinity of the Eastern Shore of Virginia, between latitude 37'00"N and 3749"N, longitude 75*30" W and 76*10" W. It is about 50 km long and extends upto 15 km offshore from the Delmarva Peninsula. Along the Atlantic coast ofthe southern Delmarva Peninsula, tides are semi-diurnal and the mean tiderange is about 1.0 m (Harrison, 1972). Surficial sediments consist basicallyof(1) greycolored, rounded, well-sorted fine sand and (2) poorly-sorted, rich inshell, medium-to-course sand (Nichols, 1972). The coastal plain strata dipgently eastward and unconformably overlay Precambrian to Triassic Agecrystalline rocks (Shideler et al., 1984). The circulation of shelf water offVirginia's coast causes a significantbottom drift of shelf sediments. Althoughthere are areal and seasonalvariations, this drift tends to move southwesterlyand causes large amounts of surficial sediments to move (Harrison et al.,1967). The geology of the mainland adjacent to the study area has beendescribed by Mixon (1985). He found the unconsolidated, Quaternary sand,gravel, silt, clay, and peat deposits (2-60 m thick) unconformably overlayapproximately 100m-thick, more consolidated,upper Tertiary glauconiticsandand clay-silt deposits in the surface and subsurface sediments of the southernDelmarva Peninsula.
Methodology and Data Analysis
Laboratory Techniques
In this study, the heavy mineral analysesare concerned only with themobile, non-cohesive, upper layer of benthic sediment (about 0-20 cm). Onehundred twenty nine samples (13 core and 116 grab) were selected for theparticular area of interest (Figure 2). Only the top portion (0-20 cm) of thecore samples was analyzed.Recently, a detailed report has been published byBerquist and Hobbs (1988), explaining the spiral, heavy liquid and magneticseparation, concentration, and sample preparation of the heavy mineralsamples used in this study. As an average, 0.75 g of each concentrated heavymineral sample was sieved to obtain the 3-4 phi (0.125-0.063 mm) sizefraction. The 3-4 phi (very fine sand) size fraction was chosen to eliminatevariations in concentrations due to selective sorting of minerals. Smallamounts of recovered heavy mineral samples (about 0.2 g) were mounted onglass slides by using Caedax medium as a glue (R.I.= 1.56). The slides werepoint-counted under a petrographic microscope to estimate the abundancesof 17 transparent minerals as well as opaques. More than 200 transparentgrains (average 210) were identifiedalongthe random line traverses on eachslide. The abundances of each mineral in each sample were calculated as the
638

grain percentage. Seven minerals were chosen to apply Q-mode factor analysisamong the 17 transparent minerals by Principal Component Analysis(Berquist, 1986; Davis, 1986): zircon; sphene; amphibole; epidote; staurolite;pyroxene; andgarnet. Finally, based on the abundances of 7 transparent heavyminerals and 129 samples, the raw-data matrix was ready to apply Q-modefactor analysis.
Q-mode Factor Analysis
In this study, an advanced mathematical procedure, Q-mode factoranalysis, was performed to find the most compositionally-extreme samples(end-members) in the data set,which mayrepresent potential source areas ofheavy minerals. As heavy minerals arrive into a basin from various sources,they are mixed into new proportions. If this is an ancient system and we arerelying on core samples, and ourobjective is to find the sources of theseheavyminerals, we would not know how many sources (end-members) there are.Q-mode factor analysis has the potential of finding these end-members(Berquist, 1986). The results of Q-mode factor analysis indicate how much ofeachend-member (factor) is present in each sample. Once a suitable numberof factors hasbeen determined, composition gradients for each end-membercanbe established by contouring the percentage of the factor in each sample(Hobbs et al., 1986). The resulting distribution patterns suggest sedimenttransport directions. In this research, 3 advanced computer programs wereused to analyze multi-variate compositional data: (1) CABFAC wasdevelopedby Klovan and Imbrie (1971); (2) QMODEL was written by Klovan andMiesch (1976) to extend the capability of the CABFAC program; and (3)EXQMODEL (Extended QMODEL) was revised from the QMODELprogram by Full et al., (1981). The Extended Q-model program defines thecompositionally-most extreme samples, which are considered end-members.In QMODEL and EXQMODEL, the oblique solution was selected (yieldingreal samples as the extreme end-members) by selecting the Option-3.
Results and Discussion
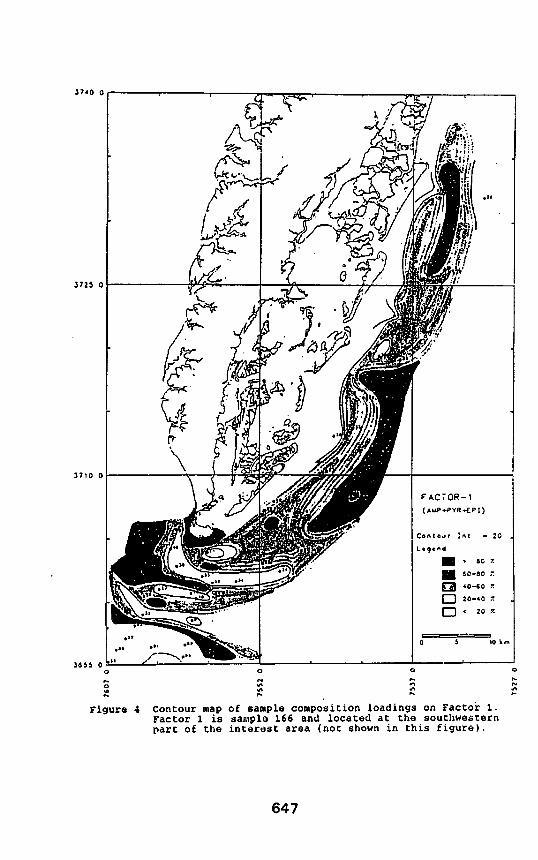
The 3-factor solution accounted for 98.0% of the total compositionalvariation of samples, showed high communalities (average communality was0.97) and high diagonal values on the extreme normalized sample loadingmatrix, gave high coefficients of determination, and provided the mostgeologically suitable model, because there was no redundancy in eithercomposition or location of the end-membersamples aswasseen on the 4- and5-factor solutions (Figure 3).The 2-factor solution wasrejected because only963% of the compositional informationwasexplained and sample projections(factor loadings) were interdependent(when loadings on one factor increased,loadmgs on the other factor decreased). Factor 1 is composed mainly ofamphibole, then pyroxene and epidote (Figure 4). As it shows easterly(offshore) decreasing concentrations of heavy minerals southwest of
639

Fisherman Island,this could be an indicationfor the offshore transport of bayoriginated amphibole, pyroxene, and epidote. High concentrations ofamphibole and pyroxene northeast of Smith Island are most probably relatedwith the troughs of the sand shoals, as Goodwin and Thomas (1973) andRowland (1988) mentioned. Factor 2 is composed of mainly zircon, thengarnet and amphibole (Figure 5). The concentrations of these mineralsdecrease seaward. This indicates that erosion of the Eastern Shore and itstributaries.and of the channel-levee systems between barrier islands,(especially by the winter storms) may be local sources for zircon and garnetas can be seen off Parramore Island (Rice and Leatherman, 1983). Factor 3is rich in garnet, and also includes amphibole and zircon (Figure 6). Thisend-member is located about 3 km southeast of Fisherman's Island. It shows
high concentrations of garnet and amphibole around the bay mouth area thatdecrease westerly (bayward). This might reflect a bayward influx of adjacentlittoral and shelf sediments by coastal erosion as Berquist (1986) suggested.Factor 3 indicates a high concentration area about 5 km north east of QuinbyInlet. These more mature minerals like zircon and garnet might be derivedfrom Delaware Bay estuary, the northeastern part of Delmarva peninsula,and/or sand-shoal deposits around Quinby Inlet. The composition gradientsof Factor 3 are spotty, but show a possible tendency to decrease in a southerlydirection. Consequently, southward transport of inner shelf sediments alongthe eastern shore of the Delmarva Peninsula may be suggested. The patternsare slightly different around the bay mouth. Higher concentrations of garnetand amphibole off Fisherman's Islanddecrease bayward. Therefore, isoplethsof the 3-factor solution show a tendency of sediment movement into the bayaround Fisherman's Island.
Summary and Conclusions
The mathematical resultsand geological interpretations of the factormaps of 129 surficial samples of heavy minerals taken from the innercontinental shelf off the southern Delmarva Peninsula indicated three different
heavy mineral associations. Factor 1 suggested off shore movement ofamphibole, pyroxene, and epidote mineral associations originating inChesapeake Bay. Factor 2 provided a relatively homogeneous distributionpattern, but suggested Chesapeake Bay and an area approximately 4 kmsoutheast of Wachaprcaque inlet as potential sources for zircon, garnet, andamphibole. Factor 3 showed a landward sediment transport from the shelfadjacent to the bay mouth and from approximately 5 km southeast of HogIsland.
In conclusion, heavy minerals on the inner continental shelf of thesouthern Delmarva Peninsula exhibit regional variations under the effects ofmodern hydrodynamic processes and circulation patternsof continental shelfwaters. Their concentration isopleths tend to parallel the present coastline.These regional variation patternsare producedby sediment dispersal from (1)
640

the northern Delmarva Peninsula due to southerly longshore transport ofsediments, (2) barrier islands of the Delmarva Peninsula, especially fromsandy beaches and inlets along the coastline by the effects of severe winterstorms, (3) relict, reworked, possibly Pleistocene age more mature innercontinental shelf sediments, associated with linear offshore sand shoals, and(4) Chesapeake Bay sediments deposited during the post-Wisconsinan timeinterval. Results of this study may have the potential to help answer manyquestions relevant to future explorations of economic placer deposits, thepreservation of beaches andwetlands, sediment budget investigations, and anunderstanding of estuarine and near-shore sedimentary processes along theinner continental shelf of Virginia.
641

References
Berquist, C.R., Jr. 1986. Stratigraphy and Heavy MineralAnalysis in the lowerChesapeake Bay, Virginia. Unpublished doctoral dissertation. School ofMarine Science, The College of William and Mary, Williamsburg, Virginia.
, and C.H. Hobbs, III. 1988. Reconnaissance of Economic HeavyMinerals of the Virginia Inner Continental Shelf. Virginia Division of MineralResources open-file report, 88-1.
Davis, J.C. 1986.Statistics and Data Analysis in Geology. John Wiley & sons,New York. 646 p.
Full, W.E., R. Ehrlich, and J.E. Klovan. 1981. Extended Q-model. Journal ofInternat. Assoc. Mathematical Geology, 13(4): 331-344.
Goodwin, B.K. and J.B. Thomas. 1973. Inner Shelf Sediments off ChesapeakeBay: Heavy Minerals. Special Scientific Report, 68, Virginia Institute ofMarine Science, Gloucester Point, VA.
Grosz, A.E. and E.C. Escowitz. 1983. Economic heavy minerals of the U.S.Atlantic continental shelf. Pages 231-242. Jn: W.F. Tanner (ed.), Proceedingsof the Sixth Symposium on Coastal Sedimentology. Florida State University,Tallahassee, Florida.
Harrison, S.C. 1972. The Sediments and Sedimentary Processes of theHolocene Tidal Flat Complex, Delmarva Peninsula,Virginia. Louisiana stateUniversity, Coastal Studies Institute, Technical Report 112, Baton Rouge,Louisiana.
Harrison, W., JJ. Norcross, NA. Pore, and EM. Stanley. 1967. Circulationof shelf waters off the Chesapeake Bight. Environ. Sci. Serv. Adm. Prof.Paper, 3, U.S. Dep. of Comm., Washington, D.C.
Hobbs, C.H., III, S.M. Colman, and C.R. Berquist, Jr. 1986.Sandy estuarinefill transported into the mouth of Chesapeake Bay. Pages 180-198. Jn: W.F.Tanner (cd.), Suite Statistics and Sediment History. Proc. of the 7th symp. onCoastal Sedimentology, Florida State University, Tallahassee, Florida.
Joreskog, K.G.,J.E. Klovan, RA. Reyment. 1976. Geological Factor Analysis.Elsevier Scientific Publishing Comp., New York. 178 p.
Klovan, J.E., and J. Imbrie. 1971.An algorithm and Fortran-IV program forlarge scale Q-mode factor analysis and calculation of factor scores.Journal ofthe Internat. Assoc. Mathematical Geology, (3) 1: 61-77.
642

, and A.T. Miesch. 1976. Extended CABFAC and QMODELcomputer programs for Q-mode factor analysis of compositional data.Computers & Geosciences, 1(3):161-178.
Mixon, R. B. 1985. Stratigraphic and geomorphic framework of uppermostCenozoic deposits in the southern Delmarva peninsula. U.S.G.S. ProfessionalPaper, 1067-G, 604 South Pickett Street, Alexandria, Virginia. 53 p.
Nichols, M.M. 1972. Inner Shelf Sediments off Chesapeake Bay: I: GeneralLithology and Composition. Special Scientific Report No. 64, Virginia Instituteof Marine Science, Gloucester Point, Virginia. 20 p.
Rice, T.E. and S.P. Leatherman. 1983. Barrier island dynamics: the easternshore of Virginia. Southeastern Geology, 24:125-137.
Rowland, TJ. 1988. Availability of mineral deposits offshore Virginia.Minerals Management Service, Office of Strategic & International Minerals,Vienna, Virginia. 12 p.
Shideler, G.L., J.C. Ludwick, G.F. Oertel, and K. Finkelstein, 1984.Quaternary stratigraphic evolution of thesouthern Delmarva peninsula coastalzone, Cape Charles, Virginia. Geological Society of America Bulletin,95:489-502.
643

FKIJTOCCHC
SOUTHERN DELMARVA PENINSULA*Vr II •*(« MAMS fl.
Figure 1 Index map of the study area on the Atlantic coast ofsouthern Delmarva Peninsula. inset map shows Delmarvapeninsula between Delaware and Chesapeake Bay estuaries(from Harrison, 1972).
644

Flouro 2 loc«l0n^ ,„ ,rrt mjM, #»lbrje«. jjjjp,.. In and
645

O)
o>
to01nft>aoSBS
•ot-v*-•*<oAnnnK"H-•nrt
oo
n
Co
ȣtBsf
H-Opjrr
•"2
o£A™°P.***
3?aB
I?o
a*
toLUIEooCO
zo
to
On.
OO
7Q0
-JQO'
COMPOSITIONSCORESOFFACTORS
(3-FACTORSOLUTION)
FACT0n-1(«<p>m.i?i)
f»CTOR-2
FACTORS
(END-MEMBERS)
(ACTOH-3
MINERALS:
•IzncoNHffiSPHEWE
HHAMPHIBOLEHipEPIDOTEE^STAUROUTE
PUBPYROXENEgglGARNET
J740 0
Figure 4 contour map of sample composition loadings on Factor 1.Factor 1 is sample 166 and located at the southwesternpart of the interest area (not shown in this figure).
647

3723
Figure 5 contour map of sample composition loadings on Factor 2.Factor 2 is sample G84 and located at the southernmostpart of the interest area (not shown in this figure).
648

Figure6
Contour
map
of
samplecomposition
loadingson
Factor
3.Factor
3is
sample
145
and
located
at
near
Fisherman's
Island.
649