security draft asset management strategy
TRANSCRIPT
B O N N E V I L L E P O W E R A D M I N I S T R A T I O N
SECURITY ASSET MANAGEMENT STRATEGY
FY2017 - 2030
R. ALTOMARE APRIL 2017
Security Asset Management Strategy
B O N N E V I L L E P O W E R A D M I N I S T R A T I O N
2
TABLE OF CONTENTS Executive Summary ....................................................................................................................... 3
Security Asset Management ....................................................................................................... 9
Overarching Strategy .................................................................................................................... 9
1. Asset Management Goals, Objectives, Initiatives and Risks........................... 10
1.1 Goals ........................................................................................................................................... 10
1.2 Objectives .................................................................................................................................... 10
1.3 Strategic Initiatives ..................................................................................................................... 11
1.4 Strategic Challenges .................................................................................................................... 12
1.5 Strategic Constraint .................................................................................................................... 12
2. Asset Category Overview .............................................................................................. 13
2.1 Definition ..................................................................................................................................... 13
2.2 Primary Asset Types and Groupings............................................................................................ 13
2.3 Service Provided .......................................................................................................................... 14
2.4 Criticality Rating .......................................................................................................................... 14
2.5 Roles and Responsibilities ........................................................................................................... 16
2.6 Metrics ........................................................................................................................................ 17
3. Investment Recommendations - Capital ................................................................ 17
3.1 NERC CIP Version 5 Compliance Enhancements Completion ..................................................... 18
3.2 Protection of Tier 1 Sites ............................................................................................................. 18
3.3 Protection of Tier 2 Sites ............................................................................................................. 18
3.4 Protection of Tier 3 Sites ............................................................................................................. 19
3.5 Protection of Tier 4 Sites ............................................................................................................. 19
3.6 Proposed Capital Plan for FY2017 – FY2030 ............................................................................... 20
4. Investment Recommendations - Expense ............................................................. 20
5. Summary of Recommended Investments .............................................................. 21
Appendix A - Risk Reduction .................................................................................................. 22
Security Asset Management Strategy
B O N N E V I L L E P O W E R A D M I N I S T R A T I O N
3
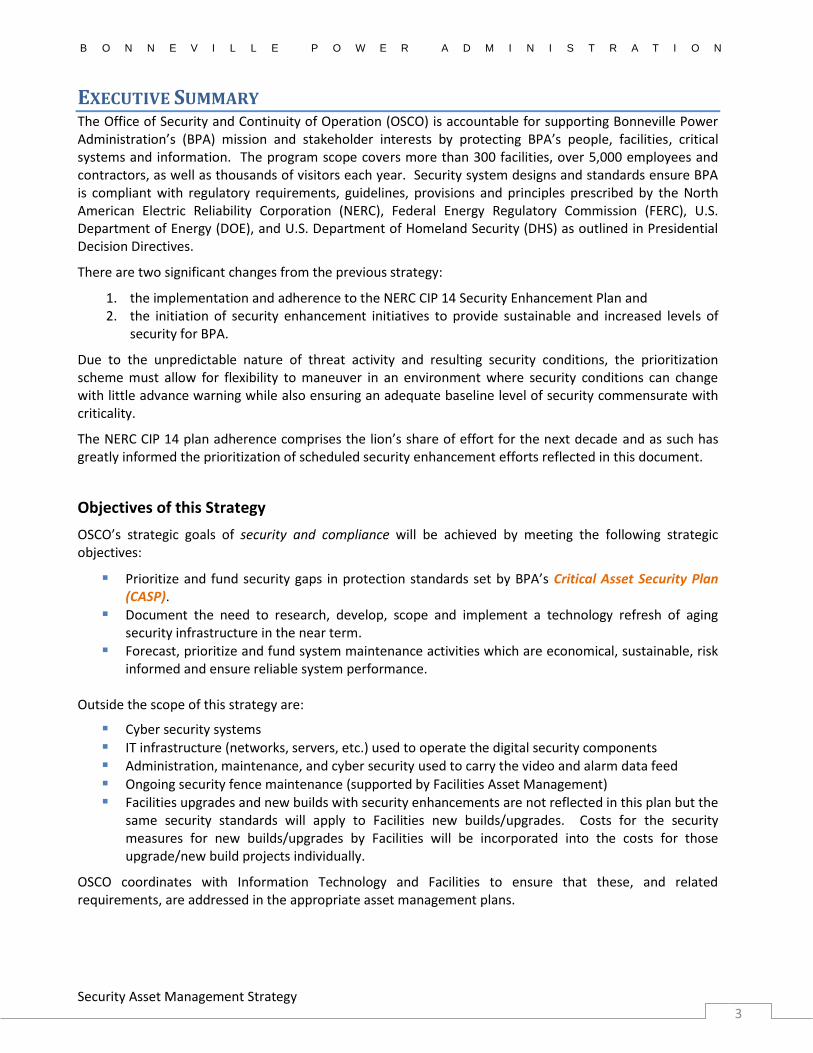
EXECUTIVE SUMMARY The Office of Security and Continuity of Operation (OSCO) is accountable for supporting Bonneville Power Administration’s (BPA) mission and stakeholder interests by protecting BPA’s people, facilities, critical systems and information. The program scope covers more than 300 facilities, over 5,000 employees and contractors, as well as thousands of visitors each year. Security system designs and standards ensure BPA is compliant with regulatory requirements, guidelines, provisions and principles prescribed by the North American Electric Reliability Corporation (NERC), Federal Energy Regulatory Commission (FERC), U.S. Department of Energy (DOE), and U.S. Department of Homeland Security (DHS) as outlined in Presidential Decision Directives.
There are two significant changes from the previous strategy:
1. the implementation and adherence to the NERC CIP 14 Security Enhancement Plan and 2. the initiation of security enhancement initiatives to provide sustainable and increased levels of
security for BPA.
Due to the unpredictable nature of threat activity and resulting security conditions, the prioritization scheme must allow for flexibility to maneuver in an environment where security conditions can change with little advance warning while also ensuring an adequate baseline level of security commensurate with criticality.
The NERC CIP 14 plan adherence comprises the lion’s share of effort for the next decade and as such has greatly informed the prioritization of scheduled security enhancement efforts reflected in this document.
Objectives of this Strategy
OSCO’s strategic goals of security and compliance will be achieved by meeting the following strategic objectives:
Prioritize and fund security gaps in protection standards set by BPA’s Critical Asset Security Plan (CASP).
Document the need to research, develop, scope and implement a technology refresh of aging security infrastructure in the near term.
Forecast, prioritize and fund system maintenance activities which are economical, sustainable, risk informed and ensure reliable system performance.
Outside the scope of this strategy are:
Cyber security systems IT infrastructure (networks, servers, etc.) used to operate the digital security components Administration, maintenance, and cyber security used to carry the video and alarm data feed Ongoing security fence maintenance (supported by Facilities Asset Management) Facilities upgrades and new builds with security enhancements are not reflected in this plan but the
same security standards will apply to Facilities new builds/upgrades. Costs for the security measures for new builds/upgrades by Facilities will be incorporated into the costs for those upgrade/new build projects individually.
OSCO coordinates with Information Technology and Facilities to ensure that these, and related requirements, are addressed in the appropriate asset management plans.
Security Asset Management Strategy
B O N N E V I L L E P O W E R A D M I N I S T R A T I O N
4
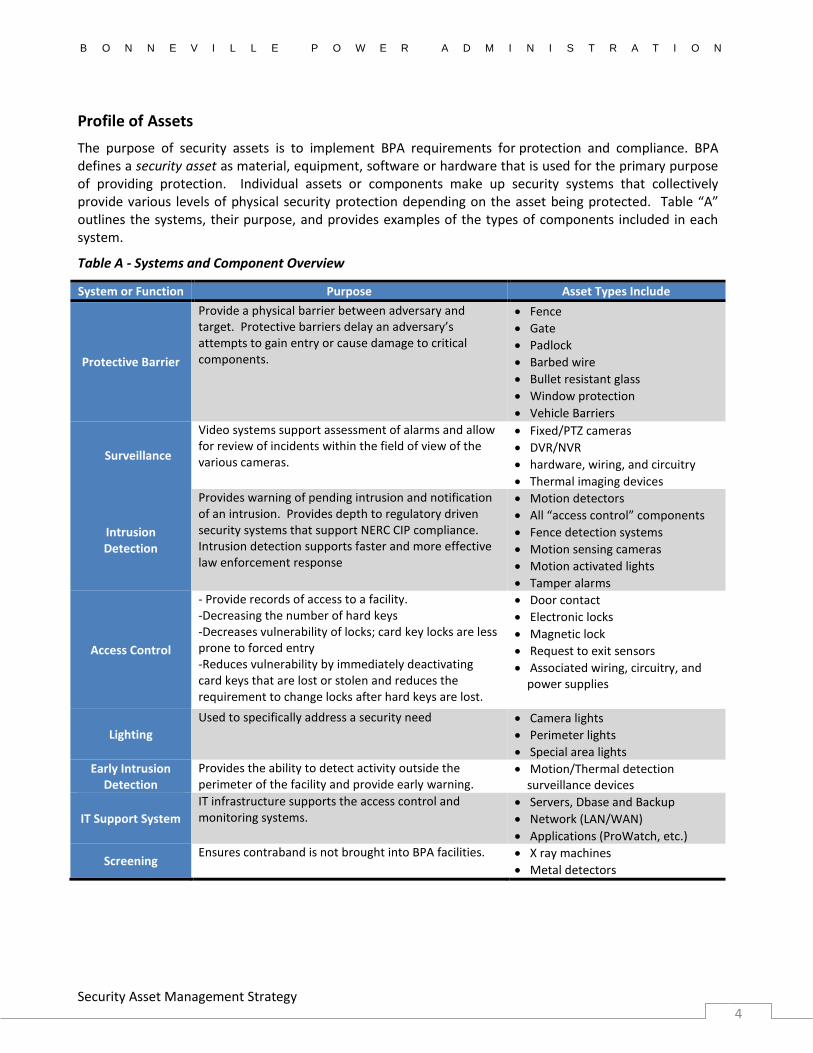
Profile of Assets
The purpose of security assets is to implement BPA requirements for protection and compliance. BPA defines a security asset as material, equipment, software or hardware that is used for the primary purpose of providing protection. Individual assets or components make up security systems that collectively provide various levels of physical security protection depending on the asset being protected. Table “A” outlines the systems, their purpose, and provides examples of the types of components included in each system.
Table A - Systems and Component Overview
System or Function Purpose Asset Types Include
Protective Barrier
Provide a physical barrier between adversary and target. Protective barriers delay an adversary’s attempts to gain entry or cause damage to critical components.
Fence
Gate
Padlock
Barbed wire
Bullet resistant glass
Window protection
Vehicle Barriers
Surveillance
Video systems support assessment of alarms and allow for review of incidents within the field of view of the various cameras.
Fixed/PTZ cameras
DVR/NVR
hardware, wiring, and circuitry
Thermal imaging devices
Intrusion Detection
Provides warning of pending intrusion and notification of an intrusion. Provides depth to regulatory driven security systems that support NERC CIP compliance. Intrusion detection supports faster and more effective law enforcement response
Motion detectors
All “access control” components
Fence detection systems
Motion sensing cameras
Motion activated lights
Tamper alarms
Access Control
- Provide records of access to a facility. -Decreasing the number of hard keys -Decreases vulnerability of locks; card key locks are less prone to forced entry -Reduces vulnerability by immediately deactivating card keys that are lost or stolen and reduces the requirement to change locks after hard keys are lost.
Door contact
Electronic locks
Magnetic lock
Request to exit sensors
Associated wiring, circuitry, and power supplies
Lighting
Used to specifically address a security need Camera lights
Perimeter lights
Special area lights
Early Intrusion Detection
Provides the ability to detect activity outside the perimeter of the facility and provide early warning.
Motion/Thermal detection surveillance devices
IT Support System
IT infrastructure supports the access control and monitoring systems.
Servers, Dbase and Backup
Network (LAN/WAN)
Applications (ProWatch, etc.)
Screening Ensures contraband is not brought into BPA facilities. X ray machines
Metal detectors
Security Asset Management Strategy
B O N N E V I L L E P O W E R A D M I N I S T R A T I O N
5
Strategic Challenges
There are two main challenges which must be overcome for successful implementation of this strategy:
Rapidly evolving regulatory requirements
NERC CIP 14 is accepted as the latest NERC requirement to implement increased security at critical locations within BPA’s footprint. As such, this Security Asset Management Strategy is crafted to respond to and implement the NERC CIP 14 security enhancement requirement. If a new security standard is deployed that BPA must comply with, this strategy may need to be revisited and revised.
Aging and technologically obsolete systems
Large numbers of systems (primarily cameras) are projected to fail in the coming years due to exceeding manufacturer-recommended Mean Time to Failure (MTTF). If not managed, this may impact security system effectiveness, cause a spike in maintenance fees and drain limited resources.
BPA’s OSCO proposes a technology refresh to leverage new technology that can be sustained over the long term. In accordance with policy, the technology refresh initiative will not be executed with capital, but rather expense, funds. The need for this initiative, while not captured in this strategy document’s capital plan, is necessary nonetheless.
Major Constraint of this Strategy
OSCO has re-prioritized its capital expenditures and extended its timeline for capital project completion in response to external, downward budgetary pressures which has resulted in a less-than-optimal schedule. Relative priorities for addressing security vulnerabilities at BPA substations were also forced to be ignored in some instances (but maintained as much as possible) to respond to the downward pressures placed upon OSCO.
Major Elements of the Strategy
Prioritization
When prioritizing, several factors are considered:
Real-time security threat information, including increased rates of security-related incidents Regulatory mandates The criticality of the facility Criticality of a system or components Efficiencies to be gained
Strategic initiatives
Three categories have been identified for meeting OSCO’s strategic objectives and reducing a variety of security and operational risks. Table “B” summarizes each category and estimates the risk exposure from forgoing or delaying implementation.
Security Asset Management Strategy
B O N N E V I L L E P O W E R A D M I N I S T R A T I O N
6
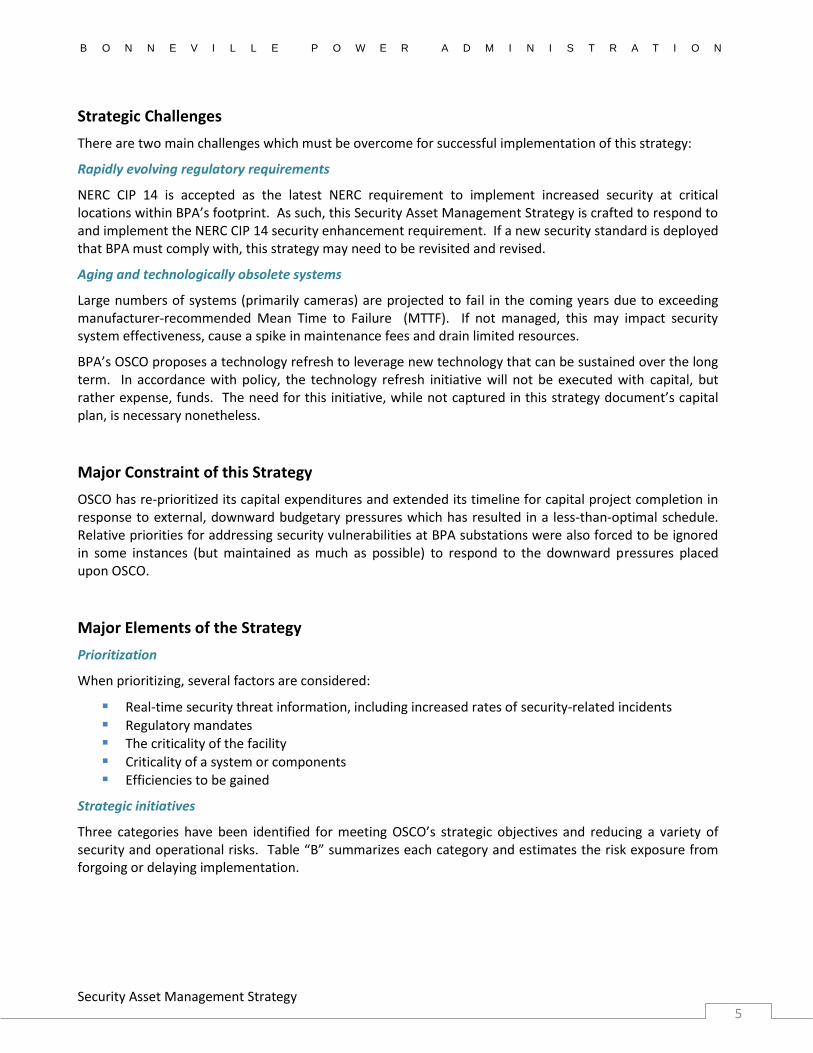
Table B - Strategic Initiatives, Risks and Costs
Drivers Initiatives Risks of Forgoing Implementation FY17-30
Capital / Expense
Tie
red
Se
curi
ty E
nh
ance
men
ts (
DO
E &
CIP
14
-dri
ven
)
( Ti
ers
I, II
, III
, IV
)
NERC CIP 14 more closely links security and compliance resulting in a single total; a difference from the previous IPR.
1. Compliance (NERC CIP v5)
Ensure compliance with security regulation by applying mandatory security enhancements as required by NERC, DHS, DOE, etc.
2. Critical Infrastructure Protection
Installation of security systems designed to provide the appropriate level of protection for critical infrastructure designated Tier 1, Tier 2, Tier 3 or Tier 4.
Financial and Reputational Risk Due to Regulatory Non-Compliance: Findings by regulatory entities within one year leading to; a) possible financial sanctions, b) mandated policy changes and, c) public criticism.
Financial and Operational Risk Due to Terrorist/Criminal Activity: Continual exposure to the “medium risk” of terrorist attack or collateral damage from criminal activity which could result in the loss of critical transmission facilities with; a) an extreme consequence to the bulk electric system, b) major economic impact to regional customers and economy and, c) severe observable impact and orders for substantial corrective action, including some mandatory changes in BPA operation or administration.
This includes Capital Projects currently scheduled for the years FY17-FY30.
$84.4M
Imm
ed
iate
Th
reat
Mit
igat
ion
Immediate Threat Mitigation:
Provides agility to respond to emerging threat vectors or respond in a timely and expeditious manner to previously unknown security gaps at BPA facilities, with appropriate capital investments.
This strategy allows BPA to confront the unpredictable nature of threats and resulting security conditions. Not programming funds toward this end removes the flexibility to maneuver in an environment where security conditions can change with little advance warning. This ensures adequate baseline level of security commensurate with criticality to include avoidance of financial, reputational, and/or operational risks to non-compliance, terrorist, or criminal activities.
$7.0M
Pre
ven
tati
ve M
ain
ten
ance
Pro
gram
5. Replacement & Renewal Program
Timely replacement of failed components commensurate with criticality of system to maintain compliance and provide protection. Strategic phase-out of components no longer technological viable.
Operational and Reputational Risk Due to Inadequate Maintenance: Failing or faulty security systems and equipment leading to; a) compromised protection of critical infrastructure, b) strain on limited resources to support O&M activity and, c) criticism by regulatory entities due to unplanned outages of critical security systems.
$11.9M
Total $91.4M $11.9M
Security Asset Management Strategy
B O N N E V I L L E P O W E R A D M I N I S T R A T I O N
7
Results to be Achieved
BPA and its stakeholders can expect ongoing compliance with requirements, improved critical site protection and reliable security system performance.
Compliance
Success in maintaining security compliance will be measured by BPA having zero violations of a NERC requirement as a result of lacking security systems or underperformance of existing systems. Violations count only when not previously self-reported and assigned a low to moderate Violation Risk Factor (VRF) and Violation Security Level (VSL) as identified by a regulatory audit or investigation.
Protection
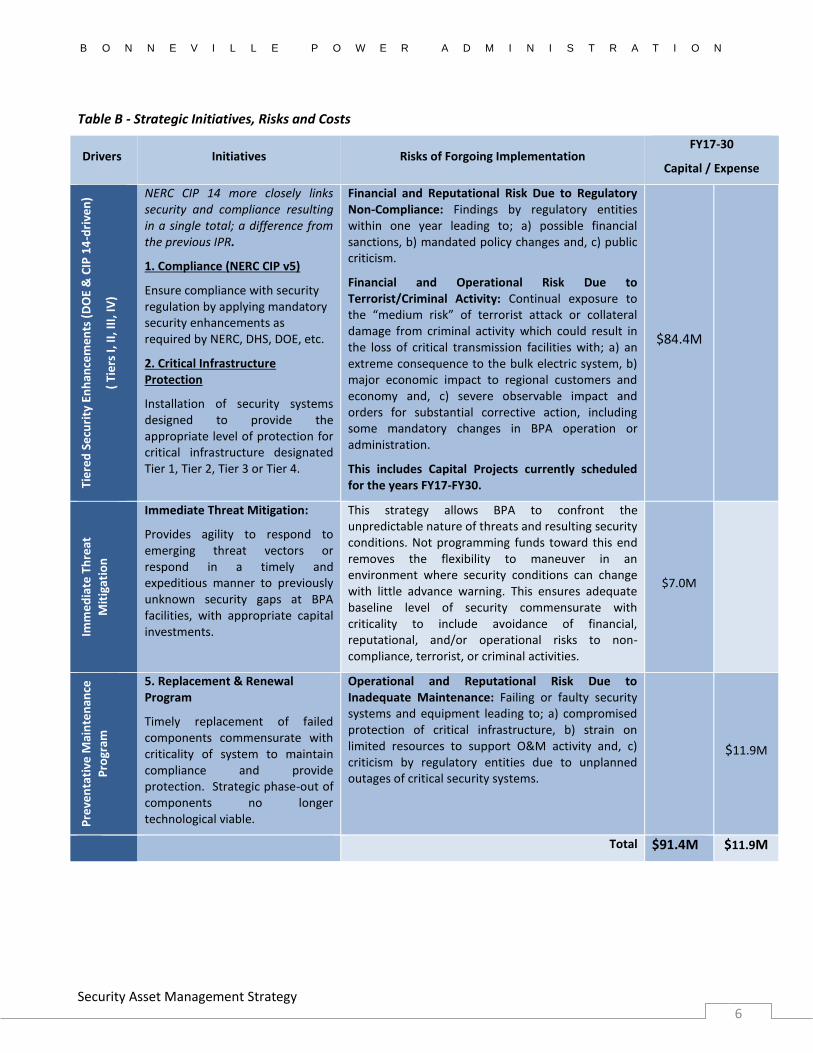
By the end of 2017 five additional Tier 2 critical substations will have security enhancements installed, which will result in a notable reduction in risk. Table “C” shows the estimated risk reduction to be gained as a result of the proposed implementation.
Table C - Estimated Security Risk Impact - Tier 2 Protection
Before Tier 2 Treatment After Tier 2 Treatment
Threat Risk Numerical
Risk Range Risk Numerical
Risk Range % Risk Reduction
International Terrorist 0.49 Medium 0.42 Medium 7%
Eco Terrorist / Special Interest 0.45 Medium 0.36 Medium 9%
Criminal Activity 0.45 Medium 0.2 Low 25%
Vandal 0.4 Medium 0.18 Low 22%
Insider 0.13 Low 0.13 Low 0%
Note: A complete explanation of the risk analysis is provided in Appendix A
Spending Levels
Proposed capital plan for FY 2017 - FY 2030
Note: This strategy document reflects a modified schedule and timeline per external budgetary constraints. Internal budgeting decisions and processes (Integrated Program Review, etc.) have mandated a modified funding plan with particular attention paid to the FY17-19 horizon which has affected capital project prioritization and an extension of an optimal 10-year timeline to a 15-year timeline. Out-year funding levels for FYs beyond FY19 will be revisited during subsequent CIR processes.
Table D - Proposed Capital Plan ($000s)

Security Asset Management Strategy
B O N N E V I L L E P O W E R A D M I N I S T R A T I O N
8
BPA’s OSCO is proposing a capital model which funds:
Immediate Threat Mitigation providing agility and contingency in the event of immediate need for capital expenditures in response to immediate threats posed to BPA.
NERC CIP v5 required protection place holder funding at $500,000 for FY17 Graded security and critical infrastructure protection at Tier 1, 2, 3 and 4 sites
Proposed expense plan for FY 2017 - FY 2030
Security systems at transmission sites are funded by Transmission Field (TF) budget, while systems installed at headquarters building are paid for out of the Corporate cost center. The proposed spending level for each category is outlined in Table “E.”
Transmission System Maintenance funding as depicted in Table E provides estimates for FY17 and applies inflation to years beyond FY17. These amounts do not reflect any increased workload as new sites transition from warranty-covered maintenance to internally covered maintenance efforts.
Table E - Expense Plan for Security System Maintenance from FY 2017–FY 2030 ($000s)
Summary
This Security Asset Management Strategy seeks to balance compliance and security enhancement / modernization initiatives to provide BPA with the most risk appropriate security while applying sound asset management principles and efficiencies to maximize the use of ratepayer dollars.
Initiative 2017 2018 2019 2020 2021 2022 2023 2024 2025 2026 2027 2028 2029 2030 Total
Prev Mx and Inventory 162.0 165.4 168.9 172.4 176.0 179.7 183.5 187.4 191.3 195.3 199.4 203.6 207.9 212.3 2,605.2
Break Fix Maintenance 468.0 477.8 487.9 498.1 508.6 519.2 530.2 541.3 552.7 564.3 576.1 588.2 600.6 613.2 7,526.0
TRANS - SUB TOTAL 630.0 643.2 656.7 670.5 684.6 699.0 713.7 728.7 744.0 759.6 775.5 791.8 808.4 825.4 10,131.2
Prev Mx and Inventory 20.0 24.2 29.3 35.4 42.9 51.9 62.8 76.0 91.9 111.2 134.6 162.8 197.0 238.4 1,278.4
Break Fix Maintenance 32.0 32.7 33.4 34.0 34.8 35.5 36.3 37.0 37.8 38.6 39.4 40.2 41.0 41.9 514.6
CORP - SUB TOTAL 52.0 56.9 62.7 69.4 77.7 87.4 99.1 113.0 129.7 149.8 174.0 203.0 238.0 280.3 1,793.0
TOTAL 682.0 700.1 719.4 739.9 762.3 786.4 812.8 841.7 873.7 909.4 949.5 994.8 1,046.4 1,105.7 11,924.2
TRANSMISSION FUNDS
CORPORATE FUNDS
Security Asset Management Strategy
B O N N E V I L L E P O W E R A D M I N I S T R A T I O N
9
SECURITY ASSET MANAGEMENT OVERARCHING STRATEGY
Security Asset Management Strategy
B O N N E V I L L E P O W E R A D M I N I S T R A T I O N
10
1. ASSET MANAGEMENT GOALS, OBJECTIVES, INITIATIVES AND RISKS
1.1 Goals
The goal of the Security Infrastructure Asset Management Strategy is to establish a prioritization strategy for both initial security system deployment and subsequent life-cycle maintenance to address the ever- changing security threats and compliance requirements, while balancing sound business and asset management principles, ensuring the following long-term outcomes:
Compliance – BPA is in compliance with all security requirements (e.g., NERC CIP, HSPD-12, DOE’s Graded Security Policy (GSP)).
Risk Informed Protection – Protection strategies consider risks as measured by existing threat and potential consequence of impact to BPA’s people, mission, and fiscal health while also considering mitigating strategies such as security systems, policy and employee awareness training.
1.2 Objectives
OSCO’s strategic goals of compliance and protection will be achieved by meeting the following strategic objectives:
1. Prioritize and fund security enhancements in accordance with OSCO’s NERC CIP 14 compliance plan and standards set by BPA’s Critical Asset Security Plan (CASP).
2. Forecast, prioritize and fund system maintenance activities which are economical, sustainable, risk informed and ensure reliable system performance in accordance with DOE O 473.3.
Methodologies used to deploy NERC CIP 14 security enhancements, subsequent maintenance activities and a technology refresh seek to:
Leverage new technologies to sustain or enhance current system effectiveness Improve security system reliability Reduce maintenance overhead
These objectives align with BPA’s strategic direction in the following ways:
Strategic Objective S1 – Policy and Regional Actions: Protecting BPA's critical transmission assets supports system reliability
Strategic Objective S9 – Stakeholder Satisfaction: Customers expect BPA to protect its critical transmission infrastructure
Strategic Objective I4 – Asset Management: BPA's valued assets and property are protected from loss or damage
Strategic Initiative I7 – Risk-Informed Decision Making and Transparency: This protection strategy utilizes a risk-informed process to prioritize the protection of critical assets
Strategic Initiative P4 – Positive Work Environment: Protection of employees supports safety in the workplace
Outside the scope of this strategy are cyber security systems and the underlying IT infrastructure (networks, servers, etc.) used to operate the digital and remaining analog security components. Administration, maintenance, and security of the software solutions used to support the video and alarm data are covered by IT as well. Security fence maintenance is covered by Facilities Asset Management. OSCO coordinates with IT and Facilities to ensure that out-of-scope requirements are covered in the appropriate asset management plans.
Security Asset Management Strategy
B O N N E V I L L E P O W E R A D M I N I S T R A T I O N
11
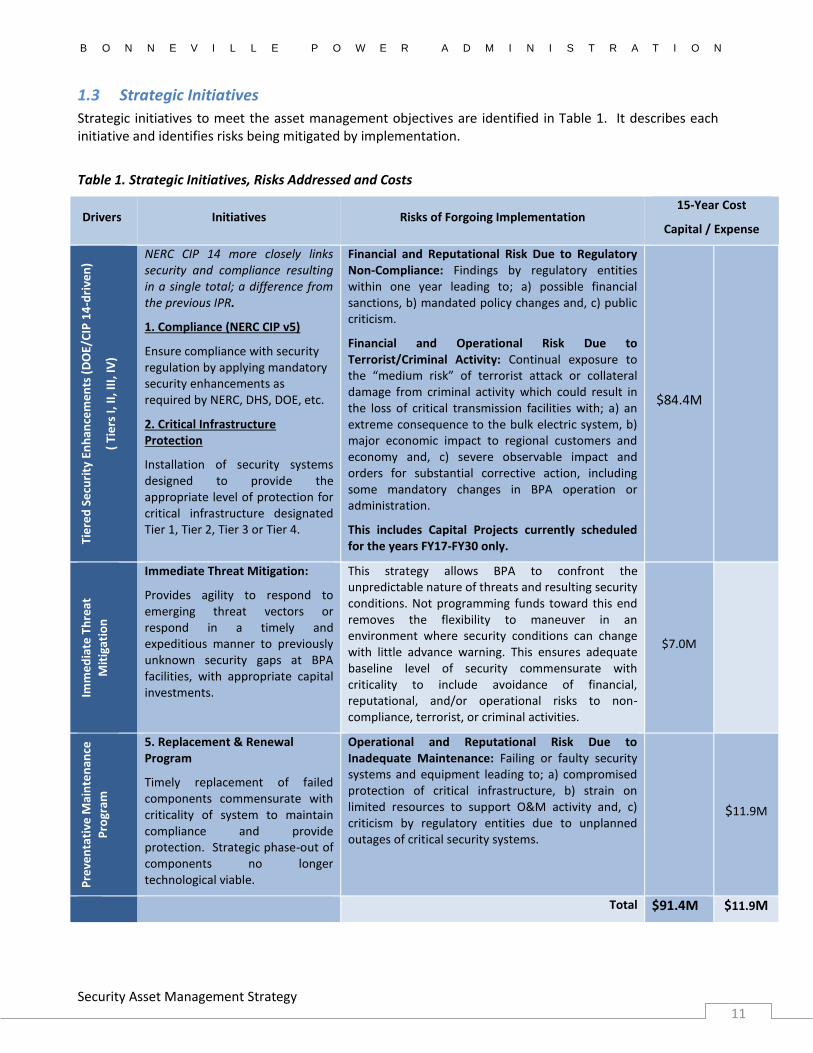
1.3 Strategic Initiatives
Strategic initiatives to meet the asset management objectives are identified in Table 1. It describes each initiative and identifies risks being mitigated by implementation.
Table 1. Strategic Initiatives, Risks Addressed and Costs
Drivers Initiatives Risks of Forgoing Implementation 15-Year Cost
Capital / Expense
Tie
red
Se
curi
ty E
nh
ance
men
ts (
DO
E/C
IP 1
4-d
rive
n)
( Ti
ers
I, II
, III
, IV
)
NERC CIP 14 more closely links security and compliance resulting in a single total; a difference from the previous IPR.
1. Compliance (NERC CIP v5)
Ensure compliance with security regulation by applying mandatory security enhancements as required by NERC, DHS, DOE, etc.
2. Critical Infrastructure Protection
Installation of security systems designed to provide the appropriate level of protection for critical infrastructure designated Tier 1, Tier 2, Tier 3 or Tier 4.
Financial and Reputational Risk Due to Regulatory Non-Compliance: Findings by regulatory entities within one year leading to; a) possible financial sanctions, b) mandated policy changes and, c) public criticism.
Financial and Operational Risk Due to Terrorist/Criminal Activity: Continual exposure to the “medium risk” of terrorist attack or collateral damage from criminal activity which could result in the loss of critical transmission facilities with; a) an extreme consequence to the bulk electric system, b) major economic impact to regional customers and economy and, c) severe observable impact and orders for substantial corrective action, including some mandatory changes in BPA operation or administration.
This includes Capital Projects currently scheduled for the years FY17-FY30 only.
$84.4M
Imm
ed
iate
Th
reat
Mit
igat
ion
Immediate Threat Mitigation:
Provides agility to respond to emerging threat vectors or respond in a timely and expeditious manner to previously unknown security gaps at BPA facilities, with appropriate capital investments.
This strategy allows BPA to confront the unpredictable nature of threats and resulting security conditions. Not programming funds toward this end removes the flexibility to maneuver in an environment where security conditions can change with little advance warning. This ensures adequate baseline level of security commensurate with criticality to include avoidance of financial, reputational, and/or operational risks to non-compliance, terrorist, or criminal activities.
$7.0M
Pre
ven
tati
ve M
ain
ten
ance
Pro
gram
5. Replacement & Renewal Program
Timely replacement of failed components commensurate with criticality of system to maintain compliance and provide protection. Strategic phase-out of components no longer technological viable.
Operational and Reputational Risk Due to Inadequate Maintenance: Failing or faulty security systems and equipment leading to; a) compromised protection of critical infrastructure, b) strain on limited resources to support O&M activity and, c) criticism by regulatory entities due to unplanned outages of critical security systems.
$11.9M
Total $91.4M $11.9M
Security Asset Management Strategy
B O N N E V I L L E P O W E R A D M I N I S T R A T I O N
12
1.4 Strategic Challenges
Two main challenges, which are outlined below, must be overcome for successful implementation of this strategy. Rapidly evolving regulatory requirements Critical Infrastructure Protection (CIP) requirements issued by NERC CIP have had a major impact on BPA’s security program, both in terms of resourcing as well as developing processes for successful implementation. NERC requirements emerge every one to two years requiring implementation within 12 to 18 months. It is difficult to anticipate the scope and budget for NERC projects in advance. Standard BPA processes for capital projects require at least a two- to three-year planning window, which does not accommodate NERC timelines. Furthermore, NERC CIP impacts several BPA organizations with complex interdependencies and upstream/downstream impacts.
Aging and technologically obsolete systems Large numbers of systems (primarily cameras) are projected to fail in the coming years due to exceeding manufacturer recommended Mean Time to Failure (MTTF). If not managed, this may impact security system effectiveness, cause a spike in maintenance fees and drain limited resources.
BPA’s OSCO is proposes a technology refresh to leverage new technology that can be sustained over the long term. In accordance with policy, the technology refresh initiative will not be executed with capital, but rather expense, funds. The need for this initiative, while not captured in this strategy document’s capital plan, is necessary nonetheless. The benefits to this approach are:
Immediate reduction in costs associated with video surveillance maintenance
Reduction in information technology band width and licensing costs Ability to redirect resources to more sustainable security system’s development and
implementation Maintaining “security in depth” and multi-layered alarm assessment capability
BPA implements a layered security approach that includes all aspects of the physical security, personnel security, information security and operations security disciplines. Video surveillance is almost exclusively used to assess alarm activity after the fact. This has traditionally been one of two primary assessment tools to determine the nature of an alarm. The proposed strategy leverages increased technological capabilities which allows for fewer deployed camera systems but still provides assessment capability in depth. Therefore, the decommissioning of targeted video surveillance assets at substations is expected to have very minimal to no impact on security system effectiveness or assessment capability.
1.5 Strategic Constraint
Major Constraint of this Strategy
OSCO has re-prioritized its capital expenditures and extended its timeline for capital project completion in response to external, downward budgetary pressures which has resulted in a less-than-optimal schedule. Relative priorities for addressing security vulnerabilities at BPA substations were also forced to be ignored in some instances (but maintained as much as possible) to respond to the downward pressures placed upon OSCO.
Security Asset Management Strategy
B O N N E V I L L E P O W E R A D M I N I S T R A T I O N
13
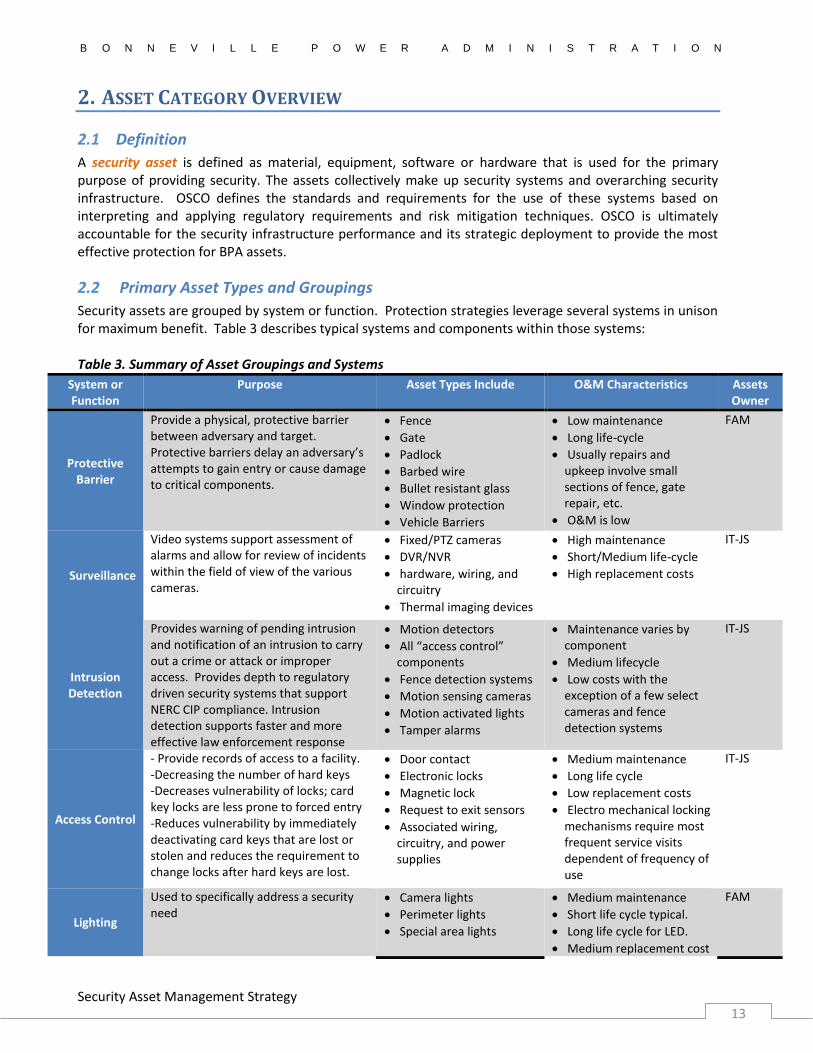
2. ASSET CATEGORY OVERVIEW
2.1 Definition
A security asset is defined as material, equipment, software or hardware that is used for the primary purpose of providing security. The assets collectively make up security systems and overarching security infrastructure. OSCO defines the standards and requirements for the use of these systems based on interpreting and applying regulatory requirements and risk mitigation techniques. OSCO is ultimately accountable for the security infrastructure performance and its strategic deployment to provide the most effective protection for BPA assets.
2.2 Primary Asset Types and Groupings
Security assets are grouped by system or function. Protection strategies leverage several systems in unison for maximum benefit. Table 3 describes typical systems and components within those systems: Table 3. Summary of Asset Groupings and Systems
System or Function
Purpose Asset Types Include O&M Characteristics Assets Owner
Protective Barrier
Provide a physical, protective barrier between adversary and target. Protective barriers delay an adversary’s attempts to gain entry or cause damage to critical components.
Fence
Gate
Padlock
Barbed wire
Bullet resistant glass
Window protection
Vehicle Barriers
Low maintenance
Long life-cycle
Usually repairs and upkeep involve small sections of fence, gate repair, etc.
O&M is low
FAM
Surveillance
Video systems support assessment of alarms and allow for review of incidents within the field of view of the various cameras.
Fixed/PTZ cameras
DVR/NVR
hardware, wiring, and circuitry
Thermal imaging devices
High maintenance
Short/Medium life-cycle
High replacement costs
IT-JS
Intrusion Detection
Provides warning of pending intrusion and notification of an intrusion to carry out a crime or attack or improper access. Provides depth to regulatory driven security systems that support NERC CIP compliance. Intrusion detection supports faster and more effective law enforcement response
Motion detectors
All “access control” components
Fence detection systems
Motion sensing cameras
Motion activated lights
Tamper alarms
Maintenance varies by component
Medium lifecycle
Low costs with the exception of a few select cameras and fence detection systems
IT-JS
Access Control
- Provide records of access to a facility. -Decreasing the number of hard keys -Decreases vulnerability of locks; card key locks are less prone to forced entry -Reduces vulnerability by immediately deactivating card keys that are lost or stolen and reduces the requirement to change locks after hard keys are lost.
Door contact
Electronic locks
Magnetic lock
Request to exit sensors
Associated wiring, circuitry, and power supplies
Medium maintenance
Long life cycle
Low replacement costs
Electro mechanical locking mechanisms require most frequent service visits dependent of frequency of use
IT-JS
Lighting
Used to specifically address a security need
Camera lights
Perimeter lights
Special area lights
Medium maintenance
Short life cycle typical.
Long life cycle for LED.
Medium replacement cost
FAM
Security Asset Management Strategy
B O N N E V I L L E P O W E R A D M I N I S T R A T I O N
14
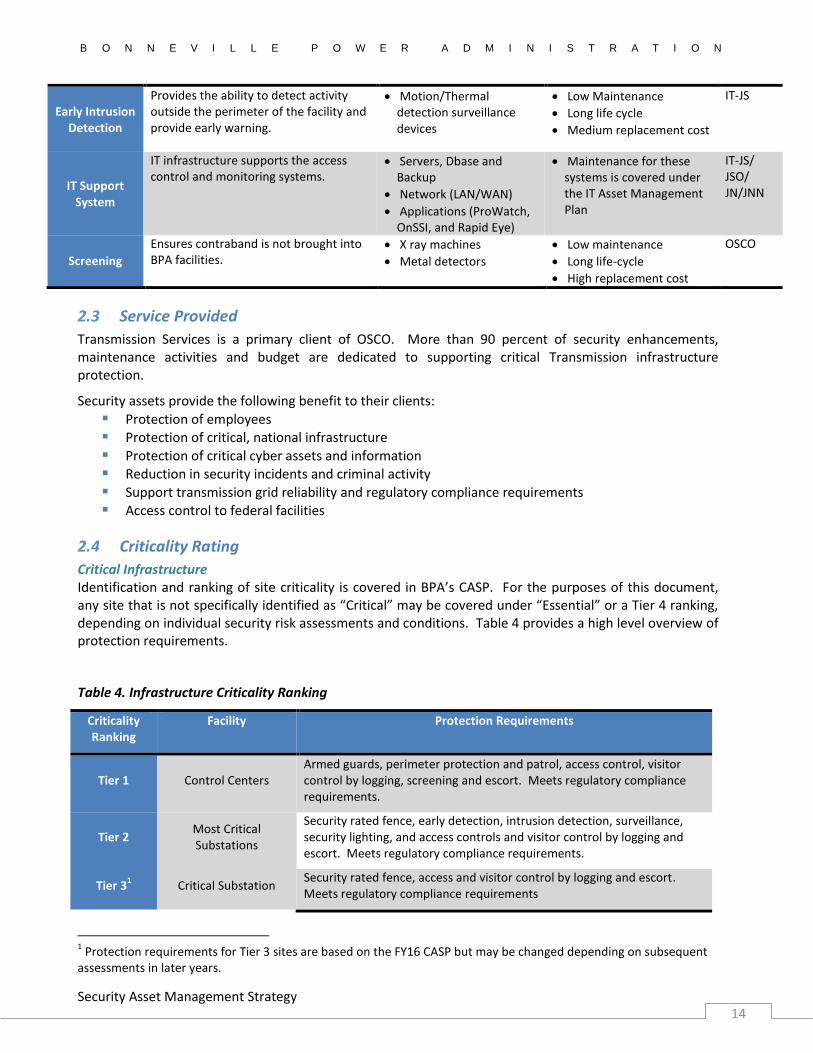
Early Intrusion Detection
Provides the ability to detect activity outside the perimeter of the facility and provide early warning.
Motion/Thermal detection surveillance devices
Low Maintenance
Long life cycle
Medium replacement cost
IT-JS
IT Support System
IT infrastructure supports the access control and monitoring systems.
Servers, Dbase and Backup
Network (LAN/WAN)
Applications (ProWatch, OnSSI, and Rapid Eye)
Maintenance for these systems is covered under the IT Asset Management Plan
IT-JS/ JSO/ JN/JNN
Screening
Ensures contraband is not brought into BPA facilities.
X ray machines
Metal detectors
Low maintenance
Long life-cycle
High replacement cost
OSCO
2.3 Service Provided
Transmission Services is a primary client of OSCO. More than 90 percent of security enhancements, maintenance activities and budget are dedicated to supporting critical Transmission infrastructure protection.
Security assets provide the following benefit to their clients:
Protection of employees Protection of critical, national infrastructure Protection of critical cyber assets and information Reduction in security incidents and criminal activity
Support transmission grid reliability and regulatory compliance requirements Access control to federal facilities
2.4 Criticality Rating
Critical Infrastructure Identification and ranking of site criticality is covered in BPA’s CASP. For the purposes of this document, any site that is not specifically identified as “Critical” may be covered under “Essential” or a Tier 4 ranking, depending on individual security risk assessments and conditions. Table 4 provides a high level overview of protection requirements.
Table 4. Infrastructure Criticality Ranking
Criticality Ranking
Facility Protection Requirements
Tier 1 Control Centers Armed guards, perimeter protection and patrol, access control, visitor control by logging, screening and escort. Meets regulatory compliance requirements.
Tier 2 Most Critical Substations
Security rated fence, early detection, intrusion detection, surveillance, security lighting, and access controls and visitor control by logging and escort. Meets regulatory compliance requirements.
Tier 31 Critical Substation
Security rated fence, access and visitor control by logging and escort. Meets regulatory compliance requirements
1 Protection requirements for Tier 3 sites are based on the FY16 CASP but may be changed depending on subsequent
assessments in later years.
Security Asset Management Strategy
B O N N E V I L L E P O W E R A D M I N I S T R A T I O N
15
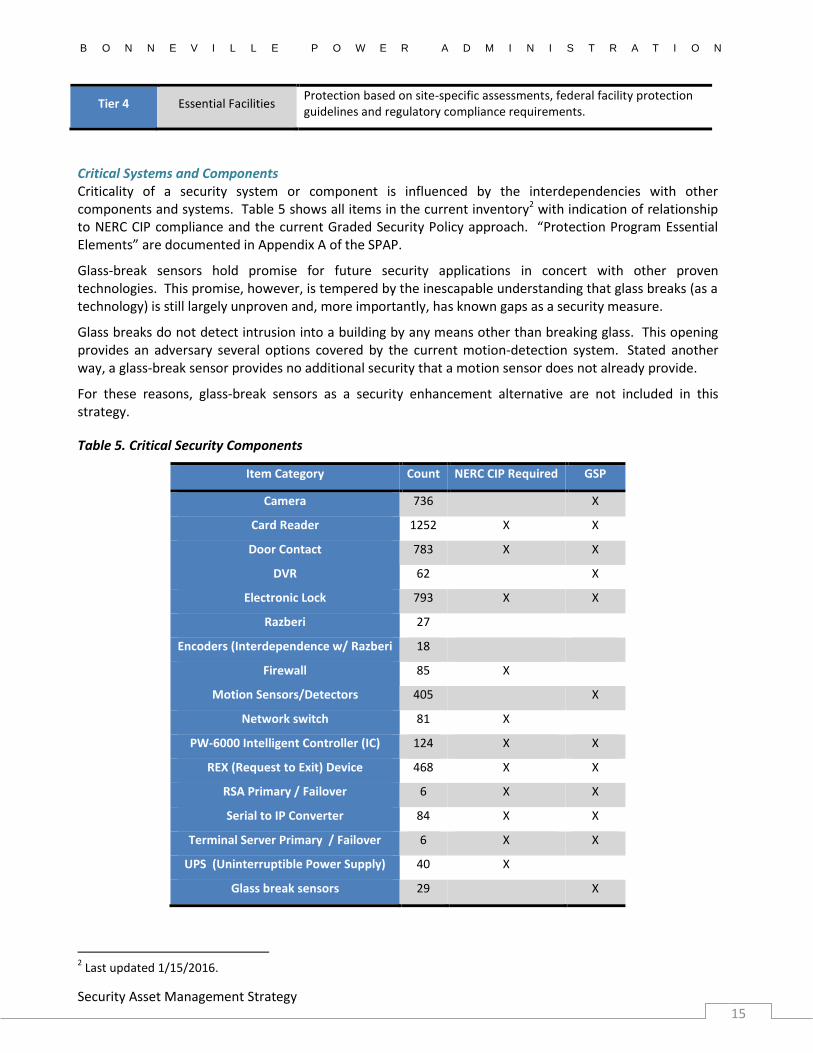
Tier 4 Essential Facilities Protection based on site-specific assessments, federal facility protection guidelines and regulatory compliance requirements.
Critical Systems and Components Criticality of a security system or component is influenced by the interdependencies with other components and systems. Table 5 shows all items in the current inventory2 with indication of relationship to NERC CIP compliance and the current Graded Security Policy approach. “Protection Program Essential Elements” are documented in Appendix A of the SPAP.
Glass-break sensors hold promise for future security applications in concert with other proven technologies. This promise, however, is tempered by the inescapable understanding that glass breaks (as a technology) is still largely unproven and, more importantly, has known gaps as a security measure.
Glass breaks do not detect intrusion into a building by any means other than breaking glass. This opening provides an adversary several options covered by the current motion-detection system. Stated another way, a glass-break sensor provides no additional security that a motion sensor does not already provide.
For these reasons, glass-break sensors as a security enhancement alternative are not included in this strategy.
Table 5. Critical Security Components
Item Category Count NERC CIP Required GSP
Camera 736
X
Card Reader 1252 X X
Door Contact 783 X X
DVR 62
X
Electronic Lock 793 X X
Razberi 27
Encoders (Interdependence w/ Razberi 18
Firewall 85 X
Motion Sensors/Detectors 405
X
Network switch 81 X
PW-6000 Intelligent Controller (IC) 124 X X
REX (Request to Exit) Device 468 X X
RSA Primary / Failover 6 X X
Serial to IP Converter 84 X X
Terminal Server Primary / Failover 6 X X
UPS (Uninterruptible Power Supply) 40 X
Glass break sensors 29
X
2 Last updated 1/15/2016.
Security Asset Management Strategy
B O N N E V I L L E P O W E R A D M I N I S T R A T I O N
16
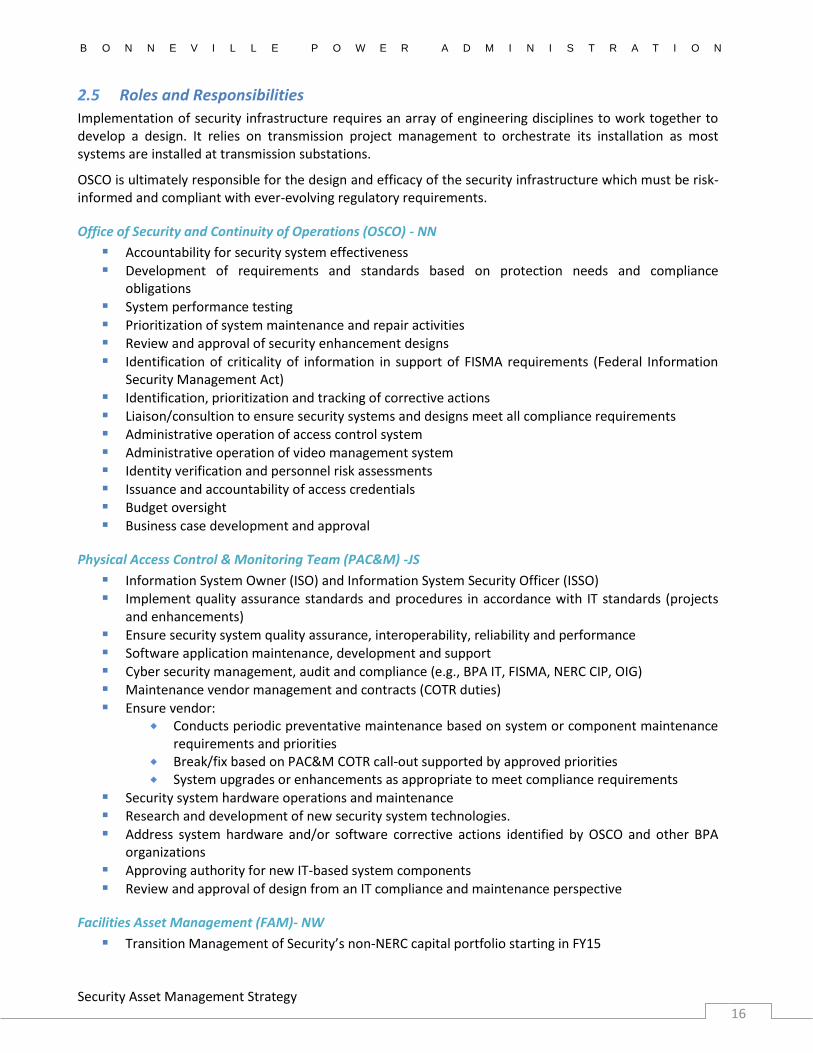
2.5 Roles and Responsibilities
Implementation of security infrastructure requires an array of engineering disciplines to work together to develop a design. It relies on transmission project management to orchestrate its installation as most systems are installed at transmission substations.
OSCO is ultimately responsible for the design and efficacy of the security infrastructure which must be risk-informed and compliant with ever-evolving regulatory requirements.
Office of Security and Continuity of Operations (OSCO) - NN
Accountability for security system effectiveness Development of requirements and standards based on protection needs and compliance
obligations System performance testing Prioritization of system maintenance and repair activities Review and approval of security enhancement designs
Identification of criticality of information in support of FISMA requirements (Federal Information Security Management Act)
Identification, prioritization and tracking of corrective actions Liaison/consultion to ensure security systems and designs meet all compliance requirements Administrative operation of access control system Administrative operation of video management system Identity verification and personnel risk assessments
Issuance and accountability of access credentials Budget oversight Business case development and approval
Physical Access Control & Monitoring Team (PAC&M) -JS
Information System Owner (ISO) and Information System Security Officer (ISSO) Implement quality assurance standards and procedures in accordance with IT standards (projects
and enhancements) Ensure security system quality assurance, interoperability, reliability and performance Software application maintenance, development and support
Cyber security management, audit and compliance (e.g., BPA IT, FISMA, NERC CIP, OIG) Maintenance vendor management and contracts (COTR duties) Ensure vendor:
Conducts periodic preventative maintenance based on system or component maintenance requirements and priorities
Break/fix based on PAC&M COTR call-out supported by approved priorities System upgrades or enhancements as appropriate to meet compliance requirements
Security system hardware operations and maintenance Research and development of new security system technologies.
Address system hardware and/or software corrective actions identified by OSCO and other BPA organizations
Approving authority for new IT-based system components Review and approval of design from an IT compliance and maintenance perspective
Facilities Asset Management (FAM)- NW
Transition Management of Security’s non-NERC capital portfolio starting in FY15

Security Asset Management Strategy
B O N N E V I L L E P O W E R A D M I N I S T R A T I O N
17
Operations and maintenance of systems and components in Table 3, where FAM is identified as the asset owner (e.g. fences, lights, doors, windows, etc.)
Operations and maintenance of FAM systems and components that support security assets Address corrective actions identified by OSCO Review and approval of design where FAM assets are involved
Coordination of other Transmission projects to ensure security systems remain intact or mitigating security processes or infrastructure is used
Inclusion of security systems in new construction and facility updates
Transmission Organizations
There are many interdependencies with various Transmission organizations. Some of the key support organizations are listed below:
Transmission Operations (TO) : Identifying and prioritizing critical infrastructure Transmission Field Operations (TF): Funding of Transmission-owned security system maintenance Substation Design (TESD): Coordinating security system design for substations
Project Management Team (TEP): Managing (capital) security enhancement projects at substations Managing vendors and contracts (COTR duties) for security enhancement projects
2.6 Metrics
Table 6 shows current and future targets for measuring success of the asset management categories. Future targets will be phased in as appropriate by either addition to current measures or in place of those measures, with a progressive drive for improved performance.
Table 6. Performance Metrics
Initiative FY2017 Targets FY18 & Future Targets
1. Compliance
No NERC-CIP violations as a result of inadequate or malfunctioning Physical Security assets resulting in a violation from an audit and that were not previously self-reported.
1) Complete security system enhancement in support of NERC CIP 14 and/or future requirements within scope and budget.
2) No NERC-CIP violations as a result of inadequate or malfunctioning Physical Security assets resulting in a violation from an audit and that was not previously self-reported.
2. Security Enhancements
(Tiers I, II, III, IV)
Complete business case for NERC CIP 14 security enhancements. Begin projects per capital funding schedule.
Complete security enhancements per capital project funding schedule.
3. INVESTMENT RECOMMENDATIONS - CAPITAL
Note: This strategy document reflects a modified schedule and timeline per external budgetary constraints. Internal budgeting decisions and processes (Integrated Program Review, etc.) have mandated a modified funding plan with particular attention paid to the FY17-19 horizon which has affected capital project prioritization and an extension of an optimal 10-year timeline to a 15-year timeline. Out-year funding levels for FYs beyond FY19 will be revisited during subsequent CIR processes.
Security Asset Management Strategy
B O N N E V I L L E P O W E R A D M I N I S T R A T I O N
18
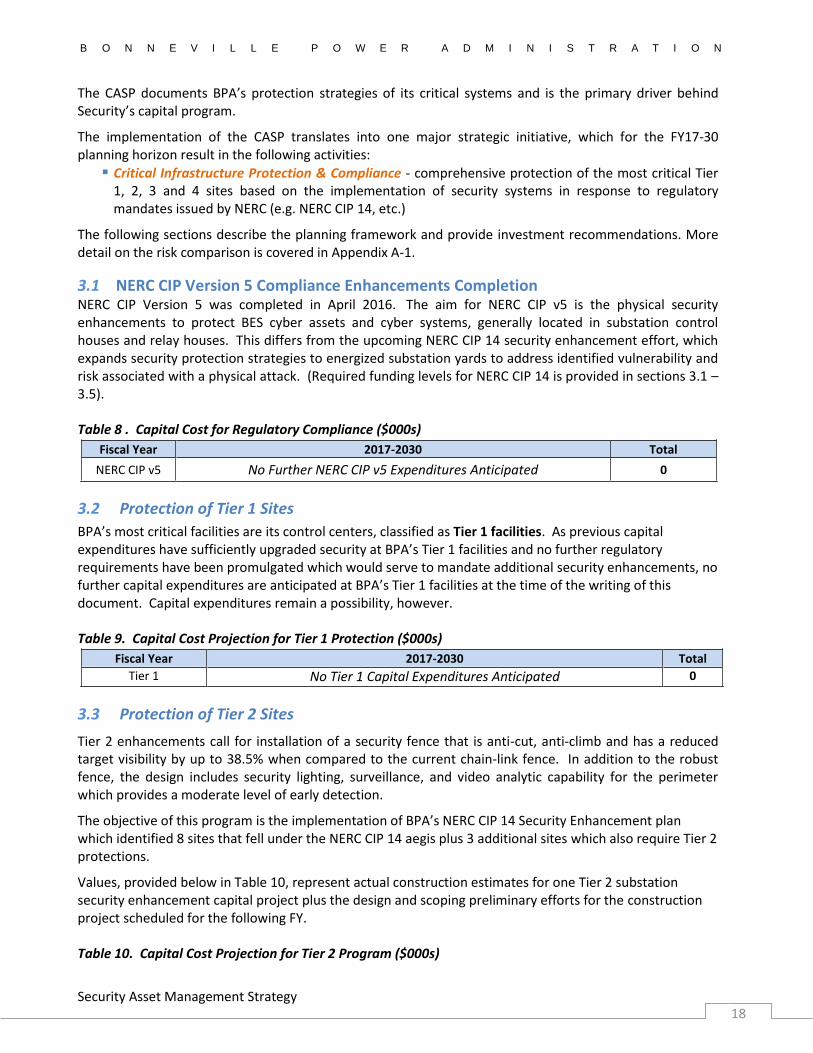
The CASP documents BPA’s protection strategies of its critical systems and is the primary driver behind Security’s capital program.
The implementation of the CASP translates into one major strategic initiative, which for the FY17-30 planning horizon result in the following activities:
Critical Infrastructure Protection & Compliance - comprehensive protection of the most critical Tier 1, 2, 3 and 4 sites based on the implementation of security systems in response to regulatory mandates issued by NERC (e.g. NERC CIP 14, etc.)
The following sections describe the planning framework and provide investment recommendations. More detail on the risk comparison is covered in Appendix A-1.
3.1 NERC CIP Version 5 Compliance Enhancements Completion NERC CIP Version 5 was completed in April 2016. The aim for NERC CIP v5 is the physical security enhancements to protect BES cyber assets and cyber systems, generally located in substation control houses and relay houses. This differs from the upcoming NERC CIP 14 security enhancement effort, which expands security protection strategies to energized substation yards to address identified vulnerability and risk associated with a physical attack. (Required funding levels for NERC CIP 14 is provided in sections 3.1 – 3.5).
Table 8 . Capital Cost for Regulatory Compliance ($000s)
3.2 Protection of Tier 1 Sites
BPA’s most critical facilities are its control centers, classified as Tier 1 facilities. As previous capital expenditures have sufficiently upgraded security at BPA’s Tier 1 facilities and no further regulatory requirements have been promulgated which would serve to mandate additional security enhancements, no further capital expenditures are anticipated at BPA’s Tier 1 facilities at the time of the writing of this document. Capital expenditures remain a possibility, however.
Table 9. Capital Cost Projection for Tier 1 Protection ($000s)
3.3 Protection of Tier 2 Sites
Tier 2 enhancements call for installation of a security fence that is anti-cut, anti-climb and has a reduced target visibility by up to 38.5% when compared to the current chain-link fence. In addition to the robust fence, the design includes security lighting, surveillance, and video analytic capability for the perimeter which provides a moderate level of early detection.
The objective of this program is the implementation of BPA’s NERC CIP 14 Security Enhancement plan which identified 8 sites that fell under the NERC CIP 14 aegis plus 3 additional sites which also require Tier 2 protections.
Values, provided below in Table 10, represent actual construction estimates for one Tier 2 substation security enhancement capital project plus the design and scoping preliminary efforts for the construction project scheduled for the following FY.
Table 10. Capital Cost Projection for Tier 2 Program ($000s)
Fiscal Year 2017-2030 Total
NERC CIP v5 No Further NERC CIP v5 Expenditures Anticipated 0
Fiscal Year 2017-2030 Total
Tier 1 No Tier 1 Capital Expenditures Anticipated 0

Security Asset Management Strategy
B O N N E V I L L E P O W E R A D M I N I S T R A T I O N
19
FY 2017 2018 2019 2020 2021 2022 2023 2024 2025 2026 2027 2028 2029 2030 Total
Tier 2
0 3,249 7,358 4,104 3,290 5,404 0 0 450 0 2,250 0 4,810 6,580 37,495
3.4 Protection of Tier 3 Sites
Based on the updated prioritization scheme which takes into account threat and security system effectiveness information, funding is proposed for protection of 14 Tier 3 sites to be accomplished coincident with Tier 2 and Tier 4 capital projects scheduled within the same FY. This scheduling is maintained (one Tier 2 project and one Tier 3 project) throughout the planning horizon3.
BPA risk tolerance from theft is fairly high. However, collateral damage resulting from attempted theft of copper grounds and other substation cables and wiring is known to have a substantially higher consequence than the underlying simple theft. Therefore, risk tolerance for that kind of event is very low. In 2009 over $1 million dollars in damage, not including loss of transmission capability, occurred after a similar ongoing series of criminal events at another site.
Values, provided below in Table 11, represent construction estimates for one Tier 1 substation security enhancement capital project per year plus the design and scoping preliminary efforts for the Tier 3 construction project scheduled for the following FY.
Table 11. Capital Cost Projection for Tier 3 Program ($000s)
FY 2017 2018 2019 2020 2021 2022 2023 2024 2025 2026 2027 2028 2029 2030 Total
Tier 3
7,560 2,370 150 2,240 2,040 150 3,990 3,840 4,360 3,850 2,230 3,700 3,000 0 39,480
3.5 Protection of Tier 4 Sites
Based on the updated prioritization scheme, which takes into account threat and security system effectiveness information, funding is proposed for protection of six Tier 4 sites to be accomplished coincident with Tier 2 and Tier 3 capital projects scheduled within the same FY.
Values, provided below in Table 12, represent actual construction estimates for one Tier 4 substation security enhancement capital project plus the design and scoping efforts for the Tier 4 construction project scheduled for the following FY.
Design/Construction on Tier 4 identified sites is delayed until 2020 to ensure proper focus is maintained on higher risk/higher priority substations (Tiers 2 & 3) until such a time as it is determined that a greater project management/construction effort can be maintained.
Table 12. Capital Cost Projection for Tier 4 Program ($000s)
FY 2017 2018 2019 2020 2021 2022 2023 2024 2025 2026 2027 2028 2029 2030 Total
Tier 4
0 0 0 450 839 1,095 2,297 1,237 150 1,369 0 0 0 0 7,437
3 FY 17 is the only exception to this trend where one Tier 2 and two Tier 3 sites are scheduled.
Security Asset Management Strategy
B O N N E V I L L E P O W E R A D M I N I S T R A T I O N
20
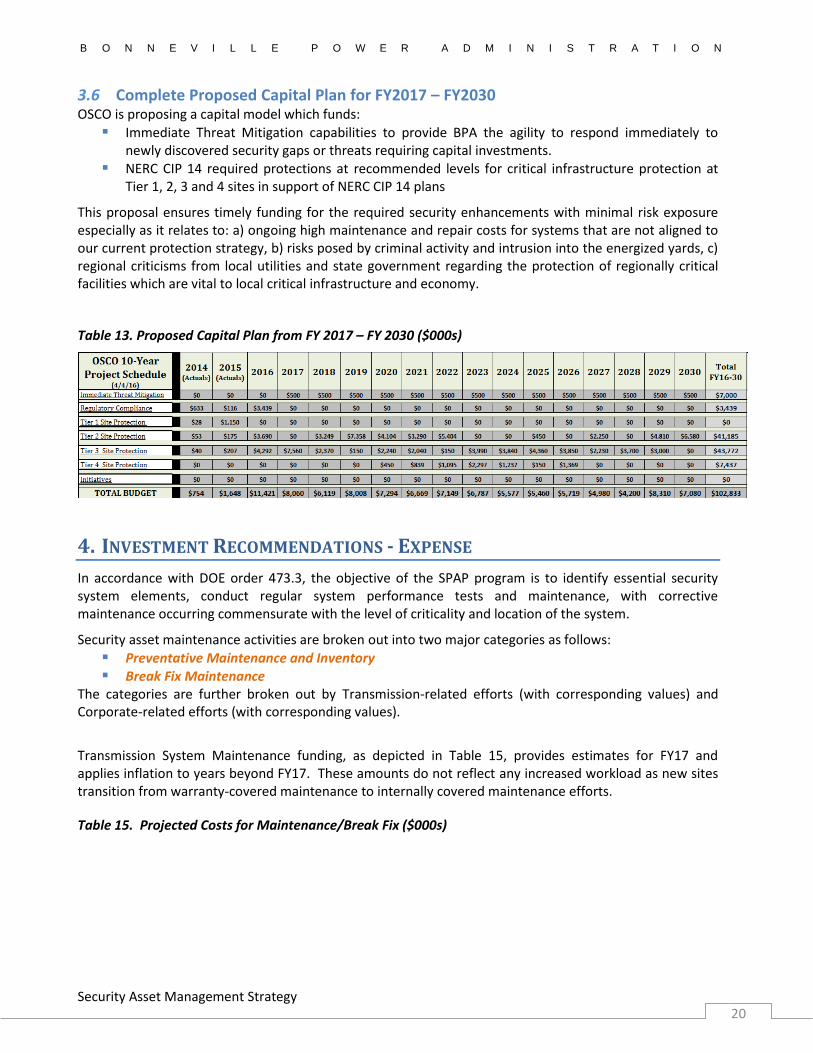
3.6 Complete Proposed Capital Plan for FY2017 – FY2030 OSCO is proposing a capital model which funds:
Immediate Threat Mitigation capabilities to provide BPA the agility to respond immediately to newly discovered security gaps or threats requiring capital investments.
NERC CIP 14 required protections at recommended levels for critical infrastructure protection at Tier 1, 2, 3 and 4 sites in support of NERC CIP 14 plans
This proposal ensures timely funding for the required security enhancements with minimal risk exposure especially as it relates to: a) ongoing high maintenance and repair costs for systems that are not aligned to our current protection strategy, b) risks posed by criminal activity and intrusion into the energized yards, c) regional criticisms from local utilities and state government regarding the protection of regionally critical facilities which are vital to local critical infrastructure and economy.
Table 13. Proposed Capital Plan from FY 2017 – FY 2030 ($000s)
4. INVESTMENT RECOMMENDATIONS - EXPENSE
In accordance with DOE order 473.3, the objective of the SPAP program is to identify essential security system elements, conduct regular system performance tests and maintenance, with corrective maintenance occurring commensurate with the level of criticality and location of the system.
Security asset maintenance activities are broken out into two major categories as follows: Preventative Maintenance and Inventory Break Fix Maintenance
The categories are further broken out by Transmission-related efforts (with corresponding values) and Corporate-related efforts (with corresponding values).
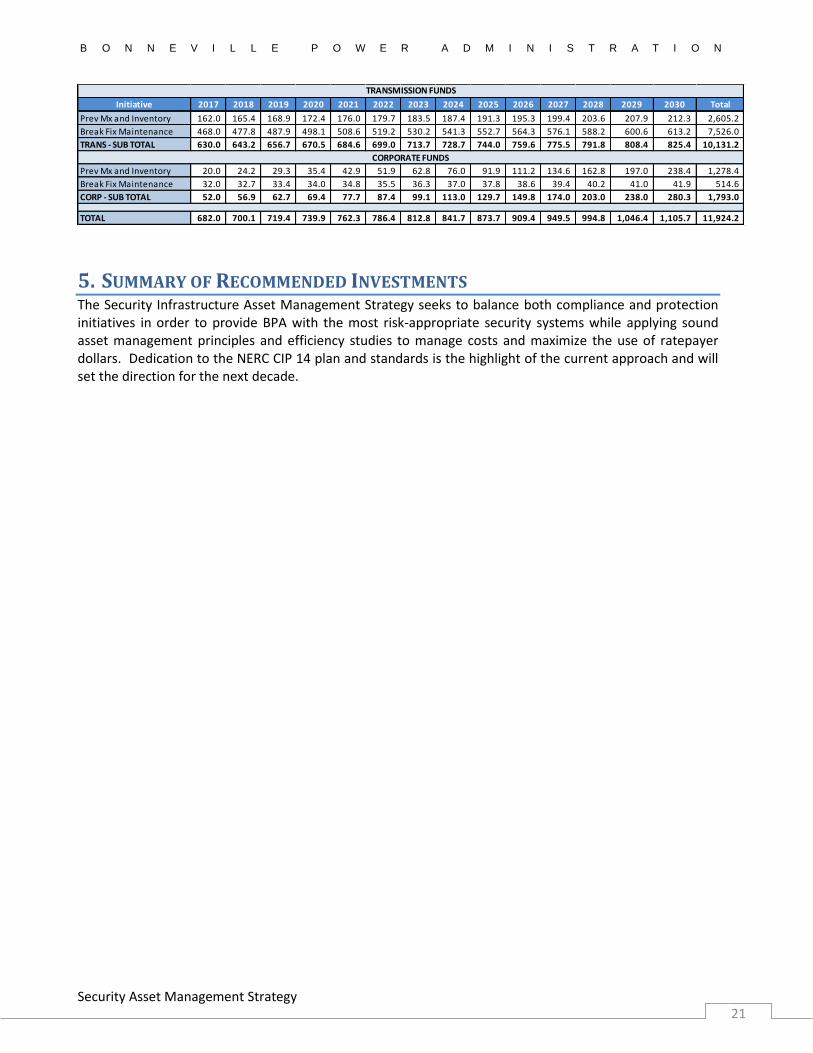
Transmission System Maintenance funding, as depicted in Table 15, provides estimates for FY17 and applies inflation to years beyond FY17. These amounts do not reflect any increased workload as new sites transition from warranty-covered maintenance to internally covered maintenance efforts.
Table 15. Projected Costs for Maintenance/Break Fix ($000s)
Security Asset Management Strategy
B O N N E V I L L E P O W E R A D M I N I S T R A T I O N
21
5. SUMMARY OF RECOMMENDED INVESTMENTS The Security Infrastructure Asset Management Strategy seeks to balance both compliance and protection initiatives in order to provide BPA with the most risk-appropriate security systems while applying sound asset management principles and efficiency studies to manage costs and maximize the use of ratepayer dollars. Dedication to the NERC CIP 14 plan and standards is the highlight of the current approach and will set the direction for the next decade.
Initiative 2017 2018 2019 2020 2021 2022 2023 2024 2025 2026 2027 2028 2029 2030 Total
Prev Mx and Inventory 162.0 165.4 168.9 172.4 176.0 179.7 183.5 187.4 191.3 195.3 199.4 203.6 207.9 212.3 2,605.2
Break Fix Maintenance 468.0 477.8 487.9 498.1 508.6 519.2 530.2 541.3 552.7 564.3 576.1 588.2 600.6 613.2 7,526.0
TRANS - SUB TOTAL 630.0 643.2 656.7 670.5 684.6 699.0 713.7 728.7 744.0 759.6 775.5 791.8 808.4 825.4 10,131.2
Prev Mx and Inventory 20.0 24.2 29.3 35.4 42.9 51.9 62.8 76.0 91.9 111.2 134.6 162.8 197.0 238.4 1,278.4
Break Fix Maintenance 32.0 32.7 33.4 34.0 34.8 35.5 36.3 37.0 37.8 38.6 39.4 40.2 41.0 41.9 514.6
CORP - SUB TOTAL 52.0 56.9 62.7 69.4 77.7 87.4 99.1 113.0 129.7 149.8 174.0 203.0 238.0 280.3 1,793.0
TOTAL 682.0 700.1 719.4 739.9 762.3 786.4 812.8 841.7 873.7 909.4 949.5 994.8 1,046.4 1,105.7 11,924.2
TRANSMISSION FUNDS
CORPORATE FUNDS
Security Asset Management Strategy
B O N N E V I L L E P O W E R A D M I N I S T R A T I O N
22
APPENDIX A - RISK REDUCTION Over the last 13 years BPA has conducted hundreds of security and risk assessments using several industry accepted methodologies. As a result, risk assessment information has been captured in a streamlined security risk assessment document outlining all the various risk conditions and reduction calculations for the several different security system configurations employed by BPA.
Reduction of risk is based on the effectiveness of a security system when compared to a given threat with given capability, intent, motive, and historical activity. Reduction of risk from a terrorist threat takes significantly greater investment in security than reduction in risk from other threats like general criminal activity and vandalism. In addition, certain types of security systems will be more effective for reducing risk from certain threats, while having practically no impact on others.
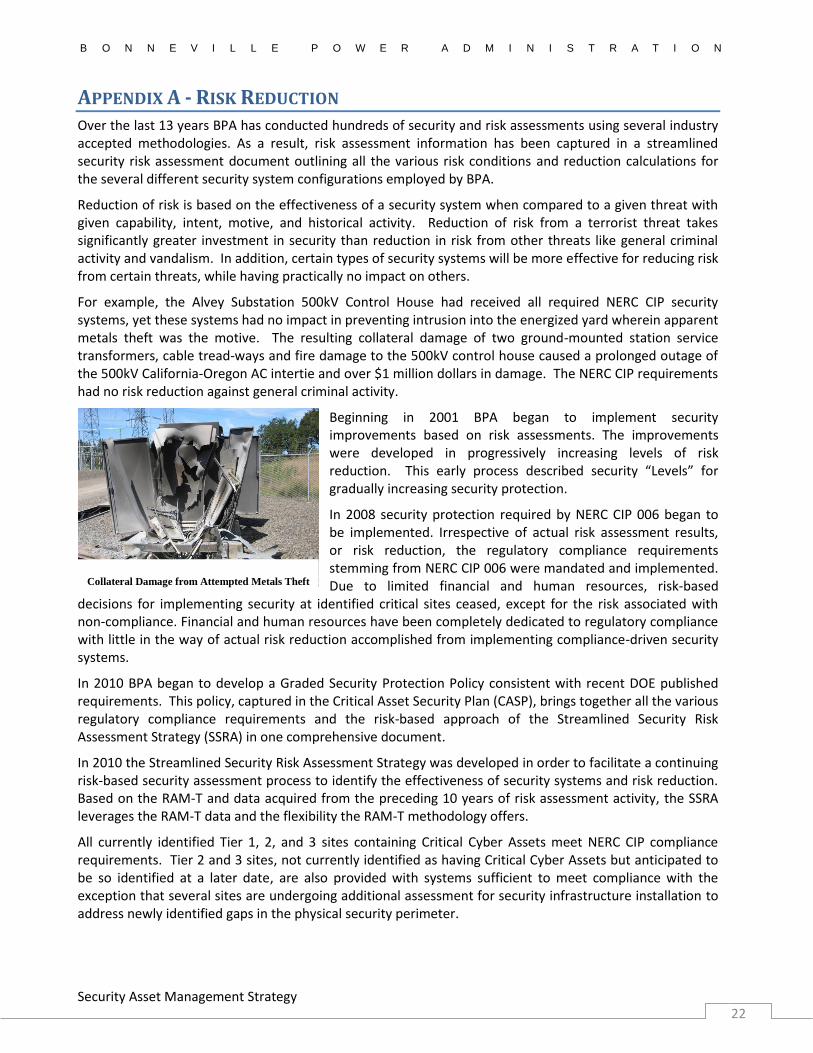
For example, the Alvey Substation 500kV Control House had received all required NERC CIP security systems, yet these systems had no impact in preventing intrusion into the energized yard wherein apparent metals theft was the motive. The resulting collateral damage of two ground-mounted station service transformers, cable tread-ways and fire damage to the 500kV control house caused a prolonged outage of the 500kV California-Oregon AC intertie and over $1 million dollars in damage. The NERC CIP requirements had no risk reduction against general criminal activity.
Beginning in 2001 BPA began to implement security improvements based on risk assessments. The improvements were developed in progressively increasing levels of risk reduction. This early process described security “Levels” for gradually increasing security protection.
In 2008 security protection required by NERC CIP 006 began to be implemented. Irrespective of actual risk assessment results, or risk reduction, the regulatory compliance requirements stemming from NERC CIP 006 were mandated and implemented. Due to limited financial and human resources, risk-based
decisions for implementing security at identified critical sites ceased, except for the risk associated with non-compliance. Financial and human resources have been completely dedicated to regulatory compliance with little in the way of actual risk reduction accomplished from implementing compliance-driven security systems.
In 2010 BPA began to develop a Graded Security Protection Policy consistent with recent DOE published requirements. This policy, captured in the Critical Asset Security Plan (CASP), brings together all the various regulatory compliance requirements and the risk-based approach of the Streamlined Security Risk Assessment Strategy (SSRA) in one comprehensive document.
In 2010 the Streamlined Security Risk Assessment Strategy was developed in order to facilitate a continuing risk-based security assessment process to identify the effectiveness of security systems and risk reduction. Based on the RAM-T and data acquired from the preceding 10 years of risk assessment activity, the SSRA leverages the RAM-T data and the flexibility the RAM-T methodology offers.
All currently identified Tier 1, 2, and 3 sites containing Critical Cyber Assets meet NERC CIP compliance requirements. Tier 2 and 3 sites, not currently identified as having Critical Cyber Assets but anticipated to be so identified at a later date, are also provided with systems sufficient to meet compliance with the exception that several sites are undergoing additional assessment for security infrastructure installation to address newly identified gaps in the physical security perimeter.
Collateral Damage from Attempted Metals Theft
Security Asset Management Strategy
B O N N E V I L L E P O W E R A D M I N I S T R A T I O N
23
Below are two scale tools and two risk tables provided to illustrate risk reduction resulting for critical sites if they had no security systems installed and, for comparison, current Tier 2 and Tier 3 security enhancements at sites that also have all NERC CIP security requirements completed.
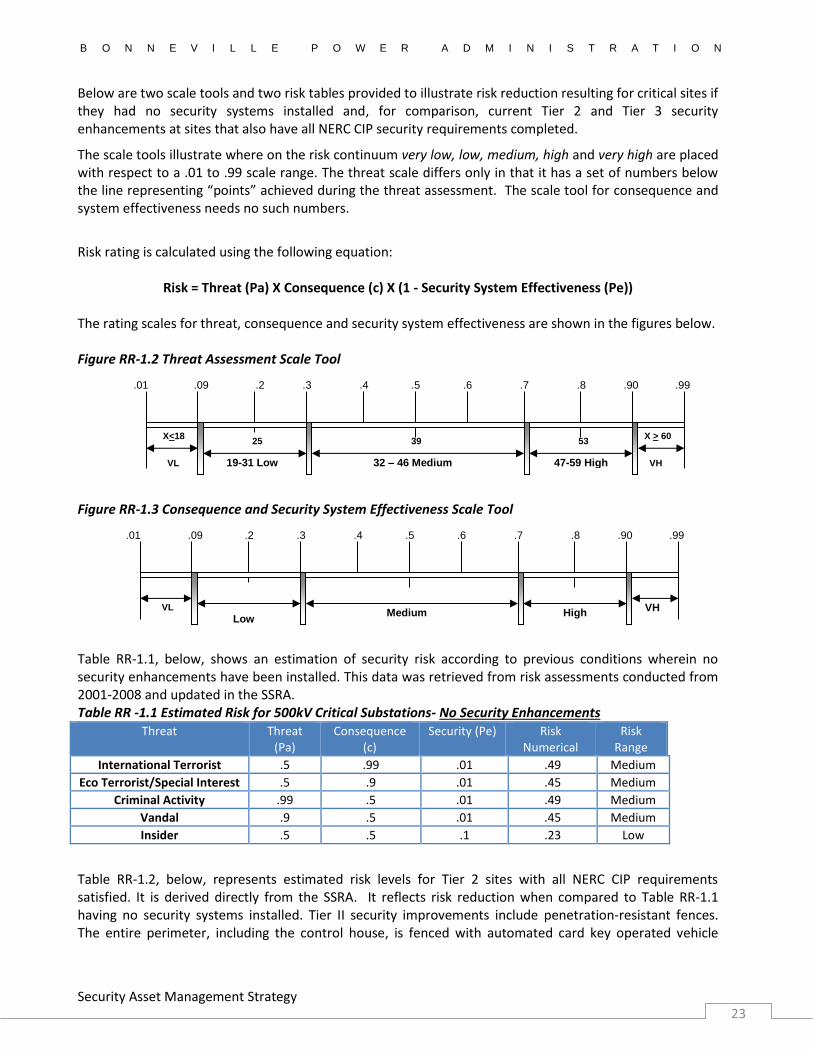
The scale tools illustrate where on the risk continuum very low, low, medium, high and very high are placed with respect to a .01 to .99 scale range. The threat scale differs only in that it has a set of numbers below the line representing “points” achieved during the threat assessment. The scale tool for consequence and system effectiveness needs no such numbers.
Risk rating is calculated using the following equation:
Risk = Threat (Pa) X Consequence (c) X (1 - Security System Effectiveness (Pe))
The rating scales for threat, consequence and security system effectiveness are shown in the figures below. Figure RR-1.2 Threat Assessment Scale Tool
Figure RR-1.3 Consequence and Security System Effectiveness Scale Tool
Table RR-1.1, below, shows an estimation of security risk according to previous conditions wherein no security enhancements have been installed. This data was retrieved from risk assessments conducted from 2001-2008 and updated in the SSRA. Table RR -1.1 Estimated Risk for 500kV Critical Substations- No Security Enhancements
Threat Threat (Pa)
Consequence (c)
Security (Pe) Risk Numerical
Risk Range
International Terrorist .5 .99 .01 .49 Medium
Eco Terrorist/Special Interest .5 .9 .01 .45 Medium
Criminal Activity .99 .5 .01 .49 Medium
Vandal .9 .5 .01 .45 Medium
Insider .5 .5 .1 .23 Low
Table RR-1.2, below, represents estimated risk levels for Tier 2 sites with all NERC CIP requirements satisfied. It is derived directly from the SSRA. It reflects risk reduction when compared to Table RR-1.1 having no security systems installed. Tier II security improvements include penetration-resistant fences. The entire perimeter, including the control house, is fenced with automated card key operated vehicle
.01 .09 .2 .3
X<18
.4 .5 .6 .7 .8 .90 .99
19-31 Low 32 – 46 Medium 47-59 High
25 39 53 X > 60
VL VH
.01 .09 .2 .3
.4 .5 .6 .7 .8 .90 .99
Low Medium High
VL VH
Security Asset Management Strategy
B O N N E V I L L E P O W E R A D M I N I S T R A T I O N
24
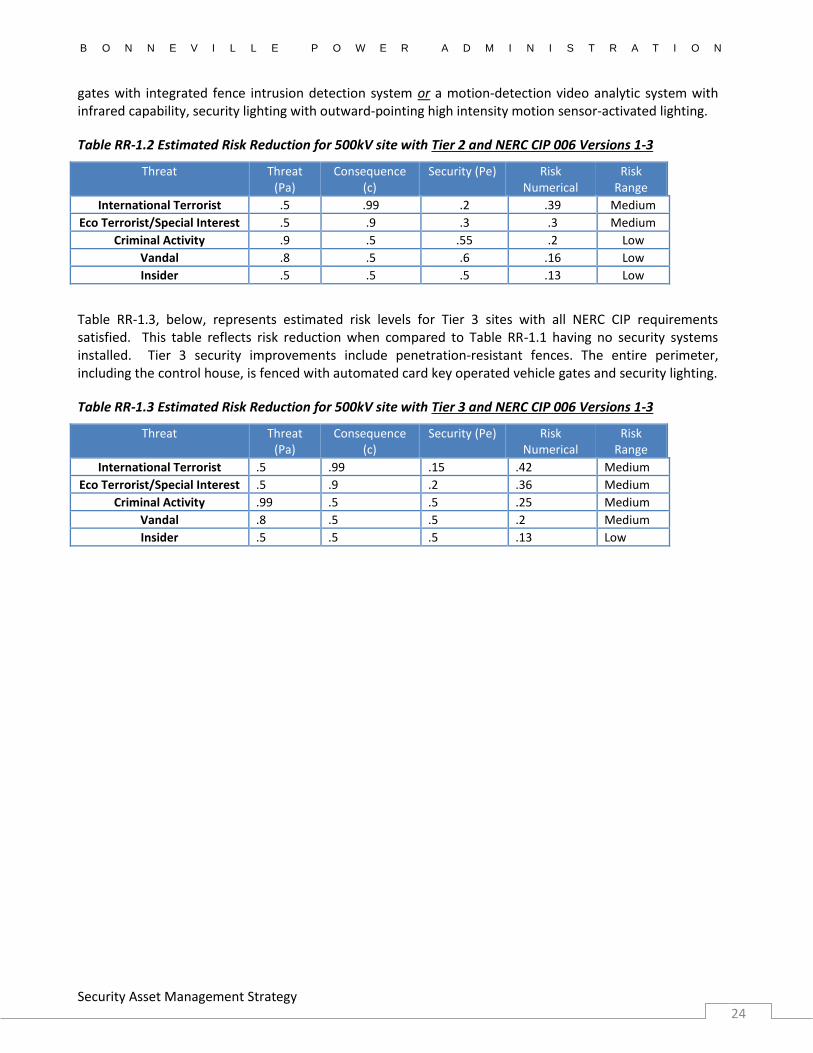
gates with integrated fence intrusion detection system or a motion-detection video analytic system with infrared capability, security lighting with outward-pointing high intensity motion sensor-activated lighting.
Table RR-1.2 Estimated Risk Reduction for 500kV site with Tier 2 and NERC CIP 006 Versions 1-3
Threat Threat (Pa)
Consequence (c)
Security (Pe) Risk Numerical
Risk Range
International Terrorist .5 .99 .2 .39 Medium
Eco Terrorist/Special Interest .5 .9 .3 .3 Medium
Criminal Activity .9 .5 .55 .2 Low
Vandal .8 .5 .6 .16 Low
Insider .5 .5 .5 .13 Low
Table RR-1.3, below, represents estimated risk levels for Tier 3 sites with all NERC CIP requirements satisfied. This table reflects risk reduction when compared to Table RR-1.1 having no security systems installed. Tier 3 security improvements include penetration-resistant fences. The entire perimeter, including the control house, is fenced with automated card key operated vehicle gates and security lighting.
Table RR-1.3 Estimated Risk Reduction for 500kV site with Tier 3 and NERC CIP 006 Versions 1-3
Threat Threat (Pa)
Consequence (c)
Security (Pe) Risk Numerical
Risk Range
International Terrorist .5 .99 .15 .42 Medium
Eco Terrorist/Special Interest .5 .9 .2 .36 Medium
Criminal Activity .99 .5 .5 .25 Medium
Vandal .8 .5 .5 .2 Medium
Insider .5 .5 .5 .13 Low
Security Asset Management Strategy
B O N N E V I L L E P O W E R A D M I N I S T R A T I O N
25
Financial Disclosure This information was made publicly available on June 10, 2016 and contains information not sourced directly from BPA financial statements.