security kaizen presentation to sepg - jeffrey w · pdf file– 650+ security kaizen...
TRANSCRIPT

SEPG 2006 Nashville, Tennessee, USA
SEPG 2006. Copyright © 2004-2005, Certified Security Solutions, Inc.
http://www.css-security.com
Security as a Dimension of Quality
Security Kaizen
– or – Quality Management for Information Security: A New Dog Learns Old Tricks

Security Kaizen
2 SEPG 2006. Copyright © 2004-2005, Certified Security Solutions, Inc.
Agenda
Introduction
• Background – Dimensions – Dependent relationships – Reciprocal benefits
• Japan – Genesis – Evolution – Execution – Lessons
• U.S. – Translation – Execution – Lessons
• Tools – Very brief review of tools
and methodology
Conventions
Ø Assumptions and assertions TERM: Definition. (Also at end of presentation.)
Quotation – Source
Security Kaizen
3 SEPG 2006. Copyright © 2004-2005, Certified Security Solutions, Inc.
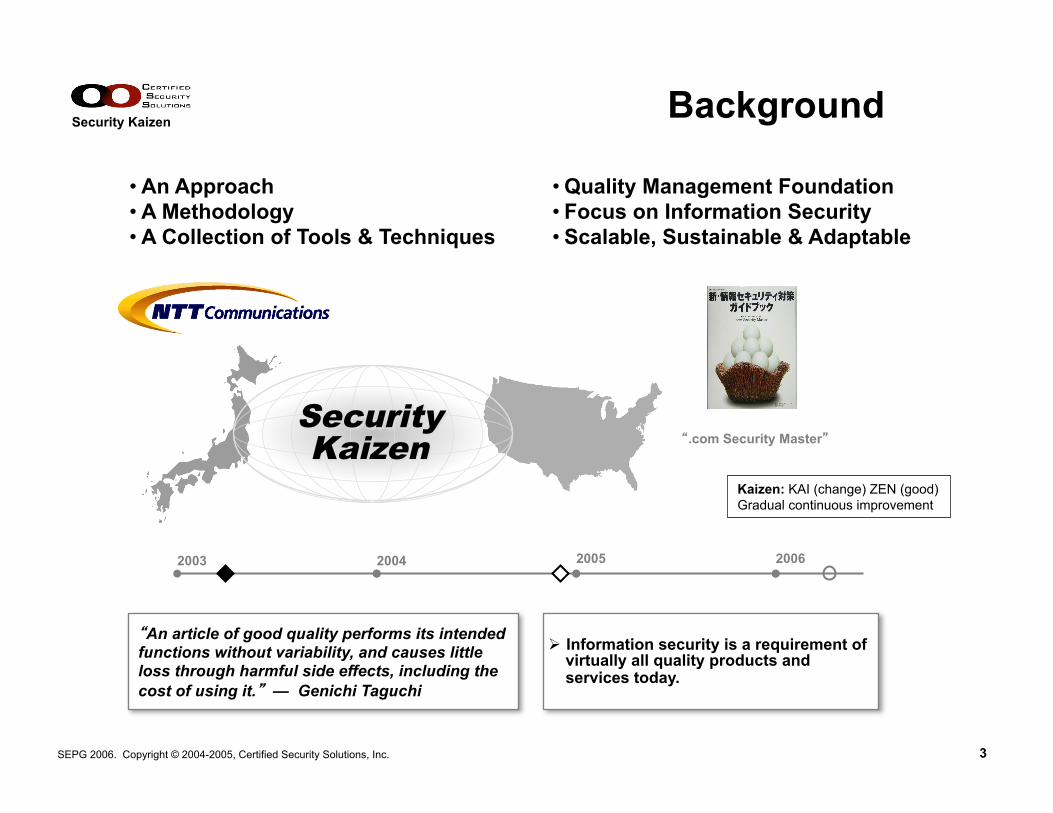
Background
2003 2004 2005
Security Kaizen
Kaizen: KAI (change) ZEN (good) Gradual continuous improvement
2006
• An Approach • A Methodology • A Collection of Tools & Techniques
• Quality Management Foundation • Focus on Information Security • Scalable, Sustainable & Adaptable
“.com Security Master”
Ø Information security is a requirement of virtually all quality products and services today.
“An article of good quality performs its intended functions without variability, and causes little loss through harmful side effects, including the cost of using it.” — Genichi Taguchi

Security Kaizen
4 SEPG 2006. Copyright © 2004-2005, Certified Security Solutions, Inc.
Dimensions In
form
atio
n Se
curit
y (ty
pica
l)
Design
Conformance
Performance Are our efforts paying off?
How well are we following the plan?
What’s important?
Dimension Focus
Internal
External
External
Supplier Process Customer
Design
Conformance
Performance
"We find in our fieldwork that companies that use regulatory compliance as the stick [to drive improvement] tend to be less capable..." — Julia Allen Ø The difference between internal
policy-based compliance and regulatory compliance is only the size of the hammer.
Ø Information security must pay as much attention to performance as conformance.
Ø Information security must become more customer focused and less internally focused.

Security Kaizen
5 SEPG 2006. Copyright © 2004-2005, Certified Security Solutions, Inc.
Dependent Relationships
PDCA: Plan-Do-Check-Act PDSA: Plan-Do-Study-Act ISMS: Information Security Management System (e.g., ISO 17799)
ITIL: IT Infrastructure Library
ITSMF: IT Service Management Forum
Quality Management
IT Management
(ITIL, ITSMF)
Security Management
(ISMS)
Dis
cipl
ines
, Tec
hniq
ues
& T
ools
(c
ultu
re, t
rain
ing
& e
duca
tion)
Dep
ende
ncie
s (“
Ask
why
5 ti
mes”)
PDCA (PDSA)
Process Management
Organizational Management
Ø The effectiveness of information security is dependent on the effectiveness of underlying IT, process and quality management.
Ø Information security is less a process and more a part of other processes.
Ø Effective information security requires the participation of process owners and operators.

Security Kaizen
6 SEPG 2006. Copyright © 2004-2005, Certified Security Solutions, Inc.
Reciprocal Benefits
Governance
Compliance
Audit
Risk
It’s what you should be doing
Leverage compliance for process management and improvement
Leverage process management and improvement for compliance
Capture, codify and disseminate best practices
Controls performance analysis
More robust processes
More accurate basis for information asset valuation
More accurate basis for risk assessment
Ø Control performance can be evaluated only in the context of a process.
Ø Governance and compliance is a largely is side effect of process management.
Ø Information asset valuation can only be accurately judged in the context of a process.
Security Kaizen
7 SEPG 2006. Copyright © 2004-2005, Certified Security Solutions, Inc.
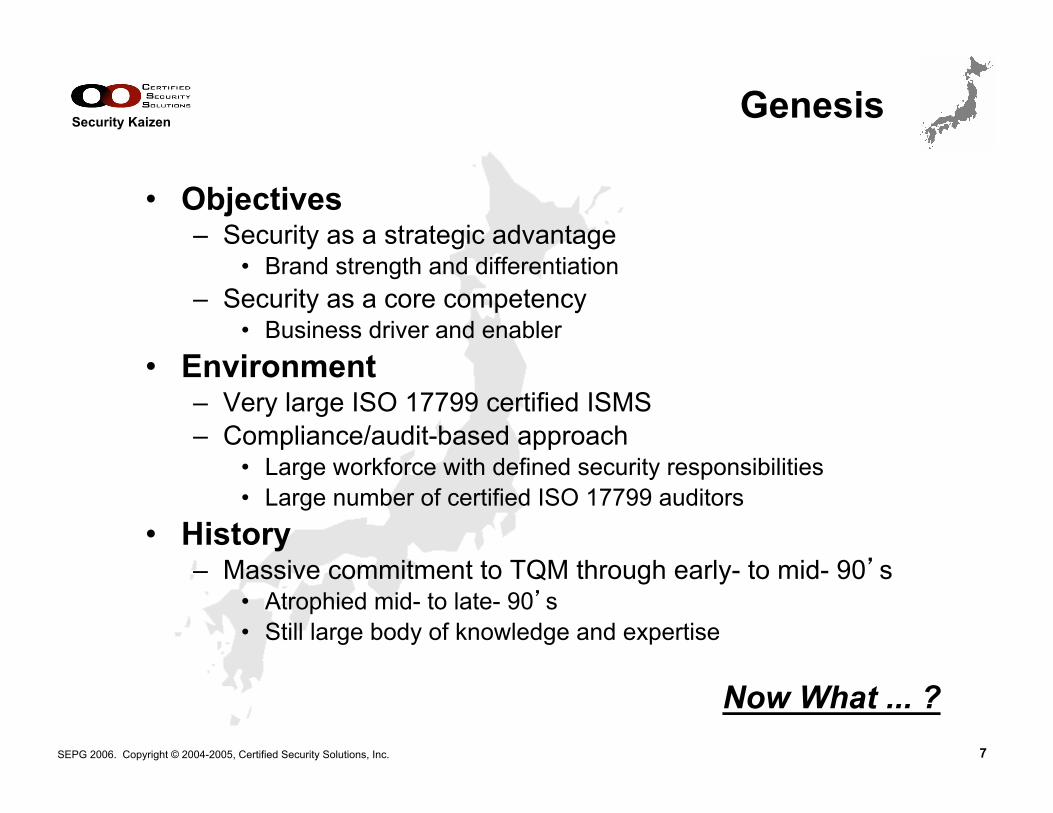
Genesis
• Objectives – Security as a strategic advantage
• Brand strength and differentiation – Security as a core competency
• Business driver and enabler • Environment
– Very large ISO 17799 certified ISMS – Compliance/audit-based approach
• Large workforce with defined security responsibilities • Large number of certified ISO 17799 auditors
• History – Massive commitment to TQM through early- to mid- 90’s
• Atrophied mid- to late- 90’s • Still large body of knowledge and expertise
Now What ... ?

Security Kaizen
8 SEPG 2006. Copyright © 2004-2005, Certified Security Solutions, Inc.
GEMBA
Evolution
Security Quality
• Make “security” more accessible. – Vocabulary, tools, techniques, measurements & metrics
• Make “security” improvement no different than other process or quality improvement activities.
– Treating security different is harmful
Intrinsic Customer focus
Extrinsic Internal focus
Engage
Participate
Contribute
Understand
Gemba: “where the action is”, e.g., the factory floor, the people who make it happen.
"Tell me and I will forget; show me and I may remember; involve me and I will understand.” — Chinese proverb
Disclosing confidential information to outsiders violates security policy.
Disclosing confidential information to outsiders puts our customers at risk.
We will not put our customers at risk, whether from action or inaction.
We will continually strive to reduce risk to our customers.

Security Kaizen
9 SEPG 2006. Copyright © 2004-2005, Certified Security Solutions, Inc.
Execution (1)
• Strategy – Security Kaizen is one (key) component
• Proof-of-concept – Prototype framework, techniques, tools, and tactics – Test, evaluate and refine
• Production – Six month cycle – 650+ Security Kaizen (gemba) teams
• Virtually the entire organization • Stripped down methodology
– Very limited initial training
2003 2004 2005
Strategy POC Dev
2006
Production Dev First cycle end
This discussion

Security Kaizen
10 SEPG 2006. Copyright © 2004-2005, Certified Security Solutions, Inc.
Mon
th 2
-6
Mon
th 1
Charter a Project Team
Map Project to Company Strategy
Develop a Robust Project Plan 2. Plan
5. Deploy
6. Improve
3. Define
4. Develop
1. Identify Select a starting point
Map the Process Workflow
Design New Processes (As Req’d)
Build Metric Causal Models
Conduct FMEA
Build SIPOC & Document Gemba
Develop Process Metric Controls
Deploy Performance Dashboard
Initiate Kaizen Cycle
Analyze Key Variables
Conduct Postmortem
Assess Policies and Practices
Process catalog
Metrics catalog
Execution (2)
Steps/tools used
Unused (by most teams)
Limited use (by most teams)

Security Kaizen
11 SEPG 2006. Copyright © 2004-2005, Certified Security Solutions, Inc.
Lessons (1)
ü Basic concept is sound – Quality management translates well
• Concepts and methods are easy to communicate • Tools and techniques apply well
ü The gemba is critical – They can and will participate and contribute
• Customer focus is essential; policy/compliance is insufficient – Critical for improvement; a key source of innovation
• “98% gemba expertise and 2% security expertise”
ü Training & education – A little can go a long way – “Pull” is better than “push”
• If they aren’t asking for it, something is wrong
Ø Many innovations in information security will be driven by the gemba.
Ø Most operational innovations in information security will be driven by the gemba.

Security Kaizen
12 SEPG 2006. Copyright © 2004-2005, Certified Security Solutions, Inc.
Lessons (2)
v Cross-functional issues – Can quickly dominate
• But a good indicator teams are shifting to external focus – Additional structure defined at end of first cycle
• Also to capture and disseminate lessons and innovation
• Process metrics v Compliance frameworks must be handled with care
• Simple and easy, but can be seductively misleading ü Instrumenting an “immature” process has benefits
• Graphically illustrates immaturity • Underscores design and operational issues

Security Kaizen
13 SEPG 2006. Copyright © 2004-2005, Certified Security Solutions, Inc.
Translation
• Adaptation of base methodology – Scaled down for small teams and limited projects
• Reduce front-end investment • Reduce objections to perceived load of Six Sigma, TQM, etc. • Suitable for typical information security expertise
• Initial engagement – Environment
• Merger/acquisition in progress • Just completed SOX compliance
– “Vulnerability management” project • Scan network, detect and remediate vulnerabilities • Management: familiar with some tools and techniques • Gemba team: not familiar with tools and techniques

Security Kaizen
14 SEPG 2006. Copyright © 2004-2005, Certified Security Solutions, Inc.
Execution (1)
Typical initial Security Kaizen project
Team • 4-6 permanent team members • 2-3 as-needed members • 1-2 quality and security experts/facilitators
Project • 12-14 weeks duration • 3-4 hours/week per team member • 250-400 team effort-hours total
Process • Focused steps (1 week average)
Step = output = task + tool + inputs • JIT learning
Knowledge transfer and team capability development
JIT: Just In Time
Dec 2004 Start Mar 2005 Scheduled end May 2005 Actual end Nov 2005 Fully operational

Security Kaizen
15 SEPG 2006. Copyright © 2004-2005, Certified Security Solutions, Inc.
Charter a Project Team
Map Project to Company Strategy
Develop a Robust Project Plan 2. Plan
5. Deploy
6. Improve
3. Define
4. Develop
1. Identify Select a starting point
Map the Process Workflow
Design New Processes (As Req’d)
Build Metric Causal Models
Conduct FMEA
Build SIPOC & Document Gemba
Develop Process Metric Controls
Deploy Performance Dashboard
Initiate Kaizen Cycle
Analyze Key Variables
Conduct Postmortem
Assess Policies and Practices
Process catalog
Metrics catalog
Execution (2)
Steps/tools used
Deferred or delayed Unused Limited use
Security Kaizen
16 SEPG 2006. Copyright © 2004-2005, Certified Security Solutions, Inc.
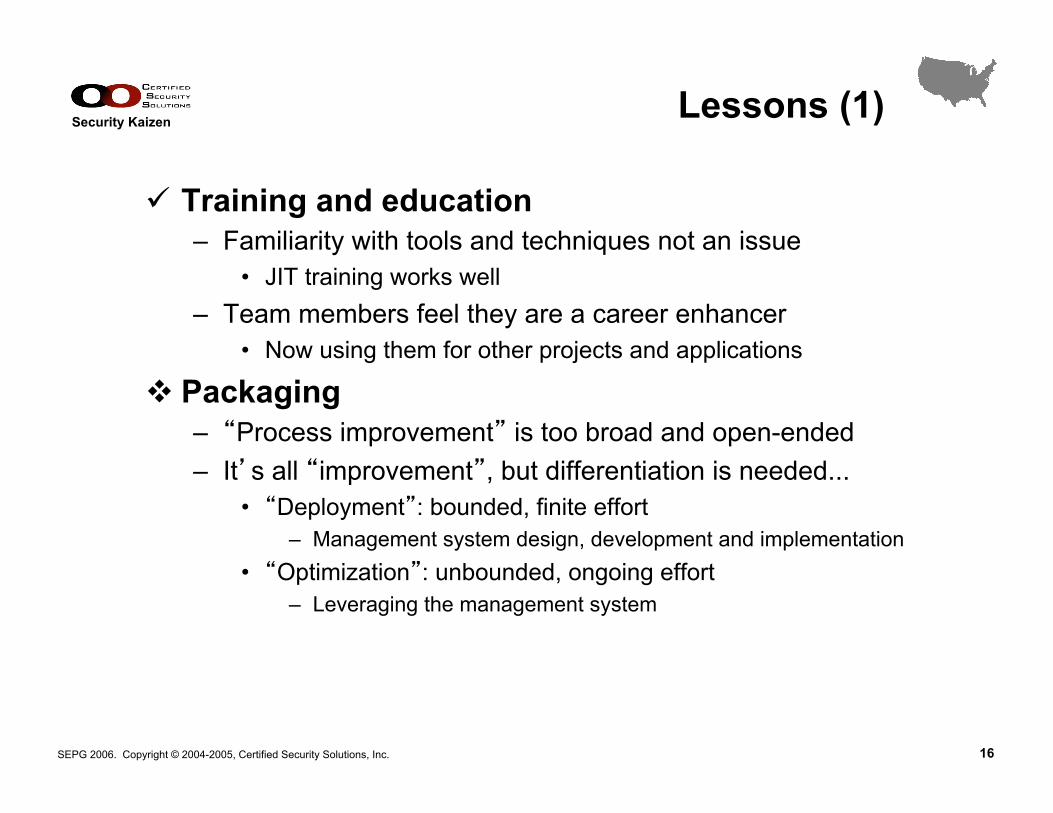
Lessons (1)
ü Training and education – Familiarity with tools and techniques not an issue
• JIT training works well – Team members feel they are a career enhancer
• Now using them for other projects and applications
v Packaging – “Process improvement” is too broad and open-ended – It’s all “improvement”, but differentiation is needed...
• “Deployment”: bounded, finite effort – Management system design, development and implementation
• “Optimization”: unbounded, ongoing effort – Leveraging the management system

Security Kaizen
17 SEPG 2006. Copyright © 2004-2005, Certified Security Solutions, Inc.
Lessons (2)
v Dashboards, data and metrics – Measurability and data collection significant issues
• Availability of data and cost of data collection – Not considered in original process design
• Voice of the Customer (VoC) is critical – Cost tradeoffs required
• Customer segmentation is critical – “Management scorecards” vs. “Operator dashboards”
• Purpose-built metrics design tool to assist
v The “metrics trap” – Everyone wants them...
• Tendency to collect data that is available but irrelevant • Tendency to regress to compliance metrics • Design is often left as an exercise to the student
– Formal design, VoC and segmentation help counteract

Security Kaizen
18 SEPG 2006. Copyright © 2004-2005, Certified Security Solutions, Inc.
Lessons (3)
v Methodology – Dashboards and metrics can be a good lever
• They are a means, not an end, however... • Without instrumentation you aren’t going to get far
– Dashboards are a visible and useful artifact • Provides useful deployment vs. optimization segregation • Development helped focus and facilitate interaction • Development helped highlight process design issues • Use helped highlight process operational issues
Ø Process metrics, dashboards and instrumentation are as good a driver as any.
Ø As long as it doesn’t begin and end there.

Security Kaizen
19 SEPG 2006. Copyright © 2004-2005, Certified Security Solutions, Inc.
Identify
PROJECT SELECTION MATRIX
Pote
ntial
Proj
ects
Vulnerability management
Backup
Security training & education
Ensu
re
info
rmat
ion
conf
iden
tialit
y
Incr
ease
se
curit
yaw
aren
ess
Ensu
re
info
rmat
oin
inte
grity
Link
to
orga
niza
tiona
lgo
als
Satis
fy
cust
omer
s
Physical access control
Security Goals Business Goals
Projectscore
109
62
45
77
Ensu
rein
form
atio
n av
ailab
ility
Δ
¡
l l l
l
l
l ¡
Δ
Δ
Δ Δ
Δ Δ
Δ
Δ Δ
Δ
No relationship(0 points)
Weak relationship(1 point)
Moderate relationship(3 points)
Strong relationship(9 points)Δ ¡ l
Δ
Weight 5 3 3 3 5 5
Figure 7 – Example Security Kaizen Project Selection Matrix
• What is important? • What should we focus on? • Why?
ISHIKAWA (FISHBONE) DIAGRAM
Countermeasures not uniformy installed
Figure 8 – Example Security Issues Fishbone Chart
Inadequate training
Weak passwordsCountermeasures break applications
Backups not documented Unavailable for contractors & third parties
Too Short Inadequate
Physical access to security arais is poorly enforced
External threats
Countermeasure breakage not tracked
ICT inventory not current
Policies & Practices
People
Facilities & EnvironmentEnvironment
System of Measurement
SecurityIssues
• What is important? • What should we focus on? • Why?
Tools

Security Kaizen
20 SEPG 2006. Copyright © 2004-2005, Certified Security Solutions, Inc.
Security Kaizen AWS Vulnerability Management
WEEK1 2 3 4 5 6 7 8 9 10 11 12
1. PLAN1.1 SK Orientation1.2 Process Walk-Through1.3 Project Plan1.4 Project Risk Assessment
2. DEFINE2.1 SIPOC
4. DEPLOY
2.3 CTQ Tree and KPI Matrix
Plan
2.5 Process Cost Model3. DESIGN
3.1 Metric Control Plan
2.2 Customer Seg Table
2.4 Policy and Practice Assessment
3.2 Correlation Matrix
4.1 Performance Dashboard4.2 Training and Communications
5. IMPROVE5.1 FMEA5.2 Continual Improvement5.3 Process Cost Report5.4 Transition Plan5.5 Postmortem & Next Steps5.6 Final Report
DETAILED PROJECT PLAN
• What is the plan?
Plan (1)
TEAM ROLES, RESPONSIBILITIES & AUTHORITY
Figure 9 – Security Kaizen Team Membership
Project champion
Project champion
Functional manager
Functional manager
Project Leader
Project Leader
Coach/facilitator
Coach/facilitator
Accounting/finance
Accounting/finance
IT security expert
IT security expert
Who benefits from the project?
Who has authority for decisions?
Who has the business-and process-specific knowledge?
Who has the expertise and skills?
Business authority
Process authority
Project authority
Business knowledge
Process knowledge
Process management advisor
Cost management advisor
Security advisor
Primary beneficiary
Permanent team members As-needed team members
• Who is on the project team? • Why?
STRATEGY MAP
Figure 10 – Example Security Kaizen Strategy Map
How
do shareholders see us?H
ow do custom
ers see us?W
hat must w
e excel at?H
ow can w
e continue to im
prove and create value?
Provide Global Solutions
Market Leadership
Revenue Growth
Information Security Leadership
Trusted Third Party Status
Source of Security Capability
Leaders in Information Stewardship
Identity & Transaction
ConfidentialityData Integrity
Data & System
Availability
Security Management
Business Information
Quality
Vulnerability Exposure Mitigation
Breakage Control & Mitigation
Security Culture
Managing Security Metrics
Kaizen& Six SigmaCapability
Financial PerspectiveC
ustomer Perspective
Internal ProcessLearning &
Grow
th
• How does this project map to organizational goals?
Tools

Security Kaizen
21 SEPG 2006. Copyright © 2004-2005, Certified Security Solutions, Inc.
PROJECT-STAKEHOLDER RISK ASSESSMENT
Figure 11 – Example Stakeholder Assessment and Risk Analysis
EnthusiasticWill work hard to make it happenHelp it workWill lend appropriate support
HesitantHolds some reservations; won’t volunteerNeutralWon’t help; won’t hurt
ReluctantWill need to be coaxed
OpposedWill openly act on and state oppositionHostileWill block at all costs
StakeholdersA B C D E
Commitment Project ImpactMinimal Moderate Significant
Prob
abilit
yHi
ghLo
wMe
dium
Issues
1. Scheduleconflicts1. Scheduleconflicts
2. Resourcelimitations2. Resourcelimitations
3. Lowperceived priority
3. Lowperceived priority
4. Lowawareness4. Lowawareness
5. Budgetlimitations5. Budgetlimitations
31
4
5
2
• Who and what are the risks to the project?
• How do we manage those risks?
Plan (2)
FORCE FIELD ANALYSIS • What are the forces that help or
hinder the project? • How do we manage those forces?
Tools

Security Kaizen
22 SEPG 2006. Copyright © 2004-2005, Certified Security Solutions, Inc.
PROCESS MAP
Figure 12 – Example Process Flowchart
Countermeasure Management
ICT Management Business Application Owner Vendor
System Security Vulnerability
Response Team (SSVRT)
Collect industry vulnerability
alerts
Evaluate threats to corporate
systems
Assess business system impact
Provide countermeasure
Identify required actions
Develop, test & validate
countermeasure
Develop countermeasure deployment plan
Deploy countermeasure
& update inventory
FollowupSelected IT Systems
ICTInventory
• What is the process flow?
Define (1) CUSTOMER SEGMENTATION TABLE & CTQ
Figure 15 – Example Customer Segmentation Table
WHO WHAT WHEN WHERE WHY HOW HOW MUCH COST CONTROL POINT CHECK POINT
User Community of ICT business systems
Protection from external threats caused by published vulnerabilities ; assurance of bus iness system integrity and reliability
24/7 Desktop sy stems on s ite and in work centers ; laptop sy stems at w ork, hom e, and off-site travel; telephony and w ireless communications on and off site.
Known v ulnerabilities threaten the organization's ability to deliv er products and serv ices safely and securely to customers
Countermeasures are developed in response to published vulnerabilities c lass ified as A, B, C, D or Z-lev el severity . Countermeasures are tes ted and v alidated, then deployed to the user community
In the last three-month period, countermeasures hav e been deployed for 6 level A's; 15 lev el B's, 20 level C's, and 21 lev el D's . In addition, 43 v ulnerabilities were noted and c lass ified as level Z: hav ing no effect.
In the last three months, the SSVRT logged 540 M anhours to deploy 62 countermeasures to approx imately 450 users.
SSVRT hours are managed in the ICT Adm inistrator's cost center.
ICT Administrators report on countermeasure deploy ment in the w eek ly status report. The SSVRT monthly report is deliv ered to the CIO during the ex ecutiv e briefing.
ICT Management Assurance of security for ICT assets against published vulnerabilities
Activ ities reported monthly SSVRT Operations is located in Building 157, Room 27
ICT Managem ent is responsible for managing ICT assets and is accountable to the offices of the CIO, CSO, and CFO
The SSVRT has 15 direc t employ ees and 3 contractors. One manager and two superv isors direct operations.
The SSVRT budgeted 2880 hours in the month of April 2004 w ith an additional 17 hours of unscheduled overtime.
In addition to 2897 M anhours , approx imately $5500 was spent on hardw are and software for the month of April 2004.
ICT Management is directed by office of the CIO.
ICT Management is responsible for the week ly ICT Administrator's status report and the SSVRT ex ecutiv e briefing.
CIO/CSO/CFO Ultimate respons ibility for ICT assets res ts in the offices of the Chief Information Officer, Chief Security Officer, and Chief Finance Officer
24/7 The CIO, CSO, and CFO offices are all in the ex ecutive suite in Building 100.
Annual budget for ICT asset protection from published v ulnerabilities was $1.5 mil for CY 2003.
The office of the CSO is respons ible for annual training and qualification of the SSVRT management and s taff.
Management and s taff of the SSVRT receives an annual security briefing, periodic certification training, ICT asset auditing training, and ad hoc specialized training.
T raining budget for SSVRT m anagement and s taff was $28,500 in CY 2003. Direct costs for on-site audits w as 1200 M anhours .
The SSVRT Manager is responsible for the annual training plan and quarterly audit.
SSVRT em ploy ees target 40 hours of training per calendar year.
Business Application Owners
Application owners rev iew vulnerability reports and ass ign a priority rating to systems that might be affected by a v ulnerability .
Weekly rev iew Business Application Owners are located at all corporate s ites.
Business Application Owners are directly responsible for ICT assets required for their bus iness operations.
Application ow ners spend approx imately two hours per m onth rev iew ing vulnerability data and receiv ing briefings. Weekly v ulnerability report is sent to all registered business application owners . Briefings are available to owners of impacted sy stems.
N /A N/A Business Application Owners report into their own Div ision Cost Centers.
SSVRT Briefings highlight affec ted business applications and s tatus counterm easure deploy ment.
Configuration Managers
Configuration Managers are responsible for updating the central ICT inventory report.
Ad hoc Configuration Managers are located at all corporate sites .
ICT inv entory is the key dis tribution guide for assess ing severity of published v ulnerabilities and deploy ing countermeasures.
Configuration Managers are instructed to ensure the ICT inv entory alway s reflfec ts the current configuration and location of ICT assets.
N /A Configuration Managers w ere budgeted at 11,000 M anhours in CY 2003.
Configuration M anagers report to the office of the CIO.
Configuration Managers are assigned directly to cost centers/work groups.
ICT Administrators Systems Managers are respons ible for installation, maintenance, and upgrade of all ICT assets.
Ad hoc ICT Administrators are located at all corporate sites .
Business Applications require full time ov ersight and maintenance by spec ialized sy stem /network administrators .
ICT Adminis trators are all certified system/network adminis trators and spec ialists in the bus iness applications in their s tewardship.
There are two ICT Adminis trators ass igned to every cost center for a total of 24 on s ite at Central Operations.
ICT Adminis trators were budgeted at 52,800 M anhours in CY 2003.
ICT Adm inistrators report to the office of the CIO and are matrixed to Bus iness Application Cost Centers .
The SSVRT tracks ICT inventory accuracy w ith a periodic audit.
• How do customers differ? • What do the customers want?
SIPOC
• Protection from external threats based on published vulnerabilities
• Countermeasure solutions free from unintended consequences
• Instruction on deploying countermeasures
• Timely identification of system vulnerabilities
• Severity assessment of vulnerabilities
• Accurate identification of ICT assets• Accurate location of ICT assets• Accurate identification of ICT asset
ownership• Verification of countermeasure
deployment
• Comprehensive vulnerability countermeasure deployment
• Update to ICT inventory• Vendor performance report• ICT inventory audit
• Timely identification of system vulnerabilities
• Severity assessment of vulnerabilities
• Accurate identification of ICT assets• Accurate location of ICT assets• Accurate identification of ICT asset
ownership• Verification of countermeasure
deployment
COUNTERMEASURE MANAGEMENT
• ICT management
• SSVRT
• Business applicationowner
• Vendors
Suppliers
• ICT business system user community
• ICT management
• CIO, CFO, CSO
• System and network managers
Customers
Inputs
Requirements
Outputs
Requirements
The COUNTERMEASURE MANAGEMENT PROCESS exists to respond to threats to information and communications technology assets by adopting or developing countermeasures to known ICT vulnerabilities
and ensuring that the countermeasures are implemented in all applications.
Aim of the Process
Figure 13 – Example SIPOC
• Who are the suppliers and customers? • What are the KPIVs and KPOVs?
CTQ: Critical To Quality KPIV: Key Process Input Variable SIPOC: Supplier-Input-Process-Output-Customer KPOV: Key Process Output Variable
Tools
Security Kaizen
23 SEPG 2006. Copyright © 2004-2005, Certified Security Solutions, Inc.
Process Performance MeasurementsExposureExposure • Time from publication of vulnerability to SSVRT notification by class
• Time from SSVRT notification to countermeasure implementation by class• Number of systems vulnerable due to failure to deploy countermeasure
• Time from publication of vulnerability to SSVRT notification by class• Time from SSVRT notification to countermeasure implementation by class• Number of systems vulnerable due to failure to deploy countermeasure• Manhours expended to develop countermeasure deployment plan• Manhours expended to deploy countermeasures• Manhours expended to audit system• Acquisition and operational costs of new hardware/software
• Manhours expended to develop countermeasure deployment plan• Manhours expended to deploy countermeasures• Manhours expended to audit system• Acquisition and operational costs of new hardware/software
CostCost
• Accuracy of ICT Inventory• Vendor countermeasure development first pass yield• SSVRT countermeasure development first pass yield• Business system breakage as a result of countermeasure implementation
• Accuracy of ICT Inventory• Vendor countermeasure development first pass yield• SSVRT countermeasure development first pass yield• Business system breakage as a result of countermeasure implementation
EffectivenessEffectiveness
Suppliers Customers
Aim of the Process
Figure 18 – Example Process SIPOC with Metrics
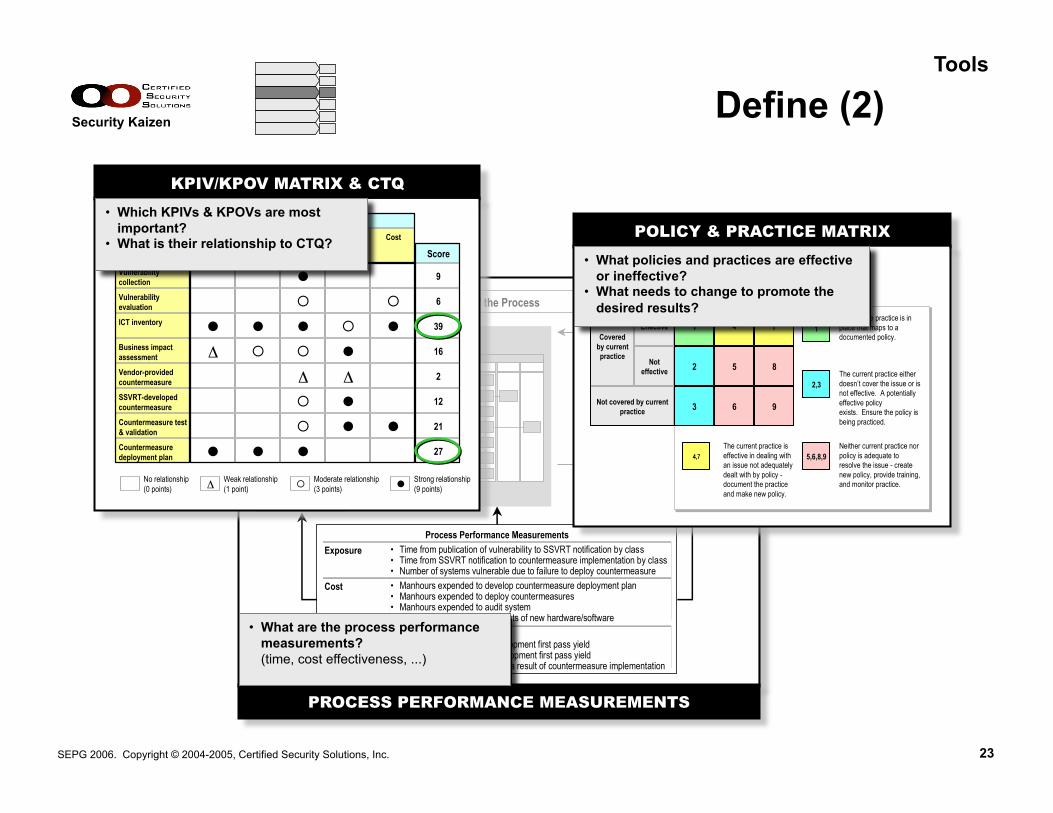
PROCESS PERFORMANCE MEASUREMENTS
• What are the process performance measurements? (time, cost effectiveness, ...)
Define (2)
POLICY & PRACTICE MATRIX
Covered by policy
Effective Not effective
Not covered by policy
Effective
Noteffective
Covered by current practice
Not covered by current practice
1 4 7
2 5 8
3 6 9
Currentpractice
Current policy
An effective practice is in place that maps to a documented policy.
The current practice either doesn’t cover the issue or is not effective. A potentially effective policy exists. Ensure the policy is being practiced.
The current practice is effective in dealing with an issue not adequately dealt with by policy -document the practice and make new policy.
Neither current practice nor policy is adequate to resolve the issue - create new policy, provide training, and monitor practice.
1
2,3
4,7 5,6,8,9
Figure 16 – Policy and Practice Assessment
• What policies and practices are effective or ineffective?
• What needs to change to promote the desired results?
KPIV/KPOV MATRIX & CTQ
Figure 14 – Example KPOV & KPIV Matrix
Responses (Y) KPOV
Factors (X) KPIVDeployment
accuracyInventory
updateaccuracy
Exposure(class A)
Breakage Cost
Vulnerability collection
Vulnerability evaluation
ICT inventory
Business impact assessment
Vendor-provided countermeasure
SSVRT-developed countermeasure
Countermeasure test & validation
Countermeasure deployment plan
Score
9
6
39
16
2
12
21
27
l
l l l l
l
l
l l
l l l
¡
¡ ¡
¡
¡
¡
¡
Δ
Δ Δ
No relationship(0 points)
Weak relationship(1 point)
Moderate relationship(3 points)
Strong relationship(9 points)Δ ¡ l
• Which KPIVs & KPOVs are most important?
• What is their relationship to CTQ?
Tools

Security Kaizen
24 SEPG 2006. Copyright © 2004-2005, Certified Security Solutions, Inc.
Policy & Practice Detail
Covered by policy
Effective Not effective
Not covered by policy
Effective
Not effective
Covered by current practice
Not covered by current practice
1 4 7
2 5 8
3 6 9
Current practice
Current policy An effective practice is in
place that maps to a documented policy.
The current practice either doesn’t cover the issue or is not effective. A potentially effective policy exists. Ensure the policy is being practiced.
The current practice is effective in dealing with an issue not adequately dealt with by policy - document the practice and make new policy.
Neither current practice nor policy is adequate to resolve the issue - create new policy, provide training, and monitor practice.
1
2,3
4,7 5,6,8,9

Security Kaizen
25 SEPG 2006. Copyright © 2004-2005, Certified Security Solutions, Inc.
Develop
METRICS CONTROL PLAN
Countermeasure Management Process Metric Control Plan
Collect industry vulnerability
alerts
Evaluate threats to corporate
systems
Assess business
system impact
Provide countermeasure
Identify required actions
Develop, test & validate
countermeasure
Develop countermeasure
deployment plan
Deploy countermeasure
& update inventory
FollowupSelected IT Systems
ICTInventory
Figure 17 – Example Process Metric Control Plan
ICT Management Business Application Owner Vendor
System Security Vulnerability
Response Team (SSVRT)
Frequency of vulnerability alerts
Count of alerts per week
KPIV(X) StableMean = 6.4Std Dev = 2.32
Control chart
Measurement or metric
Units of measure Type PerformanceControl
method
Accuracy of ICT inventory
Percent defective records per sample
KPIV(X)KPOV(Y)
StableMean =37.2Std Dev =15.72
Control chart
Vendor or SSVRT countermeasure 1st pass yield
Percent countermeasures through QA 1st pass
KPOV(Y) StableMean = 63.4Std Dev = 7.02
Bar chart
Control chart
Systems vulnerable due to missed schedule
Count of vulnerable systems per quarter
KPOV(Y) Unstable - out of control points under investigation
Control chart
Business system breakage
Percent systems broken by countermeasure
KPOV(Y) Unstable - out of control points under investigation
Bar chart
Control chart
Business applications affected
Count of affected applications per week
KPIV(X) StableMean = 4.1Std Dev = 1.52
Pareto chart
Coverage achievement of countermeasure deployment
Percent affected systems covered
KPOV(Y) StableMean = 86.0Std Dev = 8.33
Control chart
• What are the metrics’ relationship to the process?
• What are the metrics’ attributes? • How do we communicate the metric?
METRICS DESIGN MATRIX � � � � �
� � � � �
�
�
�
� �
� �
� �
� �
� � � � �
� � � � � � �
� �
� � � �
Exposure Vulnerability Profile
VMP Effectiveness
VMP Costs by Network Segment
System Admin Practices
Accepted Risk Practices
Blue Scan Coverage Scan Accuracy Scan Breakage Scan Cycle
TimeNetwork Scan
Costs
Primitive Measure
Network Segments Scanned � � � � � � � � �# Known Vulnerabilities � � �# New Vulnerabilities � � �Total # Accepted Risks � �# Accepted Risks by Category � �# Systems Scanned � � � � �# Systems Not Scanned by Customer Request � � �# Systems Regressed � � �# Soft Vulnerabilities � �# Systems with Known Vulnerabilities � � �# Systems with New Vulnerabilities � �# Systems with Repeat Vulnerabilties � �# IP Addresses with Known Vulnerabilities �# IP Addresses with New Vulnerabilities �# of IP Addresses Scanned � � �# of IP Addresses Not Scanned by Customer Request � �# False Positives Reported by Tool � �# False Negatives Reported � �# False Negatives Reported by Category � �Unintended System Downtime Caused by Scan � �Unintended System Downtime Caused by Remediation �Monthly VMP MH Expended � �Monthly Network Scan MH Expended �Hours to Scan � �Hours from Scan Start to Findings DB Open � �Hours from Vulnerability Publication to Vulnerability Closed and Verified � �
MH expended to accomplish network scan cycle
Number of soft vulnerabilities
Pareto of accepted risks by category and network segment
Ratio of false positive findings to validated findings
Hours of system downtime caused by network scan
Pareto of vulnerabilities by platform, vulnerability type, and network segment
DPMO (Sigma Score) of vulnerabilities effectively remediated
Total MH expended in VMP by month
Hours from time of scan start to findings data base open
% of IP addresses included in network scan
Measureability
Security Kaizen Metric
L - M - H
Hours from time vulnerability is published to time remediation is closed
Network Scan Customer Voice
What is the effect of the VMP on System Availability?
Was the Remediation of Vulnerabilities Effective?
What are the known and new vulnerabilities discovered in my systems?
Which vulnerabilities are caused by software design?
How much do we spend on the VMP process?
How effective is the network scan process?
How efficient is the network scan process?
Are we improving?
How much of my network segment was scanned?
Which vulnerabilities are preventable by system administration practices?
How should I prioritize vulnerability remediation efforts?
Network ScanVMP Policy / Practice
Network Scan Customers (Sustainment Managers)
Enterprise
How effective is the VMP Process?
What is our exposure to vulnerabilities in our network?
VMP Customers (Remediation Managers)
Executive Management
Network Scan Team
• What are the questions metrics should answer? For whom?
• What measurements contribute to those metrics?
• What is the effort required to obtain the measurements?
Tools

Security Kaizen
26 SEPG 2006. Copyright © 2004-2005, Certified Security Solutions, Inc.
1. Select metrics that answer customer verbatims
2. Link VoC, metrics and primitive measures
3. Assess measurements for accessibility, reliability, and validity
Metrics Design Detail
VoC
Indicators & Goals

Security Kaizen
27 SEPG 2006. Copyright © 2004-2005, Certified Security Solutions, Inc.
Deploy
PERFORMANCE DASHBOARD
56484032241680
LSL USLProcess Data
Sample N 47StDev (Within) 9.25940StDev (O v erall) 8.12971
LSL 0.00000Target *USL 35.00000Sample Mean 40.18704
Potential (Within) C apability
C C pk 0.63
O v erall C apability
Pp 0.72PPL 1.65PPU -0.21Ppk
C p
-0.21C pm *
0.63C PL 1.45C PU -0.19C pk -0.19
O bserv ed PerformancePPM < LSL 0.00PPM > USL 723404.26PPM Total 723404.26
Exp. Within PerformancePPM < LSL 7.12PPM > USL 712325.79PPM Total 712332.91
Exp. O v erall PerformancePPM < LSL 0.38PPM > USL 738274.68PPM Total 738275.06
WithinOverall
Process Capability of Application Exposure
Observation
Indi
vidu
al V
alue
5045403530252015105
300
275
250
225
200
175
150
_X=214.4
UCL=273.1
LCL=155.6
1
1
1
1
1
I Chart of Patch Mgmt Costs
Coun
t
Perc
ent
Vulnerabilities by ClassCount
6.7Cum % 42.2 75.6 93.3 100.0
19 15 8 3Percent 42.2 33.3 17.8
ABCD
50
40
30
20
10
0
100
80
60
40
20
0
Pareto Chart of Vulnerabilities by Class
Observation
Indi
vidu
al V
alue
45403530252015105
100
95
90
85
80
_X=91.19
UCL=100.04
LCL=82.35
I Chart of Patch QA 1st Pass
Observation
Ind
ivid
ua
l V
alu
e
121110987654321
25
20
15
10
5
_X=16.37
UC L=27.64
LC L=5.09
Observation
Mo
vin
g R
an
ge
121110987654321
15
10
5
0
__MR=4.24
UC L=13.85
LC L=0
Individual and Moving Range for Reported Vulnerabilities
• What is the process performance? (“gemba version”)
METRICS CORRELATION MATRIX
⇓
⇓
⇑
⇑
⇓
⇑Percent coverage of countermeasure deployment.
Percent SSVRT countermeasures resulting in business system breakage.
Percent SSVRT developed countermeasures first pass yield.
Perecent vendor provided countermeasure first pass yield.
Percent of ICT inventory records incomplete or inaccurate.
Elapsed time trom publication of vulnerability to countermeasure deployment.
•
•
•
++––
++•
++++
++++++
––
++––
Correlation
++ Positive –– Negative • None
⊕ On target is better
⇓ Smaller is better
⇑ Larger is better
Direction of improvement
Figure 19 – Example Process Metrics Correlation Matrix
• How are the metrics related to each other?
Tools

Security Kaizen
28 SEPG 2006. Copyright © 2004-2005, Certified Security Solutions, Inc.
FMEA
Figure 22 – Example FMEA Chart
Page: 1 1Date: FMEA Type:
System: FMEA Number: Subsystem: Prepared By: Core Team: FMEA Date:
Rev #: Revision Date:
Item / Function
Potential Failure Mode(s)
Potential Effect(s) of Failure SE
V
Potential Cause(s)/
Mechanism(s) of Failure
PROB Current Process
Controls DET
RPN Recommended
Action(s)
Responsibility & Target
Completion DateActions Taken
New
Sev
New
Prob
New
Det
New
RPN
ICT administrators fail to accurately update the inv entory
10 ICT administrators are reminded to be accurate during annual training
10 1000 Implement a "Verified Inv entory List (VIL) " w ith effectiv e controls
ICT Management -- August 2004
Initial Planning Meeting held 12 May - full attendance - actions assigned
10 4 2 80
ICT administrators hav e no w ay of know ing if the inv entory is accurate or not
10 ICT administrators rely on random audits and make updates on an ad hoc basis
6 600 Implement a statistical sampling plan to ev aluate inv entory accuracy and implement VIL
ICT Management -- July 2004
3 Planning Meetings held -- team formed -- sampling plan drafted. Project is scheduled
10 2 2 40
ICT administrators fail to accurately update the inv entory
10 ICT administrators are reminded to be accurate during annual training
10 1000 Implement a "Verified Inv entory List (VIL) " w ith effectiv e controls
ICT Management -- August 2004
Initial Planning Meeting held 12 May - full attendance - actions assigned
10 4 2 80
ICT administrators hav e no w ay of know ing if the inv entory is accurate or not
10 ICT administrators rely on random audits and make repairs on an ad hoc basis
6 600 Implement a statistical sampling plan to ev aluate inv entory accuracy and implement VIL
ICT Management -- July 2004
3 Planning Meetings held -- team formed -- sampling plan drafted. Project is scheduled
10 2 2 40
PROCESS 123.2
ofFMEA Objective, scope and goal(s):Security Kaizen FMEATo ensure that the COUNTERMEASURE MANAGEMENT PROCESS is an effective response to published vulnerabilities in our Information and Communication Technology systems.
4.12.2004ICT
Gemba Guy4.12.2004
Incomplete
Ex posure is increased because v ulnerable sy stems are missed in the countermeasure deploy ment plan
SSVRT1.1
CONFIGURATION
Action Results
10
10
4.13.2004
ICT Inventory
Ex posure is increased because v ulnerable sy stems are missed in the countermeasure deploy ment plan
Not up to date
• How do we make the process more robust?
Improve
SECURITY KAIZEN
Charter a Project Team
Map Project to Company Strategy
Develop a Robust Project Plan 2. Plan
5. Deploy
6. Improve
3. Define
4. Develop
1. IdentifySelect a starting point
Map the Process Workflow
Design New Processes(As Req’d)
Build Metric Causal Models
Conduct FMEA
Build SIPOC & Document Gemba
Develop Process Metric Controls
Deploy Performance Dashboard
Initiate Kaizen Cycle
Analyze Key Variables
Conduct Postmortem
Assess Policies and Practices
Process catalog
Metrics catalog
Lather, rinse, repeat, …
FMEA: Failure Mode and Effect Analysis
Tools

Security Kaizen
29 SEPG 2006. Copyright © 2004-2005, Certified Security Solutions, Inc.
Summary
• This is still a work-in-progress – Only a few proof points – But we’re learning and adapting rapidly
• This is an exercise program... ...not a pill – It is not for everyone – Developing capability is critical
• This is one way – How to develop that capability is the issue
• Must be packaged for the intended audience – Six Sigma, TQM, CMM, etc. carry a lot of perceived baggage
• They might be at the same place in 20 years... – ...but today information security management is primitive – ...and the “metrics! metrics! metrics!” refrain is becoming
deafening and distracting
"The whole notion of maturity as reflected in the CMM is built on the notion of long-term practice. There were 20 years of experience to base the CMM on... That doesn't exist yet in information security.” — Julia Allen

Thank You
http://www.css-security.com

Security Kaizen
31 SEPG 2006. Copyright © 2004-2005, Certified Security Solutions, Inc.
Terms and Abbreviations
CTQ — Critical To Quality — Factors that are critical to quality, e.g., satisfying customer requirements. FMEA — Failure Mode and Effect Analysis — A method that examines a process for potential failures, the
effect of those failures, and actions to mitigate the effect of failures. Gemba — Japanese for “where the action is”. In quality management, this refers to where the work is
performed. For example, the factory floor. ISMS — Information Security Management System (e.g., ISO 17799) ITIL — IT Infrastructure Library ITSMF — IT Service Management Forum JIT — Just In Time — Most commonly used to describe product or inventory management systems that
deliver inputs just in time, based on demand, or “pull” instead of “push”. Kaizen — Japanese for “improvement”. In quality management, kaizen has come to mean bottom-up,
incremental (evolutionary) and continuous improvement, and a framework for continuous improvement.
KPIV/KPOV — Key Process Input/Output Variable — The most important (key) inputs to and outputs from a process.
PDCA, PDSA — Plan-Do-Check-Act or Plan-Do-Study-Act — PDSA is used in the US due to misinterpretation of the meaning of “check”.
The Process — As used herein, a business process (as opposed to, e.g., the “Security Kaizen Process”).
Process performance — Measurement of process performance, such as time, cost, effectiveness, etc. There are many measures of performance, depending on customer and requirements. For purposes of security, “risk” may be one measure of process performance.
SIPOC — Supplier-Input-Process-Output-Customer — a map of the process including suppliers and their inputs to the process, and customers and the outputs from the process.
VoC — Voice of the Customer.
Security Kaizen
32 SEPG 2006. Copyright © 2004-2005, Certified Security Solutions, Inc.
Additional Reading and References
.com Security Master, NTT Communications (NTT Communications, 2004; available only in Japanese) The New Economics For Industry, Government, Education, W. Edwards Deming (Massachusetts Institute of Technology, 1994) Managerial Breakthrough, Joseph M. Juran (McGraw-Hill, 1994; first published 1964) Company-Wide Total Quality Control, Shigeru Mizuno (Asian Productivity Organization, 1988) Systems Thinking and Learning, Stephen G. Haines (HRD Press, 1998) A Field Guide to Focused Planning: Hoshin Kanri – American Style, Joe Colletti (The Woodledge Group, 1995) Quality Function Deployment: Integrating Customer Requirements into Product Design, Yoji Akao (English edition – Productivity Press, 1990) The QFD Handbook, Jack B. ReVelle, et. al. (John Wiley and Sons, 1998) Step-by-Step QFD: Customer-Driven Product Design, John Terninko (CRC Press, 1997) Rath & Strong’s Six Sigma Leadership Handbook, Thomas Bertels (John Wiley and Sons, 2003) Six Sigma for Business Leaders: A Guide To Implementation, Gregory H. Watson (GOAL/QPC, 2004) Six Sigma Business Scorecard, Praveen Gupta (McGraw-Hill, 2004) The Six Sigma Handbook, Thomas Pyzdek (McGraw-Hill, 2003) Failure Mode and Effect Analysis: FMEA from Theory to Execution, D. H. Stamatis (ASQ Quality Press, 1995) Kaizen: The Key To Japan's Competitive Success, Masaaki Imai (McGraw-Hill/Irwin, 1986) Taguchi's Quality Engineering Handbook, Genichi Taguchi (Wiley-Interscience, 2004) Toyota Production System: Beyond Large-Scale Production, Taiichi Ono (Productivity Press, 1988)
Security Kaizen
33 SEPG 2006. Copyright © 2004-2005, Certified Security Solutions, Inc.
Joe Kovara, CTO and Principal Consultant ([email protected]) Joe Kovara has more than 25 years in the Security and IT industries with extensive experience in all aspects of Information Security, operating systems and networks, as well as in the development and practical application of new technologies to a wide variety of applications and markets. Joe holds patents on self-configuring computer systems and networks. Prior to joining CSS in 2001, Joe was CTO of CyberSafe Corporation. Joe was a key contributor to CyberSafe's growth and in bringing several enterprise-security products to market and deploying them in mission-critical Fortune 100 environments. Jeffrey Elliott, Principal Consultant ([email protected]) Jeffrey Elliott has more than 20 years experience practicing and teaching quality management. Jeffrey has dedicated the past year to working with Joe Kovara on the development and refinement of Security Kaizen. Jeffrey’s career has included positions as Six Sigma Master Black Belt on projects at Lockheed Martin and Sun Microsystems. He cofounded the Total Quality Management program at San Jose State University and has presented seminars on practical applications of quality principles in Australia and Mexico. Rick DeCamp, Vice President, Product Development and Marketing ([email protected]) Rick DeCamp has been with Certified Security Solutions since its inception. Rick has over 15 years of experience successfully selling IT and security solutions, services and products. He has responsibility for Product Development and Marketing for North America. Prior to joining CSS, Rick was the North American Sales Director for CyberSafe Corporation. He joined CyberSafe in 1994, and was responsible for opening international, national and regional markets, before leaving in 2001 to join CSS.
Who we are
http://www.css-security.com +1.425.216.0720