sede administrat doutoramento iva fac fac ins ... · investigating lysine methylation of rna...
TRANSCRIPT

INSTITU
TO D
E CIÊNCIA
S BIOM
ÉDIC
AS A
BEL SALA
ZAR
FACULD
AD
E DE CIÊN
CIAS
FACULD
AD
E DE M
EDICIN
A
João Diogo D
ias . Investigating lysine m
ethylation of RNA polym
erase II CTD
Investigating lysine methylation of RN
A polym
erase II C-terminal dom
ain
João Diogo D
ias
Investigating lysine methylation of RNA polymerase II C-terminal domain
João Diogo Dias
D 2016
D.IC
BA
S 2016
SEDE A
DM
INISTR
ATIVA
Doutoramento
Biologia Básica e Aplicada

João Rodrigo Diogo Dias
Investigating lysine methylation of
RNA polymerase II C-terminal domain
Tese de Candidatura ao grau de Doutor em Biologia Básica e Aplicada submetida ao Instituto de Ciências Biomédicas Abel Salazar da Universidade do Porto.
Orientador – Prof. Dr. Ana Maria Pires Pombo
Categoria – Full Professor
Afiliação – Berlin Institute for Medical Systems Biology, Max Delbrueck Center for Molecular Medicine and Humboldt University of Berlin, Berlin, Germany
Co-orientadora – Doutora Maria Alexandra Marques Mourão do Carmo
Categoria – Investigadora Principal
Afiliação – Gene Regulation Group, Instituto de Investigação e Inovação em Saúde, Universidade do Porto
2016


The work herein presented was developed in Prof. Ana Pombo´s laboratory initially at the MRC Clinical Sciences Centre, Imperial College, Hammersmith Hospital Campus, London, UK and currently at the Berlin Institute for Medical Systems Biology, Max Delbrueck Center for Molecular Medicine, Berlin, Germany. Financial support was provided by Fundação para a Ciência e Tecnologia (FCT) by means of a PhD fellowship attributed to João Rodrigo Diogo Dias (SFRH/BD/51005/2010) through the Graduate Program in Areas of Basic and Applied Biology (GABBA), Universidade do Porto, Portugal.


Publications The results presented on this thesis have been published as a first author paper: Dias, J.D., Rito, T., Torlai Triglia, E., Kukalev, A., Ferrai, C., Chotalia, M., Brookes,
E., Kimura, H., and Pombo, A. (2015). Methylation of RNA polymerase II non-
consensus Lysine residues marks early transcription in mammalian cells. Elife, 4.
e11215.

Here I state that the work presented on this thesis was planned, performed, analysed, discussed and written by me and the experimental contributions and data analysis performed by others is acknowledged below: Chapter 3 - K7 methyl antibodies were produced by Hiroshi Kimura, Tokyo Institute of Technology, Yokohama, Japan and Naohito Nozaki, MAB Institute Inc., Sapporo, Japan. Chapter 4 - ChIP-seq libraries were produced by Carmelo Ferrai assisted by me and Alexander Kukalev; bioinformatic analysis was performed by Tiago Rito and Elena Torlai Triglia; RNA-seq libraries were performed by me and Carmelo Ferrai; Robert Beagrie and Tiago Rito analysed RNA-seq data, all members of Pombo´s lab. Chapter 5 – Alexander Kukalev (Pombo´s lab) performed the CTD peptide pulldowns.

Acknowledgements
1
Acknowledgements
In first place, I would like to thank my supervisor Ana, for her guidance, support,
dedication and patience along this PhD journey. Thank you for taking me on board
of a lab full of wonderful people.
Thank you Hiroshi, for being such a generous and kind collaborator, your
contribution was very important to make this project happen.
Thank you Genome function / Epigenetic regulation and chromatin architecture
lab, I am sure I will hardly find such a friendly and helpful workplace in the future.
Thank you so much Mariano, Sasha, Carmelo, Elena, Tiago, Dorothee, Rieke,
Giulia, Ana Miguel, Rob, Gesa, Marta, Leo, Julieta, Kelly Jane, Markus, Nadina,
Kedar, Liron, Inês de Castro, Inês Santiago, Emily, Mita, Claudia, Sheila, Isa and
Marisa (hopefully no one was forgotten).
A big thank you for Elena, Tiago and Sasha for all the help for the paper revision.
Thank you Alexandra for the Regulation of Gene Expression classes in GABBA as
it was one of the main reasons I decided to pursue a PhD in this area, and thank
you for always being helpful even if I spend months and months without giving
news.
I would like as well to thank GABBA program coordinators and all teachers as it
was a great experience and I have learned so much during those months.
Thank you GABBA 13 people (Joana, Mariana, Clara, Olga, Zé, Bruno, João,
Teresa, Margarida, Sara and Susana), it was great to spend that rainy winter in
Porto with you.
Thank you again Kelly, Doro and Inȇs for those first months in Berlin when the
machines and experiments stopped working in German soil, perhaps missing the
appropriate British room temperature settings, therefore all the restaurants and
bars in Prenzlauer Berg had to be tested.
Thank you “London people” (mãezinhas Joana e Silvia, João, Mariana, Matteo
(frato), Hakan, menina Sadaf, and the rest of CSC people), those London years
are full of good memories and have been deeply missed because of you … and
Café Oto.
Thank you FCUL and C8 crew (Rodrigo, Catarina, Inȇs, Eliane, Helder, Nuno,
Vanessa, Rita, Marisa), 14 years have passed, some of you have reproduced and
you guys still like me! Impressive!
Thank you Nuno, Hugo, Matilde, Rita, Ivo e Andreia, I hope I can spend more time
in Lisboa and see you more often in future.
Thank you Cíntia, Nuno and Diogo for always having me around in the “Pensão
Pereira-Águas” with a smile and for being so nice to me.
Thank you Rã for all the kilos of cheese and bottles of wine shared.

Acknowledgements
2
Thank you Dr. “Harald”. I know this is not the same as being mentioned on the
credits of a Berlinale movie but it is the best I can do.
I should probably thank some unnamed people and I am sure you will forgive me.
If you know me well enough to be mentioned here you can guess this was written
at 3 am the night before printing the thesis.
At last thank you mum and dad for all your love and patience and for believing and
helping me since the day I was born. I dedicate this thesis to you and to Avô Diogo
and Avó Gena.

Abstract
3
Abstract
Transcription by RNA polymerase II (RNAPII) is a highly regulated process with a
central role in gene expression. RNAPII largest subunit, RPB1, has a unique
regulatory domain, the C-terminal domain (CTD), composed of multiple
heptapeptide repeats with consensus sequence Y1-S2-P3-T4-S5-P6-S7. Dynamic
post-translational modification of CTD repeats coordinates the co-transcriptional
recruitment of enzymatic complexes that regulate transcription, chromatin
remodelling and processing of nascent RNA. Phosphorylation of serine residues,
the best characterized CTD modification, occurs at different stages of the
transcription cycle, with S5 and S7 phosphorylation being associated with initiation
and S2 phosphorylation marking productive elongation.
The number of CTD repeats has increased from unicellular and less complex
eukaryotes to vertebrates and other metazoans. The distal region of the CTD
accumulated substitutions in the consensus sequence with the seventh position of
the heptapeptide being the most variable and lysine residues (CTD-K7) the most
common non-consensus amino acid. The presence of eight CTD-K7 residues in
the vertebrate CTD has the potential to increase the diversity of post-translational
modifications and regulatory networks converging on the CTD. CTD-K7 acetylation
(K7ac) has been previously described and found associated with RNAPII pausing
at EGF-inducible genes.
In this thesis, I describe mono- and dimethylation of CTD-K7 residues (CTD-
K7me1 and CTD-K7me2) in both vertebrates and invertebrates. CTD-K7me1 and
CTD-K7me2 are associated with early stages of transcription and enriched at the
5´ end of active genes accompanying or preceding S5 and S7 phosphorylation.
CTD-K7ac is present at both 5´ ends and gene bodies and correlates more directly
with S2p and mRNA levels. Further investigations exploring genome-wide data
integrate CTD-K7 mono- and dimethylation within the complex network of CTD
modifications regulating transcription and gene expression, placing CTD-K7
methylation as one of the earliest events in the transcription cycle. The use of
chemical inhibitors, CTD mutant cell lines and bioinformatic analysis revealed a
regulatory mechanism based on the promoter levels of CTD-K7me2 and CTD-

Abstract
4
K7ac that modulates gene expression. CTD-K7 residues and associated post-
translational modifications are therefore a paradigm of novel regulatory pathways
relevant for regulation of gene expression.

Sumário
5
Sumário
A transcrição efectuada pela RNA polimerase II (RNAPII) é um processo
extremamente regulado e desempenha uma função central na expressão
genética. RPB1, a maior subunidade da RNAPII, tem um domínio regulatório
único, o domínio carboxi-terminal (CTD), constituído por múltiplas repetições de
heptapéptidos com a sequência consenso Y1-S2-P3-T4-S5-P6-S7. A adicção
dinâmica de modificações pos-traducionais nos heptapéptidos do CTD coordena o
recrutamento co-transcricional de complexos enzimáticos que regulam a
transcrição, a remodelação da cromatina e o processamento do RNA nascente. A
fosforilação das serinas, a modificação melhor caracterizada até à data, ocorre
em diferentes etapas do ciclo transcricional, sendo que fosforilação da S5 e S7
ocorre na fase de iniciação e a fosforilação da S2 marca a fase de alongamento.
O número de heptapéptidos do CTD aumentou dos eucariotas unicelulares e
menos complexos para os vertebrados e outros metazoários. A região distal do
CTD acumulou substituições na sequência consenso dos heptapéptidos, sendo a
sétima posição a mais variável e as lisinas a substituição não canónica mais
frequente. A presença de oito resíduos CTD-K7 no CTD dos vertebrados tem o
potencial para aumentar a diversidade de modificações pos-traducionais e os
sistemas regulatórios associados ao CTD. A acetilação de CTD-K7 foi descrita
anteriormente e está associada ao “pausing” da RNAPII em genes induzidos por
EGF.
No trabalho apresentado nesta tese, eu descrevo mono- e dimetilação dos CTD-
K7 resíduos (CTD-K7me1 e CTD-K7me2) em vertebrados e invertebrados. CTD-
K7me1 e CTD-K7me2 estão associadas às etapas iniciais da transcrição e
acumuladas nas extremidades 5´ dos genes activos, acompanhando ou
precedendo a fosforilação de S5 e S7. CTD-K7ac está presente nas extremidades
5´ e mais a jusante no interior dos genes estando mais directamente
correlacionada com os níveis de S2p e mRNA. Investigações adicionais,
explorando dados genómicos integraram CTD-K7 mono- e dimetilação na
complexa rede regulatória de modificações do CTD que regulam a transcrição e
expressão genética, colocando a metilação das CTD-K7 como um dos primeiros
eventos no ciclo transcricional. Investigações usando inibidores químicos, linhas

Sumário
6
celulares expressando variantes do CTD com mutações, e análises
bioinformaticas revelaram um mecanismo regulatório baseado nos níveis de CTD-
K7me2 e CTD-K7ac nos promotores capaz de modelar a expressão genética. Os
resultados descritos neste estudo apresentam os resíduos CTD-K7 e as
modificações pos-traducionais associadas a estes como um paradigma de novas
redes regulatórias relevantes para a regulação da expressão genética.

Table of contents
7
Table of Contents
Acknowledgments ................................................................................................ 1
Abstract ................................................................................................................. 3
Sumário .................................................................................................................. 5
Table of contents .................................................................................................. 7
Index of figures and tables .................................................................................. 9
Abbreviations ..................................................................................................... 14
1. Introduction ................................................................................................... 20
1.1 DNA-dependent RNA polymerases and gene expression ........................... 21
1.2 The transcription cycle of protein coding genes – a general overview ........ 22
1.2.1 RNA polymerase II ............................................................................ 22
1.2.2 Transcription initiation ....................................................................... 22
1.2.3 Transcription elongation ................................................................... 23
1.2.4 Transcription termination .................................................................. 24
1.3 C-terminal domain structure and function ................................................... 26
1.4 CTD post-translational modifications .......................................................... 30
1.4.1 Serine 5 phosphorylation ................................................................... 30
1.4.2 Serine 2 phosphorylation ................................................................... 32
1.4.3 Serine 7 phosphorylation ................................................................... 34
1.4.4 Tyrosine 1 phosphorylation ............................................................... 35
1.4.5 Threonine 4 phosphorylation ............................................................. 36
1.4.6 Proline isomerization ......................................................................... 37
1.4.7 CTD O-GlcNAcylation ........................................................................ 38
1.4.8 Arginine methylation .......................................................................... 38
1.4.9 Lysine ubiquitination and acetylation ................................................. 39
1.5 Lysine methylation of non-histone proteins ................................................. 40
2. Materials and Methods .................................................................................. 43
2.1 Cell culture ................................................................................................... 43
2.1.1 Mouse ES cells .................................................................................. 43
2.1.2 NIH3T3 cells ...................................................................................... 43
2.2 Drug treatments .......................................................................................... 43

Table of contents
8
2.3 Generation of NIH3T3 cell lines expressing wildtype and mutant CTD
constructs ........................................................................................................... 44
2.4 Generation and purification of antibodies against CTD-K7me1 and CTD-
K7me2 ................................................................................................................ 45
2.5 Western blotting ......................................................................................... 46
2.6 CTD peptide pulldowns ............................................................................... 47
2.6.1 Total cell extract preparation ............................................................. 47
2.6.2 Peptide pulldowns .............................................................................. 48
2.7 YFP-RPB1 pulldowns .................................................................................. 48
2.8 Immunofluorescence ................................................................................... 49
2.9 Gene expression analysis by quantitative RT-PCR .................................... 50
2.10 RNA-seq library preparation and gene expression analysis for NIH3T3 8K
and 0K cell lines ................................................................................................. 50
2.11 Chromatin Immunoprecipitation (ChIP) ..................................................... 51
2.12 ChIP-seq library preparation and sequencing .......................................... 52
2.13 Bioinformatic analyses ............................................................................. 53
2.13.1 Ratios of K7me1/K7ac and K7me2/K7ac ......................................... 55
2.13.2 Correlations and linear modelling of CTD modifications ................. 55
2.13.3 Gene ontology (GO) analysis .......................................................... 56
2.13.4 Microarray data analysis ................................................................. 56
3. RNA polymerase II C-terminal domain is mono- and dimethylated at Lysine
residues .............................................................................................................. 63
3.1 Aims ............................................................................................................ 63
3.2 Results ........................................................................................................ 63
3.2.1 Generation of Rpb1 mutant CTD-K7 constructs and α-amanitin
resistant cell lines to study CTD-K7 methylation ......................................... 63
3.2.2 Mutation of CTD-K7 residues is compatible with CTD phosphorylation
................................................................................................................... 67
3.2.3 Production, screen and purification CTD-K7 methyl antibodies ......... 70
3.2.3 Production, screen and purification CTD-K7 methyl antibodies ......... 70
3.2.4 CTD-K7 methylation in mouse cells ................................................... 72
3.2.5 Multiple CTD-K7 residues are methylated ......................................... 75
3.2.6 CTD-K7 methylation is conserved in invertebrates ............................ 76
3.2.7 CTD-K7 methylation occurs early during the transcriptional cycle ..... 78

Table of contents
9
3.3 Discussion ................................................................................................... 81
4. CTD-K7 methylation is present at active genes but has a negative
contribution to gene expression ...................................................................... 84
4.1 Aims ............................................................................................................ 84
4.2 Results ........................................................................................................ 85
4.2.1 CTD-K7 mono- and dimethylation are enriched at promoters of active
genes ......................................................................................................... 85
4.2.2 K7me1 and K7me2 at gene promoters have negative contributions to
productive elongation and mRNA levels .................................................... 92
4.2.3 The balance between CTD-K7 methylation and acetylation correlates
with gene expression ................................................................................. 99
4.2.4 Exploring the association between K7me2/K7ac ratio and gene
expression in mouse cells ........................................................................ 108
4.2.5 K7me1 and K7me2 marks are specific of RNAPII complexes engaged
in productive transcription events and not found at Polycomb-repressed
genes ....................................................................................................... 115
4.3 Discussion ................................................................................................. 119
5. Exploring CTD-K7 interactome .................................................................. 124
5.1 Aims .......................................................................................................... 124
5.2 Results ...................................................................................................... 125
5.3 Discussion ................................................................................................. 135
6. General discussion and conclusions ........................................................ 137
6.1 Integrating CTD-K7 mono- and dimethylation with transcription cycle and
gene expression ....................................................................................... 137
6.2 CTD-K7 modifications in the context of development and disease ............ 143
6.3 Final notes .................................................................................................. 145
7. References ................................................................................................... 148

Index of figures and tables
10
Index of figures and tables
Chapter 1
Fig. 1.1. Amino acid sequence of the murine RPB1 C-terminal domain ............... 27
Fig. 1.2. CTD modifications along the transcription cycle of protein-coding genes in
mammals .............................................................................................................. 28
Fig. 1.3. Evolutionary conservation of the CTD-K7 residues at the distal part of
RPB1 .................................................................................................................... 40
Chapter 2
Table 2.1. RPB1 CTD peptides used for mouse immunization and ELISA .......... 58
Table 2.2. List of Antibodies used in Western blot (WB), chromatin
immunoprecipitation (ChIP) or immunofluorescence (IF) ..................................... 58
Table 2.3. RPB1 CTD peptides used for peptide pulldowns ................................. 59
Table 2.4. List of expression primers (F, forward and R, reverse) ........................ 59
Table 2.5. List of ChIP primers (F, forward and R, reverse) ................................. 60
Table 2.6. Description of ChIP-seq and mRNA datasets ...................................... 61
Chapter 3
Fig. 3.1. α-amanitin resistant constructs as a tool to study RPB1 CTD-K7 function
in mouse cells ....................................................................................................... 64
Table 3.1. Summary of α-amanitin resistant Wt Rpb1 constructs and expression
strategies used to develop stable mouse cell lines .............................................. 65
Fig. 3.2. Generation of stable YFP-RPB1 mouse cell lines .................................. 66
Fig. 3.3. Mutation of CTD K7 to S7 residues does not interfere with RPB1 stability,
phosphorylation or subcellular localization ........................................................... 69
Fig. 3.4. Workflow for production and characterization of antibodies specific for
CTD-K7 methylation .............................................................................................. 71
Fig. 3.5. Workflow for purification and concentration of selected CTD-K7 methyl
antibodies ............................................................................................................. 72
Fig. 3.6. RPB1 is mono- and dimethylated at CTD-K7 residues ........................... 74
Fig. 3.7. Several CTD-K7 residues are mono- and dimethylated ......................... 76
Fig. 3.8. CTD-K7 methylation is conserved in invertebrates ................................. 77
Fig. 3.9. Interplay between K7me1 and K7me2 with RPB1 phosphorylation ........ 79
Fig. 3.10. K7me1 and K7me2 have a discrete nucleoplasmic distribution in mouse
fibroblasts ............................................................................................................. 80
Chapter 4
Fig. 4.1. CTD-K7 mono- and dimethylation are enriched at promoters of active
genes ................................................................................................................... 86

Index of figures and tables
11
Fig. 4.2. ChIP-seq profile of RPB1 CTD modifications at single genes ................ 88
Fig. 4.3. CTD-K7 mono- and dimethylation are enriched at promoters genome-
wide and overlap with K7 acetylation ................................................................... 89
Fig. 4.4. K7me1 and K7me2 mark promoters of expressed genes ....................... 90
Fig. 4.5. Average enrichment profiles of RPB1 CTD modifications on active genes
.............................................................................................................................. 91
Fig. 4.6. Exploring the relationship between different CTD modifications and
mRNA using correlation analyses ........................................................................ 92
Fig. 4.7. Exploring the relationship between different CTD modifications and
mRNA using correlation analyses – expanded version ........................................ 94
Fig. 4.8. Partial correlation analysis of K7me1 and K7me2 with S2p ................... 96
Fig. 4.9. Linear regression analyses of RPB1 CTD modifications for prediction of
S2p levels reveals a negative contribution of K7 methylation ............................... 97
Fig. 4.10. LASSO regression models to predict S2p levels select K7me1 or K7me2
as negative predictors .......................................................................................... 98
Fig. 4.11. CTD-K7 methylation and acetylation have different distributions at the
promoters of active genes and K7me2/K7ac ratio is negatively correlated with
gene expression ................................................................................................. 100
Fig. 4.12. Distribution of different RPB1 modifications around the promoter of
active genes ....................................................................................................... 102
Fig. 4.13. ChIP-seq profile of RPB1 modifications at active genes representative of
high and low K7me2/K7ac ratio .......................................................................... 103
Fig. 4.14. K7me2/K7ac ratio quantiles are associated with different levels of CTD
modifications, mRNA and nascent RNA ............................................................. 104
Fig. 4.15. Correlation analysis and linear regression confirm negative association
of K7me2/K7ac ratio with S2p levels and mRNA production ............................... 105
Fig. 4.16. Genes from distinct functional groups and expression levels associate
with different K7me2/K7ac quantiles .................................................................. 107
Fig. 4.17. Gene expression analysis of NIH3T3 K7-to-S7 mutant cell line (0K) ... 110
Fig. 4.18. Analysis of K7me1 and K7me2 global levels after of P300 and histone
deacetylase inhibition ......................................................................................... 112
Fig. 4.19. Genes with higher K7me2/K7ac ratio are upregulated after TSA
treatment ............................................................................................................ 113
Fig. 4.20. Down-regulation of gene expression after P300 inhibition .................. 114
Fig. 4.21. CTD-K7 mono- and dimethylation are not enriched at Polycomb
repressed genes ................................................................................................. 116
Fig. 4.22. RNAPII CTD is mono- and dimethylated exclusively at active genes and
not at Polycomb repressed genes ...................................................................... 117

Index of figures and tables
12
Fig. 4.23. ChIP-seq profile of RPB1 CTD modifications at Polycomb repressed
genes ................................................................................................................. 118
Chapter 5
Fig. 5.1. Screen for differential CTD interactors using YFP-RPB1 pulldowns .... 126
Table. 5.1. Gene Ontology analysis of 8K and 0K YFP-RPB1 interactors .......... 128
Table. 5.2. Gene Ontology analysis of 8K and 0K YFP-RPB1 unique interactors
............................................................................................................................ 129
Fig. 5.2. Experimental setup for CTD peptide pulldowns .................................... 131
Fig. 5.3. Analysis of CTD peptide pulldowns ...................................................... 133
Chapter 6
Fig. 5.1. Summary of CTD-K7 post-translational modifications .......................... 138

13

Abbreviations
14
Abbreviations
A – Adenosine
Ab – Antibody
Ac – Acetylation
AP – Alkaline phosphatase
BCP – Bayesian Change-Point
bp – Base pair
BRD4 – Bromodomain-containing protein 4
Br-UTP – Bromouridine-5´-triphosphate
CARM1 – Coactivator-associated arginine methyltransferase 1
CDK – Cyclin dependent kinase
cDNA – Complementary DNA
ChIP – Chromatin immunoprecipitation
CPSF – Cleavage and polyadenylation specificity factor
CstF – Cleavage stimulatory factor
CTD – C-terminal domain
CTD-K7 – CTD Lysine 7
CTD-K7me1 – CTD-K7 monomethylation
CTD-K7me2 – CTD-K7 dimethylation
CTD-K7me3 – CTD-K7 trimethylation
CTD-K7ac – CTD-K7 acetylation
CTD-K7ub – CTD-K7 ubiquitination
Dig – Digoxigenin
DMSO – Dimethyl sulfoxide
DNA – Deoxyribonucleic acid
DSIF - DRB-sensitivity inducing factor
EDTA – Ethylenediaminetetraacetic acid
EGF – Epithelial growth factor
ELISA – Enzyme-linked immunosorbent assay

Abbreviations
15
ELL – Eleven- nineteen Lysine-rich leukaemia
eRNA – enhancer RNA
FCP1 – TFIIF-associated CTD phosphatase 1
FPKM – Fragments Per Kilobase of exon per Million reads mapped
GFP – Green fluorescent protein
GO – Gene ontology
GRO – Global run-on
GTF – General transcription factor
h – Hour
H – Histone
H3K4me3 – Histone H3 lysine 4 trimethylation
H3K9ac – Histone H3 lysine 9 acetylation
H3K36me3 – Histone H3 lysine 36 trimethylation
HAT – Histone acetyltransferase
HDAC – Histone deacetylase
HMT – Histone methyltransferase
hsp – Heat shock protein
IIa – Hypophosphorylated RPB1
II0 – Hyperphosphorylated RPB1
Ig – Immunoglobulin
K7 – Lysine 7
kDa – KiloDalton
KDM – Lysine demethylase
LASSO – Least Absolute Shrinkage and Selection Operator
LC – Low-complexity
LIF – Leukemia inhibitory factor
lncRNA – Long non-coding RNA
min – Minutes
miRNA – microRNA
mNET-seq – Mammalian native elongating transcript sequencing

Abbreviations
16
mRNA – Messenger RNA
MSE – Mean Standard Error
MYBBP1A – Myb-binding protein 1A
ncRNA – Non-coding RNA
NDR – Nucleosome depleted region
NELF – Negative elongation factor
OGA – O-linked N-acetylglucosaminase
O-GlcNAc – O-linked N-acetylglucosamine
OGT – O-linked N-acetylglucosamine transferase
p – Phosphorylation
P – Proline
P3 – CTD proline 3
P6 – CTD proline 6
PAF – RNAPII associated factor
PAGE – Polyacrylamide gel electrophoresis
PAP – Poly(A) polymerase
PAS – Poly(A) signal
PBS – Phosphate-buffered saline
PCR – Polymerase chain reaction
PDGF – Platelet-derived growth factor
PIC – Pre-initiation complex
P-TEFb – Positive transcription elongation factor b
PTM – Post-translational modification
RNA – Ribonucleic acid
RNAP – RNA polymerase
RNAPI – RNA polymerase I
RNAPII – RNA polymerase II
RNAPIII – RNA polymerase III
RNAPIV – RNA polymerase IV
RNAPV – RNA polymerase V

Abbreviations
17
RPKM – Reads per kilobase per million of reads mapped
rRNA – Ribosomal RNA
s – Second
S – Serine
S2 – CTD Serine 2
S5 – CTD Serine 5
S7 – CTD Serine 7
S2p – CTD-S2 phosphorylation
S5p – CTD-S5 phosphorylation
S7p – CTD-S7 phosphorylation
SE – Standard Error
SEC – Super elongation complex
SET – Suppressor of variegation, enhancer of zeste and trithorax
Seq – Sequencing
SCP – Small CTD phosphatase
siRNA – small interfering RNA
snoRNA – small nucleolar RNA
snRNA – small nuclear RNA
SRI – Set2 Rpb1-interacting domain
Ssu72 – Suppressor of sua7 gene 2
T – Threonine
T4 – CTD Threonine 4
T4p – CTD-T4 phosphorylation
TAF – TBP-associated factor
TBP – TATA box-binding protein
TES – Termination end site
TF – Transcription factor
tRNA – Transfer RNA
TSA – Trichostatin A
TSS – Transcription start site

Abbreviations
18
uaRNA – Upstream antisense RNA
Wt – Wild type
Y – Tyrosine
Y1 – CTD Tyrosine 1
Y1p – CTD-Y1 phosphorylation
YFP – Yellow fluorescent protein

19

Chapter 1 Introduction
20
Chapter 1
Introduction
The diversity of life forms that populate the planet Earth has evolved from and is
sustained by an equally complex molecular machinery. The nucleic acids (DNA
and RNA) and proteins are three fundamental molecules for the majority of
biochemical processes required for life. The central dogma of molecular biology
was proposed in 1956 as a three-state flux of biological information from DNA to
intermediate molecules of RNA and finally to proteins. DNA encodes the genetic
information (genes and regulatory sequences) that defines each organism and is
replicated and transmitted to the following generations. RNA was initially seen
mostly as an intermediate molecule between DNA and proteins but nowadays we
know that it has very diverse functions beyond coding for proteins. Finally, proteins
are the building blocks of cells and perform most catalytic activities. Replication,
transcription and translation are the complex biochemical reactions associated
with the flux of genetic information in biological systems.
The flux of information from DNA to a functional protein or non-coding RNA
(ncRNA) involves a highly complex biochemical reaction known as transcription
where RNA molecules are generated from the DNA template sequence. RNA
molecules go through highly complex processing events required for their
functionality and stability. In the case of messenger RNA (mRNA), many of these
processing events co-occur simultaneously with transcription and are important for
the generation of a great diversity of mRNA molecules from the same DNA
template.
Gene expression is regulated by a multi-layered complex network of pathways that
ultimately defines the identity of cells and their ability to respond and interact with
the surrounding environment and associated changes. This thesis focuses on the
transcription process, more precisely on one of its central elements, RNA
polymerase II, which regulates gene expression and many other aspects of
nuclear biology.

Chapter 1 Introduction
21
1.1 – DNA-dependent RNA polymerases and gene expression
DNA-dependent RNA polymerases (RNAP) are multi-subunit enzymes present in
the three domains of life and responsible for reading the information encoded in
the DNA sequence and to polymerise a complementary RNA molecule. Eubacteria
and Archaea have a single RNAP that transcribes all their RNA molecules while
Eukaryotes have three common nuclear RNAPs (RNAPI, RNAPII and RNAPIII),
plants have additionally RNAPIV and RNAPV and extra RNAPs are found in
mitochondria and chloroplasts (Huang et al., 2015; Werner and Grohmann, 2011).
The catalytic domain and the RNA catalysis reaction of RNA polymerases have
been conserved through evolution but the more external domains of RNAPs have
diverged accommodating a diverse range of interacting factors that regulate
transcription (Kireeva et al., 2013). In eukaryotes, RNAPI, RNAPII and RNAPIII
have 14, 12 and 17 subunits respectively, five of which are common between the
three polymerases (Sainsbury et al., 2015; Werner and Grohmann, 2011). The
expansion in number of RNAPs in eukaryotes is associated with specialisation in
transcription of specific types of RNA molecules for each RNAP. RNAPI
transcribes ribosomal RNA (rRNA) 45S genes in the nucleolus and these are the
most highly transcribed genes in the genome. RNAPII transcribes mRNAs from all
the protein-coding genes and several types of non-coding RNAs such as small
nuclear RNAs (snRNA), small nucleolar RNAs (snoRNA), microRNAs (miRNAs),
long non-coding RNAs (lncRNA) and enhancer RNAs (eRNAs). RNAPIII
transcribes transfer RNAs (tRNAs), the 5S rRNA, some snoRNAs and several
non-coding RNAs such as U6 snRNA and 7SK RNA. Finally, in certain groups of
plants RNAPIV and RNAPV transcribe small interfering RNAs (siRNA) (Dieci et al.,
2009; Drouin and Carter, 2010; Huang et al., 2015; White, 2011).
For the rest of the introduction and thesis, a great focus is given to RNAPII, its
function in gene expression and regulation through post-translational
modifications.

Chapter 1 Introduction
22
1.2 – The transcription cycle of protein coding genes - a general overview
1.2.1 – RNA polymerase II
RNAPII is a multimeric protein complex composed of 12 subunits (RPB1-12) with
the largest subunits RPB1 and RPB2 forming the opposite sites of the active
centre cleft. The smaller subunits interact with RPB1 and RPB2 or bridge between
the two larger subunits (Wild and Cramer, 2012). RPB4 and RPB7 form a hetero-
dimer that binds to RPB1 and forms a stalk structure with relevant regulatory
functions at different stages of the transcription cycle (Runner et al., 2008).
RPB1 subunit has a unique and large C-terminal domain (CTD) that extends from
the catalytic core. RPB1 CTD is structurally disordered and composed in many
eukaryotes of tandem heptapetide repeats with the canonical sequence Y1-S2-P3-
T4-S5-P6-S7. An extensive range of post-translational modifications (PTMs) is
placed through the transcription cycle onto the CTD repeats and has been the
subject of extensive research. The CTD acts as recruitment platform bringing a
diverse multitude of factors to the transcription machinery in a dynamic process
heavily dependent on the PTM status.
The transcription cycle of protein coding genes performed by RNAPII has several
highly regulated steps generally divided into initiation, elongation and termination.
RNAPII recognizes the promoter sequence in response to activation signals,
initiates transcription and polymerizes RNA complementary to the coding gene
and finally needs to stop and dissociate from the DNA without transcribing into
neighbouring genes.
1.2.2 – Transcription initiation
Accessibility to regulatory sequences at the promoter is one of the initial barriers to
RNAPII initiate transcription since DNA is compacted and wrapped in
nucleosomes. Histone proteins are arranged in the nucleosomes as an octamer
composed of two molecules of histone H2A, H2B, H3 and H4. Chromatin
remodelling complexes can move or eject nucleosomes and the presence of AT-
rich sequences which leads to a less stable association between DNA and

Chapter 1 Introduction
23
histones contributes to nucleosome-depleted regions (NDR) at promoters
(Venkatesh and Workman, 2015). A multitude of transcription factors (TFs) and
protein complexes required for transcription initiation assemble at the promoter
with RNAPII forming the pre-initiation complex (PIC). Amongst these protein
complexes, general transcription factors (GTFs) TFIIA, TFIIB, TFIID, TFIIE, TFIIF
and TFIIH have an essential role for the formation of PIC at most promoters. TFIID
is a multimeric complex that contains TATA box-binding protein (TBP) and TBP
associated factors (TAFs) which recognize and bind to regulatory DNA sequences
and interact with RNAPII through TFIIB. Transcription is only possible after DNA
melting and formation of an open complex where both template and non-template
DNA strands are separated which depends on the helicase activity of TFIIH. TFIIH
has additionally a kinase subunit, CDK7, that phosphorylates RPB1 CTD at S5
and S7 residues and the resulting S5p modification recruits the capping machinery
to the transcription complex.
Activation of transcription, and regulation of initiation and elongation involve
another major regulatory complex, the Mediator, which acts as “molecular bridge”
integrating signals from TFs to RNAPII. Long-range interaction between
enhancers and promoters is thought to have an important role in activation of gene
expression and Mediator is likely to be a central element in these 3D genomic
interactions mediated by gene looping (Allen and Taatjes, 2015).
1.2.3 – Transcription elongation
Once RNAPII leaves the promoter, it does not immediately engage in productive
elongation being temporarily halted in a process known as promoter proximal
pausing which is observed in many metazoans. RNAPII pausing was initially
described in Drosophila heat shock inducible gene Hsp70 where upon stimulation
paused RNAPII rapidly resumed transcription in a stimulus-dependent manner
(Gilmour and Lis, 1986). The transition from initiation to productive elongation is a
highly regulated step influenced by several positive and negative factors (Guo and
Price, 2013). DISF (DRB-sensitivity inducing factor) and NELF (negative
elongation factor) are two factors that determinate RNAPII pausing, whose
phosphorylation by CDK9 / cyclin T subunit of P-TEFb is fundamental for the

Chapter 1 Introduction
24
transition into productive elongation. After phosphorylation, NELF dissociates from
RNAPII and phosphorylation of the SPT5 subunit of DISIF converts this factor into
a positive regulator of elongation that remains associated with RNAPII throughout
the rest of the transcription cycle (Guo and Price, 2013). Additionally, CDK9
phosphorylates RBP1 CTD at S2 residues, a modification that is fundamental for
recruitment of factors involved in chromatin remodelling and RNA processing (Ahn
et al., 2004). P-TEFb complex is equally regulated and the interaction with
HEXIM1 and the ncRNA 7SK constitutes an inhibitory complex (Michels et al.,
2004).
More recently, in vitro studies revealed a negative effect of Polr2m / GDOWN1 on
elongation when associated with RNAPII possibly by inhibiting the function of the
positive elongation factor TFIIF (Cheng et al., 2012; Mullen Davis et al., 2014),
although as depletion of GDOWN1 has no effect on Br-UTP incorporation in HeLA
cells the role of this factor in vivo is unclear (Moller et al., 2012).
Another barrier for RNAPII elongation is the first nucleosome downstream of the
promoter (+1 nucleosome). To overcome this physical barrier, the action of
chromatin remodellers, incorporation of histone variants, which lead to a more
dynamic association of DNA with the nucleosome, and PTMs of histones all assist
RNAPII transcription through chromatin (Jonkers and Lis, 2015).
The PAF (RNAPII associated factor) complex interacts with RNAPII and P-TEFb
and is another major regulator of elongation involved in RNAPII pausing release,
and co-transcriptional regulation of histone modifications and mRNA processing
(Guo and Price, 2013; Yu et al., 2015).
Other factors regulating transcription elongation include Elongins and eleven-
nineteen Lysine-rich leukaemia (ELL) proteins that are components of the super
elongation complex (SEC) (Luo et al., 2012).
1.2.4 – Transcription termination
The end of a transcription cycle for protein-coding genes involves the
interconnected processes of cleavage, polyadenylation and termination that
disrupt the ternary complex of RNA, DNA and RNAPII assuring the synthesis of

Chapter 1 Introduction
25
full length mRNA without transcribing through other genes and recycles RNAPII to
carry out other rounds of transcription. At the 3´ end of protein-coding genes, the
elongating RNAPII transcribes through the poly(A) signal (PAS), a consensus
sequence of AAUAAA nucleotides flanked by auxiliary sequences up- and
downstream that together signal for cleavage and polyadenylation of the pre-
mRNA molecule (Proudfoot, 2011). Factors recruited by the RNAPII CTD co-
transcriptionally include the cleavage and polyadenylation specificity factor (CPSF)
and the cleavage stimulatory factor (CstF) which recognize the PAS signal and
cleave the nascent transcripts downstream of PAS. Addition of a poly(A) tail to the
3´ end of pre-mRNA is mediated by poly(A) polymerase (PAP). The poly(A) tail
protects pre-mRNA from degradation, and is important for pre-mRNA export to
cytoplasm and translation (Porrua and Libri, 2015; Proudfoot, 2011).
RNAPII continues transcribing downstream of the PAS signal up to several
hundreds of base pairs (bp) until termination occurs and RNAPII dissociates from
the DNA template. Two main models are currently proposed to describe
transcription termination but the full extent of the mechanism and components
involved are still to be determined. The allosteric model explains termination as the
result of destabilization of the elongation complex due to loss of elongation factors
and / or conformational changes in RNAPII (Proudfoot, 2011; Zhang et al., 2015).
The torpedo model proposes that termination is triggered by the action of an
exonuclease (XRN2 in mammals) recruited after cleavage that degrades the
nascent RNA and displaces RNAPII from the DNA template (Loya and Reines,
2016; Morales et al., 2016; Proudfoot, 2011). Another important factor in
transcription termination is RNAPII pausing downstream of PAS at G-rich
sequences where RNA/DNA hybrids (R-loops) form. R-loops are resolved by the
helicase Senataxin allowing the access of Xrn2 that degrades the RNA and leads
to termination (Skourti-Stathaki et al., 2011). The allosteric and torpedo models
are not necessarily mutually exclusive and a combination of both has been
suggested and is likely to occur (Loya and Reines, 2016; Luo et al., 2006; Morales
et al., 2016).
Finally, at the 3´ end of genes RNAPII CTD is dephosphorylated by several
phosphatases reverting RNAPII to a hypophosphorylated state essential to initiate
another round of transcription.

Chapter 1 Introduction
26
1.3 – C-terminal domain structure and function
The RNAPII CTD has generated a great interest in research for a long time given
its essential requirement for in vivo transcription (Bartolomei et al., 1988; Zehring
et al., 1988). The appearance and evolution of RNAPII CTD and its unique tandem
repeat structure is an ongoing matter of debate. Initial studies based on the
available RPB1 sequences in different eukaryotes have proposed the existence of
a CTD clade including the more developmentally complex groups of animals,
plants, fungi and some protists in which the canonical CTD heptads (Y1-S2-P3-T4-
S5-P6-S7) are strongly conserved (Chapman et al., 2008; Liu et al., 2010; Stiller
and Hall, 2002). More recently, studies analysing a larger number of RPB1
sequences found a higher diversity in CTD structure and sequence than originally
thought and the presence of a tandem repeat structure at the most simple and
ancient eukaryotes (Stump and Ostrozhynska, 2013; Yang and Stiller, 2014). This
suggests that the CTD has originally appeared with a tandem heptapeptide
structure and that the most important features conserved across eukaryotes are
the unstructured tandem nature and the ability to be reversibly modified (Yang and
Stiller, 2014). The tandem structure of CTD was likely generated from several
amplification events of an original repetitive DNA sequence along evolution
(Chapman et al., 2008). CTD length is rather variable across different groups with
unicellular yeast having 26-27 repeats and mammals 52 (Fig. 1.1). Moreover,
several studies reinforce the concept of a differential requirement in the number of
CTD repeats for different taxa as a minimum of 8 repeats in yeast and half of the
CTD in human cells are necessary for viability (Allison et al., 1988; Bartolomei et
al., 1988; West and Corden, 1995). More recently, it was confirmed that for
RNAPII’s optimal function, especially under stress conditions, a full length CTD is
required although some changes in the amino acid sequence are tolerated (Liu et
al., 2010). In animals and plants, CTD length is correlated with developmental
complexity although exceptions can be found such as in Hydra, which have
around 60 CTD repeats. One conserved feature of longer CTDs from more
complex eukaryotes is the accumulation of non-consensus repeats at the distal
area of the CTD while canonical repeats are predominant at the proximal region
(Yang and Stiller, 2014). Mammalian cells can grow with a CTD composed only of
canonical repeats present in the proximal region while a CTD exclusively made of

Chapter 1 Introduction
27
non-canonical repeats shows severe growth defects (Chapman et al., 2005). Mice
with a CTD deletion spanning 13 repeats, most with non-canonical substitutions,
are viable but smaller than wild type littermates and have increased neonatal
lethality suggesting an involvement of the deleted repeats in regulation of
developmental growth (Litingtung et al., 1999). These and other studies suggest
the existence of functionally distinct areas on the CTD related to the acquisition of
non-consensus repeats which are likely to regulate lineage specific functions,
while the consensus repeats are important for general roles.
Figure 1.1. Amino acid sequence of the murine RPB1 C-terminal domain.
Mouse RPB1 CTD is composed of 52 heptapeptide repeats with consensus amino acid sequence YSPTSPS, which is represented 21 times at the most proximal CTD region. Non-consensus amino acids are enriched for at the distal region. Most abundant non-consensus residues are Lysines, all found at heptad position 7 (K7; represented in red). Other non-consensus residues are represented in blue.
The great regulatory potential and functional relevance of the CTD derives from
the dynamic and diverse range of PTMs that occur on specific residues of the
heptapetide repeats. Identification of CTD phosphorylation in transcribing RNAPII
was the starting point of a research endeavour connecting CTD modifications with
transcription regulation and co-transcriptional processes (Cadena and Dahmus,
1987; Zhang and Corden, 1991). The unmodified CTD has a naturally flexible
disordered structure and different conformational changes are induced by PTMs
such as phosphorylation (Yonezawa, 2014). The adoption of different
conformations depending on the modification status facilitates the recruitment of
specific factors to the CTD. As different CTD modifications associate with specific
steps of the transcription cycle, the CTD provides a recruitment platform that

Chapter 1 Introduction
28
differentiates between transcription initiation, elongation and termination, thereby
producing an informative regulatory code (CTD code) (Buratowski, 2003; Egloff et
al., 2012a; Eick and Geyer, 2013). There is a long list of factors that are co-
transcriptionally recruited to the CTD including: capping enzyme, splicing factors,
chromatin remodellers, elongation factors, RNA polyadenylation and cleavage
factors and termination factors (Eick and Geyer, 2013). CTD modification state is
equally important in the regulation of PIC assembly, promoter clearance, transition
to elongation, and termination.
A current list of PTMs targeting the mammalian CTD include phosphorylation of
S2, S5, S7, T4 and Y1, isomerization of P3 and P6, glycosylation of T4 and S
residues, symmetric and asymmetric methylation of a non-consensus R7 residue,
and ubiquitination and acetylation of non-consensus K7 residues (Fig. 1.2).
Figure 1.2. CTD modifications along the transcription cycle of protein-coding genes in mammals.
RNAPII is recruited to promoters hypophosphorylated and gets phosphorylated at S5, S7 and Y1 residues (S5p, S7p and Y1p), and acetylated at K7 residues (K7ac) in the early stages of transcription. S5p, S7p, Y1p and K7ac are highly enriched at the 5´ end of genes. RNAPII complexes engaged in elongation are phosphorylated at S2 and T4 residues (S2p and T4p), which are highly enriched at the 3´ end of genes. RNAPII is recycled at the end of the transcription cycle. TSS (transcription start site), PAS (poly(A) signal).

Chapter 1 Introduction
29
The work presented in this thesis, together with a recent publication (Dias et al.,
2015), identified two additional modifications, mono- and dimethylation of non-
consensus K7 residues. The following sections give an overview of these CTD
modifications with a focus on the triad of modifiers, readers and erasers and how
these factors regulate transcription.

Chapter 1 Introduction
30
1.4 – CTD post-translational modifications
1.4.1 – Serine 5 phosphorylation
RNAPII binds at gene promoters in a hypophosphorylated state and TFIIH kinase
subunit CDK7 (Kin28 in yeast) phosphorylates serine 5 (S5p) soon after initiation
of transcription (Akoulitchev et al., 1995; Komarnitsky et al., 2000). S5p is highly
enriched at the 5´ end of genes, has lower levels along the coding region and
again slightly higher at the 3´ end. Depletion of CDK7 results in accumulation of
RNAPII at the 5´ ends of genes and reduced occupancy downstream, indicating
that S5p is a relevant event in promoter escape (Jeronimo and Robert, 2014;
Wong et al., 2014). There is evidence of other kinases phosphorylating S5
residues, mostly from in vitro studies, including CDK8, CDK9 and CDK12
(Jeronimo et al., 2016). CDK8 is a kinase that associates with the Mediator
complex phosphorylating both S5 and S2 in vitro but it also phosphorylates cyclin
H from the CDK7/cyclin H complex, inhibiting CDK7 activity and therefore having a
negative role in transcription (Nemet et al., 2014). More recently, DYRK1A was
classified as a CTD kinase able to phosphorylate S5 and S2 residues although its
role in transcription initiation and elongation is still unknown (Di Vona et al., 2015).
Dephosphorylation of S5 residues along the CTD is regulated by several
phosphatases that establishes a dynamic pattern of S5p during the transcription
cycle and helps recycle RNAPII back to the unphosphorylated state after
transcription termination. In yeast, Ssu72 (suppressor of sua7 gene 2) is an S5p
phosphatase that is particularly important for S5p dephosphorylation at the
transition between initiation and elongation (Krishnamurthy et al., 2004; Reyes-
Reyes and Hampsey, 2007; Rosado-Lugo and Hampsey, 2014). Rtr1 (regulator of
transcription 1) dephosphorylates S5p and Y1p and its deletion results in S5p
accumulation throughout coding regions with transcription and termination defects
being observed, suggesting an important role for this phosphatase during
elongation and termination (Hsu et al., 2014; Mosley et al., 2009). RPAP2 is
another CTD phosphatase that dephosphorylates S5p at snRNA genes (Egloff et
al., 2012b). Finally, several small CTD phosphatases (SCPs) were reported to
preferentially mediate S5p dephosphorylation. SCP1 is recruited to promoters and

Chapter 1 Introduction
31
represses the expression of neuronal genes in non-neuronal tissues suggesting
that CTD phosphatases can regulate tissue specific expression profiles (reviewed
in (Eick and Geyer, 2013)).
The most characterized role of S5p described so far is the co-transcriptional
capping of nascent RNA molecules, highlighted by a study in S. pombe where
lethality of S5A mutants could be surpassed by fusion of the capping enzyme (CE)
to the CTD (Schwer and Shuman, 2011). Capping of the 5´ end of nascent RNAs
is the first co-transcriptional RNA processing event and protects the transcribed
RNA molecule from degradation. The formation of the 5´cap structure involves
three different enzymatic activities: hydrolysis of 5´ triphosphate to a diphosphate,
addition of a GMP cap, and lastly methylation of GMP. In mammals, two enzymes
are involved in the 5´capping process as the CE performs the first two steps, while
in yeast three enzymes are required for each step. DSIF and P-TEFb interact with
the CE connecting RNA capping with promoter proximal pausing (Guo and Price,
2013; Jeronimo et al., 2013).
S5p is equally important for recruitment of chromatin remodelling complexes and
chromatin modifiers that set up a chromatin state compatible with transcription.
Amongst the chromatin modifiers recruited by S5p are the histone
methyltransferase Set1, responsible for trimethylation of histone H3 at lysine 4
(H3K4me3), and the histone acetyltransferases (HAT) Gcn5, from the SAGA
complex, and Esa1 from the NuA4 complex that acetylate histone H3 and H4 tails,
respectively (Ginsburg et al., 2009; Govind et al., 2007; Ng et al., 2003).
Two recent studies provided strong evidence for S5p being involved in co-
transcriptional splicing. In Nojima et al., (2015), mammalian native elongating
transcript sequencing (mNET-seq) was performed using different CTD antibodies
and S5p was found particularly enriched at 5´ splicing sites. In Harlen et al.,
(2016), pull downs of specific CTD modifications followed by mass spectrometry
analysis found the S5p associated proteome specifically enriched for splicing
factors, most notably U1 components.
Finally, a special CTD state characterized by S5p in the absence of other CTD
modifications, such as S2p and S7p, was described at poised developmental
genes in ES cells (Brookes et al., 2012; Stock et al., 2007). These genes have a
Chapter 1 Introduction
32
bivalent chromatin conformation with both positive and repressive marks and
although transcribed do not generate mature mRNAs (Bernstein et al., 2006;
Brookes et al., 2012; Stock et al., 2007). S5 phosphorylation at poised genes does
not result from TFIIH activity but instead from ERK1/2, a unique example of a
group of genes phosphorylated by different S5 kinases depending on the
chromatin context (Tee et al., 2014).
1.4.2 – Serine 2 phosphorylation
S2 phosphorylation (S2p) is a hallmark of transcription elongation. S2p marks
RNAPII engaged in transcription and increases along gene bodies reaching the
highest levels at the 3´ end while being absent or at low levels at 5´ end region. S2
residues are phosphorylated by CDK9 (Bur1 in yeast) which is a major regulator of
elongation that phosphorylates additionally DSIF and NELF (Guo and Price, 2013;
Marshall et al., 1996; Peng et al., 1998).
Initial studies in yeast identified CTDK1 as a second major S2 kinase. CTDK1
homologs have also been found in higher eukaryotes, in particular CDK12 in
Drosophila melanogaster and CDK12 and CDK13 in human cells (Ahn et al., 2004;
Bartkowiak et al., 2010). In both yeast and D. melanogaster, CTDK1/CDK12 have
major contributions to the S2p levels mostly along gene bodies and 3´ ends, while
Bur1/CDK9 contributes more for 5´ end levels of S2p (Bartkowiak et al., 2010;
Wood and Shilatifard, 2006). In human cells, the role of CDK12 is not so well
understood as depletion of this kinase does not result in significant loss of S2p and
its interaction with other proteins involved in transcription and mRNA processing
hinders the interpretation of phenotypes (Liang et al., 2015; Yu et al., 2015). A
higher degree of redundancy for S2 phosphorylation in human cells could result
from the presence of CDK13 and BRD4 which was equally identified as a S2
kinase. Brd4 can directly and indirectly contribute to S2 phosphorylation as it
recruits P-TEFb to promoters and stimulates the activity of CDK9 (Itzen et al.,
2014; Lu et al., 2015) and additionally can act itself as a CTD kinase (Devaiah et
al., 2012).
Similar to S5p, the regulation of S2 phosphorylation levels involves the coordinate
action of phosphatases that erase S2p from the CTD. TFIIF-associated CTD

Chapter 1 Introduction
33
phosphatase 1 (FCP1) is the major S2p phosphatase to our knowledge and in vivo
inactivation of this enzyme causes accumulation of S2p along the transcription
unit. FCP1 also enhances elongation, although this activity does not require its
catalytic domain (Cho et al., 2001; Mayfield et al., 2016). Another phosphatase,
CDC14, is involved in transcriptional repression of intergenic sequences and sub-
telomeric regions through dephosphorylation of S2p and S5p (Clemente-Blanco et
al., 2011). The low levels of S2p at the 5´ end region of genes are regulated by
FUS (fused in sarcoma) protein which binds to the CTD and prevents S2
phosphorylation by CDK9 and CDK12 without interfering with TFIIH/CDK7 activity
(Schwartz et al., 2012).
S2p is involved in co-transcriptional regulation of splicing and 3´ end processing,
namely S2p is required for recruitment of U2AF splicing factor and 3´ end
cleavage factor PCF11 (Gu et al., 2013). Expression of functionally mature
mRNAs from inducible genes in macrophages is regulated by splicing mediated by
P-TEFb-dependent S2 phosphorylation (Hargreaves et al., 2009). A study in yeast
has shown that S2p phosphorylated by CTDK1 is required for co-transcriptional
recruitment of polyadenylation factors (Ahn et al., 2004). These findings are
supported by phenotypes observed in mammalian cells expressing a mutant S2A
CTD, that have defects in 3´ end cleavage, and S2E (phospho-mimic mutation)
mutants, that have reduced transcript levels (Egloff et al., 2007; Gu et al., 2013).
S2p has a pivotal role in the interaction between elongating RNAPII and chromatin
assuring that cryptic transcription in yeast is prevented from open chromatin
upstream of the transcribing polymerase. The histone methyltransferase Set2 /
SETD2 (in humans) associates with the CTD of elongating RNAPII phosphorylated
at S2 and S5 residues and methylates histone H3 on residue 36 (H3K36). HDAC
complex Rpd3S interacts with both the CTD, recognising S2p and S5p residues,
and with chromatin marks H3K36me2 and H3K36me3 and deacetylates histones
H3 and H4 repressing cryptic transcription (Carrozza et al., 2005; Krogan et al.,
2003; Venkatesh and Workman, 2013). Additionally H3K36 methylation further
contributes to the hypoacetylated state along coding regions by preventing the
replacement of histone H3 by histone chaperones and incorporation of new
acetylated H3 histones (Venkatesh et al., 2012). Finally, H3K36 methylation found

Chapter 1 Introduction
34
differentially distributed along exons and introns also influences the efficiency of
co-transcriptional splicing (Sorenson et al., 2016; Venkatesh and Workman, 2013).
Another histone modification, ubiquitination of histone H2B (H2Bub1) is also
regulated by CDK9 activity through phosphorylation of the CTD at S2 residues
(Pirngruber et al., 2009).
1.4.3 – Serine 7 phosphorylation
Amongst the three serine residues present on CTD repeats known to be
phosphorylated, S7 phosphorylation was the last to be described and remains the
most enigmatic one (Chapman et al., 2007; Egloff et al., 2007).
TFIIH kinase subunit CDK7 and yeast homolog Kin28 phosphorylate the CTD at
both S5 and S7 residues (Boeing et al., 2010; Kim et al., 2009). In mammals, S7
phosphorylation by CDK7 was shown to be a Mediator-dependent process, which
takes place at the PIC stage (Boeing et al., 2010). Genome-wide distributions of
S7p in yeast and mammalian cells show overall a high enrichment at the gene
promoters consistent with phosphorylation mediated by CDK7. Further
downstream at the gene body, the S7p levels considerably decrease in mammals
while in yeast a substantial group of genes remains with high levels until the 3´
end where higher levels are detected again in both taxa (Brookes et al., 2012;
Tietjen et al., 2010). The differences observed in S7p levels are likely to reflect
distinct features in gene structure and genome organization between yeast and
higher multicellular eukaryotes. Mammals have a complex and dispersed genomic
organization with longer genes and longer introns while the yeast genome is more
compact and with smaller genes.
Inhibition of Kin28 leads to a decrease of S7p levels at the promoter region but no
substantial changes are detected at gene bodies and 3´ ends, which points to the
activity of other S7 kinases along the transcription cycle. Indeed, Bur1 was found
to be a S7 kinase acting on the elongating RNAPII since its inhibition causes a
genome wide decrease of S7p levels along the gene body and at 3´ end (Tietjen et
al., 2010).

Chapter 1 Introduction
35
S7p dephosphorylation is mediated by the phosphatase Ssu72 and is likely to be
essential for transcription since mutation of S7 to a phosphomimetic amino acid
(S7E) is lethal in yeast and mammals (Eick and Geyer, 2013; Tietjen et al., 2010).
Interestingly, although present at both protein coding and snRNA genes, S7p has
only been associated to snRNA processing and expression (Egloff et al., 2007;
Egloff et al., 2012b). Cells expressing RPB1 with mutation of S7 to alanine
residues (S7A) have processing defects at snRNA genes, a phenotype that was
linked to the requirement of S7p to recruit the integrator complex to snRNA genes
(Egloff et al., 2007). More recently, it was shown that S7p interacts with RPAP2, a
S5p phosphatase, which also interacts with the integrator complex establishing a
gene-specific mechanism that involves S7p, the integrator complex and S5p
dephosphorylation for snRNA expression and 3´ end processing (Egloff et al.,
2012b).
In vitro experiments from Czudnochowski et al., (2012) have shown that prior
phosphorylation at the S7 residues enhances P-TEFb activity and S2
phosphorylation, which is consistent with S7p being associated with the transition
to the elongation step and suggests a role at mRNA genes yet to be characterized.
1.4.4 – Tyrosine 1 phosphorylation
CTD tyrosine phosphorylation (Y1p) was described in yeast, mammals and
chicken and the c-Abl kinase was shown to phosphorylate in vitro the mammalian
CTD on Y1 residues (Baskaran et al., 1993). Y1p distribution was mapped in yeast
and found to be very low or absent at promoters, increasing along gene bodies
with the highest enrichment present at the 3´ end of genes before the poly(A)
signal and the S2p peak (Mayer et al., 2012). In vitro peptide binding assays and
structural modelling revealed that Y1p prevents recruitment of termination factors
Pcf11 and Rtt103 to the CTD suggesting a role in preventing early termination.
Conversely, the elongation factor Spt6 was able to bind in vitro to Y1p CTD
peptides suggesting a potential role of Y1p in elongation (Mayer et al., 2012).
In mammalian cells, Y1p is highly enriched at promoters, reduced on gene bodies
and then again enriched but at a lower level at the 3´ end of genes, being equally

Chapter 1 Introduction
36
present at enhancers (Descostes et al., 2014). Interestingly, Y1p distribution and
enrichment is remarkably different between yeast and mammals which may reflect
distinct roles for Y1 phosphorylation in different taxa.
Mutation of Y1 residues is incompatible with viability in human and chicken cells
and leads to proteosomal degradation of the CTD (Descostes et al., 2014; Hsin et
al., 2014a). Y1 CTD mutants in chicken cells have increased levels of upstream
antisense RNAs (uaRNAs) and Y1p is associated with antisense transcription in
human cells which suggests a possible general role in regulation of antisense
transcription in vertebrates (Descostes et al., 2014; Hsin et al., 2014a).
1.4.5 – Threonine 4 phosphorylation
Threonine residues at the fourth position of the CTD (T4) heptad are
phosphorylated (T4p) and several functions have been associated to this
modification in different taxa. Polo-like kinase 3 (Plk3) was described to
phosphorylate T4 in mammalian cells. T4p is associated with hyperphosphorylated
RPB1 and ChIP-seq data has shown enrichment of this modification at the 3´ ends
of genes (Hintermair et al., 2012). Mammalian cells expressing RPB1 subunits
with CTD mutations at T4 residues are not viable and elongation defects were
observed with RNAPII accumulation downstream of the TSS and reduced levels at
gene bodies and 3´ end region of genes (Hintermair et al., 2012). Chicken cells
expressing a mutant CTD on T4 residues were also not viable and presented
reduced expression levels for histone genes possibly related to defective histone
mRNA 3´ end processing (Hsin et al., 2011). A more recent study from the same
group has shown that T4p can be phosphorylated by CDK9 and dephosphorylated
by FCP1 (Hsin et al., 2014b).
In budding yeast, T4 mutant strains were viable and had no evident transcriptional
defects in normal growth conditions but were unable to grow in low phosphate or
galactose conditions (Rosonina et al., 2014). T4 mutants were not able to fully
induce a subset of inducible genes required for growth in low phosphate conditions
and this phenotype was associated with defective eviction of histone variant Htz1
from promoter-proximal nucleosomes. These observations establish a link
between T4 and associated modifications with chromatin remodelling in budding
Chapter 1 Introduction
37
yeast (Rosonina et al., 2014). Another report using a mass-spectrometry approach
to study the interactomes of different CTD modifications in yeast found that T4p
interacts with termination factor Rtt103 and is important for proper termination.
Increased intron retention was detected in T4 mutants suggesting a potential role
for T4 residues and associated PTMs in splicing (Harlen et al., 2016).
Recently, T4p was found to associate with centrosomes and midbodies in mitotic
mammalian cells while S5p, S7p and S2p were not present at this RNAPII isoform.
The kinase responsible for T4p at M phase cells is Plk1 and T4 mutant cells had
defects in the M phase progression and chromosome segregation highlighting the
relevance of RNAPII and T4p as structural components of M phase apparatus
(Hintermair et al., 2016).
1.4.6 – Proline isomerization
RNAPII CTD can be non-covalently modified by cis / trans isomerization of proline
residues at positions 3 and 6 (P3 and P6) (Hanes, 2015). Different CTD binding
factors exclusively or preferentially associate with RNAPII depending on the cis /
trans conformation. The trans conformation is more common, occurring 70 to 90%
of the time in proteins, and cis / trans interconversion can occur naturally but at a
slow rate, therefore the activity of peptidyl-prolyl isomerases assumes an
important regulatory role during the transcription cycle (Mayfield et al., 2015).
Isomerase Pin1 increases the affinity of phosphatase Ssu72 to the CTD by
catalysing S5-P6 trans-to-cis conversion regulating indirectly the phosphorylation
levels of the CTD (Mayfield et al., 2015). Mutation of Ess1, yeast homolog of Pin1,
leads to an increase of S5p and S7p levels at the 3´ end of genes demonstrating
the relevance of isomerase activity for CTD phosphorylation dynamics in vivo
(Bataille et al., 2012).
Additionally, several CTD interactors such as CE, cleavage and polyadenylation
factor (Pcf11) and termination factor (Nrd1) selectively bind to specific S-P
conformation states indicating an important role of CTD isomerases at different
stages of transcription (Hanes, 2015; Kubicek et al., 2012).

Chapter 1 Introduction
38
1.4.7 - CTD O-GlcNAcylation
The CTD can be modified by O-GlcNAcylation where O-linked N-acetyl-
glucosamine (O-GlcNAc) is added to S and T residues by O-GlcNAc transferase
(OGT) and removed by N-acetylglucosamidase (OGA) (Jeronimo et al., 2013).
The relevance of CTD O-GlcNAcylation only recently started to be unravelled
although it was first described more than 20 years ago (Kelly et al., 1993).
OGT is enriched at promoters and interacts with several GTFs. Moreover, OGT
activity is required for optimal recruitment of RNAPII to the promoter and RNAPII
present at the PIC is glycosylated. Inhibition of both OGT and OGA affect
transcription prior to PIC formation suggesting cycles of O-GlcNAcylation and
removal of O-GlcNAc before transcription initiation. Mass spectrometry analysis
after in vitro O-GlcNAcylation reactions detected modification of S5 and S2
residues. Since S5 phosphorylation and O-GlcNAcylation are mutually exclusive, it
is possible that O-GlcNAcylation is an additional regulatory step of transcription
initiation (Lewis et al., 2016; Ranuncolo et al., 2012).
1.4.8 - Arginine methylation
A single Arginine residue (R1810) at the non-consensus repeat 31 of the CTD can
be asymmetrically and symmetrically dimethylated (Sims et al., 2011; Zhao et al.,
2016). Asymmetric dimethylation is performed by coactivator-associated arginine
methyltransferase 1 (CARM1) and mutation of this single CTD residue or CARM1
leads to an increased expression of snRNAs and snoRNAs. In the same study, the
tudor domain-containing protein TDRD3 was also found to be an interactor of
asymmetrically dimethylated R1810 in vitro but its knockdown did not cause any
de-repression of snRNA and snoRNAs which suggests involvement in different
functions (Sims et al., 2011).
Symmetric dimethylation of the same Arginine residue by PRMT5 is recognized by
the Tudor containing domain SMN protein. The termination factor senataxin was
shown to interact with RNAPII, an interaction that is mediated by SMN and
symmetric dimethylation of R1810. Senataxin is a DNA-RNA helicase important for
resolving the R-loops formed at 3´ end of genes having an important role in

Chapter 1 Introduction
39
transcription termination. R1810A mutant cells had an accumulation of RNAPII
downstream of poly(A) sites and increased detection of R-loops at 3´ end of
genes, revealing termination defects and indicating that R1810 dimethylation,
SMN and senataxin recruitment are common elements of a pathway regulating
termination (Zhao et al., 2016).
1.4.9 - Lysine ubiquitination and acetylation
Lysine residues can be extensively modified through several PTMs such as
ubiquitination, methylation, acetylation, sumoylation, phosphorylation
polyphosphorylation, glycosylation and hydroxylation (Lanouette et al., 2014). The
mammalian RPB1 CTD has eight lysine residues at the position 7 (CTD-K7) which
are conserved in most vertebrates while D. melanogaster has three, C. elegans
one and no CTD-K7 residues are found in yeast CTD (Fig. 1.3). Mammalian CTD-
K7 residues were found to be ubiquitinated and acetylated in two recent studies (Li
et al., 2007; Schroder et al., 2013). Ubiquitination of six out of eight CTD-K7
residues by ubiquitin E3 ligase Wwp2 in mouse ES cells leads to proteosomal
degradation of RPB1 (Li et al., 2007). This was the first study describing a
modification of non-consensus repeats and highlights the role of CTD-K7 residues
and Wwp2 in the regulation of physiological levels of RPB1 (Li et al., 2007).
CTD-K7 residues are acetylated in vitro and in vivo by P300 and K7 acetylation
(K7ac) is enriched mostly at 5´region region around the TSS and to a lesser extent
downstream in gene bodies, marking both hypo- and hyperphosphorylated RNAPII
(Schroder et al., 2013). The EGF (epithelial growth factor) responsive genes Egr2
and c-Fos fail to be induced on cells expressing a mutant CTD on K7 residues
(K7R substitution). Induction of the Egr2 and c-Fos is reduced in cells treated with
a P300 inhibitor, linking K7 acetylation by P300 with EGF response and potentially
RNAPII pausing (Schroder et al., 2013). A genome-wide expression analysis
performed in K7 mutant cells found several other genes involved in EGF signalling
dysregulated. Genes involved in growth factor signalling, cell adhesion, vascular
development and cell-cell interaction were also dysregulated (Simonti et al., 2015).
The ontology classes of the genes dysregulated are typical features of complex
multicellular metazoans and in fact, analysis of CTD sequences suggest an

Chapter 1 Introduction
40
association between the appearance and expansion of K7 residues with metazoan
evolution.
Figure 1.3. Evolutionary conservation of the CTD-K7 residues at the distal part of RPB1.
Amino acid sequence alignment of the most distal part of the CTD containing K7 residues across different species: Mus musculus (M. mus); Xenopus tropicalis (X. tro); Danio rerio (D. rer); Drosophila melanogaster (D. mel); and, Caenorhabditis elegans (C. ele). Conservation of CTD-K7 residues is highlighted in yellow. CTD repeat numbering was done according to the mouse CTD sequence between repeats 35 and 49, and aligned to the other species CTD from the position of the repeat containing the first lysine in each organism.
1.5 - Lysine Methylation of non-histone proteins
Lysine methylation of histone proteins has been extensively studied and is
essential for genome organisation as it controls DNA accessibility and compaction
regulating gene expression and protecting the genome from damage. Methylation
of non-histone proteins was firstly described a long time ago but only recently the
abundance and function of these modifications started to emerge (Lanouette et al.,
2014). In yeast, lysine methylation is common on elements of the translational
apparatus such as ribosomal proteins, elongation and release factors while many
proteins involved in transcription are methylated in mammals including many
transcription and spliceosomal factors (Biggar and Li, 2015; Clarke, 2013; Moore
and Gozani, 2014). Lysine methylation has been identified in proteins from

Chapter 1 Introduction
41
signalling pathways such as RAS-RAF, EGFR, BMP, WNT and JAK-STAT that
regulate cell growth, proliferation and differentiation (Biggar and Li, 2015).
Lysine residues can be mono-, di- and trimethylated by specific lysine
methyltransferases (KMTs) belonging to two major families: the SET domain
containing KMTs and atypical KMTs that do not have a SET domain. Removal of
methyl groups from lysines is catalysed by demethylases (KDMs) which can be
grouped in two families, the FAD-dependent amine oxidases such as LSD1 able to
demethylate only mono and dimethylated lysines and Jumonji (JmjC) domain-
containing proteins that can demethylate the three methyl states (Hamamoto et al.,
2015). Methylation does not change the charge of the modified residue but
increases the hydrophobic and basic nature of lysines which facilitates the
interaction with specific binders (Hamamoto et al., 2015; Moore and Gozani,
2014). Many proteins containing modules with PHD finger, WD40, Tudor, chromo,
PWWP and MBT domains recognize methylated lysines and the surrounding
amino acids with different affinities towards the mono-, di- and trimethylated states
(Patel and Wang, 2013).
Although the physiological relevance of lysine methylation is in great part mediated
by protein-protein interactions, methylation can also prevent other PTMs targeting
the same or neighbouring residues. If the same lysine residue is polyubiquitinated
or methylated, then methylation can contribute for protein stability by preventing
proteosomal degradation. The opposite situation has also been reported since
methylated lysines can facilitate the recruitment of E3 ubiquitin ligases which
modify other residues therefore promoting protein degradation. Crosstalk between
lysine methylation and other neighbouring modifications such as phosphorylation
can also regulate protein function. For example, NF-kB largest subunit RELA when
phosphorylated at S311 binds to DNA and activates NF-kB target genes but, when
the K310 residue is methylated the H3K9 methyltransferase, GLP is recruited to
chromatin and NF-kB target genes are repressed (Biggar and Li, 2015; Hamamoto
et al., 2015).
The expansion and conservation of K7 residues on the CTD of metazoans and the
limited knowledge of the associated modifications and their role in the transcription

Chapter 1 Introduction
42
cycle prompted us to investigate the CTD-K7 methylation. The characterization of
CTD-K7 mono- and dimethylation as two novel CTD modifications is described in
this thesis.

Chapter 2 Materials and Methods
43
Chapter 2
Materials and Methods
2.1 – Cell culture
2.1.1 – Mouse ES cells
Mouse ES cell line OS25 (kindly donated by Wendy Bickmore) was grown on
0.1% gelatin-coated surfaces in GMEM-BHK21 supplemented with 10% fetal calf
serum, 2 mM L-glutamine, 1% MEM non-essential amino acids, 1 mM sodium
pyruvate, 50 μM ß-mercaptoethanol (all from Gibco, Invitrogen), 1000 U/ml of
human recombinant leukaemia inhibitory factor (LIF; Chemicon, Millipore) and 0.1
mg/ml Hygromycin (Roche), as described previously (Billon et al., 2002; Niwa et
al., 2000).
2.1.2 – NIH3T3 cells
NIH3T3 cells (kind donation from Alex Sardini) were grown in DMEM
supplemented with 10% fetal calf serum, 2 mM L-glutamine and 1 mM sodium
pyruvate (all from Gibco, Invitrogen). NIH3T3 derived cell lines 8K, 3K, 1K and 0K
were grown in presence of α-amanitin selection (2 µg/ml; Sigma).
Mouse ES cell line OS25 and NIH3T3 and derived cell lines (8K, 3K, 1K and 0K)
were regularly tested for Mycoplasma contamination using PCR mycoplasma test
kit from AppliChem (A3744) according to manufacturer instructions.
2.2 – Drug treatments
For inhibition of CDK9 activity and S2 phosphorylation, ES cells were treated for
1h with 10 µM of flavopiridol prior to protein extraction (Stock et al., 2007); from 50
mM stock in DMSO; a kind gift from Sanofi-Aventis). For inhibition of transcription,

Chapter 2 Materials and Methods
44
ES cells were treated with 75 µg/ml of α-amanitin (stock 1 mg/ml in GMEM) during
a 7h time course with protein extracts being collected for untreated control and
after 1h, 2h, 3h, 5h and 7h time points. For general deacetylase inhibition, ES cells
were treated with TSA (50 nM, 3h, Sigma) and for inhibition of P300 acetylase, ES
cells were treated with C646 inhibitor (30 µM, 3h, Sigma, # SML0002) prior to
protein extraction. For flavopiridol, TSA and C646 treatments, control cells were
treated with vehicle (DMSO).
2.3 – Generation of NIH3T3 cell lines expressing wildtype and mutant CTD
constructs
The RPB1 construct YFP-Rpb1 amr contains a point mutation that gives
resistance to α-amanitin (kind gift from Xavier Darzacq; (Darzacq et al., 2007)).
The construct was digested with SanDI and HpaI (Thermo Fisher Scientific) to
remove a fragment with 1.3 kb (residues 6126 to 7428) containing the Rpb1 CTD.
Different CTD sequences with wildtype (8K) and mutant repeats (3K, 1K and 0K)
were obtained by gene synthesis (Genscript, USA) in the pUC57 vector backbone.
In the mutant constructs, the K7 residues were converted into the consensus S7
residues. Mutant 3K contains only three of the K7 residues present at repeats 35,
40 and 47, mutant 1K contains only one K7 residue present at repeat 35 and
mutant 0K has all K7 residues mutated to S7. Wild-type and mutant CTDs were
cloned from the pUC57 vectors to the YFP-Rpb1 amr backbone using the SanDI
and HpaI restriction sites. Constructs were digested and sequenced to confirm the
presence of the eight K7 codons at the wildtype construct, the K7 to S7 mutations
at the different mutant constructs and the absence of additional sequence
changes. For generation of cell lines 8K, 3K, 1K and 0K, NIH3T3 cells growing in a
6 well dish were transfected with 3 µg of DNA using Lipofectamine 2000
(Invitrogen, # 11668). α-Amanitin selection (2 µg/ml) was started 24h after
transfection. Polyclonal cell lines were kept under selection and expanded for one
month before being used in the experiments described.

Chapter 2 Materials and Methods
45
2.4 – Generation and purification of antibodies against CTD-K7me1 and CTD-
K7me2
Immunization of mice and hybridoma generation was performed by Hiroshi Kimura
and Naohito Nozaki and ELISA specificity assays were conducted by Hiroshi
Kimura.
Mouse monoclonal antibodies were produced essentially as described previously
(Kimura et al., 2008). To generate monoclonal antibodies specific for CTD-K7
me1, me2 and me3, mice were immunized with synthetic peptides (Table 2.1) that
were conjugated with keyhole limpet hemocyanin (performed by Hiroshi Kimura,
Tokyo Institute of Technology, Yokohama, Japan and Naohito Nozaki, MAB
Institute Inc., Sapporo, Japan). Hybridoma clones were generated and tested in
western blot using HeLA cells and clone specificity accessed by ELISA (Enzyme-
linked immunosorbent assay) using 96-well microtiter plates that were coated with
the synthetic peptides (Table 2.1) conjugated with bovine serum albumin
(performed by Hiroshi Kimura). Microtiter plates were incubated with 3-fold
dilutions of each antibody starting from 1:20 dilution of a hybridoma culture
supernatant, washed with PBS, incubated with peroxidase-conjugated secondary
antibody, and washed with PBS, before the colorimetric detection (450 nm
absorbance) using tetramethylbenzidine.
To attest their specificity for CTD-K7 residues, 35 ELISA-positive clones were
further validated using western blotting in NIH3T3 8K and 0K cells. Hybridoma
clones CMA611 and CMA612 were specific for K7me1 and K7me2 peptides,
respectively, clone 50A10 was specific for both unmodified CTD-K7 residues and
K7me1, and finally 22D12 clone recognized both K7me1 and K7me2. A total of 27
ELISA-positive clones did not pass this specificity test.
Prior to purification, CMA611, CMA612, 50A10 and 22D12 antibody clones were
isotyped as IgG2b-κ, IgG1-κ, IgG2a-κ, IgG1-κ respectively, using a Mouse
Monoclonal Antibody Isotyping Kit (AbD Serotec, #MMT1). Clones were expanded
in CD Hybridoma medium (Life Technologies) and culture supernatant was
collected (for CMA612 and 22D12 clones with isotype IgG1, NaCl was added to a
final concentration of 4M), filtered using a 0.45 μm membrane (Nalgene) and
purified using HiTrap Protein A FF Sepharose columns (1 ml; GE Healthcare). For

Chapter 2 Materials and Methods
46
CMA612 and 22D12, washes were performed with Protein A IgG binding buffer
(Thermo Scientific) and for IgG2 clones (CMA611 and 50A10) PBS was used.
Elution of CMA612 and 22D12 clones was performed using mouse IgG1 mild
elution buffer (Thermo Scientific). Elution of CMA611 and 50A10 clones was
performed using elution buffer (0.1 M glycine-HCl, pH 2.8). Antibody elution
fractions were concentrated using centrifugal filtration with Amicon Ultra filter 50K
(Millipore) and the buffer was replaced to PBS.
2.5 – Western blotting
Whole cell protein extracts were collected by scraping cells in ice-cold “lysis” buffer
[50 mM Tris-HCl pH 7.5, 1 mM EDTA, 10% glycerol, 1% Triton X-100 (all from
Sigma), 1 mM DTT (Invitrogen), supplemented with phosphatase inhibitors 50 mM
NaF, 5 mM sodium pyrophosphate and 2 mM Na3VO4 and with protease inhibitor
cocktail (Complete Mini EDTA-free, Roche # 11836170001) and 1mM PMSF
(Sigma). To release chromatin-associated proteins, cell extracts were sheared by
passage through a 25G needle, as described in (Stock et al., 2007). Protein
content of cell extracts was quantified using either Bradford (Bio-Rad, # 500-0205)
or Bio-Rad DC protein assay (Bio-Rad, #500-0116). The following amounts of total
extracts were used for western blotting per lane: 0.5-2 µg total protein for 4H8
(S5p) and 8WG16 (unmodified-S2) antibodies, and 5-10 µg total protein for the
other RNAPII antibodies/modifications and 20 µg for histone H3K9 acetylation.
Protein extracts were resolved on 3-8% Tris-acetate SDS-PAGE gels (Novex, Life
Technologies) for RNAPII modifications, 15% SDS-PAGE gels for histone H3K9
acetylation and 7% SDS-PAGE for MYBBP1A. Membranes were blocked,
incubated (2h or overnight) for primary antibody, washed (1h) and incubated (1h)
for secondary antibody, all in blocking buffer (10 mM Tris-HCl pH 8.0, 150 mM
NaCl, 0.1% Tween-20, 5% non-fat dry milk; all from Sigma). HRP-conjugated
secondary antibodies (Jackson ImmunoResearch) were detected with ECL
western blotting detection reagents (Amersham, GE Healthcare). Detailed
information about antibodies is shown in Table 2.2.
To remove phospho-epitopes from blots after protein transfer, membranes were
treated with Alkaline Phosphatase Calf Intestinal (NEB, #M0290S; 1 U/µl) for 8 h

Chapter 2 Materials and Methods
47
at 37°C in NEB buffer 3, prior to western blotting; control untreated blots were
incubated with NEB buffer 3.
C. elegans whole worm extracts (kind donation from Stefanie Seelk and Baris
Tursun, BIMSB, MDC, Berlin) were prepared from N2 worms (wild-type). Worms
were washed in M9 medium (42 mM Na2HPO4, 22 mM KH2PO4, 86 mM NaCl, 1
mM MgSO4) and directly lysed in SDS sample buffer for 10 min at 94°C. Nuclei
from D. melanogaster embryos (kind donation from Robert Zinzen, BIMSB, MDC,
Berlin) were isolated as previously described in (Bonn et al., 2012). Protein
extracts were obtained using “lysis” buffer, as described above.
2.6 – CTD peptide pulldowns
CTD Peptide pulldown experiments were performed by Alexander Kukalev from
our lab and mass spec analysis was performed by Guido Mastrobuoni (BIMSB-
MDC Proteomics and Metabolomics platform).
In order to screen for protein interactors of CTD-K7 residues and K7me2, we
designed and ordered biotinylated CTD peptides (Peptides & Elephants; Berlin)
comprised of 3 heptapeptide repeats containing either a serine (S7), unmodified
lysine (K7) or dimethylated lysine (K7me2) at position 7 (Table 2.3). CTD peptides
were coupled to Streptavidin Sepharose beads (GE Healthcare cat. 17-5113-01)
and later used for pulldowns with total protein extracts from mouse ES cells
followed by mass spectrometry analysis.
2.6.1 – Total cell extract preparation
For total cell extract preparation, cell pellets from OS25 cell line (2 biological
replicates) were ressuspended in PBS supplemented with 0.2% NP-40,
phosphatase inhibitors Na3VO4 (2 mM), NaF (5 mM) and PMSF (1 mM, Sigma)
and protease inhibitor cocktail (Complete Mini EDTA-free, Roche # 11836170001).
Ressuspended cells were sonicated using a probe-type sonicator with the
following conditions: 4 rounds of sonication for 20s at 83% of power output with 2
minute intervals between each sonication round, all performed on ice. After
Chapter 2 Materials and Methods
48
sonication, extracts were spun down and the resulting supernatant used for
peptide pulldowns after quantification of protein content using Qubit (Invitrogen).
2.6.2 – Peptide pulldowns
The chosen pulldown strategy involved a pre-incubation step to deplete protein
extracts of non-specific interactors. To screen for modifiers of K7 residues,
extracts were first incubated with S7 peptides and then with K7 peptides. To
screen for “readers” of K7me2, extracts were first incubated with K7 peptides and
the second incubation was performed with K7me2. A mock IP control was
performed in parallel using beads with no peptides added. A total of 9 mg of
protein extracts and 100 µl of beads were used per pulldown and the pre-
incubations were performed for 2 h at 4°C, on a rotating wheel after which
samples were spun down. Beads were kept at 4°C for mass spectrometry analysis
and supernatants were incubated with K7 and K7me2 peptides overnight at 4°C
on a rotating wheel. The supernatant incubated with K7 peptides was additionally
supplemented with 100 µM of SAH (S-Adenosyl-L-homocysteine) a compound
used to stabilize HMTs and facilitate their identification. After overnight
incubations, supernatants were discarded and beads were washed firstly 3 times
with PBS supplemented with 0.2% NP-40 and secondly 5 times with PBS only.
GO analysis of the proteins identified from the different pulldowns by mass
spectrometry was performed using AmiGO2 gene set / term enrichment tool with
Bonferroni correction.
2.7 – YFP-RPB1 pulldowns
YFP-RPB1 pulldown optimization was performed jointly with Alexander Kukalev
and mass spectrometry analysis was performed by Oliver Popp from MDC Mass
Spectrometry core facility.
NIH3T3 8K and 0K cells were collected in PBS with phosphatase inhibitors
Na3VO4 (2 mM) and NaF (5 mM) and with PMSF (1 mM, Sigma) protease inhibitor
cocktail (Complete Mini EDTA-free, Roche # 11836170001). Ressuspended cells
were sonicated with a probe-type sonicator with the following conditions: 3 rounds

Chapter 2 Materials and Methods
49
of 20s of sonication at 83% power output with 2 min pause between sonications.
Samples were kept on ice during the whole procedure. After sonication, samples
were spun down, supernatant was collected and protein content determined using
Bio-Rad DC protein assay (Bio-Rad, #500-0116).
For each IP, 500 µg of protein extracts in PBS + 1% Triton X-100 were incubated
overnight at 4°C with an antibody raised against GFP (10 µg; Invitrogen, A11122)
in a rotating wheel. After overnight incubation, 40 µl of Protein A beads (Roche,
#70337520) were added to IP samples and incubated for 1h. Beads were washed
with PBS + 1% Triton X-100, three times on ice. After the final wash, proteins
bound to beads were analysed by mass spectrometry from three biological
replicates.
GO analysis of the proteins identified by mass spectrometry from 8K and 0K IPs
was performed using AmiGO2 gene set / term enrichment tool with Bonferroni
correction.
2.8 – Immunofluorescence
Mouse fibroblasts (NIH3T3 cell line) were grown on coverslips coated with Poly-L-
Lysine (Sigma). Cells were fixed at room temperature for 10 min in 4% freshly
depolymerized paraformaldehyde, containing 0.1% Triton X-100 in 125 mM
HEPES-NaOH (pH 7.6) and permeabilized in 1% Triton X-100 in PBS for 20 min at
room temperature. After permeabilization, coverslips were washed in PBS and
incubated with 20 mM glycine (Sigma) in PBS for 30 min at room temperature.
Blocking (1h), incubation with primary (2h) and secondary (1h) antibodies was
performed in “PBS plus” (PBS supplemented with 1% casein, 1% BSA, 0.2% fish
skin gelatin, pH 7.8, all from Sigma). Washes were done using “PBS plus” (after
both primary and secondary antibody incubations). Prior to nucleic acid staining,
coverslips were washed with 0.1% Tween-20 in PBS. Nucleic acids were stained
using 2 µM TOTO-3 iodide (Invitrogen) in 0.1% Tween-20 in PBS for 20 min at
room temperature and washed three times in 0.1% Tween-20 in PBS, and twice in
PBS. Coverslips were mounted in VectaShield (Vector Laboratories, UK) and
imaging was performed using a laser scanning confocal microscope Leica TCS
SP2.

Chapter 2 Materials and Methods
50
2.9 – Gene expression analysis by quantitative RT-PCR
RNA was extracted by Trizol (Ambion) extraction using Phase Lock Gel tubes (5
PRIME). Samples were treated with DNAse I (Turbo DNAse, Ambion) according to
manufacturer instructions. Total RNA (1 µg) was retrotranscribed using random
primers (50 ng) and 200 U of reverse transcriptase (SuperScript II RT, Invitrogen)
in a 20 µl reaction. The synthesized cDNA was treated with 2 U of RNAse H (New
England Biolabs), diluted 1:10 and 2.5 µl were used per RT-PCR reaction. Total
RNA was measured using primers designed for the 5´ end of genes and levels
were normalized for Actb mRNA measured using primers for the exon1-exon2
junction (for primer sequence see Table 2.4).
2.10 – RNA-seq library preparation and gene expression analysis for NIH3T3
8K and 0K cell lines
RNA-seq libraries were prepared jointly with Carmelo Ferrai and bioinformatic
analysis of RNA-seq data was performed by Robert Beagrie and Tiago Rito all
members of our lab.
Total RNA was extracted from NIH3T3 cell lines 8K and 0K with Trizol reagent
(Ambion) using Phase Lock Gel tubes (5 PRIME). RNA (1µg) was then treated
with DNAse I (Turbo DNAse, Ambion) followed by ribosomal RNA (rRNA)
depletion using RiboMinus kit (Invitrogen), according to the manufacturer´s
instructions. The quality of the RNA samples was assessed by Bioanalyser
(Agilent) after DNAse I and Ribominus treatments. Next, 125 ng of RNA were used
for library preparation using Illumina TruSeq RNA sample preparation kit,
according with the instructions (Part# 15026495 Rev. A). Since we generated total
RNA libraries, we initiated the Illumina protocol at the first strand cDNA synthesis
step. At the end of the protocol, libraries were quantified using QuBit (Invitrogen)
and by qPCR using Kapa Library Quantification Universal Kit (KapaBiosystems,
#KK4824) and library preparation quality was accessed using Bioanalyser. Paired
end sequencing was performed using Illumina platform by the Genomics facility at
MRC CSC (Clinical Sciences Centre), London, UK.

Chapter 2 Materials and Methods
51
Sequence reads from RNA-seq data were aligned to mouse genome annotation
mm9 with TopHat 1.3.1 using uniquely mapped reads and FPKM values were
calculated using Cufflinks with default settings. GO analysis were performed for
genes differentially expressed between 8K and 0K datasets with AmiGO2 gene set
/ term enrichment tool, using as background genes with a minimum of 2 FPKM for
8K and 0K cell lines (n=9339).
2.11 – Chromatin Immunoprecipitation (ChIP)
ChIP for RNAPII modifications was performed using fixed chromatin as described
previously (Brookes et al., 2012; Stock et al., 2007). Mouse ES cells were fixed in
1% formaldehyde (Sigma) at 37°C for 10 min, after which the reaction was
stopped adding glycine to a final concentration of 0.125M. Fixed cells were
washed with ice cold PBS, lysed in “swelling buffer” [25 mM HEPES pH 7.9, 1.5
mM MgCl2, 10 mM KCl (all from Sigma) and 0.1% NP-40 (Roche)], scraped from
dishes and nuclei were isolated with a Dounce homogenizer (tight pestle) followed
by centrifugation. Nuclei resuspended (1x10⁷ nuclei/ml) in “sonication” buffer [50
mM HEPES pH 7.9, 140 mM NaCl, 1 mM EDTA, 1% Triton X-100, 0.1% Na-
deoxycholate and 0.1% SDS (all from Sigma)] were sonicated (Diagenode
Bioruptor) for 30 min at full power for 30 cycles of 30 s ‘on’ and 30 s ‘off’ at 4°C.
Chromatin was centrifuged and, after disposal of the insoluble fraction, DNA
content was quantified using alkaline lysis. Both swelling and sonication buffers
were supplemented with phosphatase inhibitors NaF (5 mM) and Na3VO4 (2 mM)
and with PMSF (1 mM) and protease inhibitor cocktail (Complete Mini EDTA-free,
Roche # 11836170001).
Protein G magnetic beads (Active Motif) were incubated (50 µl per IP) with 10 µg
of bridging antibody anti-IgM/IgG (Jackson ImmunoResearch) for 1 h at 4°C and
then washed and resuspended in sonication buffer. For each immunoprecipitation,
600-700 µg of chromatin was incubated overnight with beads and the respective
RNAPII or control antibody (for details about ChIP antibodies see Table 2.2). After
immunoprecipitation, beads were washed at 4°C, as described previously (Stock
et al., 2007). For elution of the immune complexes, beads were resuspended in 50
mM Tris-HCl pH 8.0, 1 mM EDTA, 1% SDS and incubated for 5 min at 65°C,

Chapter 2 Materials and Methods
52
followed by 15 min at room temperature. Reverse cross-linking was done at 65°C
overnight (for qPCR) or for 8h (for samples processed for ChIP-seq library
preparation) after adding 10 µg of RNase A (Sigma, #R4642) and NaCl to a final
concentration of 155 mM.
Samples were incubated with 100 µg of Proteinase K (Roche, # 03115836001), for
2h at 50°C, after EDTA concentration was adjusted to 5 mM. DNA was recovered
by phenol-chloroform extraction followed by ethanol precipitation in the presence
of 20 ng/ml glycogen. DNA concentration was determined by PicoGreen
fluorimetric assay (Molecular Probes, Invitrogen) and samples were diluted to a
final concentration of 0.2 ng/µl. Immunoprecipitated and input samples (0.5 ng
each) were analyzed by quantitative real-time PRC (qPCR) using SYBR No-Rox
sensimix (Bioline). Quantitative PCR “cycle over threshold” (Ct) values from
immunoprecipitated samples (RNAPII or control antibody) were subtracted from
the input Ct values and the fold enrichment over input was calculated using the
equation 2(input Ct – IP Ct). Primer sequences are listed in Table 2.5.
2.12 – ChIP-seq library preparation and sequencing
ChIP-seq libraries were produced by Carmelo Ferrai assisted by me and
Alexander Kukalev. Sequencing was performed by BIMSB Genomics Platform.
Prior to ChIP-seq library preparation, RNAPII enrichment and distribution were
assessed by qPCR analyses using a previously characterized panel of genes
(Brookes et al., 2012; Stock et al., 2007). ChIP-seq libraries for CTD K7me1 and
K7me2 were prepared from 10 ng of immunoprecipitated DNA (quantified by
PicoGreen and Qubit) using the Next ChIP-Seq Library Prep Master Mix Set from
Illumina (NEB, # E6240) following the NEB protocol, with some modifications. The
intermediate products from the different steps of the NEB protocol were purified
using MiniElute PCR purification kit (Qiagen, # 28004). Adaptors, PCR
amplification primers and indexing primers were from the Multiplexing Sample
Preparation Oligonucleotide Kit (Illumina, # PE-400-1001). Samples were PCR
amplified prior to size selection (250-600bp) on an agarose gel. After purification
by QIAquick Gel Extraction kit (Qiagen, # 28704), libraries were quantified by
qPCR using Kapa Library Quantification Universal Kit (KapaBiosystems,

Chapter 2 Materials and Methods
53
#KK4824). Library size distribution was assessed by Bioanalyzer High Sensitivity
DNA analysis Kit (Agilent, #5067-4626) before high-throughput sequencing.
Libraries were quantified by Qubit and sequenced using Illumina Sequencing
Technology (single-end sequencing, 51 nucleotides) at the BIMSB Genomics
Platform using an Illumina HiSeq2000, according to the manufacturer’s
instructions.
2.13 – Bioinformatics analyses
Bioinformatic analyses were performed by Tiago Rito and Elena Torlai Triglia.
In addition to ChIP-seq datasets generated for CTD K7me1 and K7me2
modifications in mouse ES cells, we also analyzed published ES cell ChIP-seq
and GRO-seq datasets (Table 2.6). Published RNAPII datasets were: unmodified-
S2 (detected with antibody 8WG16), S5p, S7p, S2p, all from (Brookes et al.,
2012); and RNAPII K7ac from (Schroder et al., 2013). Published histone
modification datasets were: H2Aub1 and H3K36me3 from (Brookes et al., 2012);
and H3K27me3 and H3K4me3 from (Mikkelsen et al., 2007). CpG content was
defined as in (Brookes et al., 2012).
Sequenced reads were aligned to the mouse genome (assembly mm9, July 2007)
using Bowtie2 version 2.0.5 (Langmead and Salzberg, 2012), with default
parameters. Duplicated reads (i.e. identical reads, aligned to the same genomic
location) occurring more often than a threshold were removed. The threshold is
computed for each dataset as the 95th percentile of the frequency distribution of
reads.
Boxplots were produced using R. A pseudo-count of 10-4 was added to FPKM
(Fragments Per Kilobase of exon per Million reads mapped) values from (Brookes
et al., 2012) prior to logarithmic transformation and plotting.
Average ChIP-seq profiles were generated by plotting the average depth of
coverage in non-overlapping windows of 10bp, across 5kb genomic windows
centered on TSS and TES as in (Brookes et al., 2012). The read coverage of
ChIP-seq heatmaps was calculated using HTSeq (Anders et al., 2015) with 5bp
resolution. The z-score of each gene (row) was plotted using the pheatmap

Chapter 2 Materials and Methods
54
package (Kolde, 2015) in R.
GRO-seq data from (Jonkers et al., 2014) were downloaded as bedgraph files for
untreated ES cells and the read coverage for sense and anti-sense transcription
was calculated separately for a 1.5kb window (-500 to +1000bp of TSS) at a 10bp
resolution. GRO-seq RPKM (reads per kilobase per million of reads mapped)
values were estimated using the total number of reads mapped from the TSS to
the TES of genes.
For CTD-K7me1, K7me2 and K7ac, positively enriched windows were detected
using Bayesian Change-Point (BCP; (Xing et al., 2012)) run in Histone Mark (HM)
mode using as control datasets the mock ChIP dataset from (Brookes et al., 2012)
for CTD-K7me1 and CTD-K7me2, or the input dataset from Schroder et al., 2013
for CTD-K7ac. Gene promoters were considered positive for K7me1, K7me2 and
K7ac when (a) the 2kb windows centered on the gene promoters coincided with a
region enriched for the mark, and (b) the amount of reads in the promoter window
was above the 10th percentile (10% tail cut; Fig. 4.3a). We excluded from further
analyses genes whose (positive) TSS window was overlapped with another
positive window for the same mark (both genes removed), and positive genes that
were inside other positive genes for the same mark (only ‘internal’ gene removed).
For other RNAPII modifications or histone marks, we used published classification
from (Brookes et al., 2012).
For the analyses in Fig. 4.11 to 4.15, we defined two cohorts of non-overlapping
active genes. The larger group (n=4271) included all genes with non-overlapping
promoters (2kb window around TSS), active, i.e. FPKM >1 (FPKM values from
(Brookes et al., 2012) and positive for S5p (TSS), S7p (TSS), S2p (2kb window
after TES), as well as negative for the histone marks H3K27me3 and
H2AK119ub1. The smaller cohort (n=1564) had the additional criterion that the
maximum peak of RNAPII (8WG16) has to be within a 100bp window around TSS.
Genes classified as Polycomb-repressed were positively marked by H3K27me3,
H2AK119ub1 and RNAPII-S5p, negatively marked by 8WG16, all at the 2kb
window centered around the genes TSS, and were devoid of RNAPII-S2p in the
2kb window downstream of TES (from Brookes et al., 2012). They also do not
overlap with other positively marked TSS or TES regions.

Chapter 2 Materials and Methods
55
Genes classified as most active (top 15%) or least active (bottom 15%) genes
were defined according to FPKM values from mRNA-seq datasets published in
Brookes et al., 2012, and were chosen from the pool of genes negative for
Polycomb marks (H2AK119ub1 and H3K27me3; classification from Brookes et al.,
2012.
2.13.1 – Ratios of K7me1/K7ac and K7me2/K7ac
To relate CTD-K7 methylation to acetylation levels, the ratio between the read
counts of K7me1/2 and K7ac were computed at promoters (2kb around TSS), both
scaled by 10 million over the total number of non-duplicated mapped reads of the
respective dataset. The ratios K7me1/K7ac and K7me2/K7ac are highly correlated
(Spearman’s correlation coefficient 0.88); for simplicity, only the K7me2/K7ac ratio
was used for further in-depth analyses. The ratio of K7me2/K7ac for each active
gene was used to define three quantiles (high, medium and low K7me2/K7ac
ratio).
2.13.2 – Correlations and linear modelling of CTD modifications
To apply linear regression models and perform correlation analyses, the promoter
read counts for the different CTD modifications were centered and scaled. The
Spearman’s correlation coefficients were plotted as a matrix using the ‘corrplot’
package in R and partial correlations calculated using the ‘pcor’ function of ‘ggm’
package. Traditional regression modelling using correlated predictor variables is
difficult to interpret and hence we used a stepwise regression approach to better
untangle the contributions of different CTD modifications. Typically, for a given
number of predictor variables, we report the top five best models. Since CTD-S2p
measured at 2kb window after TES is the best predictor of mRNA amongst all
CTD modifications and gene regions, we decided to study models that predict the
levels of the S2p (instead of mRNA-seq) to avoid inclusion of another highly
correlated variable. Model fitting was performed in R using the packages ‘lm’ and
‘leaps’. Model ranking was based on both adjusted R2 and Akaike information
criterion (AIC).

Chapter 2 Materials and Methods
56
To investigate whether the contribution of CTD modifications to S2p levels at 2kb
window after the TES, which were obtained through correlation and stepwise
regression analyses, are due to co-linearity artifacts or over-fitting, we also
employed the LASSO (Least Absolute Shrinkage and Selection Operator)
regression method implemented in the ‘lars’ R package (Efron, 2013). We used as
predictor variables of S2p TES levels the promoter levels of 8WG16, S5p, S7p,
K7me1, K7me2, K7ac, mock and CpG. Cross-validation [minimum cross-validated
MSE (Mean Standard Error) + 1SE (Standard Error)] was used to select the
optimal position along the path; typical models discard the mock and 8WG16
predictors. As seen in stepwise regression, S7p and K7ac display significant
positive coefficients whilst K7me1 and K7me2 have negative coefficients.
2.13.3 – Gene ontology (GO) analysis
Gene ontology enrichment analysis was performed using GO-Elite version 1.2.5
(Gladstone Institutes; http://genmapp.org/go_elite). Over-representation analysis
of the top and bottom 300 genes for K7me2/K7ac ratio (see above) was performed
using as background the n=1564 active, non-overlapping genes for which the ratio
was computed. Default parameters were used as filters: z-score threshold more
than 1.96, p-value less than 0.05, number of genes changed more than 2. Over-
representation analysis was performed with ‘permute p-value’ option, 2000
permutations.
2.13.4 – Microarray data analysis
Total RNA transcriptomic analyses of 50 nM TSA treatment of mouse ES cells (6
h) is publicly available and described in (Karantzali et al., 2008). Affimetrix
Mouse430 2.0 Array probeset names were converted to Ensembl Gene ID using
the ‘Mouse430_2.na34.annot.csv’ table obtained from the Affimetrix website.
Probesets associated with more than one Ensembl Gene ID were excluded from
the analysis; in the few cases where more than one probeset was associated to
the same Ensembl Gene ID, one probe set was randomly selected. Merging of the
list of TSA differentially expressed genes with the K7me2/K7ac ratio lists was

Chapter 2 Materials and Methods
57
performed using Ensembl Gene ID; genes in High, Medium or Low group were
taken from extended cohort (4271 genes; see Bioinformatics analyses above). The
significance of the difference between genes in the three ratio groups was tested
with a two-tailed Fisher's Exact using R.

Chapter 2 Materials and Methods
58
Table 2.1. RPB1 CTD peptides used for mouse immunization and ELISA.
Table 2.2. List of Antibodies used in Western blot (WB), chromatin
immunoprecipitation (ChIP) or immunofluorescence (IF)
Amount / dilution Antibody Raised in
(isotype) Clone Stock
(mg/ml) WB ChIP IF Source
S5p Mouse (IgG) CTD4H8 (MMS-128P)
1 1/200000 10 µl (10µg)
1/3000 Covance
S7p Rat (IgG) 4E12 - 1/10 -
- kind gift from Dirk Eick
S2p Mouse (IgM) H5 (MMS-129R)
1-3 1/500 - - Covance
Unphospho-S2
Mouse (IgG) 8WG16 (MMS-126R)
1-3 1/200 - - Covance
N-terminus (Total RPB1)
Rabbit (IgG) H224 (sc-9001x)
0.2 1/200 - - Santa Cruz Biotechnology
K7me1 Mouse (IgG) CMA611 10 1/1000 5 µl (50µg)
1/200 this study
K7me2 Mouse (IgG) CMA612 10 1/1000 5 µl (50µg)
1/200 this study
K7/K7me1 Mouse (IgG)
50A10 10 1/1000 - - this study
K7me1/2 Mouse (IgG)
22D12 10 1/1000 - - this study
H3K9ac
Rabbit serum
39585 - 1/1000 - - Active Motif
Lamin B Goat (IgG) C-20 Sc-6216 0.2 1/500 - Santa Cruz Biotechnology
α-tubulin Mouse (IgG) T6074 2 1/10000 -
- Sigma
GFP Rabbit (IgG) A11122 2 1/1000 -
- Life Technologies
Digoxigenin
Mouse (IgG) 200-002-156 1.2 - 10 µl (12µg)
- Jackson Immuno Research
MYBBP1A Rabbit (polyclonal)
GTX4978 1 1/500 - - GeneTex
Peptide sequence Modification
SYSPTSPKYTPTSPSC Unmodified
SYSPTSPKme1YTPTSPSC K7 monomethyl
SYSPTSPKme2YTPTSPSC K7 dimethyl
SYSPTSPKme3YTPTSPSC K7 trimethyl
SYSPTSPKacYTPTSPSC K7 acetyl

Chapter 2 Materials and Methods
59
Table 2.3. RPB1 CTD peptides used for peptide pulldowns
Table 2.4. List of expression primers (F, forward and R, reverse).
Peptide sequence Modification
YSPTSPS-YSPTSPS-YSPTSPS Unmodified S7
YSPTSPK-YSPTSPK-YSPTSPK Unmodified K7
YSPTSPKme2-YSPTSPKme2-YSPTSPKme2 K7 dimethyl
Gene expression primers
Primer sequence (5´to 3´)
β-actin 5´F CCACCCGCGAGCACA
β-actin 5´R CCGGCGTCCCTGCTTAC
β-actin Exon1 F TCTTTGCAGCTCCTTCGTTG
β-actin Exon2 R ACGATGGAGGGGAATACAGC
Oct4 5´F TGAGCCGTCTTTCCACCA
Oct4 5´R TGAGCCTGGTCCGATTCC
Sox2 5´F AGGGCTGGGAGAAAGAAGAG
Sox2 5´R ATCTGGCGGAGAATAGTTGG
Serpine1 5´F CCCCGAGAGCTTTGTGAAG
Serpine1 5´R AAGGTGCCTTGTGATTGGCT
Dusp1 5´F CGGTGAAGCCAGATTAGGAG
Dusp1 5´R AGGAGCGACAATCCAACAAC
Ctgf 5´F GACTCAGCCAGATCCACTCC
Ctgf 5´R GTGCAGAGGCGACGAGAG

Chapter 2 Materials and Methods
60
Table 2.5. List of ChIP primers (F, forward and R, reverse). Polr2a primers were
designed and tested by Inȇs de Castro, Pombo Laboratory.
ChIP primers Primer sequence
β-actin (promoter) F GCAGGCCTAGTAACCGAGACA
β-actin (promoter) R AGTTTTGGCGATGGGTGCT
β-actin (coding) F TCCTGGCCTCACTGTCCAC
β-actin (coding) R GTCCGCCTAGAAGCACTTGC
Oct4 (promoter) F GGCTCTCCAGAGGATGGCTGAG
Oct4 (promoter) R TCGGATGCCCCATCGCA
Oct4 (coding) F CCTGCAGAAGGAGCTAGAACA
Oct4 (coding) R TGTGGAGAAGCAGCTCCTAAG
Nkx2.2 (promoter) F CAGGTTCGTGAGTGGAGCCC
Nkx2.2 (promoter) R GCGCGGCCTCAGTTTGTAAC
HoxA7 (promoter) F GAGAGGTGGGCAAAGAGTGG
HoxA7 (promoter) R CCGACAACCTCATACCTATTCCTG
Gata4 (promoter) F AAGAGCGCTTGCGTCTCTA
Gata4 (promoter) R TTGCTAGCCTCAGATCTACGG
Myf5 (promoter) F GGAGATCCGTGCGTTAAGAATCC
Myf5 (promoter) R CGGTAGCAAGACATTAAAGTTCCGTA
Myf5 (coding) F GATTGCTTGTCCAGCATTGT
Myf5 (coding) R AGTGATCATCGGGAGAGAGTT
Gata1 (promoter) F AGAGGAGGGAGAAGGTGAGTG
Gata1 (promoter) R AGCCACCTTAGTGGTATGACG
Gata1 (coding) F TGGATTTTCCTGGTCTAGGG
Gata1 (coding) R GTAGGCCTCAGCTTCTCTGTAGTA
Polr2a (-1kb) F CCGTAAAGCTATTAGAGCACAGG
Polr2a (-1kb) R ATGCATAAGGCAGGCAAGAT
Polr2a (-0.5kb) F GTAACCTCTGCCGTTCAGGA
Polr2a (-0.5kb) R TTTCTCCCTTTCCGGAGATT
Polr2a (E1) F CAGGCTTTTTGTAGCGAGGT
Polr2a (E1) R GACTCAGGACTCCGAACTGC
Polr2a (I1) F CAGAGGGCTCTTTGAATTGG
Polr2a (I1) R GCATCAGATCCCCTTCATGT
Polr2a (I2/E3) F GCCCTCTTCTGGAGTGTCTG
Polr2a (I2/E3) R AGGAAGCCCACATGAAACAC
Polr2a (E19/I19) F CCAAGTTCAACCAAGCCATT
Polr2a (E19/I19) R TCTTAACCGCTGAGCCATCT
Polr2a (E28) F TCTCCCACTTCTCCTGGCTA
Polr2a (E28) R CCGAGGTTGTCTGACCCTAA
Polr2a (+2kb TES) F GAGGGGCAGACACTACCAAA
Polr2a (+2kb TES) R AAAAGGCCAAAGGCAAAGAT

Chapter 2 Materials and Methods
61
Table 2.6. Description of ChIP-seq and mRNA datasets
ChIP-seq
dataset
Dataset
origin
Antibody
clone
Mapped
reads
(millions)
ES cell
line
RPB1-K7me1
(GSM1874007)
This study CMA611
(this study)
64 ESC OS25
RPB1-K7me2
(GSM1874008)
This study CMA612
(this study)
69 ESC OS25
RPB1-K7ac
(SRR1028808)
Schröder et al.,
2013
AcRPB1
(Schröder et al.,
2013)
85 ESC
Input
(SRR1028807)
Schröder et al.,
2013
-
21 ESC
RPB1-S5p
(GSM850467)
Brookes et al.,
2012
CTD4H8 (MMS-
128P, Covance)
22 ESC OS25
RPB1-S7p
(GSM850468)
Brookes et al.,
2012
4E12
(Chapman et al.,
2007)
11 ESC OS25
RPB1-S2p
(GSM850470)
Brookes et al.,
2012
H5
(MMS-129R,
Covance)
33 ESC OS25
Unphospho-S2
(8WG16)
(GSM850469)
Brookes et al.,
2012
8WG16
(MMS-126R,
Covance)
24 ESC OS25
Mock IP
(GSM850473)
Brookes et al.,
2012
-
12 ESC OS25
H3K4me3
(GSM307618)
Mikkelsen et
al., 2007
ab8580
(Abcam)
9 ESC V6.5
H3K36me3
(GSM850472)
Brookes et al.,
2012
13C9
(Rechtsteiner et
al., 2010)
23 ESC OS25
H2Aub1
(GSM850471)
Brookes et al.,
2012
E6C5
(Upstate)
18 ESC OS25
H3K27me3
(GSM307619)
Mikkelsen et
al., 2007
07-449
(Upstate)
8 ESC V6.5
RNA datasets Dataset
origin
Mapped reads (millions) Cell
line
mRNA-seq
(GSM850476)
Brookes et al.,
2012
74 ESC OS25
GRO-seq
(GSE48895)
Jonkers et al.,
2014
25 ESC V6.5
(“untreated”)

62

Chapter 3 Results
63
Chapter 3
RNA Polymerase II C-terminal domain is mono- and
dimethylated at Lysine residues
3.1 Aims
To investigate new post-translational modifications of the C-terminal domain of
RPB1, I focused on the CTD-K7 residues, the most frequent amino acid
substitution present at the non-consensus repeats of vertebrates. In this chapter, I
describe the generation of RPB1 constructs, mouse cell lines and monoclonal
antibodies that were subsequently used to characterize mono- and dimethylation
of CTD-K7 residues. I also show that CTD-K7 methylation is associated with early
stages of transcription, an observation that is further explored in Chapter 4.
3.2 Results
3.2.1 – Generation of Rpb1 mutant CTD-K7 constructs and α-amanitin
resistant cell lines to study CTD-K7 modifications
α-Amanitin is an inhibitor frequently used in transcription studies that binds with
high affinity to RPB1 near the catalytic site in such a conformation that nucleotide
incorporation and translocation of the transcript are inhibited (Bensaude, 2011).
RPB1 complexes stalled in the presence of α-amanitin are degraded but several
single amino acid substitutions can prevent binding of α-amanitin, making these
mutant RPB1 variants resistant to degradation. Resistant RPB1 variants have

Chapter 3 Results
64
been used as important research tools that enable the ectopic expression of Rpb1
with deletions or mutations under α-amanitin selection. In such a system, the
endogenous α-amanitin-sensitive RPB1 is continually depleted and functionally
replaced by the resistant variant (Nguyen et al., 1996). To study the importance of
non-consensus CTD-K7 residues in transcription and their potential for post-
translational methylation, I took advantage of several Rpb1 α-amanitin resistant
constructs (Fig. 3.1).
Figure 3.1. α-amanitin resistant constructs as a tool to study RPB1 CTD-K7 function in mouse cells.
a, Outline of α-amanitin resistant YFP-RPB1 constructs used to generate mouse cell lines bearing K7-to-S7 mutations. Red bars represent CTD repeats with K7 residues. The nomenclature of the cell lines is indicative of the number of K7 residues retained in each α-amanitin-resistant Rpb1 constructs. b, The inhibitor α-amanitin binds to endogenous RPB1 inducing its degradation and as a result blocks transcription. Ectopic expression of α-amanitin resistant YFP-RPB1 bypasses degradation of endogenous RPB1 restoring transcription.
To explore the effect of the number and position of different K7 residues in the
mouse CTD, we generated α-amanitin-resistant YFP-Rpb1 (YFP fusion at N-
terminus of Rpb1 gene) constructs containing different numbers of K7-to-S7
mutations (Fig. 3.1). CTD-K7 residues were mutated into serine (S7) residues to
restore the consensus sequence of the CTD heptapeptide. We avoided the more
traditional lysine to arginine substitution, as a non-canonical arginine residue at the
CTD (in position 7 of repeat 31) undergoes methylation in vivo (Sims et al., 2011).
Therefore, artificial expansion of R7 residues in the CTD could confound our
investigation of CTD-K7 methylation. Mutant 0K does not have any K7 residues,

Chapter 3 Results
65
therefore resembling a yeast-like CTD, but with 52 repeats. Mutant 1K retains only
one K7, on repeat 35, which is conserved in D. melanogaster (aligning from C-
terminus of CTD) and is the only K7 residue present in C. elegans. Mutant
construct 3K has three K7 residues present at repeats 35, 40 and 47, all of which
are conserved in D. melanogaster. Finally, we used a wildtype Rpb1 construct
(8K), which contains all eight vertebrate-conserved K7 residues, as a control for
expression and α-amanitin selection.
In previous studies, human cells ectopically expressing the Wt YFP-Rpb1 fusion
construct grew stably under α-amanitin selection for over 1 month (Darzacq et al.,
2007). To establish the conditions for stable ectopic expression of α-amanitin
resistant RPB1 in mouse cells, I tested several constructs containing the Wt YFP-
Rpb1 sequence (8K) with different delivery systems in mouse embryonic stem
(ES) cells and NIH3T3 fibroblasts (Table 3.1 and Fig. 3.2).
Table 3.1. Summary of α-amanitin resistant Wt Rpb1 constructs and expression strategies used to develop stable mouse cell lines
Description of the different YFP-RPB1 α-amanitin constructs with CMV and F9 promoters used for expression in mouse ES cells and fibroblasts (NIH3T3) and the respective delivery systems used.
NIH3T3 cells transfected with Wt (8K) YFP-RPB1 vector under CMV promoter
expression were able to grow with α-amanitin selection after an initial period of
extensive cell death (Fig. 3.2). Polyclonal cell lines were generated stably
expressing Wt YFP-RPB1 and the different K7-to-S7 mutant constructs. All cell
lines were viable and showed stable YFP-RPB1 expression for more than one

Chapter 3 Results
66
month in culture and after several passages under α-amanitin selection. Viability of
cells expressing α-amanitin-resistant RPB1 was previously shown for K7-to-R7
mutations (Schroder et al., 2013) or for other CTD constructs without all lysines,
where Rpb1 contained only consensus heptapeptide repeats (Chapman et al.,
2005; Hintermair et al., 2012).
Figure 3.2. Generation of stable YFP-RPB1 mouse cell lines.
Polyclonal NIH 3T3 cell lines stably expressing YFP-RPB1 were generated after prolonged α-amanitin selection and expanded for further studies. Different strategies were used to generate stable YFP-RPB1 mouse ES cells but no cell viability was observed under prolonged α-amanitin selection.
ES cells were also used to stablish an expression system based on the α-amanitin
resistant constructs. The original Wt construct, which expresses YFP-RPB1 fusion
from a CMV promoter, is not ideal for expression in ES cells as it was reported that
CMV promoters drive low levels of expression in ES cells and can get inactivated
after prolonged time in culture (Chung et al., 2002; Zeng et al., 2003). The Wt
construct was engineered to replace the original promoter for a F9 promoter and
both Wt constructs were delivered in ES cells for ectopic expression. Lipofection
and electroporation with different experimental settings were used but cell viability
was only observed for up to 5 to 8 days under α-amanitin selection (Fig. 3.2). For
long-term survival of cells under α-amanitin, a resistant RPB1 form must be stably
expressed at levels that are equivalent to normal endogenous expression. Lower

Chapter 3 Results
67
or higher levels of RPB1 might contribute to a global miss-expression of RNA
which can be incompatible with cell viability (X. Darzacq personal communication).
ES cells have very dynamic and tightly regulated gene expression programs and
deregulation of gene expression in ES cells can lead to cell dead or differentiation.
With the aim of obtaining a more stable expression of the α-amanitin resistant
RPB1 I have cloned the Wt (8K) YFP-RPB1 transgene under the expression of F9
promoter into a targeting vector for the genomic locus ROSA26. This strategy was
also not successful although it was not clear if this was due to an inefficient
targeting of the locus or because the expression level of YFP-RPB1 could not fully
replace the endogenous RPB1. It is possible that ES cells are particularly sensitive
to transcription inhibition and therefore are not an optimal cell line to establish α-
amanitin resistant based systems. α-amanitin continuously stalls and degrades
endogenous RPB1, a mechanism that might be toxic for ES cells, particularly if the
ectopic expression systems used do not fully rescue the expression level of the
depleted endogenous RPB1.
3.2.2 – Mutation of CTD-K7 residues is compatible with CTD phosphorylation
Changes of the CTD sequence, which influence the post-translational or
conformation status, can potentially impact on the dynamic modification of the
CTD. CTD proline isomerization state can stimulate the activity of CTD
phosphatases and therefore influence CTD serine phosphorylation levels (Zhang
et al., 2012). It is not known whether non-canonical CTD-K7 residues and
associated PTMs cross-talk with other CTD residues and influence CTD
modifications.
To determine whether CTD-K7 residues are important for CTD phosphorylation,
we performed western blotting using total protein extracts from stable NIH3T3
clones expressing Wt 8K or 0K constructs (Fig. 3.3a) and extracts from
untransfected NIH3T3 fibroblasts as an additional control. First, we confirmed that
total expression levels of YFP-RPB1 fusion proteins, detected using an antibody
against the N-terminus of RPB1, were similar to the levels of endogenous RPB1 in
the parental NIH3T3 cell line. As expected, YFP-RPB1 fusion proteins migrate at a
higher molecular weight than endogenous RPB1, which was confirmed using

Chapter 3 Results
68
antibodies that detect the YFP tag (Fig. 3.3a). For analyses of CTD
phosphorylation levels, we used highly specific antibodies against S5p, S7p and
S2p (Brookes et al., 2012; Stock et al., 2007), detecting hyperphosphorylated (II0)
RPB1 in untransfected NIH3T3, wildtype 8K and 0K mutant cells. Global levels of
serine phosphorylation were not affected in the 0K cell line, which indicates that
mutation of K7-to-S7 residues is compatible with normal global levels of serine
phosphorylation.
Next, to examine the effect of K7-to-S7 mutation on the subcellular localization of
RPB1, we used confocal microscopy and YFP fluorescence to detect YFP-RPB1
fusion proteins and found that the typical RNAPII nucleoplasmic distribution is
unaffected by K7-to-S7 mutations (Fig. 3.3b; e.g. (Xie et al., 2006).
Immunofluorescence using S5p antibodies also shows a similar distribution and
levels of S5p in 8K and 0K cells (Fig. 3.3b). These observations show that
mutation of CTD-K7 residues is compatible with viability of mouse fibroblasts in
culture, and suggest that global serine phosphorylation and RNAPII localization
are independent of the presence or absence of K7 residues and associated
modifications.

Chapter 3 Results
69
Figure 3.3. Mutation of CTD K7 to S7 residues does not interfere with RPB1 stability, phosphorylation or subcellular localization.
a, Expression and phosphorylation levels of RPB1 in cell lines expressing wildtype and mutant YFP-Rpb1 constructs. Levels of total RPB1, YFP, S5p, S7p and S2p were analyzed by western blotting in total cell extracts from NIH3T3 (3T3) and from NIH3T3 cell lines expressing wildtype (8K) and mutant (0K) RPB1. Hypo- (IIa) and hyperphosphorylated (II0) isoforms of YFP-Rpb1 constructs migrate slower than wildtype construct detected in 3T3 due to the YFP tag (Y-IIa and Y-II0, respectively). Total RPB1 was detected with an antibody to the N-terminus of RPB1. α-tubulin was used as loading control. For each blot or antibody, samples were run in the same gel, and lanes re-ordered to improve clarity. b, Whole-cell detection of RPB1 expression in wildtype (8K), mutant (0K) and untransfected NIH3T3 fibroblasts. Expression and distribution of total RPB1 (YFP, green) is similar in 8K and 0K cell lines. Immunofluorescence of S5p (pseudo-colored red) shows a similar pattern and distribution in the three cell lines. Nucleic acids (pseudo-colored blue) were counterstained with TOTO-3. Scale bar, 10 µm.

Chapter 3 Results
70
3.2.3 – Production, screen and purification CTD-K7 methyl antibodies
Post-translational modification of non-consensus CTD repeats remains one of the
least studied aspects of RNAPII regulation. Non-canonical CTD-K7 residues have
the potential to be extensively modified increasing the diversity of CTD post-
translational modifications. Lysine residues can be mono-, di- and trimethylated;
modifications that have been associated with regulation of activity, stability and
recruitment of a diverse range of protein complexes to histone and non-histone
proteins (Hamamoto et al., 2015).
To explore the potential of CTD-K7 residues for methylation, we decided to
develop CTD-K7 methyl antibodies. With the aim of producing antibodies that
could potentially detect methylation in several or all of the K7-containing CTD
repeats, we chose the peptide sequence centered on the K7 residue in repeat 35
of the CTD (Fig. 3.4). This heptad has the most represented K7-repeat sequence
(YSPTSPK), and is the K7 residue with most conserved distance to the C-terminal
end of RPB1 in vertebrates and invertebrates (Fig. 1.3). Peptides modified by
mono-, di- and trimethylation of K7 residues were used for immunization of mice.
In a first screen, supernatants of hybridoma clones were analysed by ELISA for
specificity to CTD-K7 methyl peptides (Fig. 3.4) and tested in western blot with
HeLa cell extracts for detection of RNAPII. Positive clones that recognize RNAPII
and show specificity for CTD-K7 methyl peptides were further analysed on a
second western blot using extracts of NIH3T3, Wt 8K and mutant 0K cell lines.
This second screen allowed the identification of antibody clones recognizing
RNAPII CTD-K7 methylation in vivo. The specificity of those clones for different
methyl states was further analysed in detail in a second ELISA test (Fig. 3.4).

Chapter 3 Results
71
Figure 3.4. Workflow for production and characterization of antibodies specific for CTD-K7 methylation.
Amino acid sequence of CTD-K7-methyl peptides used for immunization was based on the sequence of mouse CTD repeats 35 and 36. After immunization, mouse hybridomas were generated and a first screen was performed characterizing antibody clone specificity for CTD-K7 methylation (ELISA) and reactivity to RPB1 (western blot). A second screen was performed in order to identify antibody clones that specifically recognize K7 or its modifications. Positive clones should bind strongly to the RPB1 wild-type band, the YFP-RPB1 8K slower-migrating band, but not to the mutant YFP-RPB1 0K band (3 clones are shown as an example, clone 13B6 in panel A is a positive clone while clones 5F1C and 8E10C are unspecific). In depth ELISA specificity characterization was performed in order to identify clones specific for CTD-K7 mono-, di- and trimethylation using unmodified (K7), mono- (K7me1), di- (K7me2), trimethylated (K7me3) and acetylated (K7ac) CTD peptides. Specific hybridoma clones were expanded and antibodies were purified from hybridoma supernatant.

Chapter 3 Results
72
Next, selected clones were expanded in culture and hybridoma supernatants
collected for antibody purification (Fig. 3.5). To obtain purified CTD-K7 methyl
antibodies with high yields, we used 900 ml of hybridoma supernatant for protein A
sepharose column purification. After washing and eluting (conditions described in
detail in Fig. 3.5 and Material and Methods) the antibodies were concentrated by
centrifugal filtration.
Figure 3.5. Workflow for purification and concentration of selected CTD-K7 methyl antibodies.
Antibody clones were isotyped prior to purification. Hybridoma supernatants were filtered for removal of cell debris and purified using Protein A Sepharose columns (GE Healthcare). For IgG1 isotype antibodies, NaCl was added to a final concentration of 4M prior to purification. Different washing and elution conditions were used depending on the isotype of the antibody. Concentration of the eluted fractions was done by centrifugal filtration.
3.2.4 – CTD-K7 methylation in mouse cells
We identified and purified several antibody clones specific for CTD-K7 mono- or
dimethylation (Fig. 3.6a). Clone CMA611 is specific for CTD-K7me1 and does not

Chapter 3 Results
73
recognize unmodified CTD-K7, CTD-K7me2, CTD-K7me3 or CTD-K7ac. Clone
CMA612 is specific for CTD-K7me2 and does not bind to the other peptides
tested. Clone 50A10 recognizes unmodified CTD-K7 sequence and its
monomethylated form. Finally, clone 22D12 is specific for both CTD-K7me1 and
K7me2. Although ELISA analyses identified clones that recognize CTD-K7me3, or
both CTD-K7me3 and me1/2 forms, these clones showed reactivity towards other
proteins or similar patterns in cell lines 8K and 0K. We therefore did not perform
further analyses using CTD-K7me3 antibody clones. A representative example of
one CTD-K7me3 clone western blot is shown in Fig. 3.4 (C).
To characterize mono- and dimethylation of the CTD in vivo, we performed
western blotting using total extracts from NIH3T3, 8K and 0K cell lines using our
specific antibodies against CTD-K7me1 and CTD-K7me2 (Fig. 3.6b). K7me1 and
K7me2 are detected in NIH3T3 and in 8K cell lines, both of which express a CTD
with eight K7 residues, but not in the 0K mutant cell line, where all K7 residues are
mutated to S7 (result obtained in two independently generated 8K and 0K cell
lines; Fig. 3.6b). These results confirm the specificity of the K7me1 and K7me2
antibodies to CTD-K7 modifications. The clone 50A10 that recognizes CTD-
K7me1 and unmodified K7 and clone 22D12 which recognizes both CTD-Kme1
and me2 show a pattern similar to K7me1 and K7me2 in western (Fig. 3.6b).

Chapter 3 Results
74
Figure 3.6. RPB1 is mono- and dimethylated at CTD-K7 residues.
a, Specificity of CTD-K7 methyl antibodies was assessed by ELISA using unmodified (K7), mono- (K7me1), di- (K7me2), trimethylated (K7me3) and acetylated (K7ac) CTD peptides (Fig. 3.4). Clones CMA611 and CMA612 are specific for K7me1 and K7me2, respectively, while clone 50A10 recognizes both unmodified CTD-K7 residues and K7me1, and clone 22D12 is specific for both K7me1 and K7me2. b, K7me1 and K7me2 mark hypophosphorylated RPB1 in mouse cells with migration similar to forms detected using 8WG16 antibody. Western blotting was performed using total protein extracts from NIH3T3 (3T3), and from NIH3T3 cells stably expressing Wt 8K (8K) or mutant 0K (0K). K7me1 and K7me2 are detected in 3T3 and 8K, but not in 0K cell lines. This result was validated in 2 independent polyclonal cell lines 8K and 0K (clone 1 and clone 2). CTD methylation migrates at the level of hypophosphorylated RNAPII (IIa and Y-IIa). Low levels of methylation of endogenous RPB1 is also detected in 8K and 0K cell lines, due to expression from endogenous Rpb1 locus. Detection of unmodified K7 and K7me1 by antibody 50A10 and K7me1/2 by 22D12 shows an identical pattern to CMA611 and CMA612 in western blot. α-Tubulin was used as loading control. For 8WG16 blot, samples run in the same gel, and where re-ordered to improve clarity. c, Detection of CTD K7me1 and K7me2 in mouse ES cells at hypophosphorylated RPB1 (IIa) confirms the association of CTD-K7 methylation with the lower migrating RPB1 form in a different cell type.

Chapter 3 Results
75
RPB1 migrates in two major forms, a fast migrating hypophosphorylated (IIa) state
and a slower migrating hyperphosphorylated (II0) state, as well as intermediate
phosphorylated forms. Interestingly, we found that both the K7me1 and K7me2
antibodies detect the hypophosphorylated RPB1 and YFP-RPB1 bands (Fig.
3.6b). These bands are also detected by the antibody 8WG16, which preferentially
recognizes unmodified S2 residues (reviewed in (Brookes and Pombo, 2009). We
further confirmed the preference of K7me1 and K7me2 to hypophosphorylated
RPB1 in mouse ES cells (Fig. 3.6c). Moreover, CTD-K7 methyl antibodies detect a
single band in NIH3T3 and mouse ES cells showing lack of cross-reactivity to
other proteins (Fig. 3.6c). These results demonstrate the existence of in vivo
methylation of non-canonical K7 residues of the CTD in mouse fibroblasts and ES
cells.
3.2.5 – Multiple CTD-K7 residues are methylated
To explore the extent of methylation of the eight mammalian K7 residues, we
performed western blots using the NIH3T3 cell lines engineered to express YFP-
RPB1 fusion proteins bearing different numbers of K7 residues (0, 1, 3 or 8
lysines; Fig. 3.7). Mono- and dimethylation were identified in total cell extracts from
the 1K cell line demonstrating that the single CTD-K7 residue at repeat 35 is
specifically mono- and dimethylated in vivo. In the 3K cell line, we observe an
increase at intensities of mono- and dimethylation, indicating that several lysine
residues are mono- and dimethylated in the same CTD. The level of
monomethylation increases further in the 8K cell line, showing abundant
monomethylation of the CTD in vivo. In contrast, the dimethylation levels remain
similar between the 8K and 3K lines, suggesting that not all eight CTD-K7 residues
are simultaneously dimethylated. This result may also potentially reflect a possible
preference for dimethylation of the K7 residues conserved between mammals and
invertebrates, which are present in the 3K construct. The different levels of mono-
and dimethylation detected in mutant cell lines 0K, 1K, 3K and Wt 8K do not result
from differences in RPB1 expression in those cell lines as similar levels of YFP-
RPB1 were observed using western blots for YFP and 8WG16 (Fig. 3.7).

Chapter 3 Results
76
Figure 3.7. Several CTD-K7 residues are mono- and dimethylated.
a, CTD K7 residues are mono- and dimethylated in 3T3 cells at levels that increase with K7 number. K7me1 and K7me2 were detected by western blotting using whole cell extracts from 3T3 lines expressing 8K, 3K, 1K or 0K Rpb1 constructs; untransfected 3T3 cell extracts were used as an additional control. RPB1 levels were measured by immunoblotting of YFP and using 8WG16 antibody with specificity for unmodified S2. α-Tubulin was used as loading control. Samples run in the same gel, and were re-ordered to improve clarity. b, Schematic representation of the number and position of CTD-K7 residues (red bars) at the YFP-RPB1 expressed in the different cell lines used in the western blot analysis in (a).
3.2.6 – CTD-K7 methylation is conserved in invertebrates
CTD-K7 residues can be found in several taxa (Fig. 1.3) which raises the question
of CTD-K7 methylation being conserved at different eukaryotic lineages including
invertebrates. To test conservation of CTD-K7 methylation in other metazoans, I
analysed CTD-K7 methylation in H. sapiens (which has the same CTD sequence
as mouse), in the arthropod D. melanogaster (three CTD-K7 residues) and
nematode C. elegans (one CTD-K7) from which vertebrates have diverged around
900 million years ago. K7me2 was detected by western blotting in whole protein
extracts from adult C. elegans worm, D. melanogaster embryos, and human
HEK293 cells (Fig. 3.8). These observations reveal, for the first time, conservation

Chapter 3 Results
77
of a non-consensus CTD modification between vertebrates and invertebrates.
K7me1 also occurs in human cells and C. elegans, but is not easily detected in
extracts from D. melanogaster embryos, suggesting that dimethylation may be a
more prevalent methylation mark. Detection of mono- and dimethylation at the
single C. elegans K7 residue, with antibodies produced using peptides based on
the mammalian repeats 34-35, also suggests that the recognition of K7
methylation is in general robust to small differences in the amino acid sequences
that flank the modified K7 residues (compare C. elegans sequence, -S4-S5-P6-K7-
Y1-S2-P3-, with immunizing mammalian peptide sequence, -T4-S5-P6-K7-Y1-T2-P3-;
Fig. 1.3). This conclusion is also supported by the increased detection of K7me1
and K7me2 with increased number of K7 residues in the mammalian CTD (cell
lines 1K, 3K and 8K; Fig. 3.7a), each flanked by slightly different amino acids (Fig.
1.1).
Figure 3.8. CTD-K7 methylation is conserved in invertebrates.
K7me2 and K7me1 are detected in invertebrates. Western blotting of K7me1 and K7me2 was performed using C. elegans whole worm extract (C. ele), D. melanogaster embryo extract (D. mel), total cell extracts from NIH3T3 cells (M. mus) and from human HEK-293T cells (H. sap). α-Tubulin was used as loading control. C. elegans extracts were a kind donation from Stefanie Seelk and Baris Tursun and D. melanogaster embryo extracts were a kind donation from Robert Zinzen, from BIMSB, MDC, Berlin.

Chapter 3 Results
78
3.2.7 – CTD-K7 methylation occurs early during the transcriptional cycle
The observation that mono- and dimethylation of CTD-K7 residues is detected
primarily in the hypophosphorylated (faster-migrating) forms of RPB1 (Fig. 3.6b
and Fig. 3.7) suggests that CTD methylation is associated with early stages of the
transcription cycle. However, it could also result from steric hindrance of K7me1
and K7me2 antibody binding close to CTD phosphorylation in adjacent residues or
to the association of CTD-K7 methylation with a free pool of non-transcribing
RPB1. To test whether CTD phosphorylation interferes with immunodetection of
K7 methylation, we performed western blots from total protein extracts obtained
from mouse ES cells, and pre-treated the blots with alkaline phosphatase to
remove phosphoepitopes prior to immunoblotting (Fig. 3.9a). We find that the
detection of K7 methylation remains specific to the hypophosphorylated RPB1
after treatment of immunoblots with alkaline phosphatase, showing only a minor
increase in the detection of K7me1 and K7me2 at intermediately phosphorylated
forms. The conditions used could fully abrogate detection of phosphorylated
epitopes from hyperphosphorylated RPB1 as observed with S5p totally depleted
after the treatment (Fig. 3.9a). Therefore, immunodetection of K7me1 and K7me2
is only minimally affected by CTD phosphorylation, suggesting that K7me1 and
K7me2 modifications are mostly depleted from elongation-competent
hyperphosphorylated RPB1 complexes. Interestingly, the association of K7me1
and K7me2 with hypophosphorylated form of RPB1 differs from K7ac, previously
shown to occur at both hypo- and hyperphosphorylated RPB1 forms (Schroder et
al., 2013), suggesting that K7 methylation may precede K7 acetylation during the
transcription cycle.
To further investigate whether K7 mono- and dimethylation occur upstream of
elongation, we treated ES cells with flavopiridol, an inhibitor of RNAPII elongation
(Chao and Price, 2001). Flavopiridol inhibits CDK9 kinase which phosphorylates
NELF, Spt5 and CTD on the S2 residues, and as a consequence blocks RNAPII
elongation. Depletion of elongation-competent complexes can be achieved by a
short treatment of ES cells with flavopiridol (10 µM, 1h), as shown by loss of S2p
detection and lower mobility of S5p forms in western blots (Stock et al., 2007); Fig.
3.9b). We find that K7me1 and K7me2 levels are only minimally increased by
flavopiridol treatment (Fig. 3.9b), consistent with both modifications being

Chapter 3 Results
79
associated with pre-elongation stages of transcription and independent of S2
phosphorylation. The minor increase in K7me1 and K7me2 levels agrees with the
slightly increased detection of K7 methylation upon CTD dephosphorylation on
western blots (Fig. 3.9a). As an additional control, we tested whether CTD-K7
methylation is affected or lost when transcription is blocked with α-amanitin which
stalls and induces degradation of transcribing RNAPII. We observed that total
RPB1 and CTD-K7 methylation are progressively lost with α-amanitin treatment
(Fig. 3.9c).
Figure 3.9. Interplay between K7me1 and K7me2 with RPB1 phosphorylation.
a, CTD K7me1 and K7me2 mark hypophosphorylated and intermediately phosphorylated RPB1 forms, but not the hyperphosphorylated (II0) form. Western blotting using total ES cell extracts and the indicated antibodies was performed after treatment of nitrocellulose membranes in the presence (+) or absence (-) of alkaline phosphatase (AP) to remove phospho-epitopes. Migration of hypo- (IIa) and hyperphosphorylated (II0) RPB1 forms are indicated. α-Tubulin was used as loading control. Lanes run on the same gel were re-ordered to improve clarity. b, K7me1 and K7me2 abundance is insensitive to CDK9 inhibition with inhibitor flavopiridol. Mouse ES cells were treated with flavopiridol (10 µM, 1h), before western blotting using antibodies specific for S5p, S2p, K7me1 or K7me2. Hypo- (IIa) and hyperphosphorylated (II0) RPB1 forms are indicated. α-Tubulin was used as loading control. Lanes were re-ordered to improve clarity. c, Time-course of α-amanitin treatment showing sensitivity of CTD-K7 methylation to transcriptional inhibition. Mouse ES cells were treated with α-amanitin (α-ama, 75 µg/ml) for the indicated time. Global levels of Total RNAPII (measured with N-terminal antibody H224) and K7me1 and K7me2 were analysed in total extracts from untreated or α-amanitin treated cells. Hypo- (IIa) and hyperphosphorylated (II0) RPB1 forms are indicated. α-Tubulin was used as loading control.

Chapter 3 Results
80
To help to address whether K7me1 and K7me2 are associated with free,
transcriptionally silent RNAPII complexes we performed immunofluorescence in
mouse NIH3T3 cells (Fig. 3.10). We find K7me1 and K7me2 concentrated in
punctate nucleoplasmic domains, absent from nucleoli and regions of
heterochromatin, and mostly devoid from cytoplasm where abundant RPB1 can be
detected (Xie et al., 2006). The K7me1 and K7me2 foci are sparser than the
discrete nucleoplasmic domains containing total YFP-RPB1 or S5p (see Fig. 3.3b),
consistent with their presence at RNAPII complexes involved in more restricted
transcription events, rather than extensively marking chromatin-free RPB1.
Immunofluorescence with antibody 50A10 that recognizes both K7me1 and
unmodified CTD-K7 presents a signal more homogenously distributed in the
nucleoplasm suggesting that unmodified CTD-K7 repeats represent a detectable
fraction of nuclear RPB1. Together, the results from alkaline phosphatase
treatment, transcription inhibitors and immunofluorescence of K7 methylation
suggest that hypophosphorylated CTD is methylated at early transcription stages
prior to elongation.
Figure 3.10. K7me1 and K7me2 have a discrete nucleoplasmic distribution in mouse fibroblasts.
K7me1 and K7me2 are localized in the nucleoplasm with a punctuate distribution. Top row, Whole-cell immunofluorescence of K7me1, K7me2, K7me1/2 and K7/K7me1 was performed using mouse NIH3T3 fibroblasts. Bottom row, nucleic acids were counterstained with TOTO-3. Scale bars, 10 µm.

Chapter 3 Results
81
3.3 Discussion
In this chapter I firstly describe the generation of α-amanitin resistant Rpb1
constructs, mutant Rpb1 mouse cell lines and CTD-K7 methyl antibodies. All these
tools were used to characterize CTD-K7 mono- and dimethylation as two novel
CTD modifications.
Mouse fibroblasts expressing mutant Rpb1 constructs with K7 residues mutated to
S7, including a mutant cell line with all eight K7 residues replaced, were viable and
could stably grow under α-amanitin selection. Different cell lines and model
systems can tolerate a diverse range of CTD mutations and deletions (Allison et
al., 1988; Chapman et al., 2005; Schroder et al., 2013). Earlier studies used
mostly CTD deletions comprising a variable number of repeats and have shown
that RNAPII requires a CTD with a minimum number of repeats for optimal
function (Allison et al., 1988; Bartolomei et al., 1988; West and Corden, 1995).
Moreover there was evidence that consensus repeats could not be fully
functionally replaced by non-consensus repeats while a CTD composed only of
the consensus sequence had no obvious phenotype. Human cells (Raji cell line)
can grow and transcribe their genome with only consensus CTD repeats as long
as the first 3 repeats and repeat 52 were kept (previously shown to be required for
CTD stability, (Chapman et al., 2005)). A single study described mice bearing a
CTD deletion of 13 repeats, spanning 10 non-consensus repeats and including
one K7 residue, which were viable but presented growth defects and increased
neonatal lethality (Litingtung et al., 1999). Viability of mutant mammalian cell lines
in normal growth conditions and the phenotype observed in mice with the CTD
deletion led to the suggestion that the function of non-consensus repeats might be
gene specific, associated to stress response or development programs of complex
eukaryotes (Yang and Stiller, 2014). In line with this, two recent studies have
described methylation of the Arginine residue at non-consensus repeat 31 which is
associated with expression level of snoRNA and snRNAs (Sims et al., 2011) and
CTD-K7 acetylation which is involved in expression of EGF-inducible genes
(Schroder et al., 2013). The description of CTD-K7 methylation from our work

Chapter 3 Results
82
(Dias et al., 2015) and (Voss et al., 2015) further expands the repertoire of CTD
modifications targeting the non-consensus repeats.
Our western results with CTD-K7 mutant cell lines show that several K7 residues
are mono- and dimethylated including the K7 residue at repeat 35. Mass
spectrometry results from Voss et al., (2015) also show extensive CTD-K7
methylation and acetylation. The observed proportional increase of K7me1 levels
with the number of CTD-K7 residues suggests that this modification is rather
abundant and potentially present in all the eight CTD-K7 residues. K7me2 levels
on the different mutant cell lines suggest that this modification is preferential to
some of the CTD-K7 residues, interestingly the K7 residues more conserved
between vertebrates and invertebrates. Mass spec results mapped K7me1 to 6 out
of 8 CTD-K7 residues while K7me2 to only one being consistent with our
observations. Additionally (Voss et al., 2015) found four CTD-K7 residues
acetylated and a single residue tri-methylated at repeat 40.
We also found CTD-K7 methylation in C. elegans and D. melanogaster, being this
the first evidence for conservation of a non-consensus modification in both
vertebrates and invertebrates. It has been suggested that CTD-K7 residue
expansion, and potentially CTD-K7 acetylation are associated with the origin and
expansion of multicellularity in eukaryotes (Simonti et al., 2015) although K7
acetylation has only been described in mammalian cells so far. The observation of
K7 methylation in C. elegans, which only has a single K7 residue and diverged
900 million years ago from vertebrates, indicates that CTD-K7 methylation was
present along the expansion of CTD-K7 residues in metazoans. Further studies to
investigate the presence of K7 acetylation in C. elegans or other different
eukaryotic lineages will help to understand whether CTD-K7 methylation and
acetylation co-evolved during the expansion of CTD-K7 residues.
The fact that CTD-K7 residues can be both methylated and acetylated, which are
mutually exclusive, raises the question of whether these modifications are present
in different groups of genes or mark distinct stages of transcription. We found that
CTD methylation is associated with hypophosphorylated CTD and inhibition of
RNAPII elongation with CDK9 inhibitor flavopiridol does not reduce CTD
methylation levels which is consistent with CTD-K7 methylation association with

Chapter 3 Results
83
early stages of transcription. CTD-K7 acetylation marks both hypo- and
hyperphosphorylated RPB1 (Schroder et al., 2013) which suggests that this
modification is more downstream in the transcription cycle and is preceded by K7
methylation. The integration of CTD-K7 modifications into the transcription cycle
and their association and interdependencies with other CTD modifications is
extensively described in the next Chapter.

Chapter 4 Results
84
Chapter 4
CTD-K7 methylation is present at active genes but has a
negative contribution to gene expression
4.1 Aims
The main aim of this chapter was to integrate CTD-K7 methylation in the
transcription cycle and to explore its association with gene expression. We started
by mapping the genome-wide occupancy of CTD-K7 mono- and dimethylation
which enabled us to identify the genomic regions and genes enriched for these
two modifications. Using an extensive analysis involving correlations, partial
correlations and regression models, we explored the relationship between K7
methylation with other CTD modifications and gene expression. We then focused
on exploring the association between K7 methylation and K7 acetylation, as we
found these modifications associate differently with gene expression and the
transcription cycle although they are both present at the same genes.
To investigate the potential opposing roles of CTD-K7 modifications on productive
transcription and gene expression, we explored the concept of a K7me2/K7ac ratio
and what differences could be found at genes with different levels of K7me2 and
K7ac. Finally, we performed RNA-seq on K7-to-S7 mutant mouse fibroblasts and
treated ES cells with inhibitors in order to relate changes in gene expression with
K7 methylation and acetylation levels.

Chapter 4 Results
85
4.2 Results
4.2.1 – CTD-K7 mono- and dimethylation are enriched at promoters of active
genes
To further explore the association of CTD-K7 methylation with transcriptionally
engaged RNAPII, I performed Chromatin Immunoprecipitation (ChIP) in mouse ES
cells using our CTD-K7 specific antibodies followed by qPCR with primers
designed for promoter and coding regions of active and non-expressed genes
(Fig. 4.1). Promoter primers were designed within -400 bp of the transcription start
site (TSS) and coding primers are positioned +2 to +4 kb from TSS. ChIP with 4H8
antibody specific for S5p was used as an extra control for comparison since the
distribution of this modification has been extensively analysed in ES cells (Brookes
et al., 2012). We observed enrichment of CTD-K7 methylation at promoters of
active genes Actb and Oct4 and on the coding region of Oct4. S5p is enriched in
both promoter and coding regions and the non-specific antibody anti-digoxigenin
(Dig) presents no enrichment for all the genomic regions tested. CTD-K7
methylation and S5p did not present enrichment above background signal
(measured with Dig antibody) at Myf5 and Gata1 genes, which are not expressed
in ES cells.
Additionally, a more detailed analysis of the distribution of CTD-K7 methylation
along a transcription unit was performed, using several primers designed for the
Polr2a locus, covering 5´ region, promoter, coding sequence on both exons and
introns and 3´ region (Fig. 4.1). This analysis confirms a strong enrichment of
CTD-K7 mono and dimethylation around the promoter region with levels reduced
to almost background downstream of intron 1. The s5p profile along the Polr2a
locus shows a strong enrichment on the 5´ promoter region, which is much less
pronounced downstream on the gene body and again slightly higher on the 3´
region as expected (Brookes et al., 2012).

Chapter 4 Results
86
Figure 4.1. CTD-K7 mono- and dimethylation are enriched at promoters of active genes.
Abundance and distribution of K7me1, K7me2, and S5p was assessed by ChIP followed by qPCR at promoters and coding regions of active (β-Actin, Oct4 and Polr2a) and inactive (Gata1 and Myf5) genes using fixed chromatin from mouse ES cells. Mean and standard deviations are presented from 2-3 independent ChIP experiments, background levels were measured using a non-specific control antibody against digoxigenin (Control). ChIP enrichment levels are expressed relative to input DNA using the same amount of DNA in the qPCR. Polr2a primers were designed and validated by Inȇs de Castro.
Encouraged by the observations of ChIP-qPCR at single genes, we decided to
characterize CTD-K7 mono- and dimethylation distribution and enrichment
genome-wide by performing chromatin immunoprecipitation coupled to next
generation sequencing (ChIP-seq) in mouse ES cells. Previous studies from our
lab (Brookes et al., 2012) have mapped and extensively characterized different
RNAPII modifications in mouse ES cells. CTD-K7 acetylation chromatin
occupancy was mapped in mouse ES cells previously (Schroder et al., 2013),
therefore using this cell system has a great advantage of allowing a direct
comparison between CTD-K7 methylation and acetylation distributions and levels.
We compared chromatin occupancy of K7me1 and K7me2 with RNAPII
phosphorylation (S5p, S7p, S2p and unmodified S2 detected with antibody

Chapter 4 Results
87
8WG16; Brookes et al., 2012) with K7 acetylation (Schroder et al., 2013), and with
gene expression measured with mRNA-seq (Fig. 4.2; (Brookes et al., 2012;
Schroder et al., 2013)). Phosphorylation of S5 and S7 is associated with initiation
and early steps of transcription and these two modifications are primarily enriched
at gene promoters and downstream of polyadenylation sites. S2p, which is
associated with elongation, is detected along gene bodies and is most highly
enriched immediately after polyadenylation sites (Brookes et al., 2012). 8WG16
that recognizes unmodified S2 is mostly enriched at gene promoters where S2p is
not present or less abundant. CTD-K7ac occupies gene promoters and extends
into gene bodies, as previously described (Schroder et al., 2013).
Observation of ChIP-seq profiles at single genes shows that K7me1 and K7me2
are highly enriched at promoters of active genes (Eed, Rpl13, and Tuba1a), and
are detected at lower levels beyond transcription end sites (Fig. 4.2). K7ac is also
found at gene promoters but it expands to the gene body being present
downstream of K7 methylation occupancy. This observation is particularly evident
for Rpl13 where several peaks higher than the promoter peak are observed in the
gene body. The K7 acetylation profile for Eed gene also shows secondary peaks
downstream of the promoter that are not so pronounced for CTD-K7 methylation.
K7 methylation and acetylation, and other RNAPII modifications, are not detected
at inactive genes (e.g. Myf5 gene). In summary, we find that K7me1 and K7me2
are more tightly localized to gene promoters than K7ac, suggesting association
with the earliest stages of transcription. The observation that K7 methylation and
acetylation are enriched at active genes and have different profiles at promoters
encouraged us to explore genome-wide their association with gene expression
and the differences in distribution of these modifications at promoters.

Chapter 4 Results
88
Figure 4.2. ChIP-seq profile of RPB1 CTD modifications at single genes.
K7me1 and K7me2 are enriched at promoters of active genes. ChIP-seq profiles for K7me1, K7me2, K7ac, 8WG16, S5p, S7p and S2p, and mRNA-seq profiles are represented for the inactive gene Myf5, and active genes Eed, Rpll13 and Tuba1a. Images were obtained from UCSC Genome Browser using mean as windowing function.
To address these questions, we assessed the genome-wide promoter distribution
and abundance of each CTD-K7 modification. Genomic regions positive for CTD-
K7 marks, were identified by Elena Torlai Triglia using a peak finder suited for both
sharp and broader occupancy patterns (Bayesian Change-Point, BCP; (Xing et al.,
2012). After identifying the BCP positive regions we applied a 10% cut off and then
used these positive regions to classify gene promoters according to the presence
of each modification (Fig. 4.3a). A total of 6962, 8265 and 8312 gene promoters
were classified as positive for K7me1, K7me2 and K7ac respectively. Analysis of
the common genes shows a great overlap between CTD-K7 modifications where
most genes are positive for all three marks (n=6398; Fig. 4.3b). An even bigger
overlap is observed for K7 methylation where 99.3% of genes monomethylated
are also dimethylated.

Chapter 4 Results
89
Figure 4.3. CTD-K7 mono- and dimethylation are enriched at promoters genome-wide and overlap with K7 acetylation.
a, Distribution of ChIP-seq signal at gene promoters for CTD-K7me1, K7me2 and K7ac. Histograms for the distribution of signal at ±2kb windows centered at all gene promoters (red lines) or at gene promoters classified as positive according to their positive overlap with genomic regions identified by BCP analysis (blue lines). Vertical lines mark the 10% cut off. CTD-K7ac dataset used was published in (Schroder et al., 2013). b, Methylation and acetylation of CTD-K7 residues coincides at most genes. Gene promoters positive for K7me1 (6962), K7me2 (8265) and K7ac (8312) were identified using BCP peak finder (see Materials and Methods). The overlap between the three CTD-K7 modifications is represented using a non-proportional Venn diagram.
We next analysed whether promoters positive for K7 methylation and acetylation
correspond to promoters transcribed and marked by other CTD modifications. We
found that genes positively enriched for CTD-K7 modifications are also marked by
S5p, S7p, S2p and 8WG16 (Fig. 4.4a). The 15% least and most active genes were
used for comparison and we observe that the levels of serine phosphorylation
found at the genes positive for CTD-K7 modifications is similar to the one
observed at the most expressed genes. Since we observed CTD-K7 methylation
at active genes and high levels of CTD serine phosphorylation at genes positive
for CTD-K7 methylation, we decided to analyse gene expression level of genes
marked by K7 methylation. We found that genes positive for CTD-K7 methylation
and acetylation are transcriptionally active at the mRNA level presenting a more
broad distribution than the 15% most active genes (Fig. 4.4b).

Chapter 4 Results
90
Figure 4.4. K7me1 and K7me2 mark promoters of expressed genes.
a, CTD-K7 methylation and acetylation extensively co-occur with other CTD modifications. The percentages of genes positive for S5p, S7p, S2p and unmodified S2 are represented for each group of genes positive for K7me1, K7me2 and K7ac individually or simultaneously. Least and most active genes (bottom and top 15% expressed genes, respectively) are represented for comparison. Numbers of genes are indicated below each group of genes. b, CTD-K7 methylation and acetylation are associated with active genes genome-wide. mRNA levels are similar at genes positive for K7me1, K7me2 and/or K7ac. Least and most active genes are represented for comparison. A pseudocount of 10-4
was added to FPKM (Fragments Per Kilobase of exon per Million mapped reads) prior to logarithmic transformation.
Next, to better visualise and compare the distribution of CTD-K7 methylation with
other CTD modifications at active genes, we plotted average occupancy profiles
around transcription start sites (TSS) and transcript end sites (TES) of the 15%
most and least expressed genes (Fig. 4.5). CTD modifications are mostly enriched
at the TSS, apart from S2p which has its highest peak at the TES. CTD-K7 mono-
and dimethylation are sharply enriched at the TSS and have a single peak while
K7 acetylation has a second peak downstream of TSS of almost equal height (Fig.
4.5b). A second peak downstream of TSS is also observed at S5p and 8WG16 but
its height is markedly lower than the TSS one.
Our observations provide novel insights into the complex post-translational
modification status of RNAPII on active genes. The associations described in
Chapter 3 of K7me1 and K7me2 with hypophosphorylated RPB1 (Fig. 3.8),
insensitivity to elongation inhibition (Fig. 3.10b) and their specific enrichment at the
promoters of active genes (Fig. 4.1, 4.2 and 4.5) suggest that K7 methylation
marks the earliest stages of the transcription cycle at protein coding genes.
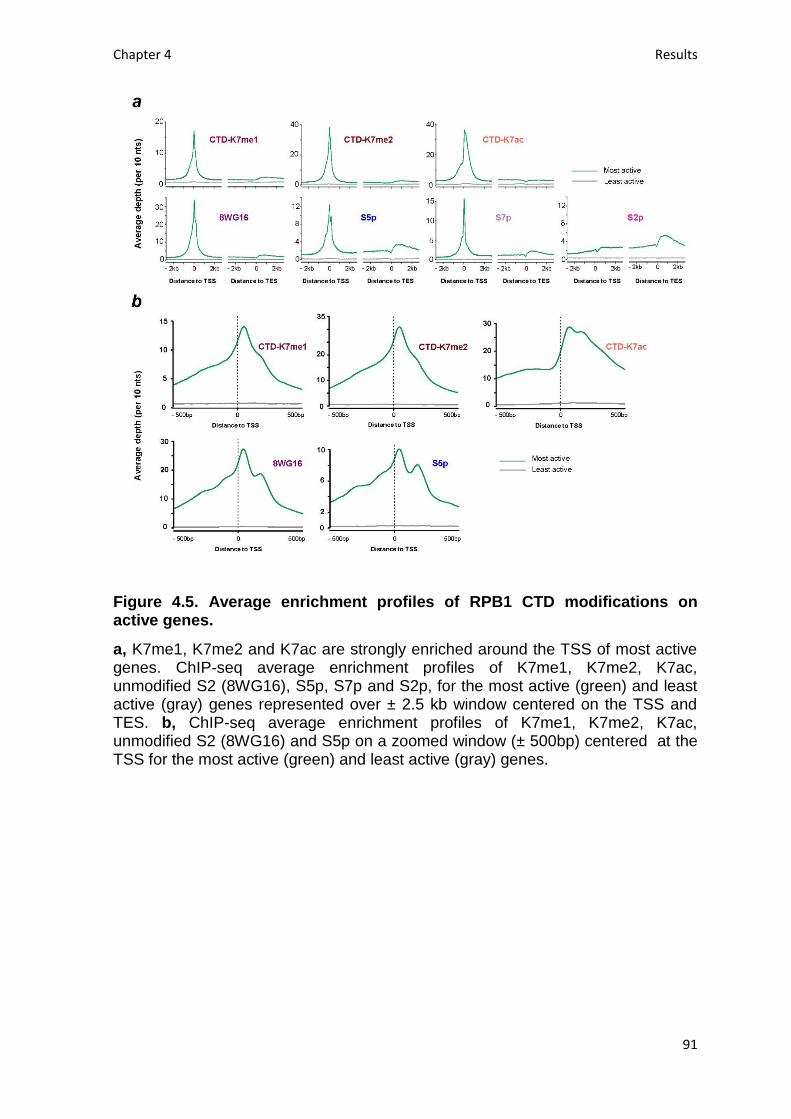
Chapter 4 Results
91
Figure 4.5. Average enrichment profiles of RPB1 CTD modifications on active genes.
a, K7me1, K7me2 and K7ac are strongly enriched around the TSS of most active genes. ChIP-seq average enrichment profiles of K7me1, K7me2, K7ac, unmodified S2 (8WG16), S5p, S7p and S2p, for the most active (green) and least active (gray) genes represented over ± 2.5 kb window centered on the TSS and TES. b, ChIP-seq average enrichment profiles of K7me1, K7me2, K7ac, unmodified S2 (8WG16) and S5p on a zoomed window (± 500bp) centered at the TSS for the most active (green) and least active (gray) genes.

Chapter 4 Results
92
4.2.2 – K7me1 and K7me2 at gene promoters have negative contributions to
productive elongation and mRNA levels
To further investigate the relationship between the levels of K7 methylation and
other RNAPII modifications and explore the temporal sequence of CTD
modifications during the transcription cycle we performed an extensive correlation
analysis. The levels of CTD modifications at promoters (K7me1, K7me2, K7ac,
S5p, S7p and 8WG16) and S2p at the TES were correlated with each other and
with mRNA in order to explore how each CTD mark contributes to gene
expression. We performed correlation analysis on a selected group of active
genes (n=4271) which are (i) positive for S5p, S7p and S2p, (ii) expressed at the
mRNA level (FPKM > 1), and (iii) negative for the repressive histone modifications
H3K27me3 and H2Aub1. We also excluded overlapping genes to avoid
misinterpretations. To better correlate the diversity of marks across TSSs, we
analysed a more restricted group of active genes (n=1564) where the maximum
peak of RNAPII (marked by unphosphorylated RNAPII using 8WG16 antibody)
was within 50 bp of the annotated TSS.
Figure 4.6. Exploring the relationship between different CTD modifications and mRNA using correlation analyses.
Matrix of Spearman’s correlation coefficients between the levels of K7me1, K7me2, K7ac, 8WG16, S5p, S7p, S2p (2kb window after TES), mRNA and mock ChIP control ordered according to increasing correlation with mRNA. This correlation analysis was performed with a group of active genes (n=1564) positive for S5p, S7p and S2p, with expression level of FPKM>1, and negative for H3K27me3
and H2Aub1, also excluding overlapping genes and genes whose maximum RNAPII peak (8WG16) is >50bp away from the annotated TSS.

Chapter 4 Results
93
We find that CTD-K7me1 and CTD-K7me2 are highly correlated (Spearman´s
correlation coefficient 0.93) having the highest correlation amongst all CTD
modifications analysed (Fig. 4.6). Although all CTD modifications have positive
correlations with each other and gene expression, we find that mRNA levels are
mostly correlated with S2p levels at TES (0.62), followed by promoter levels of
K7ac (0.55) and S7p (0.49; Fig. 4.6). In contrast, K7me1 and K7me2 enrichment
levels at promoters have the lowest correlations with S2p or mRNA (0.31-0.45). In
agreement with our previous results and reinforcing the association of K7
methylation with early stages of transcription, we observe a high correlation of
K7me1 and K7me2 with modifications associated with initiation and early
elongation (unphosphorylated S2p, S5p and S7p; 0.72-0.86). We obtained similar
results using a more inclusive correlation analysis performed with the larger cohort
of active genes selected irrespective of 8WG16 peak distance to TSS (n=4271;
Fig. 4.7). In the analysis performed with the larger cohort of genes, we also
included histone modifications and CpG content (Fig. 4.7). As expected, the
repressive chromatin marks H2Aub1 and H3K27me3 have no correlation or a
small negative correlation with CTD modification levels and gene expression (-
0.16 to 0). The chromatin mark H3K4me3 which is associated with transcription
initiation is mostly correlated with CTD promoter marks (0.56-0.69) and less with
S2p and mRNA (0.38). H3K36me3 that is associated with elongation is more
correlated with S2p and mRNA (0.55 and 0.58 respectively). Correlation of CTD-
K7 methylation with these histone modifications reinforces the association of K7
methylation with transcription initiation as K7me1 and K7me2 are clearly more
associated with H3K4me3 (0.57 for K7me1 and 0.58 for K7me2) than with
H3K36me3 (0.31 for K7me1 and 0.34 for K7me2).

Chapter 4 Results
94
Figure 4.7. Exploring the relationship between different CTD modifications and mRNA using correlation analyses – expanded version.
Matrix of Spearman’s correlation coefficients between the levels of several histone and CTD modifications, mRNA, CpG and mock control. The correlations present in Fig. 4.6 were expanded here to a larger group of active genes (n=4271) defined as positive for S5p, S7p, and S2p, negative for repressive histone marks H3K27me3 and H2Aub1 and with FPKM > 1. This larger cohort of genes includes genes with maximum 8WG16 peak deviated from TSS >50bp. The correlation matrix is organized according to increasing correlation with mRNA.
Chapter 4 Results
95
Correlation between closely related variables has the potential caveat of a
correlation value being partially driven by a third variable or group of variables.
One approach to address this limitation is to perform partial correlation analysis in
which one can re-calculate the correlation between two variables while removing
the potential contribution of other variables. In our system where all CTD
modifications correlate with each other to a certain extent, we took advantage of
partial correlation analyses to disentangle the association between K7 methylation
and productive elongation after accounting for the effects of other intervening
RPB1 modifications (Fig. 4.8). We found that the partial correlation between
K7me1 and S2p becomes zero after removing individual contributions of S5p or
K7ac (Fig. 4.8a) and similar results were obtained for partial correlation between
K7me2 and S2p (Fig. 4.8b). Moreover, removing the contribution of S7p alone, or
the combined contributions of S5p, S7p and K7ac, results in small negative
correlations of K7me1 and K7me2 with S2p (Fig. 4.8a and b). K7me1 and K7me2
were the CTD modifications with the lowest correlation values with S2p and mRNA
(Fig. 4.6 and 4.7) and our partial correlation analysis additionally suggests that K7
methylation levels are anti-correlated with S2p. We also tested the individual
contributions of S7p and K7ac to productive elongation by performing the
respective partial correlations with S2p after adjusting for the effects of their
correlation with each other. Both S7p and K7ac maintain positive partial
correlations with S2p levels (0.29 and 0.25 respectively; Fig. 4.8c), suggesting that
both modifications have direct links to the extent of elongation in contrast with K7
methylation. Overall, our correlation analysis suggests that CTD-K7 methylation is
related to RNAPII occupancy at gene promoters, and not directly to elongating
complexes.

Chapter 4 Results
96
Figure 4.8. Partial correlation analysis of K7me1 and K7me2 with S2p.
The partial correlations between K7me1 and K7me2 with S2p is zero or becomes negative after removing the contribution of other intervening modifications. Schematic summarizes the dependencies between K7me1 (a) and K7me2 (b) with other CTD modifications relative to S2p (TES); the respective correlations are represented on top. Partial correlations between K7me1 and S2p (a) and K7me2 and S2p (b) after removing the effect of the other CTD modifications are indicated in red (*** p-value < 1x10⁻⁹; n.s., non-significant). c, Levels of S7p and K7ac independently contribute to S2 phosphorylation. The partial correlations between S7p and S2p when controlling for K7ac (top) and between K7ac and S2p when controlling for S7p (bottom) remain positive (indicated in red; *** p-value < 1x10⁻⁹).
All correlation analysis performed were pairwise correlations and therefore we
could only infer the individual contribution of CTD modifications to predict
productive elongation and gene expression. However, considering the extensive
and sequential nature of CTD post-translational modifications, the most likely
scenario is that several CTD modifications jointly contribute to expression levels.
To further explore whether CTD modifications contribute together to promote
productive transcription, we employed stepwise regression models to determine
the CTD modifications that best predict elongation marked by S2p levels, for a
given number of predictors (Fig. 4.9). Regression models with a single variable
confirm that S7p and K7ac are the best predictors of S2p while K7me2 is only the
fifth best predictor. The best two-variable model consists of S7p and K7ac, while
all the other models have either K7ac or S7p as one of the variables. Interestingly,
the third and fourth models for two variables have K7me1 and K7me2 respectively

Chapter 4 Results
97
and both contribute negatively for S2p levels. Finally, CpG together with S7p is the
fifth best model. We observe that for the models with three variables all include
S7p and K7ac and the two best models additionally include K7me1 and K7me2
with negative contributions. In models with four and five predictors, we observe
similar results where S7p and K7ac are always present and with positive
coefficients while K7me1 and K7me2 are present with a negative contribution for
prediction of S2p levels. Reassuringly, these results confirm the partial correlations
observations as K7 methylation has a negative contribution whenever present with
other variables in the regression models. Curiously whenever present in the
selected models CpG has a negative contribution for S2p levels when combined in
models with other CTD modifications as variables.
Figure 4.9. Linear regression analyses of RPB1 CTD modifications for prediction of S2p levels reveals a negative contribution of K7 methylation.
Exhaustive stepwise regression analysis for prediction of S2p levels at the TES using K7me1, K7me2, 8WG16, S5p, S7p, K7ac and CpG. The five best models using 1 to 5 predictors are shown. Positive and negative coefficients are represented by black and red squares, respectively; the values of adjusted R2 and Akaike information criterion (AIC) are indicated for each model (* p-value ≤ 0.05; ** p-value ≤ 0.01; *** p-value ≤ 0.001; n.s., non-significant).

Chapter 4 Results
98
The performance of regression models can be influenced by collinearity if
variables used are too correlated. To validate our previous results, the
dependencies identified were further tested using LASSO regression (least
absolute shrinkage and selection operator) which is more robust to artefacts due
to collinearity in the predictors and over-fitting. We used LASSO in combination
with a common cross-validation approach (minimum error plus one standard error
criterion) to select the most parsimonious linear model in the LASSO path (Fig.
4.10). We confirmed major positive contributions of S7p and K7ac to the levels of
S2p together with smaller (non-redundant) positive contribution of S5p, and
negative contribution of K7me1. LASSO regression also shows that the levels of
K7me1 and K7me2 are redundant, as K7me2 has a similar negative contribution
to the minimal linear model found by LASSO analysis, when K7me1 is excluded
from the variable set (not shown). Taken together, these results reinforce the
observation that K7me1 and K7me2 are early transcription marks that are present
at actively transcribed genes, but have negative contribution to S2p and mRNA
levels, and raise the possibility that a balance between K7 methylation and K7
acetylation might define the extent of productive elongation at active genes.
Figure 4.10. LASSO regression models to predict S2p levels select K7me1 or K7me2 as negative predictors. a, LASSO regression path using 8WG16, S5p, S7p, K7me1, K7me2, K7ac and CpG as predictors for S2p levels with the optimum penalty marked by the blue line. b, LASSO regression employs the L1 norm to penalize (shrink) regression coefficients towards zero to prevent over-fitting due to co-linearity between predictor variables. We employed tenfold cross-validation to select the most parsimonious model within 1SE of the minimum MSE, represented by the red dashed lines.
Chapter 4 Results
99
4.2.3 – The balance between CTD-K7 methylation and acetylation correlates
with gene expression
The CTD has eight K7 residues that can be methylated or acetylated,
modifications likely to have different effects on the progression of RNAPII into
elongation and gene expression as our previous analysis indicate. Using the ChIP-
seq data for K7 methylation and acetylation we can test whether the balance
between the levels of both modifications might relate to gene expression and how
their distribution around the TSS could reflect an association with different stages
of the transcription cycle. Firstly, to investigate whether the balance between CTD-
K7 methylation and acetylation at gene promoters could be predictive of gene
expression, we calculated the ratio between K7me2 and K7ac and investigated
how it relates to mature and nascent RNA levels. We find that the K7me2/K7ac
ratio negatively correlates with mRNA expression (Spearman’s correlation
coefficient -0.35; Fig. 4.11a). Analyses of nascent transcription using published
GRO-seq (Genome Run-On sequencing) data (Jonkers et al., 2014) yield a similar
negative correlation with coefficient -0.31 (Fig. 4.11b). These correlation results
suggest that gene expression depends or is influenced by the balance between
the levels of K7 methylation and acetylation at gene promoters. Similar results
were obtained with the ratio K7me1/K7ac (the ratios K7me1/K7ac and
K7me2/K7ac are highly correlated - Spearman’s correlation coefficient 0.88; data
not shown) and for simplicity most of the bioinformatics analysis was performed
using only the K7me2/K7ac ratio.

Chapter 4 Results
100
Figure 4.11. CTD-K7 methylation and acetylation have different distributions at the promoters of active genes and K7me2/K7ac ratio is negatively correlated with gene expression.
K7me2/K7ac ratio correlates negatively with mRNA expression (a) and nascent transcription (b). c, Distribution of K7me2/K7ac ratios, and their division into three quantiles: Low (green), Medium (yellow) and High (blue) ratios. d, Heatmaps showing ChIP-seq density for a group of active genes (n=1564 genes, defined as in Fig. 4.6a) using ± 500 bp windows centered on promoters, except for S2p, using window -500 to +1000 bp; z-scores per gene are represented. Genes were ordered according to K7me2/K7ac ratios, from highest to lowest. Gene expression (both nascent and mature RNA; FPKM) is represented for comparison.
Next, to better visualize differences at promoter occupancy and gene expression,
we divided genes according to their K7me2/K7ac ratio in three groups (Low,
Medium and High ratio) and generated ChIP-seq heatmaps centered on gene
promoters (Fig. 4.11c and 4.11d). We observe that unmodified S2, marked by
8WG16, shows a major peak centered on the TSS, as well as a secondary peak
140 bp downstream, and is independent of the K7me2/K7ac ratio (Fig. 4.11d,
small cohort of genes; and Fig. 4.12, big cohort of genes). This second peak
marked by RNAPII downstream of the TSS peak has previously been associated
with promoter-proximal pausing (Quinodoz et al., 2014). K7me1 and K7me2 have
similar profiles enriched at the TSS-centered peak, and although K7 methylation

Chapter 4 Results
101
signal can extend up to +140 bp, it is not markedly enriched at the secondary peak
marked by 8WG16 downstream of the TSS (Fig. 4.11d and 4.12). In contrast,
K7ac expands downstream of the TSS up to +500bp, especially at genes with
lowest K7me2/K7ac ratios, but without specific enrichment at the secondary
8WG16 peak. S5p is present at both TSS and downstream peaks but the signal at
the second peak is not as evident as with 8WG16. S7p is the modification that is
more restricted around the TSS with very strong signal that does not expand much
downstream of the TSS. Finally, we detect a faint signal downstream of the +140
peak for S2p which is expected, since S2p is a broad elongation mark enriched
mostly at the TES and does not peak at the TSS. Noticeable differences of the
levels of K7me1, K7me2 and K7ac can be observed on genes from the high and
low K7me2/K7ac ratios. Confirming the correlation of K7me2/K7ac ratio with gene
expression (Fig. 4.11a and b), we observe that genes with the highest
K7me2/K7ac ratios exhibit the lowest mRNA or nascent transcript expression (Fig.
4.11d and 4.12). K7 acetylation is clearly the promoter mark analysed that
expands more downstream of the TSS into the gene body. Interestingly,
enrichment upstream of the TSS is particularly abundant for unmodified S2, while
K7ac is less enriched than K7me1 or K7me2. An expanded analysis (Fig. 4.12)
was performed with the bigger cohort of active genes (n=4271) and confirmed our
previous results. We additionally plotted heatmaps for mock Ab control, histone
H3K4me3, which is an active histone mark enriched at promoters, and GRO-seq
signal (sense and anti-sense). No striking differences are observed between K7
ratio quantiles for H3K4me3 and GRO-seq. Reassuringly, we did not find any
specific enrichment for mock Ab control.

Chapter 4 Results
102
Figure 4.12. Distribution of different RPB1 modifications around the promoter of active genes.
Heatmaps of ChIP-seq density using a ±500 bp window centered around the TSS of active genes defined as positive for S5p, S7p and S2p, as negative for H3K27me3 and H2Aub1 and with FPKM ˃1 (n = 4271); z-scores per gene are represented. Genes were ordered from highest to lowest K7me2/K7ac ratio, and individual heatmaps are represented for different RPB1 modifications, histone modification H3K4me3 and no antibody control. Gene expression is represented for comparison for both nascent (GRO-seq signal and RPKM values) and mature RNA.
To have a more detailed visualization of CTD modifications at genes with different
K7 ratio values, we selected representative examples of single gene profiles from
the high and low quantiles of K7me2/K7ac ratio (Fig. 4.13). Nupr1 is a
transcriptional regulator associated with the stress response and Caprin2 encodes
a RNA binding protein that negatively regulates proliferation. Both genes are
included in the high K7me2/K7ac ratio quantile and clearly present higher signal
for K7me1 and K7me2 than K7ac. The levels of S7p, S2p and mRNA are low in
both genes. Rpl6, which is a ribosomal protein, and Mcm3 a component of pre-
replication complex were selected as representative examples of low K7 ratio
genes. These two genes, particularly Rpl6, have higher levels of K7ac than K7me1
or K7me2 and higher levels of S2p and S7p when compared with genes from high
K7 ratio. Unlike for S7p and S2p the levels of S5p and unmodified S2 (8WG16)
are similar between the genes from the high and low ratio. Finally, mRNA levels

Chapter 4 Results
103
are much higher for low K7 ratio genes (scale is different for each gene) in
agreement with previous observations (Fig. 4.11 and 4.12).
Figure 4.13. ChIP-seq profile of RPB1 modifications at active genes representative of high and low K7me2/K7ac ratio.
Single gene ChIP-seq profiles for K7me1, K7me2, K7ac, 8WG16, S5p, S7p, S2p and mRNA expression for genes associated with high K7me2/K7ac ratio (Nupr1; ratio 5.7 and Caprin2; ratio 2.8) and low K7me2/K7ac ratio (Rpl6; ratio 0.5 and Mcm3; ratio 0.8). Single gene ChIP-seq images were obtained from UCSC Genome Browser.
The observed differences at genes belonging to different K7me2/K7ac quantiles
encouraged us to quantitatively analyse the CTD modification levels and gene
expression for the three K7 ratio groups (Fig. 4.14). We used unmodified S2
(8WG16) as a proxy for total RNAPII and found that there are no statistically
significant differences on its levels for the three quantiles. As expected, the levels
of K7me2 are higher at the high ratio quantile and progressively decrease in the
medium and low quantiles while the inverse is observed for K7ac (Fig. 4.14a). For
the elongation-associated marks, S7p and S2p, we confirm that genes from the
low K7 ratio have significant higher levels of these marks when compared to
genes from the high or medium quantiles. This observation is particularly evident
for S2p where a clear difference between the three quantiles is observed (Fig.
4.14a). Analysis of mRNA and nascent RNA clearly shows higher levels of
expression at genes from low K7 ratio quantile, while high K7 ratio genes are less
expressed and the medium quantile has an intermediate level (Fig. 4.14b). The
differences observed with nascent RNA using GRO-seq are mostly from the sense

Chapter 4 Results
104
transcription where nascent transcript signal is higher at the low K7 ratio quantile
while for the anti-sense transcription no significant differences are observed (Fig.
4.14b). In summary, we find that despite equivalent amounts of RNAPII present at
the three quantiles, genes that belong to the high K7 ratio have significant less
S7p and S2p and are less expressed at both nascent RNA and mRNA.
Figure 4.14. K7me2/K7ac ratio quantiles are associated with different levels of CTD modifications, mRNA and nascent RNA.
a, Unmodified S2 (8WG16), K7me2, K7ac, S7p and S2p (TES) levels are represented for the three quantiles of K7me2/K7ac ratio. A Wilcoxon rank-sum test was used to calculate significant differences between the K7me2/K7ac quantiles and the respective p-values are represented. b, Gene expression measured at mRNA level and nascent transcription measured with GRO-seq (RPKM, sense and anti-sense) is represented for the three quantiles of K7me2/K7ac ratio. Published GRO-seq data was obtained in mouse ES cells (Jonkers et al. 2014) and re-analysed to determine RPKM and read counts from -500 to +1000bp relative to TSS.
We further confirmed the negative association of K7me2/K7ac ratio with
elongation and gene expression by performing correlations and stepwise
regression (Fig. 4.15). We observed that in general K7me1/K7ac and K7me2/K7ac
ratios have negative correlations with RNAPII modifications, apart from

Chapter 4 Results
105
correlations between K7me2/K7ac ratio with K7me1 and K7me2 which are close
to zero but positive (0.10 and 0.11 respectively, Fig. 4.15a). Stepwise regression
models for prediction of S2p levels with one variable have K7 ratios with a
negative contribution (Fig. 4.15b). The top three predictors for two variable models
all have S7p as one variable and K7me2/K7ac, K7me1/K7ac and K7ac
respectively (Fig. 4.15b). Both K7 ratios have negative contributions and
interestingly, together with S7p predict better S2p levels than the combination of
S7p and K7ac which was the best model in our previous analysis.
Figure 4.15. Correlation analysis and linear regression confirm negative association of K7me2/K7ac ratio with S2p levels and mRNA production.
a, Matrix of Spearman’s correlation coefficients between ratios K7me1/K7ac and K7me2/K7ac and K7me1, K7me2, S5p, S7p, K7ac, S2p (2kb window after TES) and mRNA ordered according to increasing correlation with mRNA. The group of active genes (n=1564) was defined in Fig. 4.6. b, Exhaustive stepwise regression analysis for prediction of S2p levels at the TES using K7me1, K7me2, K7m1/K7ac, K7me2/K7ac, K7ac and S7p. The six best models using 1 and 2 predictors are shown. Positive and negative coefficients are represented by black and red squares, respectively; the values of adjusted R2 and Akaike information criterion (AIC) are indicated for each model (* p-value ≤ 0.05; ** p-value ≤ 0.01; *** p-value ≤ 0.001; n.s., non-significant).

Chapter 4 Results
106
Since genes associated with higher or lower K7me2/K7ac ratios have distinct
RNAPII features and expression levels, we decided to explore potential functional
differences of these genes using Gene Ontology (GO) analysis (Fig. 4.16). We find
that genes with high K7me2/K7ac ratios are associated with GO terms related to
signalling pathways, namely kinase cascades such as positive regulation of
peptidyl-serine phosphorylation, JUN kinase activity, and Rab GTPase activity.
Other interesting GO terms associated with these genes include negative
regulation of translation and negative regulation of growth. In contrast, genes with
low K7me2/K7ac ratios are associated with GO terms such as translation,
structural constituent of ribosome, RNA binding, DNA-dependent transcription,
carbohydrate utilization and regulation of developmental process. These results
suggest that the balance between K7 methylation and acetylation at gene
promoters is important to define the extent of productive transcription at groups of
genes with different biological functions. Genes from high K7 ratios are less
expressed and generally associated with signalling pathways and low K7 ratio
genes have higher levels of expression and are associated with housekeeping
functions in mouse ES cells.
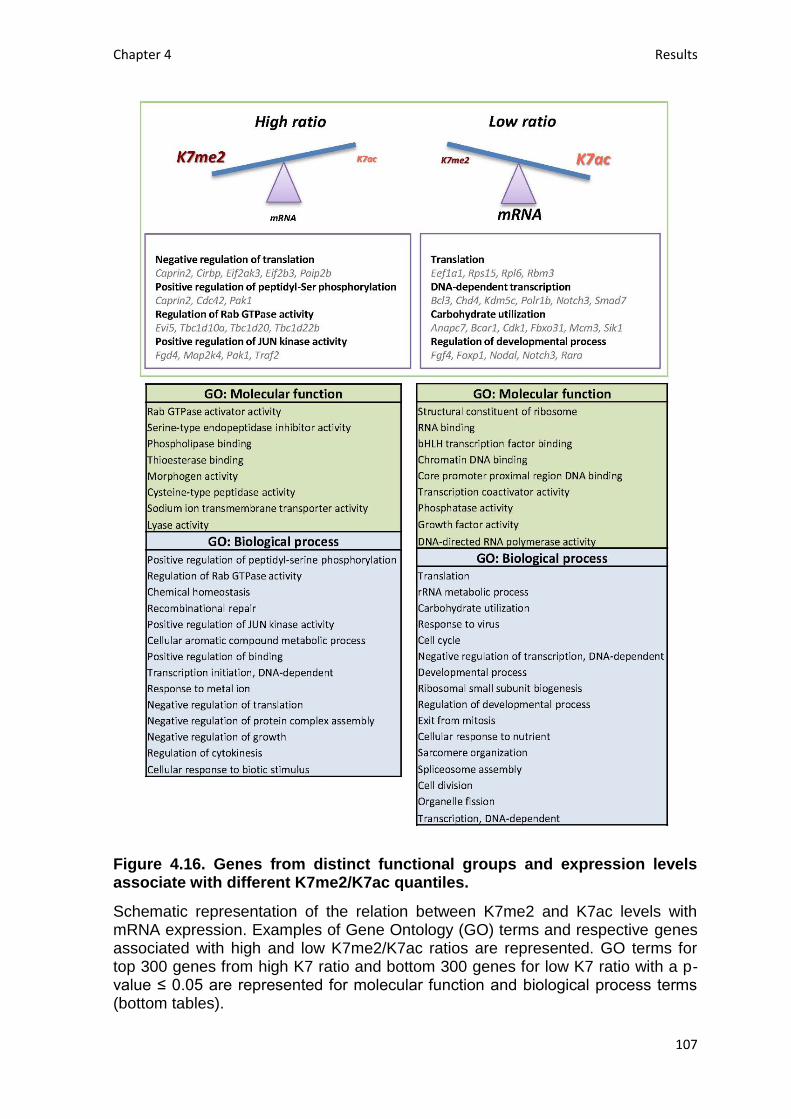
Chapter 4 Results
107
Figure 4.16. Genes from distinct functional groups and expression levels associate with different K7me2/K7ac quantiles.
Schematic representation of the relation between K7me2 and K7ac levels with mRNA expression. Examples of Gene Ontology (GO) terms and respective genes associated with high and low K7me2/K7ac ratios are represented. GO terms for top 300 genes from high K7 ratio and bottom 300 genes for low K7 ratio with a p-value ≤ 0.05 are represented for molecular function and biological process terms (bottom tables).

Chapter 4 Results
108
4.2.4 – Exploring the association between K7me2/K7ac ratio and gene expression in mouse cells
Ideally, to address the role of K7me2/K7ac ratio in gene expression one would
mutate CTD-K7 residues in the same cell system where K7 ratio was measured
and analyse gene expression changes in the mutant cell line. We have computed
K7me2/K7ac ratio using ChIP-seq data from mouse ES cells to take advantage of
a large number of published datasets and generated K7-to-S7 mutant cells in
mouse fibroblasts (NIH3T3). As mentioned in the previous chapter, establishment
of an α-amanitin based system in mouse ES cells was not possible, so we decided
to generate RNA-seq expression data from Wt 8K and 0K mutant NIH3T3 cells.
Since RNAPII occupancy and modification levels are likely to be different between
ES cells and NIH3T3 fibroblasts, we cannot directly assume that the K7 ratio
previously calculated will be the same in two cell lines. To overcome this limitation
we took advantage of our observation in ES cells where we found gene expression
to be inversely correlated with K7me2/K7ac ratio and used expression as proxy for
K7 ratio in mouse fibroblasts.
We selected genes with a minimum expression of 2 FPKM for 8K and 0K cell lines
(n= 9339) and considered genes to be differentially expressed when a minimum of
two fold difference between wild type and mutant was observed (n=216 genes).
Since at this time we only have data from one biological replicate, we applied this
stringent criteria to avoid misinterpreting noise between samples as differential
gene expression. We divided differential expressed genes in three quantiles
according to their expression and found that genes with lower expression levels in
quantile one (a proxy for high K7 ratio), are mostly upregulated in the mutant cell
line. The upregulation observed may reflect a preferential role for K7 methylation
to keep these genes expressed at low levels. Conversely, genes from quantiles
two and three (proxy for medium and low K7 ratio) show the opposite pattern
being mostly downregulated at the mutant cell line (Fig. 4.17a). Downregulation of
these genes supports the idea that K7 acetylation is particularly important for the
expression level of genes with higher expression and consequently lower
K7me2/K7ac ratio.
It is possible that the low levels of expression at quantile one together with our
stringent criteria of considering a minimum of 2 FPKM expression potentially

Chapter 4 Results
109
excludes the downregulated genes. To better address this question we divided the
genes in 10 quantiles of expression and looked at the number genes up and
downregulated in each quantile (Fig. 4.17b and c). The first three quantiles
containing the least expressed genes have a median expression of 3.7, 5.0 and
7.0 respectively, which explains probably why no downregulation is detected on
the first quantile as a two fold downregulation would correspond to a FPKM value
lower than 2 and would be excluded. For quantile two we observe slightly more
genes upregulated than downregulated. For quantile three we have the same
number of genes up and downregulated. Quantiles 4 to 10 have mostly
downregulated genes with the highest number being observed at quantile 10.
Overall, a consistent downregulation across all quantiles is observed suggesting
that K7ac might be required for appropriate expression of dysregulated genes
independently of the K7me2/K7ac ratio. Upregulation is more present for the lower
quantiles which have an expected higher level of K7 methylation suggesting that
K7 methylation is required for keeping the expression level lower at these genes.
To functionally characterize the genes with differential gene expression at the
mutant cell line, we performed GO analysis and found enrichment for GO terms
such as: positive regulation of cell proliferation, response to growth factor,
nucleosome organisation, and related to development of vasculature, skeletal
system and cardiovascular system (Fig. 4.17d). In a recent study, (Simonti et al.,
2015) have also analysed gene expression changes in mouse fibroblasts where
K7 residues were mutated to R7 instead of K7-to-S7 in a similar α-amanitin based
system. It was observed differential expression of 1787 genes using microarrays
with three biological replicates. Genes were enriched for GO terms related to: cell
adhesion, vasculature development, blood vessel development, focal adhesion,
ECM-receptor interaction and blood vessel morphogenesis. Both our results and
(Simonti et al., 2015) show that although not essential for cell viability and global
gene expression, CTD-K7 residues and the associated modifications are important
for tuning the expression levels of specific subsets of genes related with
development, cell adhesion, and cell growth.
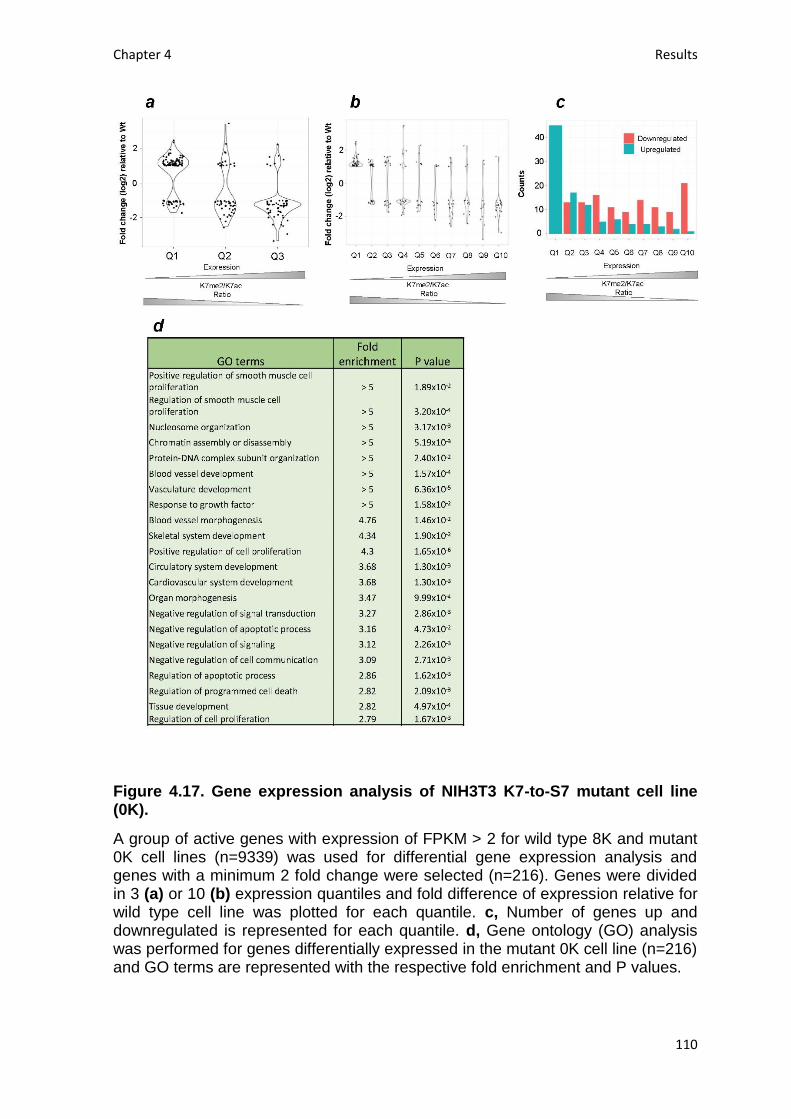
Chapter 4 Results
110
Figure 4.17. Gene expression analysis of NIH3T3 K7-to-S7 mutant cell line (0K).
A group of active genes with expression of FPKM > 2 for wild type 8K and mutant 0K cell lines (n=9339) was used for differential gene expression analysis and genes with a minimum 2 fold change were selected (n=216). Genes were divided in 3 (a) or 10 (b) expression quantiles and fold difference of expression relative for wild type cell line was plotted for each quantile. c, Number of genes up and downregulated is represented for each quantile. d, Gene ontology (GO) analysis was performed for genes differentially expressed in the mutant 0K cell line (n=216) and GO terms are represented with the respective fold enrichment and P values.

Chapter 4 Results
111
Another potential strategy to investigate the association of K7 ratio with gene
expression is to modulate the activity of enzymes responsible for writing
(methylases and acetylases) and removal (demethylases and deacetylases) of K7
post-translational modifications. K7 acetylation has a single known acetylase to
date, P300, and enzymes responsible for the deacetylase, methylase and
demethylase activities remain unknown. It is possible with the current knowledge
of writers and erasers to interfere and modulate the K7 ratio using drugs that could
affect K7 acetylation levels. Previous work has shown a reduction of CTD-K7
acetylation global levels after treatment of HEK 293T cells with P300 inhibitor
C646. Treatment of the same cell line with global histone deacetylase inhibitor
Trichostatin A (TSA) had the opposite effect inducing a global increase in CTD-K7
acetylation (Schroder et al., 2013).
I treated mouse ES cells with TSA and C646 in order to interfere with K7ac levels
and analysed the effect of inhibitors on the global levels of K7 methylation and
gene expression. We detected an increase on the levels of K7me1, K7me2 and
total RNAPII in ES cells treated with TSA, which could result from a global
increase of histone acetylation levels that affects transcription globally (Fig. 4.18a).
Inhibition of P300 with C646, previously shown to deplete K7ac levels (Schroder et
al., 2013) induced an increase in K7me1 and K7me2 (Fig. 4.18b). Quantification of
signal intensity across replicates showed an average 1.7-fold increase in the
global levels of K7me2 (ranging from 1.2 to 2.5-fold across replicates), whereas
the levels of total RPB1 remain constant or are slightly increased (Fig. 4.18b).
Levels of S7p also remain constant after P300 inhibition suggesting that K7ac and
S7p contribute independently to productive elongation. This observation is
consistent with the non-redundant contributions of K7ac and S7p to S2p and
mRNA levels found by partial correlation and stepwise regression analyses (Fig.
4.8 and 4.9). The efficiency of the inhibitors was accessed by the global levels of
H3K9ac which were decreased in cells treated with C646 and immensely
increased in the presence of TSA when compared with normal endogenous levels
(Fig. 4.18c).

Chapter 4 Results
112
Figure 4.18. Analysis of K7me1 and K7me2 global levels after of P300 and histone deacetylase inhibition.
a, Mouse ES cells were treated with histone deacetylase inhibitor TSA (50 nM, 3h), before western blotting with antibodies specific for total RNAPII, K7me1 and K7me2 . Lamin B was used as loading control. b, Mouse ES cells were treated with P300 inhibitor C646 (30 µM, 3h), before western blotting with antibodies specific for total RNAPII, K7me1, K7me2 and S7p. Lamin B was used as loading control. Relative quantification of western blot signal intensity was performed for total RNAPII, K7me2 and S7p for control and C646 treated samples normalized to the corresponding Lamin B signal. The levels of total RNAPII, K7me2 and S7p after P300 inhibition are represented relative to the signal from control (DMSO only) cells (right panel). Bars represent average values with standard deviation from 2 biological replicates and 2 to 4 technical replicates. Hypo- (IIa) and hyperphosphorylated (II0) RPB1 forms are indicated in western panels (a) and (b). c, Analysis of histone H3K9ac levels after treatment of with C646 and TSA as described in (a) and (b). α-Tubulin was used as loading control.
To integrate the global changes observed in K7 methylation after treatment of ES
cells with TSA and C646 with gene expression I analysed expression of genes
representative of the three K7 ratio quantiles. In cells treated with TSA, we
observed an upregulation for genes from the medium and high K7 ratio quantiles,
particularly for Dusp1 and Serpine1 genes and to a less extent for Ctgf and Actb
(Fig. 4.19a and b). Genes from the low K7 ratio quantile are downregulated,
particularly Sox2. Published microarray data from mouse ES cells treated with
TSA (Karantzali et al., 2008) was also analysed (by Elena Torlai Triglia) to further
test if genes with highest K7me2/K7ac ratios are generally more sensitive to up-

Chapter 4 Results
113
regulation upon TSA treatment. We find that TSA has different effects in the three
groups of genes according to their K7me2/K7ac ratio (Fig. 4.19c). The genes with
High K7me2/K7ac ratio are more likely to be upregulated (107/141 genes) upon
TSA treatment, than downregulated (34/141 genes). Genes in the Medium ratio
group are equally likely to be upregulated (51/91 genes) or downregulated (40/91
genes). Finally, genes with the lowest ratio are most often downregulated (142/180
genes) than upregulated (38/180 genes). The effect of TSA on three groups of
genes is significantly different (Fisher’s Exact test; high versus low ratio: p<2.2x10-
16). These changes observed in gene expression show a general trend for
upregulation of genes from high K7me2/K7ac ratio which have more K7
methylation and are less expressed but upon an increase in K7ac get upregulated.
Figure 4.19. Genes with higher K7me2/K7ac ratio are upregulated after TSA treatment.
a, Range of K7me2/K7ac ratios for genes used in expression analysis after TSA treatment. b, Total RNA levels were analysed by quantitative RT-PCR after treatment of ES cells with TSA (50 nM, 3h) or vehicle DMSO (control cells). Expression relative to control cells is represented and genes are ordered according to K7me2/K7ac ratio. Total RNA levels were measured using primers for the 5´ end of each gene and normalized for Actb mRNA levels. Mean and standard deviations from 3 independent TSA treatments are represented. c, Amount of fold change after 6 h treatment with the histone deacetylase inhibitor Trichostatin A (TSA) is represented for the three quantiles of K7me2/K7ac ratio. Fisher’s Exact Test was used to calculate significant differences between the K7me2/K7ac quantiles and the respective p-values are represented. Only genes with a minimum fold change of 2-fold change at 6 h TSA are shown. Dashed line: 2-fold change. Published microarray data (Karantzali et al., 2008) was obtained in mouse ES cells.

Chapter 4 Results
114
We also tested the effect of P300 inhibition on gene expression after treatment of
ES cells with C646. Gene expression analysis by RT-PCR showed an overall
decrease in gene expression upon P300 inhibition irrespectively of the ratio in 4/6
genes tested. Downregulation is particularly evident for Sox2 and Ctgf genes
which have low and high K7 ratio quantiles, respectively. These observations
suggest that irrespective of the K7ac level, its loss mostly results in gene down-
regulation (Fig. 4.20). Interestingly, this observation is consistent with the overall
downregulation of gene expression observed in the NIH3T3 mutant cell line (Fig.
4.17) but one cannot exclude potential confounding effects from P300 inhibition.
Inhibition of P300 can decrease the levels of histone acetylation and influence
transcription, repressing gene expression irrespectively of the K7me/ac ratio.
Figure 4.20. Down-regulation of gene expression after P300 inhibition.
a, Range of K7me2/K7ac ratios for genes used in expression analysis after C646 treatment. b, Total RNA levels were measured by quantitative RT-PCR after treatment of ES cells with C646 (30 µM, 3h) or vehicle DMSO (control cells). Expression relative to control cells is represented and genes are ordered according to K7me2/K7ac ratio. Total RNA levels were measured using primers for the 5´ end of each gene and normalized for Actb mRNA levels. Mean and standard deviations from 3 independent TSA treatments are represented.

Chapter 4 Results
115
4.2.5 – K7me1 and K7me2 marks are specific of RNAPII complexes engaged
in productive transcription events and not found at Polycomb-repressed
genes
Our previous results have underlined a negative role for K7 methylation on the
RNA levels of genes that are actively expressed and matured. In mouse ES cells,
Polycomb-repressed genes are associated with poised RNAPII complexes which
are characterized by an unusual CTD state phosphorylated at S5 by Erk1/2 but not
at S7 phosphorylated by TFIIH or S2 (Brookes et al., 2012; Stock et al., 2007; Tee
et al., 2014). Although the Polycomb-repressed RNAPII complexes are found at
promoters and throughout many coding regions and show detectable levels of
transcriptional activity, they do not yield mature mRNAs (Stock et al., 2007). We
decided to explore the presence of K7 methylation and acetylation at Polycomb
repressed genes in order to investigate if CTD-K7 modifications are in general
associated with RNAPII complexes that initiate in chromatin irrespective of its
potential for mRNA expression. We started by analysing the levels of K7me1 and
K7me2 at promoters of Nkx2.2, Gata4 and HoxA7, previously characterized as
Polycomb-repressed genes (Brookes et al., 2012; Stock et al., 2007). The
enrichment levels for K7me1 and K7me2 at these genes is rather low compared
with the active gene Oct4 and not much higher than the background levels
detected at inactive genes Myf5 and Gata1 (Fig. 4.21). The enrichment level
observed with Dig, an unspecific antibody used as control, is similar to K7me1 and
K7me2 at Polycomb-repressed genes which again indicates that K7 methylation is
not enriched at this particular class of genes (Fig. 4.21). Finally, as previously
described, these Polycomb-repressed genes have an enrichment for S5p at
promoter region equivalent or higher than the one observed at active genes.

Chapter 4 Results
116
Figure 4.21. CTD-K7 mono- and dimethylation are not enriched at Polycomb repressed genes.
Abundance and distribution of S5p, K7me1 and K7me2 was assessed by ChIP followed by qPCR at promoters of active (Oct4), Polycomb repressed (Nkx2.2, Gata4 and HoxA7) and inactive (Myf5 and Gata1) genes using fixed chromatin from mouse ES cells. Background levels were measured using a non-specific control antibody against digoxigenin (Control). Mean and standard deviations are presented from 2-3 independent ChIP experiments (excluding control antibody at HoxA7 promoter – 1 replicate only). ChIP enrichment levels are expressed relative to input DNA using the same amount of DNA in the qPCR.
Next, to explore whether the single gene observations reflect a genome-wide
absence of K7 methylation at Polycomb repressed genes, we selected a group of
Polycomb targets. These genes were defined as associated with S5p, positive at
TSS for H2Aub1 and H3K27me3, and negative for S7p, 8WG16 and S2p (at the
termination site); classification was based on a published gene classification
(Brookes et al., 2012). We find that the group of 1065 Polycomb repressed genes
is mostly devoid of K7me1 or K7me2. The great majority of Polycomb-repressed
TSSs (99 and 98%) do not overlap with BCP-positive regions of K7me1 and
K7me2, respectively, and the remaining 1-2% are associated with low read counts
(Fig. 4.22a and b). CTD-K7 acetylation is also found only at the lowest detectable
levels at 19% of Polycomb-repressed genes. In contrast, active genes positive for
RNAPII marks S5p, S7p, S2p and 8WG16, but negative for Polycomb marks,

Chapter 4 Results
117
H3K27me3 and H2Aub1, are ubiquitously associated with K7 methylation and
acetylation (K7me1, 91%; K7me2, 98%; and K7ac, 95%; 4.22a). To further confirm
the lack of association of CTD-K7 modifications with Polycomb repressed
promoters, we analysed the presence of Polycomb marks and H3K4me3 at genes
positive for the different CTD-K7 modifications (Fig. 4.22c). This analysis confirms
that CTD-K7 methylation and acetylation are strongly associated with H3K4me3
and to a minor extent to H3K27me3 and H2Aub1.
Figure 4.22. RNAPII CTD is mono- and dimethylated exclusively at active genes and not at Polycomb repressed genes.
a, Percentage of genes positive for K7me1, K7me2 and K7ac at Polycomb repressed genes (PRCr), the most active and inactive genes (bottom and top 15% expressed genes, respectively). Active genes are positive for S5p, S7p, S2p and 8WG16, and are negative for H3K27me3 and H2Aub1; PRCr genes are positive for H3K27me3, H2Aub1 and S5p and negative for S2p and 8WG16; inactive genes are negative for H3K27me3, H2Aub1, S5p, S2p and 8WG16. Number of genes for each group is indicated. b, Distribution of ChIP-seq signal at gene promoters for CTD-K7me1, K7me2 and K7ac. Histograms for the distribution of signal at ±1kb windows centered at all gene promoters (red line), or at gene promoters classified as positive according to their overlap with the enriched regions identified by BCP (see Materials and Methods; orange line), or at Polycomb repressed genes (purple line) classified as described in (a). Overlapping genes are excluded to avoid confounding effects. c, Percentage of genes positive for H3K4me3, H3K27me3 and H2Aub1 for different groups of genes classified according to the presence of K7me1, K7me2 and/or K7ac shows a preferential association of CTD-K7 methylation and acetylation with H3K4me3. The number of genes for each group is indicated.

Chapter 4 Results
118
We also inspected single gene profiles of Polycomb-repressed genes that were
classified positive for K7ac to investigate if any particular features could be found
(Fig. 4.22). Phph, HoxA 9-11 and Lhx5 genes lack K7 methylation and K7ac levels
are rather low and not particularly defined around the TSS, which agrees with the
previous observations that the few Polycomb-repressed genes positive for K7ac
are amongst the ones with lower levels. In summary, our observations show that
K7 methylation and acetylation are mostly depleted and unlikely to play any
relevant role at Polycomb-repressed genes. Moreover, this indicates that the
balance between K7 methylation and acetylation is specific for active genes where
it might contribute to fine-tuning of gene expression acting at the transition
between initiation and elongation.
Figure 4.23 - ChIP-seq profile of RPB1 CTD modifications at Polycomb repressed genes.
ChIP-seq profiles for K7me1, K7me2, K7ac, 8WG16, S5p, S7p and S2p, H2Aub1, H3K27me3 and mRNA-seq profiles are represented for the Polycomb repressed genes Prph, Lhx5, HoxA9, HoxA10 and HoxA11. These genes were classified as positive for K7ac and negative for K7me1 and K7me2. Images were obtained from UCSC Genome Browser using mean as windowing function.

Chapter 4 Results
119
4.3 Discussion
In this chapter, I start by describing the distribution and enrichment of CTD-K7
mono- and dimethylation on chromatin of mouse ES cells. K7 mono- and
dimethylation are highly enriched at promoters of active genes presenting a sharp
distribution around the TSS, while K7 acetylation, although also present at
promoters, expands downstream into the gene body. ChIP and ChIP-seq
observations are consistent with our previous western blotting results where we
found K7me1 and K7me2 associated with hypophosphorylated RNAPII and
marking the CTD prior to elongation. K7 acetylation was found associated with
both hypo- and hyperphosphorylated CTD (Schroder et al., 2013) which agrees
with K7 acetylation being at both promoters and gene bodies. Motivated by these
differences in K7 methylation and acetylation, we identified genomic regions
positive for K7me1, K7me2 and K7ac and found a great overlap between the three
modifications at the promoters of active genes. We also found that genes marked
by K7 methylation and acetylation are marked by S5p, S7p and S2p. Together
these observations prompted us to further explore the association of K7
methylation and acetylation at promoters with other CTD modifications,
transcription cycle and gene expression. A previous work has shown a correlation
between the levels of S5p and S2p with mRNA in the human HeLa cell line
(Odawara et al., 2011). Our extensive correlation and linear regression analyses to
understand how different CTD modifications contribute to S2p levels and gene
expression constitutes one of the most extensive analysis performed to date to
relate CTD state and gene expression. We found that S2p and K7ac are the CTD
modifications that most correlate with gene expression and that the levels of S2p
at the TES are mostly correlated with K7ac and S7p promoter levels. Our results
revealed that K7me1 and K7me2 are mostly related with RNAPII promoter
occupancy and the associated modifications (S5p, S7p and unphosphorylated S2)
and uncoupled from S2p and expression levels. Further analysis using partial
correlations and regression models revealed a negative contribution of K7me1 and
K7me2 for S2p levels and expression which is an unexpected feature of K7
methylation. Conversely, K7 acetylation is associated with S2p and gene
expression, which highlights the opposing roles of K7 methylation and acetylation.

Chapter 4 Results
120
The genome-wide presence of K7 methylation and acetylation at the same genes
raises the question of how the levels of these opposing modifications influence
transcription and gene expression. To address this question, we explored the
balance between K7 methylation and acetylation levels by computing the ratio
K7me2/K7ac at active genes. We found a negative correlation between
K7me2/K7ac ratio with gene expression for both nascent transcripts and mRNA
measured by GRO-seq and mRNA-seq. Although the levels of total RNAPII were
identical across genes from different K7me2/K7ac ratio quantiles, we found at
genes with higher K7 ratios (higher level of K7 methylation relative to K7
acetylation) significantly lower levels of S7p, S2p, nascent RNA and mRNA.
Genes with lower K7me2/K7ac ratios (higher relative level of K7 acetylation) had
significantly higher levels of S7p, S2p and were more expressed. We also found
differences in the genomic distribution of K7 acetylation around TSSs depending
on the K7 ratio. Genes from the low K7me2/K7ac quantile (with higher relative
levels of K7ac) had an expansion of K7ac downstream of the TSS into the gene
body. Moreover, K7me2/K7ac ratio was a better predictor of S2p levels than K7ac
alone in the two variable regression models with S7p suggesting that K7
methylation and acetylation are both relevant to gene expression.
To investigate whether genes with different K7me2/K7ac ratios have specific
functional features, we performed gene ontology (GO) analysis. Genes from the
low K7 ratio quantile are mostly associated with housekeeping functions and
regulation of development, consistent with their high expression levels in ES cells
while high K7 ratio quantile genes are involved in signalling. Our concept of
K7m2/K7ac ratio has revealed distinct CTD signatures for different groups of
active genes in ES cells suggesting how K7 modification status can fine-tune the
gene expression levels.
We further tested the association of K7me2/K7ac ratio with gene expression
through experimental approaches where the balance between K7 methylation and
acetylation could be altered and eventual changes in gene expression measured.
We took advantage of our NIH3T3 cell lines stably expressing α-amanitin resistant
YFP-RPB1 variants with either the wild type sequence or all K7 residues mutated
to the consensus S7 (0K cell line). In the 0K cell line, a phenotype should result
from the combined effect of losing both K7 methylation, K7 acetylation and other

Chapter 4 Results
121
potential modifications targeting these residues. After performing RNA-seq on both
cell lines, we used expression as a proxy for K7me2/K7ac ratio as there is no
ChIP-seq data for NIH3T3 cell lines and found 216 genes to be differentially
expressed at least two fold. Differentially expressed genes were divided in
quantiles and we observed a consistent downregulation across all quantiles while
upregulation was mostly observed at the least expressed genes. Although the
interpretation of these results is complex, the consistent downregulation across all
quantiles may result from the loss of K7 acetylation that is required for the
appropriate level of expression. Upregulation observed at the least expressed
genes where K7 methylation must be prevalent might indicate that at these genes
K7 methylation is important to keep expression low.
It is possible that more genes have their expression affected as a result of K7-to-
S7 mutation but this is not detected with our stringent criteria of a minimum 2 fold
change. In another contemporary study (Simonti et al., 2015), NIH3T3 cell lines
with K7 residues mutated to R7 were used to analyse gene expression changes
associated with these CTD residues. Expression microarrays were performed in
three biological replicates and 1787 genes were found to be differentially
expressed between wild type and mutant cell lines with a false discovery rate
<0.05. In both our and (Simonti et al., 2015) studies, only a subset of genes has its
expression affected in the mutant cell line which indicates that in mouse fibroblasts
mutation of K7 residues and loss of associated modifications does not have a
global effect in gene expression. Ontology analysis of the differentially expressed
genes in the K7 mutant cell lines revealed an enrichment for functions related to
cell adhesion, development of vasculature, response to growth factor, tissue
development and organ morphogenesis amongst others. This suggests a
connexion between K7 residues and associated modifications with expression of a
group of genes central for multicellular eukaryotic features and development.
To gain further knowledge of how changes in the balance between K7 methylation
and acetylation influence gene expression, we treated mouse ES cell with
inhibitors of P300 and histone deacetylases. Inhibition of P300 with C646,
previously shown to decrease K7ac global levels in HEK 293T cells, had the
converse effect on K7me2 levels in mouse ES cells. Gene expression analysis in
the same ES cells treated with C646 revealed downregulation of 4 out 6 genes

Chapter 4 Results
122
irrespective of the K7me2/K7ac ratio. These observations indicate that a shift in
the K7 ratio towards higher levels of K7me2 and lower levels of K7ac leads to a
decrease in gene expression. The fact that upon inhibition of K7ac we observe
higher levels of K7me2 also reinforces the idea of these two opposing
modifications competing for the available K7 residues.
We also found that S7p levels do not change in ES cells treated with P300
inhibitor C646, a result that agrees and with our bioinformatic analysis which
identified independent contributions of K7ac and S7p to S2p levels.
To unbalance the K7me2/K7ac ratio towards K7ac, we treated ES cells with
histone deacetylase (HDAC) inhibitor TSA, previously shown to increase the
global levels of K7ac in HEK 293T cells (Schroder et al., 2013). We observed an
increase in K7 methylation in TSA treated ES cells but this was concomitant with
an increase in total RNAPII making these observations hard to interpret. At the
gene expression level, we observed upregulation of genes from the medium and
high K7 ratio quantiles and downregulation of genes from low K7 ratio quantile.
Bioinformatic analysis of a published dataset of ES cells treated with TSA
(Karantzali et al., 2008) confirmed our initial observation of upregulation of genes
from high K7 ratio in a larger cohort of genes. Upregulation of genes that are
mostly enriched in K7 methylation after treatment that leads to an increase in K7
acetylation is consistent with our concept of K7me2/K7ac ratio modulating gene
expression. Nevertheless, considering the increase in global levels of RNAPII and
the effect of TSA on the acetylation of histones, extra experiments should be
performed to evaluate the effect of such changes on gene expression. One
potential approach to better relate the balance between K7 methylation and
acetylation with changes in gene expression would be to perform ChIP for K7me2
and K7ac on genes with different K7 ratio values that are up- or downregulated
after treatment with C646 or TSA. One limitation to measure the K7me2/K7ac ratio
in other cell lines or after drug treatments is the unavailability of the K7ac antibody.
Other limitations that have influenced our efforts to test the association of K7 ratio
with gene expression were the unknown nature of K7 methylases, demethylases,
and deacetylases and technical problems in establishing α-amanitin-resistant
RPB1 cell lines in mouse ES cells. Our gene expression results with NIH3T3
mutant cell lines and inhibitors in ES cells suggest that K7 modification status is

Chapter 4 Results
123
part of a complex network of CTD modifications that contributes to optimal gene
expression levels.
Finally, considering the negative contribution of K7 methylation to expression
levels at active genes, we investigated whether K7 modification status was also
involved in regulation of expression at Polycomb repressed genes. This subclass
of genes is particularly interesting as RNAPII complexes present a unique CTD
status where S5p levels can be found as high as in active genes but S7p and S2p
are absent and gene expression is repressed. We found that K7 methylation and
acetylation are absent at most Polycomb repressed genes, which indicates a
specific role for these modifications in modulating expression levels of productive
RNAPII complexes at active genes.

Chapter 5 Results
124
Chapter 5
Exploring CTD-K7 interactome
5.1 Aims
In this chapter, I describe the experimental approaches used to search for CTD-K7
modifiers and interacting factors of CTD-K7 associated modifications. In one
approach, pulldowns of YFP-RPB1 were performed followed by mass
spectrometric analysis using extracts from cells expressing Wt CTD (8K) and
mutant CTD (0K) with all K7 residues mutated to S7. With this approach, we
aimed to identify proteins that specifically bind to K7 residues or associated K7
modifications such as K7me1, K7me2 and K7ac.
A second approach consisted of CTD peptide pulldowns followed by mass
spectrometry analysis of interacting proteins. Using unmodified K7 and K7me2
peptides, we aimed to identify potential methyltransferases and readers of K7
methylation.

Chapter 5 Results
125
5.2 Results
Transcription and co-transcriptional processes are to a great extent regulated by
the recruitment of factors to the transcribing machinery at different stages of the
transcription cycle. RPB1 CTD acts as a recruitment platform for most of these
regulatory factors and the interactions are determined by the PTMs placed along
the CTD repeats. The presence of eight K7 residues at the mammalian CTD which
are methylated, acetylated and ubiquitinated can mediate the recruitment of novel
factors increasing the diversity of CTD interactors. In order to search for
interactors recruited by CTD-K7 residues and associated modifications, we used
two distinct approaches based on pulldowns using the full length RPB1 or short
CTD peptides followed by mass spectrometry analysis.
We took advantage of the mouse NIH3T3 YFP-RPB1 cell lines expressing either a
wt CTD (8K) or mutant variant K7-to-S7 (0K), characterized in Chapter 3, to
perform pulldowns using an antibody specific for the N-terminal YFP tag in total
cell extracts. Three biological replicates were analysed and a total of 290 and 274
proteins were identified as interactors of the wt (8K) and mutant (0K) YFP-RPB1
subunits, respectively (Fig. 5.1a). A big overlap was observed between the
elements of 8K and 0K datasets (n= 232) indicating that, for most proteins
identified, the interaction with RPB1 does not depend on K7 residues or K7
associated PTMs. Reassuringly, we found similar levels of detection for YFP-
RPB1 in both 8K and 0K datasets and additionally, several other RNAPII subunits
were identified including RPB2, RPB3, RPB7 and RPB8. Considering the complex
network of CTD interactors and given the number of proteins identified, we
analysed each biological replicate individually in order to identify proteins
consistently present in the 8K and 0K datasets (Fig. 5.1b). One of the biological
replicates (replicate 1) shared fewer elements with the other two (replicates 2 and
3), for both 8K and 0K datasets which indicates that we might be only capturing a
fraction of the global network of CTD interactors. To have a more reliable analysis
and interpretation of the differences between 8K and 0K datasets, we mostly
focused on proteins detected in at least two of the biological replicates (Fig. 5.1c).
Amongst this group of proteins, we find a large overlap between 8K and 0K
datasets with 141 common interactors in a universe of 178 and 176 elements
present in the 8K and 0K datasets respectively (Fig. 5.1c).

Chapter 5 Results
126
Figure 5.1. Screen for differential CTD interactors using YFP-RPB1 pulldowns.
a, Schematic representation of the strategy used for identification of RPB1 interactors using YFP-RPB1 pulldowns. Total cell extracts were obtained from NIH3T3 cells expressing wild type YFP-RPB1 (8K) and mutant YFP-RPB1 (0K) and pulldowns were performed using an antibody specific for the YFP-tag. Proteins associated with 8K and 0K YFP-RPB1 from 3 biological replicates were analysed by mass spectrometry. The overlap between the proteins identified in the pulldowns for 8K and 0K YFP-RPB1 is represented in a Venn diagram with the numbers of proteins indicated for the common, unique and total elements. b, Summary of the 3 biological replicates and proteins identified is represented on the left table. Biological replicate 1 was analysed in one mass spectrometry run while replicates 2 and 3 were analysed in a second mass spectrometry run. Biological replicates 1 and 2 were obtained from 8K and 0K cell line clone 1 and replicate 3 from 8K and 0K clone 2. The overlap between replicates is represented in a Venn diagram for 8K and 0K datasets. c, Representation of the overlap between 8K and 0K proteins present in at least 2 biological replicates.

Chapter 5 Results
127
To explore the functionality of the CTD interactors found with our experimental
approach, we performed GO analysis for the 8K and 0K datasets. GO terms
related to transcription and RNA processing were found for both wild type and
mutant datasets including RNAPII activity, TBP-class protein binding, mRNA
binding, RNA splicing and RNA processing, amongst others (Table 5.1a). The GO
terms obtained are similar between the two datasets and indicate that we
immunoprecipitated complexes engaged at different stages of transcription.
Through inspection of the common elements between both datasets, we find
several RNA helicases (DDX21, DDX15, DDX17, DDX5, DDX3X) important at
different stages of transcription such as transcriptional activation and repression,
splicing and elongation. Other transcription and RNA processing factors identified
include the histone chaperone and transcription elongation factor SUPT6H, the
splicing factors U2AF1, U2AF2, PRPF8 (pre-mRNA processing factor 8), SCAF1
(SR-related CTD associated factor 1) and the Integrator complex subunits Int1 and
Int5.
Given the unknown nature of methyltransferase(s) (HMTs) and demethylases that
modify CTD-K7 residues there was a great interest in identification of potential
candidates in our YFP-RPB1 pulldowns. We found the H3K36 histone
methyltransferase SETD2 in both 8K and 0K datasets and no demethylases were
identified. SETD2 is an unlikely candidate for methylation of CTD-K7 residues as it
is known to be recruited to the CTD of elongating RNAPII by the double
phosphorylation of S2 and S5 residues (Kizer et al., 2005) while our data shows
that K7 methylation takes place prior to S2 phosphorylation.

Chapter 5 Results
128
Table 5.1. Gene Ontology analysis of 8K and 0K YFP-RPB1 interactors.
Gene ontology (GO) analysis for the interactors of 8K and 0K YFP-RPB1 was performed for the full list of interactors present on at least 2 biological replicates. Enriched GO terms for molecular function and biological process are represented with respective fold enrichment and P-values.
Other group of proteins particularly interesting are the elements identified uniquely
on the 8K dataset as their interaction with the CTD may depend on CTD-K7
residues or associated modifications. Only a reduced number of proteins unique
for each dataset was identified: 37 for 8K and 35 for 0K. GO analysis of this group
of proteins (Table 5.2) did not provide any relevant functional insight as the GO
terms were similar between wt and mutant datasets and related mostly to splicing
and RNA processing, terms which are also enriched in the common elements
between the two datasets. Nevertheless, an individual inspection of the elements
unique for 8K revealed some interesting CTD interactors.

Chapter 5 Results
129
Table 5.2. Gene Ontology analysis of 8K and 0K YFP-RPB1 unique interactors.
Gene ontology (GO) analysis was performed for the interactors uniquely found on the 8K and 0K YFP-RPB1 datasets on at least 2 biological replicates. Enriched GO terms for molecular function and biological process are represented with respective fold enrichment and P-values.
Matrin 3 (MATR3) was one of the proteins found in two biological replicates of 8K
and absent in the mutant dataset. MATR3 is a nuclear matrix protein present in the
nucleoplasma and contains DNA and RNA binding motifs being involved in RNA
processing and stabilization (Salton et al., 2010). Interestingly, MATR3 was co-
purified as an element of the ALR (MLL2) complex (Issaeva et al., 2007) and NIF-
1 (NRC interacting factor 1) complex (Garapaty et al., 2009) both of them
associated with complexes that have histone lysine methylase activity. Since
HMTs are part of larger multiprotein complexes, it is possible that we did not
capture with our pulldown strategy the whole complex but only some components.
Therefore, the potential of MLL2 and NIF-1 associated complexes to methylate
CTD-K7 residues would be interesting to explore in further experiments.
The PHRF1 (PHD and Ring finger domains 1) protein was found in only one
biological replicate of Wt pulldowns and has a PhD, RING finger and SRI (Set2
Rpb1 interacting domain) domains (Rebehmed et al., 2014). PHRF1 is a
particularly interesting interactor as it was previously described to act as ubiquitin

Chapter 5 Results
130
ligase for TGIF and PARP1 and found to interact with H3K36me2 and H3K36me3
(Ettahar et al., 2013) and (Chang et al., 2015). Although the SRI domain could
mediate the interaction with CTD, the PHD domain has the potential to bind the
methylated K7 residues and PHRF1 ubiquitin ligase activity makes this protein a
potential CTD-K7 modifier.
Finally, GDOWN1 / Polr2m protein is another interesting element worth mentioning
that was found only in the 8K dataset (in 2 biological replicates) as it is considered
the “13th subunit” of RNAPII and stabilizes promoter proximal pausing. GDOWN1
is enriched at promoter regions and over gene bodies and in vitro studies have
shown GDOWN1 association with the transcription complex immediately after
initiation. Incorporation of GDOWN1 blocks elongation stimulation mediated by
TFIIF stabilizing RNAPII pausing (Cheng et al., 2012; Mullen Davis et al., 2014).
The role of GDOWN1 in vivo is yet to be fully understood as knockdown of
GDOWN1 in HeLA cells did not affect the global transcription levels measured by
Br-UTP incorporation (Moller et al., 2012).
The transition from initiation to elongation potentially coincides with a transition
from K7 methylation to K7 acetylation and, if the presence of K7 residues is
required for GDOWN1 recruitment, this could stablish a link between K7
modification status and regulation of RNAPII pausing / elongation. Although highly
speculative, a possible association between GDOWN1, promoter proximal pausing
and K7 methylation/acetylation could be an interesting hypothesis to test.
A more directed approach was used to identify proteins that could modify CTD-K7
residues or recognize K7me2 using CTD peptide pulldowns followed by mass
spectrometry analysis. We used synthetic CTD peptides differing at position seven
of the heptapeptide with S7, K7 or K7me2 residues (experiments carried out by
Alexander Kukalev, Pombo lab). To screen for potential modifiers / readers of K7
residues, we first incubated whole cell extracts with S7 peptides in order to deplete
the extract from background interactors that mostly recognize the consensus
heptapeptide sequence and then incubated the flow-through with K7 peptides (Fig.
5.2a). To screen for K7me2 readers, we did a first round of incubation with K7
peptides, followed by an incubation with K7me2 peptides (Fig. 5.2b). The

Chapter 5 Results
131
interactors of the S7, K7 and K7me2 peptides from two biological replicates and
mock IP controls were analysed by mass spec.
Figure 5.2. Experimental setup for CTD peptide pulldowns.
Schematic representation of strategy used for identification of CTD interactors of S7, K7 and K7me2 peptides. a, Total cell extracts from mouse ES cells were initially incubated with S7 peptides (pre-incubation) and the flow-through was incubated with K7 peptides. Proteins bound to S7 and K7 peptides were analysed by mass spectrometry analysis. b, A similar strategy was used but the initial incubation was performed with K7 peptides and the flow-through incubated with K7me2 peptides. Proteins bound to K7 and K7me2 peptides were analysed by mass spectrometry analysis. All peptides were biotinylated and coupled to Streptavidin sepharose beads.
Due to the identification of a small number of interactors, the data represented and
discussed in this section is based on the pool of total proteins identified in both
replicates of each peptide (Fig. 5.3). A total of 42, 60 and 3 interactors were
identified for S7, K7 and K7me2 datasets respectively after exclusion of
background elements identified on the mock IPs (Fig. 5.3a). The three proteins
identified on the K7me2 pulldowns were RPB1 itself, RPL6, a component of 60S
ribosomal subunit, and PTMA (prothymosin α). RPL6 and PTMA are unlikely to be
specific interactors of K7me2 since they were equally detected in the K7
pulldowns.

Chapter 5 Results
132
A comparison between S7 and K7 peptide datasets revealed a small overlap with
only 9 common proteins (Fig. 5.3a). Despite the low number of elements, we
performed GO analysis for S7 and K7 datasets to explore functional features. S7
peptide interactor list (n = 42) generated very few significant GO terms including
general structural molecule activity, RNA binding and threonine-type peptidase
activity, which included several proteosomal subunits (Fig. 5.3b). Unique elements
for S7 peptide list (n = 33) did not generate any significant GO terms.
K7 peptide interactors (n = 60) were enriched for GO terms including mRNA
binding, structural constituent of ribosome, poly(A) RNA binding, regulation of
mRNA splicing, mRNA transport, RNA processing, rRNA processing and gene
expression, amongst others (Fig. 5.4b). The group of interactors unique for K7
peptides (n = 51) generated similar GO terms to the ones obtained using the full
list of K7 elements.
The list of K7 peptide interactors includes the transcription and pluripotency factor
SOX2, transcription co-activators PSIP1, SNW1, ENY2, ALYREF and several
splicing factors and components of the spliceosome such as CWC15, SRP7,
SRSF1 and SRSF2. The co-activator SNW1, also involved in splicing, is a
particularly interesting protein as it was previously described to interact with
HDAC2, a histone deacetylase, and therefore has the potential of being a
component of a complex that could deacetylate CTD-K7ac residues (Zhou et al.,
2000). ENY2 (enhancer of yellow 2 homolog) is a transcriptional activator that
associates with SAGA complex, an important regulator of transcription with HAT
(histone acetyltransferase) and deubiquitinase activities (Lang et al., 2011) and a
more recent study has identified ENY2 in other deubiquitinase complexes
(Atanassov et al., 2016). ENY2 has therefore the potential to be part of HAT and
deubiquitination complexes that could acetylate and deubiquitinate CTD-K7
residues.
Another K7 interactor identified in our pull-downs is the protein MYBBP1A (Myb-
binding protein 1 A) a tumour suppressor essential for mouse development and
important for cell cycle regulation (Mori et al., 2012). To further validate this
interaction, we directly incubated cell extracts with mock, S7, K7 and K7me2
peptides and probed for MYBBP1A detection by western blotting (Fig. 5.3c). We

Chapter 5 Results
133
confirmed the interaction of MYBBP1A with unmodified K7 peptides and found no
interaction with S7 or K7me2 peptides confirming the specificity of MYBBP1A to
unmodified K7 heptapeptides. Interestingly, MYBBP1A was found in both 8K and
0K datasets indicating that the interaction with RPB1 can be also mediated by
other residues within the CTD or outside of this domain.
Figure 5.3. Analysis of CTD peptide pulldowns.
a, The number of total proteins identified in the S7, K7 and K7me2 peptide pulldowns is shown and the overlap between S7 and K7 interactors is represented on a Venn diagram. b, Gene ontology (GO) analysis for the interactors of S7 and K7 was performed and the significant terms for molecular function and biological process are represented with the respective fold enrichment and P-values. c, MYBBP1A specifically interacts with CTD K7 peptides. Pulldowns were performed using S7, K7 and K7me2 peptides followed by western blot against MYBBP1A that is detected only in the input and K7 peptide samples and is absent in mock, S7 and K7me2.

Chapter 5 Results
134
Our lab has previously identified MYBBP1A in a mass spec characterization of
mitotic RNAPII interactors and depletion of MYBBP1A with siRNA in HeLA cells
significantly increased the incorporation of Br-UTP suggesting a negative role in
transcription (Moller et al., 2012). MYBBP1A also binds to non-acetylated P53
facilitating the interaction between P53 and HAT P300 enhancing P53 acetylation
(Kumazawa et al., 2015; Ono et al., 2014). A different study has described the
involvement of MYBBP1A in inhibition of H3K18 deacetylation through interaction
and regulation of Sirt7 deacetylase activity (Karim et al., 2013).
MYBBP1A is therefore an interesting candidate to pursue further studies given its
association with P300, the roles in acetylation of histone and non-histone proteins
and negative effect on transcription levels.

Chapter 5 Results
135
5.3 Discussion
The experimental efforts developed to identify CTD-K7 interacting factors
described on this chapter were based on biochemical immunoprecipitation assays
using very distinct probes. We performed pulldowns using either a full length
tagged YFP-RPB1 expressed in vivo in mouse fibroblasts or CTD peptides
composed of three heptapeptides which were incubated with ES cell extracts. Both
strategies have advantages and pitfalls. A system based on a full length YFP-
RPB1 allows the immunoprecipitation of functional RPB1 molecules bearing a
diverse range of CTD modifications and associated with various stages of
transcription cycle. Through comparison of the interactors associated with wt CTD
and 0K mutant, we could identify a list of proteins that recognize unmodified K7
residues or K7 PTMs but without knowing exactly what is the specific PTM status
mediating the latter interactions. In contrast, peptide pulldowns can capture
interactors of a specific PTM but might miss interactions that require a specific
combination of several PTMs on the same or neighbouring heptapeptides. In fact,
we identified the highest number of interactors with the YFP-RPB1 pulldown
strategy but most of those proteins were common to Wt and mutant YFP-RPB1.
Detection of a great range of interactors due to many different PTMs co-occuring
on RNAPII complexes potentially dilutes K7 interactors making their identification
more difficult. Furthermore, the observation of a lower number of common
elements in one of the biological replicates suggests that we are only detecting a
fraction of the full network of interactors with our experimental conditions.
A much lower number of proteins was identified in the CTD peptide pulldowns and
no specific K7me2 interactors were found. As one concern was the association
and identification of non-specific K7/K7me2 interactors, that could recognize and
bind to other CTD residues, we designed the K7 and K7me2 pulldowns to include
pre-incubations with unmodified heptapeptides containing S7 or K7 peptides.
Unfortunately, this strategy probably contributed to the identification of a low
number of proteins particularly in the K7me2 pulldowns limiting our analysis and
therefore should be avoided in future studies. In both YFP-RPB1 and peptide
pulldown strategies, we used total cell extracts and it is possible that using nuclear
extracts instead could be beneficial to improve the detection of interactors and
modifiers in case those are mostly nuclear proteins.

Chapter 5 Results
136
Despite the aforementioned limitations, we identified several interesting potential
interactors of CTD-K7 and associated modifications. In the YFP-RPB1 pulldowns,
we identified the HMT SETD2, MATR3 (a component of MLL2 and NIF-1
complexes that also have lysine methylase activity) and PHRF1 (a ubiquitin
ligase). K7 peptide pulldowns identified SNW1 (a known interactor of HDAC2),
ENY2 (that associates with SAGA and other complexes containing HAT and
deubiquitinase activities), and MYBBP1A (a protein previously show to regulate
P53 acetylation mediated by P300). Enzymes that contain methylase,
demethylase, acetylase and deacetylase activities are components of multiprotein
complexes, and their identification in our mass spec data provides preliminary
evidence for candidate complexes that associate and can potentially modify K7
residues.
Alternative approaches such as a systematic knock down of the mouse HMTs,
demethylases and HDACs using siRNA or chemical inhibitor screens should be
pursued to identify additional K7 modifiers.
Several proteins recruited to the CTD recognize multiple PTMs making the
identification of interactors using peptide pulldown experiments particularly difficult.
Moreover, structural studies of protein domains recognizing methylated lysines,
such as chromodomains, have shown that the sequence context of the
neighbouring residues is important for recognition (Patel and Wang, 2013). One
interesting option would be to include in the design of the peptides other
modifications associated with initiation and early stages of transcription and likely
to coincide with K7 methylation such as S5p, Y1p, and S5-O-GlcNAc. The
conformation of the S-P bonds (either in cis or trans) is equally important for the
recruitment of several CTD interactors and could be another variable to include in
our peptides. Performing a more extensive peptide pulldown screen using extra
CTD peptides or a CTD peptide library with additional PTMs could improve our
ability to identify readers/writers of CTD-K7 methylation.

Chapter 6 General Discussion and Conclusions
137
Chapter 6
General Discussion and Conclusions
6.1 – Integrating CTD-K7 mono- and dimethylation with the transcription
cycle and gene expression
In this thesis, I describe two novel CTD modifications, mono- and dimethylation of
CTD-K7 residues at the distal region of the CTD (Dias et al., 2015). CTD-K7
residues can also be trimethylated, acetylated and ubiquitinated (Li et al., 2007;
Schroder et al., 2013; Voss et al., 2015). Western blot analyses show that K7me1
and K7me2 mark the hypophosphorylated form of RNAPII (Fig. 3.8) in mouse,
human, C. elegans and D. melanogaster being conserved amongst distantly
related metazoan taxa. K7 acetylation was previously described in mouse and
human cells and marks both hypo- and hyperphosphorylated RNAPII (Schroder et
al., 2013). In a contemporary study (Voss et al., 2015), mass spectrometry
analysis of the human CTD mapped K7me1 to six out of the eight K7 residues,
K7me2 and K7me3 to only one and the K7ac to four K7 residues. We also detect
K7me1 and K7me2 in a mouse cell line with a single K7 residue present at repeat
35 (Fig. 3.7), which was not so far detected by mass spectrometry analysis (Voss
et al., 2015). Prevalence of K7me1 over K7me2 in mass spec data agrees with our
western blot results from different mutant cell lines. In the case of K7me1, we see
an increase in global levels of K7me1 with increasing number of K7 residues in
CTD constructs (Fig. 3.7, while K7me2 levels are higher between one and three
K7 residues, without further increase in cells with eight K7 residues (Wt
sequence), which suggests that several but not all K7 residues are dimethylated. A
schematic summary of the diversity of modifications targeting CTD-K7 residues is
represented in Fig. 6.1.

Chapter 6 General Discussion and Conclusions
138
Figure 6.1. Summary of CTD-K7 post-translational modifications.
Schematic representation of the mouse CTD amino acid sequence from repeat 35 to 49 and a summary of PTMs described for K7 residues. Putative sites predicted by western blot analysis in K7-to-S7 mutant cells of but yet to be confirmed are marked with me1* and me2*. Monomethylation (me1), dimethylation (me2), trimethylation (me3), acetylation (ac) and ubiquitination (ub).
ChIP analysis revealed a strong enrichment for K7me1 and Kme2 at 5´ region of
active genes in agreement with K7 methylation marking early stages of
transcription (Fig. 4.1 and 4.2). K7ac is equally enriched around the TSS of active
genes but is also found further downstream in the gene bodies.
Inhibition of RNAPII elongation using flavopiridol, a CDK9 inhibitor, depleted
completely the levels of S2p, without detectable effect on the levels of K7me1 and
K7me2, indicating that K7 methylation is independent of S2 phosphorylation and
prior to productive elongation (Fig. 3.9). The results from flavopiridol treatment and
ChIP indicate that K7 residues are methylated prior to elongation most likely at the
initiation stage and treatment with alkaline phosphatase suggests that K7
methylation is mostly depleted from elongating complexes (Fig. 3.9).
In the mass spectrometry analyses of Voss et al., (2015), CTD phosphorylation
was detected together with K7 methylation and acetylation in several peptides.
K7me1 and K7ac, the most detected K7 modifications in the mass spec analysis,

Chapter 6 General Discussion and Conclusions
139
were found with S5p, S2p, Y1p and T4p. K7me1 was mostly found with S5p while
K7ac was equally found with S5p and S2p supporting the association of K7
methylation with early transcription and of K7 acetylation with elongating RNAPII.
It is possible that K7 methylation occurs prior to initiation and RNAPII associates
with PIC already methylated. Nevertheless, K7 methylation is unlikely to be a
ubiquitous PTM marking all RNAPII forms since IF staining of K7me1 and K7me2
shows a discrete and punctuate pattern suggesting that only a fraction of RNAPII
molecules are marked by K7 methylation (Fig. 3.10).
Our genome-wide analysis of ChIP-seq data from K7me1, K7me2 and K7ac in
mouse ES cells identified a great overlap between genes marked by K7
methylation and K7 acetylation (Fig. 4.3). Using correlation analysis and linear
modelling, we dissected the association of K7 methylation and acetylation with the
transcription cycle and gene expression. K7me1, K7me2 and K7ac are all
enriched at genes actively transcribed but we found distinct associations of K7
methylation and acetylation with gene expression and other RNAPII modifications.
On one hand, K7 methylation is mostly related to other CTD promoter marks such
as S5p, S7p and unphosphorylated S2 (marked by 8WG16) and uncoupled from
S2p levels at the TES and mRNA levels. On the other hand, K7 acetylation is
more associated with S2p and mRNA levels. Partial correlations and regression
models further revealed that K7 methylation, although enriched at active genes,
has a negative contribution for the S2p and mRNA levels, while K7 acetylation has
a significant positive contribution for both. The opposing association of K7
methylation and K7 acetylation with gene expression while being simultaneously
present at active genes led us to investigate if their levels could modulate gene
expression.
We calculated the ratio between the levels of K7me2 and K7ac (K7me2/K7ac) and
found that genes with high K7me2/K7ac ratio are less expressed and have lower
levels of S7p and S2p while the opposite was observed for genes with lower
K7me2/K7ac ratios (Fig. 4.11 to 4.14). Moreover, we detected K7ac expanding
further downstream of the TSS at genes with lower K7me2/K7ac ratios, thereby
establishing a link between gene expression, lower promoter levels of K7me2 and
higher levels of K7ac at both promoter and gene body.

Chapter 6 General Discussion and Conclusions
140
To reduce or increase K7ac levels, we treated ES cells with chemical inhibitors
and found supporting evidence for a role of K7 methylation and K7 acetylation in
modulation of expression levels. Genes from the high K7me2/K7ac ratio were
upregulated after treatment with the HDAC inhibitor TSA suggesting that an
increase in K7ac can lead to an increase in expression of genes with low levels of
K7ac (Fig. 4.19). Treatment of cells with P300 inhibitor C646 prevents K7ac and
resulted in an increase of global levels of K7 methylation and general reduction in
gene expression confirming that higher levels of K7 methylation are associated
with lower levels of expression (Fig. 4.20).
A possible mechanism for modulation of gene expression could result from a CTD
molecule being simultaneously and dynamically modified by K7me1, K7me2 and
K7ac and the relative amount of each modification or the specific K7 residues
modified could regulate the transition to elongation and expression levels. A less
dynamic mechanism could originate two distinct RNAPII populations, one
exclusively marked by K7me1/2 that does not engage in productive transcription
and other exclusively marked by K7ac that would efficiently engage in
transcription.
Results from mass spectrometry analysis (Voss et al., 2015) detected K7ac and
K7me1 together in the same peptide at repeats 39 and 40, providing evidence for
the coexistence of K7ac and K7me1 in the same CTD molecule. Similarly, K7me1
and K7me3 were found together at repeats 39 and 40 and K7me2 and K7me1 at
repeats 38 and 39 indicating that several K7 methyl states are present in the same
CTD. The combinations of PTMs identified are likely to represent just a small
fraction of the diversity occurring in vivo yet these results are compatible with a
model where transition to elongation and or expression levels can be regulated by
the extent of K7ac and K7me1/2 on the same CTD molecule.
The mechanisms underlying regulation of transcription and gene expression by
interacting factors recruited to CTD-K7 residues or K7-associated modifications
remain to be characterized but our results described in Chapter 5 can provide
some preliminary insight.
We identified MYBBP1A in our mass spec data as a specific interactor of K7
heptapetides, while no interaction was observed with S7 and K7me2 (Fig. 5.3) and

Chapter 6 General Discussion and Conclusions
141
it remains to be investigated how K7me1, K7me3 and K7ac affect MYBBP1A
interaction with the CTD. A previous study identified MYBBP1A as an interactor of
mitotic RNAPII and siRNA knockdown of MYBBP1A caused a significant increase
in Br-UTP incorporation suggesting an inhibitory role in transcription / elongation
(Moller et al., 2012). Moreover, MYBBP1A has been involved in regulation of
Lysine acetylation of histone and non-histone proteins namely through interaction
with P300 (Karim et al., 2013; Kumazawa et al., 2015; Ono et al., 2014).
MYBBP1A is therefore a promising interactor with potential to regulate
transcription elongation and modulate K7ac levels through dynamic association
with CTD-K7 residues.
GDOWN1 was another interactor identified in our YFP-RPB1 pulldowns being
exclusively present in the 8K Wt YFP-RPB1 dataset. Data mostly from in vitro
studies has linked GDOWN1 to stabilization of RNAPII promoter proximal pausing
(Cheng et al., 2012; Mullen Davis et al., 2014). The requirement of CTD-K7
residues for recruitment or stabilization of GDOWN1 with RNAPII suggests a
possible involvement of K7 methylation and acetylation and connects the K7
modification status with regulation of pausing mediated by GDOWN1. Since no
global changes in transcription, accessed by Br-UTP incorporation, were observed
upon knockdown of GDOWN1 (Moller et al., 2012) and ChIP-seq for RNAPII after
GDOWN1 depletion revealed only a small increase in RNAPII downstream of
pausing sites (Cheng et al., 2012) it is possible that only a subset of genes is
regulated by GDOWN1 in vivo.
We and Simonti et al., (2015) analysed gene expression in CTD-K7 mutant cells
(Fig. 4.17) and observed expression changes in a restricted number of genes
likely to be affected by pausing regulators, such as growth factor response genes.
It would be interesting in future studies to assess the role of GDOWN1 in the
expression of the genes found dysregulated in K7 mutant cells in order to
investigate whether K7 modifications regulate RNAPII pausing through GDOWN1
recruitment.
Another interesting CTD interactor is FUS (fused in sarcoma), a low-complexity
(LC) domain protein. LC proteins have an intrinsically disordered structure and can
reversibly polymerise forming fibres and interchange between a soluble and

Chapter 6 General Discussion and Conclusions
142
aggregate state. Many proteins have LC domains and amongst the most studied
we find the FET proteins (FUS/EWS/TAF15) (Kwon et al., 2013). FUS and EWS
(Ewing Sarcoma) are RNA binding proteins involved in transcription activation or
regulation, mRNA splicing and transport. TAF15 (TATA-box binding protein
associated factor 15) is a component of TFIID a GTF involved in PIC assembly
and transcription initiation. FET proteins interact with the CTD and preferentially
bind to non-canonical repeats with an increased affinity for constructs bearing a
higher number of non-canonical repeats, a remarkable observation that potentially
links FET proteins to CTD-K7 residues (Burke et al., 2015; Kwon et al., 2013). In
agreement with FET proteins interacting with non-canonical repeats, we found
FUS in our mass spectrometry data in one biological replicate from the K7 peptide
pulldowns but not in the S7 and K7me2 peptides; it should be mentioned that
interaction with K7me2 could have been missed due to the IP design.
FUS protein is particularly interesting as soluble FUS can bind to the CTD and
prevent S2 phosphorylation and knockdown of FUS leads to an increase in S2p at
promoters and a reduction of RNAPII pausing (Schwartz et al., 2012). Since FUS
has an RNA binding domain, it is possible that multiple FUS proteins are locally
recruited to transcribing sites facilitating polymerisation of FUS (Schwartz et al.,
2013). CTD phosphorylation by CDK7 and CDK9 prevents interaction with FUS
and TAF15 polymers or abolishes the previous interaction with unphosphorylated
CTD (Kwon et al., 2013). FUS involvement in transcriptional activation, initiation
and promoter proximal pausing can be potentially regulated by CTD-K7
methylation and acetylation given the association of FUS with non-consensus
repeats. Additionally, FUS was found to interact with CBP (CREB-binding protein)
and P300 at the human gene Cyclin D1, inhibiting their acetyltransferase activity in
a process mediated by a ncRNA induced by DNA damage (Wang et al., 2008).
FUS association with P300 raises the question of whether it can modulate K7
acetylation and the link between FUS, CTD-K7 modifications and RNAPII pausing
is an interesting subject to be further investigated.

Chapter 6 General Discussion and Conclusions
143
6.2 – CTD-K7 modifications in context of development and disease
Mice homozygous for a CTD deletion of 13 repeats, mostly non-consensus, were
found to be viable but had a growth defect phenotype marked by a smaller size
and increased neonatal lethality (Litingtung et al., 1999). The CTD deletion
included repeat 35 that we found to be modified by K7me1 and K7me2 (Fig. 3.7)
and repeat 31 containing a R7 residue that can be symmetrically and
asymmetrically dimethylated (Sims et al., 2011; Zhao et al., 2016). Interestingly,
Litingtung et al. (1999) also generated a second CTD mutant mouse model with a
smaller deletion of only two repeats (46 and 47) including a K7 residue at repeat
47 which is methylated and acetylated (Voss et al., 2015). This mutant did not
present a growth phenotype and is unclear whether the differences between the
two mutant mice resulted from the size of the deletion or because the non-
canonical repeats affected are functionally different. Nevertheless, the 13 repeat
deletion mice phenotype suggests a possible link between some non-consensus
repeats and embryonic development that remains to be investigated.
Analysis of our RNA-seq data from mouse fibroblasts expressing a K7-to-S7
mutant CTD revealed dysregulation of genes with GO term enrichments such as
response to growth factor, regulation of cell proliferation, vasculature development,
and tissue development (Fig. 4.17). These results suggest a potential link between
the growth-defects observed in mutant mice, the CTD-K7 residues and modulation
of gene expression by K7 methylation and acetylation. Moreover K7ac has been
shown to regulate inducible gene expression from EGF responsive genes Egr2
and C-Fos and gene expression analysis from mouse fibroblasts expressing a K7-
to-R7 mutant has identified dysregulation of genes induced by EGF and PDGF
(platelet-derived growth factor) growth factors (Schroder et al., 2013; Simonti et
al., 2015). EGF and PDGF signalling pathways regulate proliferation,
differentiation, and cell migration, being important for both embryonic development
and cancer (Cao et al., 2014; Zeng and Harris, 2014). Remarkably, EGF has been
associated with growth retardation in mouse models overexpressing human EGF
precursor further connecting EGF signalling and regulation of growth during
development (Chan and Wong, 2000). Studying the role of K7 methylation and
acetylation in regulation of gene expression, particularly of EGF, PDGF and other
growth factor related genes during development could clarify the growth

Chapter 6 General Discussion and Conclusions
144
phenotype observed in CTD mutant mice and reveal the relevance of K7
modifications for developmental processes.
Direct mutation of CTD-K7 residues at the endogenous Polr2a locus using
CRISPR/Cas gene editing would overcome the limitations we had in stabilising
stable mouse ES cells using an α-amanitin based system and allow us to generate
mouse models. C. elegans and D. melanogaster are also interesting animal
models to study CTD-K7 function since they have one and three K7 residues,
respectively, and we found K7 methylation present in both organisms (Fig. 3.8). It
would be interesting to investigate whether CTD-K7 functions are conserved
between invertebrates and vertebrates and whether the expansion in number of
K7 residues is associated with gain of extra functions.
The malaria parasites from the genus Plasmodium are another interesting model
for CTD evolution studies. Plasmodium parasites are an unique case amongst
eukaryotes since the number of CTD heptapeptides is variable between different
species and sub-species and they have acquired a high number of CTD repeats
with K7 residues (Kishore et al., 2009). Remarkably, the Plasmodium parasites
that infect primates have the longest CTD (up to 17 repeats in some human sub-
species of Plasmodium falciparum while bird and rodent parasites have only 8
repeats) and the highest number of CTD-K7 residues (up to 11 in P. falciparum,
Kishore et al., 2009). The functional relevance of CTD-K7 expansion in primate
Plasmodium species is not known but it is likely to reflect an adaptation to the host
biology, highlighting the need for further investigations of K7 biology.
Plasmodium parasites have a complex life cycle infecting a mosquito vector and a
vertebrate host in which replication occurs at the liver and erythrocytes. However,
Plasmodium genome encodes very few TFs to regulate gene expression in such
different environments (Kishore et al., 2009). Host factors are likely involved in
regulation of several aspects of Plasmodium gene expression and, given the
expansion of CTD-K7 residues in Plasmodium, it could be relevant to investigate
the role of K7 methylation and acetylation in regulating expression of the
Plasmodium genome.
Chemical inhibitors of HMTs, HATs and HDACs are currently being used or
investigated for cancer therapies mostly for targeting dysregulated epigenetic

Chapter 6 General Discussion and Conclusions
145
modifications associated with cancer development and progression (Hamamoto et
al., 2015). Since lysine methylation and acetylation regulate the activity of non-
histone proteins also relevant for cancer including P53, CBP /P300 and NF-kB,
there is currently an increasing interest in targeting methylation and acetylation of
non-histone proteins for cancer therapies (Goodman and Smolik, 2000;
Hamamoto et al., 2015). K7ac and K7me2 regulate expression of genes involved
in cell proliferation and response to growth factors therefore modulating K7ac and
K7me2 levels could be relevant for the development of more specific and efficient
therapies to target genes and pathways dysregulated in cancer.
6.3 – Final notes
The first extensive mass spectrometry results uncovering the universe of CTD
modifications revealed an unexpected uniform distribution of PTMs along the CTD
(Schuller et al., 2016; Suh et al., 2016). For decades, it was believed that the
combinatorial potential of the CTD was enormous but these two pioneering studies
suggest a much more homogeneous and simpler CTD code. Moreover, only a
small fraction of the total CTD residues was found phosphorylated indicating that
most CTD heptapeptides detected were unmodified or had a single phospho site.
In both yeast and human cells, S5p and S2p were the most abundant
modifications with Y1p, T4p and S7p levels being considerably lower, although
modifications introduced on the CTD sequence have limited the detection of S7p
(Schuller et al., 2016; Suh et al., 2016). K7me1, K7me2, K7me3, K7ac and K7ub
have been identified and mapped to several CTD-K7 residues and additional
modifications, such as sumoylation, can increase even further the diversity of
PTMs at the distal CTD. Considering the unexpected uniform patterns of
phosphorylation along the CTD, the non-consensus repeats and particularly K7
residues can greatly increase the diversity of the CTD code and contribute for
distinct conformations at the distal region.
It remains to be investigated whether the eight K7 residues are functionally distinct
or mostly redundant. Four of the K7 heptapetides have exactly the same sequence
while the other four have small additional changes, and all neighbouring repeats

Chapter 6 General Discussion and Conclusions
146
have non-canonical substitutions so it is possible that some K7 residues are
preferentially or exclusively bound by distinct factors.
Serine phosphorylation is dynamically regulated by several kinases and
phosphatases along the transcription cycle. An equally complex regulatory
network is likely to exist in association with K7 methylation and acetylation. To
date, only P300 and Wwp2 have been identified as K7 modifiers, being
responsible for K7 acetylation and ubiquitination, respectively (Li et al., 2007;
Schroder et al., 2013). In chapter 5, we identified components of complexes
associated with methyltransferase, acetyltransferase and ubiquitin ligase activities
that should be further investigated to determine their ability to modify CTD-K7
residues. A better knowledge of the complexes modifying K7 residues and the
interactors recruited by different K7 modifications will help us to understand the
mechanisms by which K7 methylation and acetylation regulate transcription and
gene expression.
In summary, we have identified two novel CTD modifications, mono- and
dimethylation of K7 residues that mark early stages of transcription and are mostly
enriched at the 5´ region of actively expressed genes. K7 residues are also
acetylated and we found K7 methylation and acetylation to have distinct
associations with the transcription cycle and gene expression. Using bioinformatic
analysis, drug inhibitors and CTD mutant cell lines, we found evidence for
modulation of gene expression by K7me2 and K7ac. Using mass spectrometry, we
found CTD interactors that can potentially regulate RNAPII pausing and
transcription levels depending on the posttranslational modification status of CTD-
K7 residues. The results presented in this thesis highlight how non-consensus
repeats expand the repertoire of CTD posttranslational modifications providing
additional layers of regulation for transcription.

147

Chapter 7 References
148
Chapter 7
References
Ahn, S.H., Kim, M., and Buratowski, S. (2004). Phosphorylation of serine 2 within
the RNA polymerase II C-terminal domain couples transcription and 3' end
processing. Mol Cell 13, 67-76.
Akoulitchev, S., Makela, T.P., Weinberg, R.A., and Reinberg, D. (1995).
Requirement for TFIIH kinase activity in transcription by RNA polymerase II.
Nature 377, 557-560.
Allen, B.L., and Taatjes, D.J. (2015). The Mediator complex: a central integrator of
transcription. Nat Rev Mol Cell Biol 16, 155-166.
Allison, L.A., Wong, J.K., Fitzpatrick, V.D., Moyle, M., and Ingles, C.J. (1988). The
C-terminal domain of the largest subunit of RNA polymerase II of Saccharomyces
cerevisiae, Drosophila melanogaster, and mammals: a conserved structure with
an essential function. Mol Cell Biol 8, 321-329.
Anders, S., Pyl, P.T., and Huber, W. (2015). HTSeq--a Python framework to work
with high-throughput sequencing data. Bioinformatics 31, 166-169.
Atanassov, B.S., Mohan, R.D., Lan, X., Kuang, X., Lu, Y., Lin, K., McIvor, E., Li,
W., Zhang, Y., Florens, L., et al. (2016). ATXN7L3 and ENY2 Coordinate Activity
of Multiple H2B Deubiquitinases Important for Cellular Proliferation and Tumor
Growth. Mol Cell 62, 558-571.
Bartkowiak, B., Liu, P., Phatnani, H.P., Fuda, N.J., Cooper, J.J., Price, D.H.,
Adelman, K., Lis, J.T., and Greenleaf, A.L. (2010). CDK12 is a transcription
elongation-associated CTD kinase, the metazoan ortholog of yeast Ctk1. Genes
Dev 24, 2303-2316.

Chapter 7 References
149
Bartolomei, M.S., Halden, N.F., Cullen, C.R., and Corden, J.L. (1988). Genetic
analysis of the repetitive carboxyl-terminal domain of the largest subunit of mouse
RNA polymerase II. Mol Cell Biol 8, 330-339.
Baskaran, R., Dahmus, M.E., and Wang, J.Y. (1993). Tyrosine phosphorylation of
mammalian RNA polymerase II carboxyl-terminal domain. Proc Natl Acad Sci U S
A 90, 11167-11171.
Bataille, A.R., Jeronimo, C., Jacques, P.E., Laramee, L., Fortin, M.E., Forest, A.,
Bergeron, M., Hanes, S.D., and Robert, F. (2012). A universal RNA polymerase II
CTD cycle is orchestrated by complex interplays between kinase, phosphatase,
and isomerase enzymes along genes. Mol Cell 45, 158-170.
Bensaude, O. (2011). Inhibiting eukaryotic transcription: Which compound to
choose? How to evaluate its activity? Transcription 2, 103-108.
Bernstein, B.E., Mikkelsen, T.S., Xie, X., Kamal, M., Huebert, D.J., Cuff, J., Fry, B.,
Meissner, A., Wernig, M., Plath, K., et al. (2006). A bivalent chromatin structure
marks key developmental genes in embryonic stem cells. Cell 125, 315-326.
Biggar, K.K., and Li, S.S. (2015). Non-histone protein methylation as a regulator of
cellular signalling and function. Nat Rev Mol Cell Biol 16, 5-17.
Billon, N., Jolicoeur, C., Ying, Q.L., Smith, A., and Raff, M. (2002). Normal timing
of oligodendrocyte development from genetically engineered, lineage-selectable
mouse ES cells. J Cell Sci 115, 3657-3665.
Boeing, S., Rigault, C., Heidemann, M., Eick, D., and Meisterernst, M. (2010).
RNA polymerase II C-terminal heptarepeat domain Ser-7 phosphorylation is
established in a mediator-dependent fashion. J Biol Chem 285, 188-196.
Bonn, S., Zinzen, R.P., Perez-Gonzalez, A., Riddell, A., Gavin, A.C., and Furlong,
E.E. (2012). Cell type-specific chromatin immunoprecipitation from multicellular
complex samples using BiTS-ChIP. Nat Protoc 7, 978-994.

Chapter 7 References
150
Brookes, E., de Santiago, I., Hebenstreit, D., Morris, K.J., Carroll, T., Xie, S.Q.,
Stock, J.K., Heidemann, M., Eick, D., Nozaki, N., et al. (2012). Polycomb
associates genome-wide with a specific RNA polymerase II variant, and regulates
metabolic genes in ESCs. Cell Stem Cell 10, 157-170.
Brookes, E., and Pombo, A. (2009). Modifications of RNA polymerase II are pivotal
in regulating gene expression states. EMBO Rep 10, 1213-1219.
Buratowski, S. (2003). The CTD code. Nat Struct Biol 10, 679-680.
Burke, K.A., Janke, A.M., Rhine, C.L., and Fawzi, N.L. (2015). Residue-by-
Residue View of In Vitro FUS Granules that Bind the C-Terminal Domain of RNA
Polymerase II. Mol Cell 60, 231-241.
Cadena, D.L., and Dahmus, M.E. (1987). Messenger RNA synthesis in
mammalian cells is catalyzed by the phosphorylated form of RNA polymerase II. J
Biol Chem 262, 12468-12474.
Cao, F., Townsend, E.C., Karatas, H., Xu, J., Li, L., Lee, S., Liu, L., Chen, Y.,
Ouillette, P., Zhu, J., et al. (2014). Targeting MLL1 H3K4 methyltransferase activity
in mixed-lineage leukemia. Mol Cell 53, 247-261.
Carrozza, M.J., Li, B., Florens, L., Suganuma, T., Swanson, S.K., Lee, K.K., Shia,
W.J., Anderson, S., Yates, J., Washburn, M.P., et al. (2005). Histone H3
methylation by Set2 directs deacetylation of coding regions by Rpd3S to suppress
spurious intragenic transcription. Cell 123, 581-592.
Chan, S.Y., and Wong, R.W. (2000). Expression of epidermal growth factor in
transgenic mice causes growth retardation. J Biol Chem 275, 38693-38698.
Chang, C.F., Chu, P.C., Wu, P.Y., Yu, M.Y., Lee, J.Y., Tsai, M.D., and Chang,
M.S. (2015). PHRF1 promotes genome integrity by modulating non-homologous
end-joining. Cell Death Dis 6, e1716.

Chapter 7 References
151
Chao, S.H., and Price, D.H. (2001). Flavopiridol inactivates P-TEFb and blocks
most RNA polymerase II transcription in vivo. J Biol Chem 276, 31793-31799.
Chapman, R.D., Conrad, M., and Eick, D. (2005). Role of the mammalian RNA
polymerase II C-terminal domain (CTD) nonconsensus repeats in CTD stability
and cell proliferation. Mol Cell Biol 25, 7665-7674.
Chapman, R.D., Heidemann, M., Albert, T.K., Mailhammer, R., Flatley, A.,
Meisterernst, M., Kremmer, E., and Eick, D. (2007). Transcribing RNA polymerase
II is phosphorylated at CTD residue serine-7. Science 318, 1780-1782.
Chapman, R.D., Heidemann, M., Hintermair, C., and Eick, D. (2008). Molecular
evolution of the RNA polymerase II CTD. Trends Genet 24, 289-296.
Cheng, B., Li, T., Rahl, P.B., Adamson, T.E., Loudas, N.B., Guo, J., Varzavand,
K., Cooper, J.J., Hu, X., Gnatt, A., et al. (2012). Functional association of Gdown1
with RNA polymerase II poised on human genes. Mol Cell 45, 38-50.
Cho, E.J., Kobor, M.S., Kim, M., Greenblatt, J., and Buratowski, S. (2001).
Opposing effects of Ctk1 kinase and Fcp1 phosphatase at Ser 2 of the RNA
polymerase II C-terminal domain. Genes Dev 15, 3319-3329.
Chung, S., Andersson, T., Sonntag, K.C., Bjorklund, L., Isacson, O., and Kim, K.S.
(2002). Analysis of different promoter systems for efficient transgene expression in
mouse embryonic stem cell lines. Stem Cells 20, 139-145.
Clarke, S.G. (2013). Protein methylation at the surface and buried deep: thinking
outside the histone box. Trends Biochem Sci 38, 243-252.
Clemente-Blanco, A., Sen, N., Mayan-Santos, M., Sacristan, M.P., Graham, B.,
Jarmuz, A., Giess, A., Webb, E., Game, L., Eick, D., et al. (2011). Cdc14
phosphatase promotes segregation of telomeres through repression of RNA
polymerase II transcription. Nat Cell Biol 13, 1450-1456.

Chapter 7 References
152
Czudnochowski, N., Bosken, C.A., and Geyer, M. (2012). Serine-7 but not serine-5
phosphorylation primes RNA polymerase II CTD for P-TEFb recognition. Nat
Commun 3, 842.
Darzacq, X., Shav-Tal, Y., de Turris, V., Brody, Y., Shenoy, S.M., Phair, R.D., and
Singer, R.H. (2007). In vivo dynamics of RNA polymerase II transcription. Nat
Struct Mol Biol 14, 796-806.
Descostes, N., Heidemann, M., Spinelli, L., Schuller, R., Maqbool, M.A., Fenouil,
R., Koch, F., Innocenti, C., Gut, M., Gut, I., et al. (2014). Tyrosine phosphorylation
of RNA polymerase II CTD is associated with antisense promoter transcription and
active enhancers in mammalian cells. Elife 3, e02105.
Devaiah, B.N., Lewis, B.A., Cherman, N., Hewitt, M.C., Albrecht, B.K., Robey,
P.G., Ozato, K., Sims, R.J., 3rd, and Singer, D.S. (2012). BRD4 is an atypical
kinase that phosphorylates serine2 of the RNA polymerase II carboxy-terminal
domain. Proc Natl Acad Sci U S A 109, 6927-6932.
Di Vona, C., Bezdan, D., Islam, A.B., Salichs, E., Lopez-Bigas, N., Ossowski, S.,
and de la Luna, S. (2015). Chromatin-wide profiling of DYRK1A reveals a role as a
gene-specific RNA polymerase II CTD kinase. Mol Cell 57, 506-520.
Dias, J.D., Rito, T., Torlai Triglia, E., Kukalev, A., Ferrai, C., Chotalia, M., Brookes,
E., Kimura, H., and Pombo, A. (2015). Methylation of RNA polymerase II non-
consensus Lysine residues marks early transcription in mammalian cells. Elife 4.
e11215
Dieci, G., Preti, M., and Montanini, B. (2009). Eukaryotic snoRNAs: a paradigm for
gene expression flexibility. Genomics 94, 83-88.
Drouin, G., and Carter, R. (2010). Evolution of Eukaryotic RNA Polymerases.
Encyclopedia of Life Sciences (ELS).

Chapter 7 References
153
Efron, T.H.a.B. (2013). lars: Least Angle Regression, Lasso and Forward
Stagewise, pp. R package version 1.2.
Egloff, S., Dienstbier, M., and Murphy, S. (2012a). Updating the RNA polymerase
CTD code: adding gene-specific layers. Trends Genet 28, 333-341.
Egloff, S., O'Reilly, D., Chapman, R.D., Taylor, A., Tanzhaus, K., Pitts, L., Eick, D.,
and Murphy, S. (2007). Serine-7 of the RNA polymerase II CTD is specifically
required for snRNA gene expression. Science 318, 1777-1779.
Egloff, S., Zaborowska, J., Laitem, C., Kiss, T., and Murphy, S. (2012b). Ser7
phosphorylation of the CTD recruits the RPAP2 Ser5 phosphatase to snRNA
genes. Mol Cell 45, 111-122.
Eick, D., and Geyer, M. (2013). The RNA polymerase II carboxy-terminal domain
(CTD) code. Chem Rev 113, 8456-8490.
Ettahar, A., Ferrigno, O., Zhang, M.Z., Ohnishi, M., Ferrand, N., Prunier, C., Levy,
L., Bourgeade, M.F., Bieche, I., Romero, D.G., et al. (2013). Identification of
PHRF1 as a tumor suppressor that promotes the TGF-beta cytostatic program
through selective release of TGIF-driven PML inactivation. Cell Rep 4, 530-541.
Garapaty, S., Xu, C.F., Trojer, P., Mahajan, M.A., Neubert, T.A., and Samuels,
H.H. (2009). Identification and characterization of a novel nuclear protein complex
involved in nuclear hormone receptor-mediated gene regulation. J Biol Chem 284,
7542-7552.
Gilmour, D.S., and Lis, J.T. (1986). RNA polymerase II interacts with the promoter
region of the noninduced hsp70 gene in Drosophila melanogaster cells. Molecular
and Cellular Biology 6, 3984-3889.
Ginsburg, D.S., Govind, C.K., and Hinnebusch, A.G. (2009). NuA4 lysine
acetyltransferase Esa1 is targeted to coding regions and stimulates transcription
elongation with Gcn5. Mol Cell Biol 29, 6473-6487.
Chapter 7 References
154
Goodman, R.H., and Smolik, S. (2000). CBP/p300 in cell growth, transformation,
and development. Genes Dev 14, 1553-1577.
Govind, C.K., Zhang, F., Qiu, H., Hofmeyer, K., and Hinnebusch, A.G. (2007).
Gcn5 promotes acetylation, eviction, and methylation of nucleosomes in
transcribed coding regions. Mol Cell 25, 31-42.
Gu, B., Eick, D., and Bensaude, O. (2013). CTD serine-2 plays a critical role in
splicing and termination factor recruitment to RNA polymerase II in vivo. Nucleic
Acids Res 41, 1591-1603.
Guo, J., and Price, D.H. (2013). RNA polymerase II transcription elongation
control. Chem Rev 113, 8583-8603.
Hamamoto, R., Saloura, V., and Nakamura, Y. (2015). Critical roles of non-histone
protein lysine methylation in human tumorigenesis. Nat Rev Cancer 15, 110-124.
Hanes, S.D. (2015). Prolyl isomerases in gene transcription. Biochim Biophys Acta
1850, 2017-2034.
Hargreaves, D.C., Horng, T., and Medzhitov, R. (2009). Control of inducible gene
expression by signal-dependent transcriptional elongation. Cell 138, 129-145.
Harlen, K.M., Trotta, K.L., Smith, E.E., Mosaheb, M.M., Fuchs, S.M., and
Churchman, L.S. (2016). Comprehensive RNA Polymerase II Interactomes Reveal
Distinct and Varied Roles for Each Phospho-CTD Residue. Cell Rep 15, 2147-
2158.
Hintermair, C., Heidemann, M., Koch, F., Descostes, N., Gut, M., Gut, I., Fenouil,
R., Ferrier, P., Flatley, A., Kremmer, E., et al. (2012). Threonine-4 of mammalian
RNA polymerase II CTD is targeted by Polo-like kinase 3 and required for
transcriptional elongation. EMBO J 31, 2784-2797.

Chapter 7 References
155
Hintermair, C., Voss, K., Forne, I., Heidemann, M., Flatley, A., Kremmer, E., Imhof,
A., and Eick, D. (2016). Specific threonine-4 phosphorylation and function of RNA
polymerase II CTD during M phase progression. Sci Rep 6, 27401.
Hsin, J.P., Li, W., Hoque, M., Tian, B., and Manley, J.L. (2014a). RNAP II CTD
tyrosine 1 performs diverse functions in vertebrate cells. Elife 3, e02112.
Hsin, J.P., Sheth, A., and Manley, J.L. (2011). RNAP II CTD phosphorylated on
threonine-4 is required for histone mRNA 3' end processing. Science 334, 683-
686.
Hsin, J.P., Xiang, K., and Manley, J.L. (2014b). Function and control of RNA
polymerase II C-terminal domain phosphorylation in vertebrate transcription and
RNA processing. Mol Cell Biol 34, 2488-2498.
Hsu, P.L., Yang, F., Smith-Kinnaman, W., Yang, W., Song, J.E., Mosley, A.L., and
Varani, G. (2014). Rtr1 is a dual specificity phosphatase that dephosphorylates
Tyr1 and Ser5 on the RNA polymerase II CTD. J Mol Biol 426, 2970-2981.
Huang, Y., Kendall, T., Forsythe, E.S., Dorantes-Acosta, A., Li, S., Caballero-
Perez, J., Chen, X., Arteaga-Vazquez, M., Beilstein, M.A., and Mosher, R.A.
(2015). Ancient Origin and Recent Innovations of RNA Polymerase IV and V. Mol
Biol Evol 32, 1788-1799.
Issaeva, I., Zonis, Y., Rozovskaia, T., Orlovsky, K., Croce, C.M., Nakamura, T.,
Mazo, A., Eisenbach, L., and Canaani, E. (2007). Knockdown of ALR (MLL2)
reveals ALR target genes and leads to alterations in cell adhesion and growth. Mol
Cell Biol 27, 1889-1903.
Itzen, F., Greifenberg, A.K., Bosken, C.A., and Geyer, M. (2014). Brd4 activates P-
TEFb for RNA polymerase II CTD phosphorylation. Nucleic Acids Res 42, 7577-
7590.

Chapter 7 References
156
Jeronimo, C., Bataille, A.R., and Robert, F. (2013). The writers, readers, and
functions of the RNA polymerase II C-terminal domain code. Chem Rev 113,
8491-8522.
Jeronimo, C., Collin, P., and Robert, F. (2016). The RNA Polymerase II CTD: The
Increasing Complexity of a Low-Complexity Protein Domain. J Mol Biol 428, 2607-
2622.
Jeronimo, C., and Robert, F. (2014). Kin28 regulates the transient association of
Mediator with core promoters. Nat Struct Mol Biol 21, 449-455.
Jonkers, I., Kwak, H., and Lis, J.T. (2014). Genome-wide dynamics of Pol II
elongation and its interplay with promoter proximal pausing, chromatin, and exons.
Elife 3, e02407.
Jonkers, I., and Lis, J.T. (2015). Getting up to speed with transcription elongation
by RNA polymerase II. Nat Rev Mol Cell Biol 16, 167-177.
Karantzali, E., Schulz, H., Hummel, O., Hubner, N., Hatzopoulos, A., and
Kretsovali, A. (2008). Histone deacetylase inhibition accelerates the early events
of stem cell differentiation: transcriptomic and epigenetic analysis. Genome Biol 9,
R65.
Karim, M.F., Yoshizawa, T., Sato, Y., Sawa, T., Tomizawa, K., Akaike, T., and
Yamagata, K. (2013). Inhibition of H3K18 deacetylation of Sirt7 by Myb-binding
protein 1a (Mybbp1a). Biochem Biophys Res Commun 441, 157-163.
Kelly, W.G., Dahmus, M.E., and Hart, G.W. (1993). RNA polymerase II is a
glycoprotein. Modification of the COOH-terminal domain by O-GlcNAc. J Biol
Chem 268, 10416-10424.
Kim, M., Suh, H., Cho, E.J., and Buratowski, S. (2009). Phosphorylation of the
yeast Rpb1 C-terminal domain at serines 2, 5, and 7. J Biol Chem 284, 26421-
26426.
Chapter 7 References
157
Kimura, H., Hayashi-Takanaka, Y., Goto, Y., Takizawa, N., and Nozaki, N. (2008).
The organization of histone H3 modifications as revealed by a panel of specific
monoclonal antibodies. Cell Struct Funct 33, 61-73.
Kireeva, M.L., Kashlev, M., and Burton, Z.F. (2013). RNA polymerase structure,
function, regulation, dynamics, fidelity, and roles in gene expression. Chem Rev
113, 8325-8330.
Kishore, S.P., Perkins, S.L., Templeton, T.J., and Deitsch, K.W. (2009). An
unusual recent expansion of the C-terminal domain of RNA polymerase II in
primate malaria parasites features a motif otherwise found only in mammalian
polymerases. J Mol Evol 68, 706-714.
Kizer, K.O., Phatnani, H.P., Shibata, Y., Hall, H., Greenleaf, A.L., and Strahl, B.D.
(2005). A novel domain in Set2 mediates RNA polymerase II interaction and
couples histone H3 K36 methylation with transcript elongation. Mol Cell Biol 25,
3305-3316.
Kolde, R. (2015). pheatmap: Pretty Heatmaps.
Komarnitsky, P., Cho, E.J., and Buratowski, S. (2000). Different phosphorylated
forms of RNA polymerase II and associated mRNA processing factors during
transcription. Genes Dev 14, 2452-2460.
Krishnamurthy, S., He, X., Reyes-Reyes, M., Moore, C., and Hampsey, M. (2004).
Ssu72 Is an RNA polymerase II CTD phosphatase. Mol Cell 14, 387-394.
Krogan, N.J., Kim, M., Tong, A., Golshani, A., Cagney, G., Canadien, V., Richards,
D.P., Beattie, B.K., Emili, A., Boone, C., et al. (2003). Methylation of Histone H3 by
Set2 in Saccharomyces cerevisiae Is Linked to Transcriptional Elongation by RNA
Polymerase II. Molecular and Cellular Biology 23, 4207-4218.
Kubicek, K., Cerna, H., Holub, P., Pasulka, J., Hrossova, D., Loehr, F., Hofr, C.,
Vanacova, S., and Stefl, R. (2012). Serine phosphorylation and proline

Chapter 7 References
158
isomerization in RNAP II CTD control recruitment of Nrd1. Genes Dev 26, 1891-
1896.
Kumazawa, T., Nishimura, K., Katagiri, N., Hashimoto, S., Hayashi, Y., and
Kimura, K. (2015). Gradual reduction in rRNA transcription triggers p53 acetylation
and apoptosis via MYBBP1A. Sci Rep 5, 10854.
Kwon, I., Kato, M., Xiang, S., Wu, L., Theodoropoulos, P., Mirzaei, H., Han, T.,
Xie, S., Corden, J.L., and McKnight, S.L. (2013). Phosphorylation-regulated
binding of RNA polymerase II to fibrous polymers of low-complexity domains. Cell
155, 1049-1060.
Lang, G., Bonnet, J., Umlauf, D., Karmodiya, K., Koffler, J., Stierle, M., Devys, D.,
and Tora, L. (2011). The tightly controlled deubiquitination activity of the human
SAGA complex differentially modifies distinct gene regulatory elements. Mol Cell
Biol 31, 3734-3744.
Langmead, B., and Salzberg, S.L. (2012). Fast gapped-read alignment with Bowtie
2. Nat Methods 9, 357-359.
Lanouette, S., Mongeon, V., Figeys, D., and Couture, J.F. (2014). The functional
diversity of protein lysine methylation. Mol Syst Biol 10, 724.
Lewis, B.A., Burlingame, A.L., and Myers, S.A. (2016). Human RNA Polymerase II
Promoter Recruitment in Vitro Is Regulated by O-Linked N-
Acetylglucosaminyltransferase (OGT). J Biol Chem 291, 14056-14061.
Li, H., Zhang, Z., Wang, B., Zhang, J., Zhao, Y., and Jin, Y. (2007). Wwp2-
mediated ubiquitination of the RNA polymerase II large subunit in mouse
embryonic pluripotent stem cells. Mol Cell Biol 27, 5296-5305.
Liang, K., Gao, X., Gilmore, J.M., Florens, L., Washburn, M.P., Smith, E., and
Shilatifard, A. (2015). Characterization of human cyclin-dependent kinase 12

Chapter 7 References
159
(CDK12) and CDK13 complexes in C-terminal domain phosphorylation, gene
transcription, and RNA processing. Mol Cell Biol 35, 928-938.
Litingtung, Y., Lawler, A.M., Sebald, S.M., Lee, E., Gearhart, J.D., Westphal, H.,
and Corden, J.L. (1999). Growth retardation and neonatal lethality in mice with a
homozygous deletion in the C-terminal domain of RNA polymerase II. Mol Gen
Genet 261, 100-105.
Liu, P., Kenney, J.M., Stiller, J.W., and Greenleaf, A.L. (2010). Genetic
organization, length conservation, and evolution of RNA polymerase II carboxyl-
terminal domain. Mol Biol Evol 27, 2628-2641.
Loya, T.J., and Reines, D. (2016). Recent advances in understanding transcription
termination by RNA polymerase II. F1000Res 5.F1000 Faculty Rev:1478
Lu, H., Xue, Y., Yu, G.K., Arias, C., Lin, J., Fong, S., Faure, M., Weisburd, B., Ji,
X., Mercier, A., et al. (2015). Compensatory induction of MYC expression by
sustained CDK9 inhibition via a BRD4-dependent mechanism. Elife 4. e06535
Luo, W., Johnson, A.W., and Bentley, D.L. (2006). The role of Rat1 in coupling
mRNA 3'-end processing to transcription termination: implications for a unified
allosteric-torpedo model. Genes Dev 20, 954-965.
Luo, Z., Lin, C., and Shilatifard, A. (2012). The super elongation complex (SEC)
family in transcriptional control. Nat Rev Mol Cell Biol 13, 543-547.
Marshall, N.F., Peng, J., Xie, Z., and Price, D.H. (1996). Control of RNA
polymerase II elongation potential by a novel carboxyl-terminal domain kinase. J
Biol Chem 271, 27176-27183.
Mayer, A., Heidemann, M., Lidschreiber, M., Schreieck, A., Sun, M., Hintermair,
C., Kremmer, E., Eick, D., and Cramer, P. (2012). CTD tyrosine phosphorylation
impairs termination factor recruitment to RNA polymerase II. Science 336, 1723-
1725.

Chapter 7 References
160
Mayfield, J.E., Burkholder, N.T., and Zhang, Y.J. (2016). Dephosphorylating
eukaryotic RNA polymerase II. Biochim Biophys Acta 1864, 372-387.
Mayfield, J.E., Fan, S., Wei, S., Zhang, M., Li, B., Ellington, A.D., Etzkorn, F.A.,
and Zhang, Y.J. (2015). Chemical Tools To Decipher Regulation of Phosphatases
by Proline Isomerization on Eukaryotic RNA Polymerase II. ACS Chem Biol 10,
2405-2414.
Michels, A.A., Fraldi, A., Li, Q., Adamson, T.E., Bonnet, F., Nguyen, V.T., Sedore,
S.C., Price, J.P., Price, D.H., Lania, L., et al. (2004). Binding of the 7SK snRNA
turns the HEXIM1 protein into a P-TEFb (CDK9/cyclin T) inhibitor. EMBO J 23,
2608-2619.
Mikkelsen, T.S., Ku, M., Jaffe, D.B., Issac, B., Lieberman, E., Giannoukos, G.,
Alvarez, P., Brockman, W., Kim, T.K., Koche, R.P., et al. (2007). Genome-wide
maps of chromatin state in pluripotent and lineage-committed cells. Nature 448,
553-560.
Moller, A., Xie, S.Q., Hosp, F., Lang, B., Phatnani, H.P., James, S., Ramirez, F.,
Collin, G.B., Naggert, J.K., Babu, M.M., et al. (2012). Proteomic analysis of mitotic
RNA polymerase II reveals novel interactors and association with proteins
dysfunctional in disease. Mol Cell Proteomics 11, M111 011767.
Moore, K.E., and Gozani, O. (2014). An unexpected journey: lysine methylation
across the proteome. Biochim Biophys Acta 1839, 1395-1403.
Morales, J.C., Richard, P., Patidar, P.L., Motea, E.A., Dang, T.T., Manley, J.L.,
and Boothman, D.A. (2016). XRN2 Links Transcription Termination to DNA
Damage and Replication Stress. PLoS Genet 12, e1006107.
Mori, S., Bernardi, R., Laurent, A., Resnati, M., Crippa, A., Gabrieli, A., Keough,
R., Gonda, T.J., and Blasi, F. (2012). Myb-binding protein 1A (MYBBP1A) is
essential for early embryonic development, controls cell cycle and mitosis, and
acts as a tumor suppressor. PLoS One 7, e39723.

Chapter 7 References
161
Mosley, A.L., Pattenden, S.G., Carey, M., Venkatesh, S., Gilmore, J.M., Florens,
L., Workman, J.L., and Washburn, M.P. (2009). Rtr1 is a CTD phosphatase that
regulates RNA polymerase II during the transition from serine 5 to serine 2
phosphorylation. Mol Cell 34, 168-178.
Mullen Davis, M.A., Guo, J., Price, D.H., and Luse, D.S. (2014). Functional
interactions of the RNA polymerase II-interacting proteins Gdown1 and TFIIF. J
Biol Chem 289, 11143-11152.
Nemet, J., Jelicic, B., Rubelj, I., and Sopta, M. (2014). The two faces of Cdk8, a
positive/negative regulator of transcription. Biochimie 97, 22-27.
Ng, H.H., Robert, F., Young, R.A., and Struhl, K. (2003). Targeted Recruitment of
Set1 Histone Methylase by Elongating Pol II Provides a Localized Mark and
Memory of Recent Transcriptional Activity. Molecular Cell 11, 709-719.
Nguyen, V.T., Giannoni, F., Dubois, M.F., Seo, S.J., Vigneron, M., Kedinger, C.,
and Bensaude, O. (1996). In vivo degradation of RNA polymerase II largest
subunit triggered by alpha-amanitin. Nucleic Acids Res 24, 2924-2929.
Niwa, H., Miyazaki, J., and Smith, A.G. (2000). Quantitative expression of Oct-3/4
defines differentiation, dedifferentiation or self-renewal of ES cells. Nat Genet 24,
372-376.
Nojima, T., Gomes, T., Grosso, A.R., Kimura, H., Dye, M.J., Dhir, S., Carmo-
Fonseca, M., and Proudfoot, N.J. (2015). Mammalian NET-Seq Reveals Genome-
wide Nascent Transcription Coupled to RNA Processing. Cell 161, 526-540.
Odawara, J., Harada, A., Yoshimi, T., Maehara, K., Tachibana, T., Okada, S.,
Akashi, K., and Ohkawa, Y. (2011). The classification of mRNA expression levels
by the phosphorylation state of RNAPII CTD based on a combined genome-wide
approach. BMC Genomics 12, 516.

Chapter 7 References
162
Ono, W., Hayashi, Y., Yokoyama, W., Kuroda, T., Kishimoto, H., Ito, I., Kimura, K.,
Akaogi, K., Waku, T., and Yanagisawa, J. (2014). The nucleolar protein Myb-
binding protein 1A (MYBBP1A) enhances p53 tetramerization and acetylation in
response to nucleolar disruption. J Biol Chem 289, 4928-4940.
Patel, D.J., and Wang, Z. (2013). Readout of epigenetic modifications. Annu Rev
Biochem 82, 81-118.
Peng, J., Marshall, N.F., and Price, D.H. (1998). Identification of a cyclin subunit
required for the function of Drosophila P-TEFb. J Biol Chem 273, 13855-13860.
Pirngruber, J., Shchebet, A., Schreiber, L., Shema, E., Minsky, N., Chapman,
R.D., Eick, D., Aylon, Y., Oren, M., and Johnsen, S.A. (2009). CDK9 directs H2B
monoubiquitination and controls replication-dependent histone mRNA 3'-end
processing. EMBO Rep 10, 894-900.
Porrua, O., and Libri, D. (2015). Transcription termination and the control of the
transcriptome: why, where and how to stop. Nat Rev Mol Cell Biol 16, 190-202.
Proudfoot, N.J. (2011). Ending the message: poly(A) signals then and now. Genes
Dev 25, 1770-1782.
Quinodoz, M., Gobet, C., Naef, F., and Gustafson, K.B. (2014). Characteristic
bimodal profiles of RNA polymerase II at thousands of active mammalian
promoters. Genome Biol 15, R85.
Ranuncolo, S.M., Ghosh, S., Hanover, J.A., Hart, G.W., and Lewis, B.A. (2012).
Evidence of the involvement of O-GlcNAc-modified human RNA polymerase II
CTD in transcription in vitro and in vivo. J Biol Chem 287, 23549-23561.
Rebehmed, J., Revy, P., Faure, G., de Villartay, J.P., and Callebaut, I. (2014).
Expanding the SRI domain family: a common scaffold for binding the
phosphorylated C-terminal domain of RNA polymerase II. FEBS Lett 588, 4431-
4437.
Chapter 7 References
163
Rechtsteiner, A., Ercan, S., Takasaki, T., Phippen, T.M., Egelhofer, T.A., Wang,
W., Kimura, H., Lieb, J.D., and Strome, S. (2010). The histone H3K36
methyltransferase MES-4 acts epigenetically to transmit the memory of germline
gene expression to progeny. PLoS Genet 6, e1001091.
Reyes-Reyes, M., and Hampsey, M. (2007). Role for the Ssu72 C-terminal domain
phosphatase in RNA polymerase II transcription elongation. Mol Cell Biol 27, 926-
936.
Rosado-Lugo, J.D., and Hampsey, M. (2014). The Ssu72 phosphatase mediates
the RNA polymerase II initiation-elongation transition. J Biol Chem 289, 33916-
33926.
Rosonina, E., Yurko, N., Li, W., Hoque, M., Tian, B., and Manley, J.L. (2014).
Threonine-4 of the budding yeast RNAP II CTD couples transcription with Htz1-
mediated chromatin remodeling. Proc Natl Acad Sci U S A 111, 11924-11931.
Runner, V.M., Podolny, V., and Buratowski, S. (2008). The Rpb4 subunit of RNA
polymerase II contributes to cotranscriptional recruitment of 3' processing factors.
Mol Cell Biol 28, 1883-1891.
Sainsbury, S., Bernecky, C., and Cramer, P. (2015). Structural basis of
transcription initiation by RNA polymerase II. Nat Rev Mol Cell Biol 16, 129-143.
Salton, M., Lerenthal, Y., Wang, S.Y., Chen, D.J., and Shiloh, Y. (2010).
Involvement of Matrin 3 and SFPQ/NONO in the DNA damage response. Cell
Cycle 9, 1568-1576.
Schroder, S., Herker, E., Itzen, F., He, D., Thomas, S., Gilchrist, D.A., Kaehlcke,
K., Cho, S., Pollard, K.S., Capra, J.A., et al. (2013). Acetylation of RNA
polymerase II regulates growth-factor-induced gene transcription in mammalian
cells. Mol Cell 52, 314-324.
Chapter 7 References
164
Schuller, R., Forne, I., Straub, T., Schreieck, A., Texier, Y., Shah, N., Decker,
T.M., Cramer, P., Imhof, A., and Eick, D. (2016). Heptad-Specific Phosphorylation
of RNA Polymerase II CTD. Mol Cell 61, 305-314.
Schwartz, J.C., Ebmeier, C.C., Podell, E.R., Heimiller, J., Taatjes, D.J., and Cech,
T.R. (2012). FUS binds the CTD of RNA polymerase II and regulates its
phosphorylation at Ser2. Genes Dev 26, 2690-2695.
Schwartz, J.C., Wang, X., Podell, E.R., and Cech, T.R. (2013). RNA seeds higher-
order assembly of FUS protein. Cell Rep 5, 918-925.
Schwer, B., and Shuman, S. (2011). Deciphering the RNA polymerase II CTD
code in fission yeast. Mol Cell 43, 311-318.
Simonti, C.N., Pollard, K.S., Schroder, S., He, D., Bruneau, B.G., Ott, M., and
Capra, J.A. (2015). Evolution of lysine acetylation in the RNA polymerase II C-
terminal domain. BMC Evol Biol 15, 35.
Sims, R.J., 3rd, Rojas, L.A., Beck, D., Bonasio, R., Schuller, R., Drury, W.J., 3rd,
Eick, D., and Reinberg, D. (2011). The C-terminal domain of RNA polymerase II is
modified by site-specific methylation. Science 332, 99-103.
Skourti-Stathaki, K., Proudfoot, N.J., and Gromak, N. (2011). Human senataxin
resolves RNA/DNA hybrids formed at transcriptional pause sites to promote Xrn2-
dependent termination. Mol Cell 42, 794-805.
Sorenson, M.R., Jha, D.K., Ucles, S.A., Flood, D.M., Strahl, B.D., Stevens, S.W.,
and Kress, T.L. (2016). Histone H3K36 methylation regulates pre-mRNA splicing
in Saccharomyces cerevisiae. RNA Biol 13, 412-426.
Stiller, J.W., and Hall, B.D. (2002). Evolution of the RNA polymerase II C-terminal
domain. Proc Natl Acad Sci U S A 99, 6091-6096.

Chapter 7 References
165
Stock, J.K., Giadrossi, S., Casanova, M., Brookes, E., Vidal, M., Koseki, H.,
Brockdorff, N., Fisher, A.G., and Pombo, A. (2007). Ring1-mediated ubiquitination
of H2A restrains poised RNA polymerase II at bivalent genes in mouse ES cells.
Nat Cell Biol 9, 1428-1435.
Stump, A.D., and Ostrozhynska, K. (2013). Selective constraint and the evolution
of the RNA polymerase II C-Terminal Domain. Transcription 4, 77-86.
Suh, H., Ficarro, S.B., Kang, U.B., Chun, Y., Marto, J.A., and Buratowski, S.
(2016). Direct Analysis of Phosphorylation Sites on the Rpb1 C-Terminal Domain
of RNA Polymerase II. Mol Cell 61, 297-304.
Tee, W.W., Shen, S.S., Oksuz, O., Narendra, V., and Reinberg, D. (2014). Erk1/2
activity promotes chromatin features and RNAPII phosphorylation at
developmental promoters in mouse ESCs. Cell 156, 678-690.
Tietjen, J.R., Zhang, D.W., Rodriguez-Molina, J.B., White, B.E., Akhtar, M.S.,
Heidemann, M., Li, X., Chapman, R.D., Shokat, K., Keles, S., et al. (2010).
Chemical-genomic dissection of the CTD code. Nat Struct Mol Biol 17, 1154-1161.
Venkatesh, S., Smolle, M., Li, H., Gogol, M.M., Saint, M., Kumar, S., Natarajan, K.,
and Workman, J.L. (2012). Set2 methylation of histone H3 lysine 36 suppresses
histone exchange on transcribed genes. Nature 489, 452-455.
Venkatesh, S., and Workman, J.L. (2013). Set2 mediated H3 lysine 36
methylation: regulation of transcription elongation and implications in organismal
development. Wiley Interdiscip Rev Dev Biol 2, 685-700.
Venkatesh, S., and Workman, J.L. (2015). Histone exchange, chromatin structure
and the regulation of transcription. Nat Rev Mol Cell Biol 16, 178-189.
Voss, K., Forne, I., Descostes, N., Hintermair, C., Schuller, R., Maqbool, M.A.,
Heidemann, M., Flatley, A., Imhof, A., Gut, M., et al. (2015). Site-specific

Chapter 7 References
166
methylation and acetylation of lysine residues in the C-terminal domain (CTD) of
RNA polymerase II. Transcription 6, 91-101.
Wang, X., Arai, S., Song, X., Reichart, D., Du, K., Pascual, G., Tempst, P.,
Rosenfeld, M.G., Glass, C.K., and Kurokawa, R. (2008). Induced ncRNAs
allosterically modify RNA-binding proteins in cis to inhibit transcription. Nature 454,
126-130.
Werner, F., and Grohmann, D. (2011). Evolution of multisubunit RNA polymerases
in the three domains of life. Nat Rev Microbiol 9, 85-98.
West, M.L., and Corden, J.L. (1995). Construction and analysis of yeast RNA
polymerase II CTD deletion and substitution mutations. Genetics 140, 1223-1233.
White, R.J. (2011). Transcription by RNA polymerase III: more complex than we
thought. Nat Rev Genet 12, 459-463.
Wild, T., and Cramer, P. (2012). Biogenesis of multisubunit RNA polymerases.
Trends Biochem Sci 37, 99-105.
Wong, K.H., Jin, Y., and Struhl, K. (2014). TFIIH phosphorylation of the Pol II CTD
stimulates mediator dissociation from the preinitiation complex and promoter
escape. Mol Cell 54, 601-612.
Wood, A., and Shilatifard, A. (2006). Bur1/Bur2 and the Ctk complex in yeast: the
split personality of mammalian P-TEFb. Cell Cycle 5, 1066-1068.
Xie, S.Q., Martin, S., Guillot, P.V., Bentley, D.L., and Pombo, A. (2006). Splicing
speckles are not reservoirs of RNA polymerase II, but contain an inactive form,
phosphorylated on serine2 residues of the C-terminal domain. Mol Biol Cell 17,
1723-1733.

Chapter 7 References
167
Xing, H., Mo, Y., Liao, W., and Zhang, M.Q. (2012). Genome-wide localization of
protein-DNA binding and histone modification by a Bayesian change-point method
with ChIP-seq data. PLoS Comput Biol 8, e1002613.
Yang, C., and Stiller, J.W. (2014). Evolutionary diversity and taxon-specific
modifications of the RNA polymerase II C-terminal domain. Proc Natl Acad Sci U S
A 111, 5920-5925.
Yonezawa, Y. (2014). Molecular dynamics study of the phosphorylation effect on
the conformational states of the C-terminal domain of RNA polymerase II. J Phys
Chem B 118, 4471-4478.
Yu, M., Yang, W., Ni, T., Tang, Z., Nakadai, T., Zhu, J., and Roeder, R.G. (2015).
RNA polymerase II-associated factor 1 regulates the release and phosphorylation
of paused RNA polymerase II. Science 350, 1383-1386.
Zehring, W.A., Lee, J.M., Weeks, J.R., Jokerst, R.S., and Greenleaf, A.L. (1988).
The C-terminal repeat domain of RNA polymerase II largest subunit is essential in
vivo but is not required for accurate transcription initiation in vitro. Proc Natl Acad
Sci U S A 85, 3698-3702.
Zeng, F., and Harris, R.C. (2014). Epidermal growth factor, from gene organization
to bedside. Semin Cell Dev Biol 28, 2-11.
Zeng, X., Chen, J., Sanchez, J.F., Coggiano, M., Dillon-Carter, O., Petersen, J.,
and Freed, W.J. (2003). Stable expression of hrGFP by mouse embryonic stem
cells: promoter activity in the undifferentiated state and during dopaminergic neural
differentiation. Stem Cells 21, 647-653.
Zhang, H., Rigo, F., and Martinson, H.G. (2015). Poly(A) Signal-Dependent
Transcription Termination Occurs through a Conformational Change Mechanism
that Does Not Require Cleavage at the Poly(A) Site. Mol Cell 59, 437-448.

Chapter 7 References
168
Zhang, J., and Corden, J.L. (1991). Identification of phosphorylation sites in the
repetitive carboxyl-terminal domain of the mouse RNA polymerase II largest
subunit. J Biol Chem 266, 2290-2296.
Zhang, M., Wang, X.J., Chen, X., Bowman, M.E., Luo, Y., Noel, J.P., Ellington,
A.D., Etzkorn, F.A., and Zhang, Y. (2012). Structural and kinetic analysis of prolyl-
isomerization/phosphorylation cross-talk in the CTD code. ACS Chem Biol 7,
1462-1470.
Zhao, D.Y., Gish, G., Braunschweig, U., Li, Y., Ni, Z., Schmitges, F.W., Zhong, G.,
Liu, K., Li, W., Moffat, J., et al. (2016). SMN and symmetric arginine dimethylation
of RNA polymerase II C-terminal domain control termination. Nature 529, 48-53.
Zhou, S., Fujimuro, M., Hsieh, J.J., Chen, L., and Hayward, S.D. (2000). A role for
SKIP in EBNA2 activation of CBF1-repressed promoters. J Virol 74, 1939-1947.
