sediment quality - ecotoxicologysednet.org/download/sava-ecotoxicology-susane_heise.pdf ·...
TRANSCRIPT
Sediment Quality - Ecotoxicology
Susanne Heise

Who am I?
1995: Biologist, PhD in Biological Oceanography, Institute for Marine Science, Kiel
1995 – 2002: Researcher, TU Hamburg, Institute for Baltic Sea Research Warnemünde
2002 – 2008: Project leader, Consulting Centre for Integrated Sediment Management
Since 2008: Professor at Hamburg University of Applied Sciences

What is sediment?
Aquatic sediment is aquatic particulate material with differing physical and chemical properties that can be biologically influenced. It is made up of layers of
increasing solid content with depth and includes suspended material, fluid layer,
unconsolidated and consolidated material, so all matter that could potentiallycomprise the suspension – sedimentation cycle (SedNet, 2002)
Vertical processesResuspensionaccumulation
Horizontal processesErosion, transport, mixing, dilution

Ecological Importance of Sediments: Habitat
+ more than 100 000 bacteria species
[Palmer et al. 2000]
(Foto: Dave Paterson)
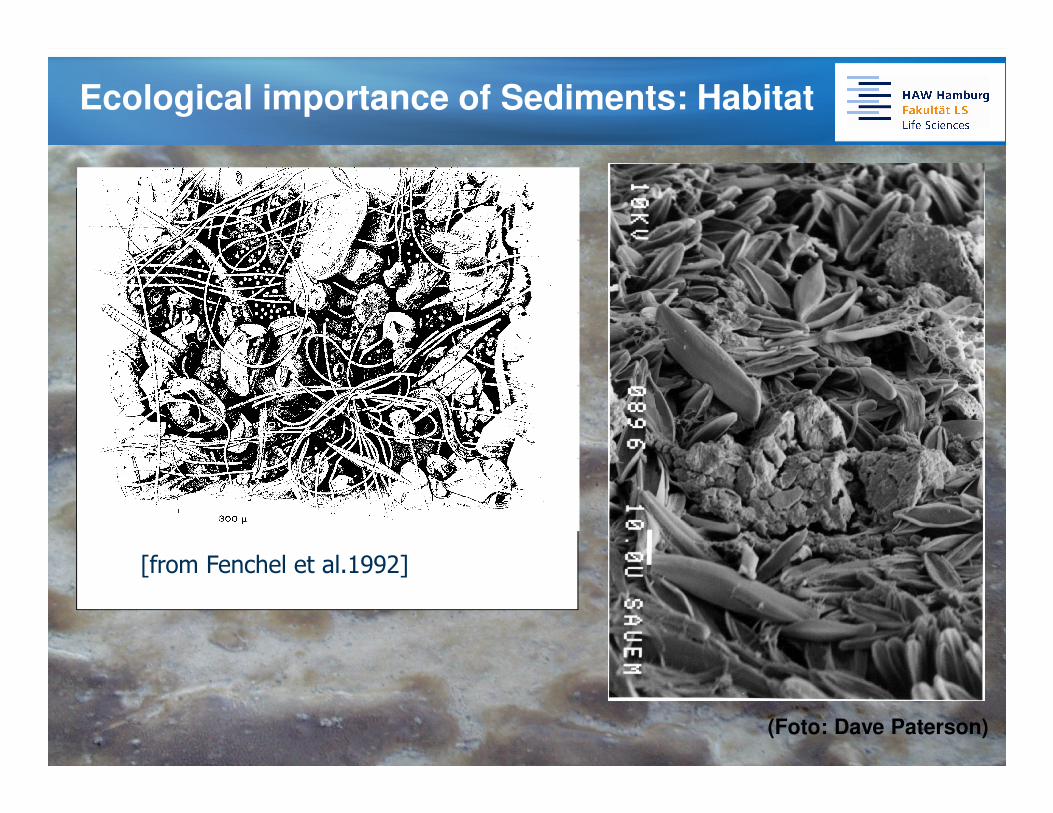
Ecological importance of Sediments: Habitat
(Foto: Dave Paterson)
[from Fenchel et al.1992]

Ecotoxicology Versus Toxicology
"Ecotoxicity studies measure the effects of chemicals on fish,
wildlife, plants, and other wild organisms" (US EPA, 2007)
Sediment ecotoxicology focuses on those contaminants that
adsorb to fine particles, and on those organisms that either live
in the sediment or are impacted by it and which are directly or
indirectly exposed to adsorbed contaminants.

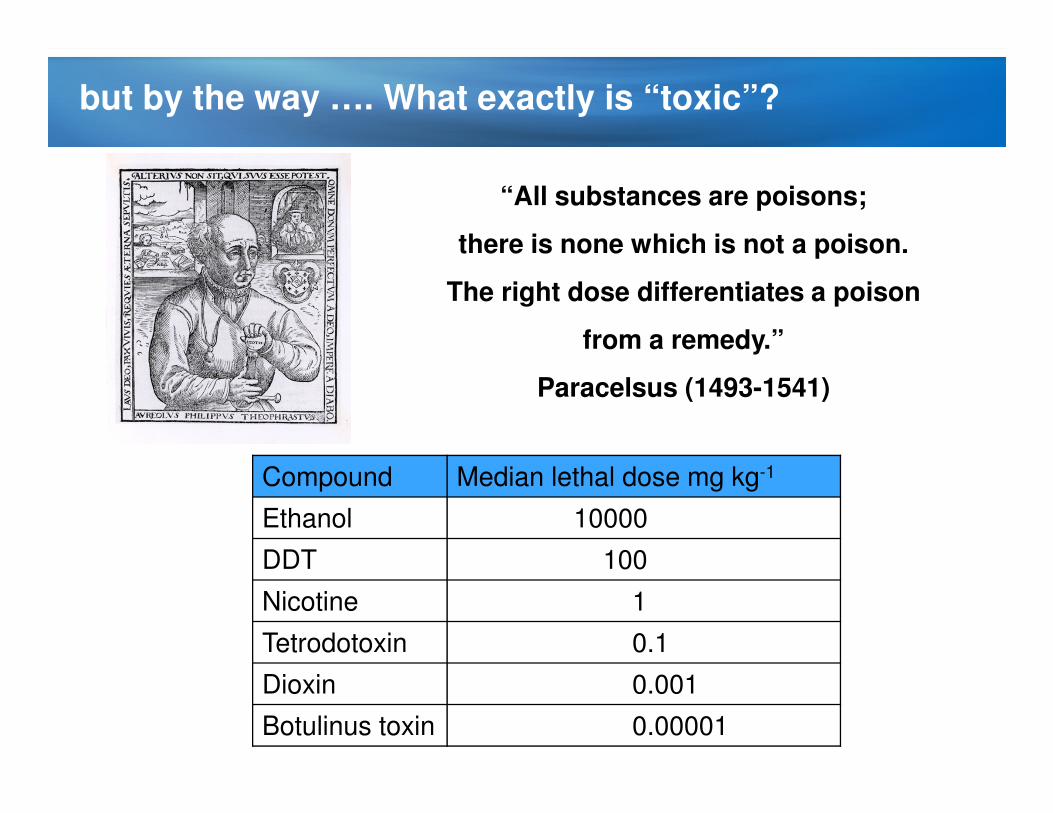
“All substances are poisons;
there is none which is not a poison.
The right dose differentiates a poison
from a remedy.”
Paracelsus (1493-1541)
but by the way …. What exactly is “toxic”?

1 10 50 100 500
Log Dose (mg/kg)
% m
ort
alit
y
0
50
100
LD50= 40 mg/kg
LOED
NOED
Dose-response curves in toxicology

1 10 50 100 500
Log concentration (mg/kg)
% e
ffect (e
.g. In
hib
itio
n)
0
50
100
LC50= 40 mg/kg
LOEC
NOEC
Dose-response curves in eco-toxicology
“All substances are poisons;
there is none which is not a poison.
The right dose differentiates a poison
from a remedy.”
Paracelsus (1493-1541)
but by the way …. What exactly is “toxic”?
Compound Median lethal dose mg kg-1
Ethanol 10000
DDT 100
Nicotine 1
Tetrodotoxin 0.1
Dioxin 0.001
Botulinus toxin 0.00001

The reasoning for ecotoxicological studies
Currently, too little is known about
� the number of potentially effective contaminants adsorbed to sediments
� their fate
� their bioavailability
� their exposure pathways
� their toxicodynamic and toxicokinetic
� their impact on physiological processes
to dermine the toxicity of environmental matrices without on-site -ecotoxicological - investigations.

potentially effective contaminants
adsorbed to sediments

What is monitored in sediments …..
Example Elbe River : e.g. ICPE / OSPAR / HABAK
Mostly:
Heavy metals
DDT et al.
HCB
HCH
PAH
PCB
TBT
Historic contaminantsHistoric sources
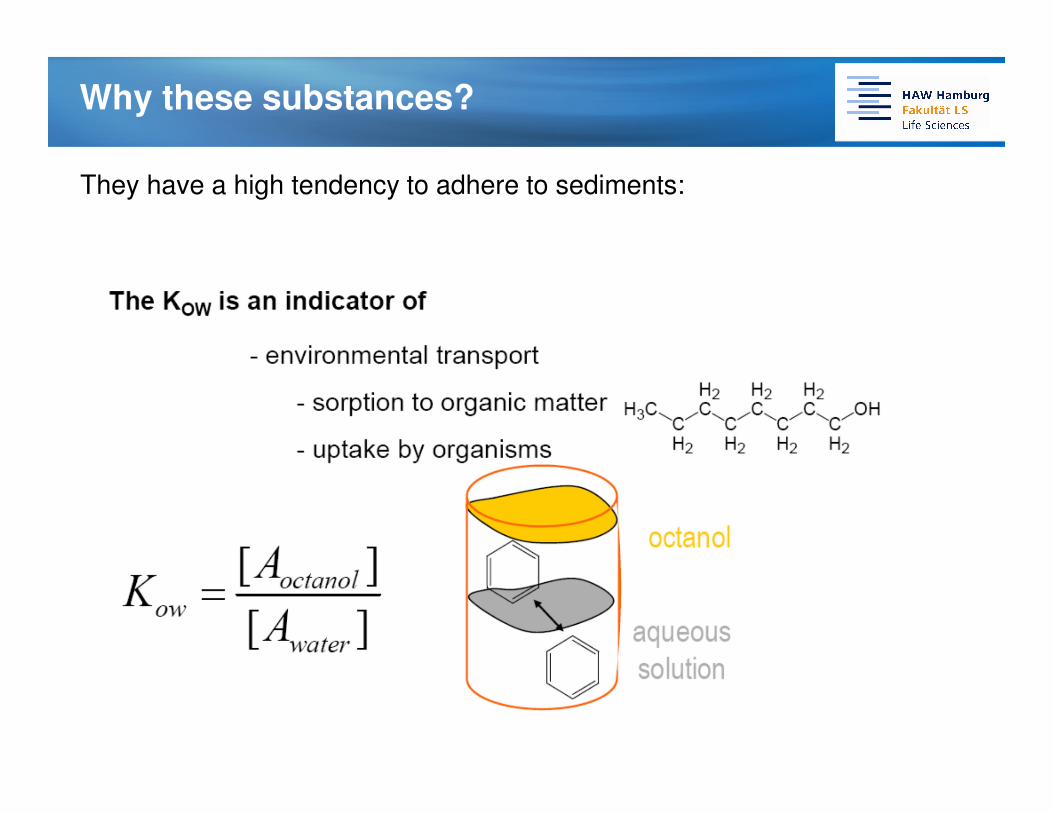
Why these substances?
They have a high tendency to adhere to sediments:

Sorption of organic substances: Kow and Koc
Most important sorbant for organic contaminants:
Organic material e.g. humic substances, Corg
Partition coefficient Corg/water : Koc
KOC has been empirically correlated to KOW
� KOC = 0,63 * KOW (Karickhoff et al, 1979)
Mostly KOW values are available rather than KOC values.
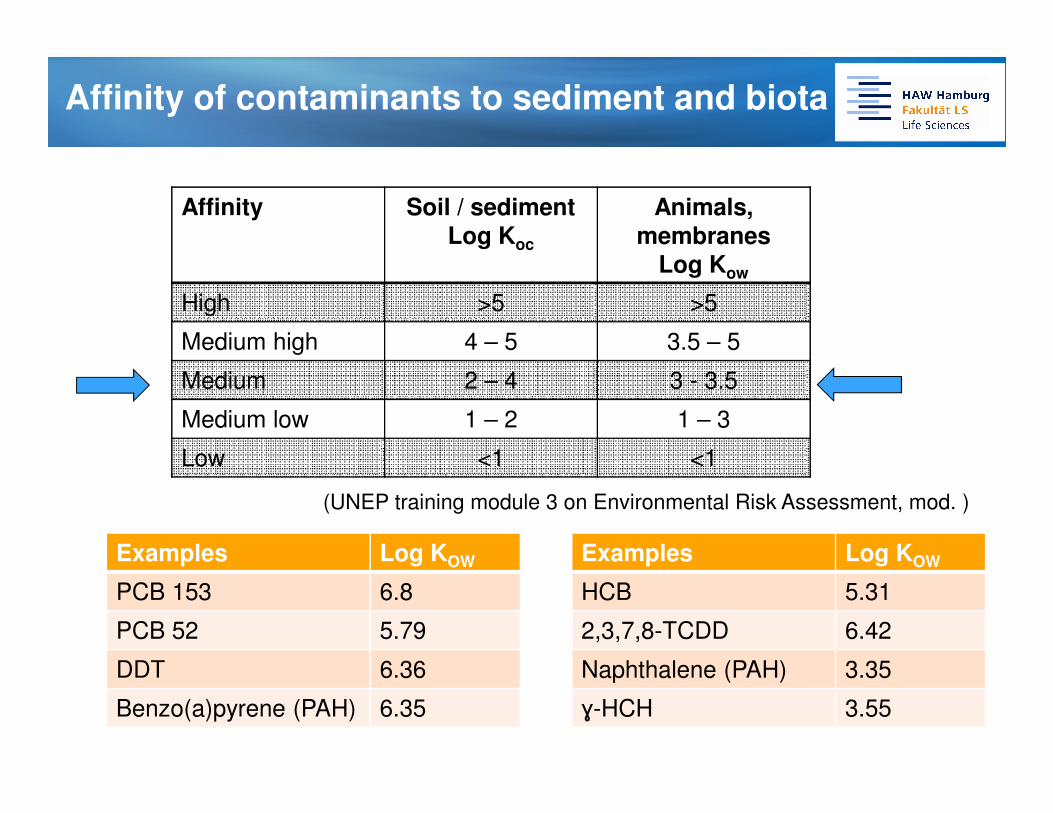
Affinity of contaminants to sediment and biota
Affinity Soil / sedimentLog Koc
Animals, membranes
Log Kow
High >5 >5
Medium high 4 – 5 3.5 – 5
Medium 2 – 4 3 - 3.5
Medium low 1 – 2 1 – 3
Low <1 <1
(UNEP training module 3 on Environmental Risk Assessment, mod. )
Examples Log KOW
PCB 153 6.8
PCB 52 5.79
DDT 6.36
Benzo(a)pyrene (PAH) 6.35
Examples Log KOW
HCB 5.31
2,3,7,8-TCDD 6.42
Naphthalene (PAH) 3.35
ɣ-HCH 3.55

Contaminant cocktails in sediments
-100 0 100 200 300 400
Arsen <20 µm
Blei <20 µm
Cadmium <20 µm
Chrom <20 µm
Kupfer <20 µm
Nickel <20 µm
Quecksilber <20 µm
Zink <20 µm
PCB 28
PCB 52
PCB 101
PCB 118
PCB 138
PCB 153
PCB 180
alpha-HCH
beta-HCH
gamma-HCH
delta-HCH
epsilon-HCH
o,p'-DDE
p,p'-DDE
o,p'-DDD
p,p'-DDD
o,p'-DDT
p,p'-DDT
Hexachlorbenzol
Tributylzinn
Co
nta
min
an
ts
% of Target Value
Parkhafen
Bullenhausen
542%
434%1737%
973%
415%
Exceedance of target valueMost contaminants come from upstream!
Exception: TBT T B T c o n c e n tra t io n in th e N o r th e rn E lb e
0
2 0 0 0
4 0 0 0
6 0 0 0
8 0 0 0
1 0 0 0 0
Auß
eneste
Park
hafen
Reih
erst.
Nord
Baake
nhafen
Bulle
nhausen
µg
/kg
dry
matt
er
1 9 9 5
1 9 9 6
1 9 9 7
1 9 9 8
1 9 9 9
2 0 0 0
2 0 0 1
2 0 0 2
2 0 0 3
2 0 0 4
(Heise et al. 2006)

Development of contamination of SPM along the Elbe catchment
Exceedance of target level for the protection of the aquatic community (SPM, 2000-2006)
(Heise et al. 2008)

Sediments as the memory of industrial history
Many European Rivers: historic contamination by miningand industrial emissions. Recent emission fromresuspension of contaminated soiland sediments

Sediments as the memory of industrial history
Every persistent substance everproduced will sooneror later end up in sediments

BUT: How many substances are out there?
EINECS – European Inventory of Existing Commercial Chemical Substances: more than 100 200 chemicals that have been recorded as being commercially available between 1971 and 1981. Registered under the Dangerous Substances Directive (67/548/EEC)
Little information on toxicology and ecotoxicology of more than 90% of these substances

We only find what we are looking for ….
Analysis costs per sediment sample:
8 heavy metals (in < 20 µm fraction)
PCB, HCB, PAH, DDT, DDD, DDECa. 250 – 500 €
1 dioxin analysis in sediment (estimation!): 250 – 750 €
Who wants to measure the rest?
Or are we on the safe site and those, that are commonly measured, the most toxic substances?

Emerging Substances (not exclusive)
Nanomaterials – in personal care products, could provide a vector for other substances to move through sedimentPesticides - Although many are water soluble, some may end up and persist in sedimentsPharmaceuticals, like antibiotics, drugs, X-ray contrast media (iopromide, iopamidol)Life-style compounds (e.g. caffeine, nicotine)Products of Personal Care (PPC): Insect repellants, UV filters, fungistatic agents in cosmetics etcIndustrial activities and by-products – breakdown products of known substancesWater-treatment by-productsFlame retardantsSurfactants (PFOS, PFOA) – perfluorinated sulfonates and carboxylic acidsHormones from contraceptives

Detection of emerging substances in water and sediment
USGS Work in Boulder Creek, Boulder Creek, CO
http://www.state.nj.us/dep/wmm/Buxton%20Emerging%20Contaminants%20For%20Posting.pdf

The “Toxic Iceberg”
PROVEN HARM
PARTIALLY
PROVEN
NOT YET RECOGNIZED
FOREVER UNRECOGNIZED
THE TOXIC ICEBERG
“Toxicologists know a great deal about a few chemicals, a little about many, and next to nothing about most.”(Rodricks, JV, 1992: 146)
(slide: Vanderlinden, Toronto Public Health)

Another problem: the bioavailability
Conc. of contaminant in sediment
Effect on organisms
Moderate concentrations are often not correlated with effect.

Why is the effect of sediment bound contaminants particularly difficult to predict?
(NRC, 2003)

Often no correlation between concentration of pollutants and biological effect
(Semple, 2004)
(Reid et al. 2000)
In many cases, there is little correlation between chemically measured concentrations in environmental samples and toxic effect. The bioavailability of substances changes with time, varies with substrate and organisms.

What to do?
�Too many chemicals to measure
�Mostly unknown toxic effects
�Little information on bioavailability
�Often unknown interaction of contaminants (synergic, additive effects?)
Measurement of ecotoxicity of sediments
To determine the impact of chemicals or mixture of chemicals on organisms
with the aim to assess an impact on the environment.
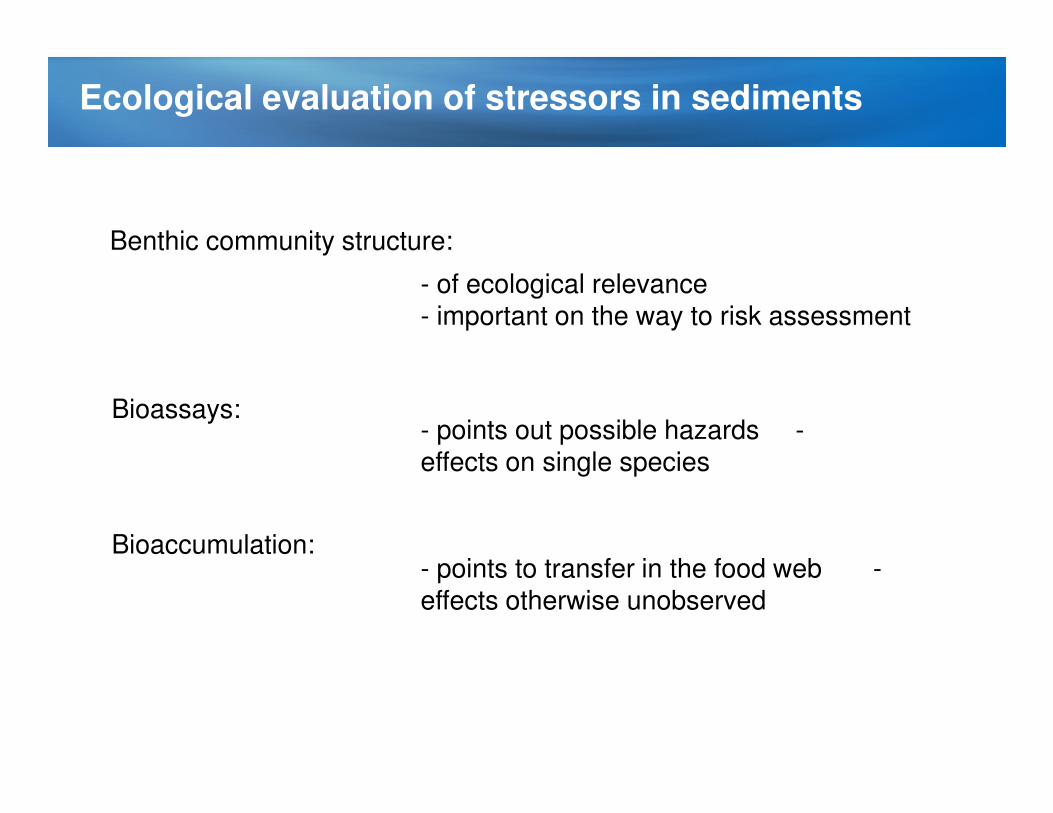
Benthic community structure:
- of ecological relevance- important on the way to risk assessment
Bioassays: - points out possible hazards -effects on single species
Bioaccumulation: - points to transfer in the food web -effects otherwise unobserved
Ecological evaluation of stressors in sediments
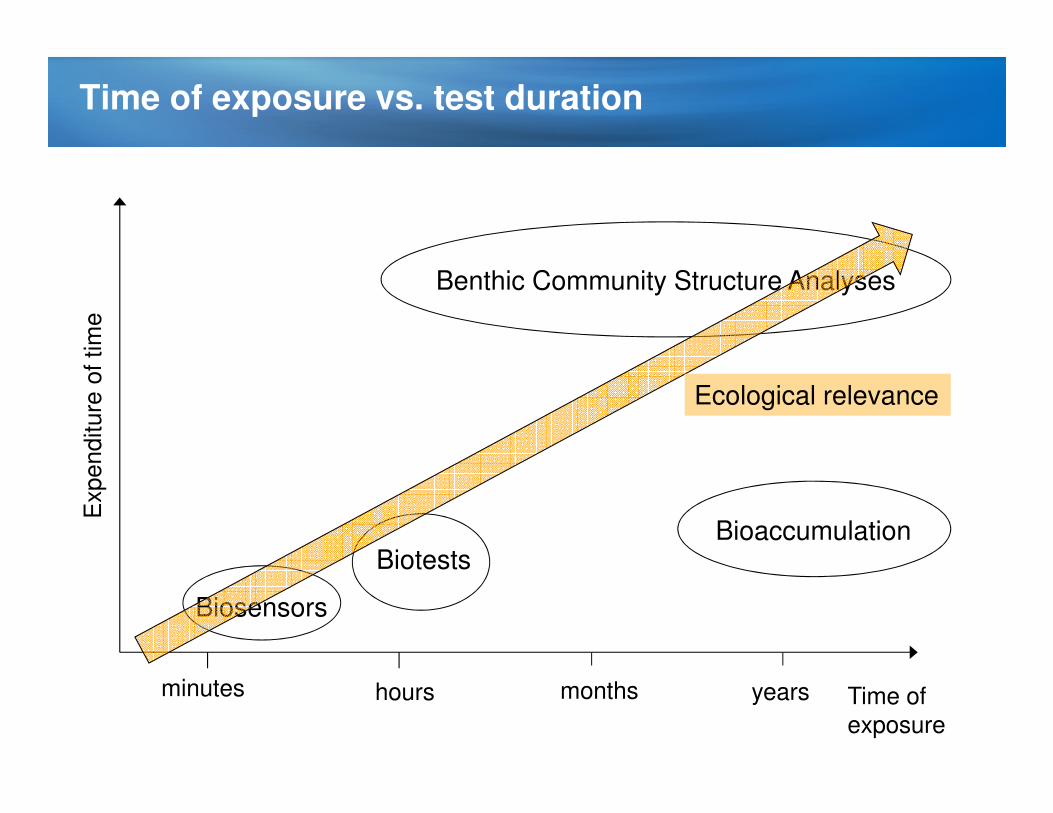
Time of exposure
minutes hours months years
Biosensors
Biotests
Benthic Community Structure Analyses
Bioaccumulation
Expenditure
of tim
eTime of exposure vs. test duration
Ecological relevance

How can ecotoxicological tests inform us
about sediment quality?

Performance of ecotoxicity test
Environmental sample
+ Test organisms
Incubation
„Endpoint“
Optimal growth medium
+ Test organisms
Incubation
„Endpoint“
Comparison
e.g. % inhibition
Endpoints: GrowthMortalityMovementReproductionMetabolic activiy
Biotests withNematodesCrustaceaBacteriaAlgaePlants ……
Environmental sample: WaterSedimentElutriate (water extract)
Standardizations acc. to ISO

Is application of one test enough? NO!
Sediments contain mixtures of contaminants
Different modes of action
Acting by different exposure pathways (water, direct contact etc)
Organisms are differently sensitive
Biotest combinations are necessary in order to detect all (?) potential effects� Often 3, better 5 bioassays� Different exposure pathways� Different sensitivities� Acute and chronic tests.

Biotestbattery
Elutriate and Methanol-extract
Elutriate
Sediment Contact
Pseudokirchneriella subcapitata
Green algae
Bacillus cereus
Sediment bacteria
Caenorhabditis elegans
Nematodes
Vibrio fischeri
Fluorescing bacteria
Application of a biotest-battery (Example)

Variation of test responses
MaxMin
Median; 75%25%
-150
-100
-50
0
50
100
150
NEMA (L) NEMA (E) AGI LBT (EL) LBT (EX) BCA
Tests and endpoints respond differently to the same environmental stress pattern � classification of results from a battery?
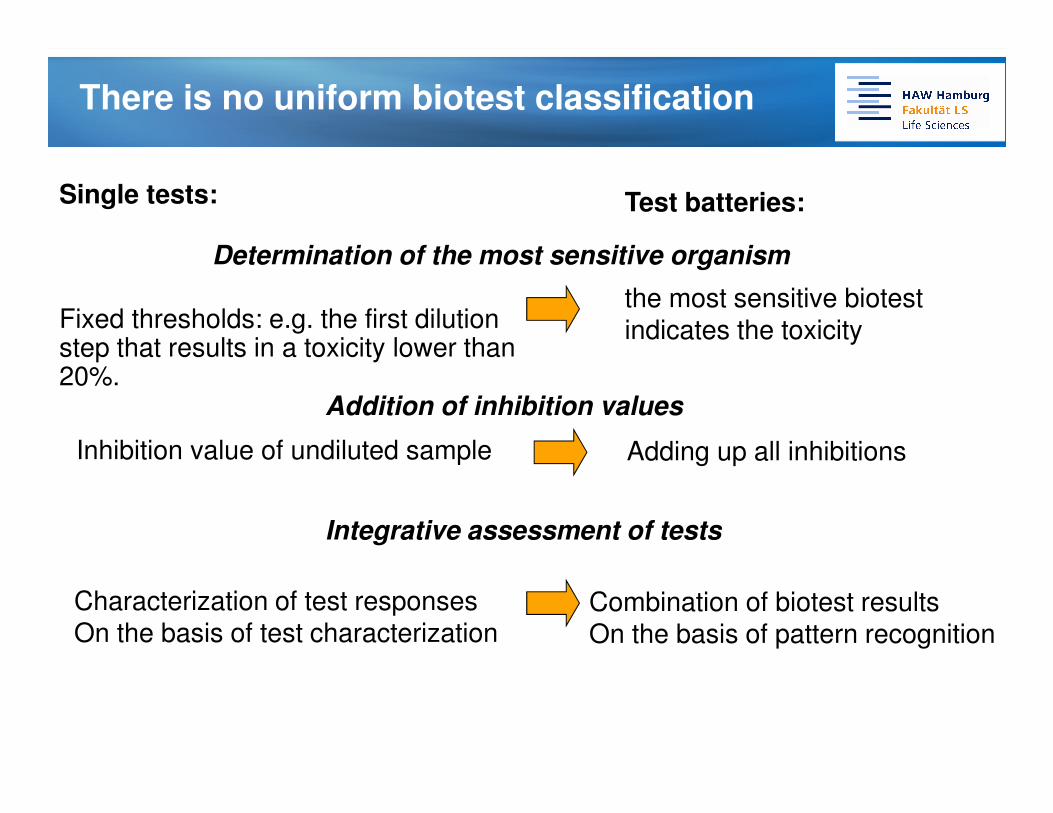
There is no uniform biotest classification
Single tests:
Fixed thresholds: e.g. the first dilution step that results in a toxicity lower than 20%.
Determination of the most sensitive organism
Test batteries:
the most sensitive biotest indicates the toxicity
Addition of inhibition values
Inhibition value of undiluted sample Adding up all inhibitions
Integrative assessment of tests
Characterization of test responsesOn the basis of test characterization
Combination of biotest resultsOn the basis of pattern recognition

Goal-oriented
e.g. -Monitoring
-Sediment management
Interpretation
depending on issues
BiotestbatterieGrünalgen
Bodenbakterien
Leuchtbakterien
0
50
100
150
200
250
absolute toxicities
Detection of patterns
Evaluation of Ecotoxicological Data
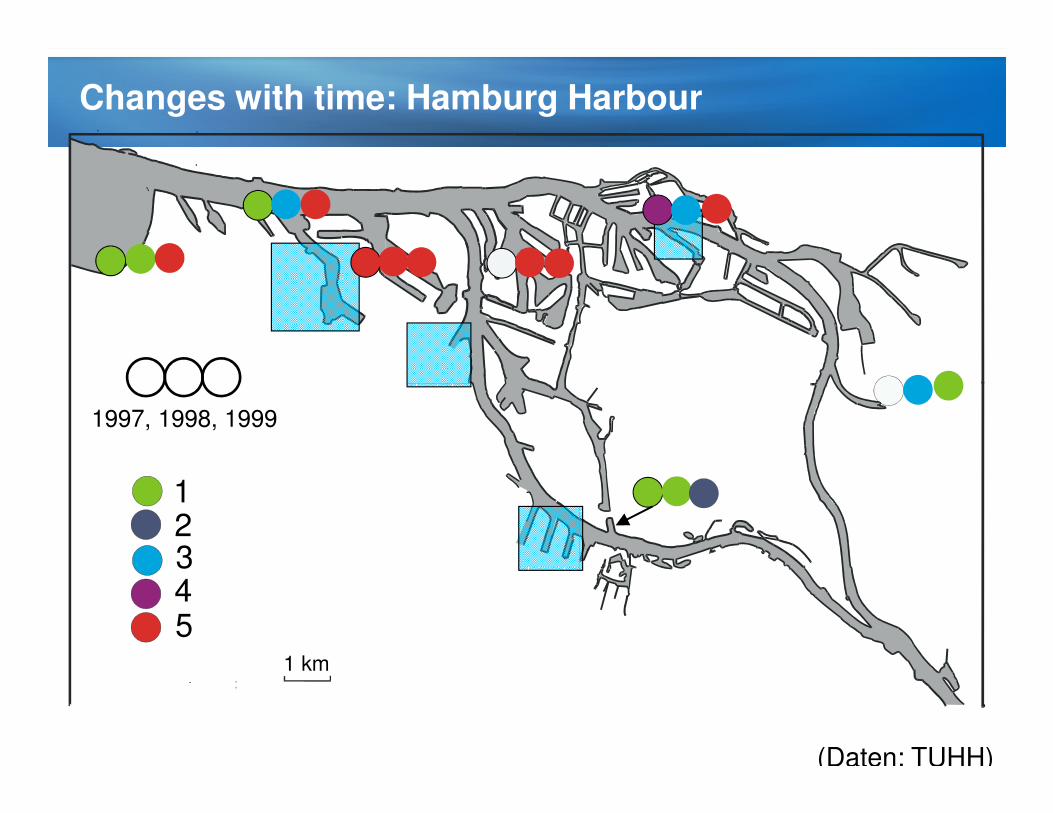
1 km
12
45
3
1997, 1998, 1999
(Daten: TUHH)
Changes with time: Hamburg Harbour
Biotests
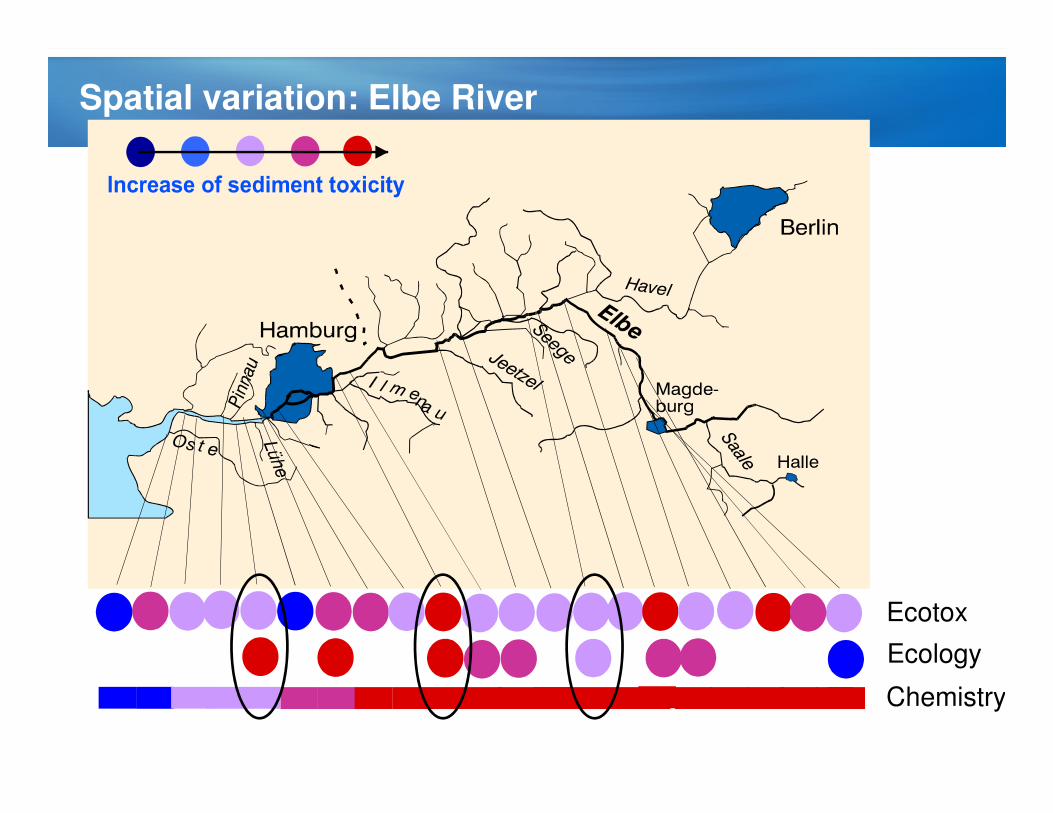
Spatial variation: Elbe River
Ecotox
Ecology
Chemistry

Case Site
Hamburg
Sampling stations
Neufeld
Effects of the events
e.g. Elbe-flood 2002 on
brackish mudflats?
Elutriate and
methanol extract
Solid
phase

öko toxikologie
53°50' 53°50'
53°52' 53°52'
53°54' 53°54'
53°56' 53°56'
8°40'
8°40'
8°45'
8°45'
8°50'
8°50'
8°55'
8°55'
9°0'
9°0'
9°5'
9°5'
12345
6
7
8 9
101112
Positionen der GKSS-Proben
Scale: 1:366554 at Latitude 0°
23/24.8.02
E.g. Impact of the Elbe flood 2002 before the flood

öko toxikologie
53°50' 53°50'
53°52' 53°52'
53°54' 53°54'
53°56' 53°56'
8°40'
8°40'
8°45'
8°45'
8°50'
8°50'
8°55'
8°55'
9°0'
9°0'
9°5'
9°5'
12345
6
7
8 9
101112
Positionen der GKSS-Proben
Scale: 1:366554 at Latitude 0°
after the flood
30.9./2.10.02
E.g. Impact of the Elbe flood 2002
(Heise et al. 2003)

öko toxikologie
53°50' 53°50'
53°52' 53°52'
53°54' 53°54'
53°56' 53°56'
8°40'
8°40'
8°45'
8°45'
8°50'
8°50'
8°55'
8°55'
9°0'
9°0'
9°5'
9°5'
12345
6
7
8 9
101112
Positionen der GKSS-Proben
Scale: 1:366554 at Latitude 0°
Other results?
(Heise et al. 2003)
Ötken et al. 2005: No effects of estuarine sediments after the flood on Chironomus riparius (insecta) and Potamopyrgus antipodarum (gastropoda)
Einsporn et al. (2005): toxic effects in flatfish and mussels after the flood. Flatfish were most affected in the Elbe estuary and near Helgoland. High levels of organic contaminants in fish liver and mussels.
Increased toxicity with algae (elutriate), bacteria and nematodes (sediment)

Lübeck Bight: Dumping site in the 60s
Mecklenburger Bight: Reference station
Lübeck Bight: Assessment of old dumping site/ or „Success of mitigation measures“

Heavy metalsIn ppm
Ni Zn Cu Pb Cd Hg
20
0 p
pm
25
00
0 p
pm
12
50
pp
m
35
pp
m
35
pp
m
20
00
0 p
pm
(Leipe et al. 2002)
Lead and Zn: up to 2 % of the sediment layers 3-18 cm
Sediment depth
surface
20 cm
Chemical Analysis

16-18 cm depth
Contact test, mar
Contact test, fw
Extract test
Elutriate test, mar
Elutriate test, fw
Surface material (low toxicity)
(0-2)
Below surface(4-6)
increasing
Toxicity
Effects measurements: Exposure pathways

Investigation of the contaminated site in detail

10.99°E10.992°E10.994°E10.996°E10.998°E 11°E
.072°N
.074°N
.076°N
.078°N
4.08°N
.082°N
Oce
anD
ata
Vie
w
256760
256720
256750
256740
256730
Surface sediment
4-6 cm depth
increasingToxicity
Dumping of „clean“ material in the regionas a capping measure

Disadvantage of „only“ biotests
Lack of knowledge on relevant stressors!
No source control!
Transferability to other trophical levels / to the ecosystem?
Weight of evidence approaches and tiered approaches are necessary:
Combination of
� in vitro-biotests (on e.g. celluar level): � modes of action, fingerprinting
� In vivo biotests � exposure pathways, bioavailability
� Ecological community modelling � from organism level to populationlevel
� and TIE – Toxicity Idenfitication Profiling
are necessary for an efficient environmental assessment.

Risk Assessment: Application of a Sediment Triad
As Cd Cr Pb Cu Hg Ni Zn0
20
40
60
80
0
100
200
300
400
500
600
700
800
900
1000
co
nc (
As,
Cd
, C
r, P
b,
Cu
, H
g,
Ni)
in
mg
/kg
co
nc (Z
n) in
mg
/kg
Chemical Contamination
Effects on the
organisms
Bioaccumulation Potential
Ecosystem analysis
Sediment Quality Criteria
Modelling of BiomagnificationEcosystem analysis(diversity of benthos organisms
Ecotoxicological Test Systems
Acute test Chronic test with Elutriates

Thank you for your attention!
Prof. Dr. Susanne HeiseAquatic EcotoxicologyHAW-Hamburg

Bioconcentration / Biomagnification
Bioconcentration: A process by which there is a net accumulation of a chemical directly from water into aquatic organisms resulting from simultaneous uptake (e.g., by gill or epithelial tissue) and elimination.
Bioaccumulation: accumulation of contaminants in tissue of organisms through any route, including respiration, ingestion, or direct contact with contaminated water, sediment, pore water, or dredged material.
Biomagnification: Tissue concentrations of bioaccumulated chemicals increase as the chemical passes up through two or more trophic levels.

(J.D. Buynak, 2011)
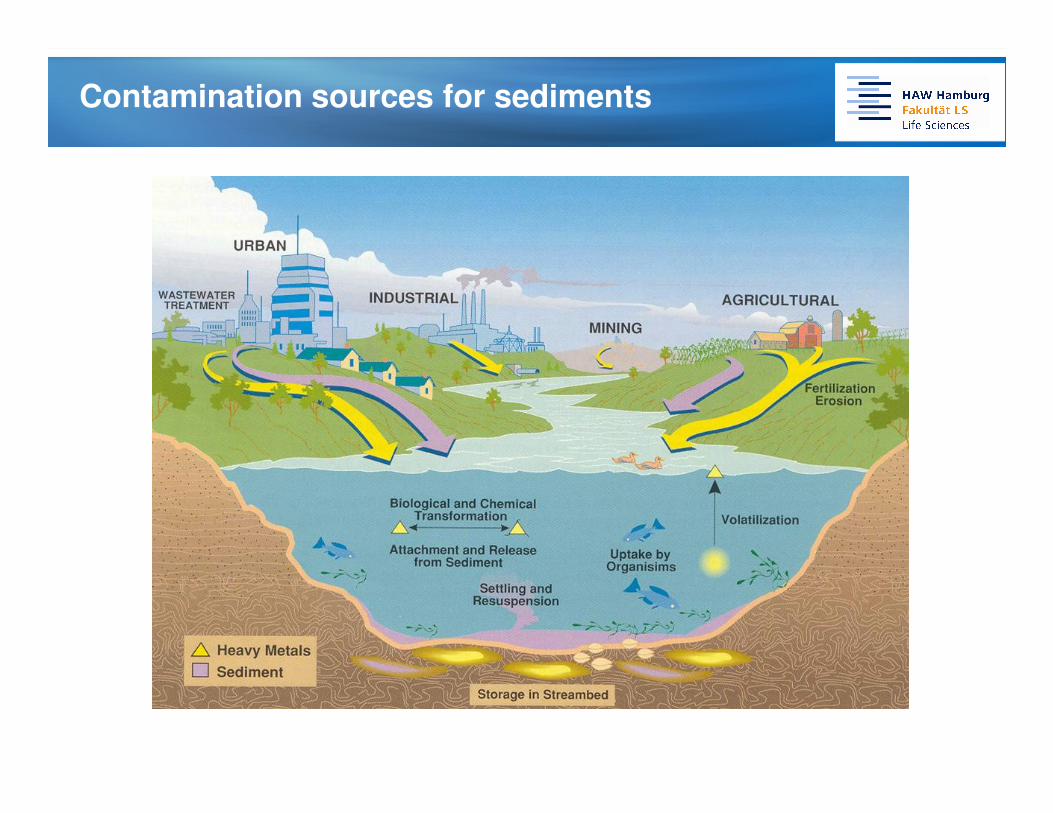
Contamination sources for sediments

Ecotoxicology Versus Toxicology
Toxicology Ecotoxicology
Protection of humans Protection of the ecosystem
Target organism is well known Often, sensitive species are not known
Models using mammals Experiments with / direct studies ofindicator species / test species
Model organisms are homeothermic Many organisms are heterothermic, various physiologies
Exposure can be determined precisely(oral doses)
Identity of stressor, concentration andexposure time theoretically known, availability by various potential exposurepathways often is not.
Basic research: Understanding ofprocesses
Basic research regarding availability, environmental exposure; also empiricalstudies to determine threshold levels forlegislation
Methods are mostly established Many methods are relatively new, oftenbeing in the process of standardization