sedimentation in major saluda-reedy watershed impoundments (became wq-07... · saluda-reedy...
TRANSCRIPT
FINAL REPORT
Sedimentation in Major Saluda-Reedy Watershed Impoundments
Report prepared by Pinnacle Consulting Group
a Division of North Wind, Inc.
Submitted to Saluda-Reedy Watershed Consortium
27 July 2005
This research project was funded by A Grant from the V. Kann Rasmussen Foundation
To Upstate Forever, on behalf of The Saluda-Reedy Watershed Consortium
www.saludareedy.org
Saluda-Reedy Watershed Consortium Sedimentation FINAL REPORT
PINNACLE CONSULTING GROUP, p.1
Project Objectives and Methods Background and Objectives Several impoundments in the Saluda-Reedy Watershed (SRW) have experienced significant rates of sedimentation over their lifespan. The Saluda-Reedy Watershed Consortium (SRWC) tasked the Pinnacle Consulting Group – A Division of North Wind, Inc. (Pinnacle) to study the rate of sedimentation on several major impoundments in the SRW. Pinnacle approached this task with the use of a Geographic Information System (GIS), historic aerial imagery, and any available preexisting sedimentation surveys. Methodology Historic aerial photographs depicting as close to “as built” and current conditions were obtained from a variety of sources. In some instances historic aerial photographs were available within a few years of an impoundment’s construction date. In a few instances historic aerial images were not available within this close time span and therefore rates of sedimentation are documented between available aerial imagery dates.
Aerial photographs were rectified in a GIS and surface areas were calculated for the studied impoundments. To take fluctuating water levels into account, an impoundment’s shoreline was delineated as the point where vegetation ended due to water influence. Thus, areas that had recently accreted sediment above waterline, but were not yet supporting vegetation were not assumed to be shoreline. Rather, the accreted, non-
vegetated sediment areas were accounted for separately.
This methodology produces areas (in acres) that represent accreted and vegetated sediment as seen between available aerial imagery dates. These figures were merged with any preexisting sediment surveys, and also took into account the effect of these accretion areas and rates on changes in bathymetry in submerged areas. These changes were then converted to volumes, as appropriate, to produce a figure that represents an estimate of total sediment delivered to an impoundment, or an area of an impoundment, since construction. Impoundments Surveyed Using this methodology, the following impoundments were surveyed: Lake Greenwood, Poinsett Reservoir, Table Rock Reservoir, Lake Conestee, Saluda Lake, Boyd Mill Pond, Lake Rabon, Tumblin Shoals and Ware Shoals.
Due to the availability of historic imagery, previously completed sediment surveys, and the compatibility of these data sources, differing amounts of analysis were completed on each impoundment. Historic Land Uses
Historic land uses in the rural areas of the SRW have included extensive row crop agriculture. This land use was a prominent feature on the landscape in the early 20th century and into the 40’s and 50’s, but giving way since the 60’s to a landscape dominated by mixed forest cover. In the upper portion of the watershed, particularly
Saluda-Reedy Watershed Consortium Sedimentation FINAL REPORT
PINNACLE CONSULTING GROUP, p.2
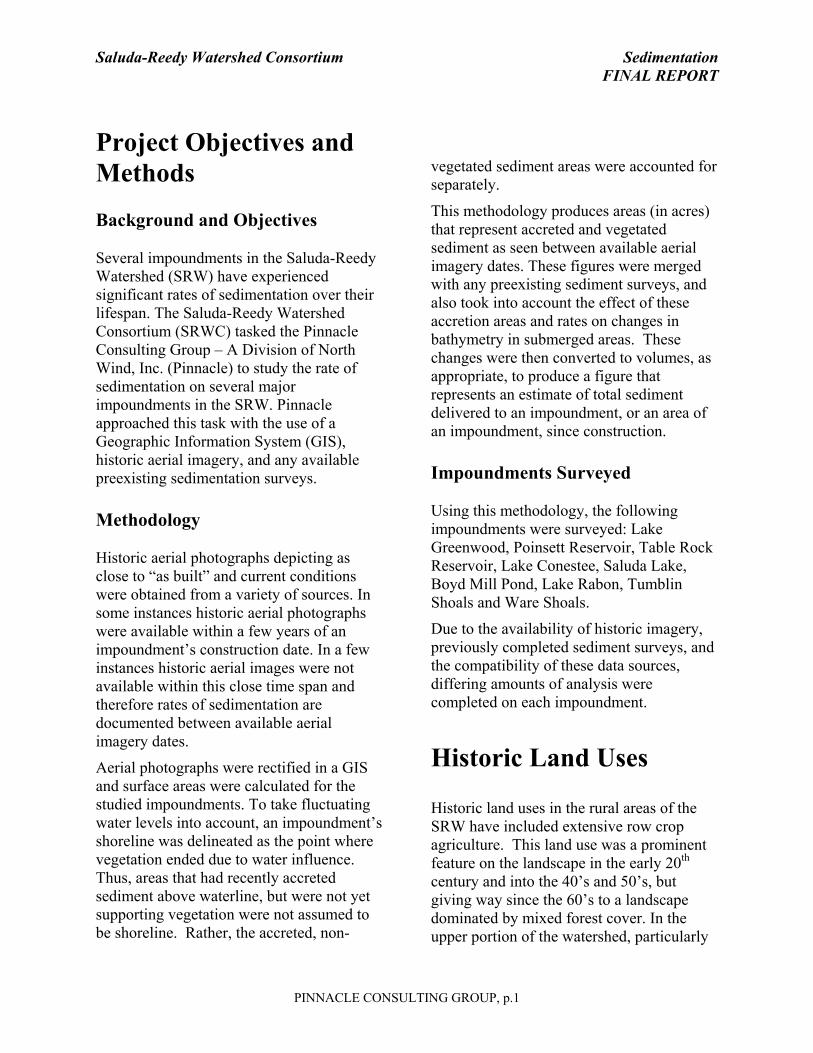
in the Reedy River subwatershed, the rural landscape has been rapidly converted to urban and suburban land uses.
In both rural and urban areas, poor conservation practices have resulted in sediment being delivered to area streams and lakes at an accelerated rate. Much of this sediment ends up in impoundments in the watershed. (See Photographs One-Eight for examples of sediment sources in the SRW).
As sediment from upstream sources has accumulated in impoundments, once flooded areas have now become vegetated land. In adjacent areas of these impoundments, accumulating sediment has made the waters progressively shallower, reducing access and benefits to wildlife and people.
Photograph One: Agricultural Sediment Source in Rural Northern SRW
Photograph Two: Urban Sediment Source and Poor Conservation Practices in Urban Greenville
Photograph Three: Mass Grading north of Greenville
Photograph Four: Residential Encroachment in Urbanizing SRW
Photograph Five: Stream Scour in Urban Greenville

Saluda-Reedy Watershed Consortium Sedimentation FINAL REPORT
PINNACLE CONSULTING GROUP, p.3
Photograph Six: Wetland Destruction near Greenville
Photograph Seven: Infrastructure Expansion in Urban Greenville
Photograph Eight: Sediment-Laden Urban Runoff in Cleveland Park, Greenville
Lake Greenwood Lake Greenwood was constructed in 1940 on the Saluda River near the town of
Greenwood in Greenwood County, South Carolina. The lake currently has a surface area of approximately 11,400 acres and receives runoff from a watershed of 1,165 square miles (745,600 acres) situated in the Upper Piedmont.
The Buzzard’s Roost Dam at Lake Greenwood is an operating Federal Energy Regulatory Commission (FERC) licensed hydroelectric facility. This lake is a significant recreational resource for west-central South Carolina. Lake Greenwood is the sole drinking water supply source for the City of Greenwood and much of Greenwood County. Therefore, water quality is of great concern to local residents and officials.
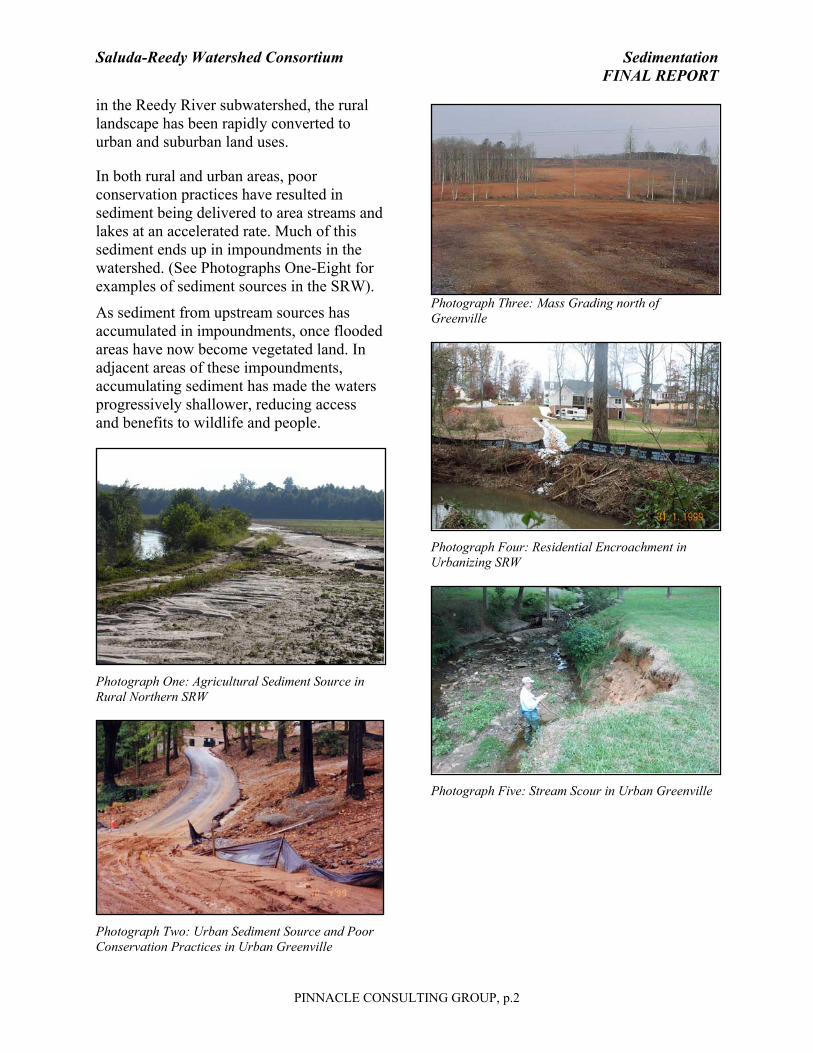
This study focused only on the upper reaches of Lake Greenwood, in the area where major tributary streams enter the lake (See Figure 1). This area comprises about seven percent of the lake. The study was performed in two phases. The Natural Resource Conservation Service (NRCS) conducted a survey via boat to assess how much sediment had accreted below waterline (elevation 439 feet msl) relative to the original bathymetry of the lake. This survey initially attempted to utilize Ground Penetrating Radar techniques but sediment characteristics were not conducive to radar wavelength transmission. As an alternative direct probing was used to identify the interface between native soils and accreted sediments. Figure 2 presents an example of a surveyed cross-section.
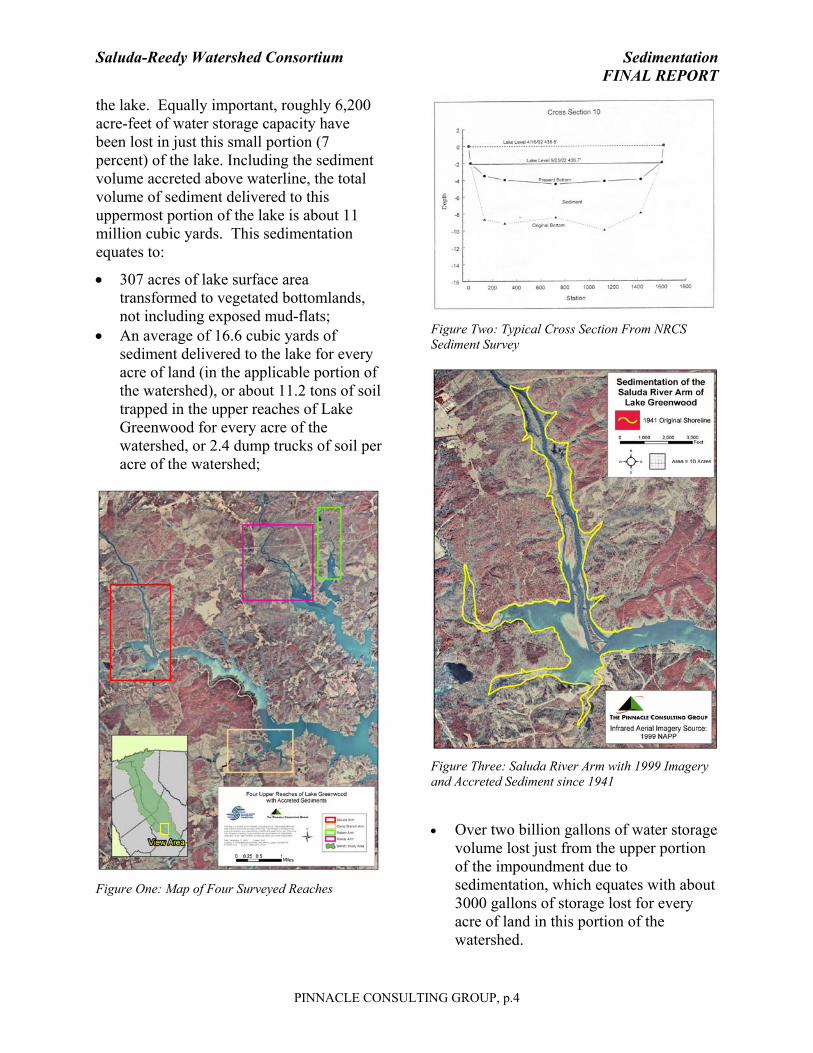
Pinnacle used GIS techniques to examine areas not accessible by boat, including areas where sediment had accreted above the waterline. This study has shown that in the upper seven percent of Lake Greenwood, approximately 307 acres of water area have disappeared and an equal area of “new land” has developed as a result of sediment accumulation. Figures 3-5 present views of accreted sediment in surveyed portions of
Saluda-Reedy Watershed Consortium Sedimentation FINAL REPORT
PINNACLE CONSULTING GROUP, p.4
the lake. Equally important, roughly 6,200 acre-feet of water storage capacity have been lost in just this small portion (7 percent) of the lake. Including the sediment volume accreted above waterline, the total volume of sediment delivered to this uppermost portion of the lake is about 11 million cubic yards. This sedimentation equates to:
• 307 acres of lake surface area transformed to vegetated bottomlands, not including exposed mud-flats;
• An average of 16.6 cubic yards of sediment delivered to the lake for every acre of land (in the applicable portion of the watershed), or about 11.2 tons of soil trapped in the upper reaches of Lake Greenwood for every acre of the watershed, or 2.4 dump trucks of soil per acre of the watershed;
Figure One: Map of Four Surveyed Reaches
Figure Two: Typical Cross Section From NRCS Sediment Survey
Figure Three: Saluda River Arm with 1999 Imagery and Accreted Sediment since 1941
• Over two billion gallons of water storage volume lost just from the upper portion of the impoundment due to sedimentation, which equates with about 3000 gallons of storage lost for every acre of land in this portion of the watershed.
Saluda-Reedy Watershed Consortium Sedimentation FINAL REPORT
PINNACLE CONSULTING GROUP, p.5
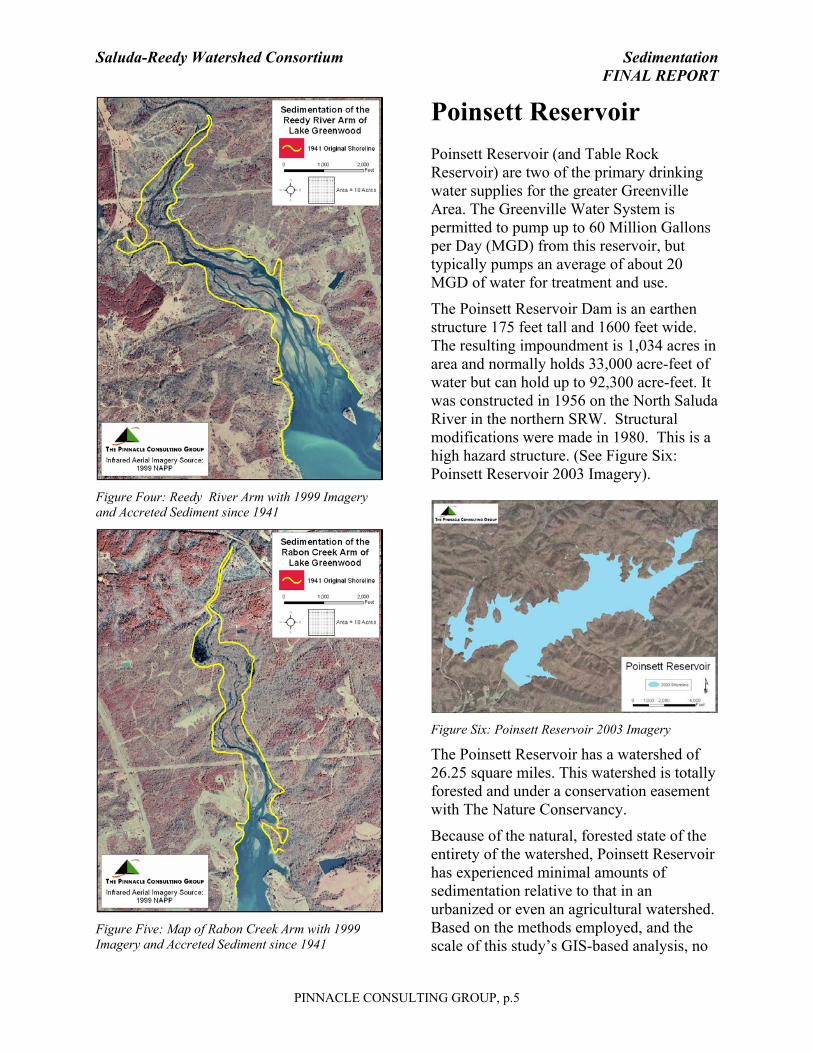
Figure Four: Reedy River Arm with 1999 Imagery and Accreted Sediment since 1941
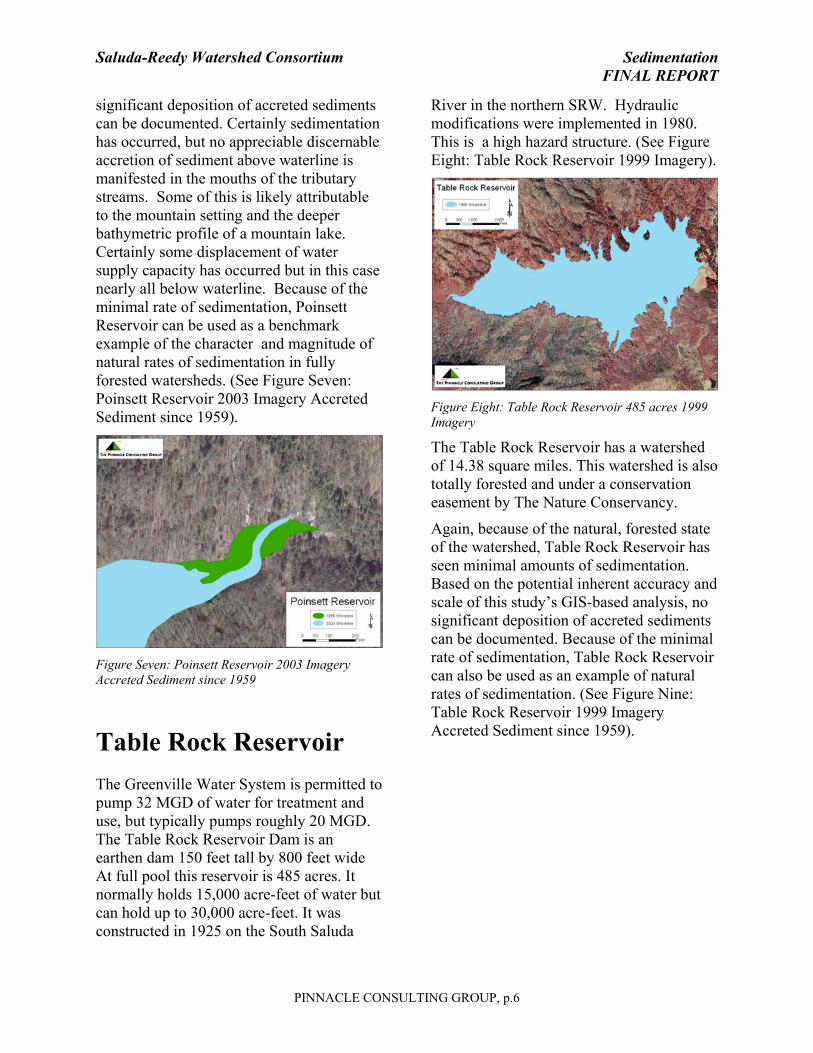
Figure Five: Map of Rabon Creek Arm with 1999 Imagery and Accreted Sediment since 1941
Poinsett Reservoir Poinsett Reservoir (and Table Rock Reservoir) are two of the primary drinking water supplies for the greater Greenville Area. The Greenville Water System is permitted to pump up to 60 Million Gallons per Day (MGD) from this reservoir, but typically pumps an average of about 20 MGD of water for treatment and use.
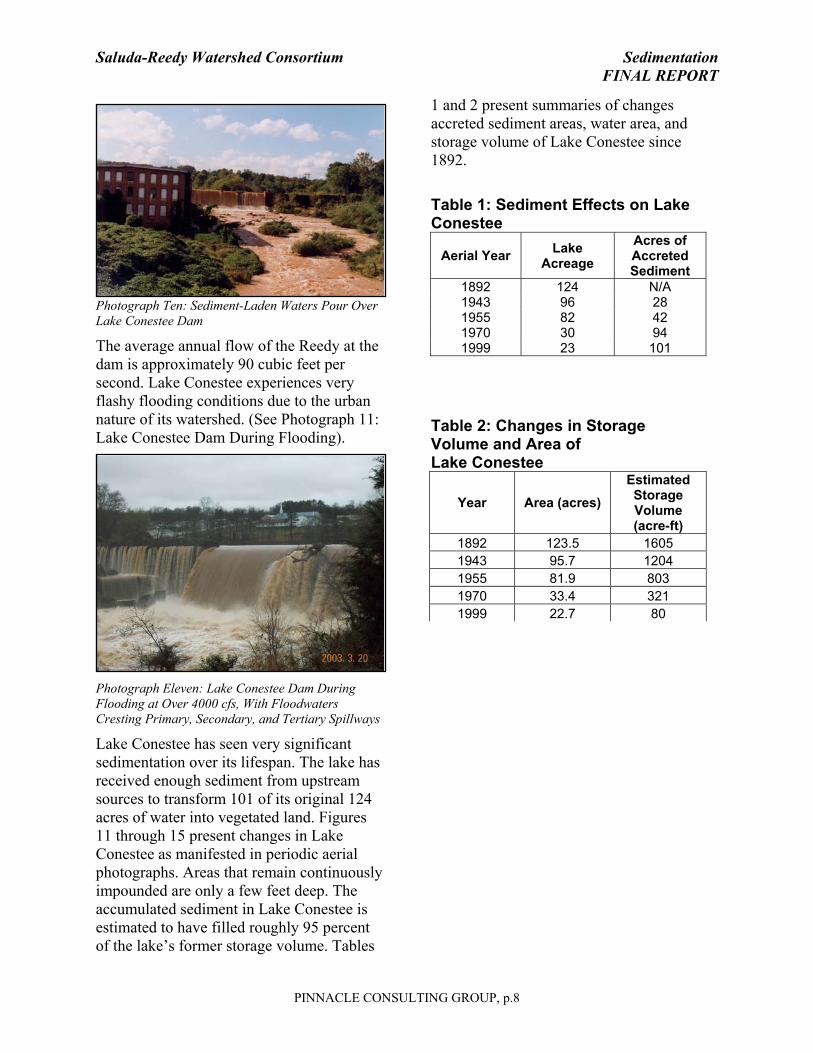
The Poinsett Reservoir Dam is an earthen structure 175 feet tall and 1600 feet wide. The resulting impoundment is 1,034 acres in area and normally holds 33,000 acre-feet of water but can hold up to 92,300 acre-feet. It was constructed in 1956 on the North Saluda River in the northern SRW. Structural modifications were made in 1980. This is a high hazard structure. (See Figure Six: Poinsett Reservoir 2003 Imagery).
Figure Six: Poinsett Reservoir 2003 Imagery
The Poinsett Reservoir has a watershed of 26.25 square miles. This watershed is totally forested and under a conservation easement with The Nature Conservancy.
Because of the natural, forested state of the entirety of the watershed, Poinsett Reservoir has experienced minimal amounts of sedimentation relative to that in an urbanized or even an agricultural watershed. Based on the methods employed, and the scale of this study’s GIS-based analysis, no
Saluda-Reedy Watershed Consortium Sedimentation FINAL REPORT
PINNACLE CONSULTING GROUP, p.6
significant deposition of accreted sediments can be documented. Certainly sedimentation has occurred, but no appreciable discernable accretion of sediment above waterline is manifested in the mouths of the tributary streams. Some of this is likely attributable to the mountain setting and the deeper bathymetric profile of a mountain lake. Certainly some displacement of water supply capacity has occurred but in this case nearly all below waterline. Because of the minimal rate of sedimentation, Poinsett Reservoir can be used as a benchmark example of the character and magnitude of natural rates of sedimentation in fully forested watersheds. (See Figure Seven: Poinsett Reservoir 2003 Imagery Accreted Sediment since 1959).
Figure Seven: Poinsett Reservoir 2003 Imagery Accreted Sediment since 1959
Table Rock Reservoir The Greenville Water System is permitted to pump 32 MGD of water for treatment and use, but typically pumps roughly 20 MGD. The Table Rock Reservoir Dam is an earthen dam 150 feet tall by 800 feet wide At full pool this reservoir is 485 acres. It normally holds 15,000 acre-feet of water but can hold up to 30,000 acre-feet. It was constructed in 1925 on the South Saluda
River in the northern SRW. Hydraulic modifications were implemented in 1980. This is a high hazard structure. (See Figure Eight: Table Rock Reservoir 1999 Imagery).
Figure Eight: Table Rock Reservoir 485 acres 1999 Imagery
The Table Rock Reservoir has a watershed of 14.38 square miles. This watershed is also totally forested and under a conservation easement by The Nature Conservancy.
Again, because of the natural, forested state of the watershed, Table Rock Reservoir has seen minimal amounts of sedimentation. Based on the potential inherent accuracy and scale of this study’s GIS-based analysis, no significant deposition of accreted sediments can be documented. Because of the minimal rate of sedimentation, Table Rock Reservoir can also be used as an example of natural rates of sedimentation. (See Figure Nine: Table Rock Reservoir 1999 Imagery Accreted Sediment since 1959).

Saluda-Reedy Watershed Consortium Sedimentation FINAL REPORT
PINNACLE CONSULTING GROUP, p.7
Figure Nine: Table Rock Reservoir 1999 Imagery and Accreted Sediment Since 1959 Lake Conestee Lake Conestee is a former mill pond located on the Reedy River, six miles south of Greenville. This historic lake dates back to at least the 1830’s. The present dam was constructed in 1892 and is a classic stone-masonry structure of that period. In its current configuration this dam is 28 feet tall, and 575 feet long. It is believed to have withstood the flood of record of August 1908, with limited damages, although this storm destroyed most bridges and structures in the region. (See Photograph Nine: Lake Conestee Dam).
Photograph Nine: Lake Conestee Dam
The Reedy River watershed above Lake Conestee is approximately 65 square miles
(41,600 acres), and includes about 85 percent of the City of Greenville. (See Figure 10: Lake Conestee Watershed).
Figure 10: Lake Conestee Watershed
Lake Conestee’s watershed is very urbanized and is continuing to see increasing urbanization. This urban expansion and poor conservation practices have led to an accelerated rate of sediment delivery. (See Photograph Ten: Sediment Delivered to Lake Conestee).
Saluda-Reedy Watershed Consortium Sedimentation FINAL REPORT
PINNACLE CONSULTING GROUP, p.8
Photograph Ten: Sediment-Laden Waters Pour Over Lake Conestee Dam
The average annual flow of the Reedy at the dam is approximately 90 cubic feet per second. Lake Conestee experiences very flashy flooding conditions due to the urban nature of its watershed. (See Photograph 11: Lake Conestee Dam During Flooding).
Photograph Eleven: Lake Conestee Dam During Flooding at Over 4000 cfs, With Floodwaters Cresting Primary, Secondary, and Tertiary Spillways
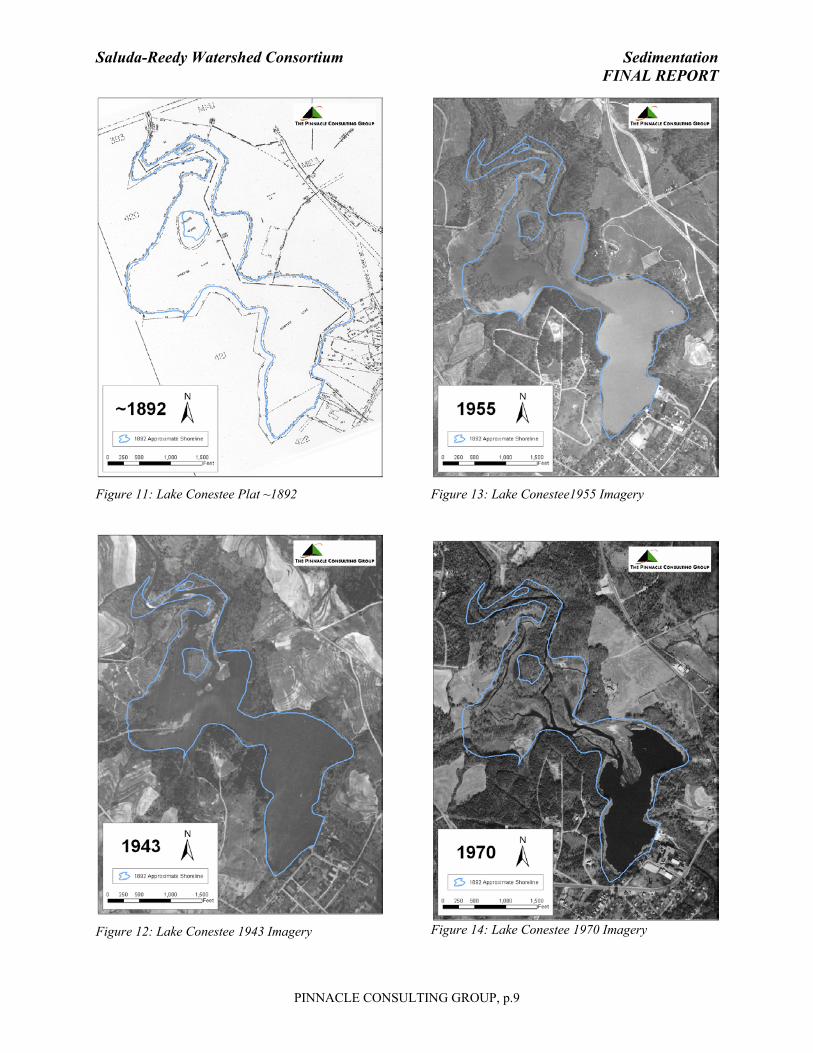
Lake Conestee has seen very significant sedimentation over its lifespan. The lake has received enough sediment from upstream sources to transform 101 of its original 124 acres of water into vegetated land. Figures 11 through 15 present changes in Lake Conestee as manifested in periodic aerial photographs. Areas that remain continuously impounded are only a few feet deep. The accumulated sediment in Lake Conestee is estimated to have filled roughly 95 percent of the lake’s former storage volume. Tables
1 and 2 present summaries of changes accreted sediment areas, water area, and storage volume of Lake Conestee since 1892.
Table 1: Sediment Effects on Lake Conestee
Aerial Year Lake Acreage
Acres of Accreted Sediment
1892 124 N/A 1943 96 28 1955 82 42 1970 30 94 1999 23 101
Table 2: Changes in Storage Volume and Area of Lake Conestee
Year Area (acres) Estimated Storage Volume (acre-ft)
1892 123.5 1605 1943 95.7 1204 1955 81.9 803 1970 33.4 321 1999 22.7 80
Saluda-Reedy Watershed Consortium Sedimentation FINAL REPORT
PINNACLE CONSULTING GROUP, p.9
Figure 11: Lake Conestee Plat ~1892
Figure 12: Lake Conestee 1943 Imagery
Figure 13: Lake Conestee1955 Imagery
Figure 14: Lake Conestee 1970 Imagery
Saluda-Reedy Watershed Consortium Sedimentation FINAL REPORT
PINNACLE CONSULTING GROUP, p.10
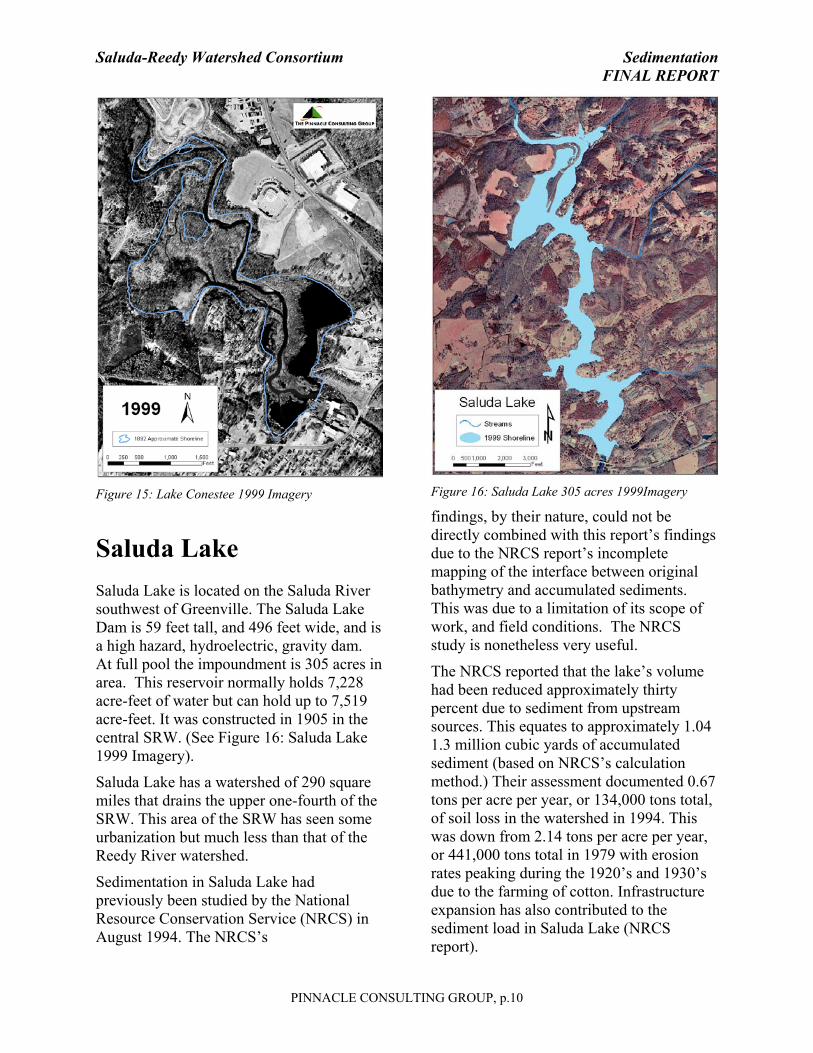
Figure 15: Lake Conestee 1999 Imagery Saluda Lake Saluda Lake is located on the Saluda River southwest of Greenville. The Saluda Lake Dam is 59 feet tall, and 496 feet wide, and is a high hazard, hydroelectric, gravity dam. At full pool the impoundment is 305 acres in area. This reservoir normally holds 7,228 acre-feet of water but can hold up to 7,519 acre-feet. It was constructed in 1905 in the central SRW. (See Figure 16: Saluda Lake 1999 Imagery).
Saluda Lake has a watershed of 290 square miles that drains the upper one-fourth of the SRW. This area of the SRW has seen some urbanization but much less than that of the Reedy River watershed.
Sedimentation in Saluda Lake had previously been studied by the National Resource Conservation Service (NRCS) in August 1994. The NRCS’s
Figure 16: Saluda Lake 305 acres 1999Imagery findings, by their nature, could not be directly combined with this report’s findings due to the NRCS report’s incomplete mapping of the interface between original bathymetry and accumulated sediments. This was due to a limitation of its scope of work, and field conditions. The NRCS study is nonetheless very useful.
The NRCS reported that the lake’s volume had been reduced approximately thirty percent due to sediment from upstream sources. This equates to approximately 1.04 1.3 million cubic yards of accumulated sediment (based on NRCS’s calculation method.) Their assessment documented 0.67 tons per acre per year, or 134,000 tons total, of soil loss in the watershed in 1994. This was down from 2.14 tons per acre per year, or 441,000 tons total in 1979 with erosion rates peaking during the 1920’s and 1930’s due to the farming of cotton. Infrastructure expansion has also contributed to the sediment load in Saluda Lake (NRCS report).
Saluda-Reedy Watershed Consortium Sedimentation FINAL REPORT
PINNACLE CONSULTING GROUP, p.11
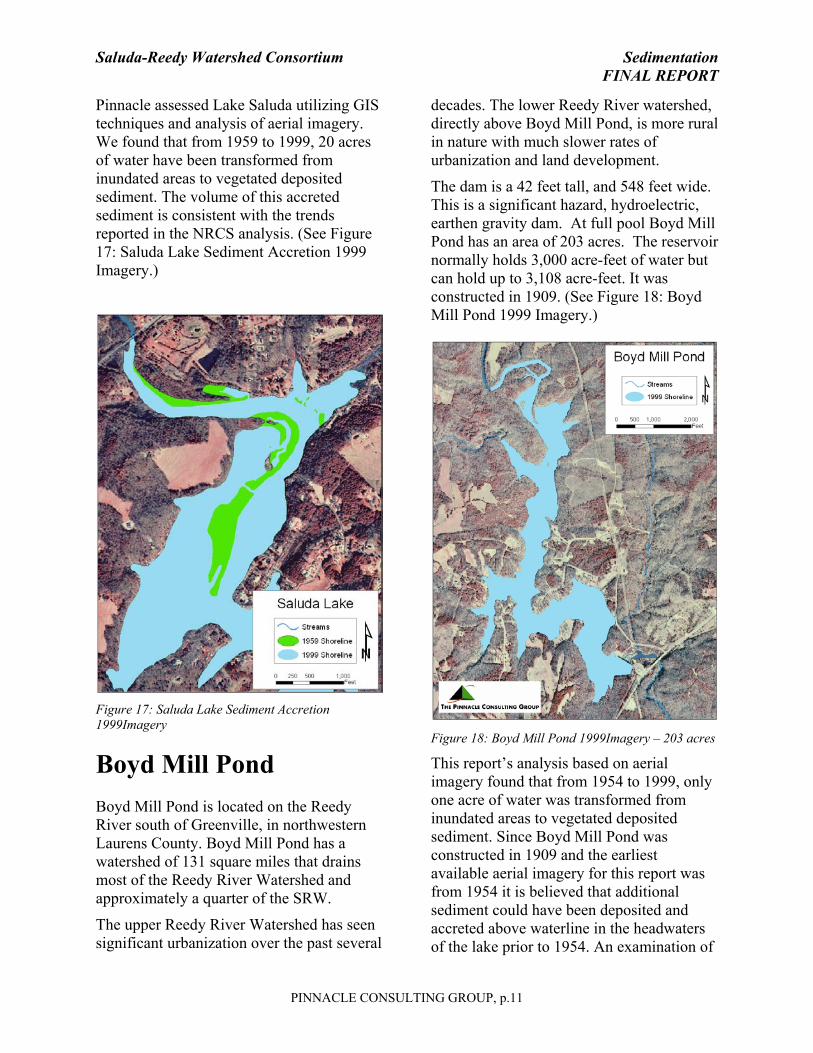
Pinnacle assessed Lake Saluda utilizing GIS techniques and analysis of aerial imagery. We found that from 1959 to 1999, 20 acres of water have been transformed from inundated areas to vegetated deposited sediment. The volume of this accreted sediment is consistent with the trends reported in the NRCS analysis. (See Figure 17: Saluda Lake Sediment Accretion 1999 Imagery.)
Figure 17: Saluda Lake Sediment Accretion 1999Imagery
Boyd Mill Pond Boyd Mill Pond is located on the Reedy River south of Greenville, in northwestern Laurens County. Boyd Mill Pond has a watershed of 131 square miles that drains most of the Reedy River Watershed and approximately a quarter of the SRW.
The upper Reedy River Watershed has seen significant urbanization over the past several
decades. The lower Reedy River watershed, directly above Boyd Mill Pond, is more rural in nature with much slower rates of urbanization and land development.
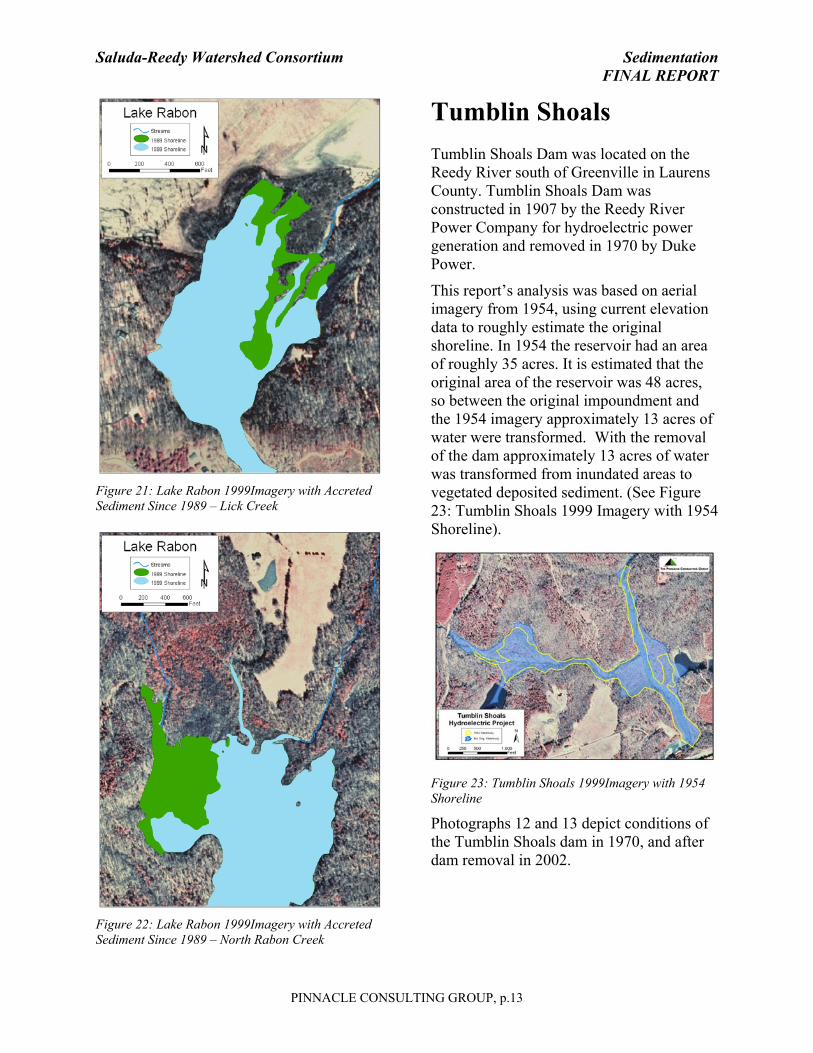
The dam is a 42 feet tall, and 548 feet wide. This is a significant hazard, hydroelectric, earthen gravity dam. At full pool Boyd Mill Pond has an area of 203 acres. The reservoir normally holds 3,000 acre-feet of water but can hold up to 3,108 acre-feet. It was constructed in 1909. (See Figure 18: Boyd Mill Pond 1999 Imagery.)
Figure 18: Boyd Mill Pond 1999Imagery – 203 acres This report’s analysis based on aerial imagery found that from 1954 to 1999, only one acre of water was transformed from inundated areas to vegetated deposited sediment. Since Boyd Mill Pond was constructed in 1909 and the earliest available aerial imagery for this report was from 1954 it is believed that additional sediment could have been deposited and accreted above waterline in the headwaters of the lake prior to 1954. An examination of

Saluda-Reedy Watershed Consortium Sedimentation FINAL REPORT
PINNACLE CONSULTING GROUP, p.12
current and historic aerial images tends to lead to this belief. (See Figure 19: Boyd Mill Pond 1999 Imagery with Accreted Sediment since 1954). We also believe that the ongoing operation of this impoundment as a hydroelectric facility may have resulted in the periodic sluicing out of accumulated sediments in order to maintain flow to the pinstocks feeding the turbines. This management may have had a significant effect on the rates of accumulation of sediment throughout the lake.
Figure 19: Boyd Mill Pond 1999Imagery with Accreted Sediment Since 1959 Lake Rabon Lake Rabon is located on the North Rabon Creek southeast of Greenville in Laurens County. Lake Rabon has a watershed of 70 square miles that drains part of the Rabon Creek Watershed. This area has seen some
urbanization but not to the scale of the upper Reedy River.
The dam is a 58 feet tall and 1500 feet wide. This is a significant hazard, earthen dam. The resulting impoundment has an area of 562 areas. The reservoir normally holds 6,832 acre-feet of water but can hold up to 28,000acre-feet. It was constructed in 1987 in the lower SRW for the purposes of flood control, storm water management, water supply, and recreation. (See Figure 20: Lake Rabon 1999 Imagery).
Figure 20: Lake Rabon 1999 Imagery – 562 acres This report’s analysis based on aerial imagery found that from 1989 to 1999, 16 acres of water was transformed from inundated areas to vegetated deposited sediment. (See Figure 21: Lake Rabon 1999 Imagery with Accreted Sediment since 1989 – Lick Creek and Figure 22: Lake Rabon 1999 Imagery with Accreted Sediment since 1989 – North Rabon Creek).
Saluda-Reedy Watershed Consortium Sedimentation FINAL REPORT
PINNACLE CONSULTING GROUP, p.13
Figure 21: Lake Rabon 1999Imagery with Accreted Sediment Since 1989 – Lick Creek
Figure 22: Lake Rabon 1999Imagery with Accreted Sediment Since 1989 – North Rabon Creek
Tumblin Shoals Tumblin Shoals Dam was located on the Reedy River south of Greenville in Laurens County. Tumblin Shoals Dam was constructed in 1907 by the Reedy River Power Company for hydroelectric power generation and removed in 1970 by Duke Power.
This report’s analysis was based on aerial imagery from 1954, using current elevation data to roughly estimate the original shoreline. In 1954 the reservoir had an area of roughly 35 acres. It is estimated that the original area of the reservoir was 48 acres, so between the original impoundment and the 1954 imagery approximately 13 acres of water were transformed. With the removal of the dam approximately 13 acres of water was transformed from inundated areas to vegetated deposited sediment. (See Figure 23: Tumblin Shoals 1999 Imagery with 1954 Shoreline).
Figure 23: Tumblin Shoals 1999Imagery with 1954 Shoreline
Photographs 12 and 13 depict conditions of the Tumblin Shoals dam in 1970, and after dam removal in 2002.

Saluda-Reedy Watershed Consortium Sedimentation FINAL REPORT
PINNACLE CONSULTING GROUP, p.14
Photograph 12: Tumblin Shoals Hydroelectric Project in 1970
Photograph 13: Tumblin’ Shoals Hydroelectric Project location in 2002
Ware Shoals Ware Shoals Dam is located on the Saluda River south of Greenville near the junction of Laurens, Abbeville, and Greenwood Counties. Ware Shoals has a watershed of 564 square miles that drains the upper two-thirds of the SRW.
The dam is 23 feet tall, 545 feet wide, and is a low hazard, gravity dam. The reservoir was originally roughly 88 acres. This impoundment normally holds 528 acre-feet of water with an unknown maximum capacity. Its construction date is unknown but it saw mechanical modifications in 1939.
It was constructed for hydroelectric power generation. (See Figure 24: Ware Shoals1999 Imagery with Accreted Sediment since 1954).
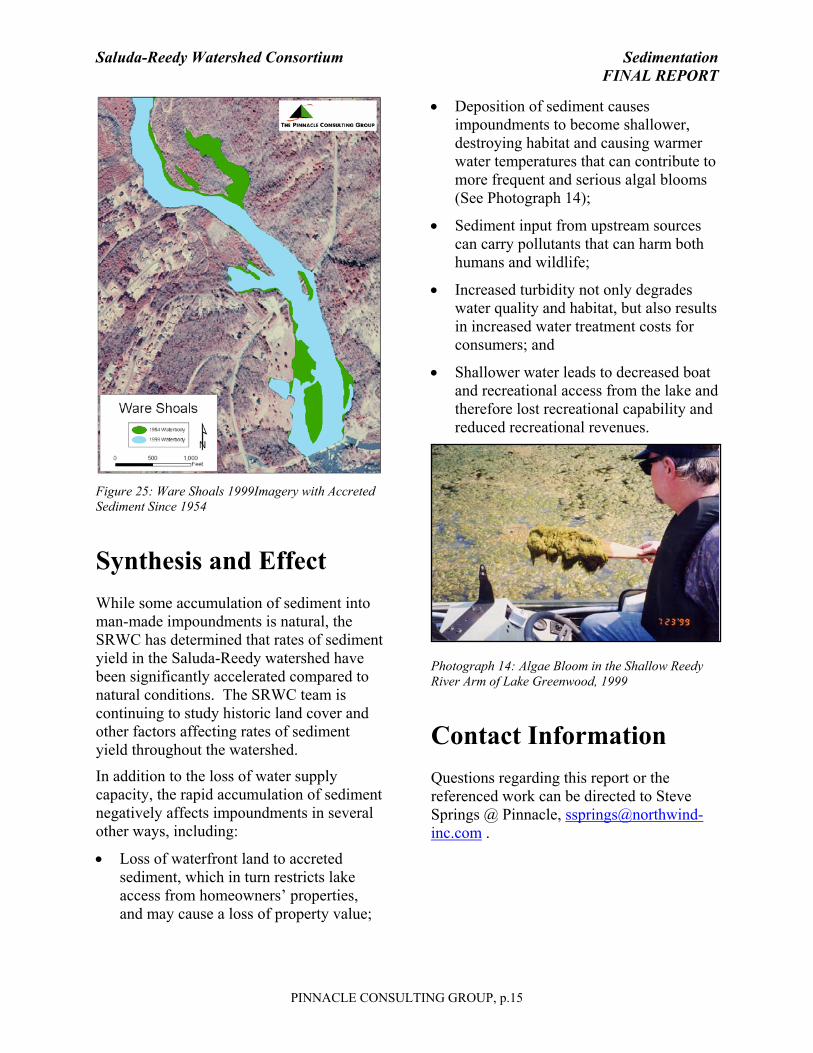
Figure 24: Ware Shoals 1999Imagery with Accreted Sediment since 1954 This report’s analysis based on aerial imagery found that from 1989 to 1999, 14 acres of water was transformed from inundated areas to vegetated deposited sediment. (See Figure 25: Ware Shoals 1999 Imagery with Accreted Sediment Since 1954).
Saluda-Reedy Watershed Consortium Sedimentation FINAL REPORT
PINNACLE CONSULTING GROUP, p.15
Figure 25: Ware Shoals 1999Imagery with Accreted Sediment Since 1954 Synthesis and Effect While some accumulation of sediment into man-made impoundments is natural, the SRWC has determined that rates of sediment yield in the Saluda-Reedy watershed have been significantly accelerated compared to natural conditions. The SRWC team is continuing to study historic land cover and other factors affecting rates of sediment yield throughout the watershed.
In addition to the loss of water supply capacity, the rapid accumulation of sediment negatively affects impoundments in several other ways, including:
• Loss of waterfront land to accreted sediment, which in turn restricts lake access from homeowners’ properties, and may cause a loss of property value;
• Deposition of sediment causes impoundments to become shallower, destroying habitat and causing warmer water temperatures that can contribute to more frequent and serious algal blooms (See Photograph 14);
• Sediment input from upstream sources can carry pollutants that can harm both humans and wildlife;
• Increased turbidity not only degrades water quality and habitat, but also results in increased water treatment costs for consumers; and
• Shallower water leads to decreased boat and recreational access from the lake and therefore lost recreational capability and reduced recreational revenues.
Photograph 14: Algae Bloom in the Shallow Reedy River Arm of Lake Greenwood, 1999
Contact Information Questions regarding this report or the referenced work can be directed to Steve Springs @ Pinnacle, [email protected] .

Saluda-Reedy Watershed Consortium Sedimentation FINAL REPORT
PINNACLE CONSULTING GROUP, p.16
References The Saluda-Reedy Watershed Consortium and The Pinnacle Consulting Group. Watershed Insights Report # 1. Sedimentation in the Upper Reaches of Lake Greenwood.
United States Department of Agriculture - Natural Resources Conservation Service. Lake Greenwood Lake Survey Sedimentation Report, Greenwood County, South Carolina, Kim Kroeger, dated November 8, 2002. Commissioned by Saluda-Reedy Watershed Consortium.
United States Army Corps of Engineers, National Inventory of Dams.