sediments on the sout1heastern flank of the …
TRANSCRIPT

,AD-A126 871 SEDIMENTS ON THE SOUT1HEASTERN FLANK OF THE BERMUDAPEDESTAL(0 NASAL OCEAN RESEARCH AND DEVELOPMENTACTIVIT NST STATIONMS D LAVOEET AL MARR83
UNCLASSIFIED NORDA-TN198 0/ 8/10IS N
II. . . . .. .. 8 22-W-
18
11.2 IL6.4 Iii.6
MICROCOPY RESOLUTION TEST CHARTNATIONAL BUREAU OF STANDARDS-1963-A
o.o--

,'0
le
......
I
ACKNOWLEDGMENTS
|IWe are greatly indebted to Dr. William Ward, University of New
Orleans, who provided guidance at critical times during the comple-tion of this work. Dr. Joseph Kelly, also of the University of NewOrleans, made many valuable suggestions during the initial stages ofplanning. Dr. Frederick Bowles of NORDA made available his sedimentlaboratory during many months of analysis, as well as criticallyreading the manuscript. Dennis Lavoie of NORDA provided invaluableassistance with the grain size analyses and unraveled the mysteriesof the Elzone Counter. Linda McRaney of NORDA provided editorialassistance. Funding was provided by the Naval Electronics SystemsCommand, Code 612, Bottom Interaction Program (PE 62759N).
!
I
]5 6"

IIII
TABLE ( CONTENTS
Page
ACKNOWLEDGEMENTS i
LIST OF FIGURES iv
LIST OF TABLES vi
ABSTRACT vii
INTRODUCTION 1
Geologic Setting 2
Physical Conditions 9 ,
STRATIGRAPHY 16
Lithostrat igraphy 16
Seismic Stratigraphy 17
METHODS 20
Carbonate Analysis 20
X-Ray Analysis 25
Scanning Electron Microscopy 28
'Grain Size Analysis 29
Limitations of the Data 31
RESULTS AND DISCUSSION 33
Morphology 33
Carbonate Content 34
Bulk Sample Carbonate Mineralogy and Skeletal Constituents 43
Grain Size 60i6
'I __ __
i44
I Il
I Page
SUMMARY AND CONCLUSIONS 73
REFERENCES 76
APPENDICES 80
VITA 98
£II
I A>oG..,,ofl
I | vc T A", 0
IsDistrbuttn/ - ,
AvailabIlitY Codes
!9I
I'I
... -I=
iv
LIST OF FIGURES
Page
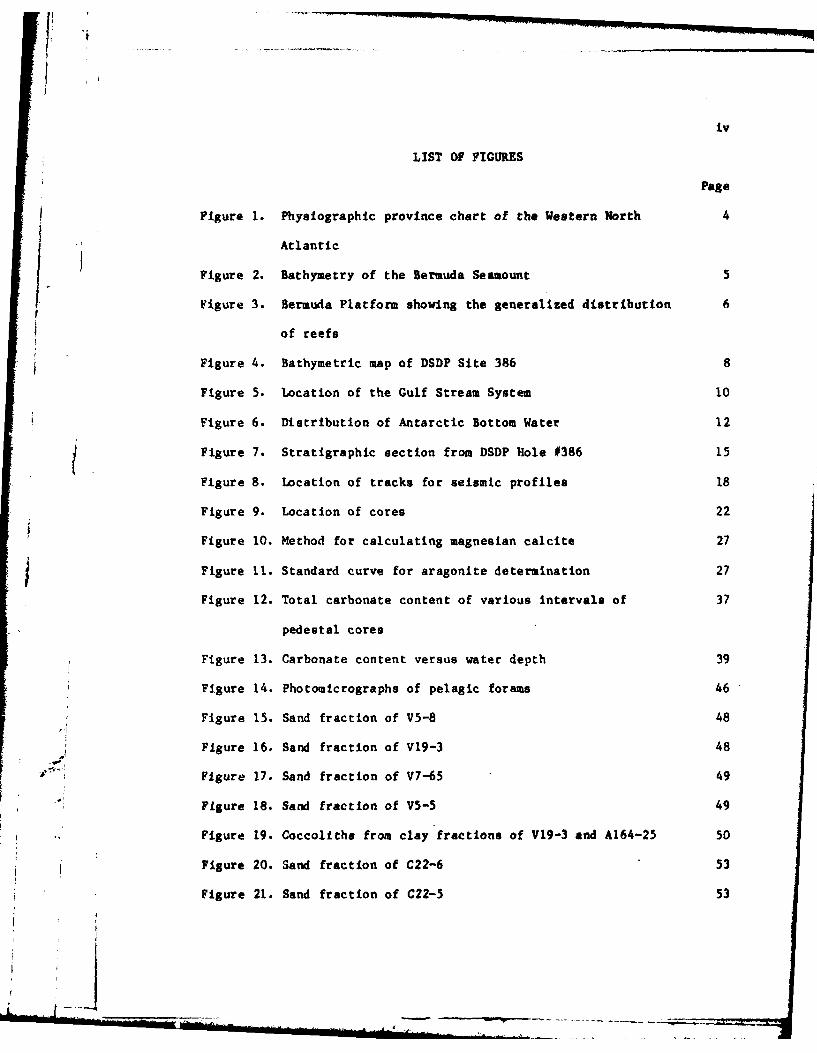
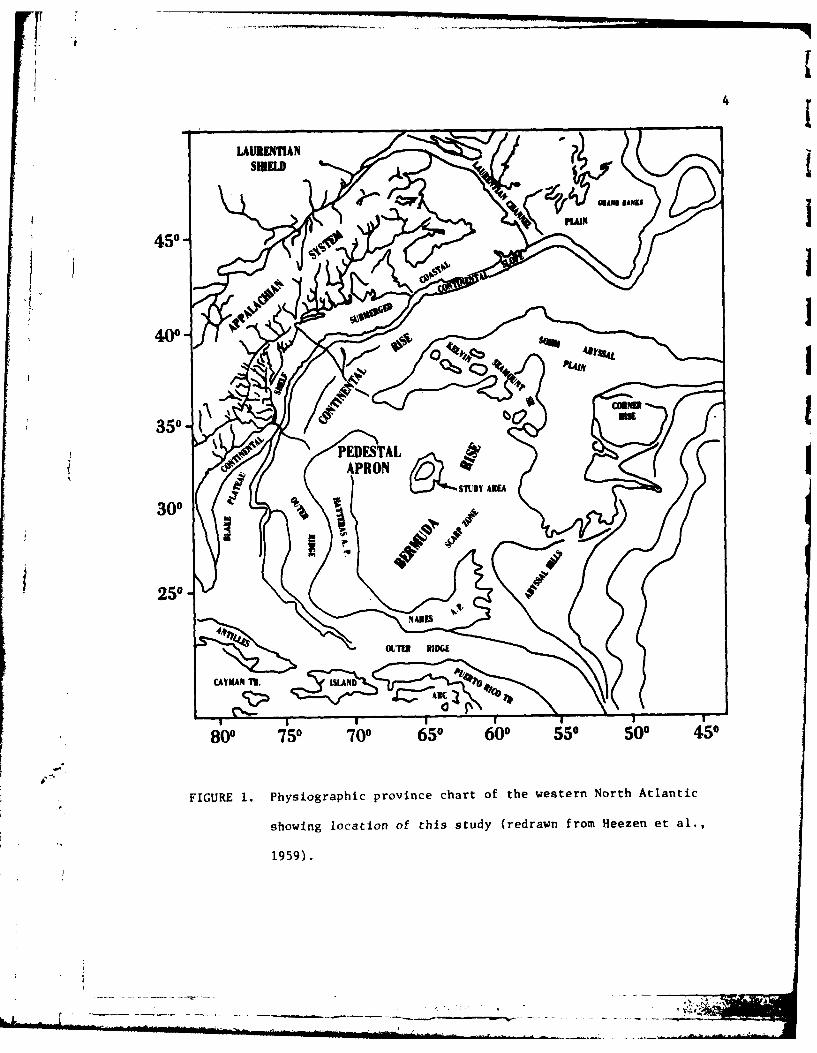
Figure 1. Physiographic province chart of the Western North 4
*j 'Atlantic
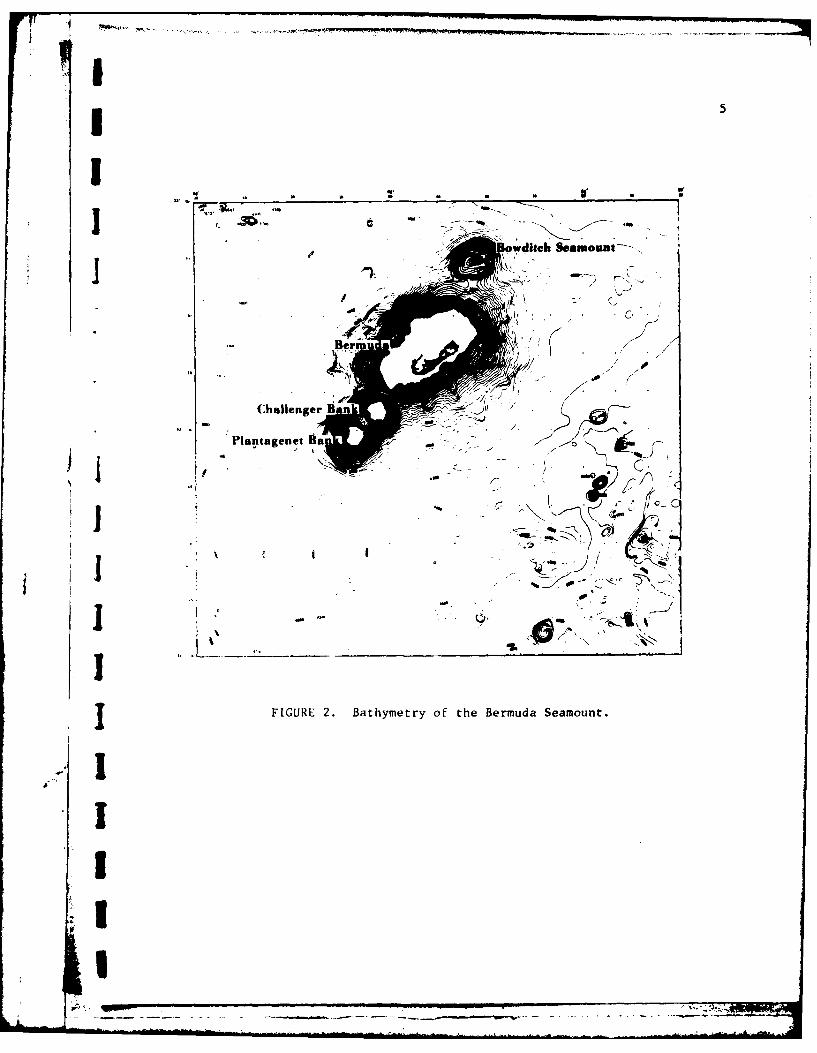
Figure 2. Bathymetry of the Bermuda Seamount 5
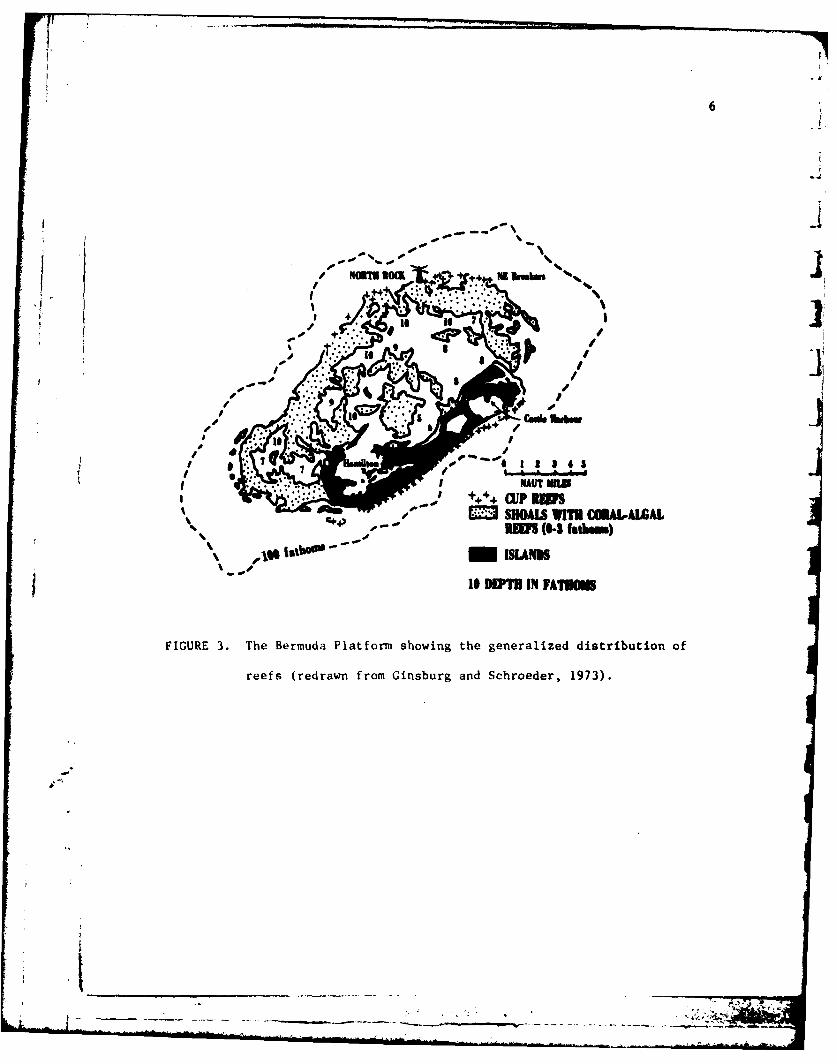
Figure 3. Bermuda Platform showing the generalized distribution 6
of reefs
Figure 4. Bathymetric map of DSDP Site 386 8
Figure 5. Location of the Gulf Stream System 10
Figure 6. Distribution of Antarctic Bottom Water 12
Figure 7. Stratigraphic section from DSDP Hole #386 15
Figure 8. Location of tracks for seismic profiles 18
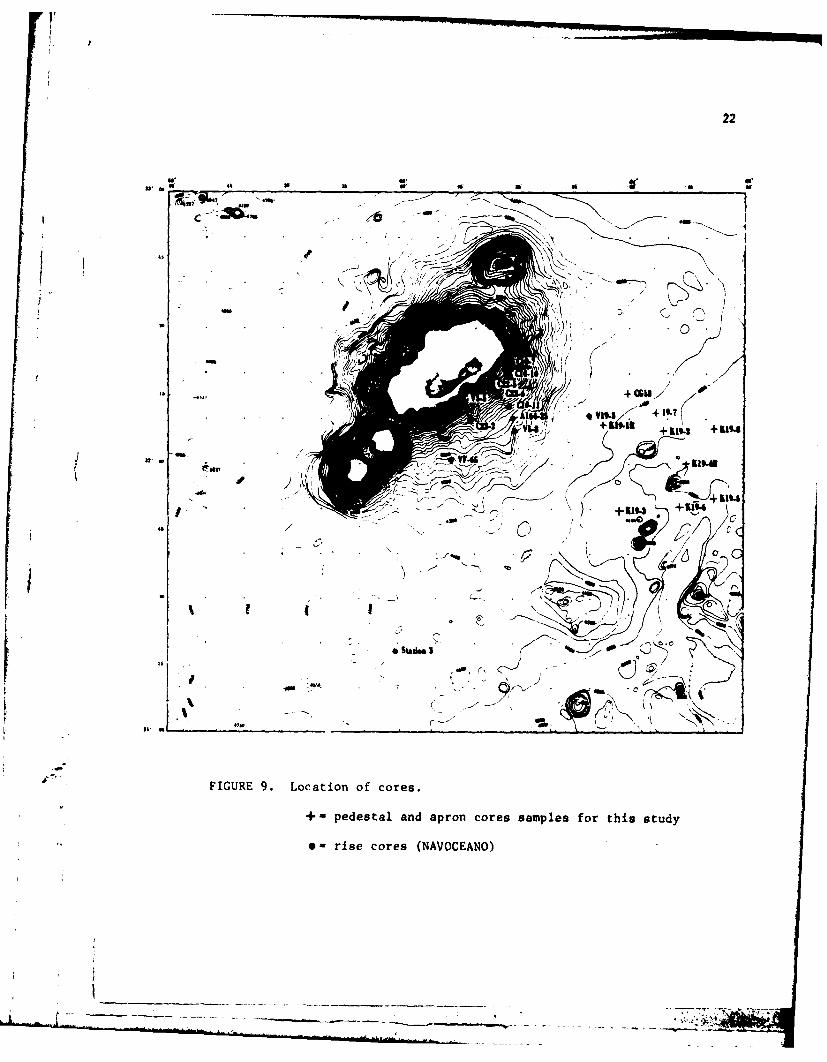
Figure 9. Location of cores 22
Figure 10. Method for calculating magnesian calcite 27
Figure 11. Standard curve for aragonite determination 27
Figure 12. Total carbonate content of various intervals of 37
pedestal cores
Figure 13. Carbonate content versus water depth 39
Figure 14. Photomicrographs of pelagic forams 46
Figure 15. Sand fraction of V5-8 48
Figure 16. Sand fraction of V19-3 48
Figure 17. Sand fraction of V7-65 49
Figure 18. Sand fraction of V5-5 49
Figure 19. Coccolitha from clay fractions of V19-3 and A164-25 50
Figure 20. Sand fraction of C22-6 53
Figure 21. Sand fraction of C22-5 53
I rl v
.5 Page
Figure 22. Sand fraction of C22-2 54
Figure 23. Aragonite versus depth of water 57
Figure 24. Calcite/calcite + magnesian calcite versus water depth 59
Figure 25. Percentage of sand vs. depth for the top, 10-, 20-, 63
I and 30-cm intervals of pedestal cores.
* IFigure 26. Combined pedestal and rise data: percent sand versus 64
water depth
Figure 27. Percent silt versus water depth for various intervals 65
of pedestal cores
Figure 28. Combined pedestal and rise data: percent silt versus 67
water depth
Figure 29. Percent clay versus water depth for various intervals 68
I of pedestal cores
Figure 30. Combined pedestal and rise data: percent clay versus 69
water depth
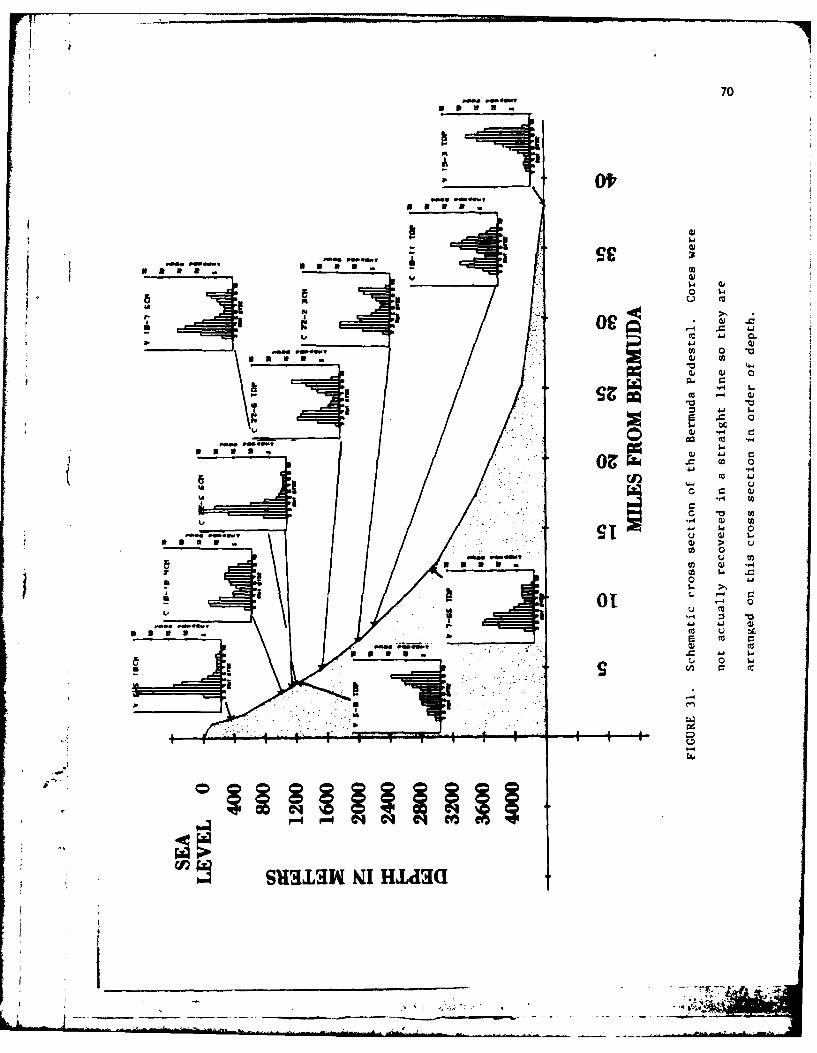
Figure 31. Schematic cross section of the Bermuda Pedestal 70
I
. I
I-,[-

LIST OF TABLES vi
Page 1Table 1. Location of pedestal and apron cores 21
.. Table 2. Location of rise cores 23Table 3. Total carbonate content for both pedestal and rise cores 35
Table 4. Percent carbonate lost to dissolution 41
Table 5. Carbonate mineralogy of the sand, silt, and clay 44
fractions of the pedestal cores
Table 6. Correlation between skeletal components and mineralogy 45 iTable 7. Skeletal constituents of the pedestal cores 55
Table 8. Grain size data for pedestal cores 61
Table 9. Grain size data for rise cores (NAVOCEANO) 62
- -. -
_ _ _ _ __ _ _ _ _

I: vii
ABSTRACTIThe Bermuda Pedestal is a truncated, flat-topped, volcanic cone
l located In the western North Atlantic Ocean at approximately 32*20'N and
64°45'W.\The. pedestal has steep slopes ranging from 30& near the top to
2.5 near the bottom. Seismic records indicate sparse sediment cover on
the slopes and an absence of large amounts of slump material on the
lower slopes of the pedestal. This suggests that the apron at the base
is not recent; rather, it may be a remnant of a talus slope associated
T with mid Eocene-Oligocene volcanic and erosional events.
The carbonate content of surface and near-surface sediment
( (quaternary) Is generally high, decreasing only slightly with increasing
depth in spite of probable extensive dissolution. Carbonate constituents
are composed of both shallow platform and pelagic organisms. Constituent
1 particles identified by scanning electron microscopy correlate well in
most Instances with mineralogy identified by X-ray diffraction. Clay
Smineral content is low to nonexistent on the pedestal. In general, grain
sizes tend to be coarser near the top of the pedestal, but anomalously
1high percentages of sand were found in a few places low on the flank and
!* apron of the pedestal.
Sediment depos'lion on the pedestal is discontinuous and episodic,
-j a combination of pelagic -rain- and redeposition by rapid-transport
processes such as slumping, turbidity currents, and resuspension and
dispersion of sediment by eddies and currents.-I
I, I
I INTRODU!CT ION
There has heen considerable interest in the geology of Bermuda
since the early 1900's. Most of the early sedimentological studies were
J Iconcerned, of necessity, with the islands of Bermuda. Only with the
advent of sophisticated seismic and coring techniques were investigators
I able to study the surrounding sea floor. Much of the work to date has
been concentrated on the Bermuda Rise; some work was done on the apron,
but little was done on the pedestal itself.
The objective of this study is to describe the surface sediments on
the southeastern flank of the pedestal and to discuss the processes
which control their characteristics, with emphasis on providing back-
ground for future research related to the Bermuda Pedestal and surround-
Iing areas. Of particular interest are the recent sediment types and
I thicknesses on the pedestal, the surrounding apron, and the rise. The
approach used was to integrate information in the literature concerning
I surrounding areas together with fresh evaluations of already available
1data and of new sedimentological analyses. Data for the apron and the
rise were gleaned from the literature and ten additional cores analyzed
7 Iby the U.S. Naval Oceanographic Office (NAVOCEANO). Samples from the top
.1 40 centimeters (cm) of eleven cores taken from the pedestal itself were
[ obtained from Lamont-Doherty Geological Observatory Core Repository and
were analyzed to provide primary data on the pedestal.
-I. A detailed hathymetry map was compiled to provide a base for the
study. Thiq is a new compilation incorporating (1) the detailed contours
(converted to meters) of the fermuda Pedestal from the U.S. Nsvy :!.O.
d.

2
16,985 Misc. Chart dated September 1960, (2) the shallow-water reef
details from U.S. Navy Chart 26341 dated June 1980, and (3) the contours
in the southeastern portions from Bowles (1980). The remainder was
contoured from raw track data provided by NAVOCEANO and the National
Geophysical and Solar-Terrestrial Data Center (NGSDC) (Appendix 1).
Seismic reflection profiles were examined to provide additional
insight into the sediment thickness and patterns on and around the
pedestal and apron. The continuous seismic reflection profiles were
obtained from Navy files and Lamont-Doherty Geological Observatory
(Appendices 3 and 5).
Geologic Setting
The Bermuda Rise, located in the center of the North American Basin
is a low, broad, northeast-trending arch 560 kilometers (km) by 1100 km
in dimension (Fig. 1). Near the center of the arch lies the Bermuda
Pedestal (Figs. 1 and 2), a truncated volcanic cone. About 350 islands
occupy 10% of the platform area of roughly 2000 square kilometers (Gees
and Medioli, 1970). The islands are clustered on the southeastern edge
of the platform. Around the remainder of the platform lie carbonate
banks and submerged and lithified dune ridges covered with a thin veneer
of coral and algae (Stanley and Swift, 1967, 1968). There are patch
reefs of Homotrems, coral and red algae (Jordan, 1971), and red-algal
cup reefs (Ginsberg and Schroeder, 1973) known as "boilers," resembling
the algal Lithothumnion rides of Pacific atolls. These cup reefs are
located primarily in tb-. southeastrn portion of the platform (Fig. 1).
. -._- - ... .'.,-ma m- -
3
In addition to the islands, banks and reefs, the pl.&form also includes
i the shallow lagoonal areas within the banks and a broad "reef" front
terrace known by fishermen as "broken ground," which extends seaward
I from the reef to the edge of the platform.
* Based on bathymetry (Fig. 2), there is a discernible pattern of
slopes on the Bermuda Pedestal. The Bermuda Platform is surrounded by
slopes of approximately 30* to depths of 1000 meters (i) to 1500 m.
Below this, to a depth of 3000 m, is an intermediate zone that has
*slopes ranging from 5* to 11. Below 3000 a is a zone that has slopes
between 2.50 and 3.8, which appears to be a sedimentary apron or deep
sea fan. This pattern is broken by Bowditch Seamount, Challenger Bank,
and Plantagenet Bank. Bowditch Seamount is a roughly conical-shaped
feature 1300 m in height situated about midway down the northeastern
side of the Bermuda Pedestal that probably represents a secondary vol-
canic center or side vent (Fig. 2). This feature has always been sub-
merged. Challenger .and Plantagenet Banks, also part of the Bermuda
Pedestal, are situated on the southwestern side of the Bermuda Pedestal
(Fig. 2). Their slopes average 200 to 220. These features probably also
represent secondary sources of vulcanism and are significantly larger
*than Bowditch Seamount. These three features seem to have been built on
the zones of intermediate and low slopes without the apparent apron at
their bases. They have steep slopes all the way to their bases.
Rolcombe and Heezen (1970) divided the Bermuda Rise into several
provinces based on elevation and slopes of the sea floor. Most of the
I.. rise is considered "rough" seafloor with elevations of 96 m to 375 m and
slopes ranging between 5° and 15°; the distance between topographic
'I". ILII_ _ -
41
LAURINMTAN
450-
400
350-RS
3 00 75'0450 60 50 0 5
4I
FIGRE1.Phsigrphc roine har o te eser Nrt Alati
FIGRE1. hshoglaipon c h rtudy(redrwsn r Aeelenetiac.
1959).
1 5
e -- -wditch Samount
Ber
Challenger Ba /
Plantagenet B
do
FIUR 2. BahmtyofteBrud emu
6
OF +--
¢s M
sI AN
o "_., /'- * SNOALS.,_ _ITlH C(3LALCAL ]
I# MM IN filOl
FIGURE 3. The Bermuda Platform showing the generalized distribution of
reefs (redrawn from Ginsburg and Schroeder, 1973).
-k -
10 DPTH N FAHOM
FIUE3.heBruaPltomsoin h eerlzddstiuino
ref rerw ro isur.n Shodr,17)
* j1
- --,--
7
highs averages 20 to 55 kas. The apron is considered to be an area of low
J relief, with elevations are between 18 and 95 a and gentle slopes (Figs.
I and 2). The study area on the southeastern flank is an area of rugged
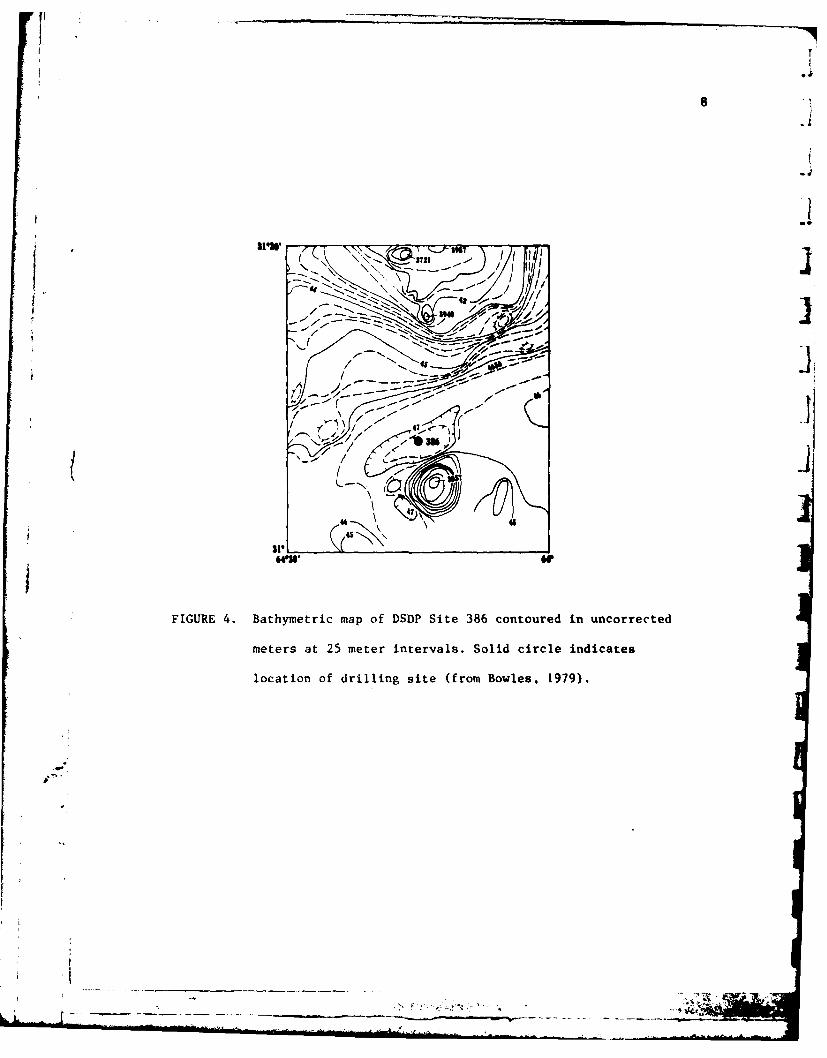
1topography, with relief of as much as 1004 m. The deepest portion of thestudy area is in 4725 mn of water (Bowles, 1979, and Fig. 4).
Trending northeast to north-northeast along the axis of the Bermuda
Rise are numerous fractures in the Cretaceous basement of the rise. The
trace of this line of fractures is called the Bermuda Discontinuity
(Vogt et al., 1971; Vogt and Ballard, 1976). The discontinuity separates
rugged and fractured basement on the eastern side of the rise from
smoother basement on the west (Fig. 1 and Bowles, 1979).
As early as 1907, Verill (quoted in Pirsson, 1914) suggested that
the island of Bermuda formed during or at the end of Triassic times.
Based upon data from a well drilled in an unstuccessful attempt to find
water near Gibbs ill, Bermuda, Pirsson (1914) proposed an Eocene or
early Oligocene age for sediments found immediately overlying the vol-
1 canic rock and, hence, an Eocene or pre-Eocene age for the volcanic
activity. Three subsequent drill holes in the Rermuda Islands penetrated
Jigneous basement. The petrology and geochronology of core samples
(Reynolds and Aumento, 1972) suggest two volcanic events occurred,
separated hy substantial time, to form the Bermuda Pedestal. The first
7consisted of tholeitte flows and was at least 60 to 80 million years
- before present (mybp) (potassium-argon dating), and perhaps as old as
the time of the formation of the regional sea floor, 110 mybp (Vogt and
Einwich, 1979). The Bermuda Rise and part of the Bermuda Pedestal could
have been built at this time. By about 33 mybp the formation of the' i,
1'- _ __ ___
8T
locaiono rlinsie(ro ols 197)
8723dl son~l
9
pedestal, or reactivation by intrusion of numerous steeply dipping (40*
3 to 700) lamprophyric dikes (Hyndman et al., 1974), was complete.
I Physical Conditions
Currents
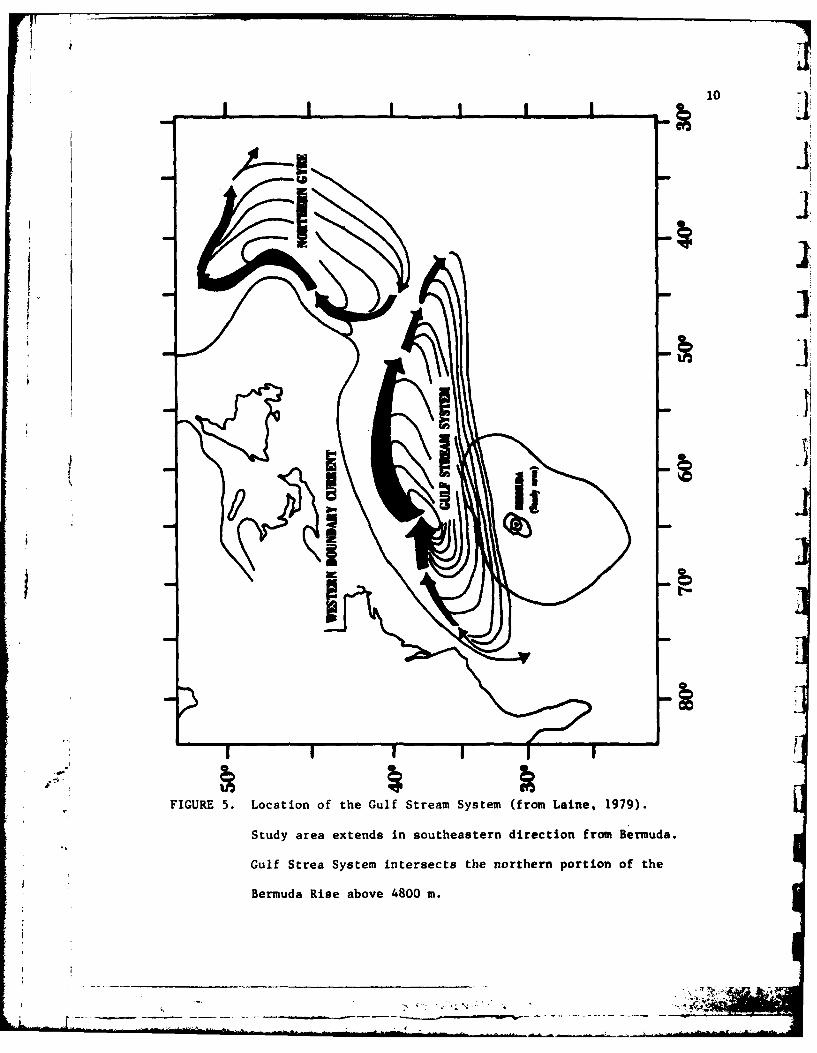
Sediments in the North American Basin of the Atlantic are strongly
influenced by the Gulf Stream System to depths of about 4800 m (Fig. 5).
The westward return flow of the system passes over and interacts with
the northern flank of the Bermuda Rise. Associated with this return flow
are a series of eddies that have significantly higher velocities than
the main flow (30 cm/sec versus 19 cm/sec). These eddies are strong
enough to resuspend bottom material, which the main flow then transports
(Lathe and Hollister, 1981).
Whereas ocean currents are generally most influential in deposi-
4. tional patterns over large areas of ocean floors, seamounts, guyots,
ridges, etc., act as obstacles to circulating water masses carrying
suspended sediment, and often localize deposional patterns by serving as
i- collection foci for pelagic sediments (Stanley and Taylor, 1977). The
Bermuda Seamount probably acts in this fashion. Currents around the
seamount itself are not well understood. That they are substantial has
been reported several times by Navy divers who have had to cancel sub-
mersible experiments because currents made diving risky (personal com-
I [munication, James Matthews, NORDA). Unpublished Navy bottom photos on
southern portions of the pedestal have revealed up to 50% exposed
j basalt, again evidence of strong current activity.
. j . ' L ...
10
II
FIGURE 5. Location of the Gulf Stream System (from Lamne, 1979).
Study area extends in southeastern direction from Bermuda.
Gulf Strea System intersects the northern portion of the
Bermuda Rise above 4800 m.
-. 5-
• .. .
in the northern Bermuda Rise, sediments consist of fine-grained
hemipelagic lutites rich in illite. The ultimate source is presumably
the east coast of Canada. During glacial portions of the Pleistocene,
I sediments were carried Southward from the St. Lawrence drainage basin by
I turbidity currents. As the transported material came in contact with
bottom water of the Gulf Stream System, the finer fractions were en-
trtrained and were carried southward by the Western Boundary Undercurrent
and to the east and west by the Gulf Stream System (Lane, 1979).
Below 4800 m, sediment is affected by North Atlantic bottom water
* i.. rather than the Gulf Stream System. Deep water from the Norwegian Sea
follows the eastern side of the Mid-Atlantic Ridge until it reaches the
Charlie Gibbs fracture zone and passes through to the west side of the
ridge. At this point, it joins deep water from the Labrador Sea to form
a southerly current along the base of the continental margin below the
T Gulf-Stream System (Fig. 5).
The movement of water over the southern flank of the Bermuda Rise
is not so well understood. Bowles (1980) shows evidence that long-term
bottom currents to the southeast of Bermuda act in a southwest direc-
.1 tion.
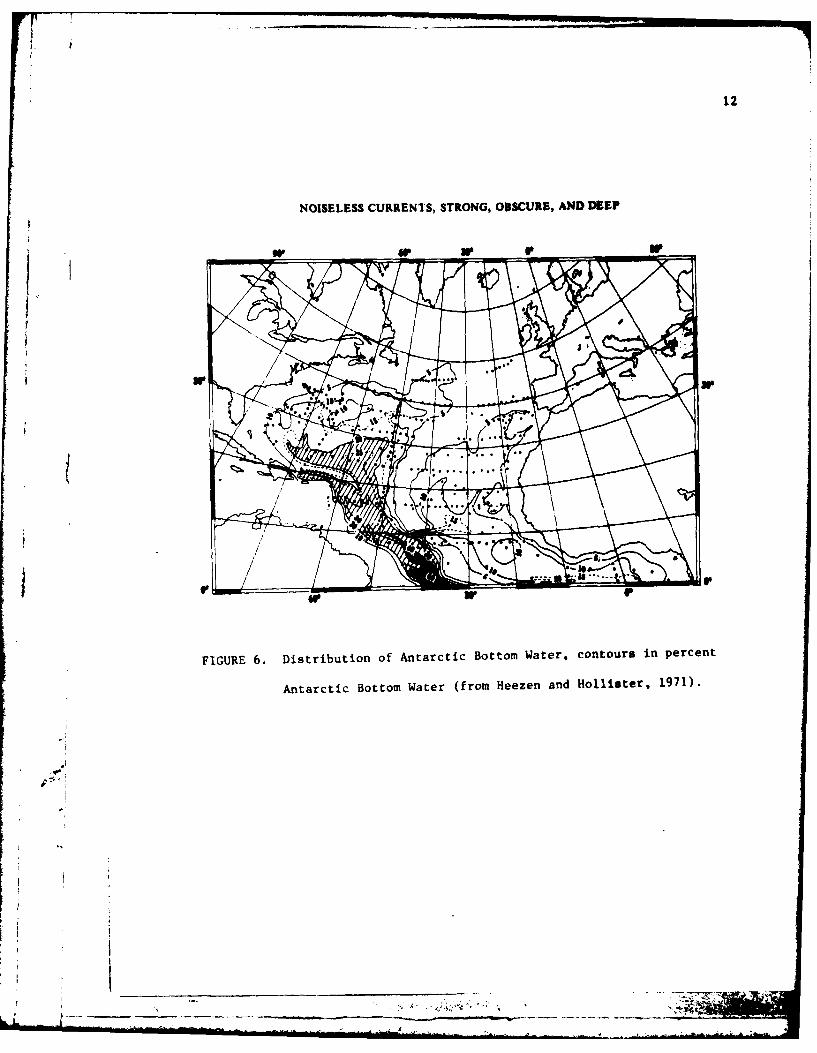
*j. Deep water arriving from the Antarctic comes northward until it
reaches the Mid-Atlantic Ridge (Fig. 6). Just southeast of Bermuda, this
deep water splits, one portion continuing to the northeast, the other
forming a counterclockwise current around the Bermuda Rise (Heezen and.0l* Hollister, 1971). Large cross beds, flutes, ripples, and scour marks on
the rise attest to the strength of the circum-Bermuda current (Heezen
4and Hollister, 1971).
I Uje ... ..
12
NOISELESS CURRENTS, STRONG, OBSCURE, AND DEEP
FIGURE 6. Distribution of Antarctic Bottom Water, contours in percent
Antarctic Bottom Water (from Heezen and Hollster, 1971).
6-L.

5 13Winds and Climate
The winds on Bermuda blow primarily from the northwest during the
winter months and from the southwest during the summer months. Wind
T speeds are fairly constant throughout the year, averaging between 5 and
The entire area is influenced by the Bermuda High. During the
winter months, November through March, several storms occur each month,
but few are felt during the remainder of the year. Tropical storms aver-
age about one per year, with severe hurricanes averaging about one every
4 to 5 years. Iropical storm season is between May and November, with
I most storms during late August through October. Temperature extremes are
between 6C and 35*C, and the climate is largely controlled by the
I marine system (Naval Weather Service Command, 1974).
IWaves
Since wave influence is negligible below 200 feet in this area,
*' 1 even the shallowest cores from which samples were analyzed were unaf-
* Ifected by wave action.
Temperature and Salinity
Bermuda (32 0 20'N, 64*45'W) is on the edge of reef building lati-
tudes (between 30° north and south); temperatures are marginal most of
the year for reef-building organisms (Stanley and Swift, 1968). Sea
.1!*
14
surface temperatures vary between 18C in March to over 27*C in August
(Neumann, 1965). The shallow waters of the Bermuda Platform respond more
markedly to atmospheric conditions, varying locally from 17* or less to
over 30* in the summers. -,
Open ocean salinities vary little from 36.5% most of the year but
decrease to near 16.0Z during the rainy months from August to October
(Neumann, 1965).
lj
iJ:'

I15
3 STRATI GRAPHY
I Lithostratigraphy
ISeveral DSDP holes have been drilled on the Bermuda Rise; Site #386
(31011.21'N, 64014.94'W) is the closest to the Bermuda Pedestal (Fig.
4). The lithologic section above basalt is dominated by typical ocean
clays (illite and montmorillonite) and hiogenic carbonate and silica
(Fig. 7). At this site, the oldest deposit is a 240 m thick unit of
greenish-grey and dark-grey and black claystone, which accumulated at
the rate of about 16 m/my (DSDP, 1979). Inasmuch as the unit is less
than one-third biogenic and the rate of deposition is an order of
magnitude larger than the rate of skeletal production (DSDP, 1979),
there must also have been an introduction of material by means other
than pelagic settling of skeletal parts.
I Above these claystones are zeolites and red claystones (Fig. 7). If
zeolites represent altered volcanic ash, they may be indicative of an
ii early phase of vulcanism on Bermuda.
The sequence of radiolarian mudstone, cherty claystone and
calcareous turbidites (Fig. 7) was depositei at uniformly high rates of
20 to 40 m/my; many contain shallow water organisms (DSDP, 1979).
A single interval approximately 150 cm thick, representing middle
Eocene to lower Oligocene, is composed of volcaniclastic turbidites
(Fig. 7). During this interval the present Bermuda Pedestal formed,
ceased to be active and was truncated. This section is often regarded as
proof of the second volcanic event, dating the formation of the present
Bermuda Pedestal at 35 mybp.
A _
16DSDP 386
M K%-
0-
uartymaeos
dayx-da
saslw O
A~~~'-~ rl. e OUGOCMN
- twwit
- th
estase
tridiae
chaty
A' CAMPANIAN4
martyilmulee.72 myhp
.k
1000-
V t C
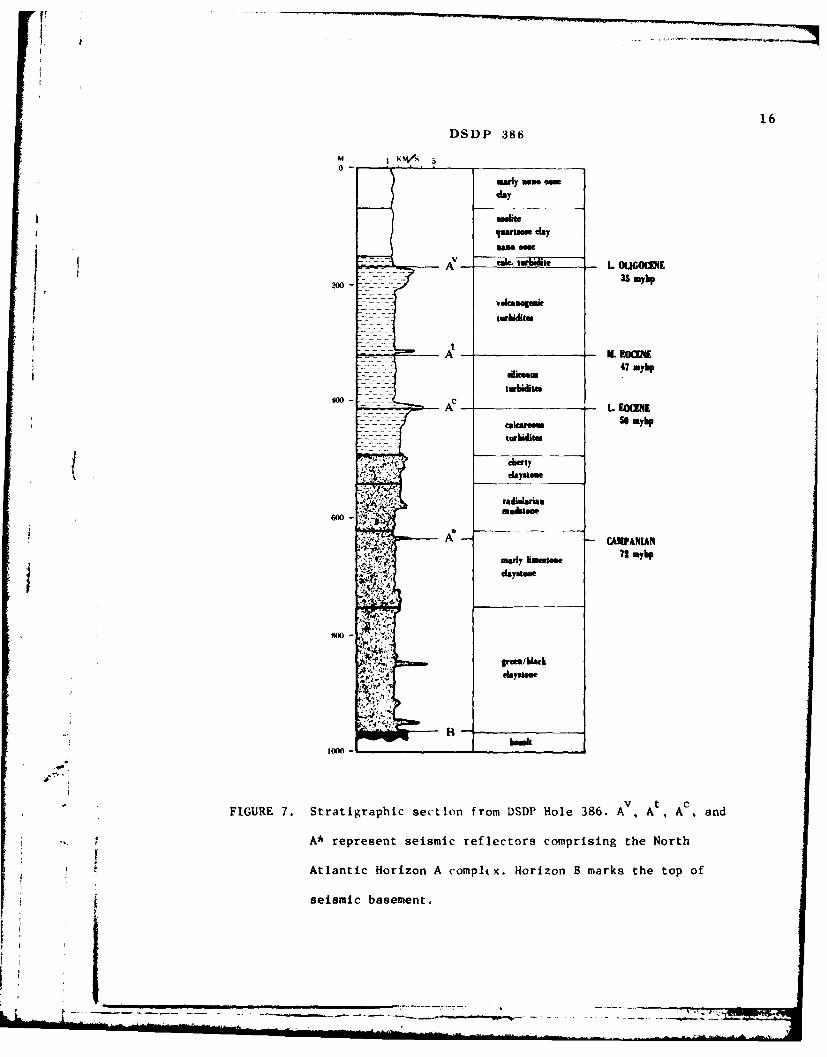
FIGURE 7. Stratigraphic section from DSDP Hole 386. A ,A A ,and
A* represent seismic reflectors comprising the North
Atlantic Horizon A compltx. Horizon B marks the top of
seismic basement.
17
Above this section, the sediments are primarily pelagic carbonate
J oozes (Fig. 7) representing considerably lower rates of accumulation
(about 6 m/my).1Seismic Stratigraphy
There are several prominent seismic-reflecting horizons in this
region which are part of the North Atlantic Horizon "A Complex"
(Tucholke, 1979). The stratigraphic section (Fig. 7) shows the
correlation of these seismic horizons with cored lithology. Horizon Av
represents the top of the volcaniclastic turbidites (deposited
approximately 35 mybp) and is commonly the strongest reflector in the
Bermuda area. It becomes less prominent and disappears in either
direction away from Bermuda. Presumably, this represents extensive
erosion of the Bermuda Pedestal. The next two lower seismic horizons,
At and Ac, are associated with Lower to Middle Eocene turbidites and
J are more widely distributed than Horizon Av. Horizon At marks the
top of turbidites with both biogenic and terrigenous components, which
J Iare not the result of local sediment redistribution. The most likely
source of these sediments is the continental margin of North America
(Tucholke, 1979). Horizon Ac corresponds to the top of cherts and may
represent a diagenetic interface that is equivalent to Horizon A
(Tucholke, 1979). Horizon B marks seismic basement and is generally felt
to represent either the upper surface of basalt or of limestones
"ponded" above the basalt.
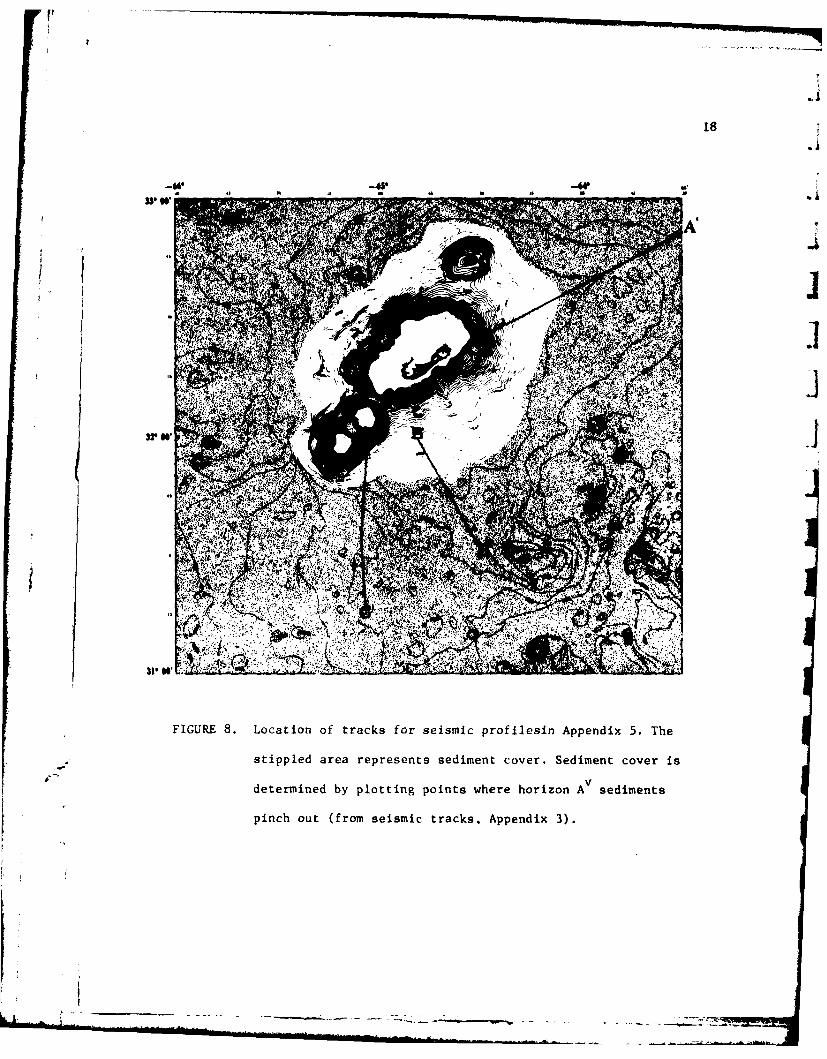
The available seismic reflection profiles in the immediate vicinity
of the Bermuda Pedestal (Fig. 8 and Appendix 5) show only Horizons AY
_ _- - - _ _- --,~- - -
18
ZIP
Af.1
A *'x
3r W*
..... ......
44.
FIGURE 8. Location of tracks for seismic profilesin Appendix 5. The
stippled area represents sediment cover. Sediment cover is
determined by plotting points where horizon Av sediments
pinch out (from seismic tracks. Appendix 3).
i I ~ ~~.... .. . ..... .. ...... . ....
1 19and sometimes B clearly. In all cases, Horizon B exhibits the irregular
J appearance of oceanic basalt. Between Horizon B and Horizon Av,
sediments appear stratified (Appendix 5) as would be expected from the
1deposition of volcaniclastic turbidites. Horizon Av is concave upward
1between highs in Horizon B. This may be the result of compaction andsettling both of the pre-Av and Horizon Av sediments. As the Bermuda
Pedestal is approached, Horizon Av increases in reflectivity, commonly
masking the lower reflectors, including Horizon B. Some profiles,
however, do show Horizons Av and B converging to form a single
reflector, which appears to become the sea floor reflector as the
interval between the surface and Horizon Av pinches out. The overall
Iappearance is one of Horizon B rising to form the Bermuda Pedestal, with
Horizon Av onlapping it (Appendix 5). At the point where the
I water-sediment interface begins to shoal, the post-Horizon Av
sediments pinch out, leaving an acoustically opaque pedestal (Fig. 8).
Above this point, neither seismic reflection nor 3.5 kHz profiles show
J detectable sediment accumulation.
I.7
A ' ____
METHODS
2
Samples were obtained from eleven cores stored in the core
repository at Lamont-Doherty Geological Observatory. The cores were J
sampled at 10 cm intervals, starting with the very top interval, to a
depth of 40 cm. The cores were taken in water depths ranging from 366 m
to 4330 m (Table I, Fig. 9). Results of ten additional cores analyzed
by NAVOCEANO were also obtained (Table 2).
Samples were analyzed for (1) total carbonate content, (2)
mineralogy by X-ray diffraction, (3) grain size by Elzone counter, and
(4) identification of constitutent particles by scanning electron
( microscope examination.
Carbonate Analysis
Carbonate analyses were done using a manometric system according to
the method developed by Hulseman (1966). All samples were ground with
mortar and pestle and homogenized by shaking. They were then dried in a
low temperature (2500 F) oven overnight and stored in a desiccator jar
until weighing. Between 0.15 and 0.3 g, depending on the carbonate
content of the sediment, were weighed on an analytical balance for each
analysis. This small sample was then added carefully to a pyrex
container. The leveling tube of the Hulseman apparatus was then raised
until the burette read 0. The system was closed with a 3-way stopcock.
Three milliliters (ml) of 4N HCI were added. When the reaction ceased,
the sample was heated with a Bunsen burner until a rolling boll was
.. _.s"
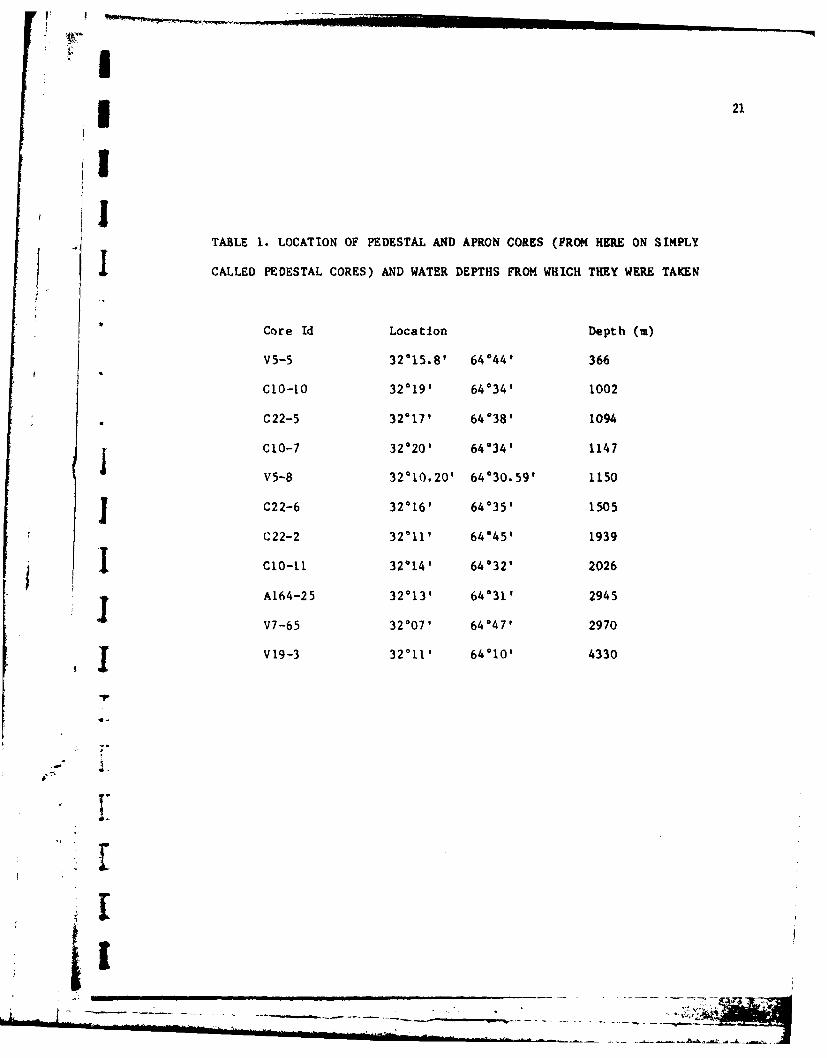
II 21
* TABLE 1. LOCATION OF PEDESTAL AND APRON CORES (FROM HERE ON SIM4PLY
CALLED PEDESTAL CORES) AND WATER DEPTHS FROM WHICH THEY WERE TAKEN
Core Id Location Depth (m)
V5-5 32815.8? 64044? 366
CIO-to 32019? 640341 1002
C22-5 32*171 64*381 1094
C1O-7 3200 64034? 1147
V5-8 32010.20' 64*30.591 1150
JC22-6 32*16' 64"35' 1505
C22-2 32"119 640451 1939
I dO-Il 329141 64032' 2026
A164-25 320131 640311 2945
SV7-65 32007? 640471 2970
V19'-3 32011? 640101 4330
22
+ .mm + LI
I) W4/~ ,. + rim1x
0 Sud I Q
0- ris core 0NVCA

II
TABLE 2. LOCATION OF RISE CORES (HAVOCEANO) AND WATER DEPTHS FROM WHICH
THEY WERE TAKEN
Core Id Location Depth (a)
K 19-IR 32°8.50 ' 6407.201 4365
CG-18 32014.8 ' 640 ' 4382
19-7 32*11.7 ' 63°55.2' 4410
K19-3 31°49.41 6402.61 4490
K19-4R 32000.101 63*45.5' 4520
K19-8 32°6.81 630381 4555
K19-5 31052.3 , 63053.9 ' 4620
K19-2 3206.0 ' 63053.9 4425
I K19-6 31051.1' 63046.3, 4620
Sta 3 31017.0 ' 64058.5 ' 4450
1.
_- J - -:- - -• ',:-. ."""" -'
SI,
24
achieved. The sample was then quickly cooled with cold water and allowed
to equilibrate 14 minutes.
The mercury in the leveling bulb was adjusted so that it was level with
the mercury in the burette. The volume of carbon dioxide (CO2) was
read directly from the burette. The amount of CO2 generated was then
determined manometrically using the following formula (Hulseman, 1966)
based on the gas laws (PV-RT).
CaCO3 + 2HC1 CaC1 2 + 1120 + CO2 [
The formula for computing the amount of carbonate can be written:
%CaC03 = V(P-H) x 0.163 (Weast, 1964, p 192)WC(T+t)I
V-observed volume of CO2 in ml (read from the burette)
P-barometric pressure in mm Hg
',1-vapor pressure of water in mm Hg, dependent on the lowest temperaturein the system (usually the temperature of the cooling system, Appendix
3)
4-weight of the sample in g
T-room temperature in degrees C; in order to compensate for variationsbetween the beginning and the end of the analysis the average of thetwo temperatures is entered
t-degrees Kelvin (273.2 added to degrees C)
0.1603 is a constant resulting from the conversion of the barometricpressure to CGS units and the molecular weight of CaCO 3.
-- -.
* 25
SI
The accuracy of the method was checked periodically throughout the
J day by analyzing a known amount of calcium carbonate (Allied Chemical,
Reagent Grade ACS code 1506). The system was considered to be accurate
I if standards fell with + 2% of the correct value. It was assumed that
samples also fell within the same range.
The 14 minute thermal equilibration time was determined experiment-
ally for this system with CaCO 3 standards.
X-Ray Analysis
Samples were separated into 3 size fractions by a combination of
settling and seiving techniques. All samples were first placed in a
500 ml flask with 15 ml 0.1 N Calgon solution (dispersant). The volume
I was then brought to 300 ml with listilled water (5 cm in depth) and
shaken thoroughly. Three hours 32 minutes later, assuming a settling
.1 distance of 5 cm, the supernatent was siphoned off. Time was calculated
SI using this formula from Folk (1974):
T iwin - depth in cm
1500 (A) (d)2
212 min - 5cm1500 (343)(.002)2
A-density at a specific temperature
d-diameter of the particle
i [__

i
26
This was repeated 3 to 4 times until the supernatent was clear. The
supernatent was assumed to contain the clay-size fraction (less than 2
m); the remainder equaled the silt plus sand-size fractions.
The sand and silt fractions were separated by wet seiving using a
~#230 (631im) setve.
These size fractions were then dried and powered. All were X-
rayed on a General Electric Diffractometer, XRD 5, as pQwder mounts at
1°/26, 30 mA and 45 KV. A silica standard was then added to each sam-
pie, which was then rerun using the same settings.
Amounts of low and high-magnesian calcite were calculated according
to Milliman (1974, p 23, Fig. 10). The area under the peaks was calculat
calculated using a planimeter. The area under the free half of the aajor
peak, the right side of the low-magnesian calcite peak, was calculated
and multiplied by 2. This area was then compareJ to the total area in
order to differentiate between It and the other calcite peaks present.
The percentage of magnesian-calcite was then calculated according to the
formula given by Milliman (1974, p 23, Fig. 10).
The aragonite percentage was similarly calculated using the area
under the 26.24 A peak and comparing that value to a standard curve pub-
lished in Milliman (1974, p 24, Fig. 11).
An attempt was made to derive a standard curve for the B. rnuda area
using organisms from these particular samples. Pteropods were used as
the aragonite source and planktonic forams as the low magnesian calcite
source. However, the very small size of tests made the separating proc-
cess difficult. Most of the pteropod tests were filled with much smaller
tests, generally of pelagic forams, thus it was impossible to obtain a
pure aragonite sample.
-- a

I, 27
eA1 4 C A *3
I ~~ ~~~C 3 0 a bq QW/11 M A aTT 1+ zs! ~£TM,, 3 4+ C, CALWIS Z nC1
jE z 4C) MC] 4 8 mgC1
OC 1 I x (4 112)
FIGURE 10. Method for calculating percent magnesian calcite (Milliman,
1974, p. 23).
II
- # 10
j!0 Its
I p24) .
6. p et .,,.it
m d "F1GURE~ 11. Standard c'urve for aragonite determination using peak
|" area analysis. Each data point represents 8 to 0
~analyses of various calcite and aragonite (Mllilman, 1974,
p. 24).
I28
Scanning Electron Microscopy
The sand size fraction of each sample was dried and randomly fixed
to sticky tape on an SEN stub by dipping the stub in the sand-sized
fraction and turning it until an even coating was achieved. The clay-
sized fraction was diluted with distilled water and filtered onto a
0.4 m 1huclepore filter (Nuclepore Corp., Pleasanton, Ca.). This was
then dried and attached to an SEM stub with double-sided tape. Samples
were then edged with silver paint to reduce charging. After thoroughly
drying, the samples were coated with a thin film of gold using a Polaron
ES1O0 Sputter Coater (Polaron Equipment, Ltd., Dolyesville, Pa.)
Samples were examined with a scanning electron microscope AMR Model
1000 (Advanced Metal Research, Inc., Bedford, Ma). Five fields were
selected at randon and photographed at 50X on each stub of sand-sized
fraction so that organisms could be identified. A 3/4" by 3/4" grid was
utilized to aid in counting. Generally all organisms in a field were
counted. Occasionally when the organism density was too great to count,
every other square was counted.
Huang and Pierce (1971) have pointed out the difficulties of
determining sources of carbonate grains and sediments in fine sands and
silts. Therefore, only the sand fraction was examined for the purpose of
estimating relative abundances of constituent particles. The clay size
fractions were scanned only to determine qualitatively the primary
constituents. No attempt was made to count organisms.
L.Ji
F= i!
- .. . .. . L _L_ _i_ __i-_-_...
I 29
Grain Size Analyses
I The amount of material available for grain size analysis was
approximately one gram, which necessitated the use -f electronic
techniques rather than the traditional pipette or settling tube methods.
The instrument used was an Elzone 8OXY (Particle Data, Inc., Elmhurst,
Ill.). The basic detection principle of this instrument is the same used
J in the Coulter Counter, i.e., a particle suspended in an electrolytic
medium passes through a micro-orifice, displacing an amount of
electrolyte equal to its volume, thus causing a change in an electric
field applied across the orifice which is proportional to the volume of
electrolyte displaced. The Elzone differs from the Coulter counter
J primarily in how this electronic pulse is processed, and it produces a
more rapid analysis and a finer resolution of the size versus frequency
distribution.
j The property measured by the Elzone technique is particle volume;
the data actually read from the instrument Is the diameter of a sphere
j having the equivalent volume, the conversion being done automaticalLy.
This is not the same property measured by the pipette method which is
I based on the Stokes relationships and mass. However, for particle
systems such as the core samples analyzed for this work, in which the
densities are fairly uniform and in which the dominant shape is
Tsub-spherical, the two techniques should give comparable results, as was
found by Kelley (1981) in a comparison of size distributions ofu1 us pended sediment.
-2.
,r- l
30
Sample preparation was as follows; 50 to 100 mg of sediment was
dispersed for a minimum of 10 minutes in an ultrasonic bath in 3 ml of a
dispersant/electrolyte solution consisting of 10 g/l calgon (commercial
sodium hexametaphosphate dispersant) and either 19 gm/I or 100 gm/l an-
hydrous sodium sulfate. Preliminary examination indicated .hat there
were few statistically significant particles over 150on equivalent di-
ameter, so the upper size limit for the analysis was chosen to be 210 m.
The lower limit of detection for the instrument used is 0.7 m. Thus the
size range considered was approximately 10.5 4 to >2.0 0.
In order to prevent blockage of the orifices by particles larger
than the orifice diameter, the sample was sequentially screened through
210jAm, 705Am, and 10im, nylon mesh (Spectrum Medical Industries, Los
Angeles, Calif.) using a 10 ml syringe as a funnel and a 25 mm-diameter
in-line filter holder (Nuclepore Corp., Pleasanton, Calif.) for the
nylon mesh. This resulted in approximately 5 ml of suspension for each
fraction (i.e., <210m, <7O0m, and <105Am). Each screening was done on a
thoroughly mixed suspension and was followed by a rinse of 7 ml disper-
sant/electrolyte in order to maintain the original relative proportions
in the size distribution, an important prerequisite for the data blend-
Ing steps to come later. For the analysis, each suspension was thorough-
ly mixed and diluted with filtered dispersant/electrolyte to yield a
coincident count rate of 1% or less (i.e., 1% or fewer of the counts are
the result of two or more particles passing through the orifice at the
same time).
Each size fraction was analyzed using a different sized orifice
because the analytical range for any given orifice is from 2 to 60% of
3 31its diameter. The three distributions obtained overlapped considerably,
I allowing each distribution to be normalized to the smaller distribution
J adjoining it. The resulting "blend" is thus a properly proportioned size
versus volume (or mass) distribution over the entire range of interest.
JThe amount of material was integrated over 0.5 phi intervals and the
percentages of clay, silt, and sand computed. Data were recorded digit-
ally, processed, and graphed using an HP 9825B computer system (Hewlett-
Packard Co., Palo Alto, Calif.).
Limitations of the Data
Sampling of cores used in this study was performed by Rusti Lotti,
assistant to Dr. Floyd McCoy, Curator of Lamont-Doherty Geological Ob-
servatory Core Repository. This researcher ws rot able to inspect the
i cores. These cores were obtained between 1959 and 1974, and were stored
in PVC core liners wrapped in plastic and refrigerated, which should
J allow preservation, in good condition, for years. In spite of this stor-
age, moisture was lost from older cores. This probably did not affect
the analyses that could be performed. Physical measurements such as
J sound velocity, water content, and specific gravity, could not be per-
formed on cores of this age.
Between 1959 and 1974, both coring and navigation techniques im-
proved considerably. The depth at which cores are recovered is measured
either in terms of amount of wire line payed out, or with a fathometer.
On slopes of 30* either technique may result in inconsistencies between
depth recorded for cores and depth apparent when core locations are
ii
32
plotted on a bathymetry map. Some depths also were recorded in corrected
(for temperature, salinity, etc.) meters by Lamont-Doherty at the time
of coring; others, in uncorrected meters (NORDA). Corrected core depths
were converted to uncorrected meters by use of Matthews Tables (Bialek,
1966) inasmuch as the bathymetry was also compiled in uncorrected
meters, a source of possible error.
Early navigation was based on celestial fixes; satellite navigation
became available by the early 1970's. Thus, early core locations may be
accurate only to within + 10 km.
Two different methods were used to analyze samples for grain size
and carbonate content. NAVOCEANO calculated grain sizes with a
Micromeritics system, this researcher, with an Elzone Counter. Total
carbonate content by NAVOCEANO utilized a carbonate bomb similar to that
used by the DSDP (DSDP, 1978). This researcher used a manometric
gasometric system (Hulseman, 1966). Several different technicians also
performed the NAVOCEANO analyses. However, results of pedestal core
analyses for this study can be considered consistent (done by the same
methnd by the same person). Data from NAVOCEANO and DSDP Leg 43 were
included primarily to enhance the picture formed from analyses of the 11
main cores from the pedestal.
- -~ .
RESULTS AND DISCUSSION
Morphology
T By plotting the points where post-Horizon Av sediments pinch out
K (Fig. 8), it becomes clear that the apparent "apron" (ons of 2.5' to
3.8' slope@) in seismically opaque with no detectable accumulation of
soft sediment. At the base of the pedestal, therefore, there is no sig-
nificant depositional apron produced by the downelope transport of post-
Horizon A pelagic sediments. The apron is more likely a volcanic or vol-
lcaniclastic feature associated with Eocene-Oligocene volcanic activity
when the Horizon Av sediments were being deposited. The term "apron",
therefore, probably should not be used because of the sedimentary conno-
tation associated with the term. The slopes of the pedestal are sparsely
covered with sediment. Unpublished Navy photos (J. Matthews, personal
communication) reveal up to 50% exposed basalt in some areas. This
1 pedestal and apron description is quite consistent with that of Cotton
(1969) in terms of reported slope zones on Pacific and Indian Ocean sea-
I mounts and with his concept of a central core of basaltic flows sur-
rounded by a talus slope of volcaniclastics.
There is evidence of down-slope transport of post-Horizon Av
sediments. Seismic line cross sections A-A', B-BI', C-C', E-E' and F-F'
(Appendix 5) show examples where the post-Horizon Av sediments pinch
,* out against the base of the pedestal. This region often shows an irregu-
lar water-sediment interface suggestive of slumps. Unpublished NAVOCEANO
-• 3.5 kHz profile date in this area show irregular hyperbolae of the
III
34
Damuth (1980) type IIIC, but with evidence of subbottom layering. Higher
on the pedestal than the point of apparent post-Horizon Av pinchout,
no subbottom layering is detectable. Profiles B-B', D-D' and E-E' (Ap-
pendix 5) also show what are interpreted to be shallow ponds of pleisto-
cene deposits (Bowles, 1981). The volume of materials in these slope
base deposits is not great, which is consistent with the relatively low
post horizon Av depositional rates (6 m/my) for sediments cored at
DSDP Site #386.
Carbonate Content
The results of the carbonate analyses for the pedestal cores are
listed in Table 3 which also shows the carbonate data for the tops of
the ten rise cores analyzed by NAVOCEANO. As expected, the percentage of
carbonate is generally high, averaging 87% overall, with 76% of the 43
samples composed of at least 80% carbonate and 33% of these cores com-
posed of at least 95% carbonate.
Variations in carbonate content within the upper 40 cm of the cores
range from virtually none (within the + 2% precision of the system) to
considerable. The extreme values are found within the 20- and 30-cm in-
tervals of cores C22-5 and V7-65. These two cores also differ in color;
instead of the usual creamy white, they are mustard yellow. They have a
high content of clay minerals (see mineralogy section) of 72% and 60% in
C22-5 and 45% and 43% in V7-65 (Table 3, Appendix 6). The amount of var-
iability within the cores does not seem to be related to their location.
_ _ _ _
• ... J _ ' . . . .. . ... . .. -

I
I 35TABLE 3. TOTAL CARBONATE CONTENT FOR BOTH PEDESTAL AND RISE CORESI
TOTAL CARBONATE CONTENT Pedestal Cores
i Core Top 10 cm 20 a 30 cm Avg
4 2 %
C22-6 83.36 96.54 90.21 90.90 90.25
CIO-10 96.82 95.53 94.06 93.10 94.88
C10-11 65.73 77.94 79.22 77.07 74.99
CIO-7 93.50 95.00 90.92 93.10 93.13
C22-5 98.17 98.77 27.99 39.09 66.01
C22-2 95.21 92.83 90.10 93.18 92.83
V5-8 9I.63 93.78 93.18 93.32 92.98
V7-65 86.28 89.83 54.64 56.86 71.90
V19-3 75.86 92.90 85.87 93.16 86.95
V5-5 - 96.06 98.83 97.91 97.60
A164.25 95.80 97.22 97.22 98.10 97.09
87.15
I NAVOCEANO TOPS
J Rise Cores
K19-6 97
I K19-2 59
K19-5 28 Clay Mineral Content20 cm 30 cmJ K19-8 61 C22-5 72 30
K19-4R R4 V7-65 45 43
K19-3 24
K19-7 53
GC-18 -
i K19-1R 96
Sta 3 21.5
IiI-!- - --- ~--- .---
36
In shallow water, the rate of supply of calcareous tests to the
system generally exceeds the rate of dissolution; thus carbonate sedi-
ment accumulates. As calcareous tests are deposited in ever deeper
water, the rate of dissolution begins to increase until such a depth is
reached where the rate of dissolution equals the rate of supply. At
depths below this zone, the carbonate compensation depth, the rate of
dissolution is large enough that carbonate sediment does not accumulate
(Johnson et al., 1977). Thus one would expect that, all other variables
held constant, total carbonate content should decrease with increasing
depth of water. .
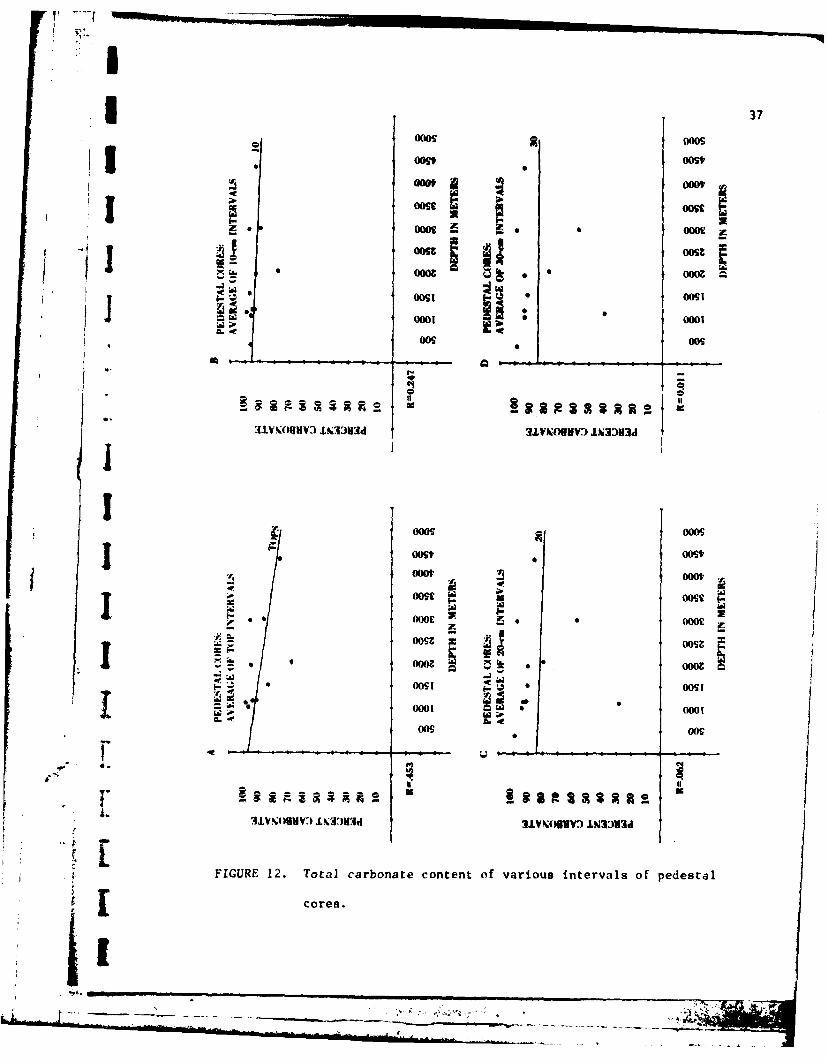
In a plot of total carbonate content versus depth (Fig. 12), therejLis a general trend of decreasing carbonate content with increasing
depth. The general trend is similar between the various intervals of the
cores (Fig. 12). Correlation coefficients (R) for the top-cm 10-cm
20-cm, and 30-cm intervals respectively are -0.453, -0.247, -0.062, and
-0.011 indicating that the top intervals of the cores show more correla-
tion between carbonate content and increasing water depth than does each
lower interval in the cores.
The shallowest core, V5-5 (366 m), has an average (over all inter-
vals within the core) carbonate content of 97.6% in the top 40 cm. With-
in the limits of the Hulseman system, this can be considered a totally
carbonate sediment. The deepest pedestal core, V19-3 (4330 m) near the
carbonate compensation depth (CCD) of 4400 to 4500 m in this area
(Bowles, 1980), has an average carbonate content of 86.90%, only 10%
less carbonate content than the shallowest core. When the average car-
bonate content of the cores is plotted against increasing water depth,
.. .. ... ..L._-,__ -_
I 3700009 000SI oo9t O~
itOOtV OOOV
1 00tw 0001
21-mom Lonwo e..33v.
000S 000S
009 00w'I-000t 000
iiX 000C
V0001 000 r
001 rj OOS
000 0001
00S~ noo
4~ 2d
31OK)V' LOAM
FIUE 1 . oa aboaecn en vrous inevasofpdetl
cores.000
LooL
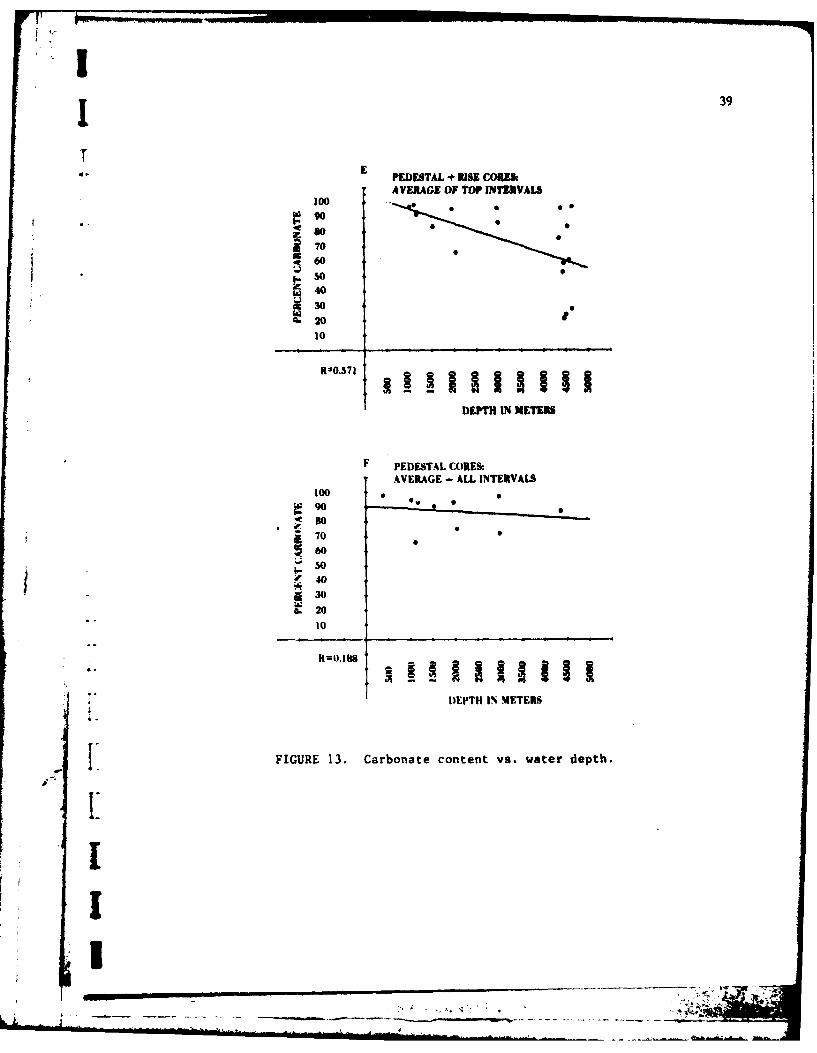
38 ithe correlation coefficient is very weak (-0.188). When the carbonate ]content of the top intervals of the aron cores are plotted with the
carbonate values for the pedestal cores) the correlation coefficient is
-0.571, indicating that there is a reasonable strong correlation between
increasing water depth and carbonate content (Fig. 13). As is evident, Ithere is a good deal of scatter in the data.
Two possible reasons account kor the decreasing carbonate content
of sediments with increasing water depth: (1) dissolution of carbonate
particles and (2) greater clay deposition as lower portions of the
pedestal are reached. In a study of the effects of dissolution in
carbonate sediments on the Ontong Java Plateau, Johnson et al. (1977)
discovered calcium-carbonate content decreases with increasing water
depth from 80% to 90% at their shallowest depths (1600 m) to less than
75% at their deepest (4500 m). The CCD there is around 5000 m. They
concluded that this change in composition represented a loss of calcium
carbonate to dissolution, which they calculated with the following
formula:
L (1 - Ro/R) 100
where
L -CaCO 3 lost in % of total sediment, to increase the insolublefraction Ro, to R%.
R - weight % of noncalcareous material in the sediment sample fromwhich L is calculated.
Ro- weight Z of noncalcareous material in a sediment which hasundergone no dissolution.
- -ERNA
39
E PEDESTAL + RISE CORS:
AVERAGE OF TOP JNTSIVALS,100
~906
so0
700
frso~40~30~20
10
RZ0.571
DEPTH IN METERS
F PEDESTAL CORES-AVERAGE - ALL INTERVALS
100~90~80
700
*60
-so
S40
20
DEPTH IN METERS
FIGURE 13. Carbonate content vs. water ilepth.
Li_ _____-----~ --
40
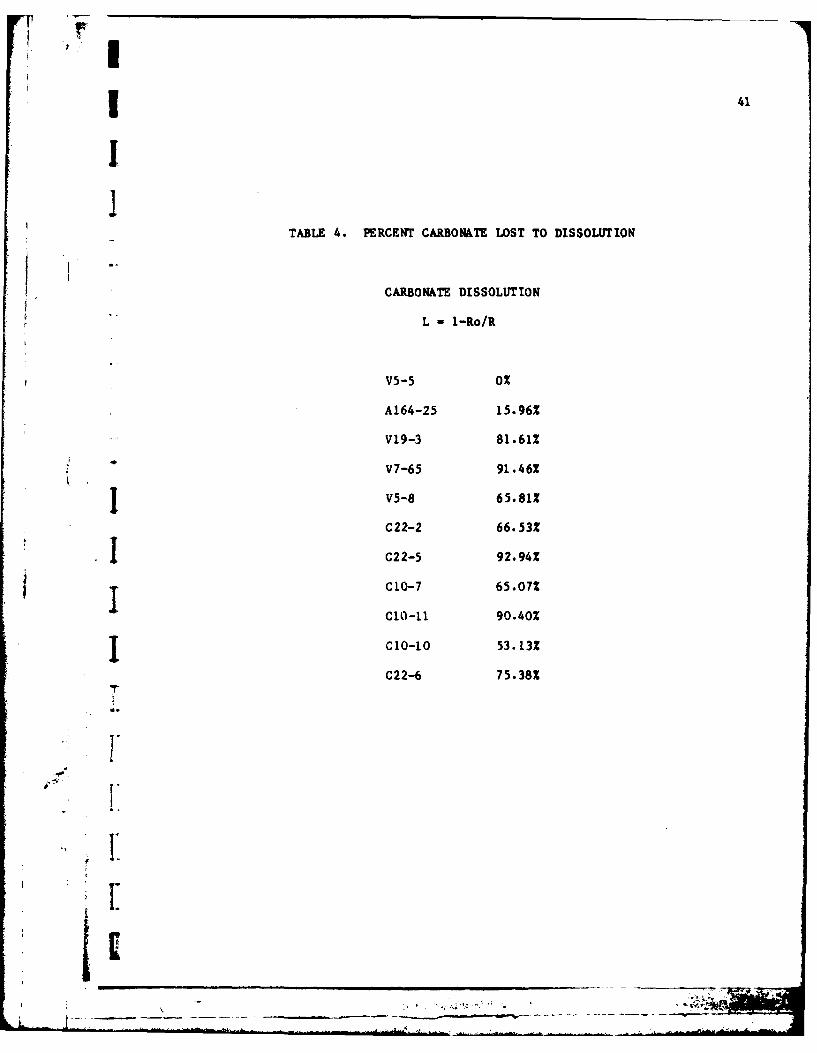
If it is assumed that sediment with the highest percentage of cal-
cium carbonate has undergone no dissolution (V5-5 with average carbonate
value of 97.6%), then L can be calculated setting Ro to 2.4%. Such
calculations suggest, for instance, that up to 91% carbonate has been
removed from V7-65 and 81.6% from V19-3, two of the deeper burial sites
(Table 4). Johnson et al. (1977) suggest, however, that other factors
probably affect calcium percentages, and they consider it unlikely that
estimated values above 3000 m chiefly reflect dissolution. Similarly,
the scatter in the data and the variation in depths of burial (Figs. 12
and 13) suggest that dissolution is only a part of the picture.
Increasing deposition of clay minerals on the lower pedestal may
dilute the total percentage of carbonate sediment in the samples. As
stated earlier currents may actively resuspend and redeposit sediments
on the rise and possibly the lower reaches of the pedestal. The Pleisto-
cene rocks of Bermuda consist of shallow water, beach, and intertidal
marine hiocalcarenites, eolianites, and red soils (Land and Mackenzie,
1970). Erosion of red soils from the platform may be contributing small
amounts of clay minerals to the lower slopes of the pedestal.
Bathurst (1971) suggests a number of variables that weaken the
correlation between calcium carbonate content of sediments and water
depth, such as coating of particles with organic compounds and distance
from lana. It is difficult to access the amount and effect of particle
coating without resampling specifically for that purpose. However, Land
and Mackenzie (1970) state that the Harrington Formation on Bermuda was
-- . . -- . - - - - - - - - -- - - - - - -
I141
TABLE 4. PERCENT CARBONATE LOST TO DISSOLUTION
CARBONATE DISSOLUTION
L - 1-Ro/R
V5-5 0%
A164-25 15.96%
V19-3 81.61%
V7-65 91.462
V5-8 65.812
C22-2 66.53Z
C22-5 92.94%
t T C10-7 65.07%
Clo-il 90.40%
I IO-10 53.132
C22-6 75.38%
.V.
Z 7"
I.
<Ii
-- - --.- -- ~
42
deposited during the Harrington Regression when sedimentation rates were
slow and large amounts of organic humus were present. The humus produced
a "waxy" coating around each grain, thus preventing alteration, at least
on the platform. Such "waxed" particles may be slower to undergo disso-
lution than uncoated particles. One can speculate about the effect of
the proximity of the core sites to Bermuda. All are directly downslopeI
from exposed land (possible source of noncarbonate sediment) and within
40 miles of the islands. Slopes range from 30* to 13* to 2.8* on the
pedestal (Fig. 2).
It is reasonable to suppose that with slopes of this magnitude
slumping is a definite possibility. At the same time, turbidity flows
may be generated and, indeed, there is evidence of turbidite deposition
in seismic profiles E-E' (Appendix 5). Such rapid transport would reduce
time available for dissolution, thus preserving by burial larger amounts
of carbonate in some areas than one would expect. _
.1
-,!
tII
*1 II
.4 .
-*-- -.- .-- ---- ~ - - --.- - --- I
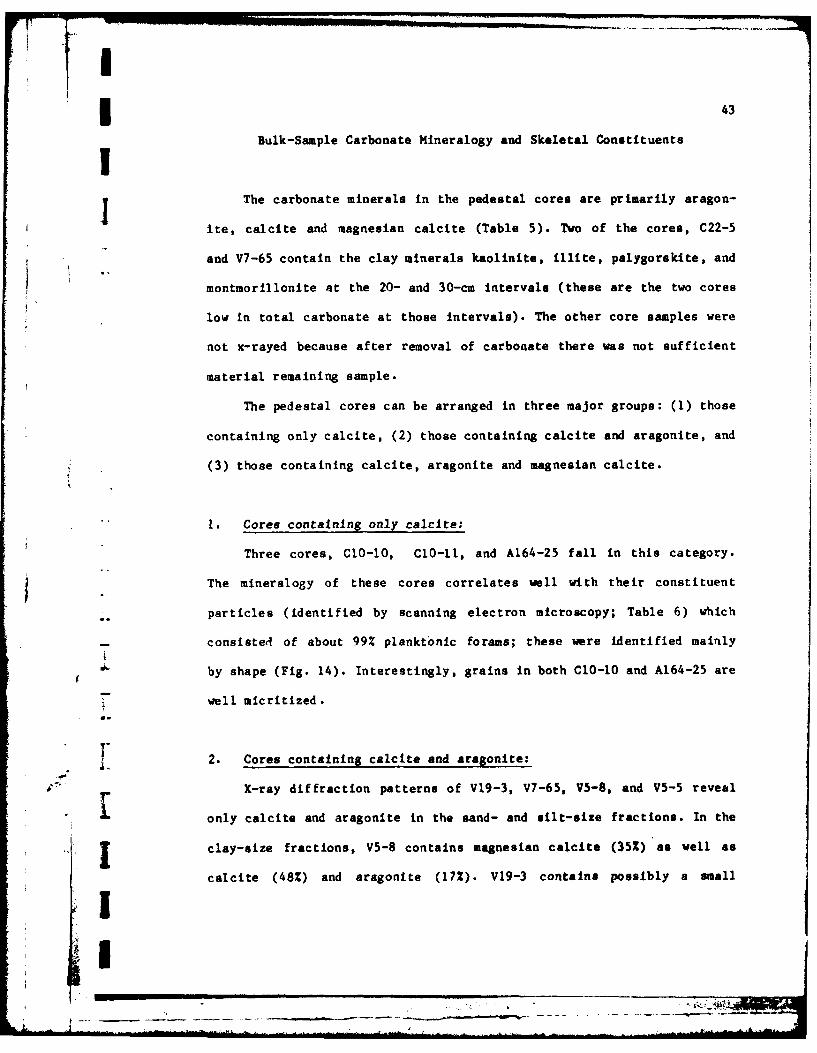
I 43Bulk-Sample Carbonate Mineralogy and Skeletal Constituents!
The carbonate minerals in the pedestal cores are primarily aragon-
ite, calcite and magnesian calcite (Table 5). Two of the cores, C22-5
and V7-65 contain the clay minerals kaolinite, illite, palygorskite, and
montmorillonite at the 20- and 30-cm intervals (these are the two cores
low in total carbonate at those intervals). The other core samples were
not x-rayed because after removal of carbonate there was not sufficient
material remaining sample.
The pedestal cores can be arranged in three major groups: (1) those
containing only calcite, (2) those containing calcite and aragonite, and
(3) those containing calcite, aragonite and magnesian calcite.
1. Cores containing only calcite:
Three cores, C1O-10, ClO-11, and A164-25 fall in this category.
The mineralogy of these cores correlates well with their constituent
particles (identified by scanning electron microscopy; Table 6) which
consisted of about 99% planktonic forams; these were identified mainly
A. by shape (Fig. 14). Interestingly, grains in both C10-10 and A164-25 are
well micritized.
2. Cores containing calcite and aragonite:
X-ray diffraction patterns of V19-3, V7-65, V5-8, and V5-5 reveal
only calcite and aragonite in the sand- and silt-size fractions. In the
I clay-size fractions, V5-8 contains magnesian calcite (352) as well as
calcite (48%) and aragonite (172). V19-3 contains possibly a small
i!

44
TABLE 5. CARBONATE MINERALOGY OF THlE SAND, SILT AND CLAY FRACTIONS
OF THE PEDESTAL CORES
Mineralogy
Sand FractionAragonite Calcite Mg Calcite
V5-5 26 74-C10-1 - 10OO
C22-5 41 28 31V5-8 47 53 -
CIO-7 40 13 47C22-6 39 28 33C22-2 26 36 38010-11 - 100A164-25 -100 -
V7-65 11 89 -
V19-3 36 64 -
Silt
V5-5 39 61 -
010-10 -100 -
022-5 35 13 52V5-8 so 50C10-7 28 23 49C22-6 34 23 44C22-2 36 24 40
010-11 -100 -
A164-25 -100V7-65 10 90-V19-3 19 81 poss a am amt,
Clay
V5-5 38 67-010-10 -100 -
C22- 5 28 48 24V5-8 17 48 35C10-7 24 27 49C22-6 26 57 17C22-2 19 47 34CLO-il 100 -
A164-25 -100 -
C7-65 3 97 -
V19-3 8 92 -
6. .

I 45
I!
] TA8LE 6. CORRELATION BETWEEN SKELETAL COMPONENTS AND MINERALOGY
SKELETAL COMPONENTS*
Core Skel components Mineralogy
V5-5 M- PF - ES - SS A - CaCl0-10 PF CaC22-5 PF -M A - Ca - MCaV5-8 PF - C/A - M A - Ca pose MgCaCIO-7 PF M - SS - ES A - Ca - MCaC22-6 PF -M A - Ca - MgCa
I C22-2 PF M A - Ca MCaCI0-11 PF CaA164 PF CaV7-65 PF -M A - CaV19-3 PF - C/A A - Ca
*M: MolluscsPF: Planktonic ForameniferaES: Eschinoid fragments
SS: Sponge spiculesC/A: Coral and Algae
I
S i
" -L-
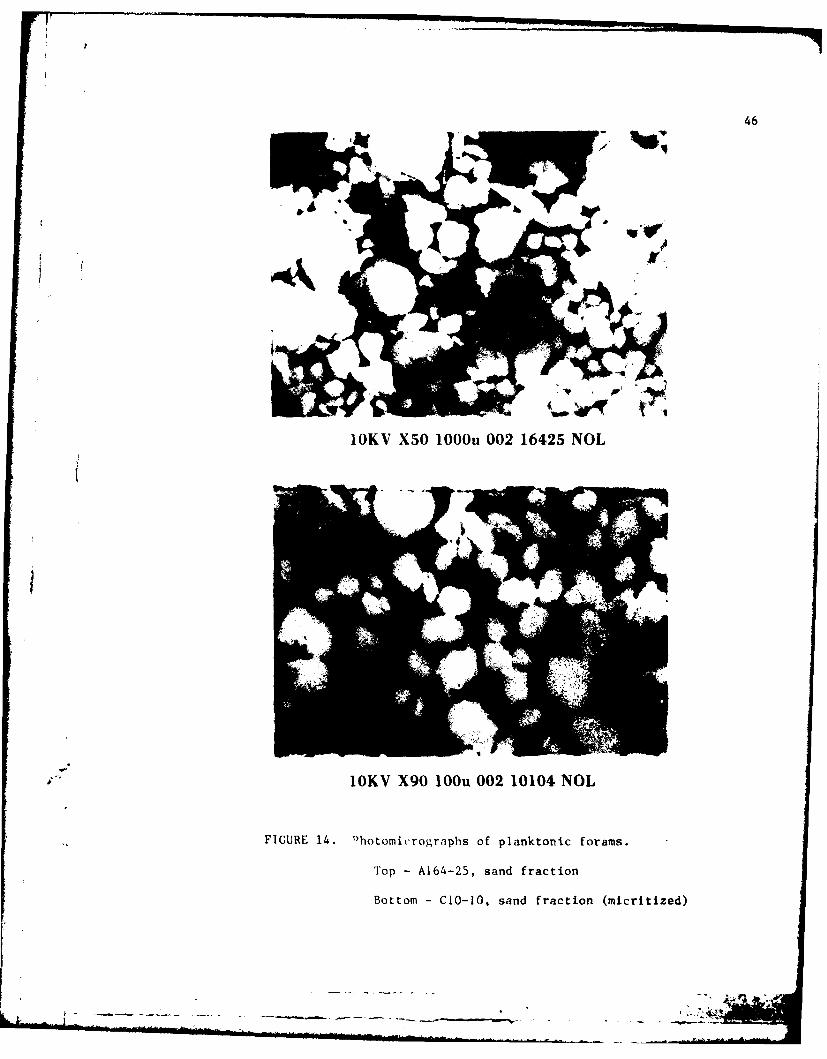
46
10KV X50 1000u 002 16425 NOL
10KV X90 100u 002 10104 NOL
FIGURE 14. "hotomicrographs of planktonic forams.
Top - A164-25, sand fraction
Bottom -CIO-lO, sand fraction (micritized)
r ! I
47
amount of magnesian calcite in the silt-size fraction, however, the
X-ray peak is so small that the presence or absence of magnesian calcite
is a matter of judgment.
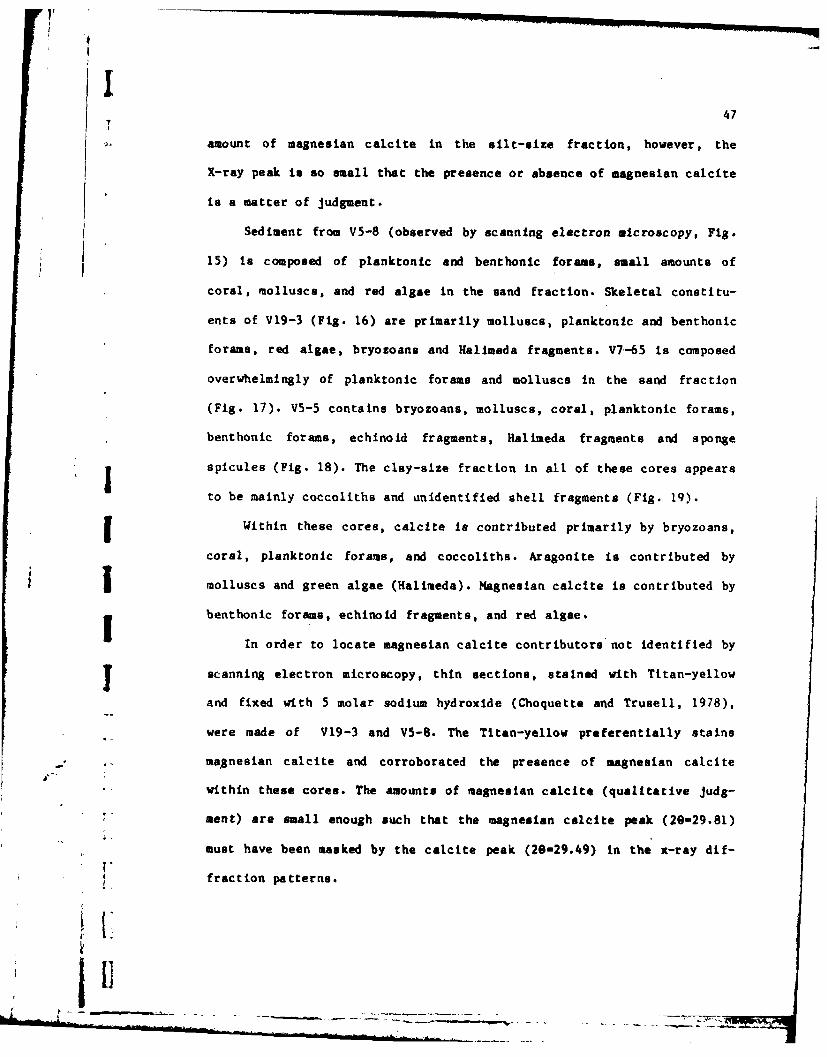
Sediment from V5-8 (observed by scanning electron microscopy, Fig.
15) is composed of planktonic and benthonic forams, small amounts of
coral, molluscs, and red algae in the sand fraction. Skeletal constitu-
ents of V19-3 (Fig. 16) are primarily molluscs, planktonic and benthonic
forams, red algae, bryozoans and Halimeda fragments. V7-65 is composed
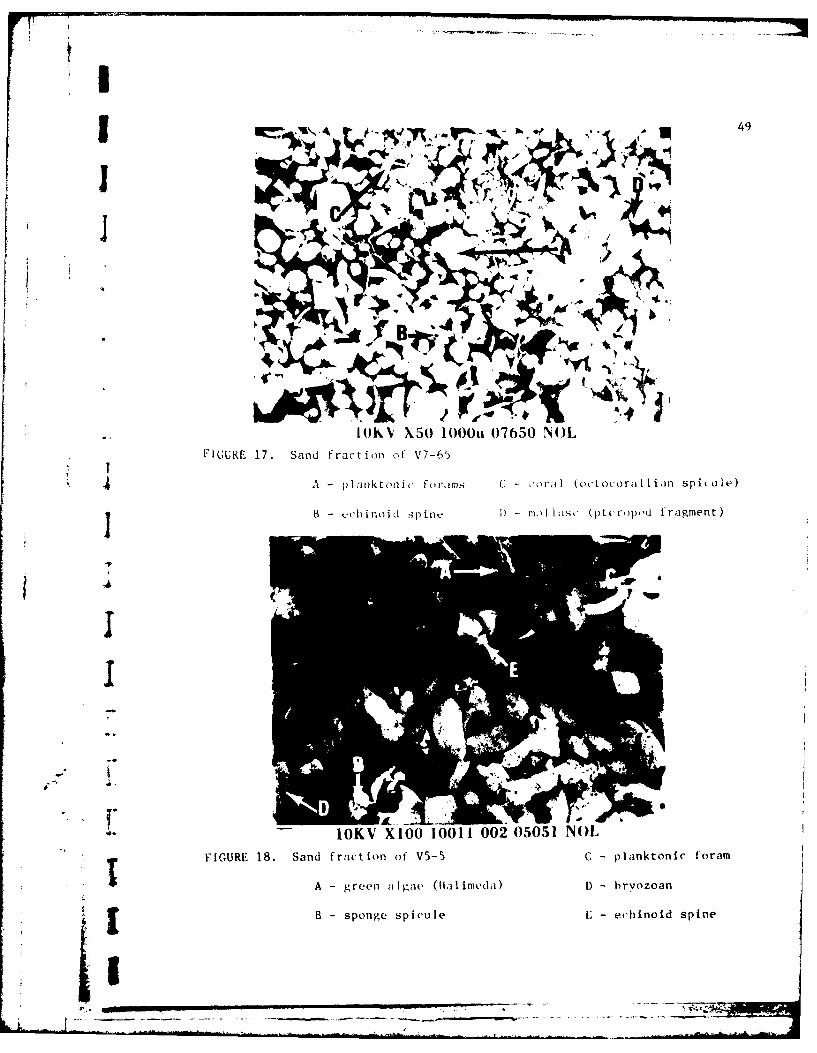
overwhelmingly of planktonic forams and molluscs in the sand fraction
(Fig. 17). V5-5 contains bryozoans, molluscs, coral, planktonic forams,
benthonic forams, echinoid fragments, Hallimeda fragments and sponge
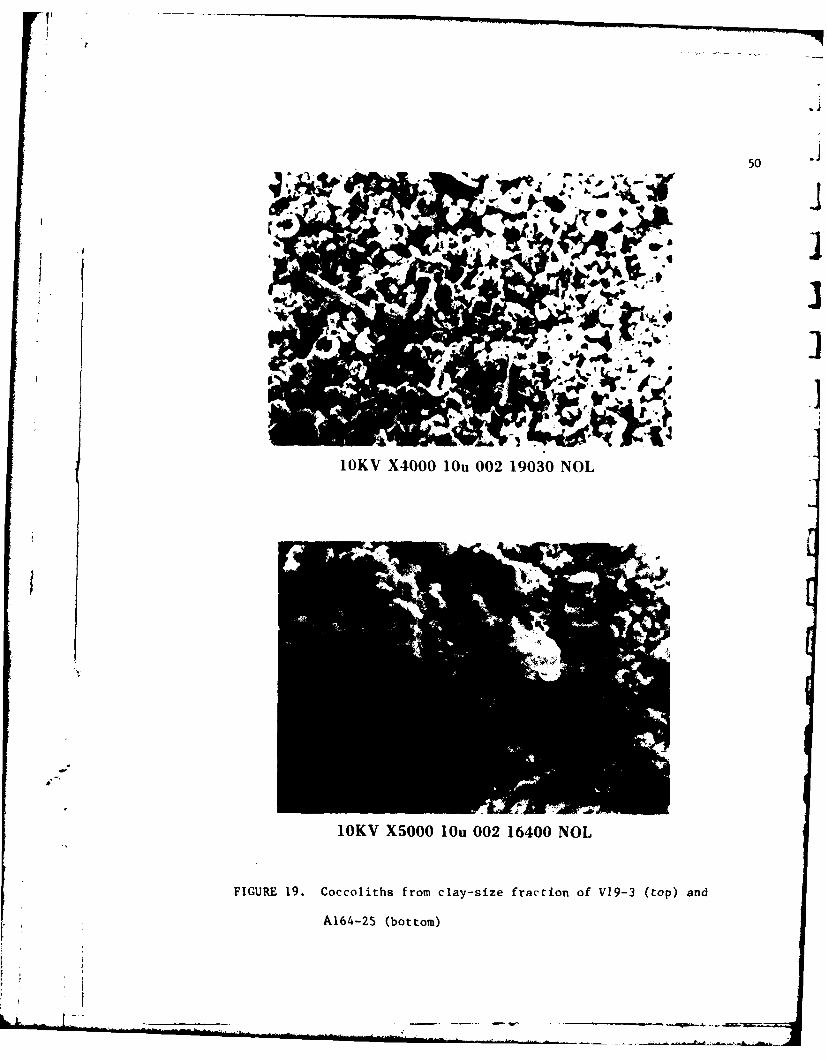
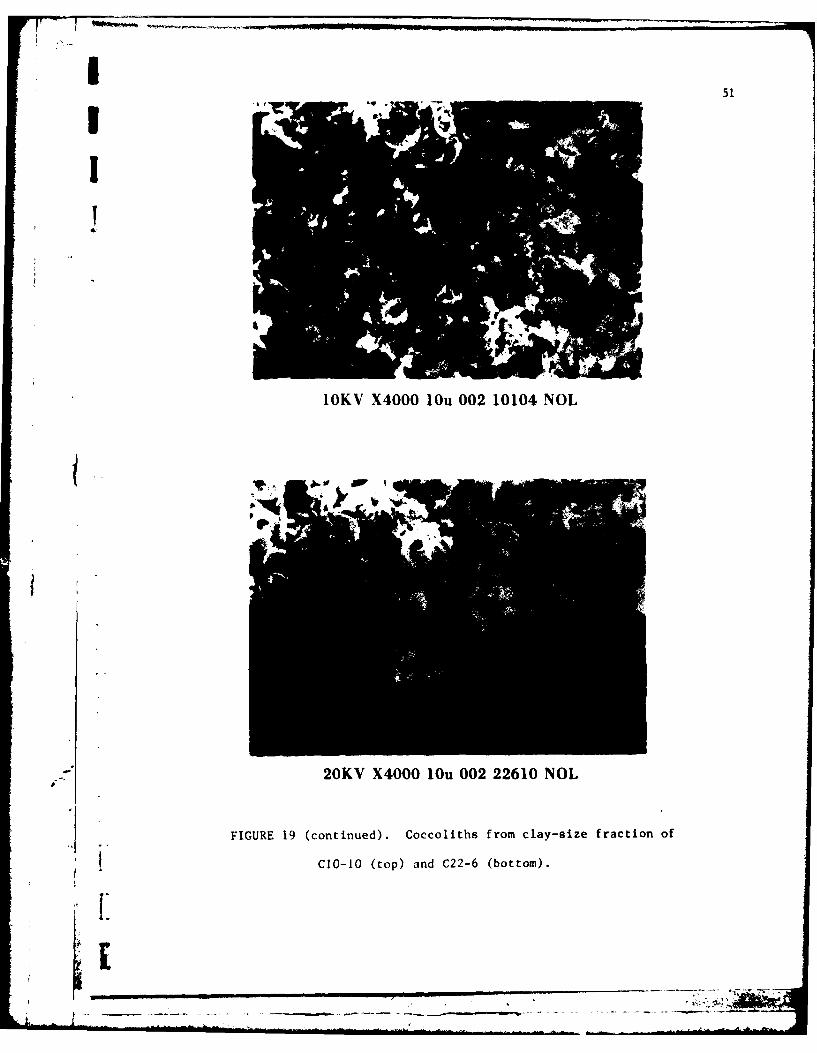
spicules (Fig. 18). The clay-size fraction in alt of these cores appears
to be mainly coccoliths and unidentified shell fragments (Fig. 19).
Within these cores, calcite is contributed primarily by bryozoans,
coral, planktonic forams, and coccoliths. Aragonite is contributed by
5 molluscs and green algae (Halimeda). Magnesian calcite is contributed by
benthonic forams, echinoid fragments, and red algae.
In order to locate magnesian calcite contributors'not identified by
scanning electron microscopy, thin sections, stained with Titan-yellow
and fixed with 5 molar sodium hydroxide (Choquette and Trusell, 1978),
were made of V19-3 and V5-8. The Titan-yellow preferentially stains
.. -magnesian calcite and corroborated the presence of magnesian calcite
within these cores. The amounts of magnesian calcite (qualitative judg-
ment) are small enough such that the magnesian calcite peak (20-29.81)
must have been masked by the calcite peak (2e-29.49) in the x-ray dif-
fraction patterns.
An"M
48
*A'V
10KV X50 1000u 001 05080 NOL
FIGURE 15. Sand fraction of V5-8
A - pianktonic foramn C - benthonic forami
B3 - mollusc (pteropod) I) - green algae (Halimeda)
10KV X50 1000u 006 01930 NOL
FIGURE 16. Sand fraction of V19-3
A -planktonic forams
419
II
-B~
IOKV X50 1000u 17650 NOL
FIGURE 17. Sand fraction of V7-65T
4 A - planktonic forams : - , 01 (octocorallian spitule)
B - tchilnoid pine I) - t I s (1l t( ropod I- ra gment)
I
IOKV X100 10011 002 05051 NOL
FIGURE 18. Sand fraction of V5-5 C - planktonic foram
A green algae (Halirneda) D - bryozoan
B - sponge spicule I; - echinold spine
" |
50
61
10KV X5000 10u 002 16400 NOL
FIGURE 19. Coccoliths from clay-size fraction of V19-3 (top) and
A164-25 (bottom)
51
10KV X4000 10u 002 10104 NOL
1JW
20KV X4000 10u 002 22610 NOL
FIGURE 19 (continued). Coccoliths from clay-size fraction of
CIO-10 (top) and C22-6 (bottom).
52
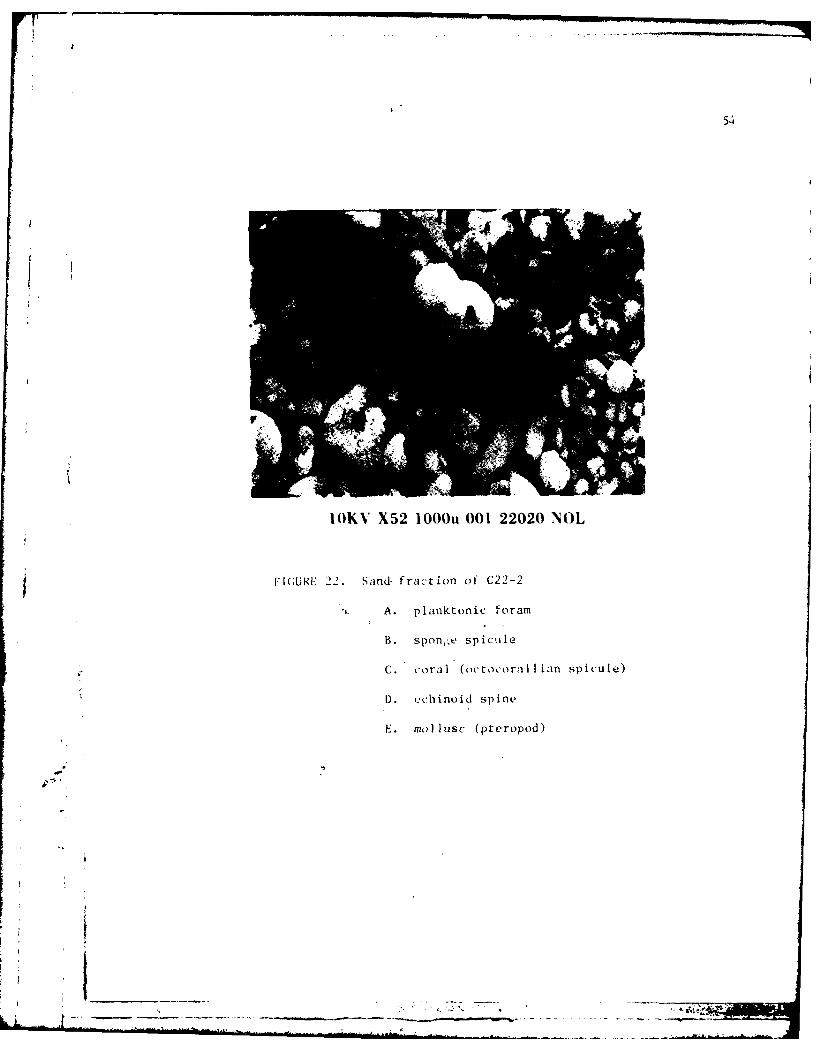
3. Cores containing calcite, aragonite and magnesian calcite:
The primary constituents of C22-5, C22-6, and C22-2, as identified
by scanning electron microscopy (Figs. 20, 21, 22) appear to be plank-
tonic forams and molluscs. Benthonic forams and red algae are present
in smaller quantities (around 3%, Table 7). There are a large number of
unidentified shell fragments in these cores (36%, 58%, and 32% respec-
tively). The aragonite and calcite identified by x-ray ckn be easily
accounted for by organisms present. Since the larger percentages of
magnesian calcite (31%, 33% and 38% respectively) are more difficult toi
explain, thin sections were made of the sand fractions of the top in-
tervals of these cores in an effort to determine source of magnesian
calcite.
The unidentified shell fragments C22-5 were reexamined with a Kevex
X7000 Energy Dispersive X-Ray Spectrometer (Kevex, Inc., Forest Hills,
Calif.) to determine their elemental compositions. Mos't appear to be
calcite or aragonite. Some of the fragments contain magnesium although
the exact amounts cannot be determined with this system. When only mag-
nesium and calcite are considered, magnesium, as percentage of combined
weight, is present in quantities generally between 1 and 32, although in
one fragment, 15% magnesium was found.
Stained thin sections (Choquette and Trusell, 1978) were again used
to determine the source of magnesian calcite. Red algae and echinold
fragments, identified in thin section, appear to be the primary con-
tributors of the magnesian calcite (qualitative judgment). Magnesian
calcite, however, was also present as Intragranular cement in pores of
planktonic forams and in algal borings similar to that found by
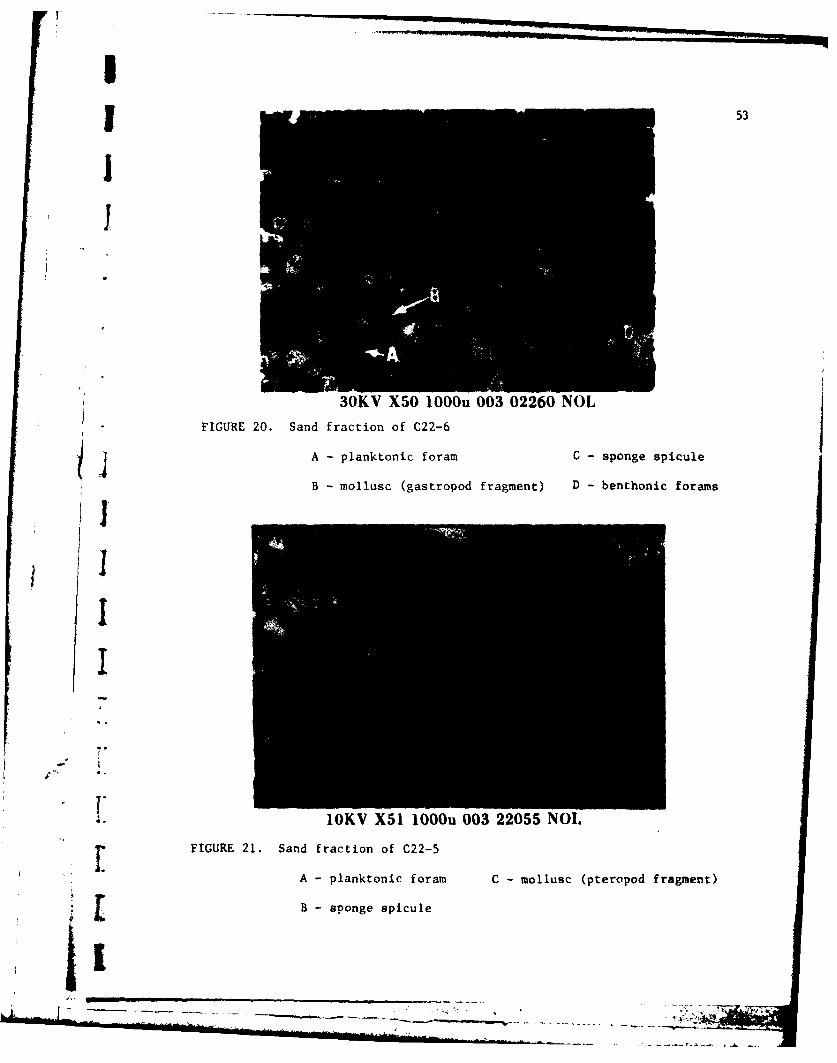
1 53
30KV X50 1000u 003 02260 NOL
Aplanktonic foram C - sponge spicule
FIGURE 2. Sand fraction of C22-
B - pakoi o mollusc (gastropod fragment) D-bnhncfrm
B pne pcl
54
IOKN7 X52 1000u 001 22020 NOL
F IGURE. 22. Sand- fra-t ion of C22-2
A. planktonic foram
B~. sponl.,e spicule
C.-oral (otcrillian spicule)
D. t'chifloid spine
E.mol lusc (ptc'ropod)

1,: 55
I- N 1 1 1 1' 4
oin C- SC
U-.- U N 4 N v N
LAJ o-C4
U;
If,~
4-4
2-. X 1. -C -to 30
t

56
Alexandersson and Milliman from the Brazilian shelf (1981). Finally,
many of the sponge spicules were partially stained red indicating a
magnesian calcite composition which had not been predicted from the
scanning electron microscopy.
The one remaining pedestal core with aragonite, calcite, and jmagnesian calcite constituents, C10-7, also contains benthic forams,
sponge spicules, and red algae in higher quantities than previous cores.
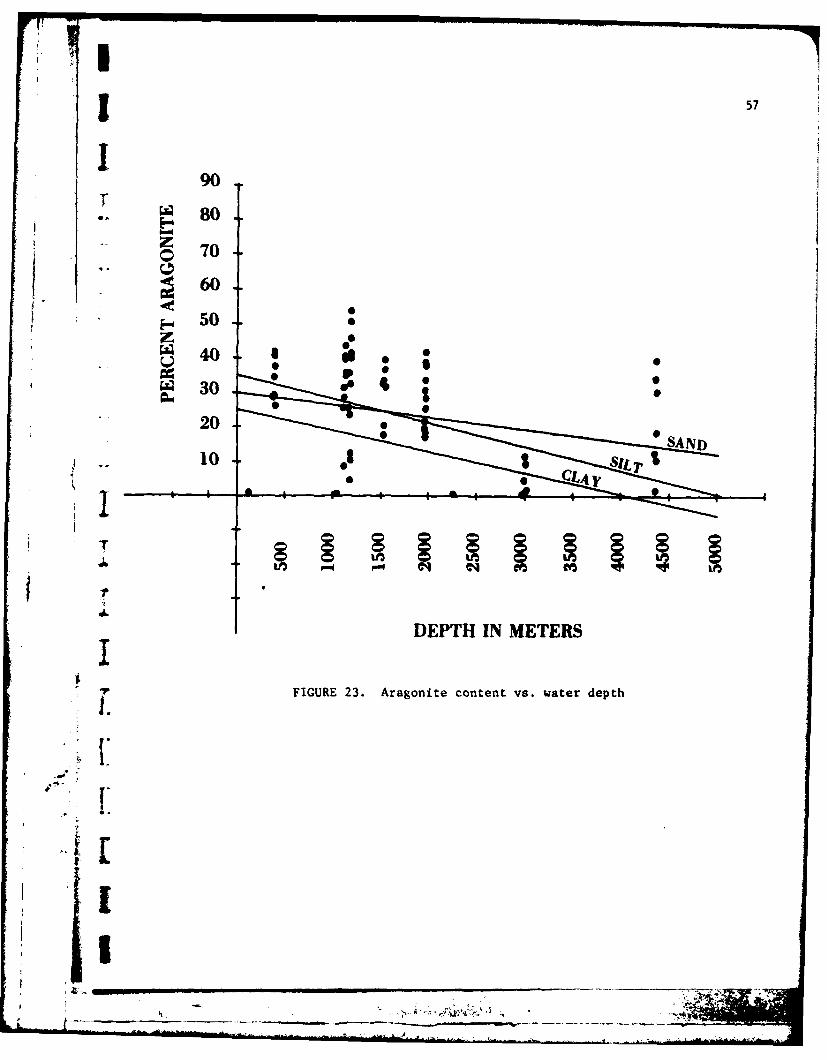
When mineralogy is plotted against depth, general trends can be
observed. For example, when aragonite versus depth in meters Is plotted
(Fig. 23), the slight but definite trend of decreasing aragonite with
increasing water depth is apparent. The cores with highest aragonite
contents, V5-5, C22-5, V5-8, C10-7, C22-6, C22-2, V7-65 and V19-3, all
contain molluscs. The three cores without aragonite contain no molluscs.
The supposition can be made that molluscs are the primary contributors
of aragonite on the pedestal.
Figure 23 also shows that there is a considerable amount of
scatter. It is possible that aragonite is being contributed by different
organisms at different water depths. However, aragonitic contributors
such as coral and green algae appear to be as prevalent in V19-3 (4330
m) as in V5-5 (366 m). The probability is that the aragonite content is
not being significantly affected by varying amounts of different
contributors. Rather, factors such as dissolution and rapid burial may
be more important.
Wilson (1975) states that in sea water aragonite is most soluble,
then magnesian calcite, with low-magnesian calcite being the emost
stable. Thus, in a plot of depth versus calcite/calcite + magnesian
thnmgeinclietihlwingeincliebigtems
p
57
90* I ~ 80
S70
60500
400
30 0
20
100
DEPTH IN METERS
FIGURE 23. Aragonite content vs. water depth
58
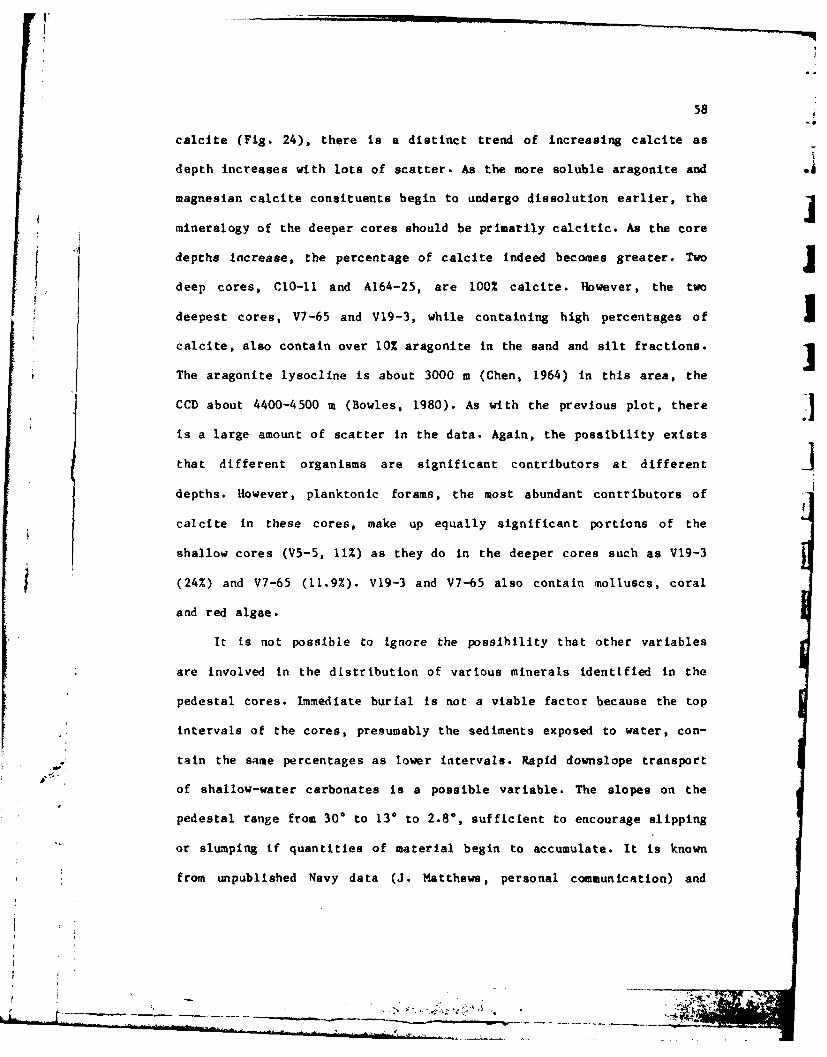
calcite (Fig. 24), there is a distinct trend of increasing calcite as
depth increases with lots of scatter. As the more soluble aragonite and
magnesian calcite consituents begin to undergo dissolution earlier, the
mineralogy of the deeper cores should be primarily calcitic. As the core
* j depths increase, the percentage of calcite indeed becomes greater. Two
deep cores, C1O-I and A164-25, are 100% calcite. However, the two
deepest cores, V7-65 and V19-3, while containing high percentages of Icalcite, also contain over 10% aragonite in the sand and silt fractions.
The aragonite lysocline is about 3000 m (Chen, 1964) in this area, the
CCD about 4400-4500 m (Bowles, 1980). As with the previous plot, there
is a large amount of scatter in the data. Again, the possibility exists
that different organisms are significant contributors at different Idepths. However, planktonic forams, the most abundant contributors of
calcite in these cores, make up equally significant portions of the
shallow cores (V5-5, 11%) as they do in the deeper cores such as V19-3
(24%) and V7-65 (11.9%). V19-3 and V7-65 also contain molluscs, coral
and red algae.
It is not possible to ignore the possibility that other variables
are Involved in the distribution of various minerals identified in the
pedestal cores. Immediate burial is not a viable factor because the top
intervals of the cores, presumably the sediments exposed to water, con-
tain the same percentages as lower intervals. Rapid downslope transport
of shallow-water carbonates is a possible variable. The slopes on the
pedestal range from 300 to 13* to 2.8, sufficient to encourage slipping
or slumping if quantities of material begin to accumulate. It is known
from unpublished Navy data (J. Matthews, personal communication) and
r ___ __ ___"

1 59
.1090
80
70
~60
~50+
40
- 20 3
I DEPTH IN METERS
FIGURE 24. Calcite/calcite and magnesian calcite content VS.
water depth.

60
Heezen and Hollister (1971) that current velocities in the area (both
near the top of the pedestal and around the base) can be quite high.
Although large amounts of sedimentary apron debris have not been identi-
fied from seismic profiles, there is evidence of some slumping (Appendix
5, B-B', C-C', and E-E'). Possibly some of the carbonate sediment being
produced on the shallow platform is being rapidly transported down slope
before dissolution can effectively occur, thus accounting for anoma-
lously high quantities of aragonite and magnesian calcite at depths be-
low where it would be expected.
Grain Size
Table 8 summarizes the grain-size data for the pedestal cores (with
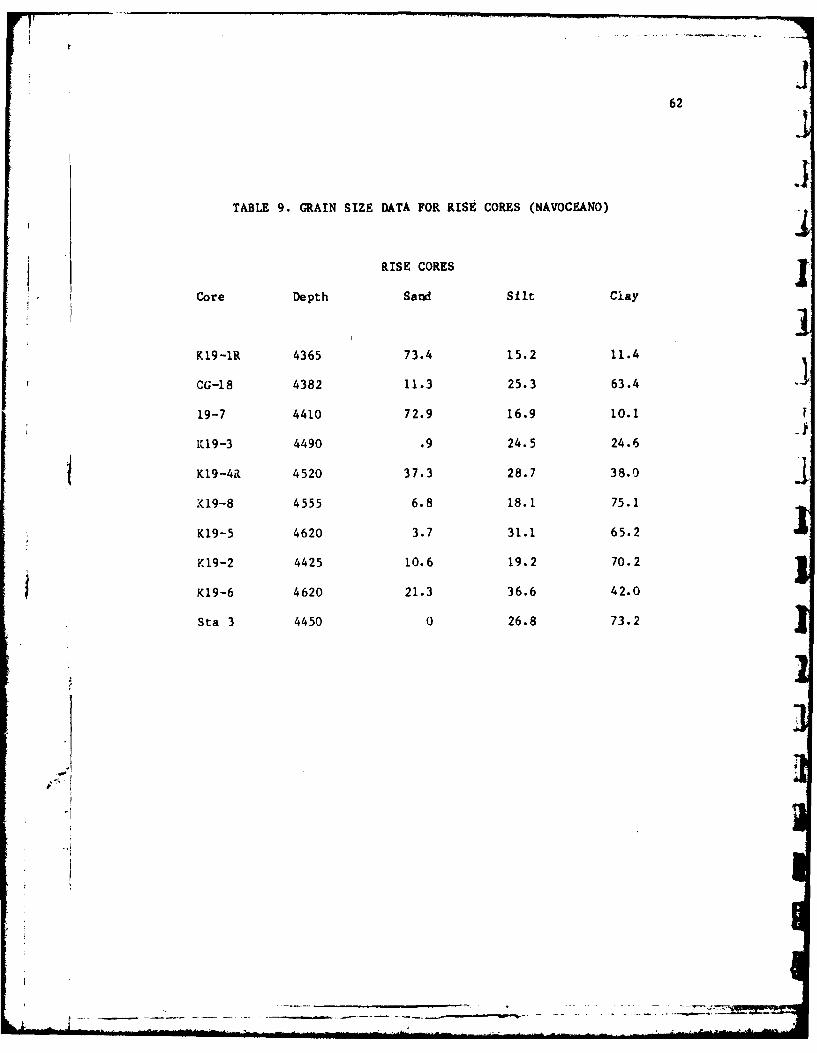
the exception of A164-25). Table 9 summarizes grain size data for the
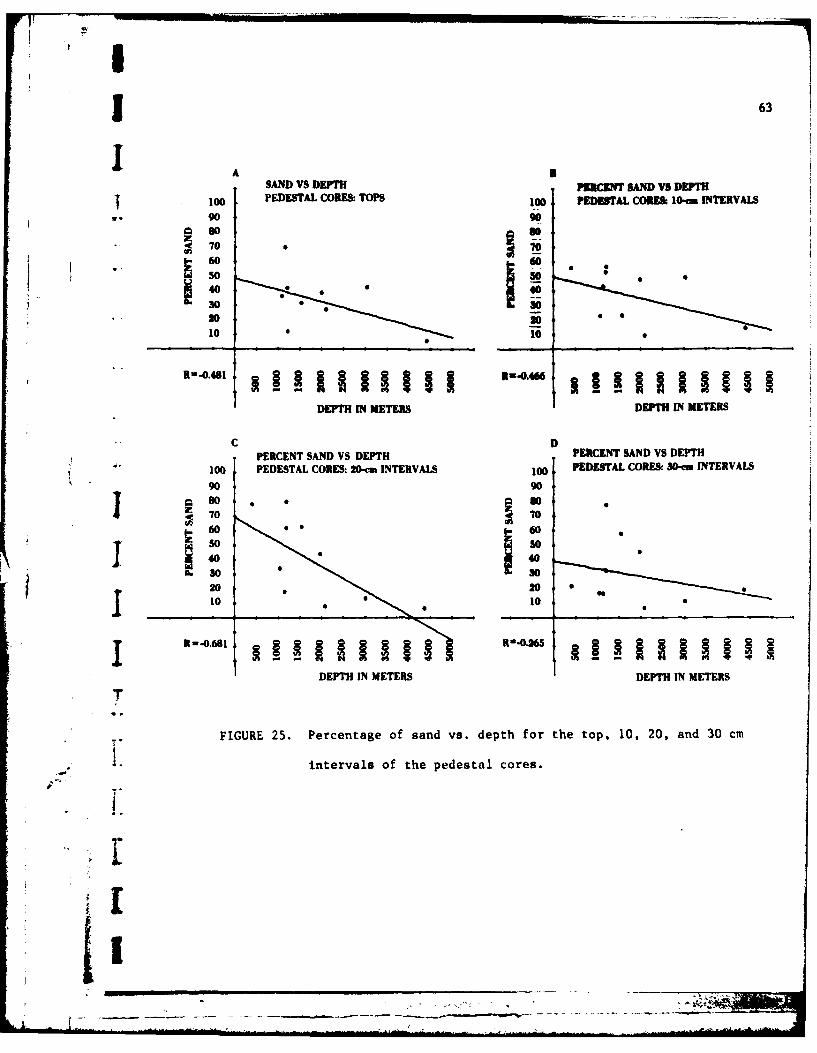
top intervals of the rise cores analyzed by NAVOCEANO. To make visuali-
zation easier, the percentages of sand versus depth have been plotted
for the top 10-, 20-, and 30-cm intervals (Fig. 25). The correlation
coefficients (R) range from -0.265 to -0.681 (Fig. 25). It is evident
that the percentage of sand in all intervals within the cores decreases
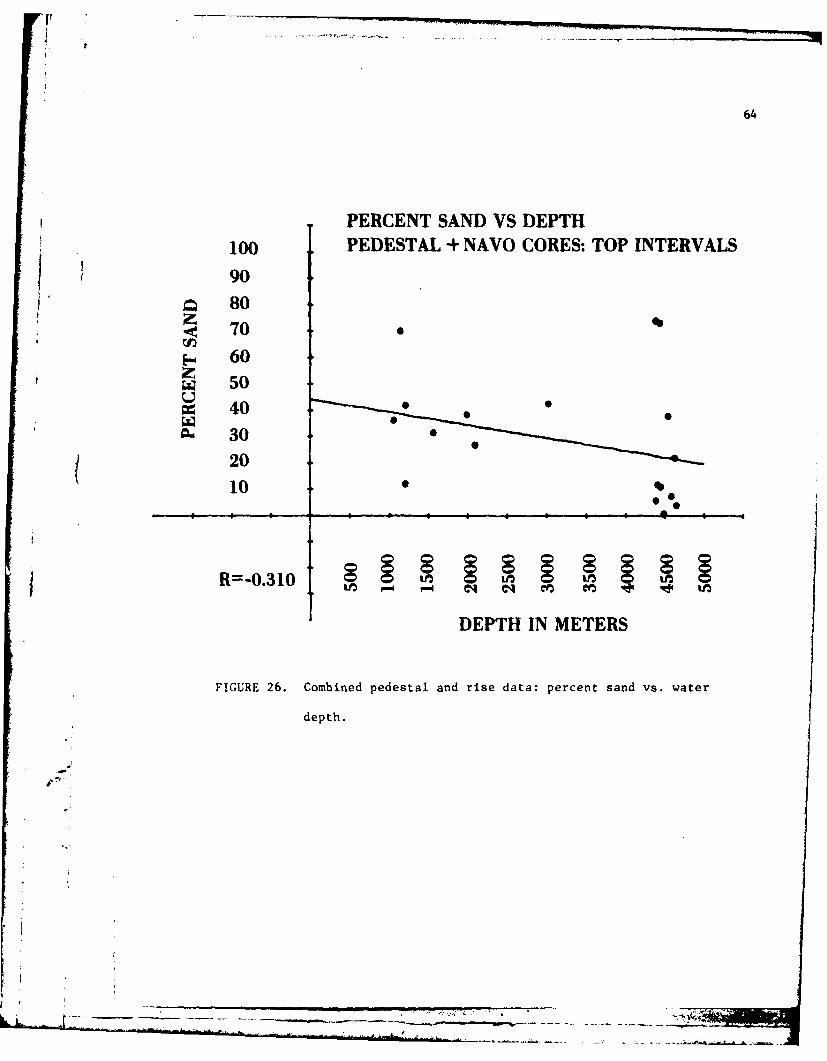
with increasing water depth. When data from the rise cores (NAVOCEANO)
are combined with data from the pedestal cores, the same trend holds;
the correlation coefficient is -0.310 (Fig. 26).
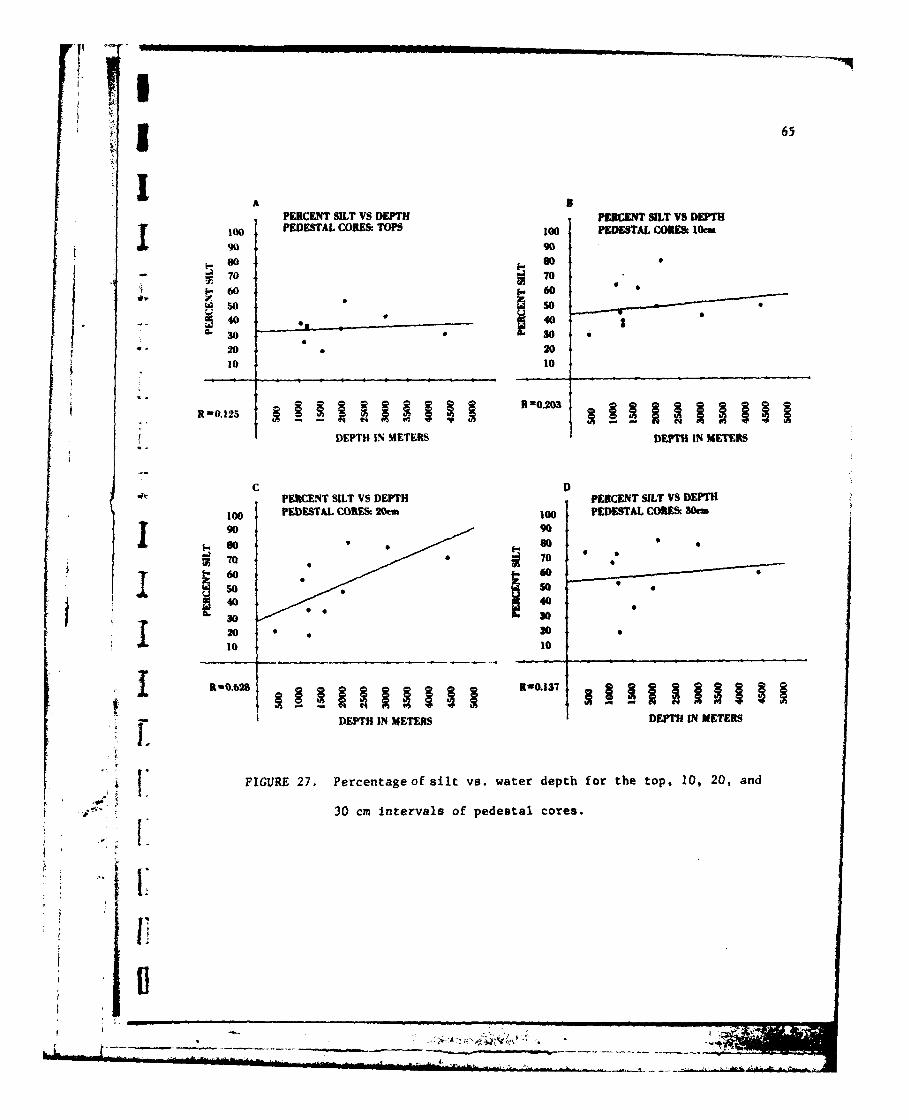
In plots of percentage of silt versus water depth for pedestal
cores, there is a weak positive correlation for the top-, 10-, and 30-cm
intervals (R - 0.125, 0.208, and 0.137 respectively). The correlation is
more positive for the 20-cm interval (0.628, Fig. 07). When data from
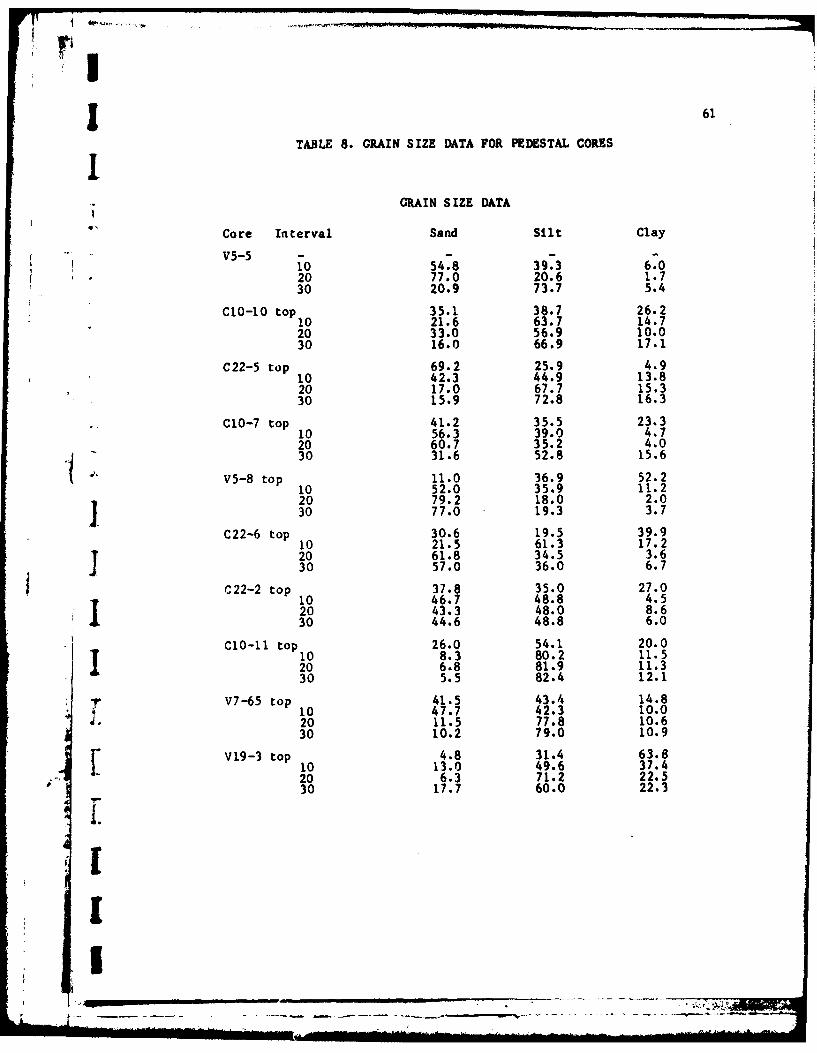
£ 61TABLE 8. GRAIN SIZE DATA FOR PEDESTAL CORESI
GRAIN SIZE DATA
Core Interval Sand Silt Clay
V5-5 - - -10 54.8 39.3 6.020 77.0 20.6 1.730 20.9 73.7 5.4
O-10 top 35.1 38.7 26.210 21.6 63.7 14.720 33.0 56.9 10.030 16.0 66.9 17.1
C22-5 top 69.2 25.9 4.910 42.3 44.9 13.820 17.0 67.7 15.330 15.9 72.8 16.3
C10-7 top 41.2 35.5 23.310 56.3 39.0 4.720 60.7 35.2 4.030 31.6 52.8 15.6
V5-8 top 11.0 36.9 52.210 52.0 35.9 11.220 79.2 18.0 2.030 77.0 19.3 3.7
C22-6 top 30.6 19.5 39.910 21.5 61.3 17.2
20 61.8 34.5 3.630 57.0 36.0 6.7
C22-2 top 37.8 35.0 27.010 46.7 48.8 4.520 43.3 48.0 8.630 44.6 48.8 6.0
CLO-i top 26.0 54.1 20.010 8.3 80.2 11.520 6.8 81.9 11.330 5.5 82.4 12.1
V7-65 top 41.5 43.4 14.810 47.7 42.3 10.020 11.5 77.8 10.630 10.2 79.0 10.9
V19-3 top 4.8 31.4 63.810 13.0 49.6 37.4
- 20 6.3 71.2 22.530 17.7 60.0 22.3
I.
I
... ..... _ - .- -
62
TABLE 9. GRAIN SIZE DATA FOR RISE CORES (NAVOCEANO)
RISE CORES
Core Depth Sand Silt Clay
Ki9-1R 4365 73.4 15.2 11.4
CG-18 4382 11.3 25.3 63.4
19-7 4410 72.9 16.9 10.1
K19-3 4490 .9 24.5 24.6
K19-4R 4520 37.3 28.7 38.0
:19-8 4555 6.8 18.1 75.1
K19-5 4620 3.7 31.1 65.2
K19-2 4425 10.6 19.2 70.2
K19-6 4620 21.3 36.6 42.0
Sta 3 4450 0 26.8 73.2
- - --- ~~~- -~- ---- - - - -- ---
I 63
I A
SAND VS DEPTH PERCENT SAND VS DEPTH
100o PEDESTAL CORES: TOPS 100 PEDESTAL CO)RES 104. INTERVALS90
s0
70 7060 60S
40030 3 5 0
10 *1000
DEPTH IN METERS DEPTH IN METERS
C DPERCENT SAND VS DEPTH PERCENT SAND VS DEPTH
100 PEDESTAL CORES: 20-cm INTERVALS 100 PEDESTAL CORE 30-m INTERVALS
90 90
so S 0 so70 7060 ~60so so40 "40
t 20 SO ,
R 10 16810 , "
DEPTH IN METERS DEPTH IN METERS
FIGURE 25. Percentage of sand vs. depth for the top, 10, 20, and 30 cm
4- intervals of the pedestal cores.
ii-.
a' ___
64
PERCENT SAND VS DEPTH100 PEDESTAL + NAVO CORES: TOP INTERVALS90
S80S70
E'60S50
400~ 40
300
2010
R=-0.310P0 4e M M
DEPTH IN METERS
FIGURE 26. Combined pedestal and rise data: percent sand vs. water
depth.
I 1 65
A5PERCENT SILT VS DEPTH PERCENT SILT VS DEPTH
too PEDESTAL CORES: TOPS 100 PEDESTAL CORES: 10cm
90 9O80 so- 70 70
z-60 60'I50 * sO
:~40 40230 o30
1. 20 * 2010 10
R -0.125 e
DEPTH IN METERS DEPTH IN METERS
C D- PERCENT SILT VS DEPTH PERCENT SILT VS DEPTH
100 PEDESTAL CORE.S: 20em 100 PEDESTAL CORES. 30cm
90 90
7060 6
40 40
S300
800
10 10
SR-0.601 R-.137
DEPTH IN METERS DEPTH IN METERSI,
4 1 FIGURE 27. Percentageofsilt vs. water depth for the top, 10, 20, and
30 cm intervals of pedestal cores.
1!
,- ,.. t 1_.--.--,, -i U
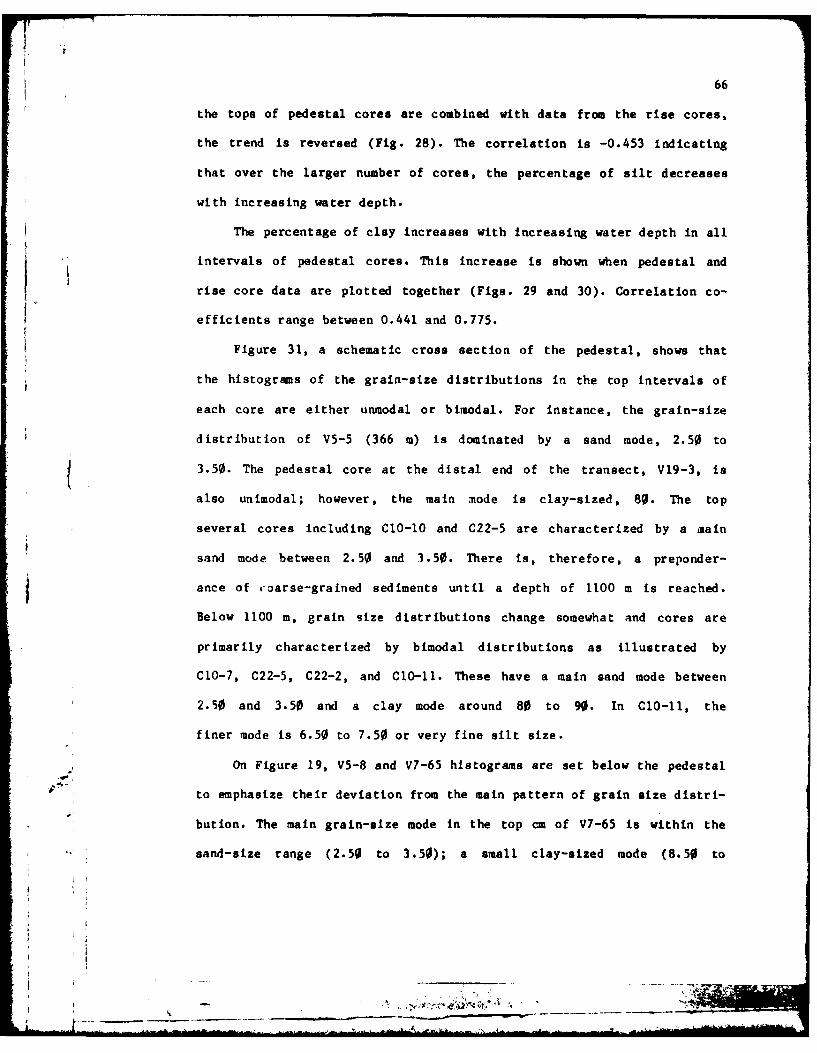
66
the tops of pedestal cores are combined with data from the rise cores,
the trend is reversed (Fig. 28). The correlation is -0.453 indicating
that over the larger number of cores, the percentage of silt decreases
with increasing water depth.
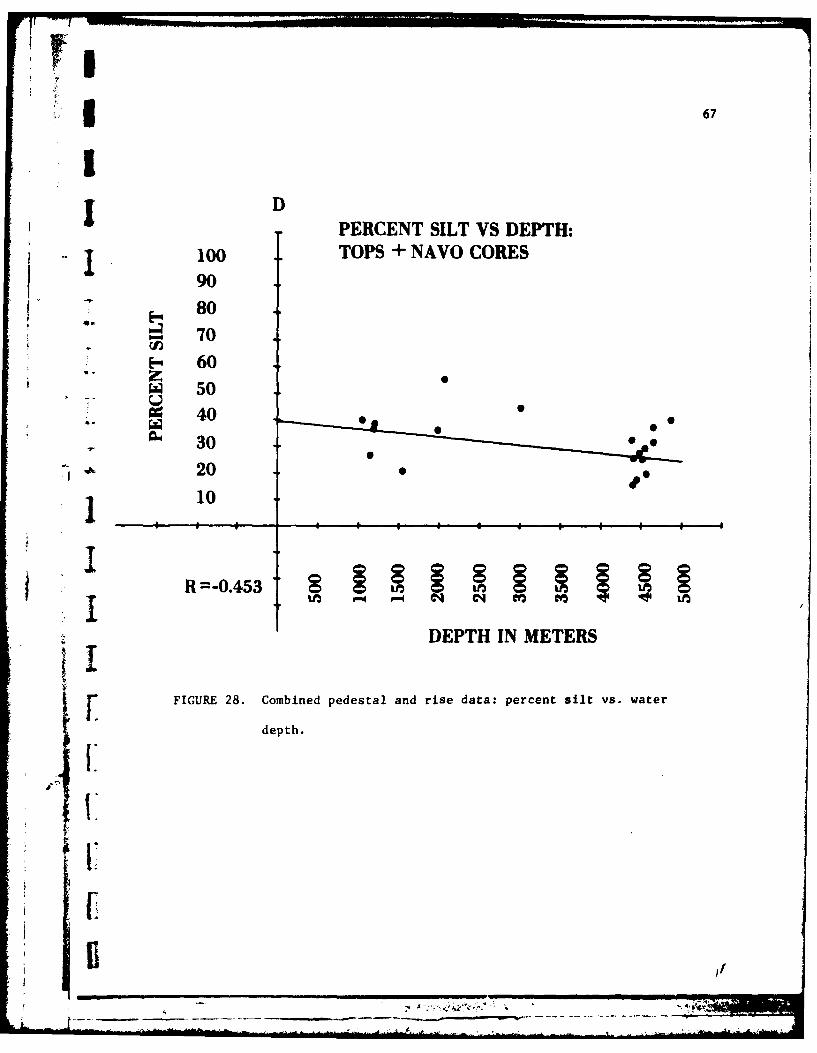
The percentage of clay increases with increasing water depth in all
intervals of pedestal cores. This increase is shown when pedestal and
rise core data are plotted together (Figs. 29 and 30). Correlation co-
efficients range between 0.441 and 0.775.
Figure 31, a schematic cross section of the pedestal, shows that
the histograms of the grain-size distributions in the top intervals of
each core are either unmodal or bimodal. For instance, the grain-size
distribution of V5-5 (366 m) is dominated by a sand mode, 2.50 to
3.50. The pedestal core at the distal end of the transect, V19-3, is
also unimodal; however, the main mode is clay-sized, 80. The top
several cores including C1O-1O and C22-5 are characterized by a main
sand mode between 2.50 and 3.50. There is, therefore, a preponder-
ance of ,oarse-grained sediments until a depth of 1100 m is reached.
Below 1100 m, grain size distributions change somewhat and cores are
primarily characterized by bimodal distributions as illustrated by
C10-7, C22-5, C22-2, and CIO-11. These have a main sand mode between
2.50 and 3.50 and a clay mode around 80 to 90. In C1O-11, the
finer mode is 6.50 to 7.50 or very fine silt size.
On Figure 19, V5-8 and V7-65 histograms are set below the pedestal
to emphasize their deviation from the main pattern of grain size distri-
bution. The main grain-size mode in the top cm of V7-65 is within the
sand-size range (2.50 to 3.50); a small clay-sized mode (8.50 to
-- ~.
* 67
D* PERCENT SILT VS DEPTH:
100 TOPS + NAVO CORES90
V 8070
E-i 60500
S40
S3020'
100
DEPTH IN METERS
U FIGURE 28. Combined pedestal and rise data: percent silt vs. water
depth.
-,44Al
68
ABPERCENT CLAY VS DEPTH: PERCENT CLAY VS, DEPTH:
10 PEDESTAL CORES. TOP 10 PEDESTAL CORES: 10-m INTERVALS
90 90~80 80
70 70~60 ~-60
~40 ~4030 30
20 20
DEPTH IN METERSDETINMER
CDPERCENT CLAY VS DEPTH PERCENT CLAY VS DEPTH
10 PEDESTAL CORES: 20-tmn INTERVALS 100 PEDESTAL CORES: 30-cnm INT'ERVALS
.80 ~. 80
70 -~70
I60 60so so5
~40 ~40A.30 A.30
R(0.755 R=0.483
DEPTH IN METERS DEPTH IN METERS
FIGURE 29. Percentage of clay vs. water depth for the top. 10. 20, and
30 cm intervals of the pedestal cores.

IP
£ 69
PERCENT CLAY VS DEPTH:100 TOP+NAVO CORES
* ~ 90~80Q70 dlE60S50
S 20 .......I ~~10 _____
J R=.447
DEPTH IN METERS
I FIGURE _AO. Combined pedestal and rise data: p~rcent clay sized material
vs. water depth.
70
- I
got
5 0
isi~P a~ a ) O
Sd .1 '
C) 0
09 C to 0-II
c Ca
cc4 0 C
ul 1 - 0
11
!40
.. . ... ... 1 C
dl 719.50) is present. Such large amounts (41%) of sand-sized sediment at
Ithis depth (2970 m) are unexpected. One would expect V5-8, recovered
from a higher position on the pedestal (1150 a), to contain more sand-
sized than clay-sized grains, yet the reverse is true.
Grain sizes for the different intervals within the same core vary
considerably (Table 8). For example, in the shallow core V5-5, at the
10-, 20-, and 30-cm intervals, the percentage of sand varies between
55%, 77%, and 21%. The clay-sized fraction is small in all intervals
(6%, 1.7%, and 5.4%). At 2094 m, C22-5 shows a marked decrease in the
sand fraction (69%, 42%, 172, and 16%) while the silt fraction increases
(26%, 46%, 68%, and 73%). Similar variation among core intervals occurs
4-. in other cores. Within V5-8, for example, sand varies between 11%, 52%,
j79%, and 772; concurrently, silt decreases (37%, 362, 2%, and 4%). In
the deepest pedestal core, V19-3, sand is low in all intervals while the
percentage of silt and clay varies considerably (Table 8).
Johnson et al. (1977) show evidence that on the Ontong Java Plateau
mean grain size of sediments decreases at deposition sites primarily
because of dissolution and fragmenting of calcareous microfossils.
Determining the mean grain size is difficult for the Bermuda Pedestal
cores since distributions of grain size are bimodal in many cases. In
general, however, grain sizes are coarser at the top of the pedestal
, . than the bottom or on the rise.
In the top intervals of the rise cores (NAVOCEANO), all taken
* within the same few hundred meters of water depth and roughly at the
CCD, there is considerable variation. Sand varies between 0.9% and
73.4%. One of the main points, therefore, is that the highly variablejf.r,_
72
grain sizes in similar locations and within the same cores over small
intervals indicate deposition cannot be occurring steadily. This same
variability is also seen in the pedestal cores. It is likely, therefore,
that deposition is discontinuous, with sediment being deposited episodi-
cally as slump material, tubidity deposits, etc. Material may also be
resuspended by currents and eddies and be redeposited elsewhere on the
Bermuda Apron and Rise. Such processes would account for the low corre-
lation coefficients between grain size and water depth.
4L{i
I, -I
'II
II
173SUMMARY AND CONCLUSIONS
r The variables examined in this study are:
1. location on the pedestal, i.e., water depth
2. total carbonate content
3. constituent grains
4. bulk-sample carbonate mineralogy
5. grain size
The relationships between these variables are complex, but a few general
statements can be made. There is an overall relationship between water
depth and all the other variables. Total carbonate content generally
6 decreases with increasing water depth. The percentage of aragonite and
magnesian calcite declines with increasing water depth. The types of
constituent particles present are related to water depth. In shallower
Idepths, there are a variety ot organisms present. With increasing water
depth, fewer types of organisms are present. Planktonic forams become
I more prevalent with deeper water and shallow-water reef debris becomes
less prevalent. Grain size generally becomes smaller with increasing
water depth. Other relationships among variables follow:
1. Grain size and constituent particles: Pelagic forams are almost
always sand size and compose the bulk of the sand modes (SEM
--.. examination).
2. Grain size and total carbonate: As total carbonate decreases, so
does grain size; whether this was due to greater contributions of clay
minerals or due to dissolution of carbonate sediment could not be
determined with the samples available. Since the clay-sized fractions
_ __ _
74
contained appreciable numbers of coccoliths, the size decrease may be
related to the constituent grains.
3. Constituent particles and mineralogy: Constituent grains corre-
late well with mineralogy. Planktonic forams are the major contributors jof calcite, molluses and Halimeda are the major contributors of aragon-
ite, and red algae and echinoid fragments are the major contributors of
magnesian calcite. ]While these trends are present, they are often overlain by high
variability in the data. Correlation coefficients are generally weak.
This variability and scatter indicate that sediment types and
distribution on the pedestal may not be controlled by sedimentation
rates; turbidity currents and slumping play an important role in
sediment distribution on the pedestal and apron.
The sediments on the Bermuda Pedestal are significantly different
from sediments on the rise. Whereas sediments on the rise are almost
entirely nanofossil oozes with a high clay mineral content, sediments on
the pedestal are almost entirely carbonate with very little clay mineral
content. Sediments on the pedestal are a combination of material de-
posited from the platform such as red algae, Halimeda, sponge spicules,
bryozoan and coral particles, and pelagic material such as ostracods,
coccoliths, and planktonic forams. There are also a host of benthic
organisms such as molluscs, echinoids, and benthic forams which may be
indigenous to the area from which they were recovered. Organisms indige-
nous to shallow reef areas were found at great depths on the pedestal j(around the CCD and below), indicating that rapid, downslope transport
must have occurred.
I' I
1 75The distribution of these sediments on the Bermuda Pedestal is
I largely controlled by the bathymetry of the area. Seismic profiles indi-
cate sparse sediment cover on the pedestal and much thicker cover on the
apron and rise. Sediment thickness, as detected by seismic profiles,
jranges from the pinchout near the base of the pedestal to greater than
900 m on the rise near DSDP Site 386. Batyhymetry shows extremely steep
slopes (30*) on the upper reaches of the pedestal and gentler slopes
(2.8-3.5*) on the apron where sediment is accumulating. There is also
evidence of some slumping and turbidity flows, which supports the
hypothesis that sediment is being transported down the seamount by these
processes.
IFinally, currents may also play a part in the distribution of sedi-
ments. Strong currents on the pedestal may encourage the initiation of
transport, and currents on the apron and rise may resuspend and redis-
Jtribute sediments from these areas.
'I
- -
76
REFERENCES
Alexandersson, E.T. and J. D. Milliman (1981). Intragranular Mg-CalciteCement in Halimeda Plates from the Brazilian Continental Shelf. Journalof Sedimentary Petrology, v. 51, No. 4, p. 1309-1314.
Bathurst, R.G.C. (1971). Carbonate Sediments and Their Diagenesis:Elsevier Scientific Publishing Co., New York, 658 p.
Bialek, E.L. (1966). Handbook of Oceanographic Tables, Matthews Tables,Table 11, U.S. Naval Oceanographic Office, Washington, D.C. p. 63-96.
Bowles, F.A. (1975). Geology/Geophysics near Bermuda. In: PhysicalEnvironmental Scenario for the Near Bermuda Area. Ocean Engineering andConstruction Project Office (FPO-l), Chesapeake Div., Naval FacilitiesEngineering Command, Washington, D.C. p. B-1-12 - B-1-21.
Bowles, F. A. (1979). II. Site Survey, DSDP Site 386, Initial Reports ofthe Deep Sea Drilling Project. ed. Ansis Kaneps, v. XIII, U.S.Government Printing Office, Washington, D.C., v. 43, p. 1013-1017.
Bowles, F. A. (1980). Stratigraphy and Sedimentation of the ArchipelagicApron and Adjoining Area Southeast of Bermuda. Marine Geology, v. 37,p. 267-294.
Powles, F. A., E. A. Angino, J. W. Hosterman, and 0. K. Galle (1971).Precipitation of Deep-Sea Palygorskite and Sepiolite. Earth andPlanetary Science Letters, v. 11, p. 324-332.
Chen, C. (1964). Pteropod Ooze from Bermuda Pedestal. Science, v. 144,No. 3614, p. 60-62.
Chocquette, P. W. and F. C. Trusell (1978). A Procedure for Making theTitan-Yellow Stain for tig-Calcite Permanent. Journal of SedimentaryPetrology, v. 48, p. 639-646.
Cotton, C. A. (1969). The Pedestals of Oceanic Volcanic Islands.Geological Society of American Bulletin, v. 80, p. 749-760.
Damuth, J. E. (1975). Echo Character of the Western Equatorial AtlanticFloor and Its Relationship to the Dispersal and Distribution ofTerrigenous Sediments. Marine Geology, v. 18, p. 17-45.
Damuth, J. E. (1980). Use of High-Frequency (3.5-12 kHz) Echograms in
the Study of Near-Bottom Sedimentation Processes in the Deep-Sea: AReview. Marine Geology, v. 38, p. 51-75.
DSDP (1978). Initial Reports of the Deep Sea Drilling Project, Trolume43. US Government Printing Office, Washington, DC.
____ M

I I
77
DSDP (1979). Initial Reports of the Deep Sea Drilling Project, Volume43. US Government Printing Office, Washington, DC, p. 195-321.
Folk, R. L. (1974). Petrology of Sedimentary Rocks. Hemphill PublishingCompany, Austin, Texas, 182 pp.
Gees, R. A. and F. Medioli (1970). A Continuous Seismic Survey of theBermuda Platform, Part I: Castle Harbour. Maritime Sediments, v. 6, No.1, p. 21-25.
Ginsberg, R. N. and J. H. Schroeder (1973). Growth and SubmarineFossilization of Algal Cup Reefs, Bermuda. Sedlmentology, p. 575-614.
Heezen, B. C. and C. D. Hollister (1971). The Face of the Deep. OxfordUniversity Press, Inc., New York, N.Y., 658 p.
Holcombe, T. L. and B. C. Heezen (1970). Patterns of Relative Relief,Slope and Topographic Texture in the North Atlantic Ocean. TechnicalReport No. 8, Cu-8-70, Naval Ship Systems Command N00024-67-1186,Lamont-Doherty Geological Observatory, Columbia University, Palisades,N.Y., 127 p.
Hulsemann, J. (1966). On the Routine Analysis of Carbonates inUnconsolidated Sediments. Journal of Sedimentary Petrology, v. 36, No.24, p. 622-625.
Huang, T. C. and J. W. Pierce (1971). The Carbonate Minerals of Deep SeaBioclastic Turbidites, Southern Blake Plateau. Journal of SedimentaryPetrology, v. 41, No. 1, p. 251-260.
Hyndman, R. D., G. K. ?Meche and F. Aumento (1974). Deep Drill 1972,Heat Flow and Heat Production in Bermuda. Canadian Journal of EarthScience, p. 809-818.
Johnson, R. C., E. L. Hamilton and W. H. Berger (1977). PhysicalProperties of Calcareous Ooze: Control by Dissolution at Depth. MarineGeology, v. 24, p. 259-277.
Jordan, C. F., Jr. (1971). Bioclastic Sediment Dispersion Off BermudanPatch Reefs. American Association of Petroleum Geologists Bulletin, v.55, pt. 1, p. 346.
Kelley, J. T. (1981). Size Distribution of Disaggregated InorganicSuspended Sediment: Southern New Jersey Inner Continental Shelf. Journalof Sedimentary Perology, v. 51, No. 4, p. 1097-1102.
1- Lamhe, E. P. (1979). Geologic Effects of the Gulf Stream System in theNorth American Basin, PhD Thesis, MIT and Woods Hole OceanographicInstitute, (Unpub.), 164 pp.
jirr 7_f1
78
Lamne, E. P. and C. D. Hollister (1981). Geological Effects of the GulfStream System on the Northern Bermuda Rise. Marine Geology, v. 39, p.277-310.
Land, L. S. and Mackenzie (1970). Field Guide to Bermuda Geology.Bermuda Biological Station for Research, Special Publication No. 4, St.George's West, Bermuda, 14 pp.
McGregor, B., P. Betzer and D. Krause (1973). Sediments in the AtlanticCorner Seaaounts: Control by Topography, Paleowinds, and GeochemicallyDetected Bottom Currents. Marine Geology, v. 14, p. 179-190.
Milliman, J.D. (1974). Marine Carbonates. Springer-Verlag, New York,N.Y., 374 pp.
Naval Weather Service Command (1974). Bermuda Environmental Scenario.Naval Weather Service, Asheville, N.C., 199 pp.
Neumann, C. A. (1965). Processes of Recent Carbonate Sedimentation inHarrington Sound, Bermuda. Bulletin of Marine Science, v. 15, No. 4, p.987-1035.
Pirsson, L. V. (1914). Geology of Bermuda Island: The Igenous Platform.American Journal of Science, v. 38, p. 777-808.
Reynolds, P. 11. and F. Aumento (1974). Deep Drill, 1972, Potassium-ArgonDating of the Bermuda Drill Core. Canadian Journal of Earth Science, v.11, p. 1269-1273.
Schmitz, J., Jr. (1977). On the Deep General Circulation in the WesternNorth Atlantic, Journal of Marine Research, v. 35, No. 1, p. 21-35.
Stanley, D. J. and D. J. P. Swift (1967). Bermuda's Southern AeolianiteReef Tract. Science, v. 157, No. 3789, p. 677-681.
Stanley, D. J. and D. J. P. Swift (1968). Bermuda's Reef-Front Platform:.athymetry and Significance. Marine Geology, v. 6, p. 479-500.
Stanley, D. J. and P. T. Taylor (1977). Sediment Transport Down a Sea-mount Flank by a Combined Current and Gravity Process. Marine Geology,v. 23, p. 77-88.
Tucholke, B. (1979). Relationships Between Acoustic Stratigraphy andLithostratigraphy in the Western North Atlantic Basin, in InitialReports of the Deep Sea Drilling Project, v. XLIII, ed. Ansis Kaneps.U.S. Government Printing Office, Washington, D.C. p. 827-846.
Vogt, P. R., G. L. Johnson, T. L. Holcombe, T. G. Gilg and 0. E. Avery(1971). Episodes of Seafloor Spreading a, Recorded in the North AtlanticBasement. Tectonophysics, v. 12, p. 211-234.
* 79Vogt, P. and A. Ballard (1976). The Bermuda Discontinuity (known as the"J-Anomaly") Between New England Seamounts and Southeastern End of GrandBanks, Sites 43-6, 43-7, 44-4, 44-5. Abstracts of the Annual Meeting ofthe American Geophysical Union, Washington, DC.
Vogt, P. and A. Einwich (1979). Magnetic Anomalies and SeafloorSpreading in the Western North Atlantic, and a Revised Calibration ofthe Keathly (M) Geomagnetic Reversal Chronology, in Initial Reports ofthe Deep Sea Drilling, Project, v. XLIII, ed Ansis Kaneps. U. S.Government Printing Office, Washington, D.C. p. 847-856.
Weast, R. C. ed. (1964). Handbook of Chemistry and Physics, 45th Ed.Chemical Rubber Publishing Co., Cleveland, Ohio, p. 124, Section D.
Wilson, J. L. (1975). Carbonate Facies in Geologic History, Springer-Verlag, Berlin, 471 pp.
7o
.~
. ,' .-- .. ."-
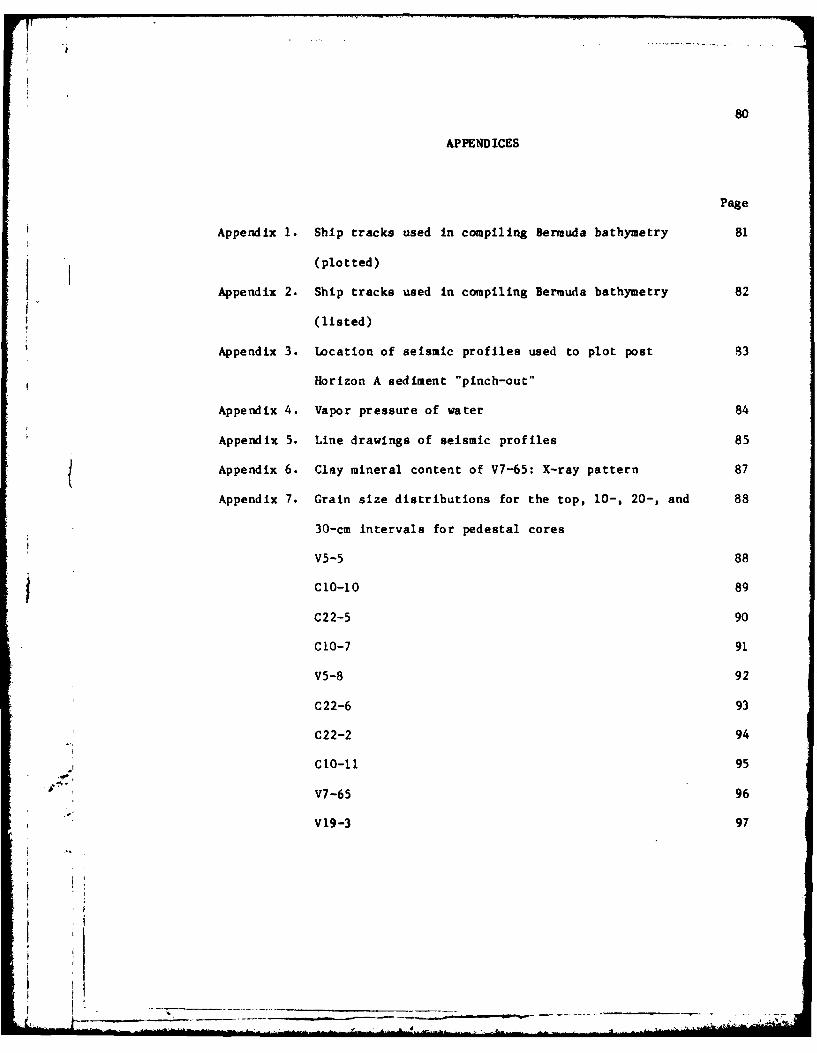
80
APPENDICES
Page
Appendix 1. Ship tracks used in compiling Bermuda bathymetry 81
(plotted)
Appendix 2. Ship tracks used in compiling Bermuda bathymetry 82
(listed)
Appendix 3. Location of seismic profiles used to plot post 83
Horizon A sediment "pinch-out"
Appendix 4. Vapor pressure of water 84
Appendix 5. Line drawings of seismic profiles 85
Appendix 6. Clay mineral content of V7-65: X-ray pattern 87
Appendix 7. Grain size distributions for the top, 10-, 20-, and 88
30-cm intervals for pedestal cores
V5-5 88
C 10-10 89
C22-5 90
C10-7 91
V5-8 92
C22-6 93
C22-2 94
C1o-1l 95
V7-65 96
V19-3 97
__ _ _ _ _ _ _ _ _ _ _
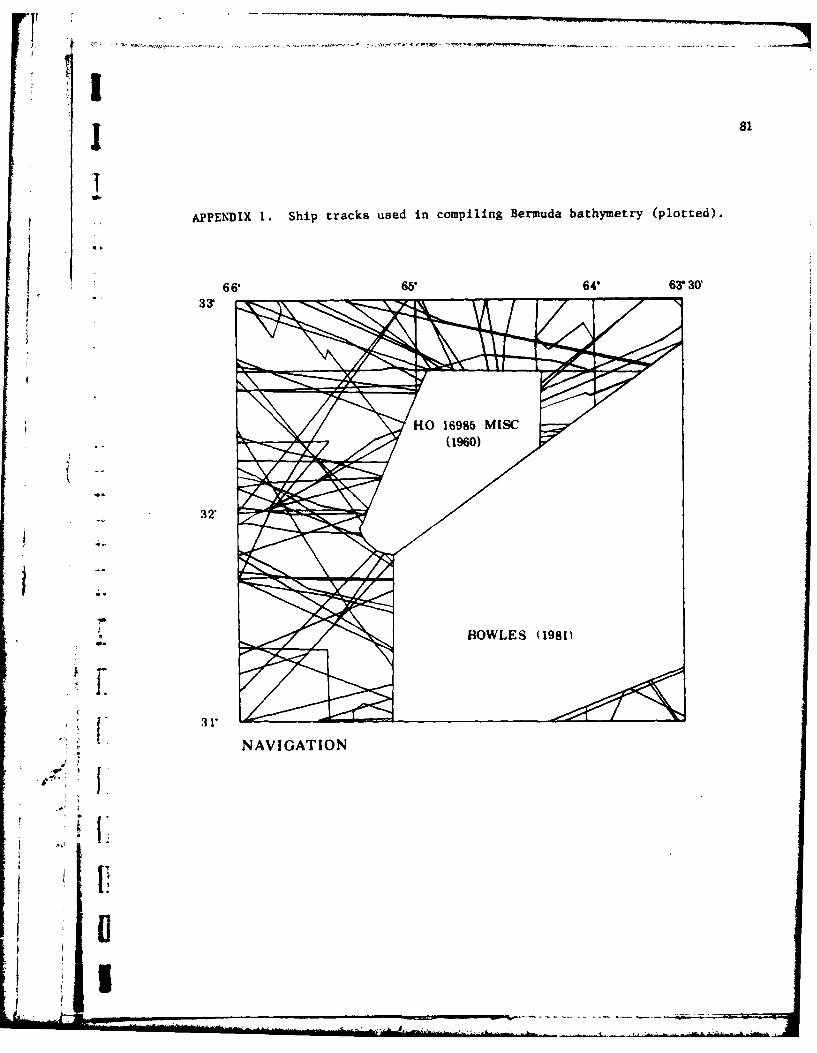
I 81
I!, i
APPENDIX I. Ship tracks used in compiling Bermuda bathymetry (plotted).
66" 65" 64" 63"30'- 33
fL
I'; HO 16985 MISC
._ .-"/ (1960) i
I
-. 32"
NAVIGATION
t F.
I i

82
APPENDIX 2. SHIiP TRACKS USED IN COMPILING BERMUDA BATHYIIETRY (LISTED)
SHIP TRACKS
Keathley V1.81.8
TAG 70 V1802
C2116 dloo.
C2110 V1801
C2102 C1A1
C2101 V1702
Ka70A V1701
23078 V26101
V3108 V2603
C106 V60
VH05201V80
C20 16019
C1510
Vi1902
V 1901
V 1819
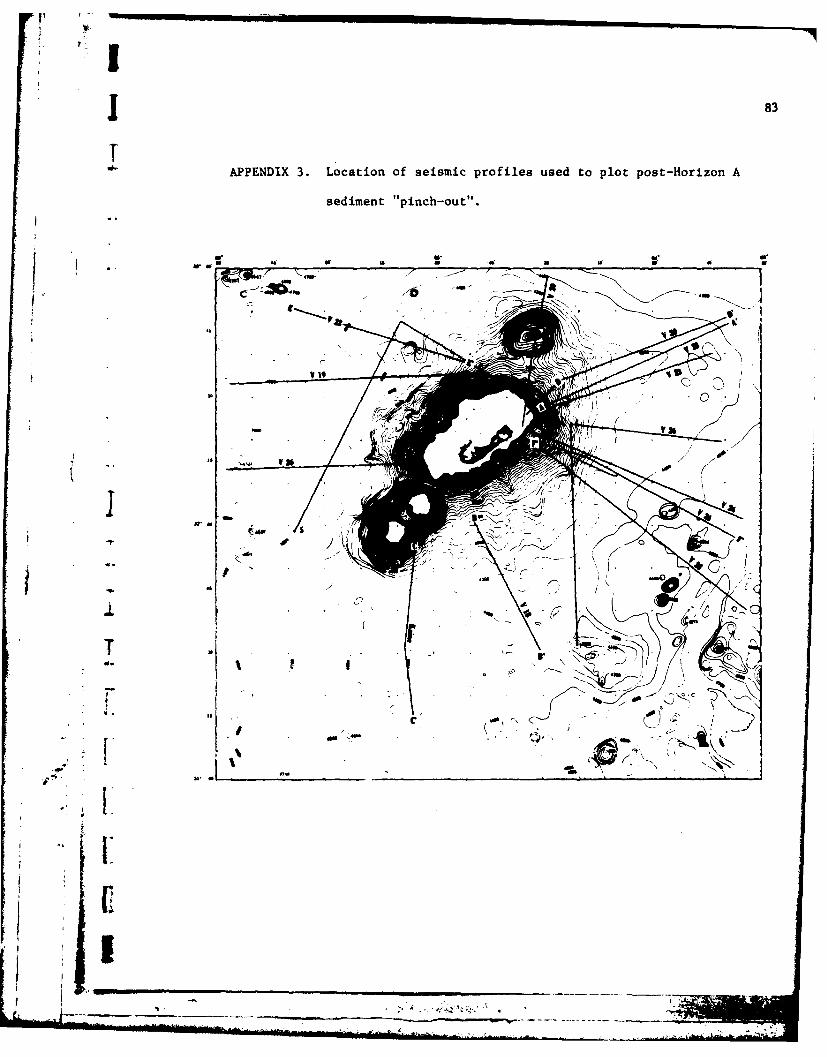
1 83
APPENDIX 3. Location of seismic profiles used to plot post-Horizon A
sediment "pinch-out".
4rr
.... 40
1~C
C.00 -
F W,%(* 1OO
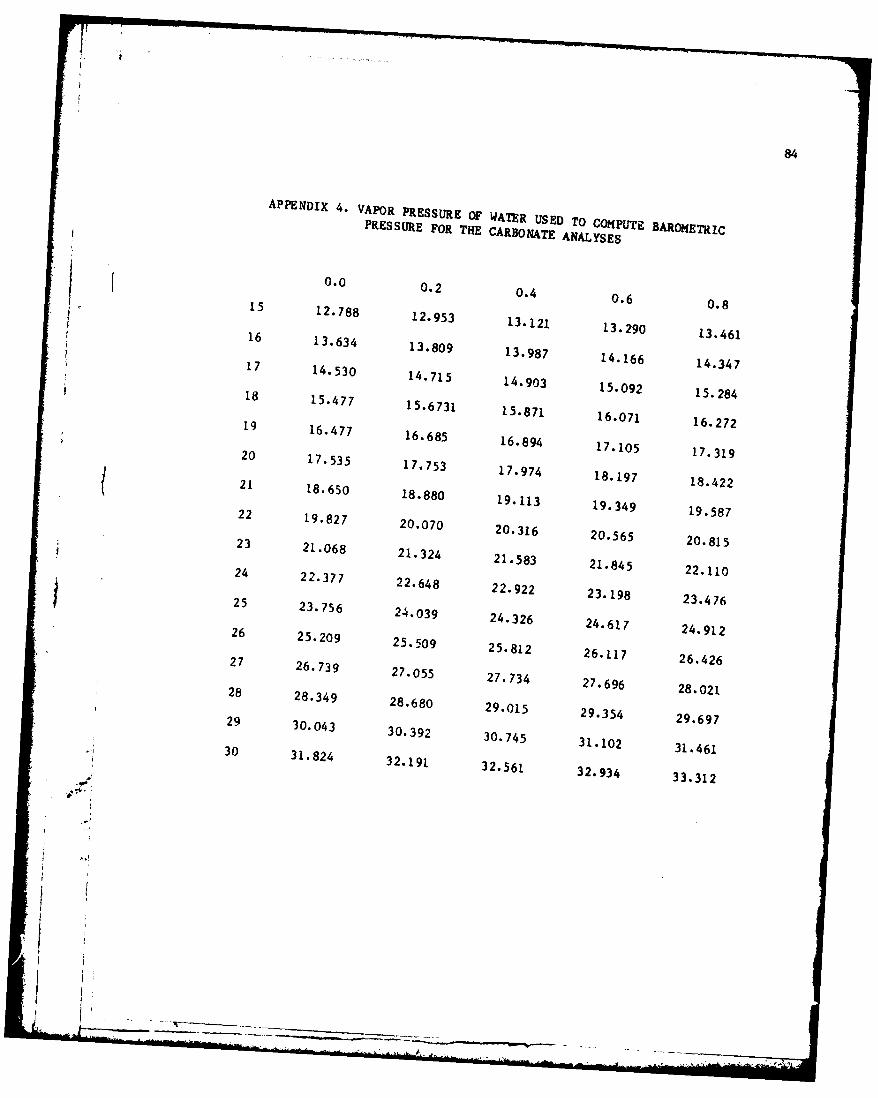
84
APPENDIX 4. VAPOR PRESSURE OF WATER USED TO COMPUTE BAROMETRCPRESSURE FOR THE CARBONATE ANALSEAEANALYSES
0.0 0.2 0.4 0.6 0.812.788 12.953 13.121 13.290
16 13.461
i 1613.634 13.809
113641.013.987
14.166 14.34717 14.530 14.715 14.903 15.092 15.284S18 154771563150252818 15477 15.6731 15.871 16.071 16.27219 16.477 16.685 16.894 17.105 17.31920 17.535
17.753 17.974
18-19721 18650 18-880 19.113 19.349 19.58722 19.827 20.070 20.316 20.565 20523
20 815
23 21.068 21.324 21.583 21.845 22.11024 22.377 22.648 22.922 23.198 23.47625 23.756 24.039 24.326 24.617 24.912
26 25.209 25.509 25.812 26.117 26.426
27 26.739 27.055 27.734 27.696 28.021
28 28.349 28.680 29.015 29.354 29.697
29 30.043 30.392 30.745 31.102 31.46130 31.824
32.191 32.561 32. 934 33 312
m#
|i
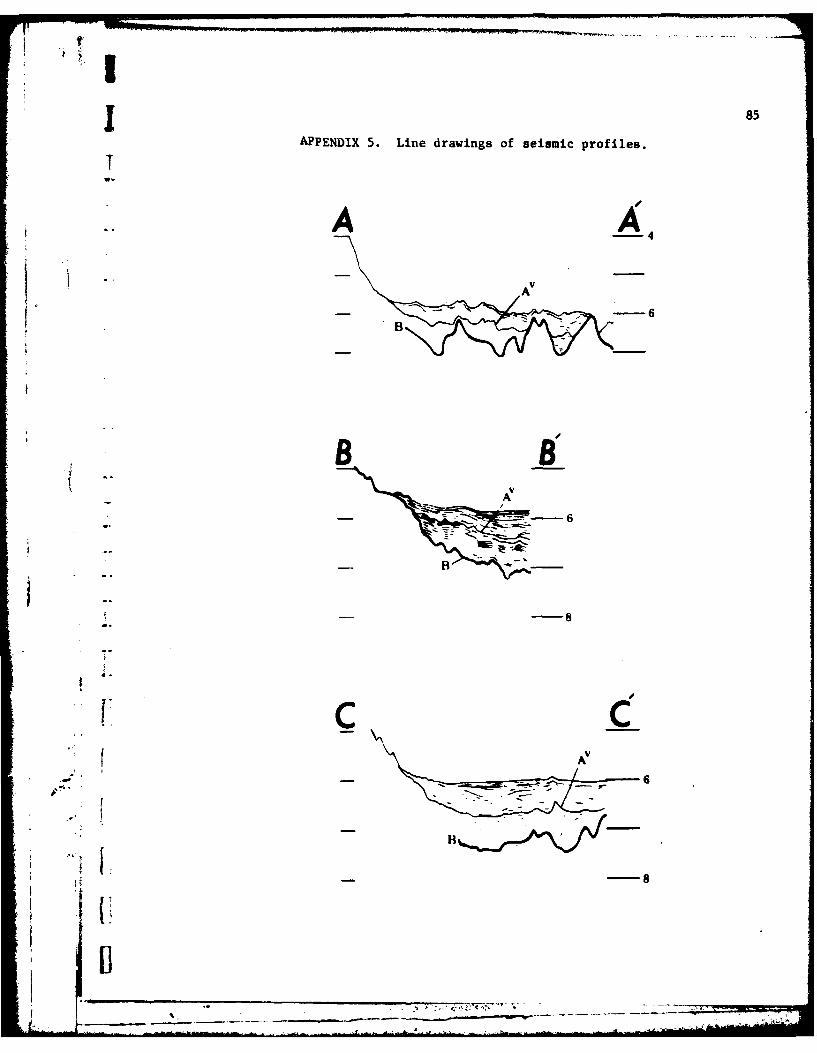
I 85
APPENDIX 5. Line drawings of seismic profiles.
1-A4
6
f A" 6
B.- -z~

86
-41D"w
aa
- ' I-- -
1~
E 2i
AllA

APPENDIX 6. Clay mineral content of V7-65; X-ray pattern. 87
T0
D I
F..
enq
Ip.t e
zIW I
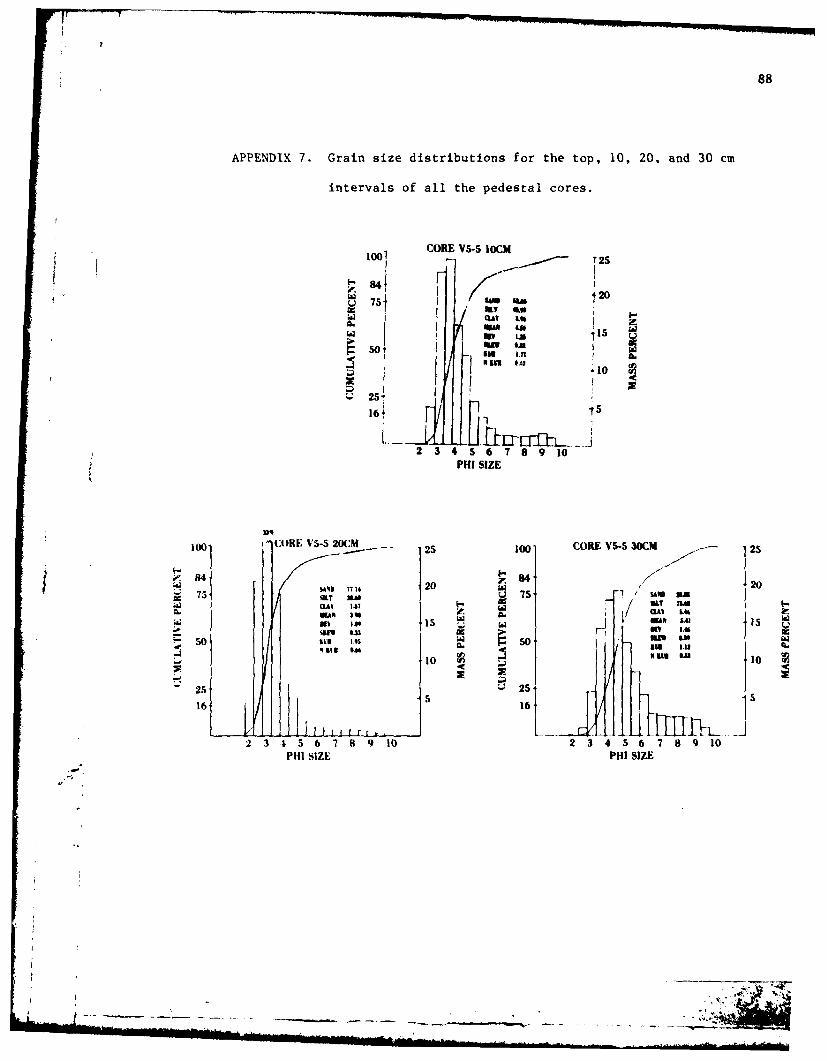
88
APPENDIX 7. Grain size distributions for the top, 10, 20, and 30 cm
intervals of all the pedestal cores.
001 CORE VS-5 10CM1T2
-20
75t
JIL 7Sf I-aj s~2 3 QAV LIS
S" P I SIZIS
MA A.
I2 '10 0
~25.16' 1
2 3 4 S 6 7 8 9 10
PHI SIZE
100 RE~ VS-s 2(KL - 5 0 CORE VS-5 30CM - ~ 2
w. .m []
25 10 25
16 16
2 3 . 5 6 7 8 9 10 2 3 5 6 7 8 9 10PHI SIZE PHI SIZE
r. WA ,L41 ,
AD-A127 6 871 SEDIMENTS ON THE 50OUTHEASTERN FL AK 0F THE BERMUDAPEDESTA(U) NAVAL OCEAN RESEARCH AND DEVELOPMENTACTIVIT RS STATIONMS D LAVOIEET AL MAR 83
N ""R GR 01
a1111.0 IL JM
1111111.6
1.2 1 .4 11.8
MICROCOPY RESOLUTION TEST CHART
NATIONAL BUREAU OF STANDARDS- 1963-A

I 89
100 con CO-10 4cm 25 1001 CORE CI-10 O1CM 25
* /. N1 s .. 1i / ,SLU20t0
m4 1s 4815m" L
I000 4 OEe01 10 -" I SI}! Cl-0 ""h M IL
~50 7,m . 5O, 'ss /
2 3 4 5 6 7 8 9 10 2 3 4 S 6 7 8 9 10PHI SIZE PIu SIZE
lo, C5 1003 CORE CIO*0c a T 25
a, M/ A 70 I1? an 20NN JM MA 6
w LI O B
O I I 4hso Na 3 w $
-- 23456739 0
* I t.PHISIE PI IZ
AD
PH SIEPISZ
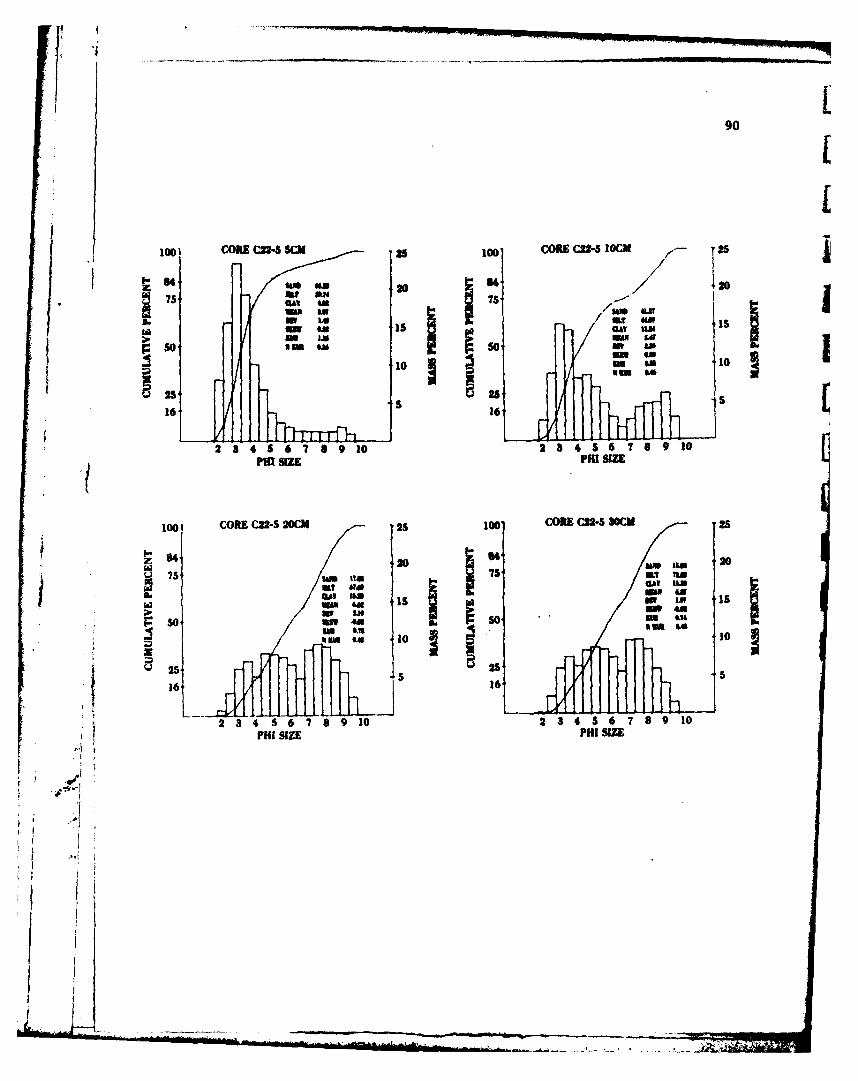
90
100 conE CR2-S scm 2510 con C22-5 10CM rJRS
S75 R 73
I~s WANS 611
010
16,1
II
10 CORE C22-S 20CMA2 0 CORE C2- 30CM 2
20 so0u
75 25wi AV U
234&6 is 91I35661
am 1x 1
25'2

1 91
IL100!' ot EC1O-7 SCM 101 CORE C18-7 10CM
654. 84m"75. ....4 ,
r n u 4
w a s as
16+ 1
2 34 5 6 7 8 9 10 2 3 4 5 67 910PHI SlZ PHI 12
1001 COC3o-7o20CMA - 5 1 1oo COMEC17.S0CM 2
d7 N/ as 75 .6 GA as 12sun mu -2Amm
[ 10141
~ 255
2 3 4506738910 2 234536 76891I PHI SIZE PHI sIZ
',.a I
ItIu
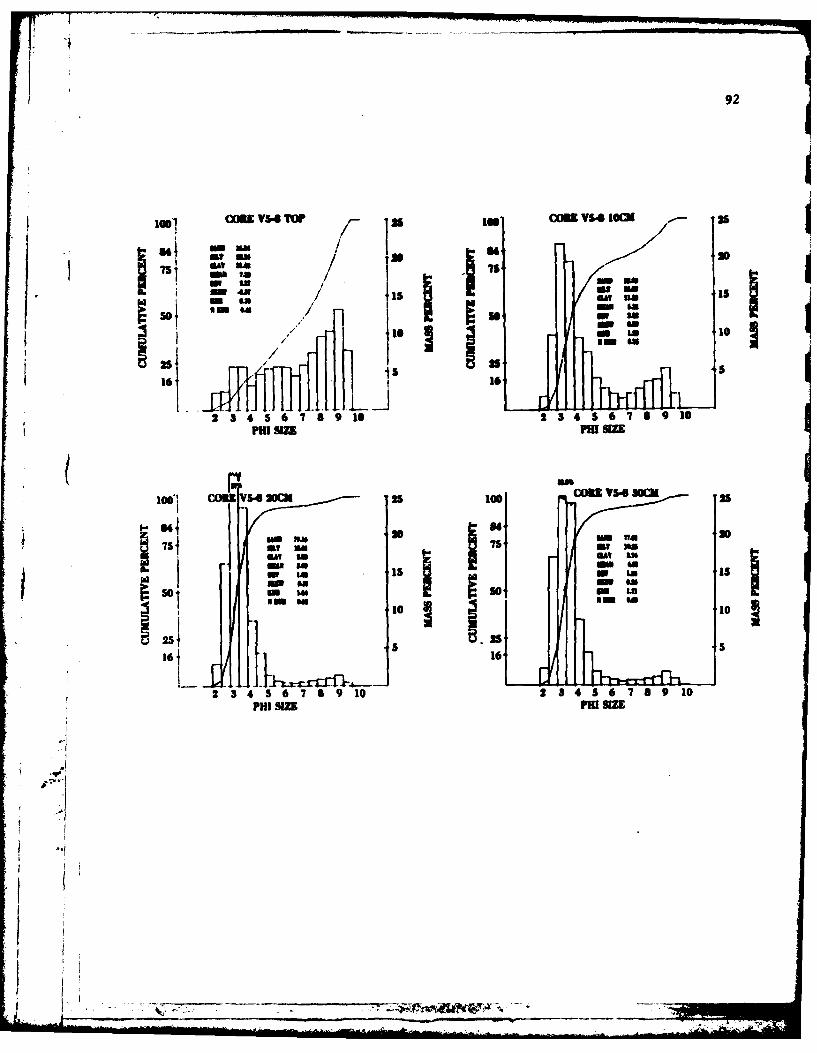
92
con V54 TOP m corn VS-" 10K39 26
urn an Im -
sow w a
16 ' 16tat..
FB SIM O ms
m m 2eL0 30
6 fmm an6
an
16 16
234 5 6 759 10 2534 56 758910PHI NU PI Sax
"Pio
- 1 2 - 2I a m 7 a u
* AUSW L

Ti 93
10 CWOUI C2 TOP 25S low" CM C2 WARM 2S
lo 5io Ec0~~ 25
7S ~ ~ a Is mym
f"m ON onm so
-eu 10 qi
16 16
2 5 S 7 83910 234S67491mPHI su rl
JI CORE C224 251M corn C" 50cm 25
75 ar 75 EWr namn
-- 051 S
11 to an16* 16
234 5 6 789 10 2 3 4 S 6 7 8 9 10
PI SZE PHI anZ
Io)!
!!i
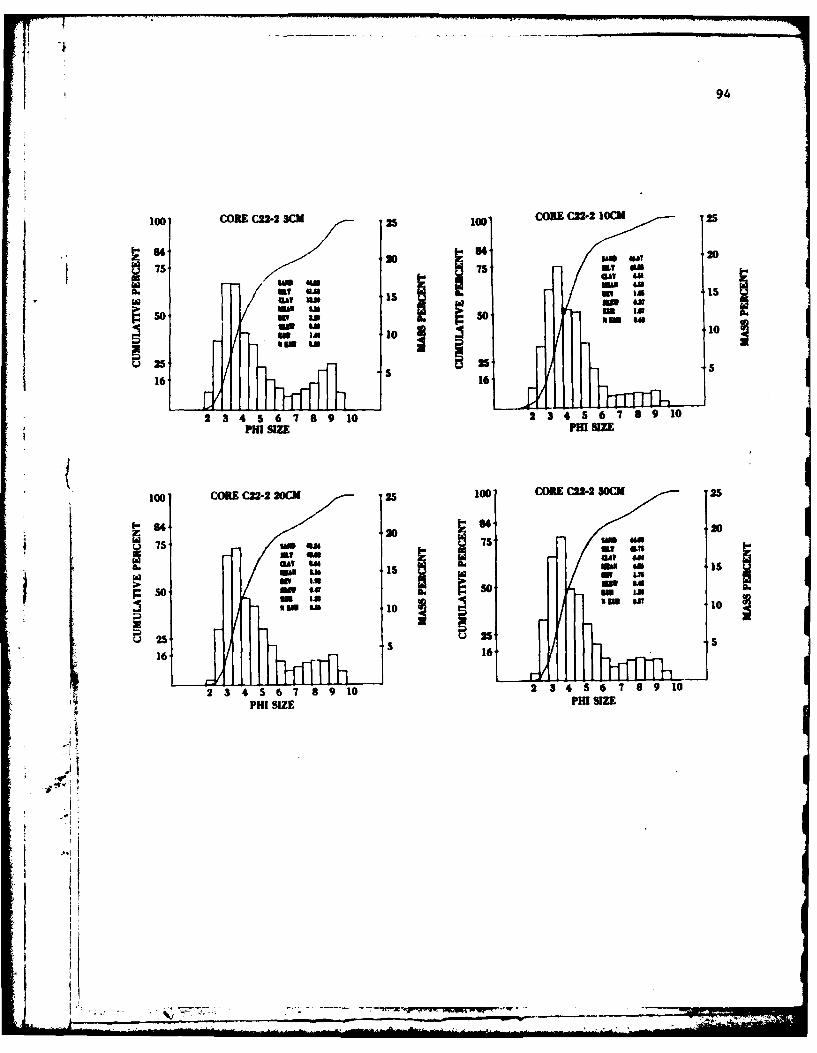
94
100 CORE C22-2 3CM 00 CORE C22 I C2M
84 20 AW0
"a7 on o 6
6 IL *A6A i7 2 5678 02 6 AU91
hV ann A
A. PHIS P1K - . i
i i
ma La
m1
&D0 10
~25 101 516 16
2 3 45 67 8910 2 3 45673a910oPHI SZE PHI SIZ
100 CORE C2-2 20CM 25100 CORE C2- 30C 25
8-4 8-4 2020w 75 lam 75 "
* EaT an 1ai l * GAI ON4
6 16
234 67 91 2145 76 1
PHI SIZE PHI SIZE
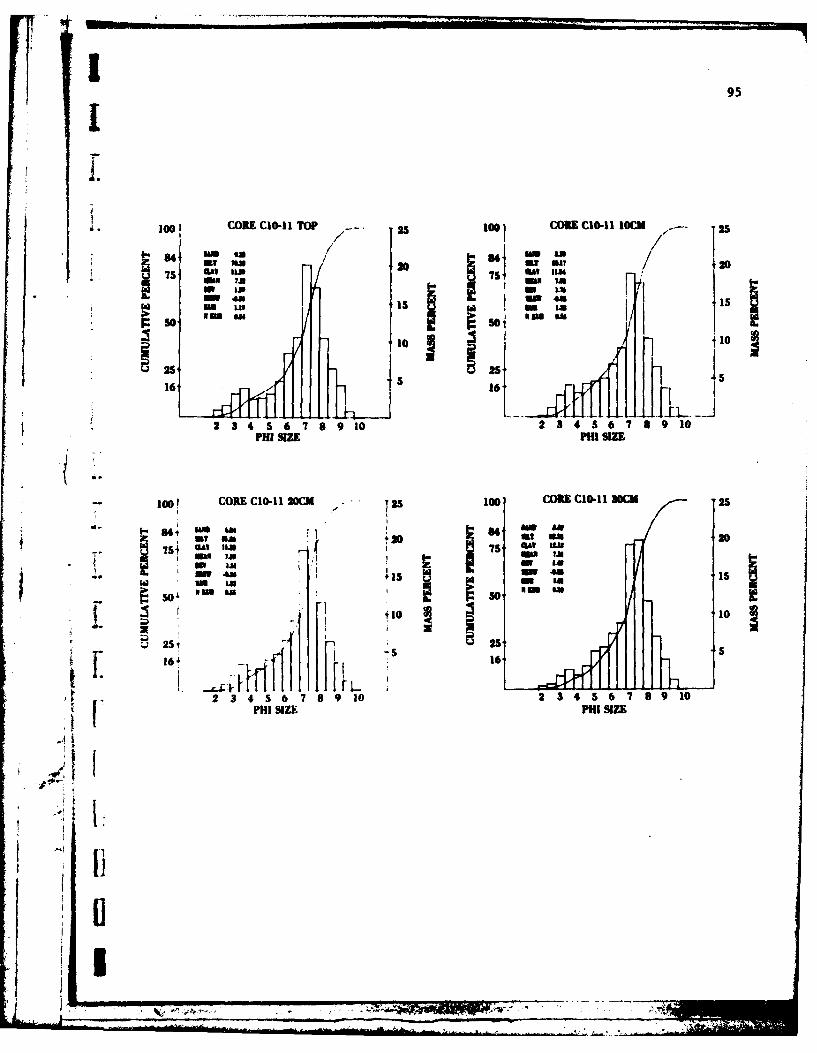
95
84 NL .72li
Is,
16 S 16
34 6 7 8 910 3456789 10
PHi SiZE PHI SIZE
K? 58 mt
fr AS -S8
5 75
S161 A'; 16'
12 3 1 4 ,S 6 7 8 9 10 2 314 5 6 7 8 9 10
O I
' li 1
w- za I U
Trfffl ~ ffL 1
fn ,
4:x
I.s25 516+ 16
21 891 S67891PH IE H i
77
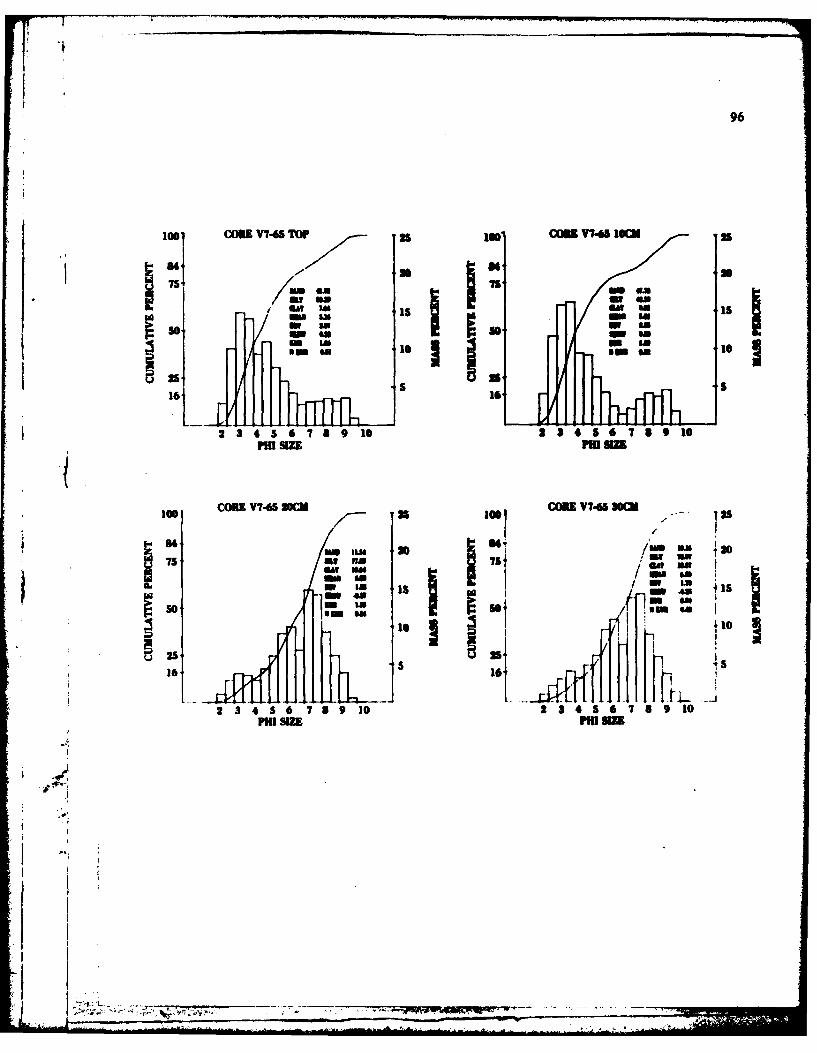
96
10 COU V7-S TOP 2 IO' COm V745 IOCM
.Aam, "mw/ GAT to6 Go5,m -, - I,
5. -am'S
161 1,-6 5-
La 4 3
2 3 4 5 6 7 8 9 10 2 3J 4 5 6 7 1 0 10PH! SIZE Ptil -a
CORE V7.6S 20CM COR V'-60225 IA is
m ° ' - -a . S 1/6a
i m mum :,
4'.
-1
.611
IS2 0234367a91
--- '.'PM SUE "'M am'" '-2';. "; * ." "" . .. ... R.
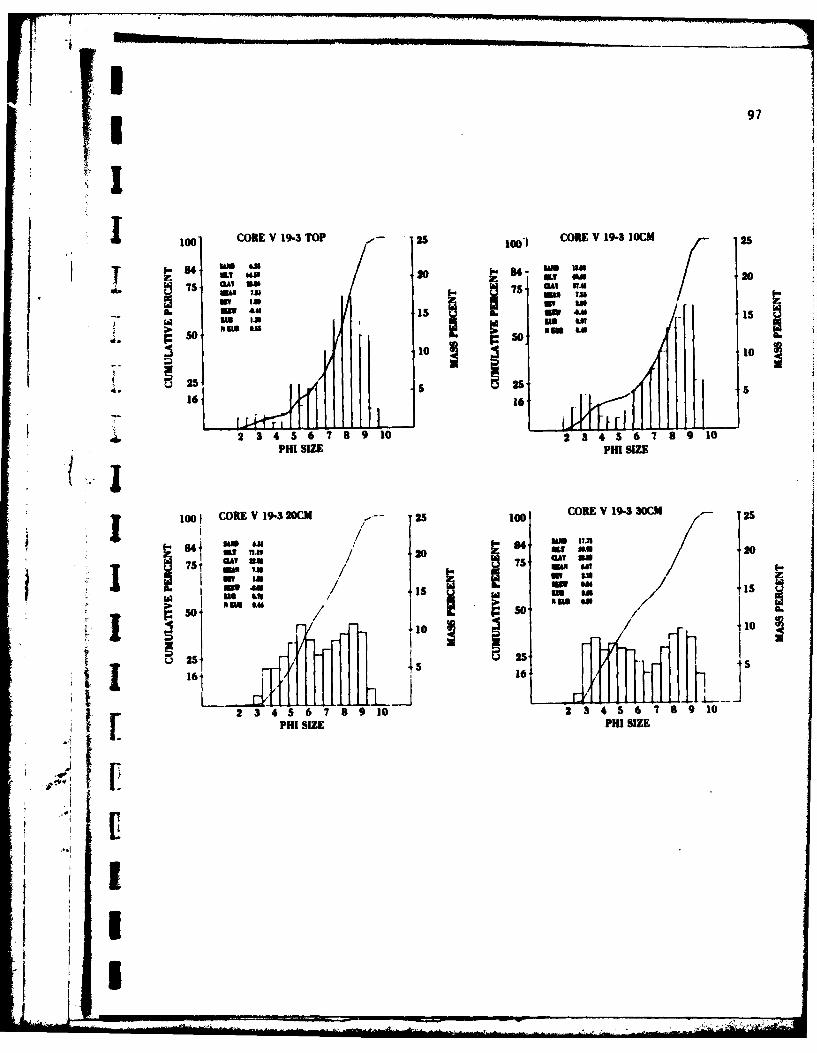
:97
10 COREV 19-3 TOP 25 lol COE V19-3 OCM 2
8*-4 8am We at M
at VI rn" 20 ILm OA 2AS 7s.3 MOsU .?A o. , i
St m - 15I SO AQ154 -i
10 10
16 1
4p 2 3 4 S 6 7 8 9 10 234567910PHI SIZE PHI SIZE
lool CORE V19-3 20CM 25 100 CORE Y 9-33OC14 25-
Kt 1.3/20at L 20
75j mV US 5 GTUNRO is O t
ii . ts16
2 3 4 5 6 7 8 9 10 2 3 4 5 6 7 8 9 10PHI SIZE PHI SIZE
* .1
I
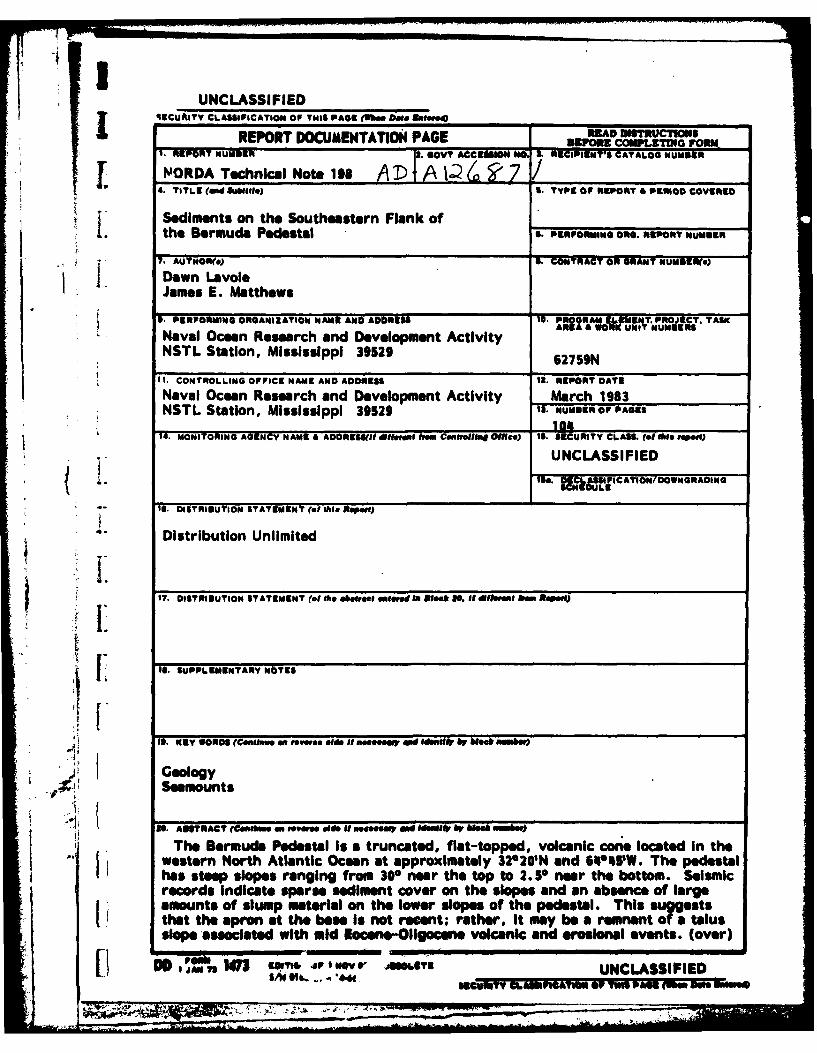
UNCLASSIFIEDJ ~~~ECURITY CLASSIFICATION OF THIS PAGE (1Sh.e DataEe~d _______________
1. EPRT REPORT DOCUMAENTATION PAGE R3AD DISTRCTI
IREOTNUMBER S.GOVT ACCENSOW ;FS.E11CIPIENTs CATALOG NUMBUER[ ~ ~14RDA Techncal Note 198 A D __ __ _ __ __ _
TITE (GdSuabftleJ S. TYPE OF REPORT & PERSOD COVERED
j Sediments on the Southeastern Flank of* the Bermuda Pedestal S. PERFORMING One. REPORT NUMBER
7. AuTwonr.) 5. CO*TRACT OR GRANT NUM5ER(d)
Dawn LavoieJames E. Matthews
9. PERFORMING ORGANIZATION NAMR AND ADDRESS IS. PRORA EIIENT. PROJECT. TASK
Naval Ocean Research and Development ActivityARAIOKNTNUERNSTL Station, Mississippi 39529 62759W
11. CON TROL LING OF FICE N AMR AND ADDRESS IS. REPORT DATE
Naval Ocean Research and Development Activity March 1983NSTL Station, Mississippi 30529 13. NUMBER OF PAGES
14. MONITORING AGENCY NAME 4 ADDRESS(fi lIf.,,of 1IMN CanIafb Offleo) Is. SECURITY CLASS. (of .io #open)
UNCLASSIFIEDIS&. lCkff4 1 ICATION/ DOWNGRADING
16 I. DISTRIBUTION STATEMENT (.1 WeD Reowt)
Distribution Unlimited
17. DISTRIBUTION STATEMENT (of the obstrect one siIR 811"k 2. 1140Et1WRI "s RipeN)
I$. SUPPLEMENTARY NOTES
Is. KEY WORDS (CoalS... en reverse odE. it n...eu #Ad I~< IV w~e** beW)
Geology
Sesmounts
SO. ASTRACT (Cmn~W*a...w on~ IWO aSe eaR' E I~M#I ~0 eA 0 8111")
The Bermuda Pedestal Is a truncated, flat-topped, volcanic cone located In thewestern North Atlantic Ocean at approximately 32*20N and 6416451W. The pedestalhas steep slopes ranging from 300 near the top to 2.50 near the bottom. Seismicrecords Indicate sperse sediment cover on the slopes and an absence of largeamounts of slump materil on the lower slopes of the pedestal. This suggeststhat the apron at the base Is not reset; rather, It my be a remnant of a talusslope assoclated with mid IlocenwbOlgntsu a volcanic and erosonai events. (over)
SNb. I*.4 WI"&,drIMI NI Snn
Smemy S.MUIGTIU NCLPASSEDE e '
UNCLASSIFIEDSICURITY Ci.AM IICAIO OP T0is PASS Mlm 0a aM.
(continued from Block 201 L, The carbonate content of surface and near-surface sediment (quaternary) is
generally high, decreasing only slightly with Increasing *pth in spite of probableextensive dissolution. Carbonate constituents are composed of both shallow plat-form and pelagic organisms. Constituent particles identified by scanning electronmicroscopy correlate well in most instances with mineralogy Identified by X-raydiffraction. Clay mineral content is low to nonexistent on the pedestal. Ingeneral, grain sizes tend to be coarser near the top of the pedestal, but anoma-lously high percentages of sand were found In a few places low on the flank andapron of the pedestal.
Sediment deposition on the pedestal Is discontinuous and episodic, a combinationof pelagic "rain" and redeposition by rapid-transport processes such as slumping,turbidity currents, and resuspension and dispersion of sediment by eddies andcurrents.
-'
LI
[
UNCLASSIFIED
gC.V1 , CL.AIPICAIO .O ?NO PA.gfWm Doe 1
. ...........
