seeing schools through the prism of pisa an international comparative perspective on quality and...
TRANSCRIPT

1111
Seeing schools through the prism of PISA
An international comparative perspective on quality and equity in education systems
Organisation for Economic Cooperation and Development (OECD)
Tokyo24 June 2005
Andreas SchleicherHead, Indicators and Analysis Division
OECD Directorate for Education

2222
3333 In the dark, all education systems look the same…
But with a little light….
暗がりのなかでは、どの学校も教育システムも同じように見える…
だが、少し光を当てると… .

4444
But with a little light….
…important differences become apparent……重要な違いが明らかになってくる… .
だが、少し光を当てると… .
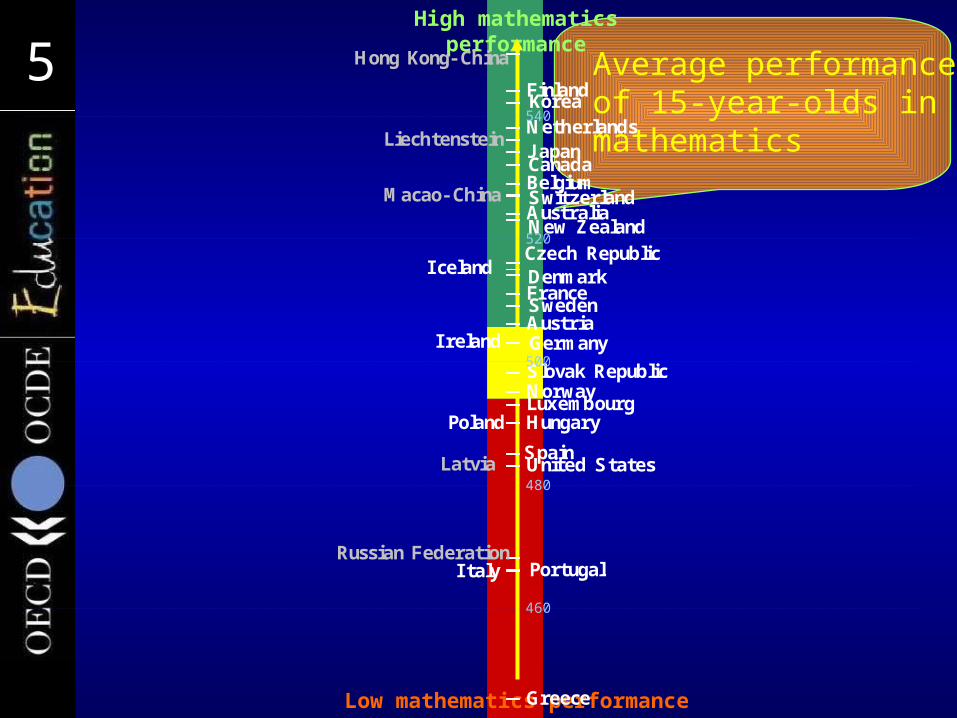
5555 Average performanceof 15-year-olds in mathematics
High mathematics performance
Low mathematics performanceGreece
Russian Federation
Liechtenstein
Korea
Hong Kong- China
Finland
Netherlands
Canada
Macao- China Switzerland
New Zealand
Belgium
J apan
Australia
I celandCzech Republic
SwedenFranceDenmark
I reland GermanyAustria
Slovak Republic
LuxembourgPoland Hungary
Norway
SpainUnited StatesLatvia
PortugalI taly
440
460
480
500
520
540
61626
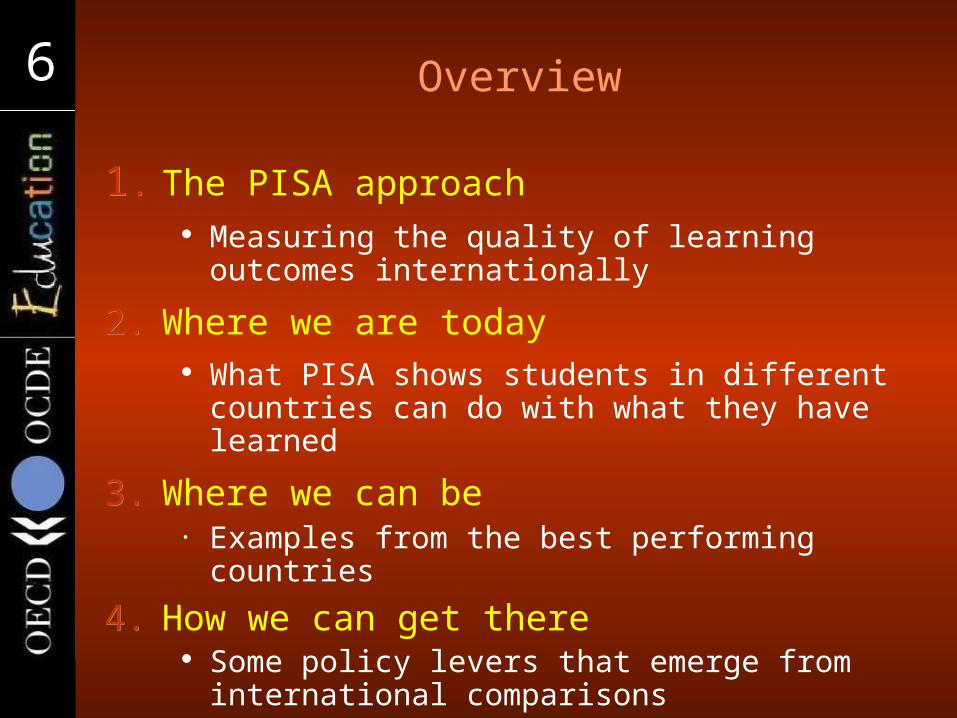
6666 Overview
11.. The PISA approach Measuring the quality of learning outcomes
internationally
2.2. Where we are today What PISA shows students in different
countries can do with what they have learned
3.3. Where we can be• Examples from the best performing countries
4.4. How we can get there Some policy levers that emerge from
international comparisons

7777
The PISA approach
Measuring the quality of learning outcomes
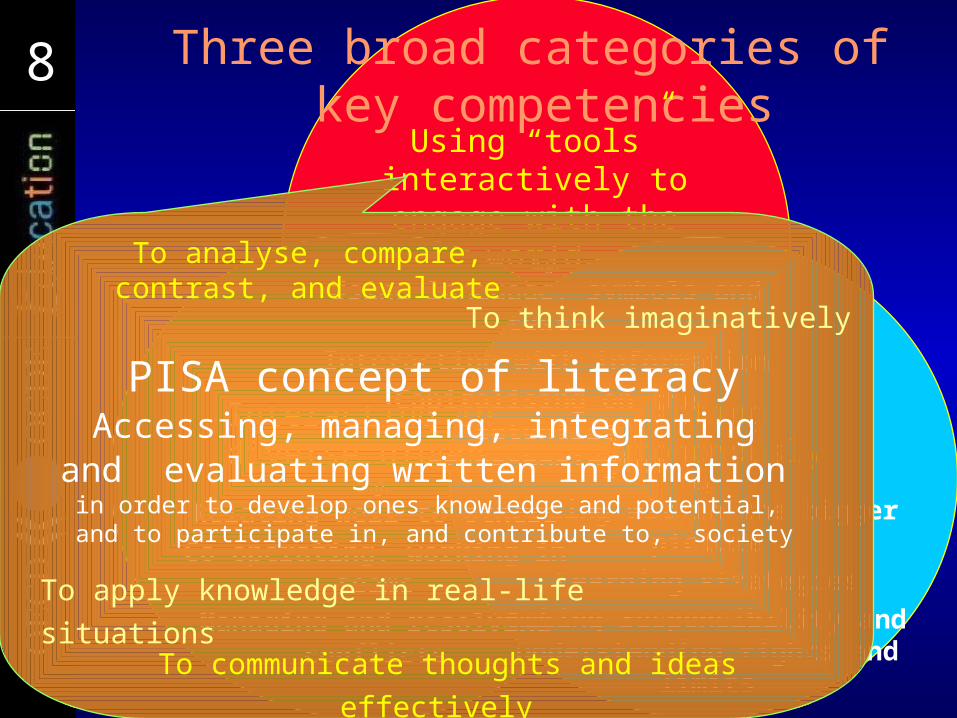
8888 Three broad categories of key competencies
Using “tools” interactively to engage with the
world
Acting autonomously
Interacting in diverse groups
e.g.
Using language, symbols and texts
Interacting with informationCapitalising on the potential
of technologies
e.g.
Relating well to othersCo-operating, working in
teamsManaging and resolving
conflicts
e.g.
Acting within the bigger picture
Learning strategiesTaking responsibility and understanding rights and
limits
To analyse, compare, contrast, and evaluate
To think imaginatively
To apply knowledge in real-life situations
To communicate thoughts and ideas effectively
PISA concept of literacyAccessing, managing, integrating
and evaluating written information in order to develop ones knowledge and potential,
and to participate in, and contribute to, society

9999Using “tools”
interactively to engage with the
world
Acting autonomously
Interacting in diverse groups
e.g.
Using language, symbols and texts
Interacting with informationCapitalising on the potential
of technologies
e.g.
Relating well to othersCo-operating, working in
teamsManaging and resolving
conflicts
e.g.
Acting within the bigger picture
Forming and conducting life plans
Taking responsibility and understanding rights and
limits
To analyse, compare, contrast, and evaluate
To think imaginatively
To apply knowledge in real-life situations
To communicate thoughts and ideas effectively
Reading literacy
Using, interpreting and reflecting on written material
10101010Using “tools”
interactively to engage with the
world
Acting autonomously
Interacting in diverse groups
e.g.
Using language, symbols and texts
Interacting with informationCapitalising on the potential
of technologies
e.g.
Relating well to othersCo-operating, working in
teamsManaging and resolving
conflicts
e.g.
Acting within the bigger picture
Forming and conducting life plans
Taking responsibility and understanding rights and
limits
To analyse, compare, contrast, and evaluate
To think imaginatively
To apply knowledge in real-life situations
To communicate thoughts and ideas effectively
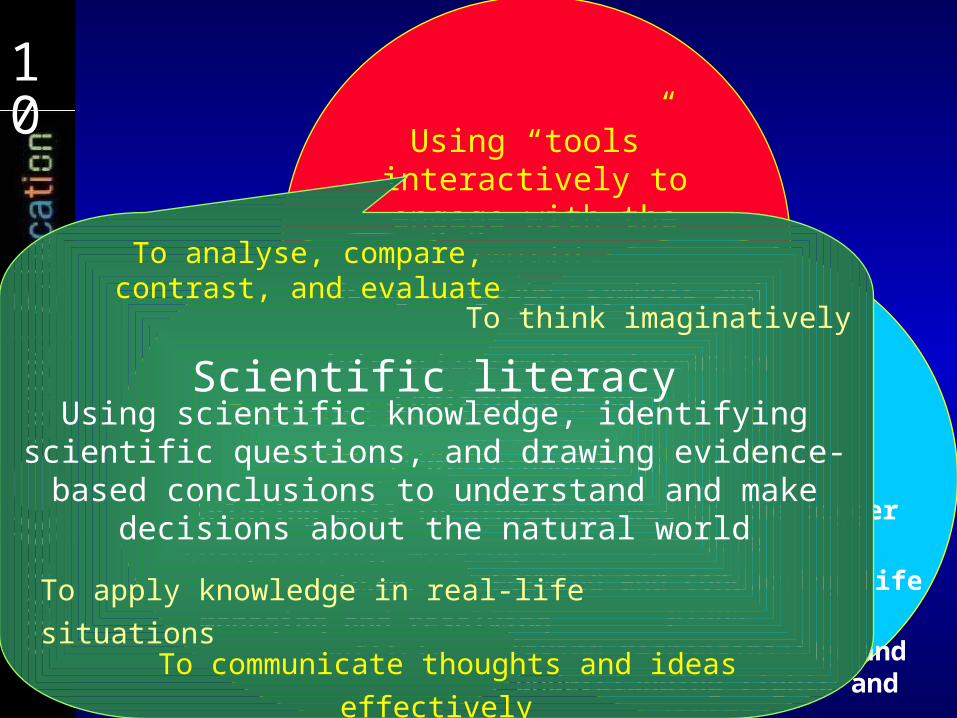
Scientific literacyUsing scientific knowledge, identifying scientific
questions, and drawing evidence-based conclusions to understand and make decisions about the natural
world
11111111Using “tools”
interactively to engage with the
world
Acting autonomously
Interacting in diverse groups
e.g.
Using language, symbols and texts
Interacting with informationCapitalising on the potential
of technologies
e.g.
Relating well to othersCo-operating, working in
teamsManaging and resolving
conflicts
e.g.
Acting within the bigger picture
Forming and conducting life plans
Taking responsibility and understanding rights and
limits
To analyse, compare, contrast, and evaluate
To think imaginatively
To apply knowledge in real-life situations
To communicate thoughts and ideas effectively
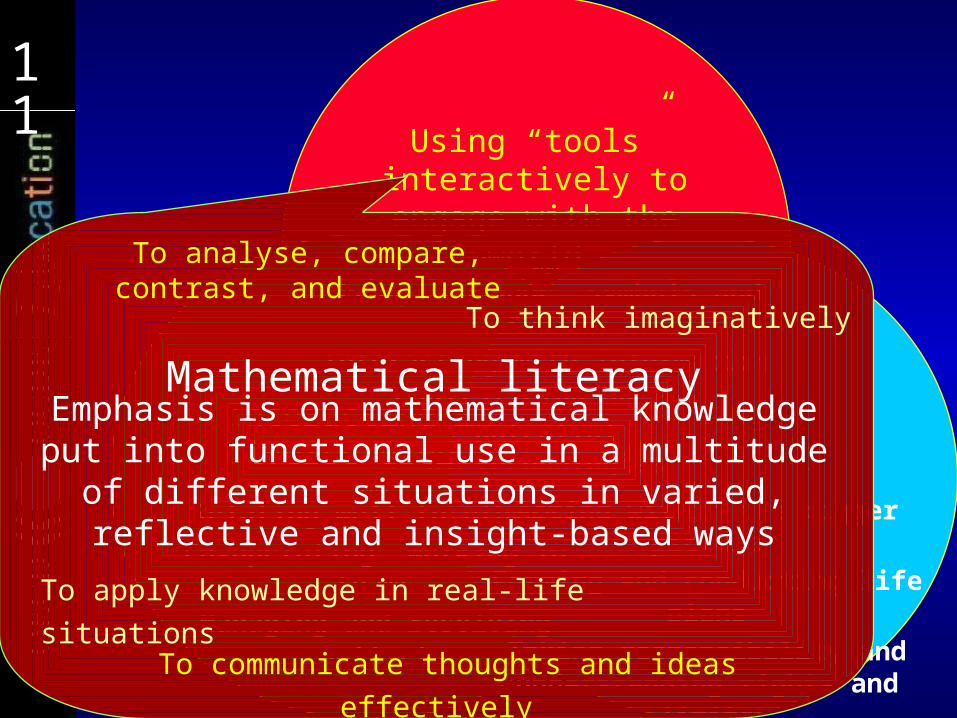
Mathematical literacyEmphasis is on mathematical knowledge put into functional use in a multitude of different
situations in varied, reflective and insight-based ways

12121212 Mathematical literacy in PISAThe real world The mathematical World
A real situation
A model of reality A mathematical model
Mathematical results
Real results
Understanding, structuring and simplifying the situation
Making the problem amenable to mathematical
treatment
Interpreting the mathematical results
Using relevant mathematical tools to solve the problemValidating
the results

13131313Deciding what to assess...
looking back at what students were expected to have learned
…or…
looking ahead to what they can do with what they have learned.
For PISA, the OECD countries chose the latter.
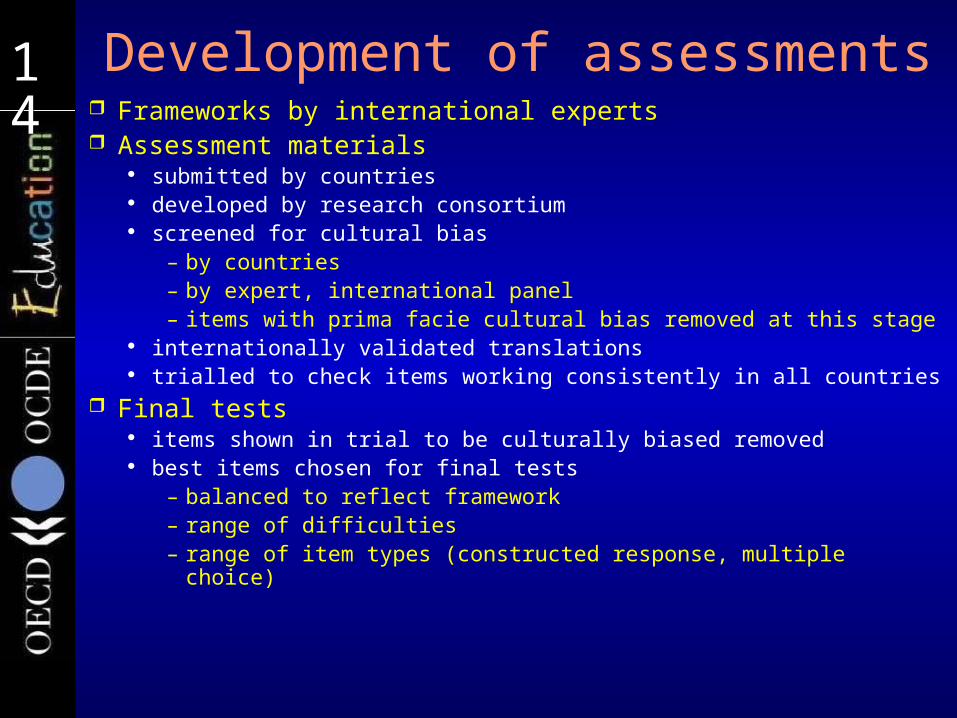
14141414 Development of assessments Frameworks by international experts Assessment materials
submitted by countries developed by research consortium screened for cultural bias
– by countries– by expert, international panel– items with prima facie cultural bias removed at this stage
internationally validated translations trialled to check items working consistently in all countries
Final tests items shown in trial to be culturally biased removed best items chosen for final tests
– balanced to reflect framework– range of difficulties– range of item types (constructed response, multiple choice)
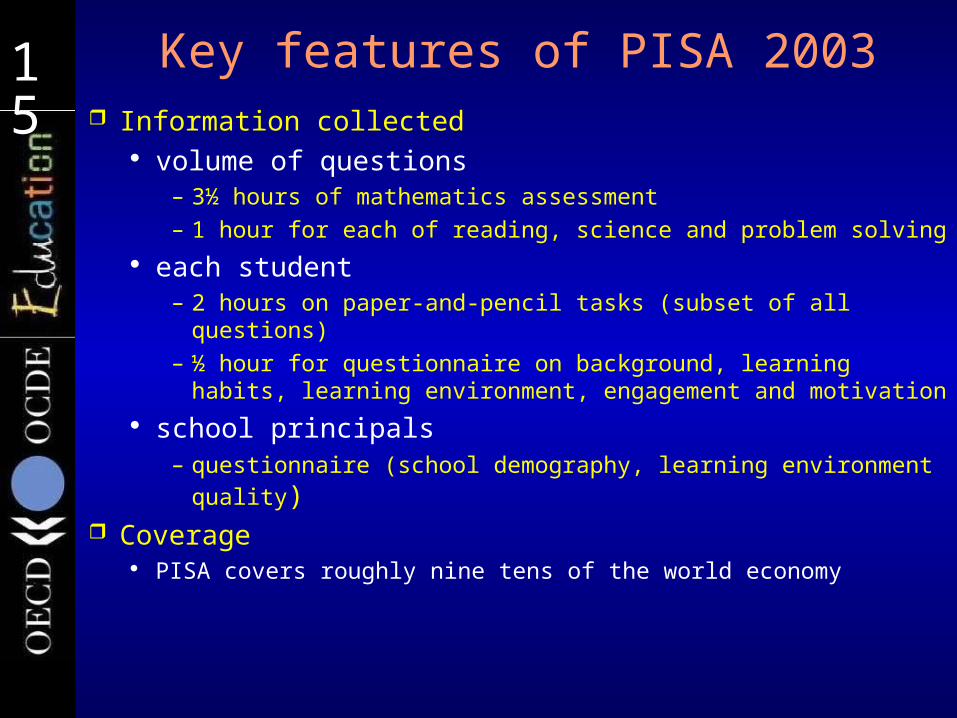
15151515 Key features of PISA 2003 Information collected
volume of questions– 3½ hours of mathematics assessment– 1 hour for each of reading, science and problem solving
each student– 2 hours on paper-and-pencil tasks (subset of all
questions)– ½ hour for questionnaire on background, learning habits,
learning environment, engagement and motivation school principals
– questionnaire (school demography, learning environment quality)
Coverage PISA covers roughly nine tens of the world economy

16161616
Where we are - and where we can be
What PISA shows students can doExamples of the best performing countries
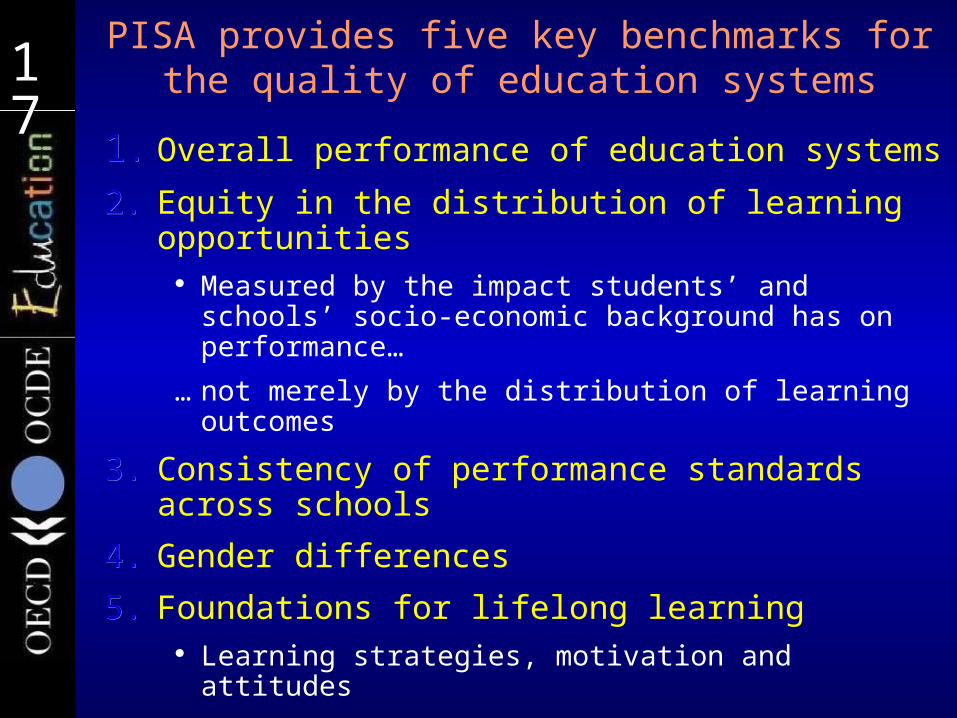
17171717PISA provides five key benchmarks for the
quality of education systems
11.. Overall performance of education systems
2.2. Equity in the distribution of learning opportunities
Measured by the impact students’ and schools’ socio-economic background has on performance…
… not merely by the distribution of learning outcomes
3.3. Consistency of performance standards across schools
4.4. Gender differences
5.5. Foundations for lifelong learning Learning strategies, motivation and attitudes

18181818 Average performanceof 15-year-olds in mathematics
Low average performance
Large socio-economic disparities
High average performance
Large socio-economic disparities
Low average performance
High social equity
High average performance
High social equity
Strong socio-economic impact
on student performance
Socially equitable distribution of
learning opportunities
High mathematics performance
Low mathematics performanceGreece
Russian Federation
Liechtenstein
Korea
Hong Kong- China
Finland
Netherlands
Canada
Macao- China Switzerland
New Zealand
Belgium
J apan
Australia
I celandCzech Republic
SwedenFranceDenmark
I reland GermanyAustria
Slovak Republic
LuxembourgPoland Hungary
Norway
SpainUnited StatesLatvia
PortugalI taly
440
460
480
500
520
540
61626
Top-performers Finland remained first in
reading and since 2000 moved further in math and science…
…and is now on a par with the East Asian countries that were previously unmatched in math and science
Also the Netherlands is among the top-performers in math
…though not in reading and science.
As is the Flemish Community of Belgium
Progress Other countries with
improvements in at least two assessment areas were Belgium, the Czech Republic and Germany
…In Belgium and Germany it was the top performers who drove improvements.
Progress Poland raised it’s overall
performance in all four assessment areas
…thanks to big improvements among lower-performing students in the wake of a major reform in 1999.
A widening gap More improvement at the top
of the scale has widened the gap between the top and bottom performers in the OECD.
19191919 Durchschnittliche Schülerleistungen im Bereich Mathematik
Low average performance
Large socio-economic disparities
High average performance
Large socio-economic disparities
Low average performance
High social equity
High average performance
High social equity
Strong socio-economic impact
on student performance
Socially equitable distribution of
learning opportunities
High mathematics performance
Low mathematics performanceGreece
Russian Federation
Liechtenstein
Korea
Hong Kong- China
Finland
Netherlands
Canada
Switzerland
New Zealand
Belgium
J apan
Australia
I celandCzech Republic
SwedenFrance
Denmark
I relandGermanyAustria
Slovak Republic
LuxembourgPolandHungary
Norway
SpainUnited States Latvia
Portugal I taly
440
460
480
500
520
540
61626
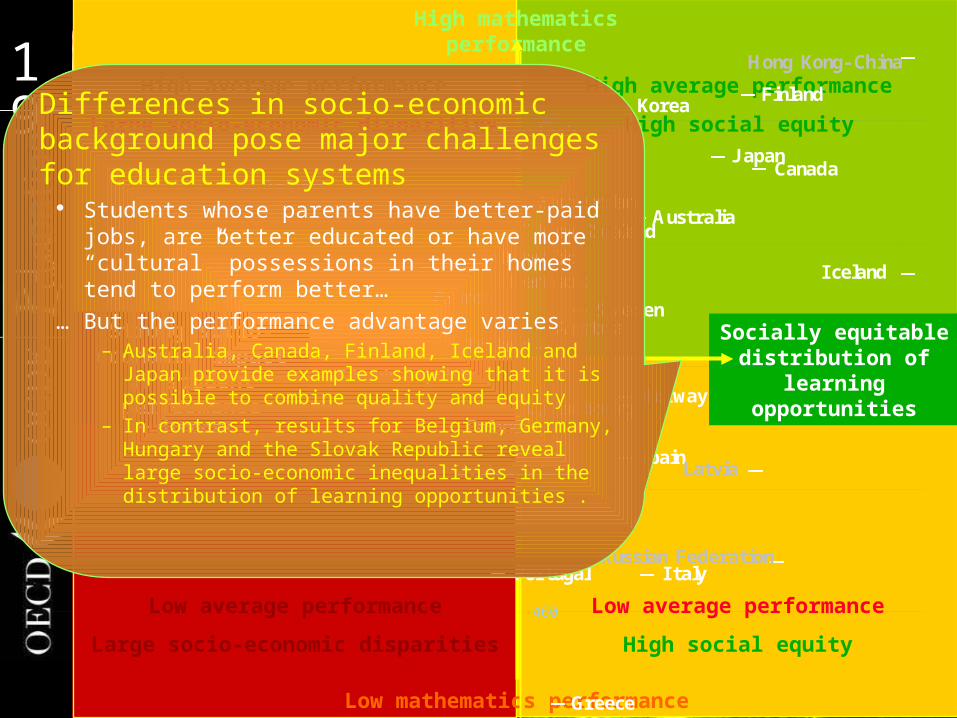
Differences in socio-economic background pose major challenges for education systems
Students whose parents have better-paid jobs, are better educated or have more “cultural” possessions in their homes tend to perform better…
… But the performance advantage varies– Australia, Canada, Finland, Iceland and
Japan provide examples showing that it is possible to combine quality and equity
– In contrast, results for Belgium, Germany, Hungary and the Slovak Republic reveal large socio-economic inequalities in the distribution of learning opportunities .
20202020
0
20
40
60
80
100
120
140
Tur
key
Hun
gary
Jap
an
Bel
gium
Ital
y
Ger
man
y
Aus
tria
Net
her
land
s
Cze
ch R
epub
lic
Kor
ea
Slo
vak
Rep
ublic
Gre
ece
Swit
zerl
and
Luxem
bou
rg
Port
ugal
Mex
ico
Uni
ted S
tate
s
Aus
tral
ia
New
Zea
land
Spa
in
Can
ada
Irel
and
Den
mar
k
Pola
nd
Swed
en
Nor
way
Fin
land
Icel
and
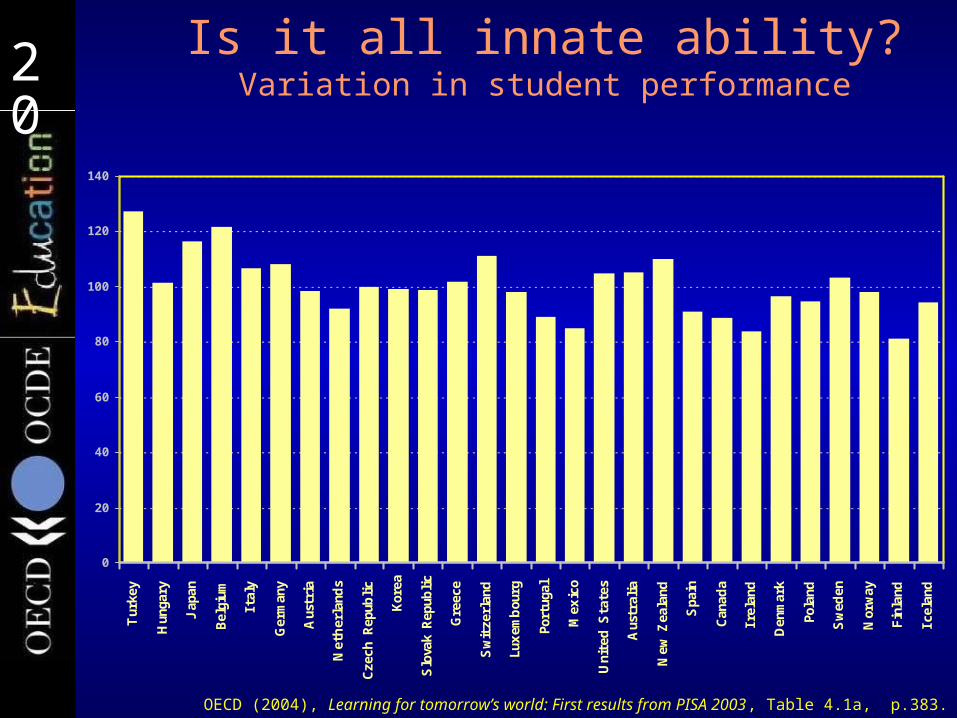
Is it all innate ability?Variation in student performance
OECD (2004), Learning for tomorrow’s world: First results from PISA 2003, Table 4.1a, p.383.

21212121
- 80
- 60
- 40
- 20
0
20
40
60
80
100Tur
key
Hun
gary
Jap
an
Bel
gium
Ital
y
Ger
man
y
Aus
tria
Net
her
land
s
Cze
ch R
epub
lic
Kor
ea
Slo
vak
Rep
ublic
Gre
ece
Swit
zerl
and
Luxem
bou
rg
Port
ugal
Mex
ico
Uni
ted S
tate
s
Aus
tral
ia
New
Zea
land
Spa
in
Can
ada
Irel
and
Den
mar
k
Pola
nd
Swed
en
Nor
way
Fin
land
Icel
and
Variation of performance
between schools
Variation of performance within
schools
Is it all innate ability?Variation in student performance in mathematics
OECD (2004), Learning for tomorrow’s world: First results from PISA 2003, Table 4.1a, p.383.
In some countries, parents can rely on high and consistent standards across schools
In Canada, Denmark, Finland, Iceland and Sweden average student performance is high…
… and largely unrelated to the individual schools in which students are enrolled.
11
114
125
22222222Stu
dent
perf
orm
ance
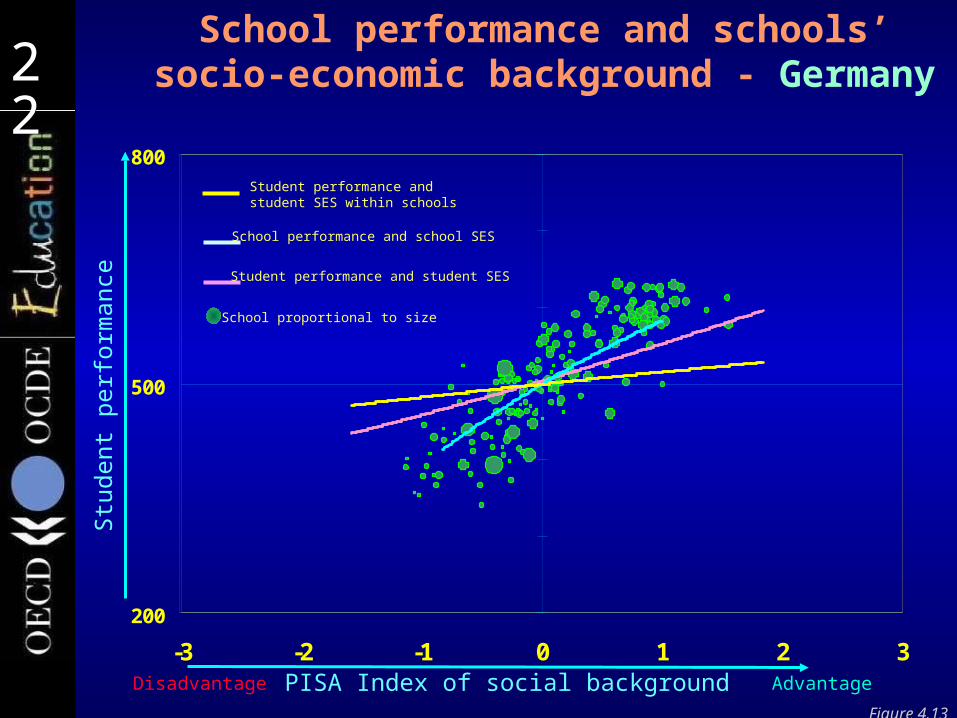
School performance and schools’ socio-economic background -
Germany
AdvantagePISA Index of social backgroundDisadvantage
Figure 4.13
School proportional to size
Student performance and student SES
Student performance and student SES within schools
School performance and school SES
200
500
800
-3 -2 -1 0 1 2 3

23232323
200
500
800
-3 -2 -1 0 1 2 3
生徒の成績
学校の成績と学校の社会経済的背景(日本)
有利社会的背景に関する PISA指数不利
生徒の成績と生徒の社会経済的地位( SES)
生徒の成績と学校内における生徒の SES
学校の成績と学校の SES
学校の規模

24242424Stu
dent
perf
orm
ance
School performance and schools’ socio-economic background - Norway
AdvantagePISA Index of social backgroundDisadvantage
Figure 4.13
School proportional to size
Student performance and student SES
Student performance and student SES within schools
School performance and school SES
OECD
OECD
OECD
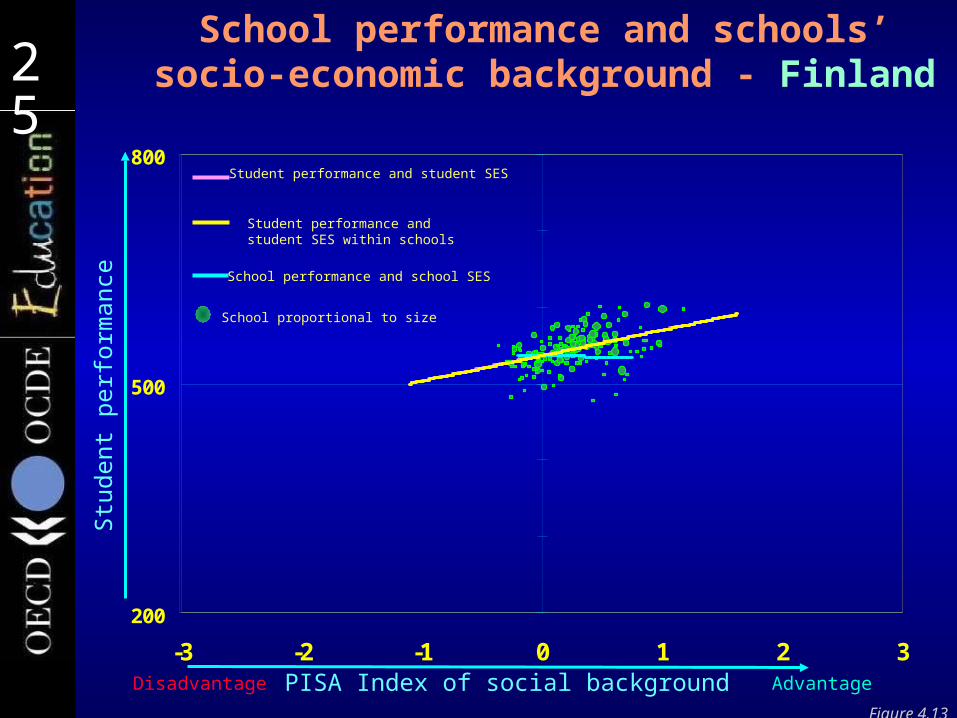
25252525
200
500
800
-3 -2 -1 0 1 2 3
Stu
dent
perf
orm
ance
School performance and schools’ socio-economic background - Finland
AdvantagePISA Index of social backgroundDisadvantage
Figure 4.13
Student performance and student SES
Student performance and student SES within schools
School performance and school SES
School proportional to size

27272727Stu
dent
perf
orm
ance
School performance and schools’ socio-economic background
AdvantagePISA Index of social backgroundDisadvantage
Figure 4.13
School proportional to size
Universal policies Increasing educational performance of all children
through reforms applied equally across the school system, e.g.
– Altering content or pace of curriculum– Improving instructional techniques– Changing the learning environment in schools and
classrooms– Standards and accountability– Teacher professional development

28282828Stu
dent
perf
orm
ance
School performance and schools’ socio-economic background
AdvantagePISA Index of social backgroundDisadvantage
Figure 4.13
School proportional to size
Socio-economically targeted policies Providing a specialised curriculum or
additional educational resources to students from disadvantaged backgrounds
– Students are often also identified through other risk factors, e.g. immigration, ethnicity, low-income community
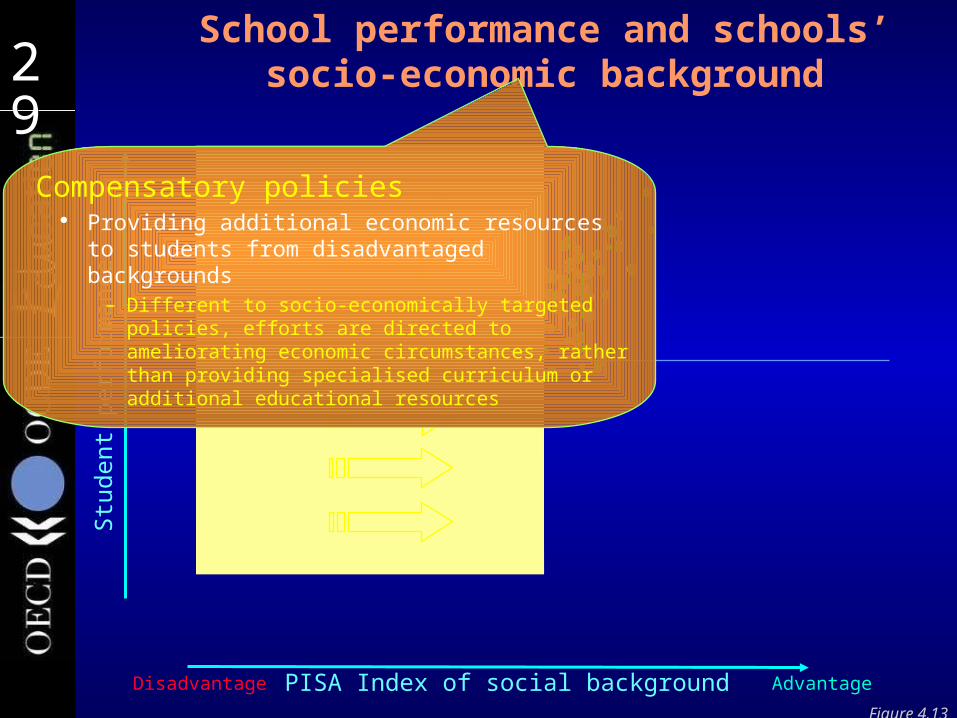
29292929Stu
dent
perf
orm
ance
School performance and schools’ socio-economic background
AdvantagePISA Index of social backgroundDisadvantage
Figure 4.13
School proportional to size
Compensatory policies Providing additional economic resources to
students from disadvantaged backgrounds– Different to socio-economically targeted
policies, efforts are directed to ameliorating economic circumstances, rather than providing specialised curriculum or additional educational resources

30303030Stu
dent
perf
orm
ance
School performance and schools’ socio-economic background
AdvantagePISA Index of social backgroundDisadvantage
Figure 4.13
School proportional to size
Performance targeted policies Providing additional economic resources to
students based on their academic performance– Early intervention programmes– Remedial and recovery programmes– Performance-based tracking or streaming
Countries with flat gradients In combination with SES-targeted policies for
countries with steeper gradients
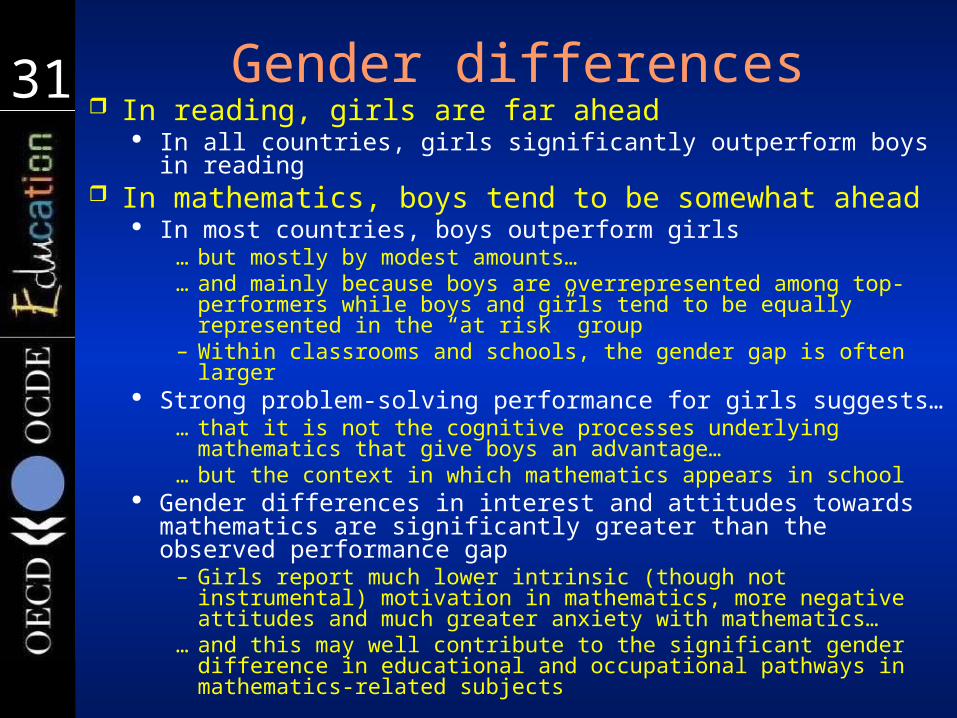
3131 Gender differences In reading, girls are far ahead
In all countries, girls significantly outperform boys in reading
In mathematics, boys tend to be somewhat ahead In most countries, boys outperform girls
…but mostly by modest amounts……and mainly because boys are overrepresented among top-
performers while boys and girls tend to be equally represented in the “at risk” group
– Within classrooms and schools, the gender gap is often larger Strong problem-solving performance for girls suggests…
…that it is not the cognitive processes underlying mathematics that give boys an advantage…
…but the context in which mathematics appears in school Gender differences in interest and attitudes towards
mathematics are significantly greater than the observed performance gap
– Girls report much lower intrinsic (though not instrumental) motivation in mathematics, more negative attitudes and much greater anxiety with mathematics…
…and this may well contribute to the significant gender difference in educational and occupational pathways in mathematics-related subjects

3232Interest in and enjoyment of
mathematics
0 10 20 30 40 50 60 70
I enjoy reading about mathematics.
I look forward to my mathematics lessons.
I do mathematics because I enjoy it.
I am interested in the things I learn about
mathematics.
OECD average Denmark J apanPercentage of students
- 60 - 50 - 40 - 30 - 20 - 10 0 10 20 30 40 50 60
Change in
mathematics per unit
of the index
Score points
OECD (2004), Learning for tomorrow’s world: First results from PISA 2003, Table 3.4, p.367 and Figure 3.4, p.126.
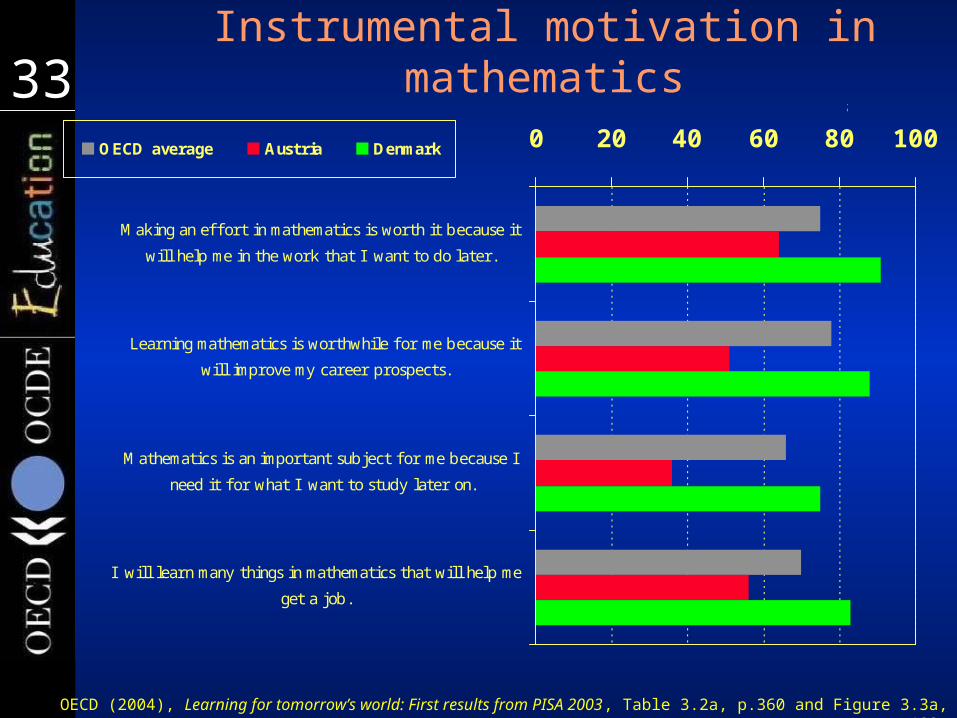
3333Instrumental motivation in
mathematics0 20 40 60 80 100
Making an eff ort in mathematics is worth it because it
will help me in the work that I want to do later.
Learning mathematics is worthwhile for me because it
will improve my career prospects.
Mathematics is an important subject f or me because I
need it f or what I want to study later on.
I will learn many things in mathematics that will help me
get a job.
OECD average Austria Denmark
Percentage of students
OECD (2004), Learning for tomorrow’s world: First results from PISA 2003, Table 3.2a, p.360 and Figure 3.3a, p.122.
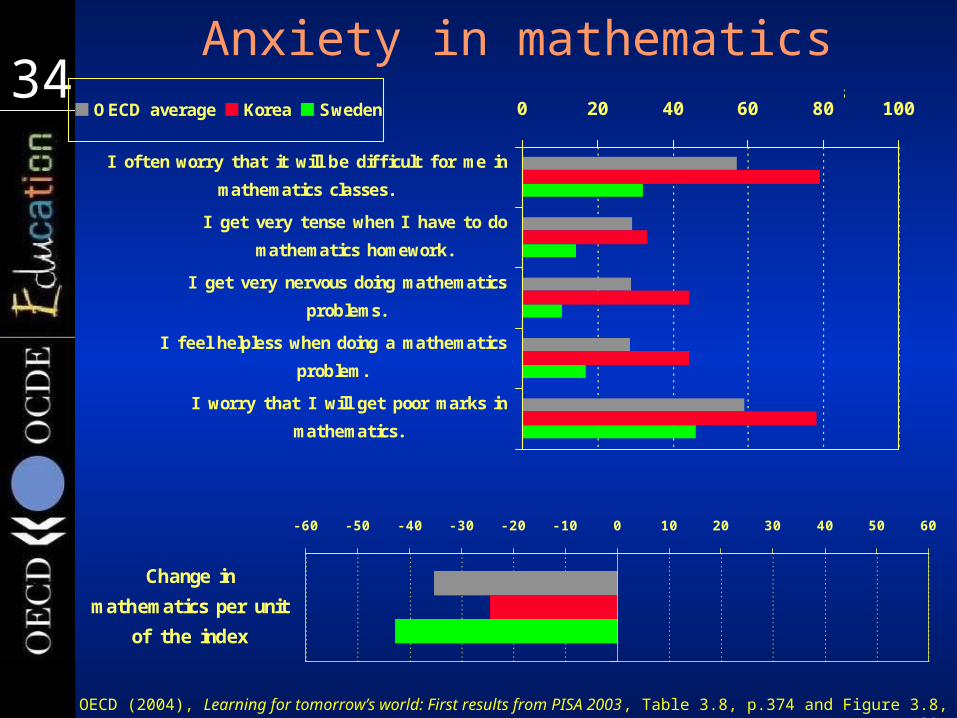
3434Anxiety in mathematics
0 20 40 60 80 100
I often worry that it will be difficult for me in
mathematics classes.
I get very tense when I have to do
mathematics homework.
I get very nervous doing mathematics
problems.
I feel helpless when doing a mathematics
problem.
I worry that I will get poor marks in
mathematics.
OECD average Korea SwedenPercentage of students
- 60 - 50 - 40 - 30 - 20 - 10 0 10 20 30 40 50 60
Change in
mathematics per unit
of the index
Score points
OECD (2004), Learning for tomorrow’s world: First results from PISA 2003, Table 3.8, p.374 and Figure 3.8, p.139.
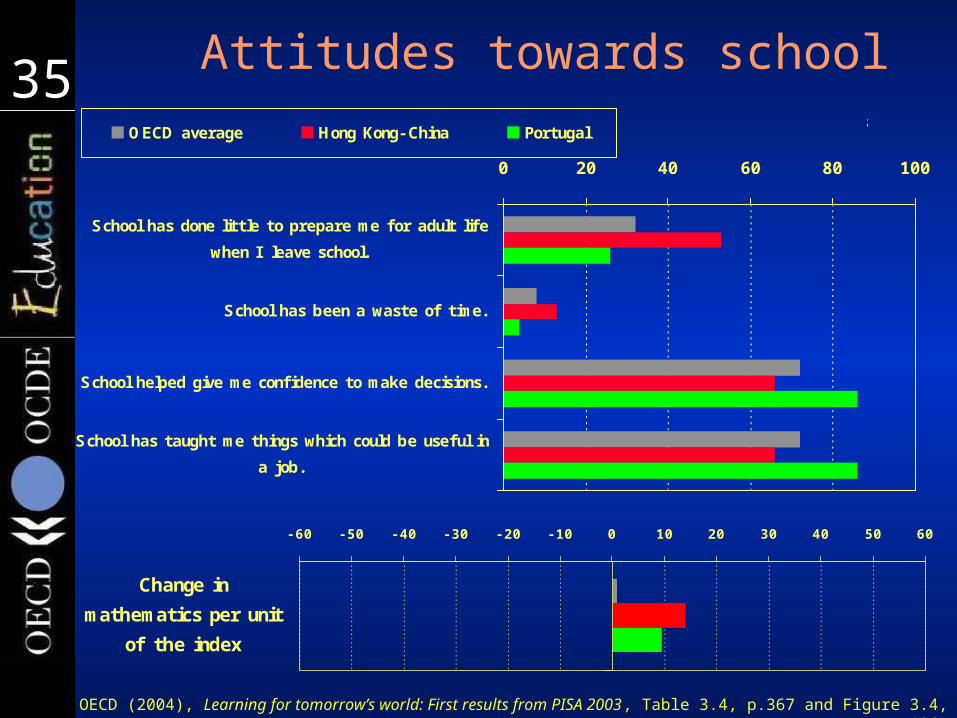
3535 Attitudes towards school
0 20 40 60 80 100
School has done little to prepare me for adult life
when I leave school.
School has been a waste of time.
School helped give me confidence to make decisions.
School has taught me things which could be useful in
a job.
OECD average Hong Kong- China PortugalPercentage of students
- 60 - 50 - 40 - 30 - 20 - 10 0 10 20 30 40 50 60
Change in
mathematics per unit
of the index
Score points
OECD (2004), Learning for tomorrow’s world: First results from PISA 2003, Table 3.4, p.367 and Figure 3.4, p.126.

3636
Low Performan
ce
HighMathematics performance
Low performance
Low social equity
High performance
Low social equity
Low performance
High social equity
High performance
High social equity
Strong impact of social background on performance
Moderate impact of social
background on performance
Student anxiety in mathematics
High degree of anxiety
Low degree of anxiety
I talyPortugal
LatviaUnited StatesSpain
Norway
Hungary PolandLuxembourg
Slovak Republic
AustriaGermany I reland
DenmarkFrance
Sweden
Czech RepublicI celand
Australia
J apan
Belgium
New Zealand
Switzerland Macao- China
Canada
Netherlands
Finland
Hong Kong- China
Korea
Liechtenstein
Russian Federation
Greece
440
460
480
500
520
540
0102030

37373737
How can we get there?
Levers for policy that emerge from international comparisons

38383838 OECD framework
National educ, social and economic context
Structures, resource alloc
and policies
Social & economic
outcomes of education
Community and school
characteristics
Student learning, teacher working
conditions
Socio-economic background of
learners
Antecedentscontextualise or
constrain ed policy
The learning environment at
school
Teaching, learning
practices and classroom
climate
Individ attitudes, engagement and
behaviour
Output and performance of
institutions
Quality of instructional
delivery
Quality and distribution of knowledge &
skills
Policy Leversshape educational
outcomes
Outputs and Outcomes
impact of learning
Individual learner
LevelA
Instructional settings
LevelB
Schools, other institutions
LevelC
Country or system
LevelD
Domain 3Domain 2Domain 1
39393939
350
400
450
500
550
600
0 10,000 20,000 30,000 40,000 50,000 60,000 70,000 80,000 90,000 100,000
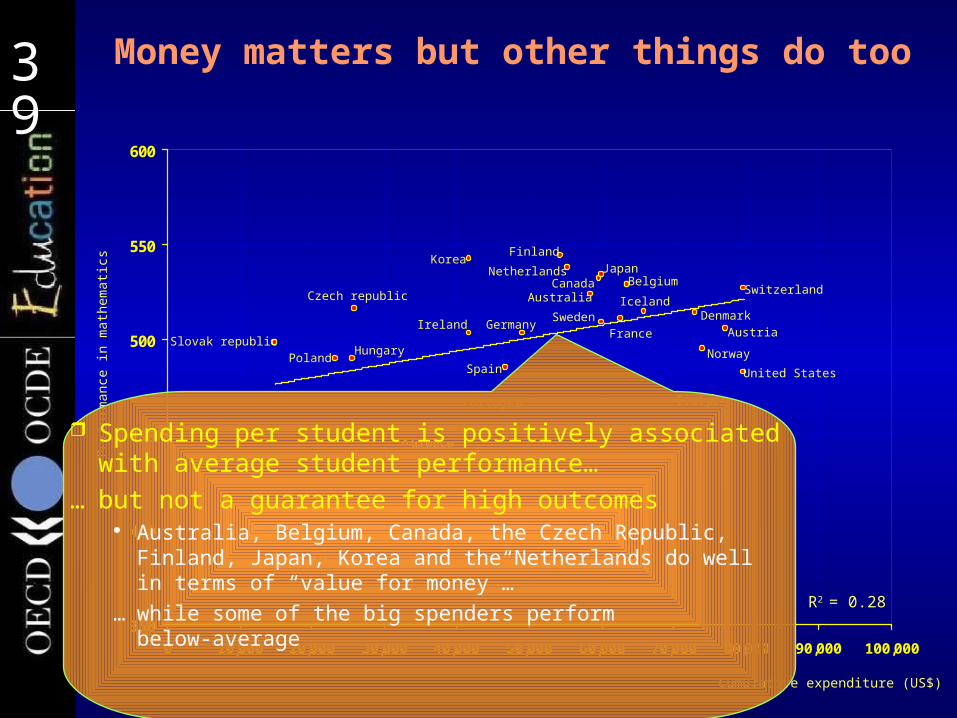
Money matters but other things do too
Mexico
Greece
Portugal Italy
Spain
GermanyAustria
Ireland
United States
Norway
Korea
Czech republic
Slovak republicPoland
Hungary
Finland
NetherlandsCanada Switzerland
IcelandDenmark
FranceSweden
BelgiumAustralia
Japan
R2 = 0.28
Cumulative expenditure (US$)
Perf
orm
an
ce in
math
em
ati
cs
Spending per student is positively associated with average student performance…
…but not a guarantee for high outcomes Australia, Belgium, Canada, the Czech Republic,
Finland, Japan, Korea and the Netherlands do well in terms of “value for money”…
…while some of the big spenders perform below-average
40404040 Sympathy doesn’t raise standards – aspiration does
In the focus countries National research teams report a strong
“culture of performance”– Which drives students, parents, teachers and the
educational administration to high performance standards
PISA suggests… …that students and schools perform better in a climate
characterised by high expectations and the readiness to invest effort, the enjoyment of learning, a strong disciplinary climate, and good teacher-student relations
– Among these aspects, students’ perception of teacher-student relations and classroom disciplinary climate display the strongest relationships
41414141 Governance of the school system In the focus countries
Decentralised decision-making is combined with devices to ensure a fair distribution of substantive educational opportunities
The provision of standards and curricula at national/subnational levels is combined with advanced evaluation systems
– That are implemented by professional agencies Process-oriented assessments and/or
centralised final examinations are complimented with individual reports and feed-back mechanisms on student learning progress
Standard setting and equity-related goals Key objectives:
– Raise educational aspirations, establish transparency over educational objectives, reference framework for teachers
Approaches range from definition of broad educational goals up to formulation of concise performance expectations
Some countries go beyond establishing educational standards as mere yardsticks and use performance benchmarks that students at particular age or grade levels should reach
Instruments– Minimum standards, targets defining excellence,
normative performance benchmarks
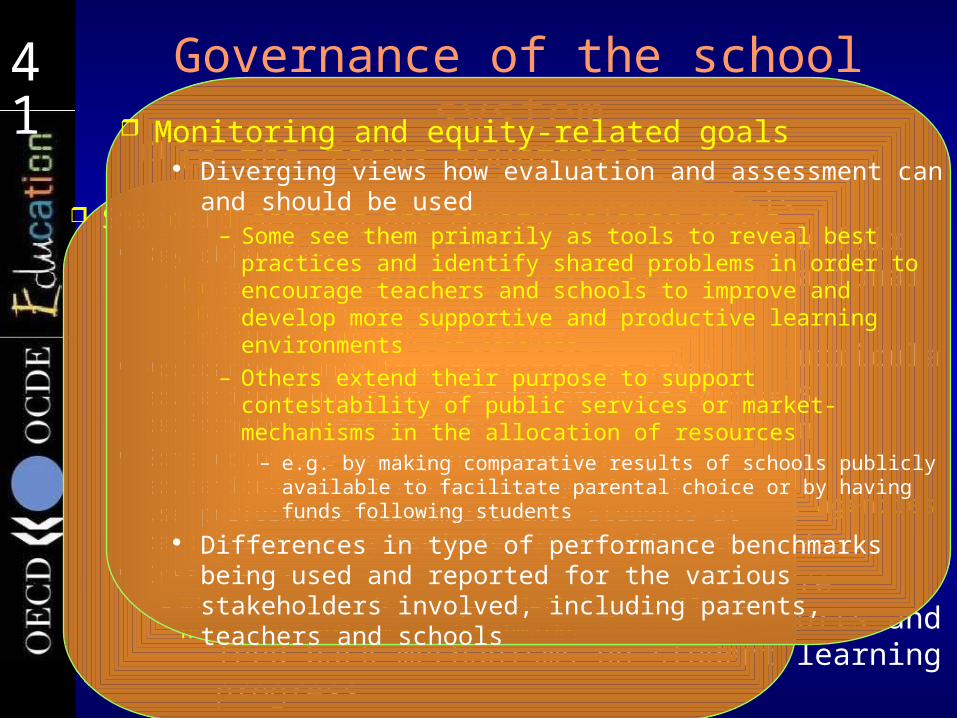
Monitoring and equity-related goals Diverging views how evaluation and assessment can
and should be used– Some see them primarily as tools to reveal best practices
and identify shared problems in order to encourage teachers and schools to improve and develop more supportive and productive learning environments
– Others extend their purpose to support contestability of public services or market-mechanisms in the allocation of resources
– e.g. by making comparative results of schools publicly available to facilitate parental choice or by having funds following students
Differences in type of performance benchmarks being used and reported for the various stakeholders involved, including parents, teachers and schools

42424242 Durchschnittliche Schülerleistungen im Bereich Mathematik
Low average performance
Large socio-economic disparities
High average performance
Large socio-economic disparities
Low average performance
High social equity
High average performance
High social equity
Strong socio-economic impact
on student performance
Socially equitable distribution of
learning opportunities
High mathematics performance
Low mathematics performanceGreece
Russian Federation
Liechtenstein
Korea
Hong Kong- China
Finland
Netherlands
Canada
Switzerland
New Zealand
Belgium
J apan
Australia
I celandCzech Republic
SwedenFrance
Denmark
I relandGermanyAustria
Slovak Republic
LuxembourgPolandHungary
Norway
SpainUnited States Latvia
Portugal I taly
440
460
480
500
520
540
61626

43434343 Durchschnittliche Schülerleistungen im Bereich Mathematik
Strong socio-economic impact
on student performance
Socially equitable distribution of
learning opportunities
High mathematics performance
Low mathematics performance
School with responsibility for deciding which courses are offered
High degree of autonomy
Low degree of autonomy Greece
Russian Federation
Liechtenstein
Korea
Hong Kong- China
Finland
Netherlands
Canada
Switzerland
New Zealand
Belgium
J apan
Australia
I celandCzech Republic
SwedenFrance
Denmark
I relandGermanyAustria
Slovak Republic
LuxembourgPolandHungary
Norway
SpainUnited States Latvia
Portugal I taly
440
460
480
500
520
540
61626
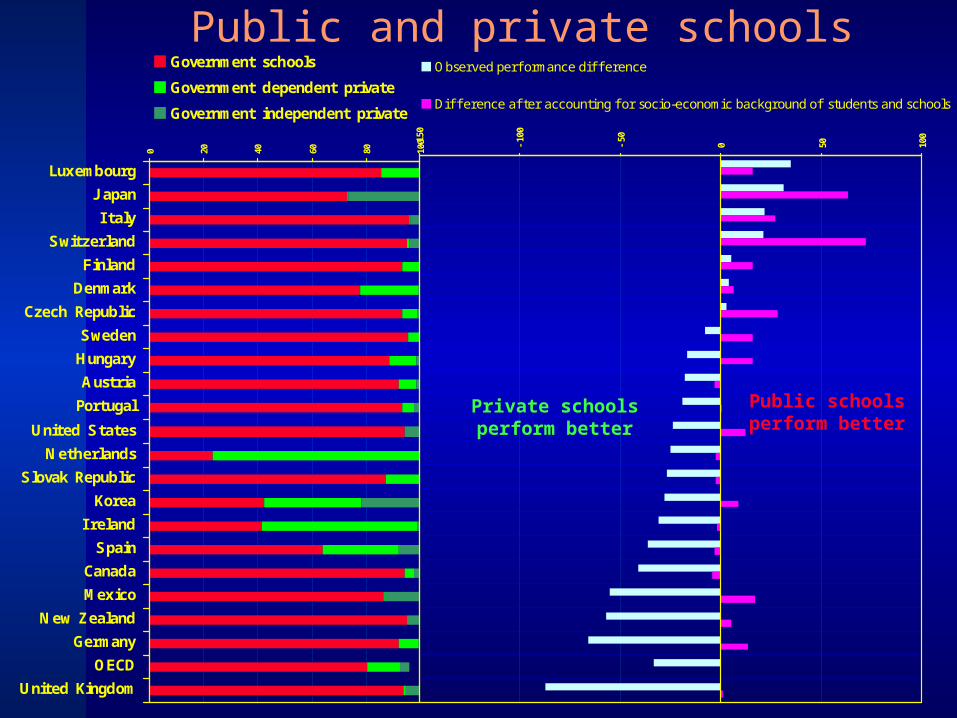
44444444Public and private schools
0 20 40 60 80 100
Luxembourg
J apan
I taly
Switzerland
Finland
Denmark
Czech Republic
Sweden
Hungary
Austria
Portugal
United States
Netherlands
Slovak Republic
Korea
I reland
Spain
Canada
Mexico
New Zealand
Germany
OECD
United Kingdom
Government schools
Government dependent private
Government independent private
-15
0
-10
0
-50
0 50 100
Observed perf ormance diff erence
Diff erence af ter accounting f or socio-economic background of students and schools
Private schools perform better
Public schools perform better

45454545 Organisation of instruction In the focus countries
Schools and teachers have explicit strategies and approaches for teaching heterogeneous groups of learners
– A high degree of individualised learning processes– Disparities related to socio-economic factors and
migration are recognised as major challenges Students are offered a variety of extra-curricular
activities Schools offer differentiated support structures for
students– E.g. school psychologists or career counsellors
Institutional differentiation is introduced, if at all, at later stages
– Integrated approaches also contributed to reducing the impact of students socio-economic background on outcomes
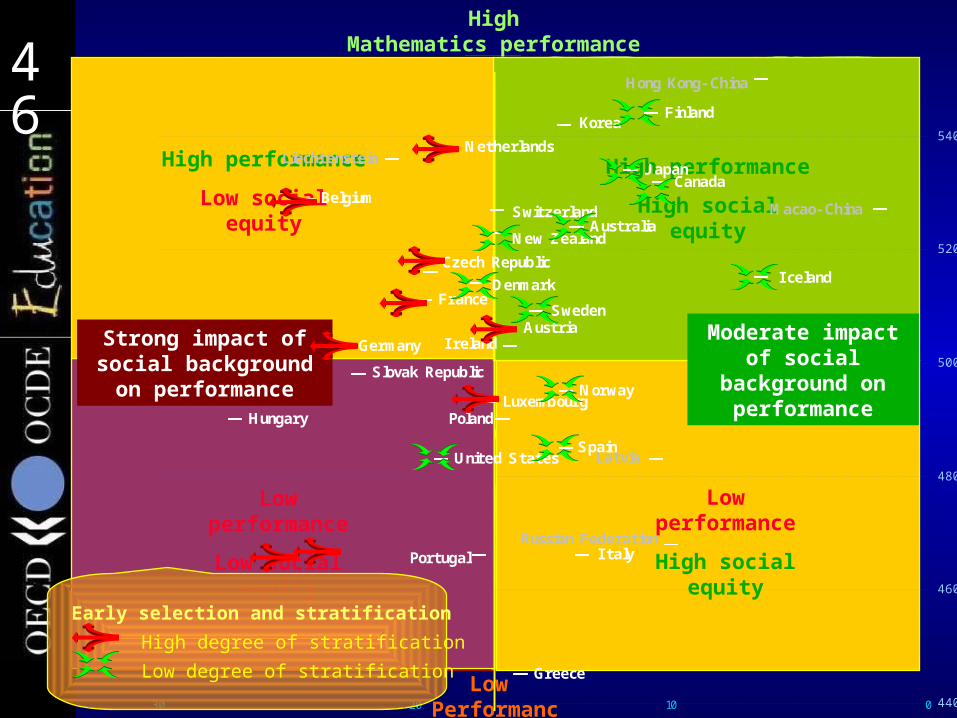
46464646
Low Performan
ce
HighMathematics performance
Low performance
Low social equity
High performance
Low social equity
Low performance
High social equity
High performance
High social equity
Strong impact of social background on performance
Moderate impact of social
background on performance
I talyPortugal
LatviaUnited StatesSpain
Norway
Hungary PolandLuxembourg
Slovak Republic
AustriaGermany I reland
DenmarkFrance
Sweden
Czech RepublicI celand
Australia
J apan
Belgium
New Zealand
Switzerland Macao- China
Canada
Netherlands
Finland
Hong Kong- China
Korea
Liechtenstein
Russian Federation
Greece
440
460
480
500
520
540
0102030
Early selection and stratification
High degree of stratification
Low degree of stratification
47474747 Support systems and professional teacher development
In the focus countries Effective support systems are located at
individual school level or in specialised support institutions
Teacher training schemes are selective The training of pre-school personnel is closely
integrated with the professional development of teachers
Continuing professional development is a constitutive part of the system
Special attention is paid to the professional development of school management personnel

48484848Teacher support in mathematics
Students’ views
0 20 40 60 80 100
The teacher shows an interest in every
student's learning.
The teacher gives extra help when students
need it.
The teacher helps students with their learning.
The teacher continues teaching until the
students understand.
The teacher gives students an opportunity to
express opinions.
OECD average Austria
J apan United States
Percentage of students
OECD (2004), Learning for tomorrow’s world: First results from PISA 2003, Table 5.1a, p.403 and Figure 5.1, p.213.

49494949Student-related factors affecting school
climatePrincipals’ views
0 20 40 60 80 100
Student absenteeism.
Disruption of classes by students.
Students skipping classes.
Students lacking respect for teachers.
Student use of alcohol or illegal drugs.
Students intimidating or bullying other students.
OECD average Canada Korea
Percentage of students
OECD (2004), Learning for tomorrow’s world: First results from PISA 2003, Table 5.2a, p.406 and Figure 5.2, p.216.

50505050Teacher-related factors affecting school
climatePrincipals’ views
0 20 40 60 80 100
Teachers low expectation of students.
Poor student- teacher relations.
Teachers not meeting individual students'
needs.
Teacher absenteeism.
Staff resisting change.
Teachers being too strict with students.
Students not being encouraged to achieve their
full potential.
OECD average Slovak Republic Turkey
Percentage of students
OECD (2004), Learning for tomorrow’s world: First results from PISA 2003, Table 5.4a, p.410 and Figure 5.4, p.220.
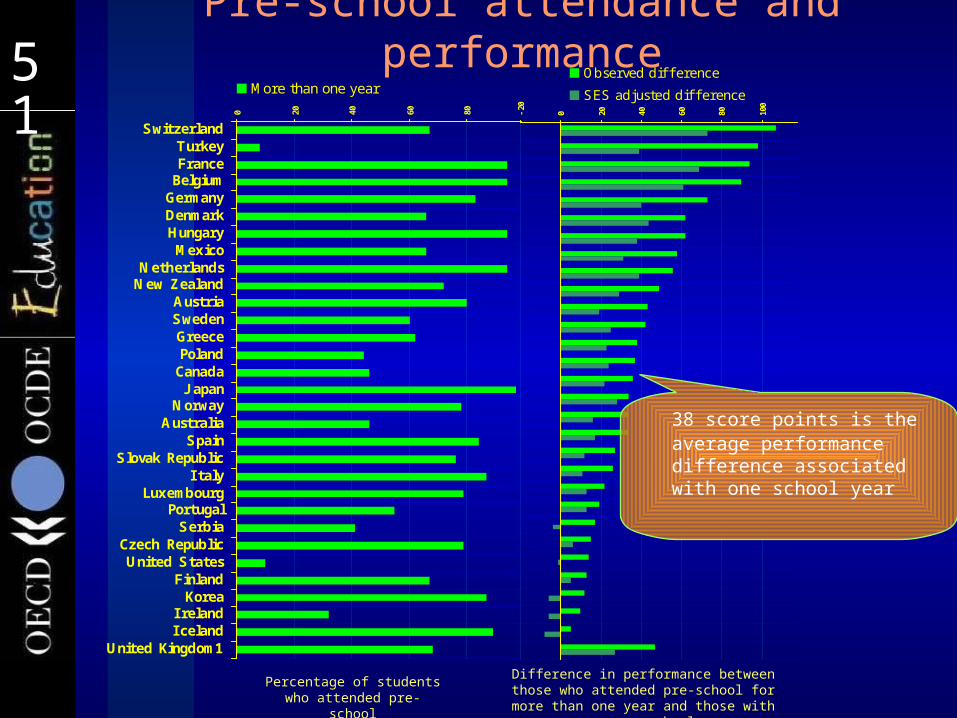
51515151Pre-school attendance and
performance
0 20 40 60 80
SwitzerlandTurkeyFrance
BelgiumGermanyDenmarkHungaryMexico
NetherlandsNew Zealand
AustriaSwedenGreecePolandCanadaJ apan
NorwayAustralia
SpainSlovak Republic
I talyLuxembourg
PortugalSerbia
Czech RepublicUnited States
FinlandKorea
I relandIceland
United Kingdom1
More than one year
-20
0 20 40 60 80 100
Observed diff erence
SES adjusted diff erence
Percentage of students who attended pre-school
Difference in performance between those who attended pre-school for more
than one year and those with no pre-school
38 score points is the average performance difference associated with one school year

52525252Creating a knowledge-rich profession in which schools and
teachers have the authority to act, the necessary knowledge to do so wisely, and access to effective support
systems
The tradition of education systems
has been “knowledge poor”
The future of education systems needs to be
“knowledge rich”
National prescription
Professional judgement
Informed professional judgement, the teacher
as a “knowledge worker”
Informed prescription
Uninformed professional judgement
Uninformed prescription,
teachers implement curricula
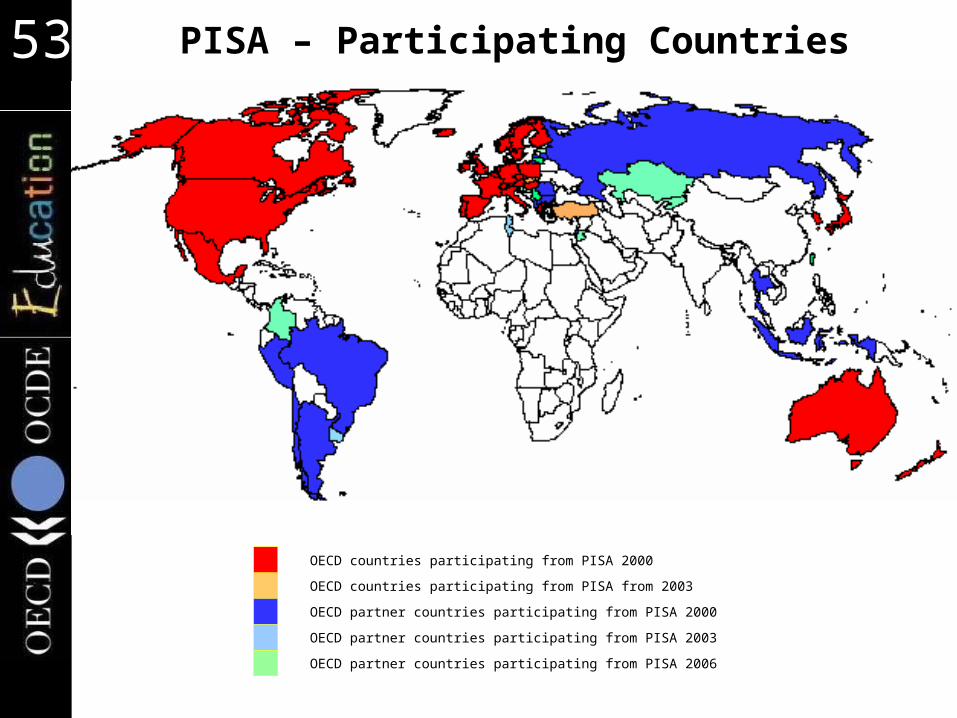
53535353
OECD countries participating from PISA 2000
OECD countries participating from PISA from 2003
OECD partner countries participating from PISA 2000
OECD partner countries participating from PISA 2003
OECD partner countries participating from PISA 2006
PISA – Participating Countries
54545454 Further information
www.pisa.oecd.org– All national and international publications– The complete micro-level database
email: [email protected]
…and remember:
Without data, you are just another person with an opinion