segregation of form, color, and stereopsis in primate...
TRANSCRIPT

The Journal of Neuroscience, November 1987, 7(11): 33783415
Segregation of Form, Color, and Stereopsis in Primate Area 18
David H. Hubel and Margaret S. Livingstone
Department of Animal Neurobiology, Harvard Medical School, Boston, Massachusetts 02115
Primate visual cortical area 18 (visual area 2), when stained for the enzyme cytochrome oxidase, shows a pattern of al- ternating dark and light stripes; in squirrel monkeys, the dark stripes are clearly of 2 alternating types, thick and thin. We have recorded from these 3 subdivisions in macaques and squirrel monkeys, and find that each has distinctive phys- iological properties: (1) Cells in one set of dark stripes, in squirrel monkeys the thin stripes, are not orientation-selec- tive; a high proportion show color-opponency. (2) Cells in the other set of dark stripes (thick stripes) are orientation- selective; most of them are also selective for binocular dis- parity, suggesting that they are concerned with stereoscopic depth. (3) Cells in the pale stripes are also orientation-se- lective and more than half of them are end-stopped.
Each of the 3 subdivisions receives a different input from area 17: the thin stripes from the blobs, the pale stripes from the interblobs, the thick stripes from layer 48. The pale stripes are thus part of the parvocellular system, and the thick stripes part of the magnocellular system. The physiological prop- erties of the cells in the thin and pale stripes reflect the properties of their antecedent cells in 17, but nevertheless exhibit differences that suggest the kinds of processing that might occur at this stage.
Visual perception is commonly thought of as subdivided into various categories, the most obvious of which are form, color, movement, depth, and texture. Although to introspection our vision does not seem particularly piecemeal or fragmented, psy- chophysics and clinical neurology both strongly suggest that these different components of perception may be carried by separate channels in the visual pathway. More direct evidence has lately come from neurophysiology and anatomy. For ex- ample, the prestriate visual area 4 of the macaque monkey seems to contain an abundance of color-coded cells (Zeki, 1973, 1978, 1980, 1983; Desimone et al., 1985; for a conflicting view, see Schein et al., 1982) whereas the middle temporal prestriate area, MT, lacks color-coded cells but is rich in cells responding spe- cifically to movement and stereoscopic depth (Dubner and Zeki, 1971; Zeki, 1974a, b; Baker et al., 1981; Miezin et al., 1982; Maunsell and Van Essen, 1983a, b; Allman et al., 1985). At the earliest stages in the retina, the pathways subserving such visual
Received Dec. 23, 1985; revised Sept. 22, 1986; accepted Feb. 18, 1987. The histology was done by Debra Broihier and Janet Robbins, the photography
by Richard McDonald. The manuscript benefited from comments by David Cardozo, Roger Tootell, and an anonymous referee. This work was supported by NIH Grants E400605 and K04 NS00972. a Presidential Youne Investiaator Award from the NSF, a Young Investigator Award and Grant NOO&4-85-K-0047 from the Office of Naval Research, and funds from the Monsanto Company and E. I. DuPont de Nemours and Co.
Correspondence should be addressed to David H. Hubel, Department of Neu- robiology, 25 Shattuck St., Harvard Medical School, Boston, MA 02115. Copyright 0 1987 Society for Neuroscience 0270-6474/87/l 13378-38$02.00/O
submodalities must obviously be mixed, but even as early as in the lateral geniculate body the inputs from the retina are divided between 2 sets of layers that are histologically and physiologi- cally different, the magnocellular and the parvocellular layers (Wiesel and Hubel, 1966; Leventhal et al., 198 1). These 2 genic- ulate subdivisions project to different layers in area 17 (the primary visual cortex) (Hubel and Wiesel, 1972; Lund and Boothe, 1975). In area 17 the parvocellular pathway then divides again into cytochrome oxidase blobs, which seem to be dealing with color, and the regions separating the blobs (interblobs), which are apparently involved in the processing of shape or form (Livingstone and Hubel, 1984). In area 17, the local cor- tical connections, which extend from any point in all directions for 2-3 mm, link blobs to neighboring blobs, and interblob regions to interblob regions, but apparently do not link blobs and interblobs. The 3 subdivisions in area 17 seem to be seg- regated from one another, and to have separate projection tar- gets in area 18 (visual area 2).
This second visual cortical area is also a mosaic. It has at least 3 structural domains, which have been revealed by cyto- chrome oxidase staining, by 2-deoxyglucose labeling (Living- stone and Hubel, 1982, 1984; Tootell et al., 1983) and by axonal transport following pulvinar injections (Curcio and Hatting, 1978; Livingstone and Hubel, 1982). The pattern in the squirrel monkey consists of 2 alternating sets of cytochrome oxidase dark stripes, thick and thin, separated by a third set of much lighter-staining pale stripes. In the macaque monkey, area 18 is also a mosaic of dark and pale regions, but the pattern is less regular: only in occasional animals are there regular stripes, and then only in some places. While in the macaque the axonal transport anatomy and physiology both indicate 3 domains, one light-staining and 2 dark-staining, the 2 types of dark stripes cannot be told apart reliably by differences in thickness. For the sake of brevity we will nevertheless continue to refer to the 2 dark-staining domains in the macaque as “thick stripes” and “thin stripes.”
Anatomically, the thin stripes are reciprocally connected to the blobs in area 17, and the pale stripes to the interblobs (Liv- ingstone and Hubel, 1983, 1984); in the previous paper (Liv- ingstone and Hubel, 1987a), we present evidence that the main input from area 17 to the thick stripes is from layer 4B.
In this physiological study we recorded from area 18 by mak- ing long microelectrode penetrations parallel to the surface, to learn whether the 3 anatomical subdivisions are concerned with separate visual subtasks. We found that nearly all the cells in the thin stripes lack orientation-selectivity and that a high pro- portion are color-coded (Hubel and Livingstone, 1985); cells in the thick stripes seem mostly concerned with stereopsis, and those in the pale stripes with shape. The finding that units with different response properties are segregated in different subre- gions of 18 has been described in 3 preliminary reports (DeYoe

The Journal of Neuroscience, November 1987. 7(11) 3379
and Van Essen, 1985; Hubel and Livingstone, 1985; Shipp and Zeki, 1985).
We begin by describing the physiological properties of the various types of cells in area 18. Then we discuss the degree to which these cell types are grouped together, and the correlation between the physiological groupings and the cytochrome oxi- dase pattern.
microcomputer we plotted poststimulus time histograms, and from these we prepared graphs of responses versus spot diameter.
Stereoscopic depth stimuli. To examine stereoscopic mechanisms in single cells, one must be able to monitor or control eye position precisely. We therefore used a second reference electrode (Hubel and Wiesel, 1970) in the part of area 17 representing a visual field eccentricity of (l-1”. Here we could easily find binocular cells with receptive fields as small as Go x i/4”. Having isolated such a reference cell, we left the electrode in place and referred back to it. For every cell in area 18 we remapped the reference cell’s receptive fields and corrected the direction of gaze
Materials and Methods with the prism whenever a shift in receptive-field position indicated that either eve had moved. Eve movements were not much of a oroblem provided the dose of gallamine was adequate. General. Anesthesia was induced with ketamine. In early experiments
we used 1.5-2% halothane to maintain anesthesia; in later experiments we used a mixture of 75-80% nitrous oxide in oxygen. The eyes were kept paralyzed with a continuous intravenous injection of gallamine triethiodide and were protected with contact lenses fitted to obtain a focus at the screen distance of 1.5 m.
Physiology. For recording, we drilled a hole a few millimeters in diameter in the skull and cut a smaller hole in the dura. Electrodes were insulated, electropolished tungsten wires, advanced through a stainless- steel guard tube using a hydraulic microdrive (Hubel, 1959). To min- imize pulsations, we sealed the guard tube to the skull (Li and Jasper, 1953) using dental impression wax. Each extracellularly recorded unit studied was distinguishable as a single isolated unit, but we could also discern background multiunit activity. A Schmitt trigger circuit con- verted the recorded action potentials to pulses for plotting response histograms. In squirrel monkeys we positioned the electrode to enter the cortex at an acute angle to the surface ( 1 p-20”) in a direction parallel to the 17/ 18 border and l-4 mm anterior to it. In macaques, we recorded from the buried part of area 18 behind the lunate sulcus by putting the electrode into the cortex S-10 mm behind and parallel to the sulcus at a shallow angle. This way the electrode went through area 17 first and then entered area 18 from the intervening white matter. In each pen- etration we made several small lesions (l-2 PA for l-2 set) to mark points for use in interpolating electrode positions when the track was later reconstructed histologically. To avoid gaps in recording produced by damage from a lesion, we first recorded for about 200 pm beyond the intended lesion site, and then withdrew and made the lesion, if possible recording while withdrawing until the physiology (especially the optimal stimulus orientation) matched what we had previously found at the point to be marked.
Color stimuli. In a recent paper we described in detail our methods for examining the responses of single cells to colored stimuli (Living- stone and Hubel, 1984, part 2). We projected stimuli onto a white screen, either with a tripod-mounted slide projector or by means of an optic bench driven by a computer and servomotors. The light source for both systems was a 500 W tungsten bulb. The screen was lit diffusely with white light at photopic levels (1.2 log cd/m2) and the stimulus was roughly 1 log unit brighter: easy to see, but not bright enough to produce glare.
Colored light was produced with interference filters (Ealing; 10 nm half-bandwidth) or with broadband gelatin filters [Wratten No. 29 (red); No. 16 (yellow); No. 58 (green); No. 45 (cyan); or No. 47B (blue)]. We made spectral sensitivity curves for only a few of the cells examined in area 18, for our purpose was mainly to establish the geometry of the receptive fields and the presence and type of color-coding, rather than to establish each cell’s specific rod or cone inputs. For the few cells we examined in detail, we measured, for a given spot size, the threshold light intensity (the neutral-density wedge settings at which a response could just be heard) for each interference filter. For most cells we simply compared responses obtained with different color filters, all for the same neutral-density wedge setting, always checking to be sure that, for a given filter, lowering the intensity did not lead to an increase in response, since a small spot, if very bright, can lose its effectiveness because of light scatter into the receptive-field surround. We categorized a cell as red versus green if the null, or crossover between on and off responses, occurred at around 580 nm; cells with nulls of around 480-500 nm were classified as yellow-blue. Analyses of cone inputs from spectral sensitivity curves, generated for 10 of the color-opponent cells, in each case agreed well with the simpler method of categorizing color coding by the crossover wavelength. We nevertheless must regard our color categorizations as tentative because we did not do spectral sensitivity curves or adaptation studies on most of the cells we studied.
With the optic bench driven by a microprocessor and a HP-9826
We mounted 2 variable (Risley) prisms in front of the left eye, as shown in Figure 1. To align the 2 eyes, we used the first prism to superimpose the right and left eye receptive fields for the reference cell. A small diagonal mirror was positioned behind this prism and out of the line of sight. A laser beam directed at the mirror from the side and deflected through the prisms and onto the screen served as an indicator of the prism setting. When we had brought the reference cell’s fields into superposition, we marked the position of the spot to indicate zero disparity. (The laser spot, of course, had nothing directly to do with the stimulus spot, being positioned a few degrees away from the receptive fields under study.) The validity of a reference cell in area 17 depends on the assumption that cells in area 17 themselves have zero disparity. In our experience (see below) disparity-tuned cells in 17 exist, but are rare (see Fig. 15) and in any case are easily recognized by the critical dependence of responses on relative eye position. The reference cells often showed binocular synergism, but had tuning curves that were broad compared to the size of the receptive fields in each eye; further- more, unlike most stereotuned cells in 18, they gave good responses to stimulation of either eye separately.
In an anesthetized paralyzed cat, a rotation of the orbits in the equa- torial plane can be large enough to cause problems in testing disparity selectivity. In the monkey such rotation seems to be insignificant judging by our failure over many years to find any consistent differences in the preferred orientations of binocularly driven cells, and from the fact that when the 2 foveas are superimposed, the peripheral receptive fields in the 2 eyes are also superimposed.
We first made rough tests on every new cell to see whether the prism setting had any marked influence on responses. We moved the direction of gaze of one eye (and therefore the disparity), as monitored by the laser spot, slowly back and forth while stimulating either with the au- tomatic optic bench or with the hand-held slide projector. If the re- sponses were sensitive to the prism setting, we reset the prism to 0 disparity and attached a second prism in front of the first; this prism then controlled the direction of gaze along an axis at right angles to the optimum stimulus orientation. [A previous study (Hubel and Wiesel, 1970) had shown that for stereotuned cells, the setting of direction of gaze along this axis was critical; varying the setting in a direction parallel to the optimum stimulus orientation gave a tuning curve that was broad (unless the cell was end-stopped) relative to total receptive field size.] The second prism was servomotor-controlled and allowed us to obtain poststimulus histograms for different prism settings. From these his- tograms we constructed a tuning curve-a graph in which response rate is plotted against disparity.
Histology. At the end of each experiment, we administered a lethal dose of sodium pentobarbital and perfused the animal through the heart with saline followed by fixative (2.25% glutaraldehyde, 0.75% formal- dehyde, 0.9% NaCl, 0.1 M sodium phosphate, pH 7.5). We removed the brain, dissected free and unfolded the posterior occipital cortex, flattened it between Teflon plates, and froze it in liauid Freon 22 (-3OQ. Tangential sections 50 pm-thick were cut on a freezing microtome and stained for cytochrome oxidase (Wong-Riley, 1979). To correlate the physiological recordings with the cytochrome oxidase histology, we compared the positions of the small lesions made during recording sessions to the cytochrome oxidase pattern. Since the stripe pattern is usually clearest in the deeper layers and our penetrations spanned the full thickness of the cortex, we usually stacked photographic transpar- encies made from the tangential sections and aligned them using the radially running blood vessels. In several of the histological photographs shown in this paper, 2 or 3 such adjacent sections were stacked, either to show several lesions in one photograph or to increase the contrast and clarity of the stripe pattern. The blood vessels at the edges, where the sections do not align as well, appear as doublets or triplets.

3380 Hubel and Livingstone * Segregation of Form, Color, and Stereopsis in Primate Area 18
Figure I. Diagram of method of bin- ocular stimulation. The right eye viewed the screen directly. The left eye viewed the screen through two Risley (adjust- able) prisms, mounted so that the di- rection of gaze of one eye could be var- ied. We adjusted the first prism by hand to superimpose the projections of the 2 visual axes on the screen. This was done by recording from a binocular cell close to the fovea1 region of area 17 and su- nerimnosina the 2 retentive fields. Then. io testthe dr&arity selectivity of another cell, usually one in area 18, we rotated the second prism so that changing its setting changed the relative positions of the receptive fields in the 2 eyes along a line perpendicular to the orientation axis of the receptive fields. The dispar- ity was monitored by placing a 45” mir- ror behind the prisms and in front of the left eye, but out of the line of sight, and projecting a laser beam through the prisms onto the screen; the spot from the beam, falling a few degrees to one side of the receptive fields, was used to calibrate the setting of the prisms.
Results 1. Cell types in area 18 We studied the visual receptive field properties of 1023 single units in area 18 of 10 monkeys (5 macaque and 5 squirrel monkeys). We tested each cell for differential responsiveness to the following stimulus variables: (1) receptive-field position; (2) receptive-field geometry, including selectivity for stimulus size, shape, and length, degree of center/surround antagonism, ori- entation selectivity, and optimum stimulus size, as compared to overall receptive-field size; (3) degree of interaction of the 2 eyes, including the relative strengths of the input from the 2 eyes, the degree of synergism when the 2 eyes were stimulated to- gether, and the effects ofvarying the ocular disparity; (4) whether the cell responded better to a light stimulus on a dark back- ground or to a dark stimulus on a light background; (5) whether it responded better to the onset or to the cessation of the stim- ulus, or to both; (6) color or wavelength selectivity in different parts of the receptive field; (7) whether the response was sus- tained or transient; and (8) selectivity for movement, including selectivity for the direction and speed of movement and relative responsiveness to stationary and moving stimuli.
In agreement with previous studies of the physiological prop- erties of cells in primate area 18 (Hubel and Wiesel, 1970; Zeki, 1974a, b, 1975, 1978; Baizer et al., 1977; Poggio and Fischer, 1977; Van Essen and Z&i, 1978; Poggio, 1984; Poggio et al., 1985; Shipp andzeki, 1985; DeYoe andVan Essen, 1985; Burk- halter and Van Essen, 1986), we find in area 18 cells with se- lectivity for each of these variables. But, as in area 17, any given cell in 18 showed selectivity for only a limited subset of these variables. Despite the large number of possible combinations
.er
of these variables, we found a strong tendency for single cells to be selective for only particular subsets of variables. Moreover, units with selectivity for a given constellation of variables tended to occur in series, implying that in area 18, as in area 17, cells are grouped according to common functions.
On the basis of the concurrence of particular subsets of vari- ables in single cells, we have distinguished 4 categories of cells: (1) unoriented, (2) oriented complex, (3) disparity-tuned, and (4) end-stopped. (Although each category is distinguished by a constellation of variables, which we will describe below, we have designated each category by only one, unique, parameter.) We have some confidence that these categories are not arbitrary because of their strong tendency to be correlated with the cy- tochrome oxidase pattern.
Unoriented cells In the preceding study in area 17 (Livingstone and Hubel, 1984), we found that cells in the cytochromedark blobs of layers 2 and 3 lack orientation selectivity and are of 2 main types- color-opponent and broadband. Broadband cells have no color opponency in their receptive-field centers; they can be either on- or off-center, and they have a surround that antagonizes the response of the center. Color-opponent cells give on responses to wavelengths in one part of the spectrum and off responses to wavelengths in another part. In primates, beyond the photo- receptor stage, color-coded cells (retinal ganglion cells, parvo- cellular geniculate cells, and unoriented cells in area 17) show 2 kinds of color-opponency: between red cones and green cones (red-on/green-off or red-off/green-on) and between blue cones and summed input from red and green cones (blue-on/yellow-

The Journal of Neuroscience, November 1987, 7(11) 3381
off or blue-off/yellow-on). In blobs, most of the color-opponent cells, like the broadband cells, have receptive-field surrounds that are antagonistic to the center, and are called double-op- ponent; a minority of the color-opponent cells, termed type 2 cells, have color-opponent centers but lack antagonistic sur- rounds. Though adjacent cells often had the same color coding, suggesting that cells with similar color coding are grouped, we have seen different types of color coding within a single blob; we have seen color-opponent cells, both red/green and yellow/ blue, and broadband cells within single blobs, usually in small subgroups but occasionally intermixed. Ts’o et al. (1986) have reported that single blobs do not contain mixtures of the 2 types of color-opponency, and since our categorization of the type of color-opponency was based on the crossover wavelength, we cannot be certain that we have seen both yellow/blue and red/ green cells in a single blob.
We have proposed that the processing of color information requires all 3 types of cone interaction: red versus green, blue versus yellow, and white versus black. Experimental psycho- physics has shown that human color perception involves a 3-variable calculation. At the level of the photoreceptors, these 3 variables are determined by the outputs of the 3 different cone types, red, green, and blue, but at subsequent stages-perhaps even from the bipolar cells on, and certainly by the time the cortex is reached-the information has clearly been recoded into a different set of variables by the summing and subtracting of inputs from the 3 kinds of cones. The 3 new variables are most likely (1) red minus green, (2) yellow (red + green) minus blue, and (3) white (red + green + blue) versus black (-red-green- blue). As long as the computation involves linear combinations of the 3 original variables, no information is lost. Indeed, if color is first represented in a 3-dimensional space (Land, 1964) with 3 axes, red, green, and blue, then the transmutation to red- green, yellow-blue, and black-white merely involves a rotation of the axes or a change to polar coordinates (Land, 1983; Liv- ingstone and Hubel, 1984).
The cells examined in area 18 that lacked orientation selec- tivity showed a strong tendency to occur in clusters, and, as we will describe in the second part of this paper, were located in the thin, dark stripes. In the macaque, a high proportion of these unoriented cells were like cells in the cytochrome oxidase blobs of area 17 in showing double-opponent color coding. In this section we describe the types of unoriented cells found in area 18, including an unoriented subtype that we did not observe in area 17, and which we term “complex unoriented.” A prelim- inary account of these results has been published (Hubel and Livingstone, 1985).
In area 18, twelve percent of the cells recorded showed no obvious orientation selectivity and responded vigorously to sta- tionary stimuli. We will refer to them as “unoriented cells.” They stand in sharp contrast to the other cell types described below-complex, end-stopped, and stereotuned-all of which showed very clear orientation tuning and responded poorly or not at all to stationary stimuli. These cells, like their blob pre- decessors, were selective for the sign either ofluminance or color contrast, but were not selective for the other stimulus variables we tested, as described above. In area 17, blob cells were sim- ilarly sharply distinguishable from simple and complex cells, and by similar criteria. In area 17, a small number of cells, often located at the edges of blobs, responded to all orientations of a line, but showed some weak orientation preference. In the pres- ent study, in area 18 we saw no evidence for such gradations,
but we would need orientation-tuning curves in a large number of cells to be sure of their absence.
Over half of the unoriented cells seemed similar in every way to blob cells in area 17 (Livingstone and Hubel, 1984). They fell into the same 3 groups: broadband, double-opponent, and center only (type 2). In Table 13 the broadband and double- opponent cells are all listed as ordinary unoriented. The subgroupings of color-coded cells (R+ G-, etc.) are to be con- sidered as tentative, just as they were in the case of the chromatic cells in blobs, and for the same reasons: rigorously distinguishing red/green from yellow/blue requires the use of chromatic ad- aptation-which is more time-consuming than the goals ofthese experiments permit-or the use of special tests, such as those employed by Derrington et al. (1984). We suspect that a cell that gives on-responses to very short wavelengths, off-responses to middle and long wavelengths, and no response to white or to wavelengths around 480-500 nm is a blue-yellow cell; if the null was around 580 nm, we categorized it as red-green.
As in area 17, we called a cell double-opponent if it showed color-opponency throughout a center region-either red-on/ green-off, red-off/green-on, blue-on/yellow-off, or blue-ofVyel- low-on-and if, for all wavelengths, a large spot gave weaker responses than a small spot just filling the center. Sometimes interposing a color filter into a beam of white light made the center response stronger, suggesting color-opponency; if we could not demonstrate a response of the opposite type (off versus on) to some other wavelengths, we could almost always bring out an opponent response by tonically shining a light at the optimal wavelength, and then turning on or off a second beam of light at some other wavelength. Usually such artifices were not nec- essary to elicit color-opponency. Similarly, we considered a cell to have surround-opponency if it gave a better response to a small spot than to a larger spot; that is, we did not require explicit responses to stimulation of its receptive-field surround alone using annuli. The original cells observed in goldfish did respond to annuli (Daw, 1968) but in macaques an R+ G- double-op- ponent cell (as we use this term) does not generally respond to turning on or off a green annulus by itself. This seems analogous to the frequent absence of explicit surround responses in broad- band center/surround retinal ganglion cells, despite the fact that in such cells one can easily demonstrate the effects of the sur- round by comparing small with large spots (Barlow, 1953). In double-opponent cells the evidence for the existence of the sur- round is similarly the absence or marked reduction of response to a large spot, whatever the wavelength. We have nevertheless been surprised to find that in many double-opponent cells the interactions of the center and surround for different color com- binations are not as simple as would be predicted from their responses to small and large spots of only one color. For a red- on/green-off center red-off/green-on surround double-opponent cell, for example, the response to a red spot surrounded by a green annulus is not necessarily stronger than the response to a red spot alone, and is frequently weaker (M. S. Livingstone and D. H. Hubel, unpublished observations; see also Ts’o et al., 1986). This is in contrast to our previous finding, which prob- ably represents the exception rather than the rule (fig. 14 in Livingstone and Hubel, 1984). These more recent results imply that the inhibitory surrounds of double-opponent cells do not act independently, but only by antagonizing the center input. The various cone inputs to the centers and surrounds ofdouble- opponent cells thus do not seem to add and subtract in any simple manner.

3382 Hubel and Livingstone * Segregation of Form, Color, and Stereopsis in Primate Area 18
lfm on-responses to Lj’red spots
receptive field @fion in degrees
A Figure 2. A, Complex unoriented double-opponent cell from area 18 of a macaque. The pillars represent firing rates during responses of a cell to a spot of red light VP x %“, 640 nm. The grid on which the pillars sit represents part of the visual field; the numbers indicate degrees of visual angle. The maximum response was obtained over a region about 4” x 4”, beyond which the smaller pillars represent the irregular background firing rates. The upper left poststimulus histogram represents the maximum response; the lower right histogram, no response. Time in seconds. B, Same cell as in A, showing firing rates during the “on” period to successively larger red spots (640 nm) centered close to the region of maximal response. To the left are poststimulus time histograms from which rates for the “on” periods were obtained. C, The same cell. Response rates for the “off” discharges to blue spots (480 nm). (From Hubel and Livingstone, 1985.)
At a given eccentricity, receptive-field centers of most ordi- nary unoriented cells in area 18 had about the same size as field centers of blob cells in 17, with both diameters 2-3 times larger than those of cells in layer 4Cp of area 17.
Complex unoriented cells. In the macaque, almost half of the unoriented cells had properties more complicated than those just described. We use the term “complex” to describe receptive fields that behave as if they perform an “or” logical operation on input from many cells with simpler properties. The term “complex” was originally coined (Hubel and Wiesel, 1962) to describe orientation-selective cells whose receptive fields lacked the distinct excitatory and inhibitory subregions characteristic of simple-cell receptive fields; such oriented complex cells re- spond as if they receive input from many simple cells with the same orientation sclcctivity, but whose receptive fields are scat- tered over an area ::Z iger than the size of a single simple-cell receptive field. In an analogous way, complex unoriented cells respond as if they pooled input from many unoriented cells, all having the same type of color coding but different receptive- field positions. Like ordinary unoriented cells, complex unori- ented cells fell into 2 main groups, broadband and color-op- ponent; each cell responded best to an appropriately colored spot of optimum size and usually gave little or no response to
larger spots, indicating the presence of an antagonistic surround. But unlike ordinary unoriented cells, complex unoriented cells responded to an optimum-size spot anywhere within an area many times greater than the optimum spot size. This “activating region” could be up to 4” in diameter when the optimum spot size was only 1/40-L/P. B aizer et al. (1977) have previously de- scribed broadband cells of this type in area 18; they called them “spot cells.” Two of the complex unoriented cells we saw in squirrel monkeys lacked any inhibitory surrounds; like type 2 cells, they gave color-opponent responses to small spots, and the responses were the same for large as for small spots; we called them “complex” because the region over which they were responsive was much larger than the smallest optimum spot size.
Figure 2 illustrates the responses from a red-on/green-offcom- plex double-opponent cell. The grid in Figure 2A represents part of the visual field, and the pillars represent firing rates during a 1 set presentation of a %” x %” red spot at various points on the screen. The cell gave excitatory responses to this red spot over about a 4” x 4” region. The shorter pillars outside this area represent the irregular background firing (see insets). Figure 2B shows the on responses to red spots, and Figure 2C the off responses to blue-green spots. Though this cell did not give

B
//j//ll II I Ill a II
I I! ,I , .._.._. ,ll. III 11~..~~.11.11~1_11~ _... I-I lhllh._, .___.. hll..il
B
discharges to blue
Figure 2. Continued. C

$334 I-Mel and Livingstone * Segregation Of Form, Color, and Stereopsis in Primate Area 13
LEFT EYE RIGHT EYE BOTH EYES
BLUE I p JILl&L- 4 6 1 4 6 I 4 6
RED plrlpIJ$Bh_lhrulu - 1
&d.l.&ML 4 6 1 4 6 1 4 6
Figure 3. Strange cell, recorded from layer 6 of area 18 in a macaque. The first of a series of 4 such cells recorded in sequence. Type 2 (center only), green-on, red-off in the left eye, red-on, green-off in the right eye. No response to stimulating both eyes together at any wavelength, or either eye separately with white light. We assume the color-opponency was red-green, because the crossover was about 580 nm (yellow) and maximal responses to short wavelengths were at about 480 nm. Abscissa = time in seconds.
explicit responses to annuli, both on and off responses decreased as the spot size was increased beyond the optimum, indicating an antagonistic input from the surround.
Complex color-coded double-opponent cells, like ordinary color-coded double-opponent cells, gave weaker responses to white spots than to colored spots of optimal wavelengths. For a red-on/green-off double-opponent cell, when a red and a green spot were shone simultaneously on the same part of the visual field (making a yellow spot), their effects usually canceled, so that no response was evoked. Moreover, the few times they were tested, the effects of 2 optimum-sized spots of opponent wave- lengths (red and green, for a red-green cell) shone simultaneously in 2 different parts of the activating region, also usually canceled each other. Complex unoriented cells were all driven indepen- dently from each eye and, with a few remarkable exceptions, their properties in the 2 eyes were similar (see below, under type 2 miscellaneous cells). We found mutual cancellation of on and off responses when the 2 eyes were simultaneously stimulated in the activating areas with light of opponent wavelengths, whether or not the light fell on exactly corresponding regions of the 2 retinas.
In this series, we did not compare systematically the prop- erties of cells in different layers, but had the impression that complex unoriented cells were more common in layers 5 and 6 than in other layers. Since input cells and output cells are usually found in different cortical layers, it will be important to study laminar differences in physiological properties. We chose to defer such a study because it is best done with vertical pene- trations, rather than with the tangential penetrations we used in order to examine radial organization.
We saw only 5 examples of complex unoriented cells in squir-
rel monkeys, out of a total of 29 unoriented cells (17%), in contrast to the proportion in macaques (43 out of 95, or 45%). Color-coded cells were also far more common in macaques (see Table 1).
Type 2 cells. Type 2 cells, color-opponent center-only (Wiesel and Hubel, 1966; Livingstone and Hubel, 1984), made up about one-tenth of the population of unoriented cells in area 18- about the same proportion as in 17-and occurred both in ma- caques and in squirrel monkeys. The smallest optimum spots were about the same size as the centers of double-opponent receptive fields at the same eccentricity.
In the macaque, 4 of the 6 type 2 cells we saw were odd, to put it mildly, being red-on/green-off in one eye, and red-off/ green-on in the other. These 4 cells were all recorded from the same monkey in a single uninterrupted sequence in layer 6 (see Fig. 19, depths 4.90-5.05 mm). Figure 3 shows average response histograms for the first of these cells (depth, 4.90: left eye, G+ R-; right eye, R+ G-). The second and fourth cells ofthe sequence were similar to this one, but the third had the reverse behavior (left eye, R+ G-; right eye, G+ R-). Two broadband cells im- mediately followed this sequence. We naturally asked whether any of these recordings could have been from 2 cells simulta- neously, each cell monocular and with opposite properties in the 2 eyes. But in each case, shining 2 red spots, one in the left eye and one in the right, gave a much weaker response than shining to a single spot in the eye excited by red, and a similar mutual cancellation was seen with green light.We have reported similar cells, except that they were double-opponent, in blobs of area 17 (Livingstone and Hubel, 1984). Although finding more than one such bizarre cell suggests that they are not simply mistakes of nature, it is hard to imagine what such cells can be

The Journal of Neuroscience, November 1987, 7(11) 3385
Table 1. Unoriented cells
Macaque Squirrel monkey
Ordi- Com- Ordi- Com- nary plex nary plex Total
Black-white On center I 16 15 2 40 Off center 6 1 0 1 8
Total 13 17 15 3 48 Double-opponent
R’ G- 17 9 5 0 31 B’ Y- 7 5 0 0 12 Y’ Rm 3 6 0 0 9 Y’ Bm 6 6 1 0 13
Total 33 26 6 0 65 Type 2
R’ Gm 0 0 0 1 1 B’ Ym 0 0 2 1 3 G’ R- 2 0 1 0 3 Y’ B- 0 0 0 0 0 Misc. 4 0 0 0 4
Total 6 0 3 2 11 Total unoriented cells 124
good for, since, if both eyes were open, they should respond only to colored objects closer to or farther from the plane of fixation, and not to large colored objects at any distance. They may nevertheless represent a higher level of processing than ordinary color-coded cells, perhaps pooling input from cells with different types of color coding, perhaps playing some role in binocular rivalry and suppression.
Oriented complex cells Many of the cells we saw in area 18 seemed no different from the complex cells previously described in area 17 of both cat and monkey (Hubel and Wiesel, 1962, 1968). We have nothing to add to the descriptions of complex cells already available, but have listed them as a separate category to indicate that they formed a very prominent group of cells in area 18 (see Table 2). These oriented complex cells were very selective for stimulus orientation, responding best to bars or edges of only a narrow range of orientations, usually without selectivity for the color or the sign of the luminance contrast of the bar or edge. They almost always preferred moving to stationary stimuli. Stereo- tuned and end-stopped cells, described below, would also qualify as oriented complex cells, but they have additional distinguish- ing properties.
As we show in Part 2, oriented complex cells were intermixed either with stereotuned cells or with end-stopped cells, whereas end-stopped and stereotuned cells were seldom intermixed. We saw no obvious differences between the complex cells that oc- curred together with stereotuned cells and those that were grouped with end-stopped cells, but from the results described below, we suspect that, had we done the appropriate tests, they might have shown differences in contrast sensitivity or ability to use color-contrast information.
Disparity-tuned cells Experiments on the physiological basis of stereoscopic depth nerception were first done in the cat by Barlow et al. (1967)
0 0
;z 10 ul i, ; 1 ; 1 ; 1 ; 1 ; r . . . . . . . L -2 -1 a 1 2 R
DISPARITY - DEG
Figure 4. Disparity-tuning curve and average response histogram for an ordinary complex cell in area 17 of a squirrel monkey (same monkey as in Fig. 14, but from area 17 of the opposite hemisphere). Though clearly driven from both eyes, the cell showed no obvious binocular synergism, as can be seen from the responses to separate eyes (L and R). Length of receptive field, 1”.
Nikara et al. (1968) and Pettigrew et al. (1968). Numerous studies have followed in cat (Henry et al., 1969; Joshua and Bishop, 1970; Bishop et al., 1971; von der Heydt et al., 1978; Fischer and Kruger, 1979; Ferster, 1981), in macaque (Hubel and Wiesel, 1970; Poggio and Fischer, 1977; Poggio et al., 1985) and in sheep (Clarke and Whitteridge, 1974, 1976; Clarke et al., 1976; Ramachandran et al., 1977). These studies report finding cells, in both areas 17 and 18, whose responses are critically dependent on the relative horizontal positions of the stimuli in the 2 eyes. Poggio and Fischer (1977) described these cells as falling into 3 main groups: “tuned excitatory” or “tuned inhib- itory,” “near,” and “far”; the cells we studied in area 18 fell into the same 3 categories, and will be described below. The reported incidence of disparity tuning in cortical cells has ranged widely, from a small minority in a study of area 17 by Hubel and Wiesel(l970) to 84% in Poggio and Fischer’s (1977) study. A tendency for disparity-tuned cells, as well as for their subtypes, to occur in groups in the cortex was seen by Hubel and Wiesel (1970) in the macaque, and by Clarke et al. (1976) in the sheep.
General characteristics of stereotuned cells. Many of the cells we saw in area 18, like many in 17, showed no striking binocular

3366 Hubel and Livingstone * Segregation of Form, Color, and Stereopsis in Primate Area 18
Figure 5. Response histograms and disparity-tuning curves from a cell recorded from a thick stripe in area 18 of a squirrel monkey (depth 3.0 in Fig. 21). The cell was one of a long sequence of disparity-tuned cells, and one of 11 cells tuned to zero disparity. The tuning curve in the center shows the firing rates during leftward movement of a + 15” oriented slit across the superimposed receptive fields of the 2 eyes; the relative horizontal positions of the eyes are represented on the abscissa. The responses to each eye alone are shown to the left and right (L and R) of the graph. Average response histograms for 10 stimuli at various disparities are shown above and to the sides (time in seconds). The lower graph is for rightward movement, and shows that the 2 directions of movement were about equally effective. The expanse of receptive field over which the cell was responsive was 1.25”, an area equivalent to all of the synergistic part of the curves and most of the inhibitory dip to either side.
synergism, even though virtually all of them received roughly equal inputs from the 2 eyes (ocular dominance groups 3-5). We did not consider these cells to be disparity-tuned if, when the 2 eyes were stimulated together, the response was not crit- ically dependent on the prism setting, even if it was greater than the response to separate eyes. For these cells, the disparity- tuning curve had a breadth comparable to the receptive-field width and a peak that was not much greater than the response to separate eyes. (A cell from area 17 that we would not consider to be disparity-tuned is shown in Fig. 4.)
The cells that we did classify as disparity-tuned showed much stronger responses when the eyes were stimulated together, and were very selective for the disparity between the 2 eyes. All the cells that were disparity-tuned were also orientation-selective, complex, and strongly preferred moving over stationary stimuli. The disparity-tuned cells we saw, like those described by Poggio and Fischer (1977), fell into 3 well-defined categories: “tuned excitatory” (or, rarely, “tuned inhibitory”), “near,” and “far.” A tuned excitatory cell responds best, and often only, over a
narrow range of disparity centered at or near zero disparity. A near cell gives synergistic responses over a relatively broad range of uncrossed disparities (which would correspond to objects nearer than the fixation plane), and little or no response to crossed disparities, with a sharp transition at zero disparity. A far cell is similarly tuned to respond only to stimuli at distances farther than the distance for which the eyes are aligned (i.e., inward horizontal retinal displacement). Tuned inhibitory cells show a sharp decline in response at zero disparity, and the tuning curve often shows small regions of synergism to either side of zero disparity.
Most of the disparity-tuned cells we saw in area 18 failed to respond to stimulation of either eye alone, or gave responses that were much weaker than the responses to the 2 eyes stim- ulated together in optimal alignment.
Tuned excitatory cells. Figures 5 and 6 show recordings from cells whose responses showed a sharp maximum at zero dis- parity. The cell in Figure 5 was recorded from a squirrel monkey. It came near the beginning of a long sequence of disparity-tuned

The Journal of Neuroscience, November 1987, 7(11) 33.97
cells, and in the midst of a run of 11 cells tuned to zero disparity (Fig. 21, depth 3.0 mm). It responded equally well to both directions of movement of a slit oriented 15” clockwise from vertical and had a disparity-tuning curve whose half-width at half-height was 15-20 arc min, a distance far smaller than the width of the receptive field (the distance over which a moving slit evoked a response), which for this cell was 1.25”. Even the value 20 arc min does not quite convey the precision with which the prism had to be adjusted for maximum response, since variations of 6 min to either side of optimum produced a sharp, obviously audible decline in response. Stimulating separate eyes in this cell evoked only feeble responses, indicated as “L” and “R” in Figure 5.
The cell in Figure 6 was recorded from the squirrel monkey experiment of Figure 14 at a depth of 0.2 mm, and was one in a sequence of tuned excitatory cells. The width of the disparity optimum was again much less than the field width, which was about 1”. The cell gave no response to stimulation of either eye separately, and responses to the 2 eyes together were strongly directional, with leftward movement preferred.
A third example of a zero-tuned cell is shown in Figure 7~. This cell, from a macaque, corresponds to the unit at depth 6.6 in Figure 19. It was recorded in an uninterrupted run of 19 disparity-tuned cells.
In view of the results of Poggio and Fischer (1977) and Hubel and Wiesel (1970) we were surprised at our failure to find, in area 18, a population of tuned excitatory cells with clear narrow peaks at nonzero disparities (Hubel and Wiesel, 1970). But whenever our curves appeared to peak slightly to one or the other side of zero disparity, careful checking with the reference cell in area 17 showed that the eyes had shifted just enough to account for the deviation. Disparities of less than about 10 arc min would nevertheless be hard to detect by these techniques.
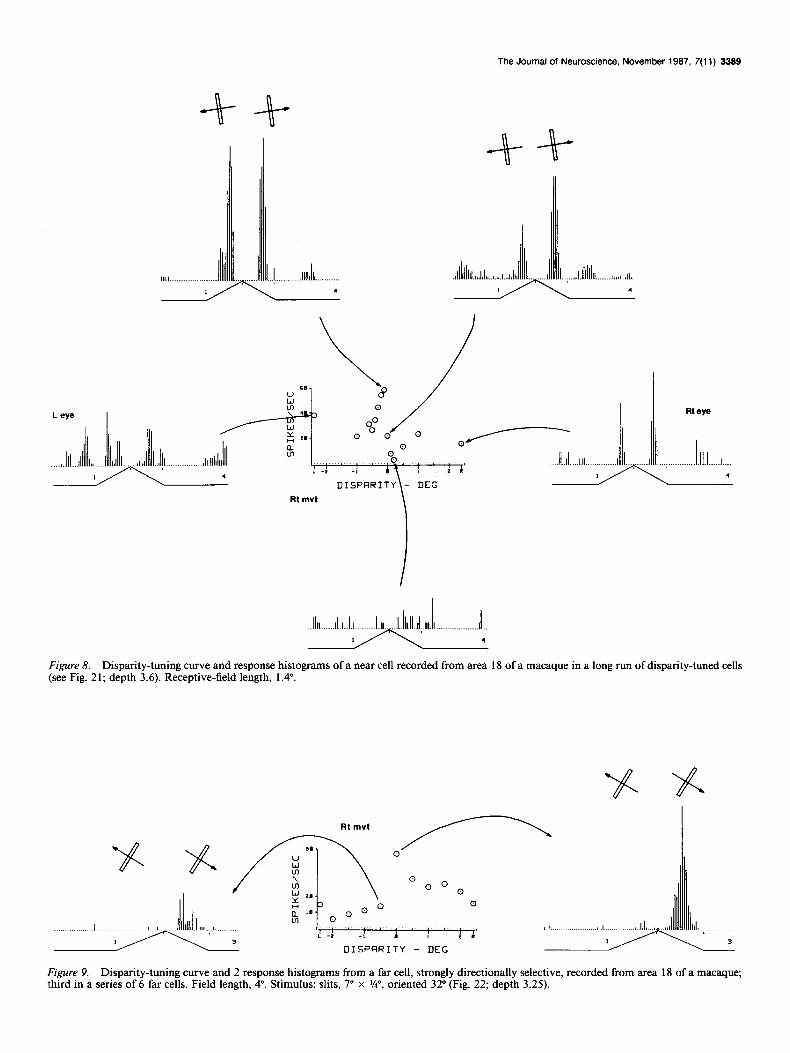
Near andfar cells. Responses from 3 near cells are illustrated in Figure 7, b, c and Figure 8. Far cells are illustrated in Figure 7d and Figure 9. The designation of the cell in Figure 9 as a far cell is perhaps debatable because of the sharp peak near zero- it could have been classed as a tuned excitatory cell-but we were impressed by the asymmetry in the responses to the left and right of zero. All 5 of these cells were recorded from ma- caques.
Tuned inhibitory cells. The few tuned inhibitory cells we saw gave disparity-tuning curves with a deep inhibitory trough at or near zero disparity, to either side of which the responses exceeded the responses to single eyes.
End-stopped cells End-stopped cells were first described in areas 18 and 19 in the cat and were termed “hypercomplex” (Hubel and Wiesel, 1965); they were subsequently shown to be present in area 17 of both cat and macaque monkey (Hubel and Wiesel, 1965,1968). These cells, now usually termed “complex end-stopped,” are in all respects like complex cells, except that they respond to short but not to long lines. The portion of the receptive field over which a cell can be driven is called the “activating region,” and extending the line beyond this region inhibits the response. In- hibition is maximal when the orientation of the line segment sweeping through the inhibitory zone is the same as the optimal orientation for the activating region, so that simply making the optimal line longer produces the maximum inhibition, which is often enough to suppress the response completely. A lesser degree of inhibition is produced if segments of different orien- tation are added to the ends of an optimal line (Hubel and
II 1 ill I ,.1.l.1.1111.11 I J I.1 Ill. Ill I.1 I Il..1 /.I . . .._._. I,, 1
‘;I
4
L mvt
Figure 6. Response histograms and disparity-tuning curves for a cell recorded from a squirrel monkey (Fig. 14, 0.2 mm) in a sequence of tuned excitatory cells. The tuning curve is a plot of responses during leftward movement of a I/g’ x 2” slit, as a function ofdisparity. In contrast to the cell of Figure 5, this cell showed strong directional selectivity. The receptive fields were 1” in length, again large relative to the size of the disparity tuning.
Wiesel, 1965, fig. 9); consequently, long curved lines that, on the average, cover the activating region in the optimal orien- tation, but are too far from the appropriate orientation for the inhibition, are generally effective stimuli, whereas long straight lines are poor stimuli. Stimulating the inhibitory regions by themselves generally produces no change in the spontaneous firing rate-reminiscent of the lack of response to annuli in many center-surround cells.
The original description (Hubel and Wiesel, 1965, 1968) pos-

3388 Hubel and Livingstone * Segregation of Form, Color, and Stereopsis in Primate Area 18
ee 0
ii 0
u-l \
I2 10
Y
I:ln^ill~;~*
0 II 5 0
k 0 . . . . . . . . . . , . ..:.... . . . . . . . . . . . .
L -2 -1 0 I 2 R a
DISPRRITY - DEG b
1 . . . . , . . . . , . . . . , . . . . , . . . . ( . . . . , . . . , . . . . , . . , . , . . . . , -l I I I I I- L -2 -1 d 1 2 R
DISPARITY - DEG
L -2 -1 0 1 2 R
C DISPARITY - DEG d DISPARITY - DEG Figure 7. Disparity-tuning curves from area 18 of a macaque, all from the experiment illustrated in Figure 19, recorded in a single sequence of disparity-tuned cells (Jan. 8, 1985). The stimulus was a slit, x6” x 2”. None of these cells showed directional selectivity. a, Tuned excitatory cell; slit oriented +37” (clockwise from vertical), depth 6.6 mm. b, Near cell; slit oriented 41”, depth 7.5 mm. c, Near cell; slit oriented 46”, depth 7.4 mm. d, Far cell; slit oriented 41”, depth 6.4 mm.
tulated that these cells were a further step in an ascending hi- erarchy from center-surround to simple to complex; but sub- sequent work (Bishop and Henry, 1972; Dreher, 1972; Kato et al., 1978) showed that some simple cells are end-stopped. The relative numbers of simple end-stopped and complex end- stopped cells have varied in different studies, perhaps because of differences in defining simple cells. The proportion of cells that are end-stopped in area 17 of the macaque was originally assessed as about 20% (Hubel and Wiesel, 1968), but only cells with marked degrees of end-stopping were included. Several authors have since emphasized that all degrees of end-stopping can be found in the monkey (Schiller et al., 1976) and in the cat (Rose, 1977). End-stopped cells tend to show broader ori- entation tuning than cells without end-stopping (Rose, 1977), but we think it is unlikely that an end-stopped cell would be confused with the unoriented cells described above, since end- stopped cells do show some orientation preference and do not have a concentric center-surround organization.
We judged a cell to be end-stopped if long lines (slits, edges, or dark bars) gave responses that were strongly reduced com- pared to the responses to lines of optimal length. By “strongly reduced” we mean no response at all, or a few spikes only, in contrast to barrages of impulses to the optimal stimulus. It was our impression that in area 18, in contrast to area 17, cells were either end-stopped or not; intermediate grades were either not present or the end-stopping was so slight as to be missed without quantitative methods.
Figures 10 and 11 show 2 examples of what we mean by “complete” and “nearly complete” end-stopping. Both cells happened to be highly directional in their responses. We saw such marked directional selectivity in only about 10% of the end-stopped cells.
Table 2 sums up the properties of all the orientation-tuned cells we encountered and indicates the degree of overlap among the categories. We can see that:
(1) In macaques, near, far, and tuned excitatory cells are all common; tuned excitatory cells are about as common as near cells and far cells combined, and near cells and far cells occur in about equal numbers (in agreement with Poggio and Fischer, 1977). In squirrel monkeys, tuned excitatory cells are by far the most common type, though the other 2 types do occur.
(2) Cells with marked direction selectivity are not rare, but probably make up less than 10% of the population of dispat-ity- tuned cells. Similarly, less than 10% of all end-stopped cells and less than 10% of all ordinary oriented complex cells show di- rection selectivity.
(3) In both macaques and squirrel monkeys about 5% of the disparity-tuned cells are also end-stopped.
Ocular dominance of the d$Gerent cell types In Figure 12 we compare ocular dominance distributions of oriented and unoriented cells in areas 17 and 18 in macaques and squirrel monkeys. For area 17, we have excluded cells in layer 4C, since, as far as we know, they are all strictly monocular
The Journal of Neuroscience, November 1987, 7(11) 3389
Figure 8. Disparity-tuning curve and response histograms of a near cell recorded from area 18 of a macaque in a long run of disparity-tuned cells (see Fig. 2 1; depth 3.6). Receptive-field length, 1.4”.
Figure 9. Disparity-tuning curve and 2 response histograms from a far cell, strongly directionally selective, recorded from area 18 of a macaque; third in a series of 6 far cells. Field length, 4”. Stimulus: slits, io x W, oriented 32” (Fig. 22; depth 3.25).

3390 Hubel and Livingstone - Segregation of Form, Color, and Stereopsis in Primate Area 18
r 00
y ,._._ I . I..; i..........“..“................. I . . . . . . . . . . . . . . . . . . . . . . . . . . . . . . . . . . . . . . . . .
1 6
LENGTH - DEGREES
Figure 10. Length-tuning curve and average-response histograms of a completely end-stopped cell in area 18 of a macaque monkey, recorded in the midst of a sequence of other end-stopped cells (Fig. 23; depth 4.6 mm). Orientation -22”; length of receptive field, 1.5”; slight directional selectivity.
(groups 1 and 7). From the histograms one can see the following: 1. Binocular cells (groups 3,4, and 5) were far more abundant
in 18 than in 17. This was so for oriented cells and unoriented cells, and for squirrel monkeys and macaques. For macaques, it is not surprising that the inputs from the 2 eyes are more evenly balanced in the unoriented cells in area 18 than in the unoriented (blob) cells of area 17, since in 17 blobs are centered along ocular dominance columns and are generally strongly (though not completely) monocular; but any small region in a thin stripe in 18 receives input from a cluster of blobs, which would cover more than one dominance column (Livingstone and Hubel, 1984). This difference in degree of binocular con- vergence between 17 and 18 is less marked for squirrel monkeys, because their area 17 blobs are already quite binocular.
2. In macaque area 17, oriented (non-blob) cells showed more binocular convergence than nonoriented (blob) cells, presum- ably because the blobs are centered on ocular dominance col- umns. This was not so in squirrel monkeys, or in area 18 of either species.
3. Both oriented and unoriented cells in area 17 are more binocular in the squirrel monkey than in the macaque. In area 18 of both species, almost none of the cells showed much eye preference. In squirrel monkeys, as compared to the macaque, a less clean segregation of inputs from the 2 eyes can be seen
as early as in the lateral geniculate body, where the 4 dorsal layers can hardly be distinguished by a Nissl stain and show considerable intermingling when they are visualized by axonal- transport methods after eye injection (I&as et al., 1978, figs. 9,10). In the squirrel monkey cortex, ocular dominance columns are probably present, to judge from periodic fluctuations in eye preference in tangential penetrations (Hubel and Wiesel, 1978), but they are certainly far less crisply defined, and have not so far been revealed by any anatomical method, such as eye closure, Nauta degeneration, axon transport, or deoxyglucose (see T&es et al., 1984, for references).
Any discussion of ocular dominance in unoriented cells of area 18 must necessarily exclude the many disparity-tuned cells that cannot be driven from separate eyes, since for these no comparison of the 2 eyes can be made.
On the distinctness of the various cell categories The 4 particular constellations of physiological properties we settled on in defining cell types, namely, unoriented, oriented complex, end-stopped, and disparity-tuned, resulted in a re- markably discrete categorization of individual cells with almost no overlap. The main exception was that about 510% of dis- parity-tuned cells were also end-stopped. (As we point out in Part 2, these end-stopped disparity-tuned cells were scattered
The Journal of Neuroscience, November 1997, 7(11) 3391
L mvt LENGTH - DEGREES
, 111 It III I I .,. ,111. I I Ill1 .I;;..! I II I I _11._111 Ill1 II I I I I III II _.l.._ll...lill.l.ll.l. III
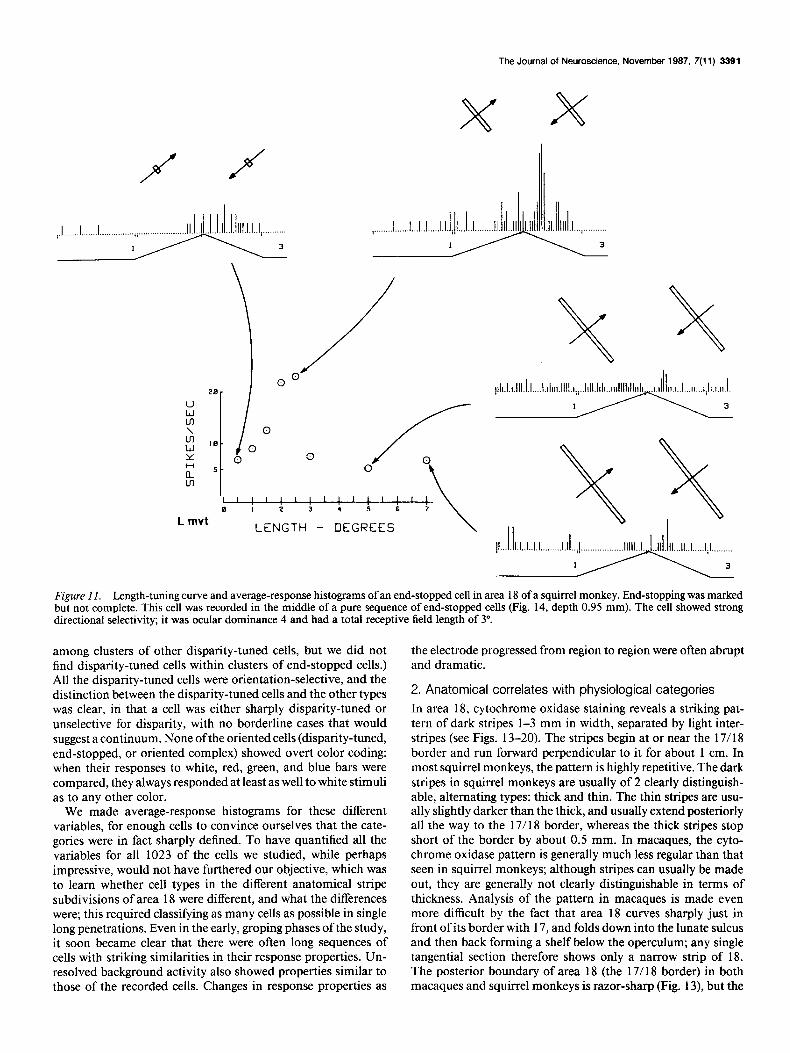
Figure Il. Length-tuning curve and average-response histograms of an end-stopped cell in area 18 of a squirrel monkey. End-stopping was marked hut not complete. This cell was recorded in the middle of a pure sequence of end-stopped cells (Fig. 14, depth 0.95 mm). The cell showed strong directional selectivity; it was ocular dominance 4 and had a total receptive field length of 3”.
among clusters of other disparity-tuned cells, but we did not find disparity-tuned cells within clusters of end-stopped cells.) All the disparity-tuned cells were orientation-selective, and the distinction between the disparity-tuned cells and the other types was clear, in that a cell was either sharply disparity-tuned or unselective for disparity, with no borderline cases that would suggest a continuum. None of the oriented cells (disparity-tuned, end-stopped, or oriented complex) showed overt color coding: when their responses to white, red, green, and blue bars were compared, they always responded at least as well to white stimuli as to any other color.
We made average-response histograms for these different variables, for enough cells to convince ourselves that the cate- gories were in fact sharply defined. To have quantified all the variables for all 1023 of the cells we studied, while perhaps impressive, would not have furthered our objective, which was to learn whether cell types in the different anatomical stripe subdivisions of area 18 were different, and what the differences were; this required classifying as many cells as possible in single long penetrations. Even in the early, groping phases of the study, it soon became clear that there were often long sequences of cells with striking similarities in their response properties. Un- resolved background activity also showed properties similar to those of the recorded cells. Changes in response properties as
the electrode progressed from region to region were often abrupt and dramatic.
2. Anatomical correlates with physiological categories In area 18, cytochrome oxidase staining reveals a striking pat- tern of dark stripes l-3 mm in width, separated by light inter- stripes (see Figs. 13-20). The stripes begin at or near the 17/18 border and run forward perpendicular to it for about 1 cm. In most squirrel monkeys, the pattern is highly repetitive. The dark stripes in squirrel monkeys are usually of 2 clearly distinguish- able, alternating types: thick and thin. The thin stripes are usu- ally slightly darker than the thick, and usually extend posteriorly all the way to the 17/l 8 border, whereas the thick stripes stop short of the border by about 0.5 mm. In macaques, the cyto- chrome oxidase pattern is generally much less regular than that seen in squirrel monkeys; although stripes can usually be made out, they are generally not clearly distinguishable in terms of thickness. Analysis of the pattern in macaques is made even more difficult by the fact that area 18 curves sharply just in front of its border with 17, and folds down into the lunate sulcus and then back forming a shelf below the operculum; any single tangential section therefore shows only a narrow strip of 18. The posterior boundary of area 18 (the 17/l 8 border) in both macaques and squirrel monkeys is razor-sharp (Fig. 13), but the

MAC
AQU
E
3Fm
3-
22s.
150.
7s.
ORI
ENTE
D AR
EA
17
N-lS
23
x30
1
~ 1
2 3
4 s
6 7
SQU
IRR
EL
MO
NKE
Y
6Bl N
-151
OCUL
RR
DOM
INRN
CE
AREA
18
N-34
6
-IL&-
12
3456
7
N-25
0 -IL-
I 2
3 4
S 6
7
JBE-
22s.
158.
7s.
UNO
RIEN
TED
FIR
ER
17
N-70
1 12
0-
Islztu
d
90.
68.
30.
1 2
3 4
S 6
7
FIR
ER
18
N-13
9 II_
I 2
3 4
S 6
7
28
1 N-
45
58
1 N-
57
15
18 sa41
L 1
2 3
4 S
6 7
Figu
re
12.
Ocu
lar
dom
inan
ce
dist
ribut
ion
of 3
212
cells
, 24
20
in a
rea
17 a
nd 7
92 i
n ar
ea 1
8, i
n m
acaq
ue
(270
9)
and
squi
rrel
mon
keys
(5
03),
orie
nted
(2
270)
an
d no
norie
nted
(9
42).
Note
: (1
) re
lativ
e pr
eval
ence
of
bin
ocul
ar
cells
, es
pecia
lly
grou
p 4,
in
squi
rrel
mon
keys
(in
con
trast
to
mac
aque
s);
in
18 (
as o
ppos
ed
to
17),
and
amon
g or
ient
ed
(as
oppo
sed
to u
norie
nted
) ce
lls i
n 17
, in
mac
aque
s;
(2)
size
of
sam
ple.

The Journal of Neuroscience, November 1997, 7(11) 3393
J
t

3394 Hubel and Liwngstone - Segregation of Form, Color, and Stereopsis in Primate Area 18
Fig-are 14. Reconstruction of a penetration through area 18 in the right hemisphere of a squirrel monkey. In this figure, and in Figures 15-20, we plot receptive-field orientation in degrees against electrode penetration distance. We have also marked the occurrence of unoriented cells with triangles in the top line; open triangles stand for color-opponent cells, mostly double-opponent, andjllled triangles represent broadband cells. The largejilled triangles below the distance axis indicate lesions. In the orientation plot, 0 stands for vertical, positive angles are clockwise from this, negative counterclockwise; end-stopped cells are indicated by open squares, ordinary complex cells by smallfilled squares, and cells sharply tuned for disparity by jilled rectangles intersected by vertical lines; lines at the left and right of the rectangles represent near and far cells, and centered lznes, tuned excitatory cells. We show a section stained for cytochrome oxidase, with the position of the penetration, which went through area 18 roughly from anterior to posterior in the direction of the large arrow. The 2 white round areas are white matter. The 3 small arrows show the positions of the 3 lesions, and part of the penetration itself can be seen at the end of the middle arrow. The first part of the track passed through the thick stripe just above the upper arrow, and then through a pale stripe and a thin stripe. The physiology shows that the electrode first passed

Table 2. Properties of oriented cells (total of 899 cells)
Disparity-tuned cells End- stopped
Directional and Total and dis- disparity- disparity- parity- tuned tuned tuned
Macaque Near 29 0 2 Far 36 9 2 Tuned excitatory 50 0 3
Total 115 Squirrel
Near 7 1 0 Far 18 0 0 Tuned excitatory 239 6 9
Total 264 Total disparity-tuned 379
End-stopped cells Dis- parity- tuned
Directional and Total end- and end- end- stopped stopped stopped
Macaque 80 9 7 Squirrel 91 7 9 Total end-stopped 171
Oriented complex cells (excluding end-stopped and disparity-tuned)
Total complex Directional
Macaque 199 12 Squirrel 166 7 Total complex 365
The Journal of Neuroscience, November 1987, 7(1!) 3395
Table 3. Figure 14 (December 19, 1984$ squirrel monkey
Depth (mm)
O-O.76
Physiology
Stereo
Histology
Dark stripe (probably thick)
0.75-l.lb End-stopped Pale stripe 1.15-2.2* Unoriented (color-coded Dark stripe (probably
and achromatic) thin)
y We identify experiments by date, which also distinguishes early from late experiments in the series. b Lesion.
anterior boundary is less clear. In the squirrel monkey the stripes stop about 5 mm anterior to the 17/18 border, roughly where anatomic studies of connectivity have placed the anterior border of area 18 (Spatz et al., 1970) and where recordings have shown the visual-field horizontal meridian to be represented (Cowey, 1964; Allman and Kaas, 197 1, 1974). Injections of horseradish peroxidase into area 18 near the 17/ 18 border result in transport not only back to area 17 but also ahead, to an area just in front of the termination of the stripes, presumably beyond area 18 (Livingstone and Hubel, 1984, fig. 30). This supports the con- tention that the entire extent of area 18 is characterized by the presence of these stripes, and that the anterior border can be defined by their anterior extent (Tootell et al., 1983).l
I We use the terms “area 18” and “visual area 2” synonymously. Area 18, as originally described in the macaque by Brodman (1909) was thought, on the basis of cytoarchitectonic criteria, to extend much farther forward-into the lunate sulcus and up its anterior bank-but physiological recording, the topography of callosal connections and of connections to area 17, and the cytochrome oxidase stain place the anterior border of 18 in the macaque only about 10 mm anterior to the 17/ 18 border (Cragg and Ainsworth, 1969; Zeki, 1969; Zeki and Sandeman, 1976; Van Essen et al., 1982; Tootell et al., 1983; Weller and Kaas, 1983; Van Essen et al., 1986). We therefore need either to redefine area 18 or to abandon the term. We have chosen the first alternative, partly because of our confusion between VI and 6, and VII and 7.
m 60 -- Near
4 30 .- STEREO Zero Far f 0 -- End Stopped 0
’ -30 .. + COLOR Chrom
I V
El-Hh V
LESION
5 -60 A ..
90 -- +++ +**++++=4
0 H .O
k 60 .. .
5 30 .- 0 W 0 .- 0 l-4 0 Fi -30 --
-60 -*
90 ‘Q A. !A. A2 2 4
PENETRATION DISTflNCE - mm Figure 14. Continued. ME-42 DEC 19 04 l-3.25 SQR 19
through a region rich in disparity-tuned cells, then through one rich in end-stopped cells, and finally through a region containing mainly unoriented cells. See also text and Table 3.

3396 Hubel and Livingstone l Segregation of Form, Color, and Stereopsis in Primate Area 18
Figure 15. Squirrel monkey. Reconstruction of an electrode track, which from the histology proved to be mainly in area 17. The penetration began in 18, however, passing through a clear thin stripe. In this portion we recorded a pure sequence of 5 complex unoriented broadband cells. Following this was a sequence of cells with sharp orientation tuning, typical of layers 2 and 3 of area 17. Then came a sequence of simple mixed with complex cells, we think in layer 4B, followed by unoriented, mainly red-sensitive cells in 4C. The fourth lesion, at 2.25 mm, marked the resumption of orientation specificity in layer 5. Between the 4th and 5th lesions in layer 5, a sequence of 4 unoriented cells occurred just beneath a blob in layers 2 and 3; this can be seen on the cytochrome oxidase section midway between the corresponding arrowtips. In this passage through area 17, most of the cells were driven by both eyes in ocular dominance group 4, with a few in groups 3 and 5, except for the part of the penetration in layer 4C; here a sequence of group 1 cells was followed by 2 group 6 cells. This supports the contention that ocular dominance segregation does exist in squirrel monkeys (see Hubel and Wiesel, 1978). See also Table 4.
In Part 1 we described a categorization of cells in area 18 into containing (1) unoriented cells, (2) disparity-tuned and oriented 4 groups: unoriented, oriented complex, disparity-tuned, and complex cells, and (3) end-stopped and oriented complex cells. end-stopped. The categorization could be made rapidly using For convenience, we refer to these 3 subdivisions as “unori- the stimulus methods we have described, without the necessity ented,” “ disparity-tuned,” and “end-stopped.” These 3 types for signal-averaging all the responses of every cell. We ended of clusters correlated with the 3 types of stripes revealed by up distinguishing these 4 categories of cells, and in our pene- cytochrome oxidase staining. trations through area 18 found them in 3 types of groupings, We begin by showing reconstructions of 11 experiments, 8

The Journal of Neuroscience, November 1987, 7(11) 3397
90 -
60 -- 30 .- 0 --
-30 -_ -60 --
90 .- 60 -- 30 .- 0 -.
-30 -- -60 --
. . . -
‘4 -.
. q Near
I . . STEREO Zaro Far f
I ‘.
End Stopped . . COLOR IChrom t
. I
-‘4 ..- . LESION’B’-Wh ;
I . -.
90 -- I .
60 y .
30 ’ 4
+. 0
-30 -60
90 60 /
. .
30 ‘4’, 0 c . . .
.
-30 -60
1/ .
30 :.: ~ i : .: :. : i ‘.’ : : ir- : A : 4
PENETRATION DISTANCE - mm U2-33 SEP 19 84 l-3.8 SQR 18
Figure 15. Continued.
with both physiology and histology (5 squirrel monkeys and 3 oxidase stain. From the experiments illustrated and 21 others macaques), followed by 3 without histology (one squirrel mon- (a total of 37 penetrations), we conclude that the end-stopped key and 2 macaques). We illustrate so many experiments in domains correspond to the pale stripes, and the disparity-tuned order to convey an impression of their regularity as well as their and unoriented domains to cytochrome-dark stripes. We further variability, and also the kinds of exceptions we encountered and conclude from the experiments in squirrel monkeys, in which how often we encountered them. Any one experiment can hardly a distinction can usually be made between thick and thin stripes, be expected to be conclusive, given the technical problems of that the thick stripes correspond to the disparity-tuned domains track reconstruction, as well as the vagaries of the cytochrome and the thin stripes to the unoriented domains. We describe the
Table 4. Figure 15 (September 19, 1984), squirrel monkey
Depth (mm) Physiology Histology
0-0.3a Unoriented Area 18, thin stripe 0.3~2.0 Mainly oriented complex Area 17, layer 2/3, nonblob 2.O-2.k Unoriented, color-coded Area 17, layer 4C 2.3-2.6 Oriented complex Area 17, layer 5 2.6-2.8 Unoriented Area 17, layer 5 under blob
2.8~3& Oriented complex, a few disparity-tuned Area 17, layers 5, 6 We show this penetration mainly for the correlation between an unequivocal thin stripe and a sequence of unoriented cells in 18 at the beginning of the penetration. All the rest of the penetration was in area 17. For the part in 17, the most interesting feature was the lack of orientation selectivity in a clump of cells between 2.6 and 2.8 mm; these unoriented cells were in layer 5, and when serial sections were overlaid so as to align the radial blood vessels, the cells turned out to have been directly under a blob in layers 2 and 3. We have previously seen similar occurrences of unoriented cells in layers 5 and 6 directly beneath a histologically defined blob in layers 2 and 3 (see Livingstone and Hubel, 1984, p. 334). In cytochrome oxidase-stained sections, darker patches can usually be seen, though very faintly, in layers 5 and 6, and the pattern is in register with the darker blobs in layers 2 and 3, suggesting that the blob system extends into the deeper layers. It is thus not surprising that cells in layers 5 and 6 lying directly below blobs share some physiological properties with blob cells. m Lesion.
3399 Hubel and Livingstone - Segregation of Form, Color, and Steraopsis in Primate Area 18
3
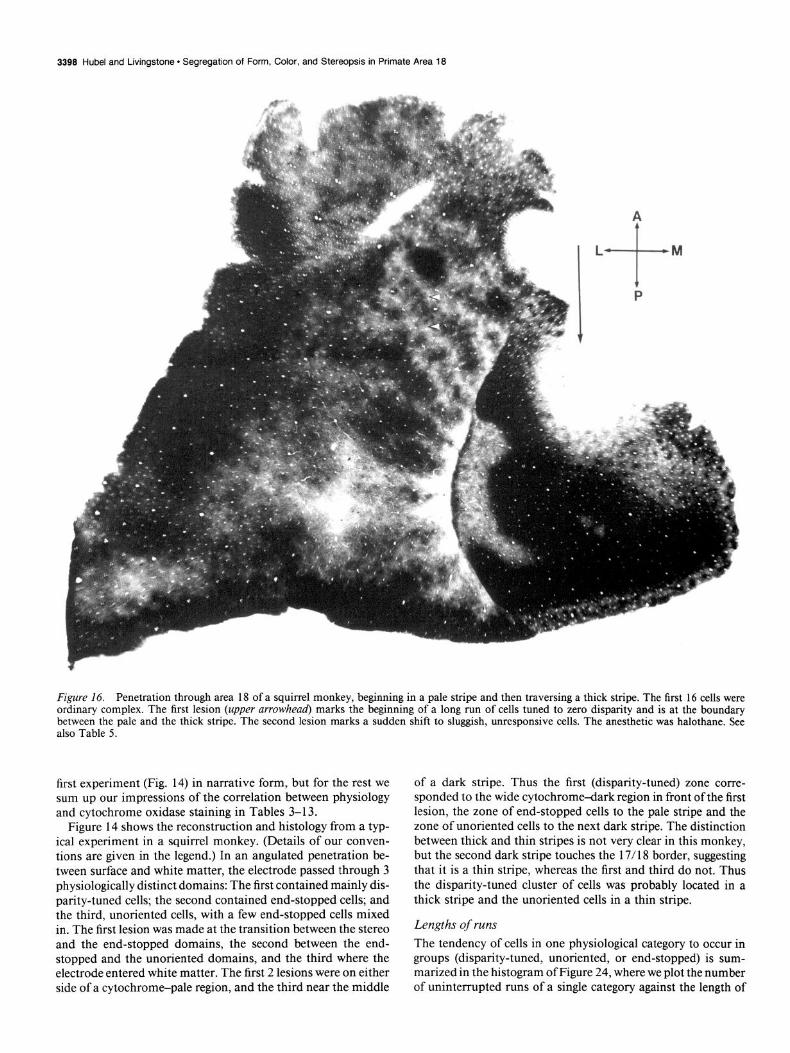
Figure 16. Penetration through area 18 of a squirrel monkey, beginning in a pale stripe and then traversing a thick stripe. The first 16 cells were ordinary complex. The first lesion (upper arrowhead) marks the beginning of a long run of cells tuned to zero disparity and is at the boundary between the pale and the thick stripe. The second lesion marks a sudden shift to sluggish, unresponsive cells. The anesthetic was halothane. See also Table 5.
first experiment (Fig. 14) in narrative form, but for the rest we sum up our impressions of the correlation between physiology and cytochrome oxidase staining in Tables 3-l 3.
Figure 14 shows the reconstruction and histology from a typ- ical experiment in a squirrel monkey. (Details of our conven- tions are given in the legend.) In an angulated penetration be- tween surface and white matter, the electrode passed through 3 physiologically distinct domains: The first contained mainly dis- parity-tuned cells; the second contained end-stopped cells; and the third, unoriented cells, with a few end-stopped cells mixed in. The first lesion was made at the transition between the stereo and the end-stopped domains, the second between the end- stopped and the unoriented domains, and the third where the electrode entered white matter. The first 2 lesions were on either side of a cytochrome-pale region, and the third near the middle
of a dark stripe. Thus the first (disparity-tuned) zone corre- sponded to the wide cytochrome-dark region in front of the first lesion, the zone of end-stopped cells to the pale stripe and the zone of unoriented cells to the next dark stripe. The distinction between thick and thin stripes is not very clear in this monkey, but the second dark stripe touches the 17/l 8 border, suggesting that it is a thin stripe, whereas the first and third do not. Thus the disparity-tuned cluster of cells was probably located in a thick stripe and the unoriented cells in a thin stripe.
Lengths of runs
The tendency of cells in one physiological category to occur in groups (disparity-tuned, unoriented, or end-stopped) is sum- marized in the histogram of Figure 24, where we plot the number of uninterrupted runs of a single category against the length of

The Journal of Neuroscience, November 1987, 7(11) 3399
COL
-60
90
60
30
0 1 -30
-60
90
60
30 i
++++*++ ,++.I-
.*+I+++++
. +- Near
. STEREO Zero f
.-. . Far 4 . End Stopped q
. COLOR Chrom V
..- I El-Wh V . ..- LESION A
.
PENETRRTION DISTflNCE - mm
Figure 16. Continued.
each run separately for the 3 cell categories. The prevalence of runs one or 2 cells in length is due in part to the fact that oriented complex cells were often peppered among groups of disparity- tuned or end-stopped cells, and we did not assign them to either category. Nevertheless, many runs were long, especially dispar- ity-tuned, for which we saw 13 sequences of more than 8 cells.
Sequences of orientation shifts In Figures 14-23 the preferred orientations of successively re- corded cells sometimes shifted regularly and by small amounts, clockwise or counterclockwise, giving very regular plots of ori- entation versus track distance. Such regularity in orientation sequences is often seen in area 17 (see, for example, Fig. 15). In area 18, however, large portions of some penetrations were strikingly less regular in their orientation progressions. In these places the orientation shifts were by no means random; rather, the orientation would often remain within 30” of one value, changing this way and that, but not getting anywhere and then, after a traverse of about 1 mm, would suddenly shift to a new average value and linger there. Such regions occurred in most penetrations and may be seen in Figures 17 (first part), 18-20, 22, and 23. Most of our penetrations were parallel to the 17/18 border, and it is possible that iso-orientation lines in area 18 run in that direction. It also is possible that the speckled patterns of deoxyglucose uptake in area 18, produced by stimulation with stripes of a single orientation (R. B. H. Tootell, personal com- munication), represent these zones of a single-orientation pref- erence.
Discussion Summary of results; comparisons with other studies The objective of this study was to obtain an idea of the phys- iological cell types in area 18 of the monkey, and to correlate their locations with the 3 types of stripes revealed by cytochrome oxidase staining. The work is thus an extension of our recent study of the physiological differences between blob and non- blob cells in area 17 (Livingstone and Hubel, 1984), and is based on a working principle that where one finds anatomical differ- ences, it makes sense to look for physiological differences.
t12 50 JUL 16 04 3- SOR 16
To sum up our results: Despite the wide spectrum of response properties, which might imply that any system of cell classifi- cation would be arbitrary, we could distinguish 4 categories of cells, each defined by a constellation of receptive-field attributes and stimulus requirements. There was a striking tendency for cells of a given class to be grouped together and for these groups to be correlated with the cytochrome oxidase staining pattern. We term the 4 classes unoriented, disparity-tuned, end-stopped, and oriented complex. It was our impression that most of the cells we studied (a total of 1023 cells) could be assigned un- ambiguously to one of these 4 categories. Cells in each of the first 3 categories tended to be grouped, and oriented complex cells were distributed between groups of either end-stopped or disparity-tuned cells. The association of oriented complex cells with 2 distinctly different types of cells suggests that there may be 2 types of oriented complex cells, although we saw no obvious differences. It could be either that these complex cells are pre- cursors to the disparity-tuned or end-stopped cells or that the information they carry is somehow complementary to the in- formation carried by these more specific cell types.
Correlation of physiological recordings with reconstructions of electrode tracks stained for cytochrome oxidase showed that, with occasional exceptions, in squirrel monkeys, the pale stripes contained end-stopped cells and oriented complex cells, the thin
Table 5. Figure 16 (July 16, 1984), squirrel monkey
Depth (mm) Physiology Histolonv
O-1.19 1.20-2.3
2.35-2.4
Oriented complex Mainly cells sharply tuned to
0 disparity Two sluggish cells that we
could not drive, and one doubtful disparity-tuned cell
Pale stripe Thick stripe
Pale stripe
This experiment was done when we were still anesthetizing the animals with halothane, to which end-stopped cells seem particularly susceptible.

3400 Hubel and Livingstone - Segregation of Form, Color, and Stereopsis in Primate Area 18
Figure 17. Two penetrations through area 18 of a squirrel monkey. The lesions made during the first penetration (I) are indicated by the 3 small arrows. The penetration entered the cortex above the first arrow, in a pale stripe, where one end-stopped cell was seen among several oriented complex cells; it then entered a thick stripe, where we encountered a run of disparity-tuned cells peaking at zero disparity, at the end of which we made the first lesion. A series of end-stopped cells coincided with the pale stripe just below this lesion. Then came 4 zero-tuned cells, a run of broadband nonoriented cells associated with a thin stripe, and an end-stopped cell and 2 complex cells. Here we made the second lesion, just after a pale stripe. Then came a long sequence of disparity-tuned cells, coinciding with another thick stripe. The final lesion, just before several end- stopped cells, was in a lighter-staining cleft separating 2 dark clumps of a thin stripe. The last few cells were disparity-tuned, possibly correlated with the final thick stripe below the lowest arrow. The second penetration was further from the 17/ 18 border, and began above the upper arrow in a thick stripe associated with disparity-tuned cells. Pale stripe, thin stripe, pale stripe, and thick stripe were correlated with end-stopped, unoriented, end-stopped, and disparity-tuned sequences. A final few end-stopped cells could not be correlated with histology because of tissue injury. See Tables 6 and 7.
stripes contained unoriented cells, and the thick stripes dispar- The area 17 inputs to these 3 anatomical subdivisions have ity-tuned plus oriented complex cells. In the macaque, the pale recently been traced and are remarkably consistent with the stripes similarly contained end-stopped cells and oriented cells; physiological properties of each region: the thin stripes receive we could not distinguish thick from thin stripes, but the dark input from the upper-layer blobs, the thick stripes from layer stripes were physiologically of 2 types, containing either unori- 4B, and the pale stripes from the interblobs. These combined ented cells or disparity-tuned plus oriented complex cells, with anatomical and physiological results imply that stereopsis may the 2 types frequently separated by pale stripes, and alternating. be carried out by the magnocellular branch of the visual path,

The Journal of Neuroscience, November 1987, 7(11) 3401
. .
q
+ w+ +
98..
-68
-38 \ 38 : : : _ i :*~ : : ; : : : : j : : ‘*,: ; ( : : I i : i: : Q; : : i : $
PENETRATION DISTANCE - mm
M2-51 FEB 6 85 l- SQR 16 z
COL v v v .
90
60 T
Nat&r STEREO
I Zero Far f
30 -c End Stopped q
COLOR Chrom 0 -- I
V El-Wh V
-30 .. LESION A
-60 -- n + q q . .
90 .- D
60 -- + + + D q D
30 -. 0 _. 44 4
-30 .-
-60 ..
90 ‘Q I i AT 2 A 3 4
PENETRflTION DISTANCE - mm
Figure 17. Continued. M3-8 FEB 6 85 2-4.1 SQR 16
Near t STEREO Zero
Far ! End Stopped D COLOR Chron
I
V Bl-Wh V
LESION A
Table 6. Figure 17 (February 6, 1985, penetration l), squirrel monkey
Depth (mm) Physiology Histology
o-o.4 0.5-1.b 1.4-2.5 2.6-3.4 3.4-3.6
3.7a-5.1 5.2-(5.4+5.6
5.7-6.1
Oriented complex: hard to drive; one end-stopped cell Disparity-tuned: 0 disparity End-stopped, disparity-tuned: 0 disparity Unoriented: achromatic Two oriented complex cells; one end-stopped cell Disparity-tuned: 0 disparity, one far cell and 2 near cells End-stopped plus oriented complex
Disparity-tuned: 0 disparity
Pale stripe Thick stripe Pale stripe Thin stripe Pale stripe Thick stripe Pale stripe plus pale cleft between 2
darker clumps in a thin stripe Thick stripe
One can see a correlation between unoriented cells and the first thin stripe, between disparity tuning and 2 thick stripes, and between end-stopping (with some zero disparity cells mixed in) and pale stripes. The absence of unoriented cells in the second thin stripe is possibly explained by the electrode’s having passed through a very light region separating 2 of the dark clumps that often make up thin stripes. 0 Lesion.

3402 HUM and Livingstone l Segregation of Form, Color, and Stereopsis in Primate Area 18
Figure 18. Macaque monkey. Mediolateral penetration through area 18, where it forms a shelf below the exposed surface of area 17. The oval region of cortex is a tangential section through the shelf, and more anteriorly 18 is cut transversely. The penetration began in a pale stripe, with mostly oriented complex cells, but also one end-stopped and one disparity-tuned far cell. The first lesion marked the end of this sequence. Next, in the first dark stripe, was a mixture of disparity-tuned and oriented complex cells, with one end-stopped cell. Then a wide dark stripe (containing the second lesion) was associated with a long run of unoriented, mainly achromatic cells. Then a pale stripe was associated with oriented complex plus end-stopped cells; finally a dark stripe was associated with a run of disparity-tuned cells. In this penetration, as with some other macaques, the physiological properties associated with the thicker and thinner dark stripes were the reverse of what was seen in squirrel monkeys. The rather chaotic coalescing and cross-linking between stripes, evident in the anterior (in the figure, upper) part of the shelf, is also not unusual in the macaque. (Table 8.)
Table 7. Figure 17 (February 6, 1985, penetration 2), squirrel monkey
Depth (mm)
O-O.5 0.6-l .4 l.Y-1.8 1.9-2.6
2.7~3.2 3.7-3.9
Physiology
Disparity-tuned: all zero disparity End-stopped Unoriented: 3 double-opponent, one achromatic End-stopped Disparity-tuned: 3 zero disparity, 2 far End-stopped
Histology
Thick stripe Pale stripe Thin stripe Pale stripe Thick stripe Pale stripe (seen better in adjacent
sections; not clear in this section because of tissue injury)
n Lesion.

The Journal of Neuroscience, November 1987, 7(11) 3403
30
e
-38
-60
cn se I
-i 60 T
3s ’ a
-30 z -60 H I z 90..
5 60 w 30.. H 8 El .’
-38 ..
-68
SE
68 f
End Stopped n COLOR Chron
I V
Bl-Wh V LESION A
. . C. + +.” l . .
.
.
. - I -0.. l 0 m
0
.
o. .
.
PENETRATION DISTANCE - mm
Figure 18. Continued. HE-6 RPR 10 04 2-9.5 nfw ie
color perception by the blob subdivision (whose inputs are still unclear), and form perception by the parvocellular-interblob branch. Tests of the psychophysical implications of these results will be described in the following paper (Livingstone and Hubel, 1987b).
Previous work had already indicated that area 18 contained a variety of cell types. The earliest studies, which concentrated mainly on binocular interaction, found cells whose responses were critically dependent on the relative positions of the 2 eyes, and other cells that were not (Hubel and Wiesel, 1970; Baker et al., 1974). Subsequent work greatly expanded the variety of described cell types: Baizer et al. (1977) distinguished 6 groups of cells on the basis of the stimulus parameter most relevant for each. Our results and theirs seem, on the whole, to agree well.
What they called “orientation cells” correspond to our oriented complex cells; their “spot cells” correspond to our broadband complex unoriented cells. Two differences are (1) our failure to find cells that would fit their class of “light inhibited cells,” and (2) the absence in their series of any color-coded “spot cells.” We think it likely that we would have classed their “border cells” and some of their “direction cells” as end-stopped, since, as we have mentioned, the orientation selectivity of some end- stopped cells was weak. Baizer et al. (1977) do not mention any tendency for similar types of cells to be clustered together.
DeYoe and Van Essen (1985) have made a preliminary study of area 18 in the macaque, with similar objectives to ours: correlation of physiology with anatomy (in their case, both cy- tochrome oxidase staining and retrograde labeling from V4 and
Table 8. Figure 18 (April 10, 1984), macaque
Depth (mm) Physiology Histology
4.4-5.1a Oriented complex; one stereo far, one end-stopped Pale 5.1-5.4 Stereo; one end-stopped cell Dark 5.5-6.2 Oriented complex: 2 end-stopped cells Pale 6.3-(6.ga, 7.7+7.9 Unoriented: 9 double-opponent, 3 broadband Dark
8-8.5 Oriented complex with 2 end-stopped cells Mottled, mostly pale 8.60-9.1 Disparity-tuned Dark 9.2-9.4 End-stopped and oriented complex Pale
Note the correlation between pale regions and end-stopping, and between dark stripes and either disparity-tuning or color-coding. I he macaque, unlike the squirrel monkey, shows no consistent difference in thickness between the cytochrome dark stripes associated with color and those associated with stereopsis. a Lesion.
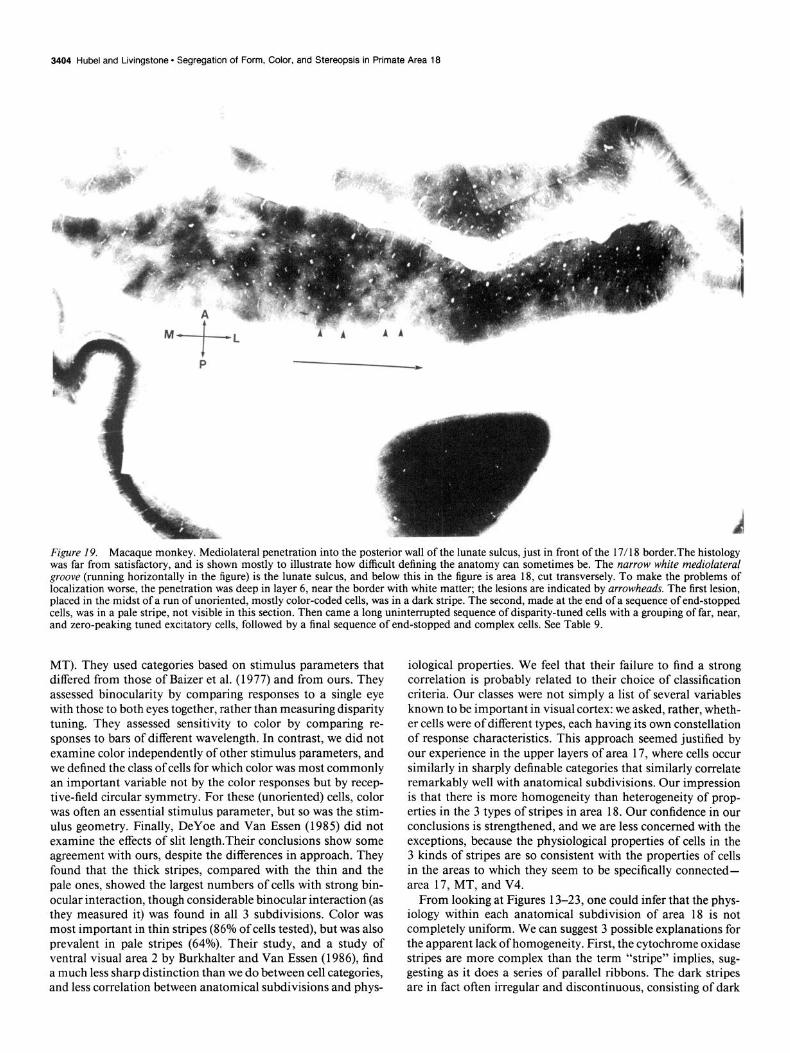
3404 Hubel and Livingstone - Segregation of Form, Color, and Stereopsis in Primate Area 18
Figure 19. Macaque monkey. Mediolateral penetration into the posterior wall of the lunate sulcus, just in front of the 17/ 18 border.The histology was far from satisfactory, and is shown mostly to illustrate how difficult defining the anatomy can sometimes be. The narrow white medioluterul groove (running horizontally in the figure) is the lunate sulcus, and below this in the figure is area 18, cut transversely. To make the problems of localization worse, the penetration was deep in layer 6, near the border with white matter; the lesions are indicated by arrowheads. The first lesion, placed in the midst of a run of unoriented, mostly color-coded cells, was in a dark stripe. The second, made at the end of a sequence of end-stopped cells, was in a pale stripe, not visible in this section. Then came a long uninterrupted sequence of disparity-tuned cells with a grouping of far, near, and zero-peaking tuned excitatory cells, followed by a final sequence of end-stopped and complex cells. See Table 9.
MT). They used categories based on stimulus parameters that differed from those of Baizer et al. (1977) and from ours. They assessed binocularity by comparing responses to a single eye with those to both eyes together, rather than measuring disparity tuning. They assessed sensitivity to color by comparing re- sponses to bars of different wavelength. In contrast, we did not examine color independently of other stimulus parameters, and we defined the class of cells for which color was most commonly an important variable not by the color responses but by recep- tive-field circular symmetry. For these (unoriented) cells, color was often an essential stimulus parameter, but so was the stim- ulus geometry. Finally, DeYoe and Van Essen (1985) did not examine the effects of slit length.Their conclusions show some agreement with ours, despite the differences in approach. They found that the thick stripes, compared with the thin and the pale ones, showed the largest numbers of cells with strong bin- ocular interaction, though considerable binocular interaction (as they measured it) was found in all 3 subdivisions. Color was most important in thin stripes (86% of cells tested), but was also prevalent in pale stripes (64%). Their study, and a study of ventral visual area 2 by Burkhalter and Van Essen (1986) find a much less sharp distinction than we do between cell categories, and less correlation between anatomical subdivisions and phys-
iological properties. We feel that their failure to find a strong correlation is probably related to their choice of classification criteria. Our classes were not simply a list of several variables known to be important in visual cortex: we asked, rather, wheth- er cells were of different types, each having its own constellation of response characteristics. This approach seemed justified by our experience in the upper layers of area 17, where cells occur similarly in sharply definable categories that similarly correlate remarkably well with anatomical subdivisions. Our impression is that there is more homogeneity than heterogeneity of prop- erties in the 3 types of stripes in area 18. Our confidence in our conclusions is strengthened, and we are less concerned with the exceptions, because the physiological properties of cells in the 3 kinds of stripes are so consistent with the properties of cells in the areas to which they seem to be specifically connected- area 17, MT, and V4.
From looking at Figures 13-23, one could infer that the phys- iology within each anatomical subdivision of area 18 is not completely uniform. We can suggest 3 possible explanations for the apparent lack of homogeneity. First, the cytochrome oxidase stripes are more complex than the term “stripe” implies, sug- gesting as it does a series of parallel ribbons. The dark stripes are in fact often irregular and discontinuous, consisting of dark

The Journal of Neuroscience, November 1987, 7(11) 3405
COL fi
0
-30
-60
90
60
30
0
-30
-60
90
60
30
0
-30
-60
90
60
30
0- : : : : ’ : : : : j ; - : : i :A: : :ri : : : : L 1
PENETRATION DISTANCE - mm
.
q m
m 4
“‘Qt+ t4
Orn
t
cc
cc Cc a
I Near STEREO Zero
Far f End Stoppod 0 COLOR Chrom
I V
Bl-Wh V LESION A
. q
.
0
.
. q
D
fl2-46 JAN 6 65 1-9.05 MAC 18 Figure 19. Continued.
clumps separated by narrow isthmuses of paler-staining regions. These interruptions could account for occasional end-stopped cells in runs of disparity-tuned cells, or in runs of unoriented cells. They would not explain inhomogeneities in the pale stripes, but deoxyglucose labeling shows regular periodicities along the lengths of the pale stripes (Tootell et al., 1983). What any of these finer subdivisions signifies is quite unknown. Second, the cause of some of the imperfections in correlation may be tech- nical: cytochrome oxidase stains can be irregular, artifacts in staining can arise from tissue injury, and the stripes in many animals are hard to identify with certainty because of cortical curvature or a less than ideal plane of section. Third, our set of categories may not match the biological realities, or may be incomplete. Finally, the correlation may in fact not be absolute; each stripe may contain such a mixture of cell types that any
system of physiological classification would fail to yield an or- derly pattern, or (perhaps worse) result in something between order and chaos. Of all these possibilities, we find the last the least appealing, not because we feel that biology must always be orderly, but because of the ample precedents for parallels between anatomical and physiological distinctions: layering in the retina, tectum, lateral geniculate body and cortex; various kinds of column and blobs versus non-blob cortex in area 17, and so on.
On the other hand, experience with other parts of the visual path, especially area 17, gives ample warning that area 18 is likely to have many more secrets. The patterns with clumping within the stripes, mentioned above, are an example of some- thing we have no physiological parallel for; the cortical layering is another. In these experiments, we did not look for laminar
Table 9. Figure 19 (January 8, 1985), macaque
Depth (mm) Physiology Histology
4.9-5P
5.6-6~ 6.1-7.9
g-(8.3+8.90
Unoriented: 5 color-opponent, 2 broadband, with one poorly oriented questionable end-stopped cell
End-stopped Long unbroken sequence of disparity-tuned cells: some
subgrouping of near, far, and zero Oriented complex and end-stopped
Dark
Pale Dark/mottled
Pale
Note the correlation between dark bands and either disparity-tuned cells or unoriented cells, and between pale regions and oriented complex/end-stopped regions. (The first pale stripe shows up poorly in this section, but was clear in more superficial ones.) Recordings are all from layer 6, very close to white matter. ” Lesion

3406 Hubel and Livingstone l Segregation of Form, Color, and Stereopsis in Primate Area 16
Figure 20. Macaque. Mediolateral penetration through area 18, parallel to the 17/ 18 border, but in the shelf of cortex deep to area 17. Arrowheads indicate the 2 lesions. Three regions were traversed. The first, containing mainly end-stopped cells, was in a pale stripe. The second sequence, consisting of disparity-tuned cells, was in the first part of a large dark stripe formed by the coalescence of 2 dark stripes; in the latter part of this same stripe, we recorded a mixture of unoriented cells, complex cells, and one disparity-tuned cell. As in Figure 18, the stripe that contained unoriented cells was, if anything, thicker than the stripe correlated with disparity-tuning. (Table 10.)
differences because tangential penetrations, while ideal for look- ing at radial groupings such as columns, blobs, or stripes, are not useful for laminar comparisons. For such comparisons we will need to make perpendicular penetrations through one type of stripe at a time. We hope that by comparing input layers with output layers we can learn more about hierarchical organization within each subsystem. Obviously, we look upon the present study as far from final.
The different classes of cells Unoriented cells; responses to color In our previous study of the upper-layer blobs of area 17 (Liv- ingstone and Hubel, 1984) we suggested that the unoriented cells in the blobs play a part in the perception of color, with the 2 types of color-opponency, red-green and blue-yellow, sub- serving hue perception and the broadband cells coding bright-
ness. Together, the 3 opponent mechanisms are enough to spec- ify the 3 variables necessary to account for human color perception. A high proportion of the blob cells show center- surround antagonism. This is hardly surprising for broadband cells, since brightness, as has been known since Hering (186 l), has no definition except in the context of spatial differences in luminance, but this is also true for hue: color constancy requires analogous spatial comparisons (Land, 1959; Jameson and Hurv- ich, 196 1).
The next step in the process, in area 18, came as a surprise to us. In a transformation that we term “complexification”, the stimuli that are effective in driving blob cells are generalized over a wider area. This is analogous to the step in the orien- tation-selective system from simple to complex cells. It is worth considering how these complex unoriented cells might act in everyday life. They do not respond well to diffuse light; they

The Journal of Neuroscience, November 1987, i’(11) 3407
COL . .
90 -
60 --
30 --
0 --
-30 . .
-60 --
90 -.
60 --
30 ,
.
I Near STEREO Zero
Far End Stoppmd 0 COLOR Chrom
I P
Bl-Wh V LESION A
PENETRATION DISTANCE - mm
M2-39 NOV 29 94 l-6.9 NRC 19 Figure 20. Continued.
require spots or lines on a background of contrasting luminosity or color; and they have the latitude in stimulus-position re- quirements conferred by complexification, without constraints on orientation. But while complexification deprives the cell of the ability to tell exactly where the stimulus is, it preserves its ability to respond to the stimulus with no loss of resolution. The only complex unoriented cells likely to respond to a large splotch of color are those with fields near the border of the splotch. This is consistent with psychophysics-for example, the fact that the resolution of the color system is low, and that borders are necessary for the containment of colors (Krauskopf, 196 1; Yarbus, 1967; Livingstone and Hubel, 1987b).
Our thinking about the role of color information in the dif- ferent subdivisions of the visual pathway is influenced by the criteria we use to designate a cell as “color-coded.” Cells that give opposite responses to light of different wavelengths are the most compellingly color-coded, especially since, as a conse- quence of the opposing effects of different wavelengths, they respond weakly or not at all to white light. But overtly color- opponent cells are not the only color-coded cells to be found in 17 and 18. Although a minority (about 10%) of the oriented complex cells of area 17 either respond better to some colors than to white or respond much better to some colors than to
others, most of the oriented complex cells in 17 and 18 do not show any color-opponency or even any color preference, even though their major input comes from the clearly color-coded parvocellular layers of the geniculate. Is the information pooled in such a way that all information about color contrast is lost? For some cells it seems not: Gouras and Kriiger (1979) and Thorell et al. (1984) found that about half of the complex cells in layers 2 and 3 of fovea1 area 17 of the macaque (presumably interblob) responded to chromatic borders at all relative lu- minances. The cells they tested responded well to either sign of a black-white edge, and of course showed no response when the 2 luminances were equal; therefore their failure to show a null response to chromatic borders indicates that they must receive some form of color-contrast information. It may be that the color-opponent information in the parvocellular geniculate cells is pooled in area 17 in such a way that the oriented complex cells retain a sensitivity to color borders but lose information about the sign or the color of the contrast. Since the interblobs project to the pale stripes, we might expect about half the cells in the pale stripes to be similarly responsive to chromatic bor- ders at all relative luminance contrasts, but we have not yet tested these cells with equiluminant borders.
The origin of the input to the blob system is still not clear. It
Table 10. Figure 20 (November 29, 1984), macaque
Depth (mm) Physiology Histology
4.4-5.2 End-stopped and oriented complex, with 2 Pale stereo cells
5.3-(5.5+6.2 Mainly disparity-tuned Dark 06.4-6.6 Two broadband unoriented cells, mixed with Dark, possible coalescence of
complex cells; one disparity-tuned cell 2 dark stripes
Here the apparent coalescence of 2 dark stripes seems to correlate with a region of disparity-tuned cells and a region of unoriented cells, with no intervening zone of end-stopping. In the following 3 experiments we show only the physiology, since the histological sections were poor because of tissue injury, bad perfusion, unfortunate plane of section, or other technical problems. All of the penetrations were in area 18. y Lesion.

3408 Hubel and Livingstone l Segregation of Form, Color, and Stereopsis in Primate Area 18
-68 . . n 98..
60..
38..
0 ..
-30 a’
-60 .a
90..
68 ..
30..
0 a*
-30..
-60 ..
90 .b
68..
39 *’
l rnrn t(+,r*++.*+,c., ‘4. l +
++. +++
++mm$o ..+++*+++++, D + ++C+++H’4*
$4
I Now b STEREO Zero
Far ! End Stoppad q
COLOR Chrom
I V
Bl-Wh t LESION A
+ ++d
n +
++-** +
++. + +=+
*+.=tQ
01 : : : : ’ : : :::I: : : : ’ : : :
PENETRATION DISTANCE - mm M2-41 DEC 13 94 1-5.75 SQR 19
Figure 21. Squirrel monkey. Long mediolateral penetration through 18 in the buried shelf; the histology was not recovered. Two long sequences of disparity-tuned cells are separated, preceded, and followed by sequences containing a mixture of end-stopped and oriented complex cells. No unoriented cells were encountered. (Table 11.)
probably receives some of its input directly from the geniculate (Kaas et al., 1976; Hendrickson et al., 1978; Livingstone and Hubel, 1984) possibly from the interlaminar plexuses (Fitz- patrick et al., 1983). But we think a system as substantial as the blobs in 17 should also receive input from something less ten- uous than these plexuses. It is possible that at least some of the input to the blobs, and perhaps most of it, comes from the parvocellular layers indirectly, via layer 4C& We were previ- ously skeptical about a 4C@ input because of the apparent in- compatibility of type 1 receptive fields with double-opponent
fields (Fig. 25, top). This objection would certainly be valid if 4Cp cells and blob cells had the same field-center sizes, but the 2 sizes are in fact very different, so that the centers andsurrounds of a large number of 4Cp fields would be comfortably contained in the center of one double-opponent cell’s field, and their op- posite signs would now be appropriate (Fig. 25, bottom). It would even be appropriate to have 2 opposite kinds of type 1 cells feeding into the center of a double-opponent cell-for ex- ample, excitation from both red-on center/green-off surround and green-off center/red-on surround cells would be compat-
Table 11. Figure 21 (December 13, 1984), squirrel monkey
Depth (mm) Physiology
O-O.6 Mostly oriented complex, one end-stopped cell 0.65-2.35 Long sequence mostly of disparity-tuned cells, of which all but 2 were tuned
excitatory, peaking at zero disparity 2.40475 A run of end-stopped cells 2.85-5.35 A second huge sequence of disparity-tuned cells, in distinct subsequences:
predominantly tuned excitatory (zero), a few near cells, a cluster of far cells, followed by a l-mm-long series of cells almost all of which were tuned excitatory, peaking at zero disparity
5.4-5.65 Brief run of end-stopped cells
This experiment was notable for its lack of color-coded cells, for regularity of the orientation sequences, and for subclustering of the different types of disparity-tuned cells within a continuous sequence of disparity-tuned cells.

The Journal of Neuroscience, November 1987, 7(11) 3409
-60 T
I
Near STEREO Zero
Far End Stopped II COLOR Chrom
I V
BI-Wh V LESION A
: i :i : : i: : :ii: : ~.+y&----+7j----+---.
E PENETRFITION DISTANCE - mm MZ-43 DEC 28 84 l-4.4 MAC 18
Figure 22. Macaque, area 18. Long mediolateral penetration along the buried shelf deep to the part of area 17 exposed on the occipital lobe. Five sequences, consisting mainly of unoriented color-coded cells, end-stopped cells, disparity-tuned cells, end-stopped cells, and disparity-tuned cells. (Table 12.)
ible with the responses of a red-on/green-off center receptive field. The double-opponent field’s inhibitory surround could be derived similarly.
Disparity-tuned cells Area 17. Studies in a number of laboratories in a variety of species have established area 17 as the first stage at which dis- parity-tuned cells occur. Previous work from this laboratory indicated a paucity of such cells in 17 (Hubel and Wiesel, 1970), and, in the present study, we have again found that most cells in 17 are not sharply disparity-tuned. Most binocular cells show some synergism when the 2 eyes are stimulated together, but the area of synergism is broad relative to the receptive-field width. We have nevertheless seen some clear disparity-tuned cells in 17 (e.g., Fig. 15). Our failure to see more could be a matter of sampling or anesthetic. Sampling problems would explain our results if the disparity-tuned cells were confined to layer 4B. This may indeed be the case, because layer 4B seems to be the only part of area 17 that is connected to the thick stripes in 18 (see Livingstone and Hubel, 1987a). Anesthesia would explain our results if disparity tuning were generated in area 18 and then reflected back to 17 by reciprocal connections.
Area 18. In the present series, as in all previous studies of stereopsis, orientation selectivity was invariably an additional property of disparity-tuned cells. As we discuss in the following paper (Livingstone and Hubel, 1987b), this may be important in matching the elements in 2 retinal images and in the rejection
of false targets in stereopsis. Most cells responded much better to stimulation of both eyes, with disparity optimized, than to stimulation of either eye alone; some did not respond to single- eye stimulation at all. For cells that responded to stimulation of separate eyes, the receptive fields measured in either eye alone were not obviously different from the fields of complex cells that showed no sharp disparity tuning. A very few were, in addition, end-stopped; none were simple. We saw no evidence for the inhibitory sidebands (elongated zones of inhibition lying parallel to the receptive-field axis, flanking the field on either side) described by Henry et al. (1969), Bishop et al. (197 1) and Ferster (198 1) for the cat, and in any case such zones of inhi- bition could hardly explain disparity tuning that is much nar- rower than the receptive-field width.
Most physiological studies of stereopsis agree that disparity- tuned cells occur as 3 main types: tuned excitatory (and, rarely, inhibitory), near, and far (Poggio and Fischer, 1977). In agree- ment with most other recent studies, the tuned excitatory cells we recorded almost all peaked at zero disparity, within the limits of precision of our measurements. We did not find any cells with narrow peaks at nonzero disparities. In an earlier study (Hubel and Wiesel, 1970) many cells were described that peaked at nonzero disparities of up to a few degrees; but we now have a clearer idea of where the anterior boundary of area 18 is, and, in retrospect, the recordings were probably from regions anterior to area 18. Poggio and Fischer (1977) have reported extremely small nonzero disparities in cells of fovea1 area 17 in alert an-
Table 12. Figure 22 (December 28, 1984), macaque
Depth W-4 Physiology
O-l.35 A long run of unoriented cells, most of them color-coded; the 5 cells from 0.1 to 0.5 were all complex unoriented (see Part 2)
1.4-2.5 Mainly end-stopped 2.55-3.4 Disparity-tuned, all far cells 3.6-3.85 A small cluster of end-stopped cells 4.O-end A small cluster of disparity-tuned cells, with one end-stopped cell
This penetration was notable for 3 long, fairly pure sequences of cell types: unoriented, then end-stopped, then disparity- tuned; orientation preferences showed little or no progression or order.

3410 Hubel and Livingstone * Segregation of Form, Color, and Stereopsis in Primate Area 18
COL v*v WV v . . . . . .
-30 Near
-60 STEREO Zero t
Far
901 - 4
+
End Stoppmd D COLOR Chrom V
60 Bl-Wh ‘I
30
1
LESION A
0
-30 - q o
-60 t
90 60 30 0
-30 ij::l:j:::*:j~I:~y~:://
PENETRATION DISTANCE - mm w-44 SRN 3 85 l-7.85 Mix 18
Figure 23. Macaque, area 18. Long mediolateral penetration along the buried shelf deep to the part of area 17 exposed on the occipital lobe. Nine relatively pure sequences: end-stopped, disparity-tuned, end-stopped, unoriented, end-stopped, disparity-tuned, end-stopped, unoriented, and end- stopped. A penetration whose histology we would dearly love not to have lost. (Table 13.)
imals, in which control over eye position is far superior to what one achieves in acute experiments. We would probably not have detected such small disparities in the cells we recorded from.
We still have no clear idea as to how cells selective for bin- ocular disparity are built up. The most likely way of producing such a cell would be to have a pair of simple cells, one fed from each eye, converge on a third cell, whose properties would be essentially simple and whose optimal disparity would then de- pend on the relative receptive-field positions of the simple cells. Unfortunately, the intermediate, disparity-tuned simple cell is missing. It could nevertheless exist but not have been seen, and layer 4B of area 17 would be an obvious place to look. The cells we recorded in layer 4B were mostly simple (Livingstone and Hubel, 1984) but their disparity-tuning properties were not tested. We did observe a cell in 4B that had opposite directional preferences in the 2 eyes, and consequently responded selec- tively to objects moving in depth (Livingstone and Hubel, 1984).
In squirrel monkeys, in the thick stripes of area 18, we found no dearth of cells exquisitely tuned to zero disparity, but near and far cells were seen much less frequently than in the macaque. We know of no behavioral evidence that squirrel monkeys have stereoscopic depth perception, although it hardly seems likely that such an adept brachiator would not have well-developed stereopsis. It is clear from behavioral tests with random-dot stereograms that macaques do possess stereopsis (Bough, 1970) and one wonders what, if any, differences in capabilities reflect the anatomical and physiological differences between the 2 species.
We saw few exceptions to the conspicuous grouping of dis- parity-tuned cells in the thick stripes of 18. Occasional disparity- tuned cells occurred in pale stripes, and occasional end-stopped cells in thick stripes. The grouping of disparity-tuned cells in histologically discrete units strongly supports the idea that stere- opsis is carried by a special channel. The idea that these dis- parity-tuned cells are involved in depth perception, rather than in some other function for which disparity tuning is an epi-
phenomenon, is reinforced by the segregation, within the thick stripes, of groups of cells tuned to zero, near, and far disparities. It seems surprising that no analogous grouping of the 3 types of disparity-tuned cells has been described in area 17.
Finding the thick stripes loaded with cells sensitive to dis- parity at once implicates the magnocellular system in stereopsis, since we show in the previous paper (Livingstone and Hubel, 1987a) that the thick stripes receive their area 17 input from layer 4B. The relationship also fits with the evidence that area MT receives input both from layer 4B in area 17 and from the thick stripes, and with the prevalence of disparity-tuned cells in MT (Zeki, 1974b; Maunsell and Van Essen, 1983b).
End-stopped cells The most conspicuous feature of the pale stripes was the high proportion of end-stopped cells, in marked contrast to the scar-
Table 13. Figure 23 (January 3, 1985), macaque
Depth (mm) Physiology
4.2-4.7 End-stopped 4.75-5.1 Stereo 5.15-5.2 Two end-stopped cells
5.3-5.65 Unoriented, color 5.75-6.05 End-stopped
6.1-6.35 Stereo 6.4-6.85 End-stopped
6.95-7.4 Unoriented, achromatic 7.7-7.8 Two end-stopped cells
Here we observed 9 sequences, each relatively pure: end-stopped, stereo, end- stopped (only 2 cells), unoriented, end-stopped, stereo, end-stopped, unoriented non-color-coded, end-stopped. The occurrence of end-stopped sequences between alternating unoriented and disparity-tuned sequences suggests that this monkey must have had a beautifully regular alternation of stripes. The penetration was, sadly, in the tightly curved posterior lunate bank, and a reconstruction of the histology was impossible.

The Journal of Neuroscience, November 1987, 7(11) 3411
Stereo-Tuned
Unoriented
End-Stopped
Number of cells of the same type in a sequence
city or absence of color-coded or disparity-tuned cells. In area 17, the first estimate of the number of end-stopped cells was about 20% (Hubel and Wiesel, 1968) and similar estimates have been made in subsequent surveys (Schiller et al., 1976). In con- trast, in the thin stripes of area 18 they represented about 65% of the cells. This abrupt increase in the prevalence of end-stop- ping has made us think more about its possible function in form perception.
The adequate stimulus for an end-stopped cell is an optimally oriented line swept across a particular part of the visual field. If the line is extended beyond this activating region in one or both directions (depending on the cell), the response declines. The maximum inhibition from the end zones is evoked by lines of the same orientation as the optimal orientation of the acti- vating region (Hubel and Wiesel, 1965). For this reason, a curved line should be a better stimulus than a long straight line if the curve’s orientation is appropriate in the part crossing the acti- vating region and if the parts crossing the end zones are suffi- ciently different from that orientation (Fig. 26). Straight parts of contours can thus be expected to activate complex cells, but not to activate end-stopped cells, whereas corners or regions of high curvature will activate either type (Fig. 27). In the original study of end-stopped cells, corners with various angles were
Figure 24. Histograms showing numbers of uninterrupted runs of var- ious lengths for disparity-tuned cells, end-stopped cells, and unoriented cells.
studied (Hubel and Wiesel, 1965), but curves have not, to our knowledge, been examined systematically.
It had seemed to us reasonable that both complex cells and end-stopped cells would be required to deal with contours, and that the strong predominance of complex cells without end stop- ping in area 17 might reflect a relative preponderance of straight lines or gently curved lines over sharp curves in everyday scenes. The much higher proportion of end-stopped cells in area 18 has impelled us to rethink the question.
If we ask how the different types of cells at each level of the visual pathway respond to simple figures, we see that cells with center-surround receptive fields, in the retina or lateral genic- ulate, will respond best to small spots, but will also respond well if the entire receptive-field center, and some but not all of the surround, is stimulated. This would occur at borders, as indi- cated in the upper part of Figure 28. Simple cells are also in- sensitive to diffuse light and respond best to borders, but are one step more specific than center-surround cells in that they require the border to be of a particular orientation. Complex cells gen- eralize spatially the simple-cell specificity. These types of ori- entation-selective cells should carry all the information neces- sary to inform an animal about a form such as that of Figure 28: Information about the outline is provided by the complex

3412 Hubel and Livingstone * Segregation of Form, Color, and Stereopsis in Primate Area 18
double-opponent center
4Cp fields’
\@$)A y p ponent surround (wrong way around)
\
G+ R-
fields
G+ R-
double-
‘double-opponent center /
/ Figure 25. Two possible circuits, considered in the text, that illustrate the proposed ways of building up a red-on/green-off center double- opponent cell. Top, Two type 1 cells from layer 4C/3 (or possibly from the parvocellular geniculate layers) converge on a blob cell. The 2 af- ferent cells are presumed to have receptive-field centers of identical size and position, and opposite color coding. This scheme is probably in- correct, because the resulting field center is too small, and because the surround is the wrong way around. Bottom, A more plausible scheme is to have several or many afferent type 1 cells, with fields scattered over an area somewhat larger then any of their total (center plus sur- round) field sizes. This would account for the color-opponent field cen- ter, but would leave the surround unaccounted for (which is better than having it backwards). The surround properties require inhibitory input from cells with the same color properties (or excitatory input from cells with opposite color properties), but receptive fields outside the center region.
cells whose receptive fields are appropriate in position and ori- entation, and the inside of the shape is interpreted as diffuse, or having no other edges, because no complex cells whose fields are inside the boundary would be responding. In discussing the function of end-stopped cells, we can extend the same reasoning: to specify any straight-line portion of a contour, all that is really needed is a pair of end-stopped cells to report the positions of the ends of the straight segment, and no reports from any end- stopped cells between. End-stopped cells alone, then, should be sufficient to specify a uniform bounded surface. The boundary is defined by end-stopped cells. If any end-stopped cells were activated inside the boundary, that would indicate the presence of further contours there, and thus that the inside was not uni- form; an absence of responses inside the boundary consequently signifies that it is uniformly filled.Thus, in such a scheme, at this level in the pathway (i.e., area 18) only end-stopped cells are needed to define the form fully. Of course the uniformity of
receptive field orientation
\
end-stopped cell
Figure 26. A curved contour passes through the receptive field of an end-stopped cell. In the activating region, its orientation is close to optimal, but it curves sharply enough that it fails to produce an inhib- itory effect from the end zones.
the form’s interior could be conveyed by the quiescence of or- dinary (not end-stopped) complex and simple cells, and this indeed is what we think is happening in 17; but we are suggesting that the need for such cells is superseded at the level of area 18. For that matter, their function at antecedent levels, such as 17 or the earliest stages of 18, may be thought of as simply to build up the end-stopped cells. Such strategies would obviously be efficient, because they would drastically reduce at each stage the number of cells required to transmit the information.
Attneave (1954) from information theory, has similarly ar- gued that a shape is best described by designating the parts of its contour “most different from a straight line,” or those points at which the contours change direction maximally, and then connecting those points with a straight line. If this were indeed the main function of end-stopped cells, it would help to explain the abrupt relative increase in their numbers in going from interblob 17 to the pale stripes in 18. It could also help explain the pallor of the pale stripes when stained for cytochrome ox- idase or labeled with deoxyglucose, since what we are contem- plating is a system in which, at any given instant, only a few cells would be likely to be active.
Psychophysically, such a system would go far towards ex- plaining the phenomenon of completion, i.e., the perception that a line passing through a part of the visual field blinded by cortical destruction is continuous, even if, in fact, it is interrupted; this is presumably because of the elimination of the end-stopped
-end-stopped cells
Figure 27. Illustration of the idea that a gently curved part of a contour would not activate a completely end-stopped cell, but a more sharply curved region would.

The Journal of Neuroscience, November 1987, 7(11) 3413
center-surround cells
complex cells
good response
end-stopped cells
Figure 28. Top, The responsiveness of center-surround cells to ligbt- dark contours placed so that most or all of the field centers, but only part of the surrounds, are stimulated. Mzddle, The response of complex cells to contours of appropriate orientation, but the lack of response to a homogeneous interior. Bottom, end-stopped cells should respond to ends of lines or to sharply curved contours of appropriate orientation, but not to contours of inappropriate orientations, to straight or gently curved contours, or to uniformly lit areas.
cells that would report the interruption. We wondered whether the absence of any obvious hole in the fovea1 part of one’s visual field in the dark-adapted state might be a similar form of com- pletion, since to preceive a hole implies seeing the boundary, and hence the activation of the appropriate cells. We carried this reasoning further and asked whether we would see com- pletion of lines crossing the scotomatous (dark-adapted) fovea, or whether we would fill in the center with whatever pattern covered the rest of the visual field. When we looked at lines or textured patterns under dark adaptation we were surprised to find we did see a hole, and completion did not occur: continuous lines running through the center of gaze appeared interrupted, and textures and patterns appeared smooth or blank near the center of gaze.
By this time we should not be surprised to find that a given scene may be represented in one way at one stage in the visual pathway, and in a quite different way at another stage. We are used to the idea that rods and cones react to the presence or absence of light, whereas retinal ganglion cells compare light in one small area with the average light in the immediate surround. At each stage the representation becomes more abstract, more succinct, more efficient. And so far, at each stage it has been difficult to guess what will come next. The pale stripes of 18 are no exception.
retina B-ganglion cells A-ganglion cells I I
LGN
Area 17
Area 18
Prestriate hevond 18
+ + parvocellular magnocellular
1 1
layer 4cp
inte!obs ~tLs
layer 4Ca
’ layer 4B
1 \1 \1
pale stripes thin stripes thick stripes
1 \1 k
? J
v4 MT
Figure 29. Diagram showing some of the major forward connections of the pathways from lateral geniculate body to prestriate regions. Pul- vinar, tectum, and a host of other important structures are ignored, as is the “w” system, whose counterpart in monkeys is unclear (to us). To this we may add that some consider the magnocellular and parvo- cellular paths to correspond to the Y and X distinction (Enroth-Cugell and Robson, 1966). One reason we have avoided using these terms is the difficulty in dealing with categories with multiple defining attributes; the terms magno- and parvocellular have the advantage of being pri- marily anatomical, and cleanly separated.
Complex cells We have left ordinary orientation-specific complex cells until the end of this discussion because we do not think of them as necessarily constituting a single class, intermixed as they are with disparity-tuned cells in the thick stripes and end-stopped cells in the pale stripes. It seems simplest to think of the end- stopped cells and the neighboring complex cells with which they are intermixed as representing one system, and the disparity- tuned cells and their neighboring complex cells as another. Since the 2 divisions of area 18 have such different inputs from area 17, we suspect that differences will be found in these 2 subpop- ulations of complex cells. Because the disparity-tuned cells seem to receive their major input from the magnocellular system, and the end-stopped from the parvocellular system, we clearly need to test the oriented complex cells, as well as the disparity-tuned cells and the end-stopped cells, with equiluminant color-con- trast stimuli and with low luminance-contrast edges.
Assignment offunctions to the d@erent channels The retinocortical pathway seems to have split into 3 subdi- visions at the level of area 18: one component seems to be involved in high-resolution form discrimination, the second with color perception, and the third with stereopsis (Fig. 29). In addition, a system concerned with movement may project directly from layer 4B of area 17 to MT, where it is joined by the stereo system from the thick stripes of 18. The 4B + thick stripe -* MT and 4B + MT pathways are probably magnocel- lular in origin and convey information about movement and depth.The interblob - pale stripe system carries information about shape, or form, and is parvocellular in origin. The blob + thin stripe + V4 system carries information about color; its inputs are unclear, but may come from both parvo- and mag- nocellular layers. This segregation of functions and their cor- relation with the physiological properties of the 2 geniculate subdivisions generate many predictions about the way primates should see-predictions that are far-reaching and testable. The following paper (Livingstone and Hubel, 1987b) will describe
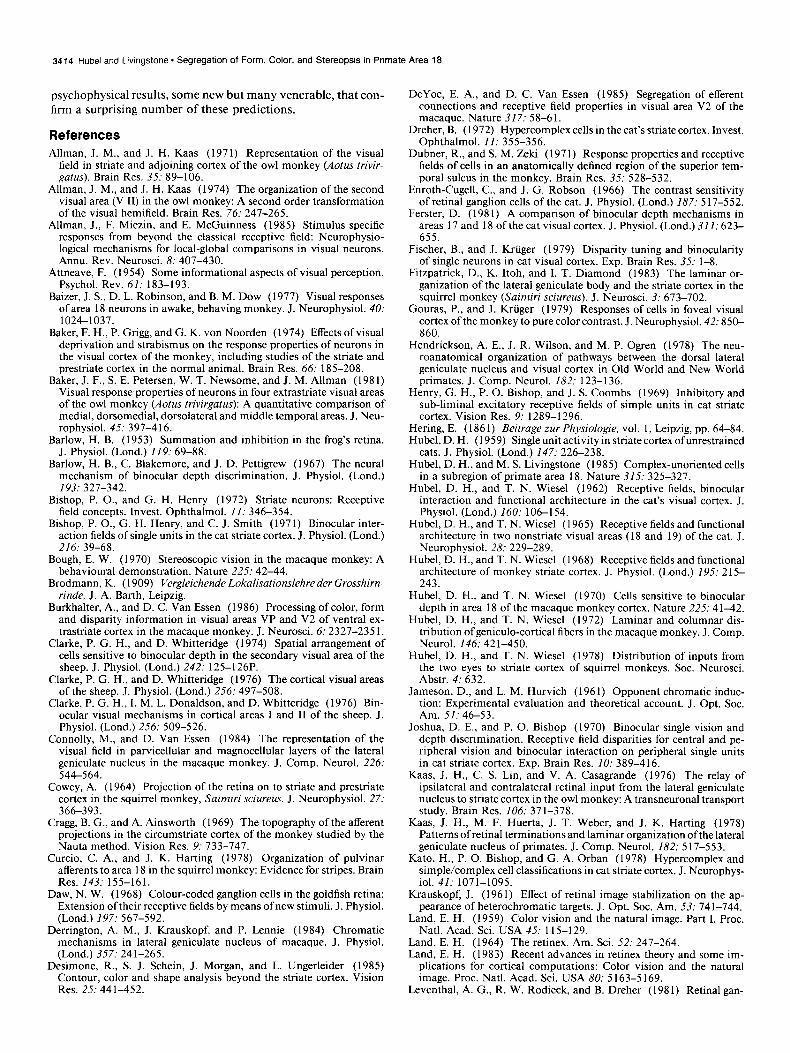
3414 Hubel and Livingstone * Segregation of Form, Color, and Stereopsis in Primate Area 18
psychophysical results, some new but many venerable, that con- firm a surprising number of these predictions.
References Allman, J. M., and J. H. Kaas (1971) Representation of the visual
field in striate and adjoining cortex of the owl monkey (A&us trivir- g&us). Brain Res. 35: 89-106.
Allman, J. M., and J. H. Kaas (1974) The organization of the second visual area (V II) in the owl monkey: A second order transformation of the visual hemifield. Brain Res. 76: 247-265.
Allman, J., F. Miezin, and E. McGuinness (1985) Stimulus specific responses from beyond the classical receptive field: Neurophysio- logical mechanisms for local-global comparisons in visual neurons. Annu. Rev. Neurosci. 8: 407-430.
Attneave, F. (1954) Some informational aspects of visual perception. Psychol. Rev. 61: 183-193.
Baizer, J. S., D. L. Robinson, and B. M. Dow (1977) Visual responses of area 18 neurons in awake, behaving monkey. J. Neurophysiol. 40: 1024-1037.
Baker, F. H., P. Grigg, and G. K. von Noorden (1974) Effects of visual deprivation and strabismus on the response properties of neurons in the visual cortex of the monkey, including studies of the striate and prestriate cortex in the normal animal. Brain Res. 66: 185-208.
Baker, J. F., S. E. Petersen, W. T. Newsome, and J. M. Allman (198 1) Visual response properties of neurons in four extrastriate visual areas of the owl monkey (Aotus trivirgutus): A quantitative comparison of medial, dorsomedial, dorsolateral and middle temporal areas. J. Neu- rophysiol. 45: 397-4 16.
Barlow, H. B. (1953) Summation and inhibition in the frog’s retina. J. Physiol. (Lond.) I 19: 69-88.
Barlow, H. B., C. Blakemore, and J. D. Pettigrew (1967) The neural mechanism of binocular depth discrimination. J. Physiol. (Lond.) 193: 327-342.
Bishop, P. O., and G. H. Henry (1972) Striate neurons: Receptive field concepts. Invest. Ophthalmol. 11: 346-354.
Bishop, P. O., G. H. Henry, and C. J. Smith (1971) Binocular inter- action fields of single units in the cat striate cortex. J. Physiol. (Lond.) 216: 39-68.
Bough, E. W. (1970) Stereoscopic vision in the macaque monkey: A behavioural demonstration. Nature 225: 42-44.
Brodmann. K. (1909) Veraleichende Lokalisationslehre der Grosshirn- rinde, J. ‘A. Barth, Leipzig.
Burkhalter, A., and D. C. Van Essen (1986) Processing of color, form and disparity information in visual areas VP and V2 of ventral ex- trastriate cortex in the macaque monkey. J. Neurosci. 6: 2327-235 1.
Clarke, P. G. H., and D. Whitteridge (1974) Spatial arrangement of cells sensitive to binocular depth in the secondary visual area of the sheep. J. Physiol. (Lond.) 242: 125-126P.
Clarke, P. G. H., and D. Whitteridge (1976) The cortical visual areas of the sheep. J. Physiol. (Lond.) 256: 497-508.
Clarke, P. G. H., I. M. L. Donaldson, and D. Whitteridge (1976) Bin- ocular visual mechanisms in cortical areas I and II of the sheep. J. Physiol. (Lond.) 256: 509-526.
Connolly, M., and D. Van Essen (1984) The representation of the visual field in parvicellular and magnocellular layers of the lateral geniculate nucleus in the macaque monkey. J. Comp. Neurol. 226: 544-564.
Cowey, A. (1964) Projection of the retina on to striate and prestriate cortex in the squirrel monkey, Suimiri sciureus. J. Neurophysiol. 27: 366-393.
Cragg, B. G., and A. Ainsworth (1969) The topography of the afferent projections in the circumstriate cortex of the monkey studied by the Nauta method. Vision Res. 9: 733-747.
Curcio, C. A., and J. K. Hatting (1978) Organization of pulvinar afferents to area 18 in the squirrel monkey: Evidence for stripes. Brain Res. 143: 155-161.
Daw, N. W. (1968) Colour-coded ganglion cells in the goldfish retina: Extension of their receptive fields by means of new stimuli. J. Physiol. (Lond.) 197: 567-592.
Derrington, A. M., J. Krauskopf, and P. Lennie (1984) Chromatic mechanisms in lateral geniculate nucleus of macaque. J. Physiol. (Lond.) 357: 241-265.
Desimone, R., S. J. Schein, J. Morgan, and L. Ungerleider (1985) Contour, color and shape analysis beyond the striate cortex. Vision Res. 25: 441-452.
DeYoe, E. A., and D. C. Van Essen (1985) Segregation of efferent connections and receptive field properties in visual area V2 of the macaque. Nature 317: 58-61.
Dreher, B. (1972) Hypercomplex cells in the cat’s striate cortex. Invest. Ophthalmol. 11: 355-356.
Dubner, R., and S. M. Z&i (197 1) Response properties and receptive fields of cells in an anatomically defined region of the superior tem- poral sulcus in the monkey. Brain Res. 35: 528-532.
Enroth-Cugell, C., and J. G. Robson (1966) The contrast sensitivity of retinal ganglion cells of the cat. J. Physiol. (Lond.) 187: 5 17-552.
Ferster, D. (1981) A comparison of binocular depth mechanisms in areas 17 and 18 of the cat visual cortex. J. Physiol. (Lond.) 311: 623- 655.
Fischer, B., and J. Kruger (1979) Disparity tuning and binocularity of single neurons in cat visual cortex. Exp. Brain Res. 35: 1-8.
Fitzpatrick, D., K. Itoh, and I. T. Diamond (1983) The laminar or- ganization of the lateral geniculate body and the striate cortex in the squirrel monkey (Saimiri sciureus). J. Neurosci. 3: 673-702.
Gouras, P., and J. Kruger (1979) Responses of cells i.n fovea1 visual cortex of the monkey to pure color contrast. J. Neurophysiol. 42: 850- 860.
Hendrickson, A. E., J. R. Wilson, and M. P. Ogren (1978) The neu- roanatomical organization of pathways between the dorsal lateral geniculate nucleus and visual cortex in Old World and New World primates. J. Comp. Neurol. 182: 123-l 36.
Henry, G. H., P. 0. Bishop, and J. S. Coombs (1969) Inhibitory and sub-liminal excitatory receptive fields of simple units in cat striate cortex. Vision Res. 9: 1289-1296.
Hering, E. (186 1) Beitruge zur Physiologic, vol. 1, Leipzig, pp. 64-84. Hubel, D. H. (1959) Single unit activity in striate cortex ofunrestrained
cats. J. Physiol. (Lond.) 147: 226-238. Hubel, D. H., and M. S. Livingstone (1985) Complex-unoriented cells
in a subregion of primate area 18. Nature 315: 325-327. Hubel, D. H., and T. N. Wiesel (1962) Receptive fields, binocular
interaction and functional architecture in the cat’s visual cortex. J. Physiol. (Lond.) 160: 106-154.
Hubel, D. H., and T. N. Wiesel (1965) Receptive fields and functional architecture in two nonstriate visual areas (18 and 19) of the cat. J. Neurophysiol. 28: 229-289.
Hubel, D. H., and T. N. Wiesel (1968) Receptive fields and functional architecture of monkey striate cortex. J. Physiol. (Lond.) 195: 215- 243.
Hubel, D. H., and T. N. Wiesel (1970) Cells sensitive to binocular depth in area 18 of the macaque monkey cortex. Nature 225: 4 l-42.
Hubel, D. H., and T. N. Wiesel (1972) Laminar and columnar dis- tribution of geniculo-cortical fibers in the macaque monkey. J. Comp. Neurol. 146: 421-450.
Hubel, D. H., and T. N. Wiesel (1978) Distribution of inputs from the two eyes to striate cortex of squirrel monkeys. Sot. Neurosci. Abstr. 4: 632.
Jameson, D., and L. M. Hurvich (1961) Opponent chromatic induc- tion: Experimental evaluation and theoretical account. J. Opt. Sot. Am. 51: 46-53.
Joshua, D. E., and P. 0. Bishop (1970) Binocular single vision and depth discrimination. Receptive field disparities for central and pe- ripheral vision and binocular interaction on peripheral single units in cat striate cortex. Exp. Brain Res. 10: 389-416.
Kaas, J. H., C. S. Lin, and V. A. Casagrande (1976) The relay of ipsilateral and contralateral retinal input from the lateral geniculate nucleus to striate cortex in the owl monkey: A transneuronal transport study. Brain Res. 106: 371-378.
Kaas, J. H., M. F. Huerta, J. T. Weber, and J. K. Harting (1978) Patterns ofretinal terminationsand laminar organization ofthe lateral geniculate nucleus of primates. J. Comp. Neurol. 182: 5 17-553.
Kato, H., P. 0. Bishop, and G. A. Orban (1978) Hypercomplex and simple/complex cell classifications in cat striate cortex. J. Neurophys- iol. 41: 1071-1095.
Krauskopf, J. (196 1) Effect of retinal image stabilization on the ap- pearance of heterochromatic targets. J. Opt. Sot. Am. 53: 74 l-744.
Land, E. H. (1959) Color vision and the natural image. Part I. Proc. Natl. Acad. Sci. USA 45: 115-129.
Land, E. H. (1964) The retinex. Am. Sci. 52: 247-264. Land, E. H. (1983) Recent advances in retinex theory and some im-
plications for cortical computations: Color vision and the natural image. Proc. Natl. Acad. Sci. USA 80: 5 163-5 169.
Leventhal, A. G., R. W. Rodieck, and B. Dreher (198 1) Retinal gan-

The Journal of Neuroscience, November 1987, 7(11) 3415
@ion cell classes in the Old World monkey: Morphology and central projections. Science 213: 1139-l 142.
Li, C.-L., and H. Jasper (1953) Microelectrode studies of the electrical activity of the cerebral cortex in the cat. J. Physiol. (Lond.) 121: 117- 140.
Livingstone, M. S., and D. H. Hubel (1982) Thalamic inputs to cy- tochrome oxidase-rich regions in monkey visual cortex. Proc. Natl. Acad. Sci. USA 79: 6098-6 10 1.
Livingstone, M. S., and D. H. Hubel (1983) Specificity of cortico- cortical connections in monkey visual system. Nature 304: 531-534.
Livingstone, M. S., and D. H. Hubel (1984) Anatomy and physiology of a color system in the primate visual cortex. J. Neurosci. 4: 309- 356.
and depth. J. Neurosci. 7: 34 16-3468. Lund, J. S., and R. G. Boothe (1975) Interlaminar connections and
pyramidal neuron organization in the visual cortex, area 17, of the
Livingstone, M. S., and D. H. Hubel (1987a) Connections between layer 4B of area 17 and the thick cytochrome oxidase stripes of area 18 in the squirrel monkey. J. Neurosci. 7: 3371-3377.
Livingstone, M. S., and D. H. Hubel (1987b) Psychophysical evidence for separate channels for the perception of form, color, movement,
cortical associations, and some intrinsic interlaminar connections of the striate cortex in the squirrel monkey (Sizimiri). J. Comp. Neurol. 140: 155-174.
Thorell, L. G., R. L. De Valois, and D. G. Albrecht (1984) Spatial mapping of monkey Vl cells with pure color and luminance stimuli. Vision Res. 24: 75 l-769.
T&es, M., A. E. Hendrickson, and J. Tigges (1984) Anatomical con- sequences of long-term monocular eyelid closure on lateral geniculate nucleus and striate cortex in squirrel monkey. J. Comp. Neurol. 227: 1-13.
Tootell, R. B. H., and M. S. Silverman (1981) A comparison of cy- tochrome oxidase and deoxyglucose patterns in macaque visual cor- tex. Sot. Neurosci. Abstr. 7: 356.
Tootell, R. B. H., M. S. Silverman, R. L. De Valois, and G. H. Jacobs (1983) Functional organization of the second cortical visual area in primates. Science 220: 737-739.
monkey striate cortex. Sot. Neurosci. Abstr. 12: 1497. Van Essen, D. C., and S. Zeki (1978) The topographic organization
of rhesus monkey prestriate cortex. J. Physiol. (Land.) 277: 193-226.
Ts’o, D. Y., C. D. Gilbert, and T. N. Wiesel (1986) Relationships between color-specific cells in cytochrome oxidase-rich patches of
macaque monkey. J. Camp. Neurol. 159: 305-334. Maunsell, J. H. R., and D. C. Van Essen (1983a) Functional properties
of neurons in middle temporal visual area of the macaque monkey. I. Selectivity for stimulus direction, speed, and orientation. J. Neu- rophysiol. 49: 1127-l 147.
Maunsell, J. H. R., and D. C. Van Essen (1983b) Functional properties of neurons in middle temporal visual area of the macaque monkey. II. Binocular interactions and sensitivity to binocular disparity. J. Neurophysiol. 49: 1148-l 167.
Miezin, F., E. McGuinness, and J. Allman (1982) Antagonistic direc- tion specific mechanisms in area MT in the owl monkey. Sot. Neu- rosci. Abstr. 8: 681.
Nikara, T., P. 0. Bishop, and J. D. Pettigrew (1968) Analysis of retinal correspondence by studying receptive fields of binocular single units in cat striate cortex. EXP. Brain Res. 6: 353-372.
Van Essen, D. C., W. T. Newsome, and J. L. Bixby (1982) The pattern of interhemispheric connections and its relationship to extrastriate visual areas in the macaque monkey. J. Neurosci. 2: 265-283.
Van Essen, D. C., W. T. Newsome, J. H. R. Maunsell, and J. L. Bixby (1986) The projections from striate cortex (Vl) to areas V2 and V3 in the macaque monkey: Asymmetries, area1 boundaries, and patchy connections. J. Comp. Neurol. 244: 45 l-480.
von der Heydt, R., C. Adorjani, P. Hanny, and G. Baumgartner (1978) Disparity sensitivity and receptive field incongruity of units in the cat striate cortex. Exp. Brain Res. 31: 523-545.
Weller, R. E., and J. H. Kaas (1983) Retinotopic patterns of connec- tions of area 17 with visual areas V-II and MT in macaque monkeys. J. Comp. Neurol. 220: 253-279.
Wiesel, T. N., and D. H. Hubel (1966) Spatial and chromatic inter- actions in the lateral geniculate body of the rhesus monkey. J. Neu-
Pettigrew, J. D., T. Nikara, and P. 0. Bishop (1968) Binocular inter- action on single units in cat striate cortex: Simultaneous stimulation by single moving slit with receptive fields in correspondence. Exp. Brain Res. 6: 391-410.
Poggio, G. F. (1984) Processing of stereoscopic information in primate visual cortex. In Dynamic Aspects of Neocortical Function, G. M. Edelman, W. E. Gall, and W. M. Cowan, eds., pp. 613-636, Wiley, New York.
Poggio, G. F., and B. Fischer (1977) Binocular interaction and depth sensitivity in striate and prestriate cortex of behaving rhesus monkey. J. Neurophysiol. 40: 1392-1405.
Poggio, G. F., B. C. Motter, S. Squatrito, and Y. Trotter (1985) Re- sponses of neurons in visual cortex (Vl and V2) of the alert macaque to dynamic random-dot stereograms. Vision Res. 25: 397-406.
Ramachandran, V. S., P. G. H. Clarke, and D. Whitteridge (1977) Cells selective to binocular disparity in the cortex of newborn lambs. Nature 268: 333-335.
Rose, D. (1977) Responses of single units in cat visual cortex to moving bars of light as a function of bar length. J. Physiol. (Land.) 271: l- 23.
Schein, S. J., R. T. Marrocco, and F. M. De Monasterio (1982) Is there a high concentration ofcolor-selective cells in area V4 of monkey visual cortex? J. Neurophysiol. 47: 193-213.
Schiller, P. H., B. L. Finlay, and S. F. Volman (1976) Quantitative studies of single-cell properties in monkey striate cortex. 1. Spatio- temporal organization of receptive fields. J. Neurophysiol. 39: 1288- 1319.
Shipp, S., and S. Zeki (1985) Segregation of pathways leading from area V2 to areas V4 and V5 of macaque monkey visual cortex. Nature 315: 322-325.
Spatz, W. B., J. T&es, and M. Tigges (1970) Subcortical projections,
rophysiol. 29: 1115-1156. Wong-Riley, M. T. T. (1979) Changes in the visual system of mon-
ocularly sutured or enucleated cats demonstrable with cytochrome oxidase histochemistry. Brain Res. 171: 1 l-28.
Yarbus, A. L. (1967) EyeMovements and Vision (trans. from Russian, 1965) Plenum, New York.
Zeki, S. M. (1969) Representation of central visual fields in prestriate cortex of monkey. Brain Res. 14: 27 l-29 1.
Zeki, S. M. (1973) Colour coding in rhesus monkey prestriate cortex. Brain Res. 53: 422-427.
Zeki, S. M. (1974a) Functional organization of a visual area in the posterior bank of the superior temporal sulcus of the monkey. J. Physiol. (Lond.) 236: 549-573.
Zeki, S. M. (1974b) Cells responding to changing image size and dis- paritv in the cortex of the rhesus monkey. J. Phvsiol. (Land.) 242: 827-841.
_ . ,
Zeki, S. M. (1975) The functional organization of projections from striate to prestriate visual cortex in the rhesus monkey. Cold Spring Harbor Symp. Quant. Biol. 40: 591-600.
Zeki, S. M. (1978) Uniformity and diversity of structure and function in rhesus monkey prestriate visual cortex. J. Physiol. (Lond.) 277: 273-290.
Zeki, S. M. (1980) The representation of colours in the cerebral cortex. Nature 284: 4 12-4 18.
Zeki, S. M. (1983) The distribution of wavelength and orientation selective cells in different areas of monkey visual cortex. Proc. R. Sot. Lond. [Biol.] 217: 449-470.
Zeki, S. M., and D. R. Sandeman (1976) Combined anatomical and electrophysiological studies on the boundary between the second and third visual areas ofrhesus monkey cortex. Proc. R. Sot. Lond. [Biol.] 194: 555-562.