seismic activity during the 1968 test pumping at the … activity during the 1968 test pumping at...
TRANSCRIPT
Seismic Activity During
the 1968 Test Pumping at
the Rocky Mountain Arsena I
Disposal Well
By D. B. Hoover and J. A. Dietrich
GEOLOGICAL SURVEY CIRCULAR 613
This report concerns work
done in cooperation with the
U.S. Army Corps of Engineers
COLORADO WATER RESOURCES LIBRARY U.S. GEOLOGICAL SURVEY WRD. DENVER
Washington 1969

United States Department of the Interior STEWART L. UDALL, Secretary
Geological Survey William T. Pecora, Director
Free on application to the U.S. Geological Survey, Washington, D.C. 20242

CONTENTS
Page
Abstract---------------------------------------------------------Introduction------------------------------------------------------ 1 Data acquisition system------------------------------------------- 2 Monitoring operations --------------------------------------------- 2 Results of test---------------------------------------------------- 3 Acknowledgments------------------------------------------------- 4 References cited-------------------------------------------------- 4
ILLUSTRATIONS
Figure 1. Location m<lp of seismic stations used during the test program showing the time difference for arrivals
Page
between stations STK and W1---------------------------- 9 2. Empirical relationship between magnitude and coda--------- 10 3. Computer output format for an earthquake occurring
on July 18, 1968 --------------------------------------- 11 4. 1968 6-hour seismicity data------------------------------ 12 5. 1968 10-day average seismicity--------------------------- 14 6. 1968 Bergen Park 10-day average seismicity--------------- 14 7. Map of earthquake epicenters for September 19o8 ----------- 15 8. Map of earthquake epicenters for Oct. 1 to Nov. 4, 1968------ 16 9. Histogram showing distance of earthquakes from station
WI--------------------------------------------------- 17 10. Temperature logs observed in the injection disposal
well on Sept. 4, 1961, and Nov. 10, 19o8 ------------------ 18
TABLES
Page
Table 1. Time of occurrence of pumping tests----------------------- 2 2. Hypocenters for some Derby earthquakes occurring
during 1967 and 1968------------------------------------ 19 3. Derby earthquakes from Sept. 1 to Nov. 15, 19o8------------- 29
III


Seismic Activity During the 1968 Test Pumping at ~
the Rocky Mountain Arsenal Disposal Well
By D. B. Hoover and J. A. Dietrich
f. h,_
During the 1968 pumping tests at the Rocky Mountain Arsenal disposal well, the U.S. Geological Survey was responsible for moniwring earthquakes occurring in the area of the arsenal ami making chemical analysis of the fluids removed. Three criteria were established ro suspend the pumping if anomalous earthquake activity occurred during the pumping rest. These criteria were based on the frequency, magnitude, and location of the local earthquakes.
The pumping program consisted of four rests which occurred between September 3 and October 26, 1968. During periods of pumping, earthquake activity remained within acceptable limits and no suspensions of the pumping were required. After each of rhc two rna jor pumping periods an increase in the frequency of small earthquakes occurred. During the first of rheserwo periods of high seismic activity the Geological Survey recommended a delay in the stan of the next phase of the pumping until the activity subsided. Most of the earthquakes during l9o8 occurred northwest uf the arsenal; however, in rhe 212-month period after the start of rhe test, a larger percent of the earthquakes occurred on the arsenal than in the previous 8-month period. The rcmperarare in the cooled zone ar rhe bonom of the well was I2°F warmer 2 weeks after pumping stopped than it was in January 196H. Preliminary chemical analyses indicate rhar very linle mixing between was r e fluids and connate water has occurred.
INTRODUCTION
In September and October 1968 the U.S. Army Corps of Engineers made a pumping test of the Rocky Mountain Arsenal disposal well. This well had been used to inject about 165 million gallons of waste fluid into Precambrian basement rock 12,000 feet below the surface of the Denver basin. Shortly after the start of injection in early 1962 small earthquakes were recorded from the vicinity of the arsenal. These earthquakes, commonly known as Derby earthquakes, have continued although injection was discontinued in 1966. Most investigators agree that the earthquakes have been triggered by the injected fluid and a recommendation has been made (Healy and others, 1968) that part of the fluid be withdrawn in an attempt to decrease the earthquake activity. The pumping tests were designed to determine if substantial amounts of the fluid could be pumped from the disposal well.
In a memorandum of understanding dated June 5, 1968, between the U.S. Geological Survey and the Corps of Engineers, Omaha District, the Geological Survey assumed responsibility for five aspects of the test pumping program at the Rocky Mountain Arsenal disposal well. Briefly these five areas of responsibility were as follows:·
l. To establish a seismic monitoring system for use during the pum'Jing tests.
2. To provide liaison with the Colorado School of Mines to obtain benefit from related information which that institution could provide.
3. To install a special down-hole instrument package 60 days prior to the test for use during and after pumping.
4. To monitor the seismic activity and advise the Corps of Engineers immediately of any unusual seismic activity that might occur during the test and recommend suspension of the test if anomalous seismic activity developed.
5. To provide for fluid sam'Jle collection and selective analysis of fluids removed from the reservoir.
The major emphasis under these areas of responsibility was to provide a seismic monitoring program which would assure maximum protective warning should any anomalous seismic activity occur in conjunction with the fluid removal.
The pumping tests were designed to determine if large volumes of fluid could be removed from the Rocky Mountain Arsenal disposal well and if any change in seismic activity would be caused by the fluid removal. The preponderance of opinion was that a test program, which would remove only a small part of the fluid that had been injected into the reservoir, would constitute no additional seismic hazard to Denver. However, because the test was to be conducted in a largely unknown system, which had previously produced slightly damaging earthquakes, there was noway

to guarantee the complete safety of the proposed test. The monitoring procedures and criteria for suspending the test were designed to provide for the maximum safety of the populace of Denver. This report covers Geological Survey activities. The results of the pumping test are given in a report to the Corps of Engineers (van Poollen, 1969).
ln the preparatory phases of the program, difficulties were encountered in making the special down-hole instrument package operational. These difficulties, coupled with the possibility of losing or damaging the instrument package during the test, were considered sufficient reason to abandon the plan to operate the down-hole instrument during the test. The absence of the down-hole data in no way affected the ability to evaluate the seismic hazards during the pumping program.
By agreement with the Corps of Engineers, provision was made for a temporary halt of the pumping tests on the recommendation of Geological Survey personnel in Denver should any anomalous seismic activity become evident. Resumption of testing could be decided at the local level, or, if conditions warranted it, the decision would be referred to joint conference between the Geological Survey and the Corps of Engineers. A recommendation to terminate the test would be subject to approval of the Director of the Geological Survey and District Engineer, Omaha District, Corps of Engineers.
On the basis of t<he previous earthquake activity in the Derby area in 1968, the Geological Survey established three criteria to be used for calling a temporary halt in the pumping program at the field level. These criteria were reported to the Corps of Engineers on August 12, 1968. The first criterion was based on the local seismicity .lf the frequency of Derby earthquakes exceeded 10 in any consecutive 6-hour period during pumping, the pump would be shut down. The second criterion would require an immediate halt to pumping if an earthquake of magnitude 3.0 or greater should occur. Lastly, any earthquake occur ring within a 1.5 mile radius of the well would be cons.idered anomalous and again a temporary but immediate halt would be ordered.
The time intervals during which the pump was operating and the total quantity of fluid removed in each test is given in table l. Details on these tests and the prior cleanout operations are discussed by van Poollen (1969).
Table 1.-Time of occurrence of pumping tests
Test No. Time of test
1--- 0600 Sept. 3-0600 Sept. 4 2--- 2300 Sept. 4-2300 Sept. 5 3--- 2310 Sept. 7-1800 Sept. 13
0915 Oct 21-2230 Oct. 26
Fluid removed (gallons)
5 '8 3 8 17,950
1l!2 '513 200,919
2
DATA ACQUISITION SYSTEM
Figure I gives the locations of the seismometers in use dOring the test program. Twenty-one seismometers in 17 locations were used. Fourteen locations were on the arsenal arranged in an offcenter cross. Three additional stations were on the west side of the South Platte River to provide a network of stations surrounding the epicentral zone. Two of the locations, sites S46 and E35, contained both horizontal and vertica 1 seismometers to provide data on three components of ground motion; other recording I o cations provided data only on vertical motion. The seismometers used were Hall-Sears type HS-1 0 having a 2 Hz natural frequency.
Data from each seismometer on the arsenal were transmitted over wire line to a central recording site in building 1706 on the arsenal. Here, all the signals were electronically amplified and recorded photographically on a CEC 5-119 oscillographic recorder. Paper speed of the 5-119 at l mm per sec (millimeter per second) provided sufficient information to monitor all channels and catalog local earthquakes. Thirteen of the 18 channels were also recorded on a modlfied Ampex model 300 tape transport running at 0. 3 ips (inches per second). Data recorded on the magnetic tape provided sufficient time resolution for accurate location of the events.
The three seismometers west of the South P 1 at t e River and one of the seismometers from the arsenal array were telemetered over telephone lines to the Denver Federal Center. At the Federal Center, data from the three off-arsenal sites were recorded on an applied magnetics tape transport running at 0. 3 ips to provide added information at high timer e solution.
Because of the need for a visible on-line monitoring system during the pump test, a two-channel Geo Technical Corp. helicorder system was installed in building 25 at the Federal Center. Stations STK and W l were recorded :m this visible system during the test to provide approximate mclgnitudes and locations as each earthquake o c c u r red. A helicorder paper speed of 1 mm per sec provided about 0.1 sec time resolution. This visible m::mitoring system was installed on June 27, 1968.
The system can detect Derby earthquakes in the vi-· cinity of the arsenal of Richter magnitude approximately -1.0 or larger. The smaller events, however, are generally not locatable because of the energy attenuation across the array and reliable arrival times are not recorded at the more distant stations.
MONITORING OPERATIONS
Because of the criteria established for temporary halt of the test, it was necessary to provide an immediate indication of the number and magnitudes of Derby earthquakes and to determine their approximate

locations. The visible monitor provided by the helicorder system in building 2.=, at the F edc rill Center was the source of basic on-line inf,>r·mation. Uuringpumping operations a 24-hour watc ii was made· and the record was examined by trained l'hservers c1·ery 5 minutes. As each Derby earrhquakc o,·curred, the observers recorded the arrival time Jt , ach of the two stations STK and W1, the location ghc.·n by the time difference !STK -lW1, and the approximn:c· magnitude.
The identification of a Uerb\· cart nquaKe was not difficult because they have a characteristic Jppearance unlike most other disturbances on record. Some booms might occasionally be mistaken for earthquakes, but the time difference between stations S 1 K and i\ I usually served to distinguish questionable ,. v ~' n t s. ThL· timing of the individual events was tabu l J ted anJ graphed as each occurred to provide the stati::;ric ntecessary to implement the first criterion for temporary halt of the test.
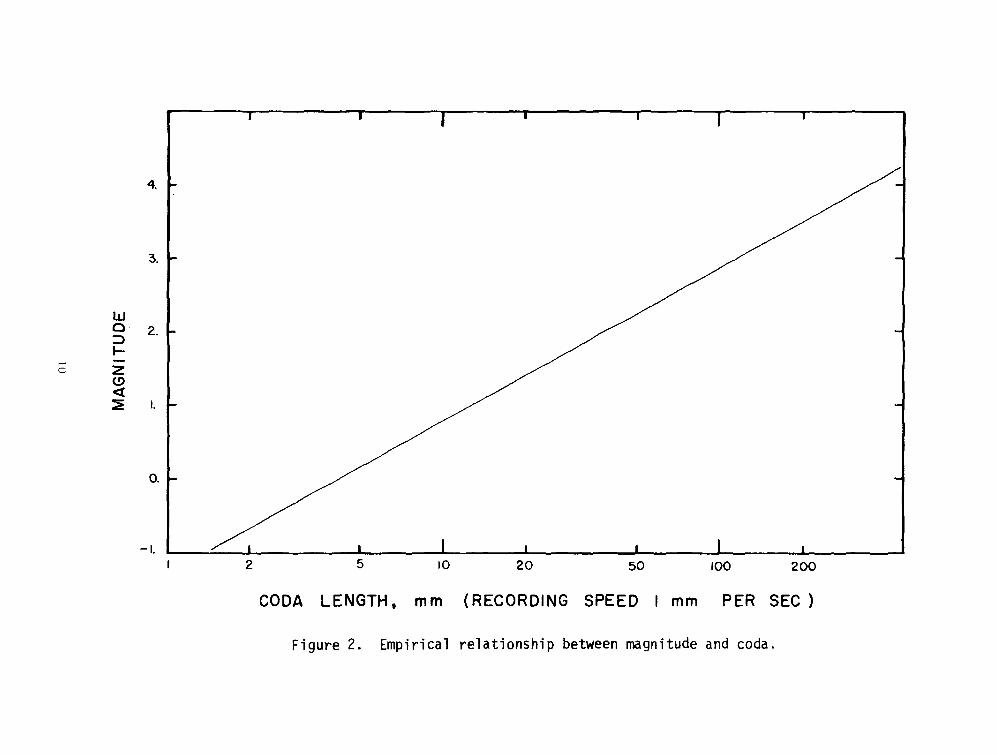
The duration of the coda, or tim•;:: that the ground was disturbed during each earthquake, was tabulated and related directly to the magnitude, The high sensitivity of the system and its limited dynamic range precluded the use of amplitudes co determine the m'lgnitude from body waves over any wide range. To resolve this difficulty an experimentally determined relationship was used to relate the coda on the helicorder to Richter magnitude determined by the Color ado School of Mines at its Bergen Park Observatory. This method has been found to work well in the magnitude range of events recorded at Bergen Park. It is recognized that serious problems exist in extrapolating this relationsl1ip to the very small magnitude event::;, and the magnitudes in the range below zero should be considered approximate only. The experim:=ntally determined relationship is illustrated in figure 2.
Approximate epicenters were obtained by measuring the time difference between stations STK and WI and plotting the epicenter using the appropriate scale (fig. 1). These two stations are on the long axis of the active zone and most of the earthquakes occur between them. Seismic events occurring at the same time at both stations are located on the line midway between the two stations; events o:::curring early at WI would be closer to the W·-"ll. Earthquakes whose arrival time was 0. 75 second or more early at station WI were considered anomalous and accurate locations were determined as rapidly as possible from the magnetic-tape recording system.
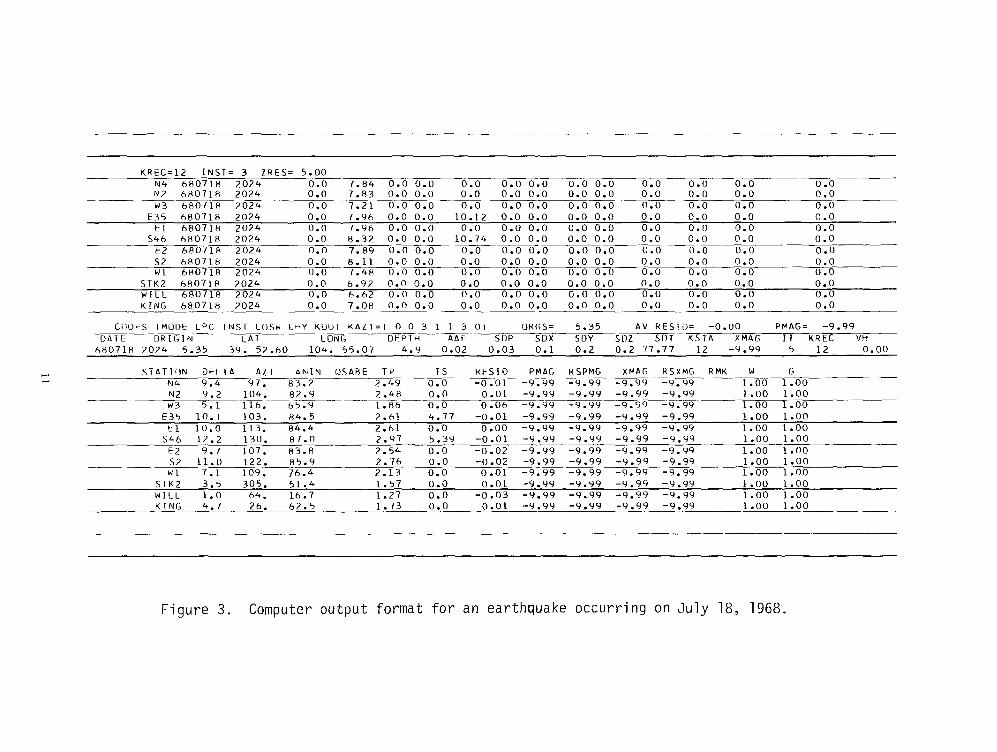
Precise hypocenter locations were obtained by reproducing the earthquakes recorded on magnetic tape onto an expanded time base photogra]hic record and timing each arrival to 0.01 sec. The arrival times for each event were then introduced into a computer program developed by J. P. Eaton, and a least squares fit obtained to the data. Average time residuals were less than +0.01 sec and most residuals were within +0.03
3
sec. A typical output from this program is shown in figure 3. This event occurred at 20 hours, 24 minutes, ~.3=J sec GMT on July 18, 1968.
RJ:;SULTS Or TEST
The detailed seismicity observed in the Derby area for the period January 1 to November 15, 1968, was compiled in figure 4. The diagram shows the number of earthquakes observed in each one-quarter-day interval throughout the year. The period of greatest activity was the last quarter of July 15,1968, when 22 ea nhquakes were observed. This relatively large number of events includes the magnitude 3. 3 event at 1 S33 GMT and its aftershock sequence. This is the largest Derby earthquake in 1968. The next two largest earthquakes were a magnitude 2. 9 event which occurred at 1904 GMT July 27 andamagnitude 3.2 event recorded at 1429 GMT on November 2. No large number of aftershocks were noted after these twu later events. !\orm'llly Derby earthquakes of magnitude 3.0 or less do not have a noticeable aftershock sequence.
Prior to pumping, the next highest peak on the seismicity plot occurred on May 6 when nine events occurred in o ho.1rs. Because of this and the otherwise gem.'rally low level of activity during the year, it was decided that l (J events in a 6-hour period would constiwrc anomalous activity and justify a temporary halt in operations.
;\fter the start of the pumping test more than I 0 earthquakes were' recorded in only one 6-hourperiod. On November 14, in .'i hours, 14 small earthquakes occurred, none of which were larger than magnitude I .4. These events occurred 18 days after the termination of the test and during an interval of r c l at i v e quiescence.
Because the average level of activity is not readily seen on the detailed plot of figure 4, a running 10-day average seismicity plot was prepared I fig .. 'i). This diagram 3hows th= n'1mher of earthquakes ir any 1 0-day interval, starting on January I, 1968, and pL>r~cd at the start of the interval (that is, Januaryl-lOwas plotted on January I). A 1 0-day interval was chosen since this was the time span from the start of the pump t(CSt to
termination of the first three cycles ofpumping. It was felt that this might show more clearly any anomalous activity that might be associated with the purrc1ing. A smnother function was obtained, and the acri\·i ty occurring on July 15, although still very definite, ' ·sn't represent such a marked anomaly. The two hi.=~·~ s t levels of activity occurred on Septem her:.::::. and October 28 when .57 and 42 events respectively w c r c· recorded in the 10 days following those dates. ! ~esc·
occurred 19 days and 7 days after the start of rtlc' two major pumping cycles.
The second major phase of the test was sch=duled w start in late September at about the time that the seismic activity was rising to its highest level. The Ceological Survey concludc=d that there was a significant
chance of having to invoke one of the stop criteria if pum;::>ing was resumed during this particularly active period; therefore, on September 20 a postponement of pumping for a period of at least 15 days or until the seismicity reach2d lower I eve Is was requested. On October 17 the Corps of Engineers was informed that the activity was again normal and pumping could b·e resumed.
It was recognized that after June 27, when the visible monitor system wets installed, there was some bias present in the data. This bias was due to the presence of a duplicate monitoring s y s t em, which was watched by many more persons than had been involved in the earlier data acquisition process. Some additional small earthquakes were undoubtedly identified because of the intensive and repeated examination of the records. To determine if this bias was significant, the smaller earthquakes in the sequence were re jeered and only the larger events were considered. This was done using the data on Derby earthquakes provided by the Colorado School of Mines Bergen Park Observatory where the lower limit of sensitivity for Derby shocks is about magnitude 1.0. This also provided an independent estimate of the seismicity pattern that was completely independent of any bias that might be present in our instrumentation and analysis system.
The 1 0-day running average obtained using only the Bergen Park Observatory data is shown in figure 6. Although fewer events were recorded at Bergen Park (a maximum of seven in any I 0-day period), the two seismicity plots correlate remarkably well. We believe that the bias in the later part of our seismicity d.:lta is certainly less than 10 events and probably less than 5 events per 10-day period.
Table 2 lists all of the Derby earthquakes for which reliable hypocenter locations have been obtained by means of the computer program. Only part of the earthquakes prior to April I, 1968, have been located and the list for this p·eriod is incomplete. Most events occurring after April I, 1968, that were large eno•Jgh to provide good signal strength across the array have been located and are listed.
From these data, maps showing the epic~nter locations of the September to November 1968 earthquakes were prepared (figs. 7 and 8). These data show that most of the events occurred in the vicinity of the flood plain of the South Platte River northwest of the we II, but a few also occurred at the arsenal and w·~st of the river. The epicentral zone is similar to the zone described by Healy and others (1966). There is, however, an indication that the majority of earthquakes occurred a few \ilomders to the northwest of the major center obtained in late 1965 and early 1966. This northwestward migration has also been observed by Major and Simon ( 1968).
To compare the pattern of activity prior to the pump test with that during and immedlately after, data fro:n table 2 w'ls used to prepare the histograms in figure 9. In these histograms the numher of events in a given
4
distance interval are plotted against the epicentral distance from station WI. This is approximately the distance from the well and was used for convenience since it is a statistic obtained from the co:n;Juter program.
The distribution of events since September 3, 1968, is broader than that for events that were located during the preceding year and a half. Since early September, earthquakes have occurred both closer to the well (some have been east of the well) and more farther northwest of the well than in the previous IS-month period.
The complete seismicity data from September 1 to November 15, 1968, is included in table 3. This table contains the information obtained during the tesc from the visible monitor in building 25. At no time during pumping operations was it necessary to invoke any of the criteria established for a temporary halt. During nonpumping intervals, a few earthquakes occurred that appeared to be ano:n e~lously close to the well. These events were precisely located from the array data but no,le o:::curred so close to the well that termination of the test w:1s recommended. The magnitude 3 event on November 2 and the 14 events on November 14 o:::curred after termination of the test.
The thermal history of the well has been of interest because of the possibility that a thermal stress triggering mechanism may be contributing to instability in the region. The thermal regime is also of interest for correcting fluid densities in the well bore and for understanding changes in transmissibility in the fluid reservoir due to changes in temperature. The fluid tem,•erature also places practical limitations on the rate of fluid removal by limiting the amount of pressure reductio:~ so as nclt to initiate boiling in the fluid column. In January 1968, a temperature log was run in the well by the Geological Survey in which a 25°C temperature decrease was foJnd in the lower 160 :.'eet of hole. Total depth at that time was 12,000 feet. This temperature inversion was also confirmed in work by Ball Bros. Research Corp. in June 1968. This relatively large temperature inversion is due to the injection of 165 mmion gallons of cold waste fluid into the reservoir during operations from January i 962 to February 1966. Because the test pumping program was drawing hot fluids fro:n the reservoir into the chilled region immediately aro:.md the well1 we were interested in determining the amount of wetrming at the bottom. On November 10, 1968, 2 weeks after the test was terminated, a temperature log was run by Schlumherger Well Service Co:npany. This log is shown in figure 10, along with the log originally run in September 1961, 2 days after the lower liner was cemented. The most recent log agrees within the measuring accuracy with the log ob:ained in January 1968, except in the region of the temperature inversion. The bottom of the hole, 11,991 feet, w:1s found to have warmed up l2°F; most of this wets a result of the pumping.
Preliminary analysis of the fluids pumped from the well indicated that very little mixing of the injected
waste fluid with connate water had occurred (R. L. Wershaw, written commun., 1968). These conclusions were based ;Jrincipally o,1 radium and lithium analyses. Complete results will be reported when the an.:tlyses are finished.
ACKNOWLEDGMENTS
We wish to acknowledge the cooperation and assistance of the Colorado School o<' Mines throughout this investigation. Particular thanks go to Maurice Major and Ruth Simon for making a~1aila'1le som2· of their Be:cgen Park data arJd for much fruitful discussion. We extend our appreciation to the Corps of Engineers for financial support during the past years and during the test program. The valuable assistance of J amt~S Zeltinger and Lou Gustafson, Corps of Engineers representatives on site during the test, W'!S greatly appreciated. These two individuals were of particular service to as in the fluid 3am;:>ling program during their long vigils at the well site. We extend our appreciation for helpful advice and additional equipment to our Survey colleagues in Menlo Park, Calif., specifically J. P. Eato,l, W. H. Jackson, and John Roller.
5
We would like to acknowledge the assist an:: e of Rhoda Robinson, Penny Miller, A. C. Austin, Don Peterson, R. F. Schoenfeld, Dolores W~lson, and Tom Davison, who conscientiously spent many hours, often late at night, peering at the slowly revol~vlng recording drum. To these people goes much credit for the success of the operations during the test program.
REFERENCES CITED
Healy, J. H., and others, 1966, Geophysical and geological investigations relating to earthquakes in the Denver area, Colorado: U.S. Geol. Survey open-file report.
1968, The Denver earthqJakes: Science, v. --y()T, no. 3848. Major, Maurice, and )imon, Ruth, 1968, A seismic
study of the Den·;er [Derby] earthquakes: Colorado School of Mines Quart., v. 63, no. 1.
van Poo1len, 1-1. K., 1969, RockyMountainArsenalwell pumping tests, 1968: U.S. ArmyC:orpsofEngineers, Omaha District.


FIGURES l-10 AND TABLES 2, 3

esrK_
';<.Q2__",,/":;(/ ________ . ---::: ---,1 -........ 1~osec I
/ • 't::, • • • • el
W3 WI Nl N2 E35 E6 I J eEz
1
,~~y~ / : ~ , ," eEl
1
( , i esl :
I I J
" I ' J
. DERBY,] LJ
ROCKY MOUNTAIN :I
~ 1 I ~,
I
ARSENAL
L_- --------------
I 0 lmi - I 0 lkm -=--::-.-=-
.546
EXPLANATION
ARSENAL WELL
• RECORDING SITE
SINGLE COMPONENT
• RECORDING SITE
THREE COMPONENT
1------+-APPROXIMATE FAULT TRACE
8 TIME SCALE WI- STK
Figure 1. Location map of seismic stations used during the test program showing the time difference for arrivals between stations STK and Wl.
9
4.
3.
w Q =>
2.
1--,.... z 0
(!) <(
~ I.
0.
-I. 2 5 10 20 50 100 200
CODA LENGTH, mm (RECORDING SPEED I mm PER SEC )
Figure 2. Empirical relationship between magnitude and coda.
KREC=12 INST= 3 ZRES= 5.00 N4 680718 2024 o.o 7.84 o.o o.o o.o o.o o.o o.o o.o o.o o.o o.o o.o 1\12 680718 2024 o.o 7.83 o.o o.o o.o o.o o.o o.o o.o o.o o.o o.o o.o W3 680718 ;>024 o.o 7.21 o.o o.o o.o o.o o.o o.o o.o o.o o.o o.o o.o
E35 680718 2024 o.o 7.96 o.o o.o 10.12 o.o o.o o.o o.o o.o o.o o.o o.o E1 680718 2024 o.o 7.96 o.o o.o o.o o.o o.o o.o o.o o.o o.o o.o o.o
S46 680718 2024 o.o 8.32 o.o o.o 10.74 o.o o.o o.o o.o o.o o.o o.o o.o E2 6807111 2024 o.o 7.89 o.o o.o o.o o.o o.o o.o o.o o.o o.o o.o o.o S2 680718 2024 o.o 8. 11 o.o o.o o.o o.o o.o o.o o.o o.o o.o o.o o.o W1 680718 2024 o.o 7.48 o.o o.o o.o o.o o.o o.o o.o o.o o.o o.o o.o
STK2 680718 2024 o.o 6.92 o.o o.o o.o o.o o.o o.o o.o o.o o.o o.o o.o WILL 680718 2024 o.o 6.62 o.o o.o o.o o.o o.o o.o o.o o.o o.o o.o o.o KING 680718 2024 o.o 7.08 o.o o.o o.o o.o o.o o.o o.o o.o o.o o.o o.o
CODES (MODE LPC INST LOSW LHY KOUT KAZ)=( 0 0 3 3 0) ORGS= 5.35 AV RESTO= -o.oo PMAG= -9.99 DATE ORIGIN LAT LONG DEPTH AAF SOP SDX SDY soz SDT KS TA XMAG I I KR EC VH
680718 2024 5.35 39. 52.60 104. 55.07 4.9 0.02 0.03 0.1 0.2 0.2 77.77 12 -9.99 5 12 o.oo
STATION DELTA AZI AN IN OS ABE TP TS KESID PMAG RSPMG XMAG RSXMG RMK w G N4 9.4 97. 83.2 2.49 o.o -0.01 9.99 -9.99 -9.99 -9.99 1. 00 1.00 N2 9.2 104. 82.9 2.48 o.o o.o1 -Y.99 -9.99 -9.99 -9.99 1.00 1.00 W3 5. 1 116. 65.9 1.116 o.o 0.06 9.Y9 -9.Y9 9.99 -9.99 1.00 1.00
E35 10.1 103. 84.5 2.61 4. 77 -0.01 -9.99 -9.99 -9.99 -9.99 1.00 1.00 E1 10.0 113. 84.4 2.61 o.o o.oo Y.99 -9.99 9.99 -9.99 1. 00 1.00
546 12.2 130. 87.0 2.97 5.39 -0.01 -9.YY -9.99 -9.99 -9.99 1.00 1.00 E2 9.7 107. 83.8 2.54 o.o -o.o2 -9.Y9 -9.99 -9.99 -9.99 1.00 1.00 S2 11.0 122. 85.9 2.76 o.o -o.o2 -9.99 -9.99 -9.99 -9.99 1.00 1.00 W1 7.1 109. 76.4 2.13 o.o 0.01 -9.Y9 -9.99 -9.99 -9.99 1.00 1.00
STK2 3.5 305. 51.4 1.57 o.o o.o1 -9.99 -9.99 -9.99 -9.99 1.00 1.00 WILL 1.0 64. 16.7 1.27 o.o -0.03 -9.99 -9.99 -9.99 -9.99 1.00 1.00 KING 4.7 26. 62.5 1. 73 o.o o.o1 -9.Y9 -9~99 -9.99 -9.99 1.00 1.00
Figure 3. Computer output format for an earthquake occurring on July 18, 1968.

10-
8-
6-
><t 0
4-
2 ~,II J, !1~1 U ,IJ U 1,1(11,1,, ,~;~d:~~ j 0: w CL
en 20-w :X: <t :::> 0 I r-0: <t w
IJ.._
0
0: w (IJ
:2 :::> z 10-
8-
6-
4-
Figure 4. 1968 6-hour seismicity data.
12

OCTOBER NOVEMBER
Figure 4.--Continued.
13

60-
V)
~ 0
Q
~ "' "'
~ Ill ::!< 10 ::> z
1968 DERBY SEISMICITY
Figure 5. 1968 10-day average seismicity.
~ a: 4.
~ "' i z.
z
1968 DERBY SEISMICITY BERGEN PARK DATA
Figure 6. 1968 Bergen Park 10-day average seismicity.

0 0
~------------------
0
0 0
ROCKY MOUNTAIN
ARSENAL
---===='-ilo ___ l mi
1•--==0,.__.1 km
\ I I I I I I I I I I I I I I I I I I I I I I I
EXPLANATION
ARSENAL WELL
0
EARTHQUAKE EPICENTER
SEPTEMBER 1968
Figure 7. Map of earthquake epicenters for September 1968.
15

0
------------------ \
ROCKY MOUNTAIN
ARSENAL
---="----""o ___ l mi
-.L-==:::0'--_1 km
\ I I I I I I I I I I I I I I I I I I I I I I
EXPLANATION
ARSENAL WELL
0
EARTHQUAKE EPICENTERS
OCT.- NOV. 1968
Figure 8. Map of earthquake epicenters for October 1 to November 4, 1968.
16

CJ)
w ~ <X :::> 0 :c I-a: <X 15 w lL 0 10
a:: w 5 CD ~ .:::> z
15
APRIL- DEC. 1967
JAN. -AUG. 1968
SEPT.-NOV. 1968
mc»mmmmmmmmmm ....:oo.....:f\in~ldc.rir-.:a>m I I I 1 I I I I I. I I I. -=oo-=C\if'()vl.('ju:>r-..:mm
EAST I WEST
DISTANCE RANGE FROM STATION WI, km
Figure 9. Histogram showing distance of earthquakes from station Wl.
17

0 0 0 )(
ILL
I 1-a... w
2
4
6
8
0 10
12
~NOV. 10> 1968
SEPT. 4> 1961 ~
100 200 300
TEMPERATURE , DEGREES F
Figure 10. Temperature logs observed in the injection disposal well on September 4, 1961 and November 10, 1968.
18

Table 2.-Hypocenters for some Derby earthquakes occurring during 1967 and 1968
Depth Distance from Date Origin Time Latitude Longitude (kilometers) Wl (kilometers)
h m s 67 01 01 09 17 06 39 52.18 104 54.29 5.3 5.8
67 01 02 20 02 09 51.22 52.90 3.7 3.6
67 01 03 12 59 38 53.18 55.52 5.0 8.1
67 01 05 04 30 41 51.55 54.48 5.7 5.9
67 01 10 05 07 48 51.85 52.85 4.8 3.7
67 01 12 22 36 54 52.02 50.76 5.4 1.3
67 01 13 01 15 18 51.71 55.00 4.0 6.6
67 01 .13 15 33 27 52.88 51.66 6.9 3.4
- 67 01 14 08 19 22 51.94 53.67 6.8 4.8 '!:)
67 01 15 02 09 24 51.74 56.11 5.0 8.2
67 01 17 21 24 46 50.89 50.94 3.0 0.8
67 01 18 10 40 57 51.90 55.15 3.3 6.9
67 01 18 16 47 54 51.86 53.78 4.6 5.0
67 01 20 11 19 07 51.51 53.35 5.9 4.3
67 01 20 17 12 14 52.59 54.42 2.6 6.2
67 01 21 16 26 47 50.75 50.71 3.1 1.2
67 01 22 10 44 33 52.38 53.19 7.0 4.4
67 01 24 20 06 45 51.12 51.50 5.4 1.7
67 01 24 20 09 34 51.04 51.47 2.9 1.7
67 01 25 09 30 25 51.01 54.86 6.4 6.5
67 01 25 04 20 22 51.61 54.29 7.6 5.6

Table 2. -Hypocenters for SOJJ,le Derby earthguakes occurring during 1967 and 1968--Continued
Depth Distance from Date Origin Time Latitude Longitude (kilometers) W1 (kilometers)
h m s 67 01 25 12 23 05 39 51.95 104 51.53 ·5. 9 2.0
67 01 29 23 34 25 51.83 54.88 7.2 6.5
67 02 02 01 53 38 52.60 52.95 6.5 4.3
67 02 03 05 27 59 52.31 55.51 5.8 7.5
67 02 03 05 34 13 52.44 52.75 6.1 3.9
67 02 03 05 37 05 52.83 54.22 6.9 6.1
67 02 03 05 39 30 52.17 52.74 6.1 3.7
67 02 03 05 42 40 52.41 52.67 6.8 3.8
67 02 03 05 43 22 51.19 51.59 6.3 1.8
tv 67 02 03 06 13 22 51.78 52.58 6.4 3.3 :::>
67 02 03 06 31 41 51.56 52.29 4.6 2.8
67 02 05 19 53 12 51.70 50.64 5.7 0.7
67 04 10 22 12 01 52.31 53.35 4.5 4.6
67 04 10 22 51 26 53.31 54.83 5.0 7.3
67 04 11 18 20 30 52.58 53.80 4.7 5.4
67 04 11 18 20 38 53.07 54.94 5.4 7.2
67 04 11 18 56 13 53.07 54.77 9.0 7. 0
67 04 13 21 53 10 52.50 53.49 5.8 4.7
67 04 14 06 47 14 52.30 53.64 6.1 5.0
67 04 14 07 12 58 51.82 54.11 5.4 5.4
67 04 14 20 25 01 52.08 54.10 5.1 5.5
67 04 14 12 54 50 52.38 53.55 5.6 4.9
67 04 14 20 27 08 52.09 53.93 5.3 5.3

Table 2.-Hypocenters for some Derby earthquakes occurring during 1967 and 1968-Continued Depth Distance from
Date Origin Time Latitude Longitude (kilometers) Wl (kilometers) h m s
67 04 14 21 36 01 39 52.50 104 54.04 5.7 5.7
67 04 14 23 16 24 52.92 53.61 4.3 5.4
67 04 15 00 15 38 51.96 53.99 5.1 5.3
67 04 15 00 55 58 53.00 53.82 4.0 5.8
67 04 15 09 18 24 53.19 54.21 4.5 6.4
67 04 15 09 19 49 53.52 54.34 4.7 6.9
67 04 15 13 08 34 53.12 54.39 5.0 6.6
67 04 15 22 35 29 52.44 53.61 5.9 5.0
67 04 16 00 20 40 53.10 54.08 4.4 6.2
N 67 04 16 11 29 23 52.81 54.19 5.5 6.1 ......
67 04 16 14 07 46 53.69 54.48 4.4 7.3
67 04 17 08 44 02 52.58 53.89 4.9 5.5
67 04 18 13 43 14 53.09 53.76 4.4 5.8
67 04 20 12 14 17 52.94 53.76 4.6 5.7
67 04 20 14 04 03 52.31 53.29 6.8 4.5
67 04 20 23 31 15 52.92 54.50 4.8 6.6
67 04 21 12 03 28 52.77 53.59 5.1 5.3
67 04 22 02 40 16 52.24 54.47 4.6 6.1
67 04 29 08 31 27 52.01 53.71 5.1 4.9
67 04 29 09 29 44 52.94 53.51 4.2 5.3
67 04 29 16 00 44 52.31 54.80 5.2 6.6
67 04 30 03 02 01 52.17 54.02 5.6 5.4

Table 2. -Hypocenters for some Derby earthquakes occurring during 1967 and 1968--Continued
Depth Distance from Date Origin Time Latitude Longitude (kilometers) Wl (kilometers)
h m s 67 05 02 16 29 39 39 52.21 104 53.78 5.1 5.1
67 05 03 11 20 09 51.51 50.52 5.9 0.3
67 05 03 11 53 57 52.03 53.61 4.8 4.8
67 05 03 13 27 59 52.06 54.06 6.3 5.4
67 05 05 21 21 28 52.06 52.43 6.4 3.2
67 09 09 14 48 55 52.47 53.85 4.5 5.4
67 09 09 14 56 12 52.44 54.40 6.6 6.1 67 09 09 15 13 25 52.22 53.55 5.4 4.8 67 09 09 15 39 49 51.98 54.41 4.9 5.9 67 09 09 15 51 15 52.57 54.95 4.2 6.9 N
N
67 09 09 16 01 28 52.93 55.33 4.1 7.7 67 09 09 16 16 43 52.51 53.09 7.7 4.1 67 09 09 16 16 47 52.27 53.88 5.5 5.3 67 09 09 16 30 06 52.87 54.78 3.2 6.9 67 09 09 17 15 45 53.30 56.30 5.0 9.2 67 09 09 17 26 05 52.92 54.61 3.1 6. 7 67 09 09 17 33 10 52.53 55.05 4.6 7.0 67 09 09 17 35 44 52.84 54.77 3.9 6.8 67 09 09 17 48 21 53.41 57.20 6.1 10.5
67 09 09 19 43 56 52.71 54.22 3.4 6.0
67 09 09 19 47 06 52.82 54.86 3.4 7.0
67 09 09 19 53 16 52.26 54.86 3.8 6.6
67 09 09 20 12 37 52.68 55.00 4.9 7.0

Table 2.-Hypocenters for some Derby earthquakes occurring during 1967 and 1968-Continued
Depth Distance from Date Origin Time Latitude Longitude (kilometers) Wl (kilometers)
h m s 67 09 09 20 53 50 39 52.83 104 54.46 3.2 6.4
67 09 09 20 57 03 51.93 53.97 3.7 5.3
67 09 09 21 07 50 52.83 54.37 3.0 6.3
67 11 14 10 07 49 52.38 53.27 6.5 4.6
67 11 14 10 41 37 52.02 53.30 6.7 4.4
67 11 15 07 10 09 52.23 53.16 6.3 4.3
67 11 15 07 10 14 51.68 52.10 4.7 2.5
67 11 27 05 09 23 53.17 55.35 6.5 7.9
67 12 11 06 50 47 52.16 53.57 7.0 3.8
N 67 12 11 12 30 43.6 51.65 53.77 4.8 3.8 w
67 12 11 12 30 43.7 51.59 53.59 4.7 3.5
67 12 20 06 17 36 53.43 52.90 3.1 5.2
68 02 03 06 53 33 53.64 55.23 4.9 8.1
68 02 05 07 45 35 52.24 53.36 7.0 4.6
68 02 10 08 43 43 52.82 53.71 7.1 5.5
68 02 10 12 44 45 52.57 53.88 6.7 5.5
68 02 13 03 39 20 51.86 50.80 5.8 1.1
68 02 13 08 25 01 51.98 54.08 6.5 2.9
68 02 18 06 11 57 52.25 54.41 6.2 6.0
68 02 18 23 30 46 52.30 54.25 5.6 5.8
68 02 24 14 06 50 52.69 53.54 4.0 5.2
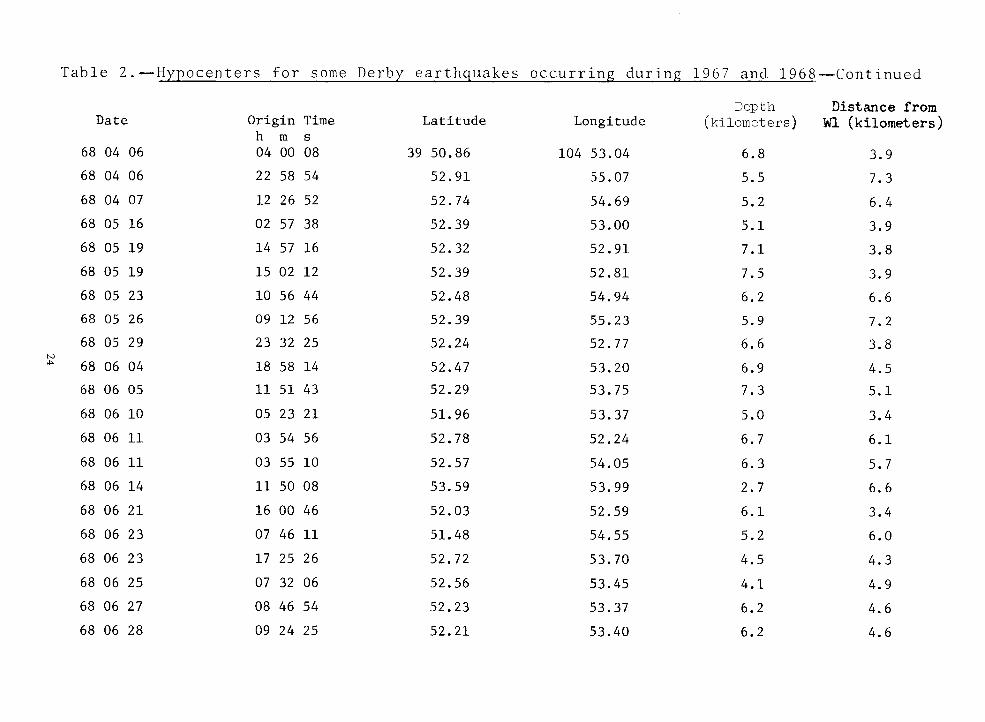
Table 2. -Hypocenters for some Derby earthquakes occurring during 1967 and 1968-Continued
Depth Distance from Date Origin Time Latitude Longitude (kilometers) Wl (kilometers)
h m s 68 04 06 04 00 08 39 50.86 104 53.04 6.8 3.9
68 04 06 22 58 54 52.91 55.07 5.5 7.3
68 04 07 12 26 52 52.74 54.69 5.2 6.4
68 OS 16 02 57 38 52.39 53.00 5.1 3.9
68 OS 19 14 57 16 52.32 52.91 7.1 3.8
68 OS 19 15 02 12 52.39 52.81 7.5 3.9
68 OS 23 10 56 44 52.48 54.94 6.2 6.6
68 OS 26 09 12 56 52.39 55.23 5.9 7.2
68 OS 29 23 32 25 52.24 52.77 6.6 3.8 tv .... 68 06 04 18 58 14 52.47 53.20 6.9 4.5
68 06 OS 11 51 43 52.29 53.75 7.3 5.1
68 06 10 OS 23 21 51.96 53.37 5.0 3.4
68 06 11 03 54 56 52.78 52.24 6.7 6.1
68 06 11 03 55 10 52.57 54.05 6.3 5.7
68 06 14 11 so 08 53.59 53.99 2.7 6.6
68 06 21 16 00 46 52.03 52.59 6.1 3.4
68 06 23 07 46 11 51.48 54.55 5.2 6.0
68 06 23 17 25 26 52.72 53.70 4.5 4.3
68 06 25 07 32 06 52.56 53.45 4.1 4.9
68 06 27 08 46 54 52.23 53.37 6.2 4.6
68 06 28 09 24 25 52.21 53.40 6.2 4.6
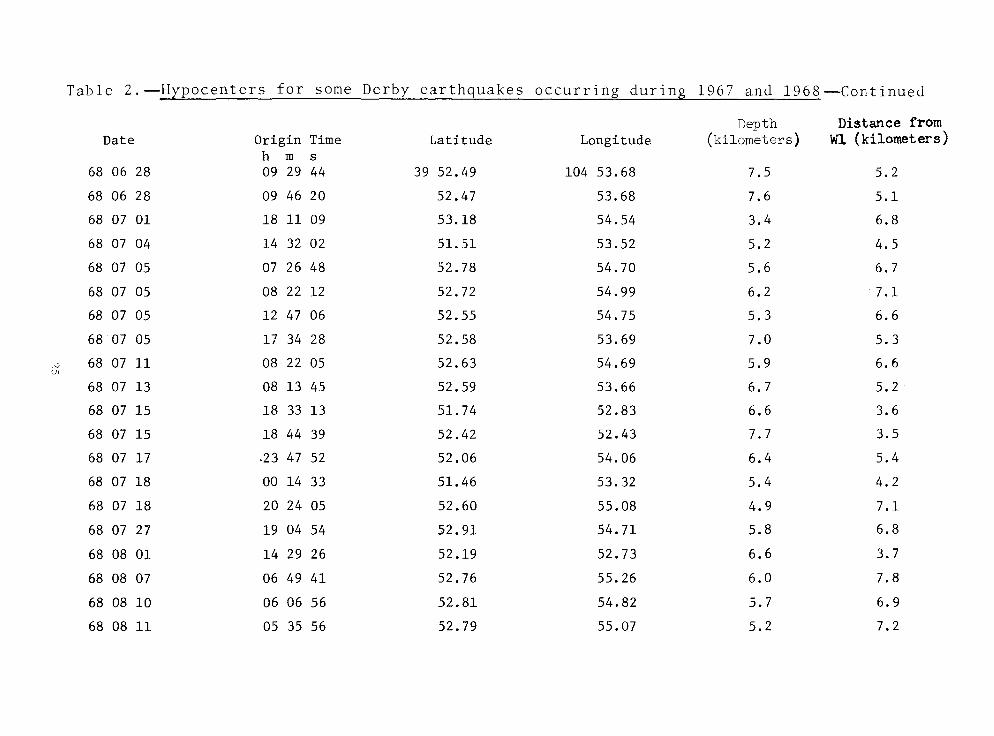
Table 2.-Hypocenters for some Derby earthquakes occurring during 1967 and 19 6 8 -Con t in u e d
Depth Distance from Date Origin Time Latitude Longitude (kilometers) Wl (kilometers)
h m s 68 06 28 09 29 44 39 52.49 104 53.68 7.5 5.2
68 06 28 09 46 20 52.47 53.68 7.6 5.1
68 07 01 18 11 09 53.18 54.54 3.4 6.8
68 07 04 14 32 02 51.51 53.52 5.2 4.5
68 07 05 07 26 48 52.78 54.70 5.6 6.7
68 07 05 08 22 12 52.72 54.99 6.2 7.1
68 07 05 12 47 06 52.55 54.75 5.3 6.6
68 07 05 17 34 28 52.58 53.69 7.0 5.3
''"' 68 07 11 08 22 05 52.63 54.69 5.9 6.6 :Jl
68 07 13 08 13 45 52.59 53.66 6.7 5.2
68 07 15 18 33 13 51.74 52.83 6.6 3.6
68 07 15 18 44 39 52.42 52.43 7.7 3.5
68 07 17 -23 47 52 52.06 54.06 6.4 5.4
68 07 18 00 14 33 51.46 53.32 5.4 4.2
68 07 18 20 24 05 52.60 55.08 4.9 7.1
68 07 27 19 04 54 52.91 54.71 5.8 6.8
68 08 01 14 29 26 52.19 52.73 6.6 3.7
68 08 07 06 49 41 52.76 55.26 6.0 7.8
68 08 10 06 06 56 52.81 54.82 5.7 6.9
68 08 11 OS 35 56 52.79 55.07 5.2 7.2

Table 2. -Hypocenters for some Derby earthquakes occurring during 1967 and 1968-Continued
Depth Distance from Date Origin Time Latitude Longitude (kilometers) Wl (kilometers)
h m s 68 08 14 01 53 24 39 52.73 104 53.19 5.9 4.8
68 08 14 02 03 26 52.75 55.08 6.2 7.2
68 08 25 08 36 40 52.99 55.30 4.8 7.6
68 08 29 04 27 11 52.72 55.12 6.1 7.2
68 08 31 13 58 43 52.44 53.45 6.8 4.8
68 08 31 15 49 09 52.87 53.81 6.6 5.6
68 08 31 20 04 57 52.67 53.42 4.5 5.0
68 08 31 22 03 03 52.87 53.16 3.5 4.9
68 09 01 01 24 46 52.55 53.73 4.0 5.3
"-' 68 09 02 01 26 22 52.47 55.04 4.1 7.0 0'-
68 09 02 02 29 24 52.13 56.85 5.8 9.4
68 09 02 15 09 23 52.87 54.20 4.0 6.1
68 09 04 21 45 30 51.91 53.49 6.6 {1.6
68 09 06 00 29 36 52.60 54.44 3.7 6.2
68 09 06 06 53 40 51.84 52.12 6.0 2.7
68 09 06 06 53 49 51.41 52.44 6.7 3.0
68 09 07 23 so 48 52.19 53.17 6.6 4.3
68 09 08 03 46 09 51.36 52.17 6.7 2.6
68 09 10 19 14 47 53.32 54.24 3.3 6 .. G
68 09 12 OS 02 25 53.56 54.45 5.0 7.1
68 09 13 04 26 36 52.52 54.65 5.8 6.5
68 09 13 04 26 57 52.88 53.96 7.4 5.8

Table 2. -_Hypocenters for some Derby earthquakes occurring during 1967 and 1968-Continued
Depth Distance from Date Origin Time Latitude Longitude (kilometers) '1-.rl (kilometers)
h m s 68 09 16 23 38 31 39 52.67 104 54.66 5.5 6.6
68 09 19 15 48 35 51.92 50.73 5.2 1.1
68 09 23 00 35 40 52.80 53.79 7.0 5.6
68 09 23 01 10 28 52.50 53.92 7.0 5.5
68 09 23 02 36 53 52.44 53.77 7.0 5.2
68 09 23 12 22 48 51.92 54.20 4.8 5.6
68 09 23 14 44 56 51.42 54.00 5.1 5.2
68 09 24 14 51 27 53.41 54.61 5.9 7.1
68 09 24 14 52 18 53.63 54.30 5.7 9.7 '" •J
68 09 25 02 12 00 53.45 54.14 4.8 6.6
68 09 25 08 48 02 52.94 56.03 6.7 8.4
68 09 26 12 26 11 52.02 53.95 5.6 5.3
68 09 27 20 47 01 52.11 55.08 5.6 6.9
68 09 28 03 43 54 51.69 53.45 5.7 4.4
68 09 28 05 48 36 51.56 53.76 5.8 4.9
68 09 28 13 46 26 51.76 53.59 5.8 4.7
68 09 28 16 53 32 52.48 54.72 5.6 6.5
68 09 29 00 38 34 52.97 53.71 4.3 5.6
68 09 29 22 22 47 52.90 55.05 5.9 7.3
68 09 29 22 23 01 52.10 54.72 4.4 6.4
68 10 06 19 51 35 52.96 55.14 5.4 7.4

Table 2 .-Hypocenters for some Derby earthquakes occurring during 1967 and 1968 -Continued
Depth Distance from Date Origin Time Latitude Longitude (kilometers} vn. (kilometers)
h m s 68 10 09 02 11 33 39 52.01 104 52.76 6.9 3.6
68 10 09 06 08 41 52.76 54.66 5.4 6.7
68 10 11 16 19 22 52.54 53.43 6.4 4.9
68 10 13 03 47 22 52.53 55.09 5.0 7.1
68 10 13 13 00 39 52.48 53.55 7.2 5.0
68 10 13 13 01 14 52.74 53.50 7.0 5.1
68 10 14 03 10 42 52.40 53.20 7.t 4.5 tv 00 68 10 13 10 48 13 52.42 53.08 6.5 4.3
68 10 17 13 24 21 52.24 53.01 6.6 4.1
68 10 14 05 01 12 51.13 49.75 4.8 1.0
68 10 30 18 41 05 52.79 53.44 4.3 5.1
68 10 30 18 45 20 52.49 53.65 1/6 5.1
68 10 30 18 27 07 52.61 54.85 5.6 6.8
68 10 30 18 36 35 52.59 54.78 5.1 6.7
68 11 02 14 29 02 51.70 53.65 6.0 4.7
68 11 03 19 28 56 52.56 55.07 6.7 6.7
68 11 02 21 47 13 51.83 52.80 5.8 3.6

Table 3. -Derby earthquakes from Sept. 1 to Nov. 1 5 ' 1968
.:lt(Wl-STK) Date Time GMT ~seconds) Magnitude
September 2 0125 .4 0.0
0228 .8 1.6
0749 -.1 -0.3
1509 . 5 o.o September 3 2208 -.7 -0.5
September 4 0016 -.4 -1.0
0115 .4 -0.1
0346 .4 0.3
0456 .3 -0.2
1900 .3 -0.1
2145 -.2 1.4
September 5 0546 .4 -0.4
2349 .1 -0.3
September 6 0029 . 2 0.3
0211 .4 -0.4
0653 -.7 0.3
0653 -.7 -0.1
2325 noisy trace -0.6
September 7 1604 0.0 -0.5
2350 .5 0.5
September 8 0346 -.5 0.1
0358 . 5 -0.5
September 10 1914 .3 -0.1
2009 .2 0.3
September 12 0503 .4 2.0
1658 0.0 -0.6
September 13 0207 noisy trace -0.5
0355 . 5 -0.7
0426 -.5 0.5
0426 .7 0.7
0720 .1 -0.2
1424 .1 -0.5
29

Table 3. -Derby earthquakes from Sept. 1 to Nov. 15' 1968-Continued
.:lt (Wl-S'I'K) Date Time GMT (seconds) Magnitude
September 14 0947 .1 -0.3
2328 -.4 -0.7
September 16 2257 .3 -0.2
2338 . 5 0.3
September 17 0005 noisy trace -0.3
0614 .1 -0.3
September 19 0452 .3 -0.5
1548 -1.6 0.5
September 20 1003 noisy trace -0.7
September 21 2016 . 5 -0.7
September 22 0720 .5 -0.7
1523 .8 -0.2
September 23 0035 -.1 0.2
0109 0.0 0.7
0111 -.4 -0.5
0112 -.1 -0.4
0112 -.4 -1.0
0112 -.6 0.0
0236 .1 0.3
0826 0.0 -0.3
1222 0.0 0.1
1444 -.3 0.2
September 24 1451 . 7 2.3
1452 .2 1.0
1506 .4 1.7
September 25 0212 . 5 1.6
0848 .4 0.8
1244 0.0 0.0
September 26 0104 -.2 -0.2
0113 -.2 -0.7
0211 0.0 -0.3
1226 .1 0.5
30

Table 3. -Derby earthquakes from Sept. 1 to Nov. 15, 1968-Continued
Llt(Wl-STK) Date Time GMT (seconds) Magnitude
Stiptember 27 2047 0.0 1.0
2306 .1 -0.3
September 28 0343 -.1 0.4
0548 -.1 0.2
0815 0.0 -0.1
1151 noisy trace -0.3
1346 0.0 1.8
1645 0.0 0.0
1645 .3 -0.3
1646 .2 -0.5
1653 .3 0.5
1817 -.2 -0.2
2223 . 2 -0.7
2223 .2 -0.3
2227 0.0 -0.5
2228 -.4 -0.6
2229 noisy trace -1.0
September 29 0038 -.1 1.8
0039 -.1 0.8
0039 -.1 1.6
0113 0.0 -1.0
0120 0.0 -0.1
0607 . 2 0.2
0608 1.6 0.1
1122 noisy trace -0.1
2019 .1 -0.2
2027 noisy trace -0.2
2222 .7 1.0
2223 ,4 1.8
September 30 1420 .1 -1.0
1420 noisy trace -0.3
31

Table 3. -Derby earthquakes from Sept. 1 to Nov. 15' 1968-Continued
Date Time GMT ~t(Wl-STK)
(seconds) Magnitude
October 1 0715 -.4 -0.3
0716 . 7 0.2
0726 STK bad -0.5
0848 .8 -0.3
1721 -.7 -1.0
October 2 0141 -.5 0.8
1901 -.5 .1
October 5 1255 -.3 -.1
1945 .7 .2
October 6 0607 .6 . 7
0659 .6 .2
1951 . 7 1.8
October 8 0405 . 5 1.7
0638 .4 -.6
0825 -.1 -.1
0847 . 4 -1.0
1458 -.1 -.1
1645 -.5 .6
October 9 0210 -.4 1.3
0320 .3 -.7
0321 .3 -.3
0520 .5 -.1
0520 • 6 -.7
0608 .4 .3
October 11 1618 -.1 .2
October 13 0346 . 6 -.7
0536 noisy trace 0.0
1047 -.2 -.3
1048 .3 -.7
1049 .1 -.3
1114 .4 -.3
1300 -.1 1.4
1300 -.2 1.3
1301 0.0 -.3
32

Table 3. -Derby earthquakes from se·pt. 1 to Nov. 1 5 ' 1968-Continued
Date Time GMT .lt(Wl-STK)
{seconds) Magnitude
October 14 0310 -.3 2.0
0500 -1.5 .5
October 15 2214 -.1 . 6
October 17 1323 -.1 . 7
October 19 0359 .5 -0.1
October 20 0236 .5 -.2
0416 -.5 -.3
0416 -.5 -.6
0906 -.5 .1
October 21 0524 -.4 -.7
1814 1.8 .3
October 23 0405 1.1 2.0
October 25 0628 1.0 -1.0 (
October 26 0916 -.6 -.2
1345 .3 -1.0
1537 0.0 -.4
2359 .2 -1.0
October 28 1317 .1 .6
2115 .2 -1.0
2215 0.0 .3
October 29 2258 . 5 -.2
2258 . 2 .1
2259 . 7 -.1
2259 .6 -.1
2300 . 6 -.6
October 30 1826 noisy trace . 7
1835 .5 1.8
1838 .1 -.7
1838 .2 -.1
1844 -.3 . 6
1846 0.0 -.1
1846 .3 -1.0
1846 0.0 .9
33
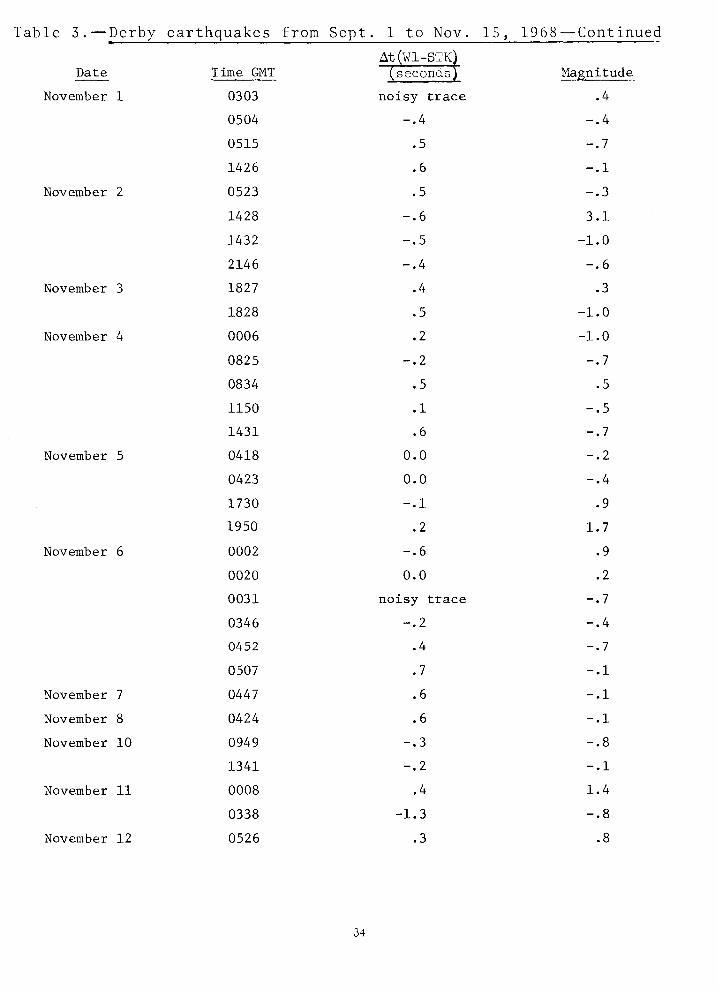
Table 3. -Derby earthquakes from Sept. 1 to Nov. 15' 1968-Continued
Date Time GMT At(Wl-STK)
(secondsJ Magnitude
November 1 0303 noisy trace .4
0504 -.4 -.4
0515 .5 -.7
1426 . 6 -.1
November 2 0523 .5 -.3
1428 -.6 3.1
1432 -.5 -1.0
2146 -.4 -.6
November 3 1827 .4 .3
1828 .5 -1.0
November 4 0006 .2 -1.0
0825 -.2 -.7
0834 . 5 .5
1150 .1 -.5
1431 .6 -.7
November 5 0418 0.0 -.2
0423 0.0 -.4
1730 -.1 .9
1950 .2 1.7
November 6 0002 -.6 .9
0020 0.0 .2
0031 noisy trace -.7
0346 -.2 -.4
0452 .4 -.7
0507 . 7 -.1
November 7 0447 . 6 -.1
November 8 0424 . 6 -.1
November 10 0949 -.3 -.8
1341 -.2 -.1
November 11 0008 .4 1.4
0338 -1.3 -.8
November 12 0526 .3 .8
34

Table 3.--Derby earthquakes from
Date Time GMT
Sept. 1 to Nov.
ilt (Wl-STK) (seconds)
15, 1968---Continued
Magnitude
Change to single channel operation
November 13 0430 -0.5
1041 -0.5
November 14 0905 -.1
1136 .5
1142 -.7
1143 -.7
1214 -.7
1223 -.5
1223 -.5
1224 1.4
1230 .7
1231 -.7
1234 .1
1235 -1.0
1240 -.7
1342 -.8
INTERI(J;:,>- "t.OLOGICAL SURVEY, WASHINGTON. D.C.-i969
35
