seismic assessment and rehabilitation of a rc structure
TRANSCRIPT

Seismic Assessment and Rehabilitation of a RCStructure Under Mainshock-Aftershock SeismicSequences Using Beam-Column Bonded CFRPStrategyOmid Karimzade Soureshjani
Kharazmi UniversityGholamreza Nouri ( [email protected] )
Kharazmi University Faculty of Engineering https://orcid.org/0000-0002-2936-599X
Research Article
Keywords: Seismic rehabilitation, Beam-column bonded strategy, CFRP, Mainshock-aftershock, Seismicsequences, Nonlinear time-history analysis
Posted Date: November 2nd, 2021
DOI: https://doi.org/10.21203/rs.3.rs-1026929/v1
License: This work is licensed under a Creative Commons Attribution 4.0 International License. Read Full License

Seismic assessment and rehabilitation of a RC structure under mainshock-
aftershock seismic sequences using beam-column bonded CFRP strategy
Omid Karimzade Soureshjani, Ph.D. Candidate of Structural Engineering, Kharazmi University
Postal address: Kharazmi University, No.43, Dr. Mofatteh Ave., Tehran, IRAN
ORCID iD: https://orcid.org/0000-0003-4310-0194
Gholamreza Nouri, Ph.D. Asst. professor of Structural Engineering, Kharazmi University
Postal address: Kharazmi University, No.43, Dr. Mofatteh Ave., Tehran, IRAN
ORCID iD: https://orcid.org/0000-0002-2936-599X
Corresponding author: Gholamreza Nouri
Email address: [email protected], Telephone: +98 21 88830891
ABSTRACT
A mainshock is usually accompanied by a group of ground motions. In many design codes, the effects of
the seismic sequences have been neglected or underestimated. Aftershocks can increase structural damage
or even cause failure. The current study evaluated the seismic behavior of a rehabilitated and as-built RC
structure under real scaled mainshock-aftershocks using nonlinear analysis. Verification was done in two
modes. The inter-story drift ratio, maximum residual, and relative displacements were studied. The seismic
study of the as-built structure showed that the residual displacement grew, on average, more than 90%
under the mainshock-aftershock sequence compared to the mainshock-only record. A beam-column bonded
CFRP rehabilitation strategy using six layers of T-700 CFRP was chosen based on the specific performance
level. The strategy showed the ability to transfer the plastic strain from the columns to the beams, which
could be considered as a change from a weak column-strong beam concept to a strong column-weak beam
concept. Compared to the as-built structure under the seismic sequences, the rehabilitated structure showed
an average growth of 78% in the first-story drift ratio, which was significant. Unlike the as-built structure,
seismic sequences caused no growth drift in the rehabilitated structure. It also was observed that the ratio
of aftershock PGA to mainshock PGA could have an intensive effect on the seismic behavior of both
rehabilitated and as-built structures.
Keywords: Seismic rehabilitation, Beam-column bonded strategy, CFRP, Mainshock-aftershock, Seismic
sequences, Nonlinear time-history analysis.

1. Introduction
The strain energy stored in active fault systems is not completely released with a single rupture. In many cases, the
strain energy remaining in the fault system could cause repetitive ground motions (aftershocks) at brief intervals
(Hatzivassiliou and Hatzigeorgiou, 2015; Amadio et al., 2003). Aftershocks can increase structural damage or even
cause building collapse (García and Negrete-Manriquez, 2011). However, in many structural seismic design codes,
the ground motions are considered as a single event and the effect of the aftershocks is underestimated (Moustafa and
Takewaki, 2011).
When considering the effect of aftershocks (seismic sequences) in seismic areas, a multi-level design
approach for the design of structures has been suggested by Di Sarno (2013). Their study investigated the effect of
seismic sequences on the inelastic behavior of a reinforced concrete (RC) frame. The results showed that the seismic
sequences could be affect the behavior of the RC frame. Li et. al (2014) studied the collapse probability of steel
buildings under mainshock-aftershock records, the effect of fault types, and some features of the mainshock-aftershock
records. They reported that aftershocks could have a higher peak ground acceleration (PGA), energy content, and even
longer duration than the corresponding mainshocks. The study also found that, during a strong mainshock, the collapse
capacity of a structure could strongly decrease, meaning that structural collapse would be likely under even a weak
aftershock.
Ruiz-García (2012) assessed the characteristics of mainshock-aftershock ground motions by considering 184
real seismic sequences. The effects of real mainshock-aftershocks on the seismic responses of buildings was
investigated. The study found that the predominant period of the mainshock was longer than the corresponding
aftershock. Furthermore, the seismic behavior of the structures under real seismic sequences was completely different
from that under artificial seismic sequences.
Ji et al. (2020) introduced the λ-index, which is defined as the ratio of the maximum structural residual
displacement under a mainshock to the structural damage under an aftershock. This study performed nonlinear seismic
analysis using more than 200 seismic sequences and a single degree of freedom (SDOF) model to determine the λ-
index. They proposed an equation for this index to predict structural damage under seismic sequences. Massumi et al.
(2021) studied the effect of sequential ground motions (mainshock-aftershock) considering both vertical and
horizontal components of two RC moment-resisting structures. The increase of the probability of failure or damage
was presented in this study.

In many seismic design codes, chiefly in regions with modest seismicity, such as central Europe, earthquake
hazards have been downgraded (Dazio and Bachmann, 2000). Observation of the effect of strong ground motions
such as in Kobe, Japan (1995) and Northridge, CA (1994) on structures which were designed according to the available
seismic design codes have led to basic revisions in seismic design provisions (Venture, 2000). It has been
recommended to upgrade the seismic performance of existing structures designed according to previous seismic design
codes using a new generation of design codes using reliable methods such as rehabilitation strategies (Meitz, 1998).
Considering the trade-off between required strength, cost, application ease, weight reduction, and corrosion
resistance, rehabilitation using FRP is an ideal strategy (Hassan and Rizkalla, 2002; Chajlani and Hussain, 2015).
Seismic rehabilitation of beam-column joints using FRP laminates was investigated by Ghobarah and Said (2001).
Their experimental study contained a full-scaled RC moment-resisting frame tested under cyclic loading. The results
showed that the FRP laminates increased the shear capacity and that flexural hinges formed in the beam connections.
Wang et al. (2016) studied the flexural behavior of 16 members filled with CFRP. The results showed that
the stiffness and moment capacity of the models improved remarkably. CFRP and steel core corporate with each other
perfectly in both transverse and longitudinal directions. The authors presented an equation to calculate the flexural
capacity of these kinds of members. Cabral-Fonseca et al. (2018) investigated the durability of concrete joints bonded
with FRP sheets. The seismic behavior of six RC columns was investigated and compared with five columns
strengthened with FRP sheets in the body and anchors. The moment capacity of the strengthened columns showed
remarkable improvement (Del Rey Castillo et al., 2018). The rehabilitation of existing RC structures using FRP sheets
and wood and the strengthening of wooden beams using CFRP laminates were studied by Grazide et al. (2020) and
İşleyen et al. (2021), respectively. Both studies experimentally and numerically showed that the initial stiffness and
ultimate loading capacity improved with the use of FRP or CFRP laminates.
In previous studies on seismic rehabilitation using CFPR or FRP laminates, most attention has been paid to
the structural members (beam or column), connections (beam-column) and SDOF models. The effect of seismic
sequences, which are probable events in seismic zones, has not been considered or has been neglected. There also has
been a lack of seismic rehabilitation studies on multi-story structures and seismic sequences.
The focus of the current study was the rehabilitation and seismic behavior of a multi-story RC structure under
seismic sequences. This study investigates the effect of the seismic sequences on an RC structure and proposes a
rehabilitation strategy (beam-column bonded CFRP) according to the specific performance level. The sufficiency of

the proposed rehabilitation strategy also has been assessed. The seismic behavior of the rehabilitated structure also
was compared with an as-built structure under seismic sequences to determine whether or not the performance of a
rehabilitated structure under a mainshock-aftershock sequence is similar to that under the mainshock.
The effect of the seismic sequences in rehabilitated structures either has been neglected or underestimated by
the engineering community and seismic design codes. This study provides a good perspective for the investigation of
the seismic performance and sufficiency of rehabilitated RC structures using CFRP under seismic sequences.
2. Analyzed frame
The target structural model was the frame of a 6-story RC moment-resisting structure. The model was designed
according to an outdated Italian provision that does not contain a seismic design code (Regio Decreto Leggne, 1939).
Fig. 1 shows that the frame model has three bays with lengths of 4.5 m, 2 m and 4.5 m. The frame comprises three
types of columns and one type of beam in both the short and tall models. The story height was 2.75 m in the first story
and 3 m in the other stories (Calvi et al., 2002). The compressive strength of the concrete and yield strength of the
steel longitudinal and shear rebars were 20 MPa and 380 MPa, respectively. The loads applied to the frames during
analysis included the frame self-weight, live load, and earthquake forces.
Fig. 1. Details of the studied model
3. Numerical modeling
3.1. Behavior model for concrete
The compressive behavior of the concrete was calculated using the Mander concrete stress-strain relation in Eqs. (1)
to (3) (Mander et al., 1988). The tensile stress-strain curve was defined according to the model of Carreira and Chu

(1986). In this case, the yield stress was set at 7.5√𝑓′𝑐 psi where 𝐸 is the modulus of elasticity, 𝑓′𝑐 is the concrete
compressive strength, 𝜀′𝑐 is the concrete strain at 𝑓′𝑐 and 𝜀 is the concrete strain.
𝑓 = 𝑓′𝑐𝑋𝑟𝑟 − 1 + 𝑋𝑟 (1)
𝑋 = 𝜀𝜀′𝑐 (2)
𝑟 = 𝐸𝐸 − (𝑓′𝑐𝜀′𝑐 ) (3)
3.2. Steel rebar behavior model
The engineering stress-strain behavior of the rebars was calculated (Eqs. (4) to (6)) using the Ramberg and Osgood
(1943) model. This behavior model can be used to approximate the stress-strain curve of material if the yield strength,
ultimate strength, elastic modulus, and rupture strain are known. All of these values were readily available in this
study. In order to consider the change in the cross-section area and provide a more accurate behavior model for steel
rebars under loading, the true stress-strain curve was calculated using the engineering curve and Eqs. (7) and (8) (Beer
et al., 2013), where 𝑓𝑢 and 𝑓𝑦 are the ultimate and yield strengths, respectively, 𝜎 is the stress, 𝜀 is the strain, 𝜀𝑟 is the
rupture strain, 𝑛 is the material-dependent constant, 𝜎𝑡𝑟𝑢𝑒 and 𝜀𝑡𝑟𝑢𝑒 are the true stress and strain, respectively.
𝜀 = 𝜎𝐸 + 0.002 (𝜎𝐸)𝑛 (4)
𝑛 = 𝐿𝑛 (𝜀𝑢𝑠0.2)𝐿𝑛 (𝑓𝑢𝑓𝑦) (5)
𝜀𝑢𝑠 = 100 ∗ (𝜀𝑟 − 𝑓𝑢𝐸 ) (6)
𝜎𝑡𝑟𝑢𝑒 = 𝜎 ∗ (1 + 𝜀) (7) 𝜀𝑡𝑟𝑢𝑒 = 𝐿𝑛(1 + 𝜀) (8)
4. Finite element implementation
The proposed structure was modeled in ABAQUS software. The concrete damage plasticity model was used to define
the concrete behavior. This model is based on the assumption of isotropic damage and is an analytical model used for
the analysis of materials with concrete-like properties and behavior in which the intended material is subject to
arbitrary loads, such as cyclic loads (Dassault Systèmes, 2017). This model has the ability to consider the interaction
between the rebars and concrete (as in RC structures). Nonlinear implicit time-history analysis was employed based
on the unconditionally stable Hilber Hughes Taylor (HHT) method, with appropriate time increments and a full
Newton-Raphson solution (Dassault Systèmes, 2017; Hilber et al., 1977; Hibbitt and Karlsson, 1979).
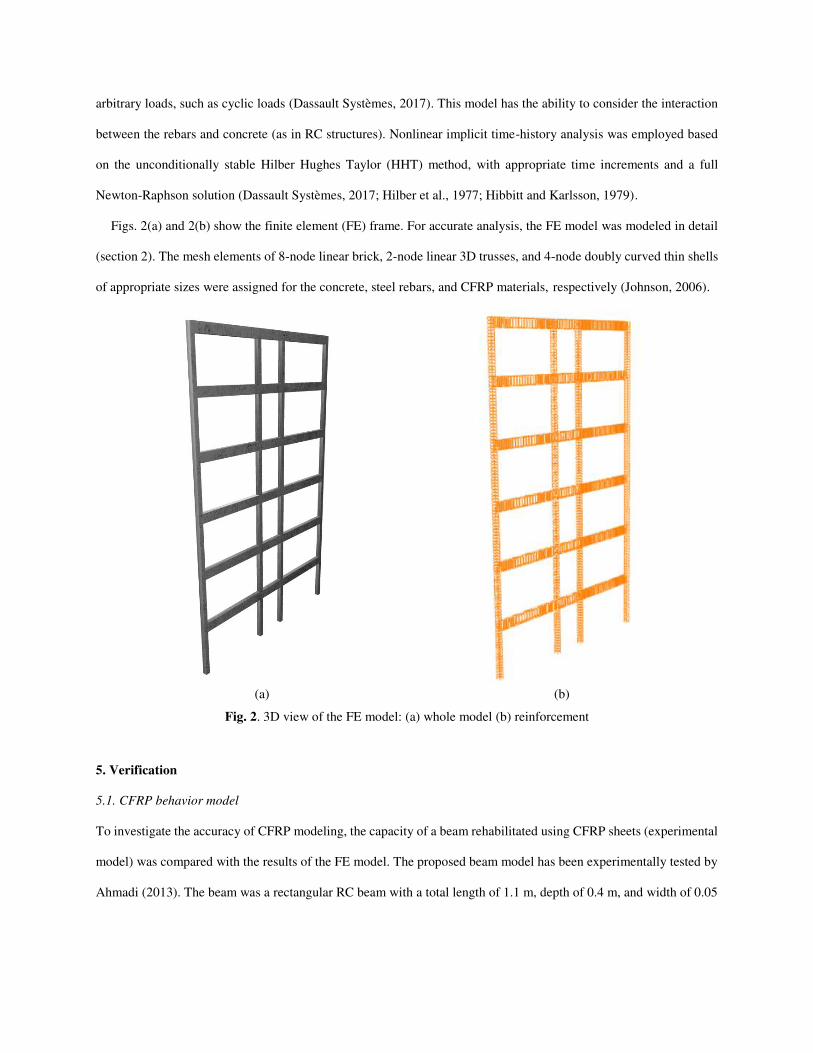
Figs. 2(a) and 2(b) show the finite element (FE) frame. For accurate analysis, the FE model was modeled in detail
(section 2). The mesh elements of 8-node linear brick, 2-node linear 3D trusses, and 4-node doubly curved thin shells
of appropriate sizes were assigned for the concrete, steel rebars, and CFRP materials, respectively (Johnson, 2006).
(a) (b)
Fig. 2. 3D view of the FE model: (a) whole model (b) reinforcement
5. Verification
5.1. CFRP behavior model
To investigate the accuracy of CFRP modeling, the capacity of a beam rehabilitated using CFRP sheets (experimental
model) was compared with the results of the FE model. The proposed beam model has been experimentally tested by
Ahmadi (2013). The beam was a rectangular RC beam with a total length of 1.1 m, depth of 0.4 m, and width of 0.05

m. The concrete was M30 with a yield strength of 335 MPa. Support plates were placed at each end of the beam and
the effective length of the beam was 0.8 mm. Figs. 3(a) and 3(b) show the geometry of the beam model.
(a)
Fig. 3. The beam model scheme: (a) the geometry and details (b) elevation view
The shear failure mode was considered as the dominant failure mode and the shear cracks expand at 45° (Parry,
2004). An orthogonal pattern was used for the CFRP at a 45° angle to the horizon. The FE models of the proposed
beam model in both unrehabilitated and rehabilitated states are shown in Figs. 4(a) and 4(b), respectively. The total
number of mesh elements were 1703 and 19421 for the unrehabilitated and rehabilitated models, respectively. The
CFRP sheets were applied to both sides of the rehabilitated beam.
(a) (b)
Fig. 4. FE model of the beam: (a) un-rehabilitated (b) rehabilitated
The capacity curves of the models were obtained by applying a concentrated load at the mid-span of the beam and
increasing it monotonically. Fig. 5 shows the capacity curves (load-displacement) of the experimental and FE models.
The areas under capacity curves (absorbed energy) were calculated and compared. The unrehabilitated and
rehabilitated FE models showed a difference of 4.48%, and 1.86% compared to the corresponding experimental
models. This indicates that there was good agreement between the experimental and FE models.
11ϕ6

(a) (b)
FE model (this study) Experimental model
Fig. 5. Capacity curves: (a) un-rehabilitated (b) rehabilitated 5.2. Seismic analysis
To verify the nonlinear behavior of the structural model, it was analyzed under the Loma Prieta (1989) ground motion
using time-history analysis (Table 1). In this regard, the maximum relative displacement of the FE model was
compared with the results of the Calvi et al. (2002) for the same record. Fig. 6 shows that there was good agreement
between diagrams on the both the negative and positive sides.
Table 1. Details of the Loma Prieta ground motion
Event Station Year Magnitude (Mw)
Loma Prieta Hollister Differential Array 1989 6.9
FE model (this study) Calvi, G. M. et al. (2002)
Fig. 6. Comparison of maximum relative displacement ]
6. Mainshock-aftershock records
Seven real scaled mainshock-aftershock ground motion records were chosen to investigate the effect of seismic
sequences on the rehabilitated and as-built frames (Ruiz-Garcia, 2012; Pacific Earthquake Engineering Research
0 1 2 3 4 5
0
50
100
150
200
Strain
Str
ess (
MP
a)
0 2 4 6 8
0
50
100
150
200
250
Strain
Str
ess (
MP
a)
-20 -10 0 10 20
0
1
2
3
4
5
6
Displacement (cm)
Sto
ry N
o.

Centre, 2011; Wang et al., 2018). The aftershocks (seismic sequences) were selected using the seismic declustering
method using space-time history (Hainzl et al., 2010). For comprehensive and accurate analysis, seismic sequences
with different ranges of magnitude, PGA values and aftershock PGA to mainshock PGA ratios were chosen. Table 2
and Fig.7 show the details and time history records of the intended ground motions, respectively. For purposes of
reasonable comparison, the PGAs of the mainshocks were scaled to 0.4g (3.92 m/s2). The aftershocks were adjusted
using their corresponding mainshock PGA scale coefficient. The acceleration time-history records of seismic
sequences for the Kozani, Mammoth Lakes, Cape Mendocino, Imperial Valley, Whittier Narrows, Northridge, and
Coalinga records were multiplied by coefficients of 1.96, 0.94, 0.60, 1.22, 0.93, 0.46, and 3.29, respectively. A five-
second interval with zero acceleration between the mainshock and aftershock records was testing using trial and error
to ensure that the structure did not vibrate.
Table 2. Details of the mainshock-aftershock ground motions
Event Station Year Type Magnitude (𝐌𝐰)
Kozani Kozani 1995
Mainshock 6.40
Aftershock 5.30
Mammoth Lakes Convict Creek 1980
Mainshock 6.06
Aftershock 5.70
Cape Mendocino Petrolia 1992
Mainshock 7.01
Aftershock 6.60
Imperial Valley El Centro Array #4 1979
Mainshock 6.53
Aftershock 5.01
Whittier Narrows LA-Obregon Park 1987
Mainshock 5.99
Aftershock 5.27
Northridge Rinaldi 1994
Mainshock 6.69
Aftershock 5.28
Coalinga Coalinga-14th 1983
Mainshock 5.09
Aftershock 4.89

(a) (b)
(c) (d)
(e) (f)
(g)
Fig. 7. Scaled mainshock-aftershock acceleration records: (a) Kozani (b) Mammoth Lakes (c) Cape
Mendocino (d) Imperial Valley (e) Whittier Narrows (f) Northridge (g) Coalinga
7. Numerical investigation and discussion
7.1. Seismic behavior of as-built structure
0 10 20 30 40 50
-4
-3
-2
-1
0
1
2
3
4
Time (s)
Acce
lera
tion
(m
/s2)
0 10 20 30 40 50
-4
-3
-2
-1
0
1
2
3
4
Time (s)
Acce
lera
tion
(m
/s2)
0 20 40
-4
-3
-2
-1
0
1
2
3
4
Time (s)
Acce
lera
tion
(m
/s2)
0 20 40 60
-4
-3
-2
-1
0
1
2
3
4
Time (s)
Acce
lera
tion
(m
/s2)
0 20 40
-4
-3
-2
-1
0
1
2
3
4
Time (s)
Acce
lera
tion
(m
/s2)
0 10 20 30
-4
-3
-2
-1
0
1
2
3
4
Time (s)
Acce
lera
tion
(m
/s2)
0 10 20 30 40 50
-4-3-2-10123456
Time (s)
Acce
lera
tion
(m
/s2)

The top story displacement of the as-built structure under the mainshocks (section 6) was recorded. On average,
aftershocks caused a 92.8% growth in the residual displacement compared to the mainshock only, which is remarkable.
This means that the aftershocks caused almost as much of an increase in the residual displacement as did the
mainshocks. For example, under the Cape Mendocino seismic sequence, the residual displacement increased from 9.1
cm for the mainshock alone to 18.5 cm for the mainshock-aftershock. Structural damage caused by the mainshock
affected the growth of residual displacement under the aftershocks. This indicates that the consideration of seismic
sequences for this type of structure could be vital.
The drift ratio is a fundamental structural parameter used for the seismic assessment of a structure (Yang et al.,
2010). The drift ratio of the as-built structures under the mainshock and mainshock-aftershock ground motions (section
6) were calculated and are shown in Fig. 8. Table 3 presents some seismic data about the as-built structure.
Table 3. Seismic behavior data of the as-built structure under seismic sequences
1 2 3 4 5 6 7
Event
Top story relative
displacement
under Mainshock
(cm)
Top story relative
displacement under
Mainshock-
aftershock (cm)
Growth of 3
compared to
2▲ (%)
Mainshock-
aftershock top
drift ratio (%)
Story with
the most
drift ratio*
Drift ratio
growth (%)
Kozani 28.1 35.1 24.99 1.97 1 10.19
Mammoth Lakes 27.0 27.2 0 1.52 1 20.11
Cape Mendocino 23.3 25.6 8.66 1.40 1 17.30
Imperial Valley 20.1 20.2 0 1.12 1 0
Whittier Narrows 28.4 28.7 0 1.57 1 38.46
Northridge 22.2 25.4 13.63 1.40 1 15.77
Coalinga 26.7 48.2 84.61 2.70 1 43.60
▲ Growth= 𝑐𝑜𝑙𝑢𝑚𝑛 (3)−𝑐𝑜𝑙𝑢𝑚𝑛 (2)𝑐𝑜𝑙𝑢𝑚𝑛 (2) * Story with the most drift ratio under mainshock. Drift ratio growth (%),
showing the growth of the story with the most drift ratio under mainshock-aftershock (column 6), compared to drift
ratio of the same story considering solely the mainshock

(a) (b)
(c) (d)
(e) (f)
(g)
Mainshock Mainshock-aftershock
Fig. 8. Mainshock and mainshock-aftershock drift ratio: (a) Kozani (b) Mammoth Lakes (c) Cape Mendocino
(d) Imperial Valley (e) Whittier Narrows (f) Northridge (g) Coalinga
Table 3 and Fig. 8 indicate that the aftershocks primarily increased the drift ratio in the lower stories. The highest
drift ratios occurred in stories 1, 2, and 3, respectively. These stories experienced the most damage (plastic strain)
under the mainshock, but the aftershocks caused a dramatic increase in the drift ratio in these stories. On the contrary,
0 1 2 3 4 5
0
1
2
3
4
5
6
Drift ratio (%)
Sto
ry N
o.
0 1 2 3 4 5
0
1
2
3
4
5
6
Drift ratio (%)
Sto
ry N
o.
0 1 2 3 4 5
0
1
2
3
4
5
6
Drift ratio (%)
Sto
ry N
o.
0 1 2 3 4
0
1
2
3
4
5
6
Drift ratio (%)
Sto
ry N
o.
0 1 2 3 4 5
0
1
2
3
4
5
6
Drift ratio (%)
Sto
ry N
o.
0 1 2 3 4
0
1
2
3
4
5
6
Drift ratio (%)
Sto
ry N
o.
0 1 2 3 4 5
0
1
2
3
4
5
6
Drift ratio (%)
Sto
ry N
o.

in stories 5 and 6, the seismic sequences caused no remarkable increase in drift ratios because there was very little
damage, plastic strain, or complete elastic behavior under the mainshock. Stories 5 and 6 under the Northridge
mainshock, for example, showed no remarkable drift ratio growth).
In the FEMA pre-standard and commentary for the seismic rehabilitation of buildings, a drift ratio of 2% is
considered to be the life safety limit (LS) for concrete frames (Federal Emergency Management Agency, 2000). As is
clear in Fig. 8, the structure experienced drift ratios of more than 2% (3.33% on average in the first story) under all
mainshocks in the lower floors. These high drift ratios could cause structural instability; therefore, a rehabilitation
strategy was chosen and was assessed (section 7.2). The maximum and minimum ranges and average drift ratios under
the mainshock and mainshock-aftershock records are shown in Fig. 9.
Mainshock Mainshock-aftershock
Fig. 9. Maximum, minimum ranges, and average value of drift ratios
7.2. Seismic rehabilitation strategy
An effective seismic rehabilitation strategy should decrease the undesirable effect of seismic loading and improve the
seismic performance in a structure in accordance with its performance level (limit state). For each case, several
efficient strategies can be suggested, each having advantages and disadvantages. These include steel/concrete shear
walls, infill concrete panels, steel bracing, active and passive structural control systems, and FRPs (El-Sokkary and
Galal, 2009; Kurata et al., 2012; Hollaway, 2014; Ghobarah, Abou Elfath, 2001; Syrmakezis et al., 2006).
Fig. 10 shows the plastic strain magnitude of a structure under the Imperial valley mainshock-aftershock. Plastic
behavior formed predominantly in the columns and beam-column connections, which represents the weak column-
0 1 2 3 4 5
123456123456
Drift ratio (%)
Sto
ry N
o.

strong beam concept (Ye et al., 2010). This concept relates to the type of structural design in which the model
experiences high drift, chiefly in the lower floors under lateral loading (section 7.1). In this case, the seismic
rehabilitation of the structure was done using the beam-column bonded T700-CFRP sheet strategy. This strategy can
transfer the plastic strain from the columns to the beams (strong column-weak beam concept), which sharply decreased
the drift ratio under seismic or lateral loading. Table 4 shows the mechanical properties of the T700-CFRP sheets
(Hassan et al., 2018; Toray Composite Materials America Inc., 2020). T700 CFRP sheets are generally used to increase
the load-carrying capacity and stiffness of building, bridges, silos, chimneys, and similar structures (Toray Composite
Materials America Inc., 2020).
Table 4. T700-CFRP mechanical property
Mechanical property Value
Thickness 1.02mm
Density 1800kg/m3
Filament Diameter 7µm
𝐄𝐱 132GPa
𝐄𝐲 10.3GPa
𝐄𝐳 10.3GPa
𝛖𝐱𝐲 0.25
𝛖𝐲𝐳 0.38
𝛖𝐱𝐳 0.25
𝐆𝐱𝐲 6.5GPa
𝐆𝐱𝐳 6.5GPa

𝐆𝐲𝐳* 3.73GPa
𝐓𝐱 2100MPa
𝐓𝐲 24MPa
𝐓𝐳 65MPa
𝐂𝐱 1050MPa
𝐂𝐲 132MPa
𝐂𝐳 132MPa
𝐒𝐱,𝐲,𝐳 75MPa
∗ 𝐺 = 𝐸2(1 + 𝜐)
where 𝐸 is the Young’s modulus, 𝜐 is the Poisson’s ratio, 𝐺 is the shear modulus, 𝑇 is the tensile strength, 𝐶 and 𝑆
are the compressive strength and the shear strength respectively.
Fig. 10. The as-built structure plastic strain magnitude under Imperial Valley mainshock-aftershock
Table 5 shows the drift ratio limits according to performance levels of immediate occupancy (IO) and LS (Federal
Emergency Management Agency, 2000). The IO performance level was chosen as the target performance level for

the seismic rehabilitation. The Imperial Valley mainshock was considered to determine the required length (𝐿𝑒) and
thickness (number of layers 𝑛) of the CFRP sheets. The rehabilitation strategy and drift ratio of the structure (under
mainshock) before and after rehabilitation (as-built and rehabilitated models) are shown in Figs. 11(a) and 11(b),
respectively. Using trial-and-error, six layers of T700 CFRP were used for the rehabilitated structure and the inter-
story drift ratio was less than 1% in all the stories (IO performance level).
Table 5. IO and LS performance levels drift ratio limitation of RC structures
Structure
Drift ratio limitation (%)
IO LS
Concrete frame 1.0 2.0
Concrete wall 0.5 1.0
(a) (b)
Mainshock (as-built)
Mainshock (rehabilitated)
Fig. 11. Rehabilitation strategy: (a) place of CFRP sheets (b) drift ratio under Imperial valley ground motion
0 1 2 3 4
0
1
2
3
4
5
6
Drift ratio (%)
Sto
ry N
o.

The effective length (𝐿𝑒) of the CFRP sheets were calculated using Eq. (9), as proposed by the ACI (American
Concrete Institute, 2008). The 𝐿𝑒 is the length required at which the FRP strain fell to zero (Fig. 12(a) and (b)), where 𝑛 is the number of layers (six, in this study), 𝐸𝑓 is the elastic modulus in MPa (𝐸𝑥, in this study) and 𝑡𝑓 is the thickness
of the FRP sheets in mm (1.02 mm according to Table 4).
𝐿𝑒(𝑚𝑚) = 23300(𝑛𝐸𝑓𝑡𝑓)0.58 (9)
(a) (b)
Fig.12. FRP/CFRP effective length: (a) concrete and FRP/CFRP scheme (b) strain curve through the
effective length
7.3. Seismic behavior of rehabilitated structure
The seismic behavior of a rehabilitated structure under mainshock and mainshock-aftershock records was studied. As
stated, the chosen rehabilitation strategy provides the possibility of the formation of plastic strain in the beams instead
of the columns, which can substantially decrease the drift ratio and relative displacement under seismic loading. The
plastic strain magnitude of the beam-column connection on the fifth story under the Imperial Valley mainshock is
shown in Fig. 13. It can be seen that rehabilitation allowed the plastic strains to be transferred from the column and
the beam-column connections to the beam elements, which is desirable seismic behavior (strong beam-week column
concept). It can be concluded that the proposed rehabilitation strategy was sufficient.
(a)
(b)
Fig. 13. Plastic strain magnitude of story five beam-column connection: (a) rehabilitated (b) as-built

Fig. 14 and Table 6 show the drift ratios and structural seismic behavior data, respectively, for the
rehabilitated structure under mainshocks and mainshock-aftershocks. The mean drift ratios of the as-built model under
mainshocks and mainshock-aftershocks are shown in Fig. 13. This parameter was less than 1% (IO performance level)
under all mainshocks; therefore, the proposed rehabilitation strategy can be considered valid and sufficient.
The choice of the IO performance level for rehabilitation resulted in structural damage (plastic strain) values
that were not remarkable under the mainshocks, even in the lower floors. Except for the Coalinga seismic sequence,
the drift ratios did not increase under the mainshock-aftershock or seismic sequences in comparison with the
mainshocks only. In this case study, the seismic sequences had little effect on the seismic behavior of the rehabilitated
structure; thus, the aftershocks may not be deterministic. However, the aftershocks had an intensive effect on the
seismic behavior of the as-built structures and caused an increase in relative displacement that was equal to that of the
mainshocks under all selected seismic sequences.
Table 6. Seismic behavior data of the rehabilitated frame under seismic sequences
1 2 3 4 5 6 7
Event
Top story relative
displacement
under Mainshock
(cm)
Top story relative
displacement under
Mainshock-
aftershock (cm)
Growth of
3 compared
to 2▲ (%)
Mainshock-
aftershock top
drift ratio (%)
Story with
the most
drift ratio*
Drift ratio
growth
(%)
Kozani 11.1 11.1 0.0 0.65 2 0.0
Mammoth Lakes 15.8 15.8 0.0 0.89 3 0.0
Cape Mendocino 14.3 14.3 0.0 0.80 2 0.0
Imperial Valley 10.3 10.3 0.0 0.58 2 0.0
Whittier Narrows 8.7 0.87 0.0 0.49 2 0.0
Northridge 7.9 7.9 0.0 0.44 2 0.0
Coalinga 10.4 18.7 79.8 1.05 2 77.0
▲ Growth= 𝑐𝑜𝑙𝑢𝑚𝑛 (3)−𝑐𝑜𝑙𝑢𝑚𝑛 (2)𝑐𝑜𝑙𝑢𝑚𝑛 (2) * Story with the most drift ratio under mainshock. Drift ratio growth (%);
showing the growth of the story with the most drift ratio under mainshock-aftershock (column 6), compared to drift
ratio of the same story considering solely the mainshock

(a) (b)
(c) (d)
(e) (f)
(g)
Mainshock (rehabilitated) Mainshock-aftershock (rehabilitated)
Mean mainshock (as-built) Mean mainshock-aftershock (as-built)
Fig. 14. Mainshock and mainshock-aftershock drift ratios of the rehabilitated frame: (a) Kozani (b) Mammoth Lakes (c)
Cape Mendocino (d) Imperial valley (e) Whittier narrows (f) Northridge (g) Coalinga
Except for the Coalinga mainshock-aftershock, the ratio of the aftershock PGA to mainshock PGA for the
other seismic sequences was less than 1 (𝑃𝐺𝐴𝑎𝑃𝐺𝐴𝑚 ⩽ 0.91). For the Coalinga seismic sequence, the ratio was 1.62, which
was remarkable and unlikely. For rehabilitated structures, the Coalinga aftershock was the only case that showed a
0 1 2 3 4 5
0
1
2
3
4
5
6
Drift ratio (%)
Sto
ry N
o.
0 1 2 3 4 5
0
1
2
3
4
5
6
Drift ratio (%)
Sto
ry N
o.
0 1 2 3 4 5
0
1
2
3
4
5
6
Drift ratio (%)
Sto
ry N
o.
0 1 2 3 4 5
0
1
2
3
4
5
6
Drift ratio (%)
Sto
ry N
o.
0 1 2 3 4 5
0
1
2
3
4
5
6
Drift ratio (%)
Sto
ry N
o.
0 1 2 3 4 5
0
1
2
3
4
5
6
Drift ratio (%)
Sto
ry N
o.
0 1 2 3 4 5
0
1
2
3
4
5
6
Drift ratio (%)
Sto
ry N
o.
growth in the damage (plastic strain), residual displacement, and drift ratio in comparison with only the mainshock.
This could be the main reason behind the different seismic behaviors shown by the structures under this seismic
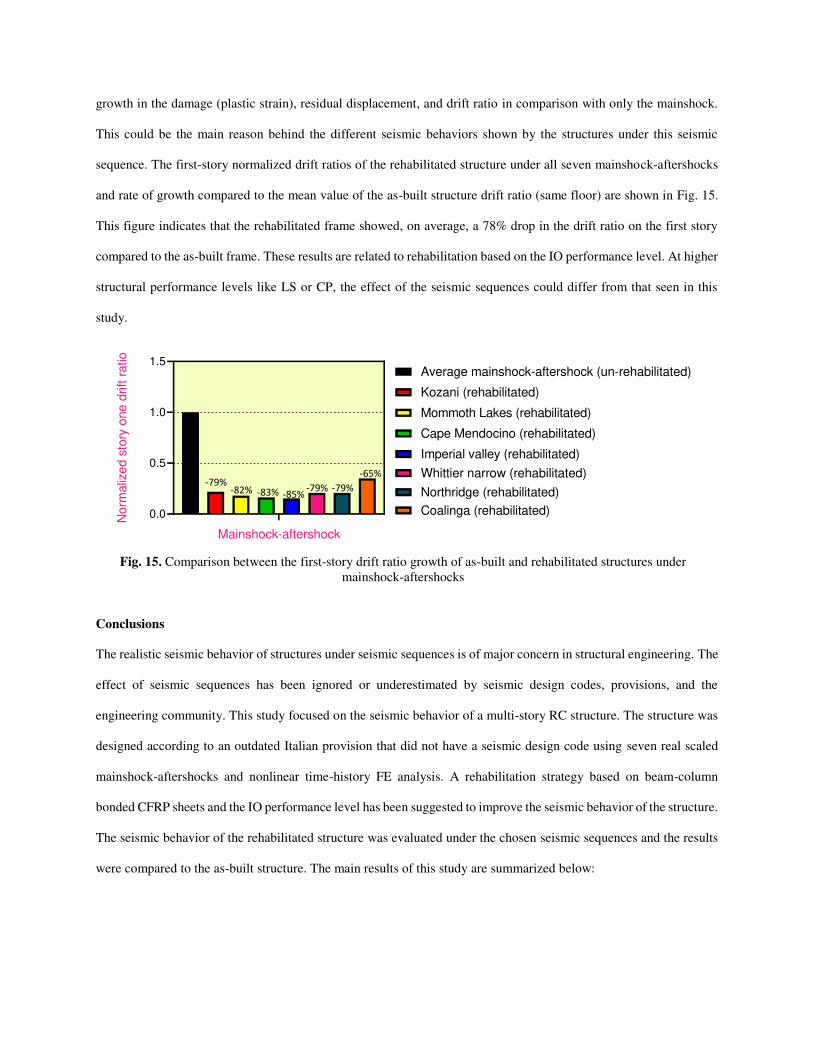
sequence. The first-story normalized drift ratios of the rehabilitated structure under all seven mainshock-aftershocks
and rate of growth compared to the mean value of the as-built structure drift ratio (same floor) are shown in Fig. 15.
This figure indicates that the rehabilitated frame showed, on average, a 78% drop in the drift ratio on the first story
compared to the as-built frame. These results are related to rehabilitation based on the IO performance level. At higher
structural performance levels like LS or CP, the effect of the seismic sequences could differ from that seen in this
study.
Fig. 15. Comparison between the first-story drift ratio growth of as-built and rehabilitated structures under
mainshock-aftershocks
Conclusions
The realistic seismic behavior of structures under seismic sequences is of major concern in structural engineering. The
effect of seismic sequences has been ignored or underestimated by seismic design codes, provisions, and the
engineering community. This study focused on the seismic behavior of a multi-story RC structure. The structure was
designed according to an outdated Italian provision that did not have a seismic design code using seven real scaled
mainshock-aftershocks and nonlinear time-history FE analysis. A rehabilitation strategy based on beam-column
bonded CFRP sheets and the IO performance level has been suggested to improve the seismic behavior of the structure.
The seismic behavior of the rehabilitated structure was evaluated under the chosen seismic sequences and the results
were compared to the as-built structure. The main results of this study are summarized below:
1
0.0
0.5
1.0
1.5
Mainshock-aftershock
Norm
aliz
ed s
tory
one d
rift r
atio
Kozani (rehabilitated)
Mommoth Lakes (rehabilitated)
Cape Mendocino (rehabilitated)
Imperial valley (rehabilitated)
Whittier narrow (rehabilitated)
Northridge (rehabilitated)
Coalinga (rehabilitated)
Average mainshock-aftershock (un-rehabilitated)
-79% -82% -83% -85%
-79% -79%
-65%

1. The results of the analysis show that the seismic sequences had an intensive effect on the seismic behavior
of the structures. On average, the top residual displacement and first-story drift ratio increased about 90%
and 21%, respectively, under the mainshock-aftershock compared to mainshock only.
2. The beam-column bonded CFRP rehabilitation strategy demonstrated good performance for improving the
seismic behavior of the structure. The plastic strain contours indicated that the strategy transmitted plastic
strains from the columns and beam-column connections to the beams, which can be considered as the strong
column-weak beam concept. This sharply decreased the relative displacements of the stories.
3. According to the seismic behavior of the rehabilitated frame, unlike the as-built structure, aftershocks caused
no increase in the drift ratio of any of the stories, except under the Coalinga mainshock-aftershocks. This
implies that it may not be necessary to consider seismic sequences for IO-based rehabilitation under the
average aftershocks. The first-story drift ratios of the rehabilitated structure showed, on average, a 78%
decrease compared to the as-built frame.
4. The ratio of aftershock PGA to mainshock PGA is a determinative parameter in the seismic behavior of the
structures under seismic sequences. The only aftershock that increased the drift ratio in the rehabilitated
structure was the Coalinga mainshock-aftershock. The aftershock PGA to mainshock PGA for this event was
1.62, which is unusual. This ratio for the other six seismic sequences was less than 0.91. This may be the
reason for the different seismic behaviors of the rehabilitated frames under the Coalinga mainshock-
aftershock.
5. Overall, in rehabilitation based on the IO performance level, the level of the damage under mainshocks was
slight or negligible, aftershocks (or the use of seismic sequences) caused no remarkable increase in the
relative displacement, residual displacement, drift ratio, plastic strain, and so on. This indicates that the effect
of the seismic sequences can be ignored in these types of rehabilitated structures.
These conclusions relate to an RC structure with rehabilitation based on the IO performance level under seven
mainshock-aftershock sequences. More studies and analyses are required at different performance levels and different
types of structures.
Declarations
Ethical statements (The developed method is the original effort of the authors which is not submitted or published
elsewhere)
Funding (This research was not funded by any funding bodies)

Conflict of interest/Competing interests (The Authors declare that they have no conflict of interest)
Availability of data and material (Data and material are available)
Code availability (The developed codes are available)
Plant reproducibility (Not applicable)
Clinical trials registration (Not applicable)
Gels and bolts/ Image manipulation (Not applicable)
High-risk content (Not applicable)
Acknowledgment (There is no acknowledgment)
References
Ahmadi M (2013) Analysis of rehabilitation effect on the improvement capacity of reinforced concrete beams with
FEM. Procedia Engineering 54: 327-340.
Amadio C, Fragiacomo, M and Rajgelj, S (2003) The effects of repeated earthquake ground motions on the non‐linear
response of SDOF systems. Earthquake engineering & structural dynamics 32-2: 291-308. doi:
https://doi.org/10.1002/eqe.225.
American Concrete Institute (ACI) (2008) Guide for the design and construction of externally bonded FRP systems
for strengthening concrete structures. Farmington Hills, USA.
Beer FP, Johnston R, Dewolf, J and Mazurek D (2013) Mechanics of Materials. New York, USA, McGraw-Hill.
Cabral-Fonseca S, Correia JR, Custódio J, Silva HM, Machado AM and Sousa J (2018) Durability of FRP-concrete
bonded joints in structural rehabilitation: A review. International Journal of Adhesion and Adhesives 83: 153-167.
doi: https://doi.org/10.1016/j.ijadhadh.2018.02.014.
Calvi GM, Magenes G and Pampanin S (2002) Relevance of beam-column joint damage and collapse in RC frame
assessment. Journal of Earthquake Engineering 6-01: 75-100. doi: https://doi.org/10.1080/13632460209350433.
Carreira DJ and Chu KH (1986) Stress-strain relationship for reinforced concrete in tension. In Journal Proceedings
83-1: 21-28.
Chajlani J and Hussain A (2015) Application of FRP in concrete structures. International Journal of Engineering
associates 4-8: 50-51
Dazio A and Bachmann H (2000) State of the seismic design and detailing of buildings with RC structural walls in
Europe. In: Proceeding of the 12th world conference on earthquake engineering. No. 526.

Del Rey Castillo E, Griffith M and Ingham J (2018) Seismic behavior of RC columns flexurally strengthened with
FRP sheets and FRP anchors. Composite Structures 203: 382-395. doi:
https://doi.org/10.1016/j.compstruct.2018.07.029.
Di Sarno L (2013) Effects of multiple earthquakes on inelastic structural response. Engineering Structures 56: 673-
681. doi: https://doi.org/10.1016/j.engstruct.2013.05.041.
El-Sokkary H and Galal K (2009) Analytical investigation of the seismic performance of RC frames rehabilitated
using different rehabilitation techniques. Engineering structures 31-9: 1955-1966. doi:
https://doi.org/10.1016/j.engstruct.2009.02.048.
Federal Emergency Management Agency (2000) Commentary for the seismic rehabilitation of buildings (FEMA356).
Prestandard F. E. M. A. Washington, USA.
Ghobarah A and Abou Elfath H (2001) Rehabilitation of a reinforced concrete frame using eccentric steel bracing.
Engineering structures 23-7: 745-755. doi: https://doi.org/10.1016/S0141-0296(00)00100-0.
Ghobarah A and Said A (2001) Seismic rehabilitation of beam-column joints using FRP laminates. Journal of
earthquake engineering 5-01: 113-129. doi: https://doi.org/10.1080/13632460109350388.
Grazide C, Ferrier E and Michel L (2020) Rehabilitation of reinforced concrete structures using FRP and wood.
Construction and Building Materials 234: 117716. doi: https://doi.org/10.1016/j.conbuildmat.2019.117716.
Hainzl S, Steacy S and Marsan, D (2010) Seismicity models based on Coulomb stress calculations. Report,
Community Online Resource for Statistical Seismicity Analysis. doi: https://doi.org/10.5078/corssa-32035809.
Available at http://www.corssa.org.
Hassan SA, Santulli C, Yahya MYB, Gang CL and Abu BMN (2018) The potential of biomimetics design in the
development of impact resistant material. FME Transactions 46-1: 108-116. doi:
https://doi.org/10.5937/fmet1801108H.
Hassan T and Rizkalla S (2002) Flexural strengthening of prestressed bridge slabs with FRP systems. PCI journal 47-
1: 76-93.
Hatzivassiliou M and Hatzigeorgiou, GD (2015) Seismic sequence effects on three-dimensional reinforced concrete
buildings. Soil Dynamics and Earthquake Engineering 72: 77-88. doi:
https://doi.org/10.1016/j.soildyn.2015.02.005.

Hibbitt HD and Karlsson BI (1979) Analysis of pipe whip, Report No. EPRI-NP—1208. Hibbitt and Karlsson
Inc.
Hilber HM, Hughes TJ and Taylor RL (1977) Improved numerical dissipation for time integration
algorithms in structural dynamics. Earthquake Engineering & Structural Dynamics, 5-3: 283-292.
https://doi.org/10.1002/eqe.4290050306.
Hollaway LC (2014) Using fibre-reinforced polymer (FRP) composites to rehabilitate differing types of metallic
infrastructure. In: Rehabilitation of Metallic Civil Infrastructure Using Fiber Reinforced Polymer (FRP)
Composites. Cambridge, United Kingdom. Woodhead Publishing, pp: 323-372
İşleyen ÜK, Ghoroubi R, Mercimek Ö, Anıl Ö, Togay A and Erdem RT (2021) Effect of anchorage number and CFRP
strips length on behavior of strengthened glulam timber beam for flexural loading. Advances in Structural
Engineering. doi: https://doi.org/10.1177/1369433220988622.
Ji D, Wen W, Zhai C and Katsanos EI (2020) Maximum inelastic displacement of mainshock-damaged structures
under succeeding aftershock. Soil Dynamics and Earthquake Engineering 136: 106248. doi:
https://doi.org/10.1016/j.soildyn.2020.106248.
Johnson S (2006) Comparison of nonlinear finite element modelling tools for structural concrete. Urbana Champaign,
University of Illinois, US.
Kurata M, Leon RT, DesRoches R and Nakashima M (2012) Steel plate shear wall with tension-bracing for seismic
rehabilitation of steel frames. Journal of constructional steel research 71: 92-103. doi:
https://doi.org/10.1016/j.jcsr.2011.10.026.
Li Y, Song R and Van De Lindt JW (2014) Collapse fragility of steel structures subjected to earthquake mainshock-
aftershock sequences. Journal of Structural Engineering 140-12: 04014095. doi:
https://doi.org/10.1061/(ASCE)ST.1943-541X.0001019.
Lie-ping YE, Qian-li MA and Zhi-wei MIAO (2010) Study on weak beam-strong column design method of RC frame
structures. Engineering Mechanics 2-12: 102-113. doi: https://doi.org/10.6052/j.issn.1000-4750.2009.05.0320.
Mander JB, Priestley MJ and Park R (1988) Theoretical stress-strain model for confined concrete. Journal of structural
engineering 114-8: 1804-1826. doi: https://doi.org/10.1061/(ASCE)0733-9445(1988)114:8(1804).

Massumi, A, Sadeghi K, and Ghaedi H (2021). The effects of mainshock-aftershock in successive earthquakes on the
response of RC moment-resisting frames considering the influence of the vertical seismic component. Ain Shams
Engineering Journal, 12-1: 393-405 doi: https://doi.org/10.1016/j.asej.2020.04.005.
Meitz J (1998) Electrochemical rehabilitation methods for reinforced concrete structures: a state of the art report.
Europe: The Institute of Materials Minerals and Mining, Europe
Moustafa A and Takewaki I (2011) Response of nonlinear single-degree-of-freedom structures to random acceleration
sequences. Engineering Structures, 33-4: 1251-1258. doi: https://doi.org/10.1016/j.engstruct.2011.01.002.
Pacific Earthquake Engineering Research Centre (2011) PEER ground motion database. Available at:
https://ngawest2.berkeley.edu/.
Parry RH (2004) Mohr circles, stress paths and geotechnics. CRC Press. New York, USA.
R. D. (1939) Regio Decreto Leggne. XVIII, G.U. n. 2228 (in Italian).
Ramberg W and Osgood WR (1943) Description of stress-strain curves by three parameters. NACA-TN-902, National
Advisory Committee for Aeronautics, Washington, DC, United States
Ruiz-García J (2012) Mainshock-aftershock ground motion features and their influence in building's seismic response.
Journal of Earthquake Engineering 16-5: 719-737. doi: https://doi.org/10.1080/13632469.2012.663154.
Ruiz-García J and Negrete-Manriquez JC (2011) Evaluation of drift demands in existing steel frames under as-
recorded far-field and near-fault mainshock–aftershock seismic sequences. Engineering Structures 33: 621–634.
doi: https://doi.org/10.1016/j.engstruct.2010.11.021.
Syrmakezis CA, Mavrouli OA and Antonopoulos AK (2006) Rehabilitation of hospital buildings using passive control
systems. Smart Structures and Systems 2-4: 305-312. doi: https://doi.org/10.12989/sss.2006.2.4.305.
Systèmes D (2017) Getting Start with ABAQUS tutorial, ABAQUS Version 6.14. Dassault Systèmes, Providence,
RI.
Toray Composite Materials America, Inc. (2020) carbon fiber products T700. Tacoma, Washington, USA.
Venture SJ (2000) State of the art report on systems performance of steel moment frames subject to earthquake ground
shaking. FEMA 355C.
Wang G, Wang Y, Lu W, Yan P and Chen M (2018) Earthquake Direction Effects on Seismic Performance of Concrete
Gravity Dams to Mainshock–Aftershock Sequences. Journal of Earthquake Engineering 24-7: 1-22. doi:
https://doi.org/10.1080/13632469.2018.1453423.
Wang QL, Li J, Shao YB and Zhao WJ (2016) Flexural Performances of Square Concrete Filled CFRP-Steel Tubes
(S-CF-CFRP-ST). Advances in Structural Engineering 18-8: 1319-1344. doi: https://doi.org/10.1260/1369-
4332.18.8.1319.
Yang D, Pan J and LiG (2010) Interstory drift ratio of building structures subjected to near-fault ground motions based
on generalized drift spectral analysis. Soil Dynamics and Earthquake Engineering 30-11: 1182-1197. doi:
https://doi.org/10.1016/j.soildyn.2010.04.026.