seismic assessment of typical 1970s tall steel moment … · 2012-07-12 · welds, flexibility of...
TRANSCRIPT
Seismic Assessment of Typical 1970s
Tall Steel Moment Frame Buildings
in Downtown San Francisco
Ibrahim Almufti, Carlos Molina Hutt, Michael Willford
Arup, USA
Gregory Deierlein Stanford University, USA
SUMMARY:
An inventory of the existing tall building stock in San Francisco revealed that most tall buildings in the city
were built in the 1970s and 1980s and adopted a steel Special Moment Resisting Frame (SMRF) structural
system. In order to assess likely performance to current standards an archetypical 40-story steel SMRF building
design was developed to represent the existing tall building stock. The building was designed per the 1973
Uniform Building Code (UBC 73), supplemented by the 1973 SEAOC Blue Book recommendations (SEAOC
1973), and employed connection details characteristic of the time.
Nonlinear response history analyses were carried out in LS-DYNA (LSTC) with ground motions representative
of the Maximum Considered Earthquake (MCE) hazard level defined in current building codes, which for San
Francisco is near a 1000 year return period due to the deterministic limit on the MCE. Under this level of
shaking roughly 80 to 85% of the buildings are expected to sustain severe damage capable of causing loss of life
and such that the structure may be at total economic loss. A small proportion of buildings may collapse.
Keywords: Seismic, Retrofit, Tall Buildings, Steel Moment Frame, Fracture, LS-DYNA
1. INTRODUCTION
San Francisco may be one of the most seismically vulnerable cities in the world due to its proximity
to major active faults and its large number of older buildings. Until very recently, tall buildings in
San Francisco were designed using only conventional building codes, which follow a prescriptive
force-based approach based on the first mode translational response of the structure. Many researchers
and engineers have raised concerns that the prescriptive approach of building codes is not suitable for
tall buildings, which have significant responses in higher modes. Recognizing these shortcomings,
several jurisdictions including Los Angeles (LATBSDC 2008) and San Francisco (SF AB-083 2003)
have implemented guidelines which adopt a performance-based approach for new design. In light of
these concerns and the potentially disproportionate consequences of tall building collapse in an urban
environment, we intend to determine seismic collapse risk of the existing tall building stock in San
Francisco by means of a modern performance-based assessment. This paper presents the findings of
our initial intensity-based performance assessment representative of MCE-level shaking.
An inventory of the existing tall building stock was carried out by the SEAONC (Structural Engineers
Association of Northern California) Committee on Performance-Based Design of Tall Buildings. This
committee identified more than 90 buildings of 20 stories or greater, most of which employed a steel
moment frame lateral system. While many researchers have assessed the performance of existing steel
moment frame buildings of 30 stories and shorter (Muto and Krishnan 2011, Gupta and Krawinkler
1999), little is known of the performance of taller buildings. Muto found that approximately 5% of tall
steel buildings in the 10-30 story range in the Los Angeles area would collapse and 15% would
sustain damage capable of causing death due to a M7.8 scenario on the San Andreas Fault -Great
Southern California Shakeout Scenario (Muto and Krishnan 2011).

In order to assess the seismic performance of existing tall buildings in San Francisco, non-linear
response history analyses of a representative 40-story building were carried out using the software
package LS-DYNA (LSTC), which accounts for both nonlinear material and geometric effects. We
used 40 ground motion pairs selected and scaled based on the Conditional Spectrum of the 5%
probability of exceedance in 50 year hazard, which is approximately equivalent to the code level
Maximum Considered Earthquake (MCE) defined in ASCE 7 over the period range of interest for tall
structures. The analysis employs robust non-linear component models to represent fracture of the
welds, flexibility of the panel zones, degradation of the plastic hinges, tensile and flexural capacity of
the column splices and buckling of the columns.
2. INVENTORY OF EXISTING TALL BUILDING STOCK IN SAN FRANCISCO
In order to categorize the seismic risk to existing tall buildings in San Francisco, the first task was to
develop a database of all buildings taller than 160 feet (≈49 meters). This was done in collaboration
with the SEAONC Committee on Performance Based Design of Tall Buildings. Building
characteristics were tabulated by location, height, number of stories, year built, lateral system type,
and whether the building had been retrofitted (although the latter was difficult to determine). Much of
the initial information was obtained from www.emporis.com. Approximately 240 buildings taller than
160 feet were identified. Figure 1 illustrates the number of tall buildings built each decade between
1900 and 2010 (left) and the lateral system type for tall buildings built between 1960 and 1990 (right).
Figure 1. Number of tall buildings built in San Francisco per decade between 1900 and 2010 (left) and lateral
system types for tall buildings built between 1960 and 1990 (right)
Information on the lateral system type was obtained by interviews with the Engineers of Record and a
partial database gathered previously by the SEAONC committee. Information on the remaining
buildings could only be obtained by viewing construction documents available at the building
department. The lateral system type for approximately 80 out of the 240 buildings was identified.
This data was de-aggregated to identify trends in order to select a ‘prototype’ building for this study.
Figure 1 (right) shows the lateral system type for tall buildings built between 1960 and 1990. The sub-
category ‘Other System’ means that the lateral system of the building is known and it is not a steel
moment frame, while the sub-category ‘Unknown System’ is designated for all buildings for which
the lateral system is unknown. From this data, it was determined that the steel moment frame system
is the most prevalent type in pre-1990s construction for buildings greater than 35 stories in height.
A sidewalk survey was also conducted to visually inspect a random sample of 18 of the buildings
identified. While several of the buildings were regular in plan (some with setbacks up the height), 6
of the 18 had no corner columns.
3. PROTOTYPE BUILDING
Based on the inventory presented in section 2, a 40-story steel SMRF was selected as a representative
prototype building. The building is assumed regular in plan with corner columns; the implications of
the absence of corner columns have not yet been investigated. The prototype building attempts to
represent the state of design and construction practice from the mid 1970s to the mid 1980s. Based on
0
10
20
30
40
50
1900-
1910
1911-
1920
1921-
1930
1931-
1940
1941-
1950
1951-
1960
1961-
1970
1971-
1980
1981-
1990
1991-
2000
2001-
2009
Num
ber
of
Buil
din
gs
Buil
t
Year Range
0
10
20
30
40
< 20 20-25 26-30 31-35 36-40 41-45 > 45
Num
ber
of
Buil
din
gs
Number of Stories
Steel MF
Other System
Unknown System

examination of existing building drawings, the following use and layout was assumed for our
prototype building: 38 levels of office space; 2 levels (one at mid-height and one at the top) dedicated
to mechanical equipment; 3 basement levels for parking; building enclosure composed of concrete
panels and glass windows; floor system composed of concrete slab (3 inches or 76.3 mm) over metal
deck (2.5 inches or 63.5 mm) supported by steel beams; steel grade of columns A572 and steel grade
of beams A36. Typical story heights are 10 feet (≈3 meters) for basement levels, 20 feet (≈6 meters) at
ground level (lobby) and 12.5 feet (≈3.75 meters) for typical office levels. The overall height of the
structure is 507.5 feet (≈153.75 meters) above ground and 30 feet (≈9 meters) below grade. The
gravity loads, Superimposed Dead Load (SDL) and Live Load (LL), associated with the different
spaces is summarized in Table 1 below
Table 1. Loading Assumptions
Use SDL LL
Use SDL LL
(psf) (kPa) (psf) (kPa) (psf) (kPa) (psf) (kPa)
Parking 15 0.7 52 2.5 Mechanical 135 6.5 56 2.7
Lobby 90 4.3 100 4.8 Roof 85 4.1 32 1.5
Office 40 1.9 56 2.7 Façade 41 2.0 - -
The prototype building was designed to the provisions of UBC 73 and the 1973 SEAOC Blue Book,
which was commonly employed to supplement minimum design requirements. As illustrated in
Figure 2, the prototype system consisted of a space frame with 20 to 40 feet spans (≈6 to 12 meters)
using wide flange beams, built up box columns, and welded beam-column connections. Typical
member sizes and connection details were verified against construction drawings of existing
buildings.
Figure 2. Prototype 40-story office building
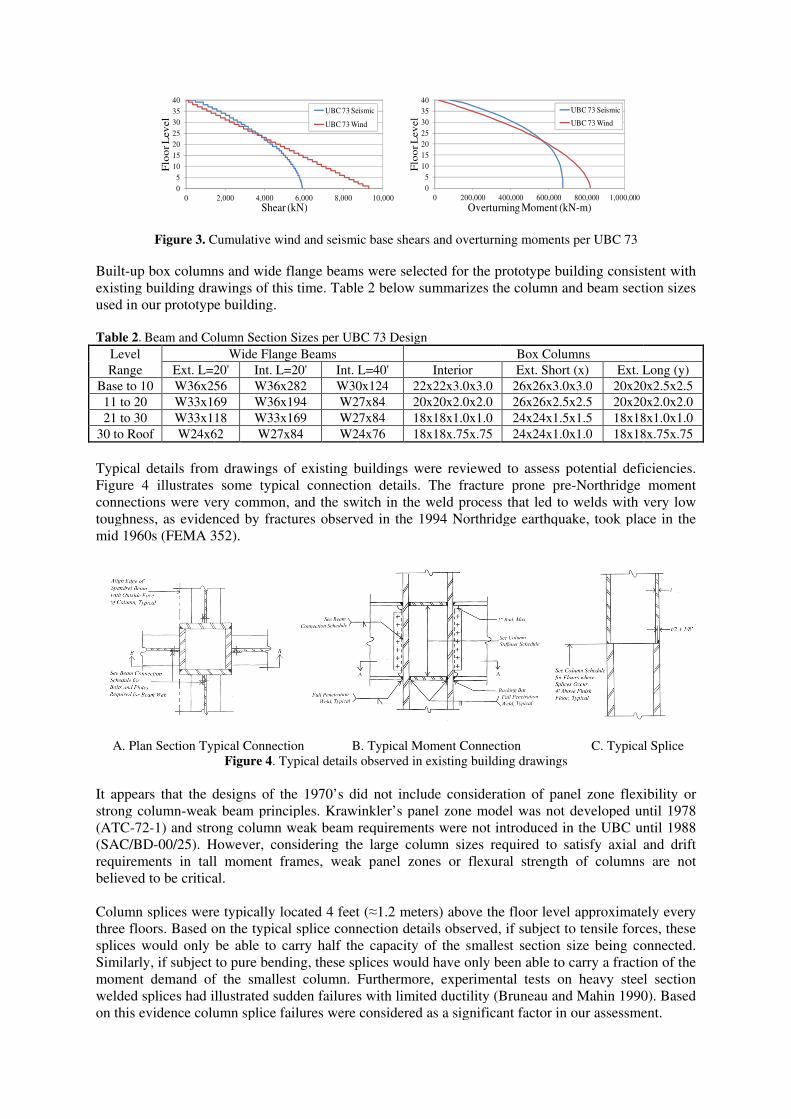
Lateral wind forces generally govern over seismic for design, as illustrated in Figure 3. Per discussion
with engineers practicing at this time, member sizes would have been sized for wind demand and
detailed to provide a ductile response under seismic excitation. UBC 73 includes simple and concise
prescriptive (equivalent static) strength design guidelines but does not specify drift limits. In the
1970s, design offices would have most likely implemented drift limits established by their firms
practice or those obtained from the SEAOC Blue Book of the time. For this study, the drift limit
recommendations from Appendix D of the SEAOC Blue Book are used, equal to 0.0025 for wind and
0.005 for seismic. The latter criterion is suggested for buildings taller than 13 stories. It is important to
note that moment frame section sizes in the prototype building were governed by wind drift limits,
resulting in low strength utilization ratios under code prescribed forces. Also worth noting is that such
wind drift limits are similar to those currently used in the design of tall buildings.
x
y
Built-up
existing building drawing
used in our prototype building
Table 2.
Level
Range
Base to 10
11 to 20
21 to 30
30 to Roof
Typical details
Figure 4
connections w
toughness, as evidenced by fractures observed in the 1994 Northridge earthquake, took place in the
mid 1960s (FEMA 352).
A. Plan Section Typical Connection
It appears that
strong column
(ATC-72
(SAC/BD
requirements in tall moment frames, weak panel zones or flexural strength of columns are not
believed to be critical
Column sp
three floors
splices would only be able to carry half the capacity of the smallest section size being connected.
Similarly, if subject to pure bending, these splices would ha
moment demand of the smallest column.
welded splices had illustrated
on this evidence
Figure 3. Cumulat
up box columns and wide flange beams were
existing building drawing
in our prototype building
. Beam and Column Section Sizes per UBC 73 Design
Ext. L=20'
Base to 10 W36x256
11 to 20 W33x169
21 to 30 W33x118
30 to Roof W24x62
ypical details from drawings of existing buildings
4 illustrates some
connections were very common, and the switch in the weld process that led to welds with very low
toughness, as evidenced by fractures observed in the 1994 Northridge earthquake, took place in the
mid 1960s (FEMA 352).
Plan Section Typical Connection
It appears that the designs of the 1970’s did not include consideration of panel zone flexibility
g column-weak beam principles
72-1) and strong column weak beam requirements were not introduced
(SAC/BD-00/25). However,
requirements in tall moment frames, weak panel zones or flexural strength of columns are not
believed to be critical
Column splices were typically located 4 feet (
three floors. Based on the typical splice connection details observed, if subject to tensile forces, these
splices would only be able to carry half the capacity of the smallest section size being connected.
Similarly, if subject to pure bending, these splices would ha
moment demand of the smallest column.
welded splices had illustrated
on this evidence column splice failures were considered as a significant factor in our assessment.
0
5
10
15
20
25
30
35
40
0
Flo
or L
ev
el
Cumulative wind and seismic base shears and overturning moments
columns and wide flange beams were
existing building drawings of this tim
in our prototype building.
Beam and Column Section Sizes per UBC 73 Design
Wide Flange
L=20' Int. L=20'
W36x256 W36x282
W33x169 W36x194
W33x118 W33x169
W24x62 W27x84
from drawings of existing buildings
tes some typical connection details
ere very common, and the switch in the weld process that led to welds with very low
toughness, as evidenced by fractures observed in the 1994 Northridge earthquake, took place in the
mid 1960s (FEMA 352).
Plan Section Typical Connection
Figure 4. Typical details observed in existing building drawings
the designs of the 1970’s did not include consideration of panel zone flexibility
weak beam principles
and strong column weak beam requirements were not introduced
However, considering
requirements in tall moment frames, weak panel zones or flexural strength of columns are not
believed to be critical.
lices were typically located 4 feet (
. Based on the typical splice connection details observed, if subject to tensile forces, these
splices would only be able to carry half the capacity of the smallest section size being connected.
Similarly, if subject to pure bending, these splices would ha
moment demand of the smallest column.
welded splices had illustrated sudden
column splice failures were considered as a significant factor in our assessment.
2,000 4,000
Shear (kN)
ive wind and seismic base shears and overturning moments
columns and wide flange beams were
s of this time. Table
Beam and Column Section Sizes per UBC 73 Design
Wide Flange Beams
L=20' Int.
W36x282 W30x124
W36x194 W27x84
W33x169 W27x84
W27x84 W24x76
from drawings of existing buildings
ical connection details
ere very common, and the switch in the weld process that led to welds with very low
toughness, as evidenced by fractures observed in the 1994 Northridge earthquake, took place in the
Plan Section Typical Connection B
Typical details observed in existing building drawings
the designs of the 1970’s did not include consideration of panel zone flexibility
weak beam principles. Krawinkler’s panel zone model was
and strong column weak beam requirements were not introduced
considering the large
requirements in tall moment frames, weak panel zones or flexural strength of columns are not
lices were typically located 4 feet (
. Based on the typical splice connection details observed, if subject to tensile forces, these
splices would only be able to carry half the capacity of the smallest section size being connected.
Similarly, if subject to pure bending, these splices would ha
moment demand of the smallest column. Furthermore,
sudden failures
column splice failures were considered as a significant factor in our assessment.
6,000 8,000
Shear (kN)
UBC 73 Seismic
UBC 73 Wind
ive wind and seismic base shears and overturning moments
columns and wide flange beams were selected for the prototype building consistent with
Table 2 below summarizes the column and beam section sizes
Beam and Column Section Sizes per UBC 73 Design
L=40'
W30x124 22x22x3.0
W27x84 20x20x2
W27x84 18x18x1
W24x76 18x18x.75x
from drawings of existing buildings were
ical connection details. The fracture prone pre
ere very common, and the switch in the weld process that led to welds with very low
toughness, as evidenced by fractures observed in the 1994 Northridge earthquake, took place in the
B. Typical Moment Connection
Typical details observed in existing building drawings
the designs of the 1970’s did not include consideration of panel zone flexibility
Krawinkler’s panel zone model was
and strong column weak beam requirements were not introduced
the large column sizes required to
requirements in tall moment frames, weak panel zones or flexural strength of columns are not
lices were typically located 4 feet (≈1.2 meters)
. Based on the typical splice connection details observed, if subject to tensile forces, these
splices would only be able to carry half the capacity of the smallest section size being connected.
Similarly, if subject to pure bending, these splices would ha
Furthermore,
failures with limited ductility
column splice failures were considered as a significant factor in our assessment.
10,000
UBC 73 Seismic
UBC 73 Wind
0
5
10
15
20
25
30
35
40
Flo
or L
ev
el
ive wind and seismic base shears and overturning moments
selected for the prototype building consistent with
below summarizes the column and beam section sizes
Interior
22x22x3.0x3.0
20x20x2.0x2.0
18x18x1.0x1.0
18x18x.75x.75
were reviewed
The fracture prone pre
ere very common, and the switch in the weld process that led to welds with very low
toughness, as evidenced by fractures observed in the 1994 Northridge earthquake, took place in the
. Typical Moment Connection
Typical details observed in existing building drawings
the designs of the 1970’s did not include consideration of panel zone flexibility
Krawinkler’s panel zone model was
and strong column weak beam requirements were not introduced
column sizes required to
requirements in tall moment frames, weak panel zones or flexural strength of columns are not
1.2 meters) above the floor level approximately every
. Based on the typical splice connection details observed, if subject to tensile forces, these
splices would only be able to carry half the capacity of the smallest section size being connected.
Similarly, if subject to pure bending, these splices would have only been able to carry a fraction of the
Furthermore, experimental tests on heavy steel section
with limited ductility (Bruneau and Mahin
column splice failures were considered as a significant factor in our assessment.
10
15
20
25
30
35
40
0 200,000 400,000
Overturning Moment (kN
ive wind and seismic base shears and overturning moments
selected for the prototype building consistent with
below summarizes the column and beam section sizes
Box Columns
Ext. Short
26x26x3.0x3.0
26x26x2.5x2.5
24x24x1.5x1.5
24x24x1.0x1.0
reviewed to assess potential deficiencies.
The fracture prone pre-
ere very common, and the switch in the weld process that led to welds with very low
toughness, as evidenced by fractures observed in the 1994 Northridge earthquake, took place in the
. Typical Moment Connection
Typical details observed in existing building drawings
the designs of the 1970’s did not include consideration of panel zone flexibility
Krawinkler’s panel zone model was not developed
and strong column weak beam requirements were not introduced in
column sizes required to satisfy axial and drift
requirements in tall moment frames, weak panel zones or flexural strength of columns are not
above the floor level approximately every
. Based on the typical splice connection details observed, if subject to tensile forces, these
splices would only be able to carry half the capacity of the smallest section size being connected.
ve only been able to carry a fraction of the
experimental tests on heavy steel section
(Bruneau and Mahin
column splice failures were considered as a significant factor in our assessment.
400,000 600,000
Overturning Moment (kN
UBC 73 Seismic
UBC 73 Wind
ive wind and seismic base shears and overturning moments per UBC 73
selected for the prototype building consistent with
below summarizes the column and beam section sizes
Columns
(x) Ext. Long
x3.0 20x20x2.5
x2.5 20x20x2.
x1.5 18x18x1.
x1.0 18x18x
to assess potential deficiencies.
-Northridge moment
ere very common, and the switch in the weld process that led to welds with very low
toughness, as evidenced by fractures observed in the 1994 Northridge earthquake, took place in the
C. Typical Splice
the designs of the 1970’s did not include consideration of panel zone flexibility
developed until
in the UBC until
satisfy axial and drift
requirements in tall moment frames, weak panel zones or flexural strength of columns are not
above the floor level approximately every
. Based on the typical splice connection details observed, if subject to tensile forces, these
splices would only be able to carry half the capacity of the smallest section size being connected.
ve only been able to carry a fraction of the
experimental tests on heavy steel section
(Bruneau and Mahin 1990). Based
column splice failures were considered as a significant factor in our assessment.
800,000 1,000,000
Overturning Moment (kN-m)
UBC 73 Seismic
UBC 73 Wind
selected for the prototype building consistent with
below summarizes the column and beam section sizes
Long (y)
20x20x2.5x2.5
20x20x2.0x2.0
18x18x1.0x1.0
18x18x.75x.75
to assess potential deficiencies.
Northridge moment
ere very common, and the switch in the weld process that led to welds with very low
toughness, as evidenced by fractures observed in the 1994 Northridge earthquake, took place in the
C. Typical Splice
the designs of the 1970’s did not include consideration of panel zone flexibility or
until 1978
until 1988
satisfy axial and drift
requirements in tall moment frames, weak panel zones or flexural strength of columns are not
above the floor level approximately every
. Based on the typical splice connection details observed, if subject to tensile forces, these
splices would only be able to carry half the capacity of the smallest section size being connected.
ve only been able to carry a fraction of the
experimental tests on heavy steel section
1990). Based
column splice failures were considered as a significant factor in our assessment.
4. ANALYTICAL MODEL
This section outlines the modeling assumptions used in the non-linear response time history analyses
in LS-DYNA (LSTC).
4.1. Component models
The component models to represent non-linear columns, beams, panel zones and splices are described
below. Concrete slabs were modeled as elastic cracked concrete 2D shell elements to represent the
flexible floor diaphragm.
4.1.1 Columns
Columns were modeled as lumped plasticity beam elements with yield surfaces capable of capturing
interaction between bi-axial bending moment and axial force. Buckling in compression is also
captured. Degradation parameters for response under cyclic loads were calibrated based on
experimental tests of tubular steel columns (Nakashima et al. 2007) following the guidelines for
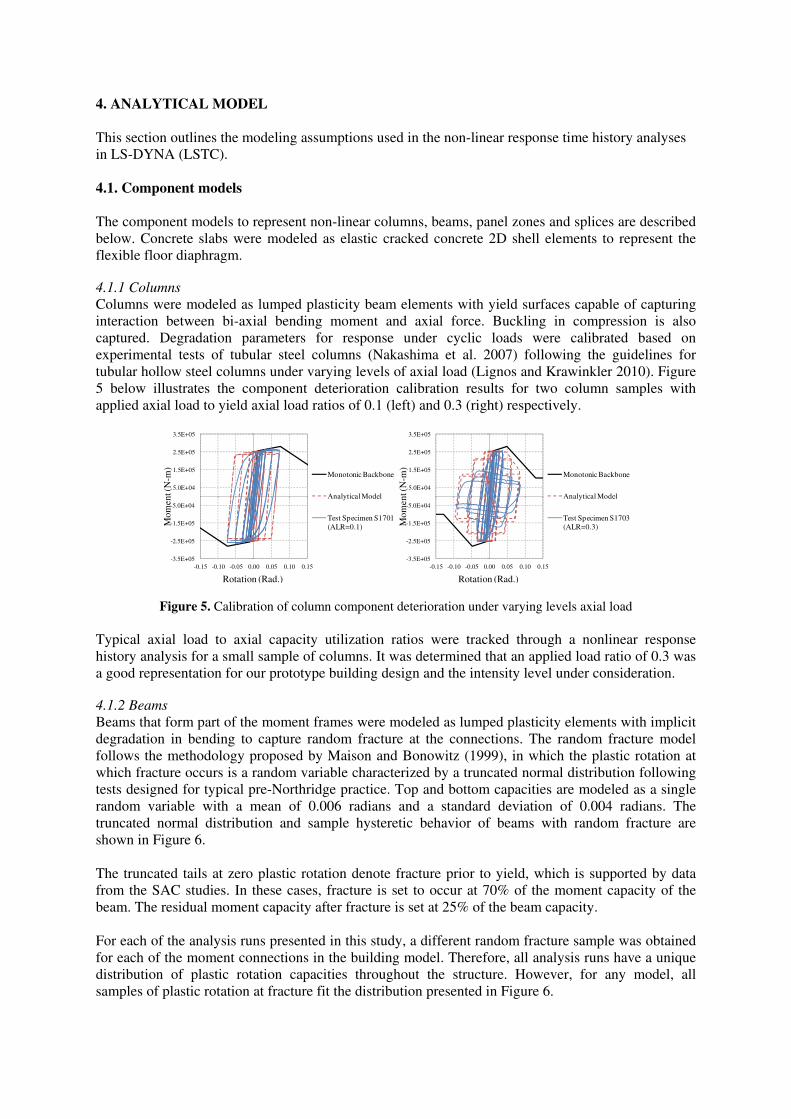
tubular hollow steel columns under varying levels of axial load (Lignos and Krawinkler 2010). Figure
5 below illustrates the component deterioration calibration results for two column samples with
applied axial load to yield axial load ratios of 0.1 (left) and 0.3 (right) respectively.
Figure 5. Calibration of column component deterioration under varying levels axial load
Typical axial load to axial capacity utilization ratios were tracked through a nonlinear response
history analysis for a small sample of columns. It was determined that an applied load ratio of 0.3 was
a good representation for our prototype building design and the intensity level under consideration.
4.1.2 Beams
Beams that form part of the moment frames were modeled as lumped plasticity elements with implicit
degradation in bending to capture random fracture at the connections. The random fracture model
follows the methodology proposed by Maison and Bonowitz (1999), in which the plastic rotation at
which fracture occurs is a random variable characterized by a truncated normal distribution following
tests designed for typical pre-Northridge practice. Top and bottom capacities are modeled as a single
random variable with a mean of 0.006 radians and a standard deviation of 0.004 radians. The
truncated normal distribution and sample hysteretic behavior of beams with random fracture are
shown in Figure 6.
The truncated tails at zero plastic rotation denote fracture prior to yield, which is supported by data
from the SAC studies. In these cases, fracture is set to occur at 70% of the moment capacity of the
beam. The residual moment capacity after fracture is set at 25% of the beam capacity.
For each of the analysis runs presented in this study, a different random fracture sample was obtained
for each of the moment connections in the building model. Therefore, all analysis runs have a unique
distribution of plastic rotation capacities throughout the structure. However, for any model, all
samples of plastic rotation at fracture fit the distribution presented in Figure 6.
-3.5E+05
-2.5E+05
-1.5E+05
-5.0E+04
5.0E+04
1.5E+05
2.5E+05
3.5E+05
-0.15 -0.10 -0.05 0.00 0.05 0.10 0.15
Mo
men
t (N
-m)
Rotation (Rad.)
Monotonic Backbone
Analytical Model
Test Specimen S1701
(ALR=0.1)
-3.5E+05
-2.5E+05
-1.5E+05
-5.0E+04
5.0E+04
1.5E+05
2.5E+05
3.5E+05
-0.15 -0.10 -0.05 0.00 0.05 0.10 0.15
Mo
men
t (N
-m)
Rotation (Rad.)
Monotonic Backbone
Analytical Model
Test Specimen S1703
(ALR=0.3)

Figure 6. Probability distribution and sample hysteretic response for random fracture in connections
4.1.3 Panel zones
Panel zones were modeled using the Krawinkler model as outlined in ATC-72-1 by the use of an
assembly of rigid links and rotational springs that capture the tri-linear shear force-deformation
relation. Since the prototype building model is three dimensional and columns are built-up box
sections, the shear force-deformation relationship in each direction was assumed decoupled.
4.1.4 Column splices
Column splices were modeled as non-linear springs capable of reaching their nominal capacity with a
sudden brittle failure followed by 20% residual capacity when subject to axial tension and/or bending.
Full column capacity was assumed in compression since this is achieved by direct bearing.
4.2 Loads, damping and boundary conditions
Analytical models were subject to the ground motions described in section 6 in conjunction with
expected gravity loads associated with the seismic weight of the structure. Seismic weight was
assumed to include selfweight, superimposed dead load and 25% of the unreduced live loads (PEER
2010). Since the hazard level under consideration corresponds to that of the code MCE, 2.5%
damping was assumed in the analysis (PEER 2010). The damping model used in the analysis applies
damping to deformation, excluding rigid body motion. The damping is adjusted based on tangent
stiffness- which is believed appropriate for non-linear seismic analysis. A fixed base is assumed at
foundation level and soil-structure interaction is not considered.
5. SEISMIC HAZARD
The majority of tall buildings in San Francisco are densely clustered in the downtown area, located
approximately 15km from the two major faults in the Bay Area. The San Andreas fault is capable of
producing M8.0 events while the Hayward fault is capable of producing M7.2 events. The study
assumes Site Class D per ASCE 7, which is typical for downtown San Francisco sites.
5.1 Assessment of MCE
A site-specific Probabilistic Seismic Hazard Analysis (PSHA) for the 2% in 50 year hazard was
carried out in EZ-FRISK using three NGA relationships (B&A 08, C&B 08 and C&Y 08). For sites in
close proximity to faults in regions of high seismicity, the MCE is capped by a deterministic limit,
defined as 150% of the largest median Sa geomean response (ASCE 7-05) or 84th percentile Sa
maximum direction response (ASCE 7-10) computed at each period for all known faults in the region.
In downtown San Francisco, the M8.0 scenario on the San Andreas fault governs the deterministic
hazard at all periods. However, the default deterministic limit of chapter 21 of ASCE 7-05 and ASCE
7-10 (SS = 1.5g and S1 = 0.6g for bedrock and SMS = 1.5g and SM1 = 0.9g for Site Class D) governs the
code level MCE for San Francisco. Figure 7a compares all these 5% damped acceleration spectra.
At �� = 5 seconds, the ASCE 7 MCE spectral acceleration is approximately 0.18g. De-aggregation of
the MCE shows the mean causal magnitude is M7.72 on the San Andreas fault, the mean causal
0.00
0.10
0.20
0.30
0.40
0.50
0.60
0.70
0.80
0.90
1.00
0.000 0.005 0.010 0.015 0.020
Plastic Rotation at Fracture (Rad)
Cumulative
Distribution Function
Random
Sample
0.000 0.005 0.010 0.015 0.020
Fre
quency
Plastic Rotation at Fracture (Rad)
Probability
Density Function
Random
Sample
-5.E+06
-4.E+06
-3.E+06
-2.E+06
-1.E+06
0.E+00
1.E+06
2.E+06
3.E+06
4.E+06
5.E+06
-0.10 -0.05 0.00 0.05 0.10
Mom
ent (N
-m)
Rotation (Rad.)
Cyclic Skeleton
Hysteretic Response
Fracture Limit at 0.010 Radians
Plastic Rotation
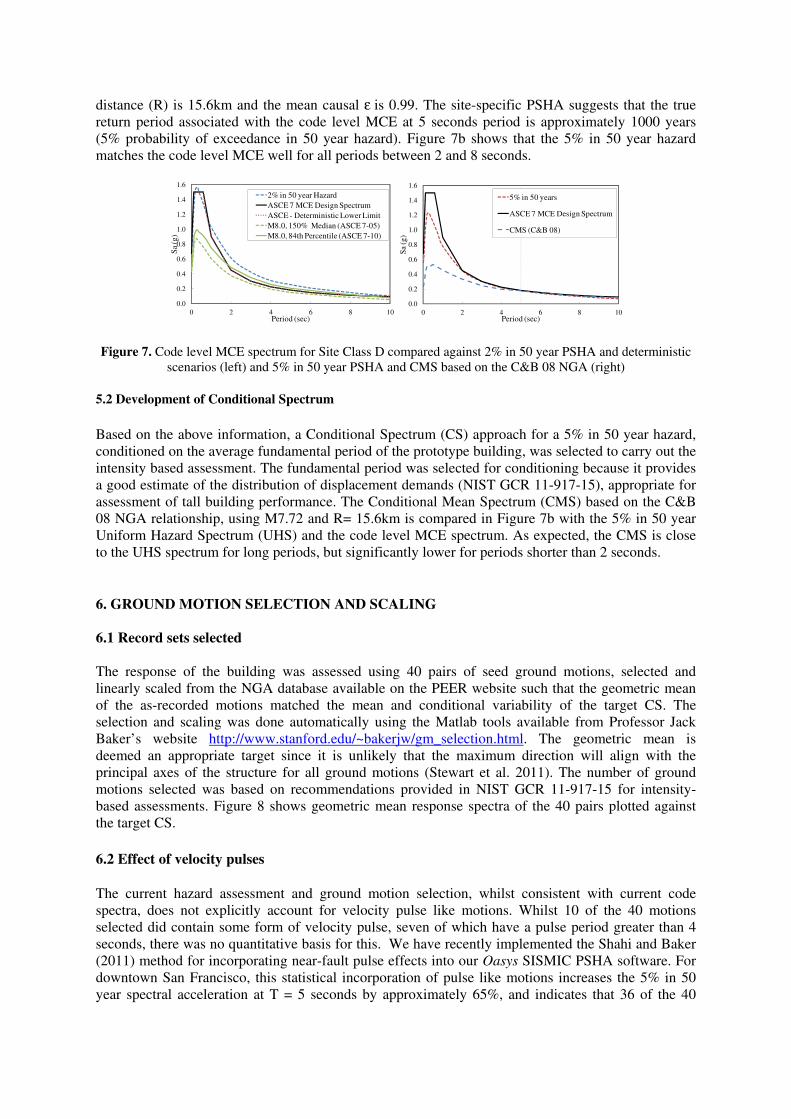
distance (R) is 15.6km and the mean causal ε is 0.99. The site-specific PSHA suggests that the true
return period associated with the code level MCE at 5 seconds period is approximately 1000 years
(5% probability of exceedance in 50 year hazard). Figure 7b shows that the 5% in 50 year hazard
matches the code level MCE well for all periods between 2 and 8 seconds.
Figure 7. Code level MCE spectrum for Site Class D compared against 2% in 50 year PSHA and deterministic
scenarios (left) and 5% in 50 year PSHA and CMS based on the C&B 08 NGA (right)
5.2 Development of Conditional Spectrum
Based on the above information, a Conditional Spectrum (CS) approach for a 5% in 50 year hazard,
conditioned on the average fundamental period of the prototype building, was selected to carry out the
intensity based assessment. The fundamental period was selected for conditioning because it provides
a good estimate of the distribution of displacement demands (NIST GCR 11-917-15), appropriate for
assessment of tall building performance. The Conditional Mean Spectrum (CMS) based on the C&B
08 NGA relationship, using M7.72 and R= 15.6km is compared in Figure 7b with the 5% in 50 year
Uniform Hazard Spectrum (UHS) and the code level MCE spectrum. As expected, the CMS is close
to the UHS spectrum for long periods, but significantly lower for periods shorter than 2 seconds.
6. GROUND MOTION SELECTION AND SCALING
6.1 Record sets selected
The response of the building was assessed using 40 pairs of seed ground motions, selected and
linearly scaled from the NGA database available on the PEER website such that the geometric mean
of the as-recorded motions matched the mean and conditional variability of the target CS. The
selection and scaling was done automatically using the Matlab tools available from Professor Jack
Baker’s website http://www.stanford.edu/~bakerjw/gm_selection.html. The geometric mean is
deemed an appropriate target since it is unlikely that the maximum direction will align with the
principal axes of the structure for all ground motions (Stewart et al. 2011). The number of ground
motions selected was based on recommendations provided in NIST GCR 11-917-15 for intensity-
based assessments. Figure 8 shows geometric mean response spectra of the 40 pairs plotted against
the target CS.
6.2 Effect of velocity pulses
The current hazard assessment and ground motion selection, whilst consistent with current code
spectra, does not explicitly account for velocity pulse like motions. Whilst 10 of the 40 motions
selected did contain some form of velocity pulse, seven of which have a pulse period greater than 4
seconds, there was no quantitative basis for this. We have recently implemented the Shahi and Baker
(2011) method for incorporating near-fault pulse effects into our Oasys SISMIC PSHA software. For
downtown San Francisco, this statistical incorporation of pulse like motions increases the 5% in 50
year spectral acceleration at T = 5 seconds by approximately 65%, and indicates that 36 of the 40
0.0
0.2
0.4
0.6
0.8
1.0
1.2
1.4
1.6
0 2 4 6 8 10
Sa
(g)
Period (sec)
2% in 50 year Hazard
ASCE 7 MCE Design Spectrum
ASCE - Deterministic Lower Limit
M8.0, 150% Median (ASCE 7-05)
M8.0, 84th Percentile (ASCE 7-10)
0.0
0.2
0.4
0.6
0.8
1.0
1.2
1.4
1.6
0 2 4 6 8 10
Sa
(g)
Period (sec)
5% in 50 years
ASCE 7 MCE Design Spectrum
CMS (C&B 08)

motions should in fact contain pulses. This indicates that the structural responses described in section
7 might be significantly underestimated.
Figure 8. CS computed using 3NGA and C&B 08 only (left) and ground motions scaled to target CS (right)
7. BUILDING PERFORMANCE PREDICTIONS
7.1 Interstory Drift Ratios (IDRs)
PEER (2010) proposes that for MCE level shaking, mean IDRs should be limited to 3% and the
maximum transient IDRs from the suite of analyses to 4.5%. This is on the basis that structural
components with a proper yielding mechanism will perform well and non-structural components
properly attached to the structure will not pose a life safety hazard. Residual drift limits are also
important in determining the required downtime associated with excessive post-earthquake
deformations, which could lead to condemnation as well as hazard to surrounding structures in the
event of aftershocks. The corresponding PEER recommendations for MCE, limits the mean residual
IDRs to 1% and the maximum residual IDRs from the suite of analyses to 1.5%. However, significant
non-structural damage and extended downtime or even building condemnation would be expected if
mean residual drifts exceed 0.5%.
Predicted transient and residual IDRs are shown in Figure 9. It can be observed that the peak
interstory drifts tend to occur near mid-height and the top of the structure. This may be attributable to
the governing structural design criteria per UBC 73 being drift control under wind forces, not seismic.
a) Peak transient IDRs in x and y b) Peak residual IDRs in x and y
Figure 9. Transient and residual IDRs against height
The overall distributions of peak transient and residual IDRs are shown in Figure 10. Rather than
only evaluating IDRs against the limits provided by PEER (2010), which are intended to
ensure code-level performance, peak transient and residual IDRs were also classified into
damage state categories as described in ATC-58-1. Results illustrate 80 to 85% chance of
Damage State 3 (DS3) or worse. DS3 is characterized by the requirement of major structural
realignment to restore safety margin for lateral stability; however, the required realignment
0.01
0.1
1
10
0.1 1 10
Sa (
g)
Period (sec)
CMS - 3NGA
CMS - 3NGA + σ
CMS - CB08
CMS - CB08 + σ
-10
0
10
20
30
40
50
60
70
80
90
100
110
120
130
140
150
0% 1% 2% 3% 4% 5%
Ele
vat
ion (m
)
IDR (-)
Sample IDR Limit Mean IDR Limit
Analysis Results Mean IDR X
-10
0
10
20
30
40
50
60
70
80
90
100
110
120
130
140
150
0% 1% 2% 3% 4% 5%
Ele
vat
ion (m
)
IDR (-)
Sample IDR Limit Mean IDR Limit
Analysis Results Mean IDR Y
-10
0
10
20
30
40
50
60
70
80
90
100
110
120
130
140
150
0% 1% 2% 3% 4% 5%
Ele
vat
ion (m
)
IDR (-)
Sample IDR Limit Mean IDR Limit
Analysis Results Mean IDR X
-10
0
10
20
30
40
50
60
70
80
90
100
110
120
130
140
150
0% 1% 2% 3% 4% 5%
Ele
vat
ion (m
)
IDR (-)
Sample IDR Limit Mean IDR Limit
Analysis Results Mean IDR Y

and repair of the structure may not be economically and practically feasible (i.e., the structure
might be at total economic loss) as described in ATC-58-1.
a. Peak Transient Drift b. Peak Residual Drift
Figure 10. Peak transient and residual drifts
Figure 11. Damage state (DS) and Collapse (CP) classification per transient (left) and residual (right) IDRs
7.2 Performance of structural components
On average, 34% of moment connections yielded and 15% of connections fractured, which would
compromise the strength and stiffness of the structure in the event of aftershocks and later earthquakes
until retrofit measures are adopted. As anticipated, typically the panel zones in the large built up box
columns did not suffer significant levels of deformation due to their inherent strength and stiffness.
Local tension demands in column splices were typically below nominal capacities and brittle fracture
leading to collapse was only observed in one of the analysis runs. In this case splice fracture occurred
near mid-height of the structure and led to collapse. Columns often reached their nominal capacities in
bending and compression, but did not undergo extensive deterioration (because they are so stocky)
and hence do not compromise the overall stability of the structure.
8. POTENTIAL RETROFITS
In order enhance the seismic performance of typical 1970s tall steel moment frame buildings, a
reduction in transient and residual deformations is required. This objective can be achieved by adding
stiffness, damping or a combination of these to the structure. Based on the response of the structural
components, direct retrofit of the deficiencies identified in this study will not suffice to significantly
enhance seismic performance. Specific retrofit measures will be explored in future studies.
9. CONCLUSIONS
The performance of tall 1970s steel moment frame buildings in downtown San Francisco under
earthquake shaking levels consistent with the code MCE are expected to produce 80 to 85% chance of
damage that will require major structural realignment such that the required realignment and repair of
the structure may not be economically and practically feasible. Significant structural and non-
structural damage is expected. Damage capable of producing loss of life, significant losses attributed
structural and non-structural damage, downtime and potential building condemnation are anticipated.
Since drift limits largely controlled member sizes, buildings which followed less stringent limits or
which did not follow any limits (not required by the code of the time) are expected to undergo larger
deformations and present a greater risk of severe damage or collapse.
0%
2%
4%
6%
8%IR
D (
-)IDR-X
Mean IDR X
IDR-Y
Mean IDR Y
Sample Limit
Mean Limit 0%
2%
4%
6%
8%
IRD
(-)
IDR-X
Mean IDR X
IDR-Y
Mean IDR Y
Sample Limit
Mean Limit
0%
20%
40%
60%
80%
100%
DS1 DS2 DS3 DS4 CP0%
20%
40%
60%
80%
100%DS1 DS2 DS3 DS4 CP
0%
20%
40%
60%
80%
100%
0%
20%
40%
60%
80%
100%DS1 DS2 DS3 DS4 CP
DS1 DS2 DS3 DS4 CP
An important consideration is that incorporation of recent research into the presence of velocity pulses
in ground motions associated with large events would significantly increase the degree of damage and
number of collapses predicted.
ACKNOWLEDGEMENT
SEAONC Tall Buildings Committe, David Leung, Janice Mochizuki, Bryce Tanner, Jason Krolicki, Ramin
Motamed, Jack Backer, Damian Grant, Dimitrios Lignos, Tiziana Rossetto, David Scott and Rafael Sabelli.
REFERENCES
Applied Technology Council. (2012). Seismic Performance Assessment of Buildings. ATC-58-1 100% Draft.
Baker J. (2011). Conditional Mean Spectrum: Tool for Ground-Motion Selection. Journal of Structural
Engineering, Vol. 137, No. 3.
Baker J., Jayaram N. (2008). Correlations of Spectral Acceleration Values from NGA Ground Motion Models.
Earthquake Spectra, Vol. 23, No. 1, pages 299-317.
Bruneau M., Mahin, S. (1990). Ultimate Behavior of Heavy Steel Section Welded Splices and Design
Implications. Journal of Structural Engineering, Vol. 116, No. 8.
FEMA. (2000). Program to Reduce the Earhquake Hazards of Steel Moment-Frame Structures: Recommended
Postearthquake Evaluation and Repair Criteria for Welded Steel Moment-Frame Buildings. FEMA 352.
Gupta A., Krawinkler H. (1999). Seismic Demands for Performance Evaluation of Steel Moment Resisting
Frame Structures. Dept. of Civil and Environmental Engineering, Stanford University. Report No. 132.
International Conference of Building Officials. (1973). Uniform Building Code 1973 Edition.
LATBSDC. (2008). An Alternative Procedure for Seismic Analysis and Design of Tall Buildings Located in the
Los Angeles Region.
Lignos D., Krawinkler H. (2010). A Steel Database for Component Deteriorration of Tubular Hollow Square
Steel Columns Under Varying Axial Load for Collapse Assessment of Steel Structures under Earthquakes.
Joint Conference Proceedings 7CUEE & 5ICEE.
Maison F., Bonowitz D. (1999). How Safe Are Pre-Northridge WSMFs? A case Study of the SAC Los Angeles
Nine-Story Building. Earthquake Spectra, Vol. 15, No. 4.
Muto M., Krishnan, S. (2011). Hope for the Best, Prepare for the Worst: Response of Tall Steel Buildings to the
ShakeOut Scenario Earthquake. Earthquake Spectra, Vol. 27, No. 2, pages 375-398.
Nakashima M. et al. (2007). Test on Large Cyclic Deformation of Steel Tube Columns Having Fixed Column
Bases. Journal of Structural and Construction Engineering, Vol. 598, pages 149-154.
NEHRP Consultants Joint Venture. (2011). Selecting and Scaling of Earthquake Ground Motions for
Performing Response-History Analyses. NIST GCR 11-917-15.
PEER. (2010). Tall Buildings Initiative: Guidelines for Performance-Based Seismic Design of Tall Buildings.
PEER Report No. 2010/05.
PEER/ATC. (2010). Modeling and Acceptance Criteria for Seismic Design and Analysis of Tall Buildings.
PEER/ATC-72-1.
SAC Joint Venture. (2000). Performance Prediction and Evaluation of Steel Special Moment Frames for
Seismic Loads. SAC Steel Project Report No. SAC/BD-00/25.
SEAONC AB-083. (2007). Recommended Administrative Bulletin on the Seismic Design and Review of Tall
Buildings Using Non-Prescriptive Procedures.
SEAOC Seismology Committe. (1973) Recommended Lateral Force Requirements and Commentary.
SEAONC Seismology Committee on Ground Motions. (2009). 2475-year Ground Motion? Not in Coastal
California! SEAONC News, Vol. LXIV, No. 8.
Shahi S., Baker J. (2011). An empirically calibrated framework for including the effects of near-fault directivity
in probabilistic seismic hazard analysis. Bulletin of the Seismological Society of America, Vol. 101, No. 2,
pages 742-755.
Stewart J. et al. (2011). Representation of Bidirectional Ground Motions for Design Spectra in Building Codes.
Earthquake Spectra, Vol. 27, No. 3, pages 927-937.