seismic attributes used for reservoir simulation ... attributes used for reservoir simulation:...
TRANSCRIPT
Back to Exploration – 2008 CSPG CSEG CWLS Convention 508
Seismic Attributes used for Reservoir Simulation: Application to a Heavy Oil Reservoir in Canada
Carmen Dumitrescu*
Sensor Geophysical Ltd, Calgary, AB [email protected]
and
Larry Lines
University of Calgary, Calgary, AB, Canada
Summary
Cold heavy oil production with sand has become one of the main non-thermal schemes for developing heavy oil reservoirs in Canada. One challenge in modeling the fluid flow in the reservoir simulation studies is reservoir heterogeneity. Several seismic attributes were used to estimate the porosity (ranging from 19% to 35%) at the Plover Lake oil sands reservoir in Canada. First, the top and the base of the reservoir were mapped based on several seismic attribute volumes that include the density. From petrophysical analysis we learned that density is a key physical property in differentiating between sand and shale within the oil sands. Probabilistic neural network (PNN) analysis was used to derive the relationship between density log data and external attributes (PP and PS migrated stacks, AVO attributes and inversion results). Secondly, we used geostatistics to estimate a porosity map within the reservoir. The study is based on a set of porosity logs at well locations and several seismic attribute maps. Kriging, cokriging, kriging with external drift (KED) and multiattribute analysis for maps plus KED, were tested in order to improve the results. The KED with porosity from multiattribute analysis is the most realistic, honoring the wells and the seismic.
Introduction
The Plover Lake oil sands project, conducted by Nexen Inc., is located in Saskatchewan, Canada. Oil sands of the Devonian-Mississippian Bakken Formation are found in NE-SW trending shelf-sand tidal ridges that can be up to 30 m thick, 5 km wide and 50 km long. Overlying Upper Bakken shales are preferentially preserved between sand ridges. The Bakken Formation is discomformably overlain by Lodgepole Formation carbonates (Mississippian) and/or clastics of the Lower Cretaceous Mannville Group (Mageau et al., 2001). The 3D-3C seismic dataset was acquired by Veritas DGC using the VectorSeis® digital multicomponent recording system over an 8 square kilometer surface area. On the project, out of 100 logged wells, only 29 had sonic, density, porosity and GR logs. The migrated structure stacks
Back to Exploration – 2008 CSPG CSEG CWLS Convention 509
for the PP (vertical) and for the PS (radial) component were produced by Sensor Geophysical Ltd. as part of a CHORUS (Consortium for Heavy Oil Research by University Scientists) project at the University of Calgary. To achieve an optimal estimation of density, pre- and post-stack seismic attributes (PP and PS stacks, AVO attributes and inversion results) were used in the probabilistic neural network (PNN) analysis. The estimated density volume was used for mapping the top (Upper/Mid Bakken) and the base (Lower Bakken) of the heavy oil reservoir at Plover Lake.
Figure 1: Map showing the Plover Lake area, Saskatchewan, Canada.
Once we had the top and the base of the reservoir, we mapped porosity within the reservoir using several geostatistical methods such as kriging, cokriging, kriging with external drift (KED) and multiattribute analysis that were compared in terms of accuracy. The estimated porosity map will be used in a subsequent effort, for reservoir simulation at Plover Lake.
Method
Part A: Mapping the top and the base of the reservoir From petrophysical analysis, we learned that density is a key physical property in differentiating between sand and shale within the oil sands. Therefore, having a density volume available over the Bakken Formation would be very useful for mapping the top and the base of the reservoir. PNN analysis was used to derive the relationship between attributes of the seismic data and density log data. The PNN analysis used as input the PP and PS stacks, the AVO attributes and the inversion results, discussed in previous papers by Dumitrescu et al. (2006 and 2007). PNN analysis, has four steps: (i) perform a multiattribute step-wise linear regression and its validation, (ii) train neural networks to establish the nonlinear relationships between seismic attributes and reservoir properties at well locations, (iii) apply trained neural networks to the 3-D seismic data volume, (iv) validate results on wells withheld from training. Part B: Mapping Porosity The advantage of using geostatistics is that we can both honor the primary data values at the well locations as well as honor the “spirit” of the dense dataset away from the wells. In this project, we tested three different ways of bringing in a secondary dataset: (i) cokriging, (ii) KED, and (iii) multiattribute analysis for maps plus KED. The multiattribute analysis involves combining multiple map attributes to predict a reservoir parameter such as porosity, by training at the well locations.
Back to Exploration – 2008 CSPG CSEG CWLS Convention 510
This method is an extension of the multiattribute approach applied to seismic volumes (Hampson et al., 2001).
Results
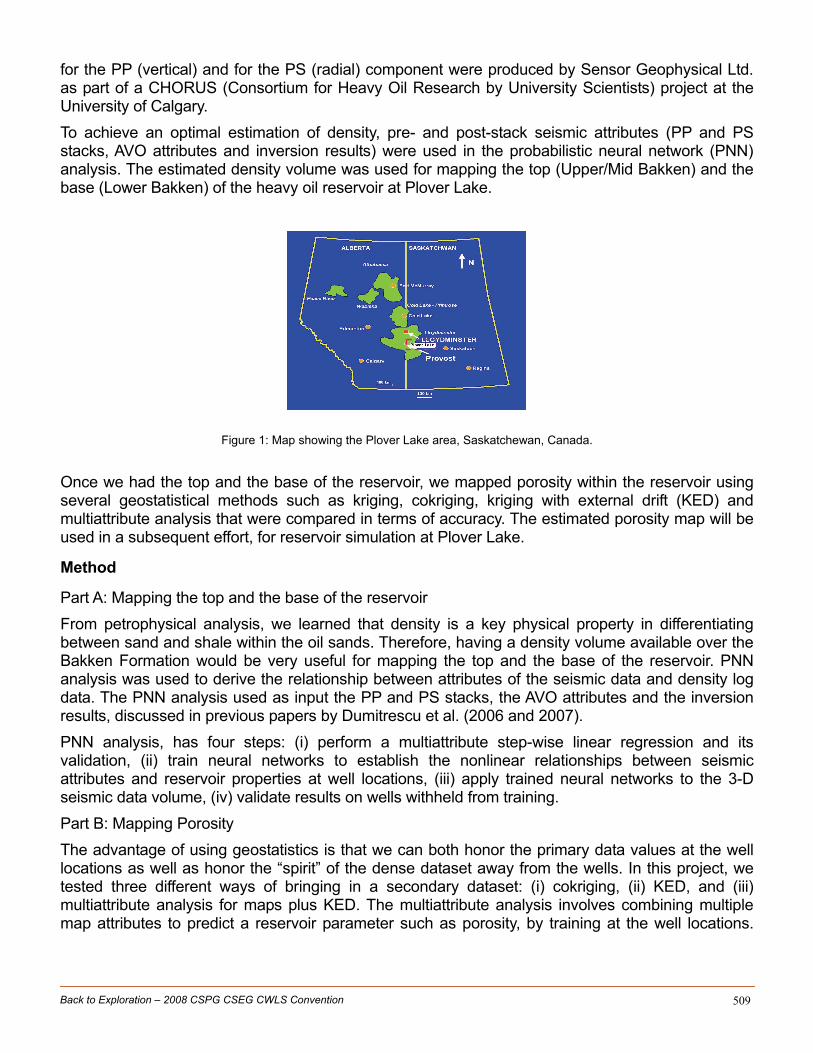
Part A: Mapping the top and the base of the reservoir Neural network analysis used as a target log the density from 22 wells and as external attributes seven seismic volumes: P-wave reflectivity, S-wave reflectivity, the Fluid Factor, the PP and PS stacks, P-wave impedance and S-wave impedance. Figure 2 (left) presents a cross-plot of Density and Gamma Ray logs (colored by porosity) with zones defining sand and shale within the reservoir and at all 22 wells. The same zones are identified on the cross-plot of the actual and predicted density logs (Figure 2, right).
2000 2650Density (kg/m3)
Gamma Ray (api)
0
200
Porosity (%)
19
35
sand
shale
2000 2650Actual density (kg/m3)
Predicted density (kg/m3)
2650
sand
shale
Cross-correlation=96%
2000 2650Density (kg/m3)
Gamma Ray (api)
0
200
Porosity (%)
19
35
sand
shale
2000 2650Actual density (kg/m3)
Predicted density (kg/m3)
2650
sand
shale
Cross-correlation=96%
Figure 2: (left) Cross-plot of the Gamma Ray and Density logs (colored by porosity) and (right) Cross-plot of the actual density and predicted density logs using PNN. A perfect prediction
corresponds to the red diagonal line. Data points from the analysis zone of all 22 wells.
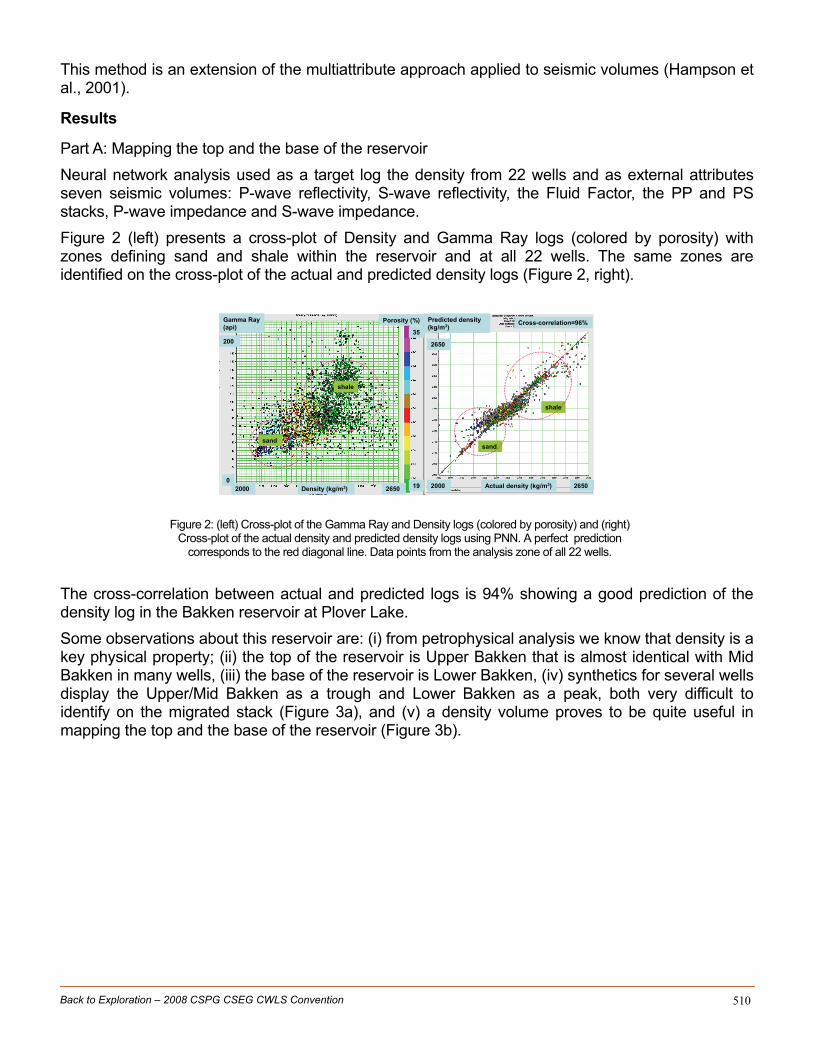
The cross-correlation between actual and predicted logs is 94% showing a good prediction of the density log in the Bakken reservoir at Plover Lake. Some observations about this reservoir are: (i) from petrophysical analysis we know that density is a key physical property; (ii) the top of the reservoir is Upper Bakken that is almost identical with Mid Bakken in many wells, (iii) the base of the reservoir is Lower Bakken, (iv) synthetics for several wells display the Upper/Mid Bakken as a trough and Lower Bakken as a peak, both very difficult to identify on the migrated stack (Figure 3a), and (v) a density volume proves to be quite useful in mapping the top and the base of the reservoir (Figure 3b).
Back to Exploration – 2008 CSPG CSEG CWLS Convention 511
T
LB
MB
W
2100
2650
T
LB
MB
W
a
b
Density (kg/m3)
T
LB
MB
W
2100
2650
T
LB
MB
W
a
b
Density (kg/m3)
Figure 3: (a) Rp and inserted synthetic traces for several wells and (b) density results on EW line 37 of the 3D. Inserted in color are the density logs. All the wells tie this line within a 60 m
projection distance. (W: Waseca, MB: Mid Bakken, LB: Lower Bakken, T: Torquay).
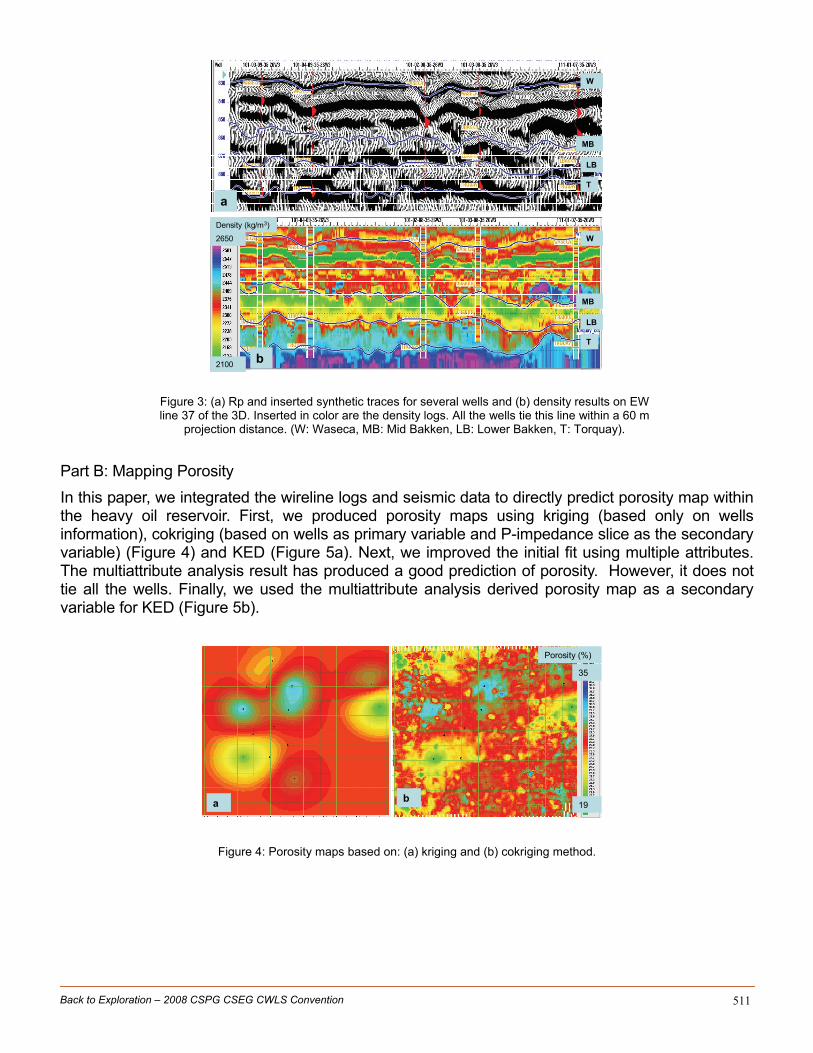
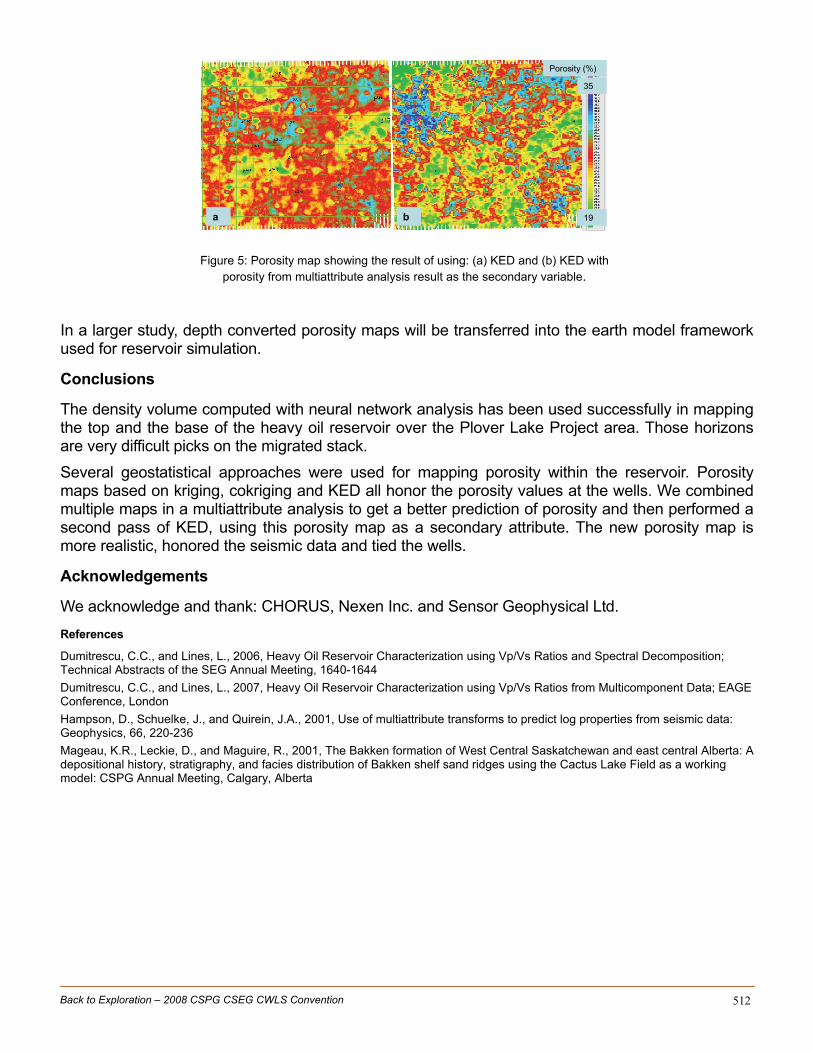
Part B: Mapping Porosity In this paper, we integrated the wireline logs and seismic data to directly predict porosity map within the heavy oil reservoir. First, we produced porosity maps using kriging (based only on wells information), cokriging (based on wells as primary variable and P-impedance slice as the secondary variable) (Figure 4) and KED (Figure 5a). Next, we improved the initial fit using multiple attributes. The multiattribute analysis result has produced a good prediction of porosity. However, it does not tie all the wells. Finally, we used the multiattribute analysis derived porosity map as a secondary variable for KED (Figure 5b).
a b19
35
Porosity (%)
a b19
35
Porosity (%)
Figure 4: Porosity maps based on: (a) kriging and (b) cokriging method.
Back to Exploration – 2008 CSPG CSEG CWLS Convention 512
a b 19
35
Porosity (%)
a b 19
35
Porosity (%)
Figure 5: Porosity map showing the result of using: (a) KED and (b) KED with porosity from multiattribute analysis result as the secondary variable.
In a larger study, depth converted porosity maps will be transferred into the earth model framework used for reservoir simulation.
Conclusions
The density volume computed with neural network analysis has been used successfully in mapping the top and the base of the heavy oil reservoir over the Plover Lake Project area. Those horizons are very difficult picks on the migrated stack. Several geostatistical approaches were used for mapping porosity within the reservoir. Porosity maps based on kriging, cokriging and KED all honor the porosity values at the wells. We combined multiple maps in a multiattribute analysis to get a better prediction of porosity and then performed a second pass of KED, using this porosity map as a secondary attribute. The new porosity map is more realistic, honored the seismic data and tied the wells.
Acknowledgements
We acknowledge and thank: CHORUS, Nexen Inc. and Sensor Geophysical Ltd.
References
Dumitrescu, C.C., and Lines, L., 2006, Heavy Oil Reservoir Characterization using Vp/Vs Ratios and Spectral Decomposition; Technical Abstracts of the SEG Annual Meeting, 1640-1644 Dumitrescu, C.C., and Lines, L., 2007, Heavy Oil Reservoir Characterization using Vp/Vs Ratios from Multicomponent Data; EAGE Conference, London Hampson, D., Schuelke, J., and Quirein, J.A., 2001, Use of multiattribute transforms to predict log properties from seismic data: Geophysics, 66, 220-236 Mageau, K.R., Leckie, D., and Maguire, R., 2001, The Bakken formation of West Central Saskatchewan and east central Alberta: A depositional history, stratigraphy, and facies distribution of Bakken shelf sand ridges using the Cactus Lake Field as a working model: CSPG Annual Meeting, Calgary, Alberta