seismic damage assessment of rc building with the …
TRANSCRIPT

SEISMIC DAMAGE ASSESSMENT OF RC BUILDING WITH THE TRANSFER SLAB SYSTEM
MOHAMED ELASSALY & MOHAMED NABIL Structural Engineering Department, Fayoum University, Egypt
ABSTRACT Over the past decade, several studies investigated behavior aspects of irregular structures and limitations of seismic code provisions for such class of buildings. This paper investigates the dynamic and seismic behavior of buildings employing thick transfer slab between two different structural systems, representing podium and upper tower. The shape of these structures is commonly dictated by either aesthetic or functional considerations that often preclude simplicity or regularity. The purpose of this paper is to assess the seismic damage potential of such structures compared to regular buildings. The seismic behavior is examined under the effects of 6 natural ground motions. The structural damage assessment is conducted through examining drift ratios and damage indices of the overall structure as well as of the significant structural components of RC building. Other significant seismic design parameters such as base and story shear are also assessed for the varying ground motion characteristics. The evaluation and the comparison of the seismic behavior of these buildings, has great impact in attenuating the seismic structural response under various earthquake ground motions. Nonlinear dynamic analyses are performed on a 2-dimensional model of R.C. building. Keywords: transfer structures, dynamic behavior, damage index, story drift ratios, shear story.
1 INTRODUCTION Because of the large increase in population density in many countries of the world, the multiple usage of one building has become an important architectural and investment issue. Buildings that have transfer slab system, would facilitate such multi-purpose and multi-function buildings. Transfer slab system involves a podium structure that houses spaces functional areas such as a shopping mall, a large lift lobby, parking, commercial markets, multi-purpose halls, etc. For the upper part of structure, it is often used as office and residential units using more economical and shorter span design. Using transfer slab system between these two parts of the building has become common solution. To achieve this result, the layout of the podium structure can use spaced columns in longer span design, while the upper floor implies columns with short spans. Thus, spacing between columns would be much shorter than those in podium zone. In the recent years, research work has been done to study the behavior of R.C buildings with transfer systems under seismic loads [1]–[4]. Most of the building models that were used in those research works were fabricated using micro-concrete with steel wires to simulate reinforcement in concrete. Table 1 presents the peak ground motions used in shaking table tests, in those studies. The shaking table tests indicated that under minor earthquake attacks, all the buildings remained elastic, no cracks were found in the models. In addition, tests revealed that natural frequencies of those models did not decrease. When the models are subjected to moderate earthquakes, cracks began to occur at the tops of columns below transfer beams and at the base of 1st floor columns, following the transfer beams. After major earthquakes, all the models are severely damaged. Response of the damaged models showed considerable inelastic behavior.
Earthquake Resistant Engineering Structures XI 83
www.witpress.com, ISSN 1746-4498 (on-line) WIT Transactions on The Built Environment, Vol 172, © 2017 WIT Press
doi:10.2495/ERES170081

Table 1: Peak ground acceleration of prototypes adopted in shaking table test.
Earthquake intensity Huang et al. [2] Li et al. [3]Minor 0.035–0.04g 0.02–0.06gModerate 0.07–0.12g 0.08–0.14gMajor 0.16g 0.15–0.34g
Zhao and Hao [1], studied a 68-storey commercial building. The building model had two transfer structure elements located in the 6th and 38th floors of the building. After major earthquakes; serious damage was found in the peripheral shear walls above the transfer floor. Shear and central core wall structures in the middle and upper floors could have been damaged by shear. The shear wall structure above the transfer floor was supported by a peripheral frame that is relatively weak in lateral and torsional stiffness. Extensive cracks were found in the peripheral frame below the transfer floor. However, only minor cracks were observed in the core walls just above and below the transfer floor. Both natural frequencies and damping ratios started to change when the models were subjected to occasional earthquakes. Huang et al. [2], used a shaking table analysis for a model of 28 stories R.C residential building with a transfer floor located at the 9th floor. After major earthquakes, serious damage was found in the peripheral shear walls above the transfer floor. Shear and central core wall structures in the middle and upper floors could have been damaged by shear. A weak floor formed at the floor above the transfer structure. Li et al. [3], investigated the seismic behavior of a R.C residential building which has 34 typical floors above a 2.7 m thick transfer plate and a three-level podium. After major earthquakes, tension failure was found on the end of shear walls in the vicinity above the transfer plate. Floor slabs and beam-wall joints were also cracked. Xu et al. [4], investigated the effects of the vertical positioning of the transfer structure system on the seismic response behavior of frame-supported shear wall structures. They found that the most onerous soft story behavior phenomenon was expected, when the transfer floor is located at a level close to 40% of the height of the building; for such case, the maximum inter-story drift was expected at the transfer floor level. The present research paper discusses, analytically, the effects of existence of transfer slab system on the seismic behavior of such buildings. The effects of transfer slab position or its elevation level are also investigated. The present study helps in understanding the expected variation in the seismic behavior of such buildings, compared to that of regular building. Analyses of 2-dimensional models of R.C. building are performed using the computer programs ETABS [5], and IDARC2D V.6.1. [6].
2 HYPOTHETICAL STRUCTURE AND MATHEMATICAL MODELING Fig. 1 presents an elevation view for the considered hypothetical 20 story plane frame model which has a floor height of 3.0 m. The R.C. model can be visualized as subdivided into three zones or parts; 1) The podium part, 2) The floor containing the transfer slab system and 3) The tower part. In the present study, the transfer slab system exists either in the first, fourth, sixth or eighth floor, for models B1, B2, B3 and B4, respectively. Frame spacing is assumed to be 5.0 m, for all building models. Distance between columns axis is set to 5.0 m, for the tower part and 9.50 m, for podium part. The structural systems for the podium and the tower are consisted of reinforced concrete solid slabs supported over series of columns. The slab thickness for podium floors is set to 16 cm, and 12 cm for tower slabs. The beam dimensions are 25×60 cm for tower slabs and 25×90 cm for podium slabs. The transfer slab
84 Earthquake Resistant Engineering Structures XI
www.witpress.com, ISSN 1746-4498 (on-line) WIT Transactions on The Built Environment, Vol 172, © 2017 WIT Press
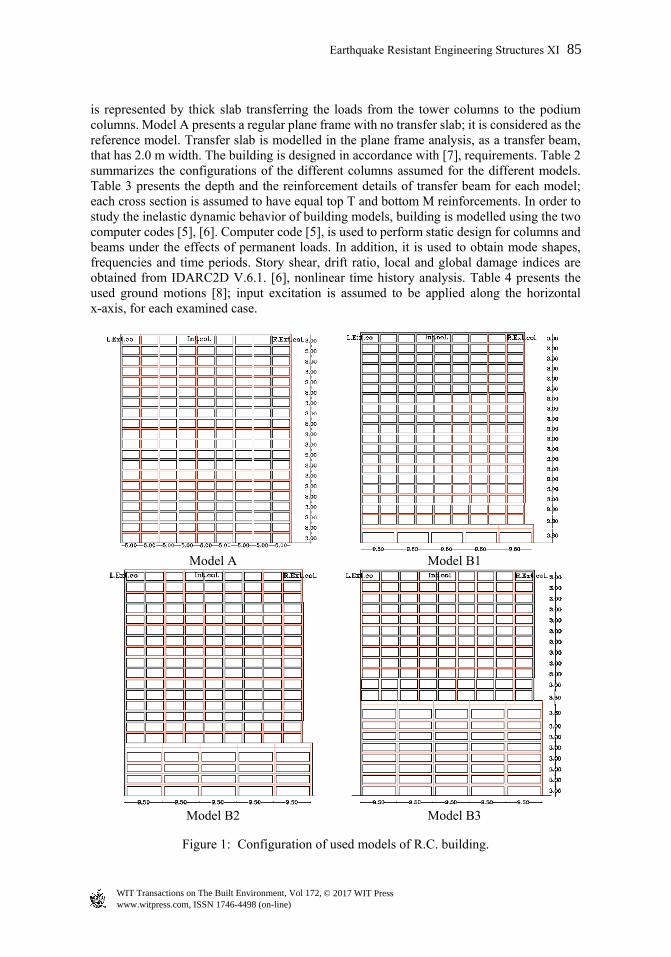
is represented by thick slab transferring the loads from the tower columns to the podium columns. Model A presents a regular plane frame with no transfer slab; it is considered as the reference model. Transfer slab is modelled in the plane frame analysis, as a transfer beam, that has 2.0 m width. The building is designed in accordance with [7], requirements. Table 2 summarizes the configurations of the different columns assumed for the different models. Table 3 presents the depth and the reinforcement details of transfer beam for each model; each cross section is assumed to have equal top T and bottom M reinforcements. In order to study the inelastic dynamic behavior of building models, building is modelled using the two computer codes [5], [6]. Computer code [5], is used to perform static design for columns and beams under the effects of permanent loads. In addition, it is used to obtain mode shapes, frequencies and time periods. Story shear, drift ratio, local and global damage indices are obtained from IDARC2D V.6.1. [6], nonlinear time history analysis. Table 4 presents the used ground motions [8]; input excitation is assumed to be applied along the horizontal x-axis, for each examined case.
Model A Model B1
Model B2 Model B3
Figure 1: Configuration of used models of R.C. building.
Earthquake Resistant Engineering Structures XI 85
www.witpress.com, ISSN 1746-4498 (on-line) WIT Transactions on The Built Environment, Vol 172, © 2017 WIT Press

Table 2: Configurations and RFT details of model columns.
CE: External column section; CI: Internal column section.
Table 3: Configurations and RFT of transfer beam sections with 200 cm width.
Building model
Transfer beam Building model
Transfer beam Model Depth,
cm RFT, (bottom and top) cm2
Model Depth, cm
RFT, (bottom and top) cm2
B1 BL* BI* BR*
160 157.5 123.0 113.0
B3 BL BI BR
140 101.0 95.00 85.00
B2
BL BI BR
150 139.0 111.0 101.0
B4
BL BI BR
130 119.3 95.00 85.00
*BL: Left external beam section; BI: internal beam section; BR: Right external beam section.
Table 4: Characteristics of the used ground motions [8].
Excitation Earthquake component Date M PGA
(g)PGV (m/s)
a/v ratio (g/ms-1)
EQ.1 Parkfield / PARKF/ C02065 28/06/1966 6.1 0.476 75.1 0.63
EQ.2 Northridge / NORTHR/PAR--L 17/01/1994 6.7 0.657 75.2 0.87
EQ.3 San Fernando / SFERN/PCD164 09/02/1971 6.6 1.226 112.5 1.09
EQ.4 Northridge / NORTHR/SYL360 17/01/1994 6.7 0.843 129.6 0.65
EQ.5 Northridge / NORTHR/MUL279 17/01/1994 6.7 0.516 62.8 0.82
EQ.6 Gazli, USSR / GAZLI/GAZ090 17/05/1976 6.8 0.718 71.6 1.00
Building model
Podium part Tower partColumn model
Cross section A×B, cm×cm
RFT, cm2
Column model
Cross section A×B, cm×cm
RFT, cm2
A CE CI
60×60 70×70
56.28 76.83
B1 CE CI
65×65 95×95
108.02 235.68
CE CI
55×55 65×65
48.08 77.34
B2
CE CI
65×65 95×95
108.02 235.68
CE CI
60×60 60×60
41.76 65.80
B3 CE CI
65×65 95×95
108.02 235.68
CE CI
50×50 55×55
29.36 56.26
B4 CE CI
65×65 100×100
108.02 255.32
CE CI
45×45 55×55
33.40 57.78
86 Earthquake Resistant Engineering Structures XI
www.witpress.com, ISSN 1746-4498 (on-line) WIT Transactions on The Built Environment, Vol 172, © 2017 WIT Press
3 NONLINEAR TIME HISTORY ANALYSIS Seismic hazards of R.C. building models are assessed by nonlinear time history analyses. Two-dimensional models of interior frames of sample buildings, are investigated. Torsion effects are ignored since all investigated models are assumed to have regular plan configurations. Effects of infill walls on the overall stiffness of models, are not accounted for. A time step of 0.001s and a 5% Rayleigh proportional damping are selected. The computer programs ETABS [6], and IDARC2D V.6.1. [7], are employed. The analysis takes into consideration the P-delta effects. A smooth hysteretic model is used to simulate the elastic-yield transition and the shape of unloading; it incorporates stiffness degradation, strength deterioration, non-symmetric response, slip-lock and a tri-linear monotonic envelope. Significant structural features, including damage indices, inter-story drift ratios and base shear are calculated for each investigated case.
4 DISCUSSION OF ANALYSIS RESULTS The effects of the existence of transfer slab/beam are evaluated by comparing results of maximum story drift ratio, maximum shear story and local damage along the height of the building, as well as the overall damage index, of B Models with those of Model A. Comparing the dynamic properties of Model A with other models gives us a comprehensive picture of the effects of the transfer slab system, as well as its effects due to its elevation level position. The dynamic properties of building models are investigated through examining their mode shapes and fundamental frequencies. Fig. 2 demonstrates the mode shapes as well as the periods of the first three modes of Models A, B1, B3 and B4. Fig. 3 presents the changes of periods of the first 10 modes when compared with that of Model A. The fundamental period of Model B1 increases by 0.18% when compared that of Model A. For the other models, the increase varies from 0.25%, 4.00% and 4.72% for models B2, B3 and B4, respectively. Fig. 4 shows the variation of story shear as a percentage of total building weight (WT) of Model A and Model B4, when subjected to six different ground motions. For Model A, the figure shows a typical variation of story shear, where the highest value exists at the base; hence, it gradually decrease towards the top of the model. The maximum base shear varies from 4% to 8% of total model weight, for both models, according to the applied ground motion excitation. For Model B4, transfer system has significant effects on story shear distribution, since all of the columns beneath the transfer beam, suffer significantly high values of story shear. A significant decrease in story shear is expected for the column stories above the transfer system. In order to demonstrate the expected variation of maximum story shear for the different investigated models due to the transfer system, a plot of the maximum change of story shear of Model B, compared to that of Model A, is depicted in Fig. 5. The maximum change in story shear of a particular floor of Model B, is represented as:
. # .
. , (1)
where, SSB# is the story shear in a particular floor of models B; SSA is the story shear in the same floor of Model A. Fig. 5a shows that the story shear for the tower part of Model B1, is decreased by 10% to 58%, when compared to that of Model A, for the different applied earthquake ground motion. For the part of transfer system, story shear increases by almost 38% to 101%. It should be noted that for case of Model B1, the transfer slab part is considered as the podium part. Figs 5(b), 5(c) and 5(d) demonstrate similar distribution of the change of the story shear along the height of Models B2, B3 and B4, when compared to that of Model A. The figures show behavior for the tower parts of different models similar to that of Model B1, where story shear is decreased by almost 6% to 73%. The amount of decrease in story
Earthquake Resistant Engineering Structures XI 87
www.witpress.com, ISSN 1746-4498 (on-line) WIT Transactions on The Built Environment, Vol 172, © 2017 WIT Press

T1 = 2.776 s T2 =0.906 s T3 = 0.521 s T1 = 2.781 s T2 =0.903 s T3 = 0.521s
Model A Model B1
T1 = 2.783 s T2 =0.952 s T3 = 0.648 s T1 = 2.907 s T2 =1.163 s T3 = 0.591 s
Model B3 Model B4
Figure 2: First three mode shapes and periods of studied models.
Figure 3: Variation of mode periods for the first ten mode shapes of studied models.
shear of tower part increases with the increase of transfer slab position level. For the floors, where transfer slab exists, the story shear of Models B2, B3 and B4 increase by almost 6% to 89% according to the applied earthquake. It should be noted that change of shear story for the floor where transfer slab exist, may be much larger than the change of story shear in podium part including base shear. Finally, the change of shear story for the podium part of the Models B2, B3 and B4 are much larger than those of Model A; the percentage of increase may reach as high as 100%. In general, the existence of transfer slab system causes increase in shear story in podium part and in the floor that contains transfer system; whereas, it causes decrease in story shear in tower part.
0
0.5
1
1.5
2
2.5
3
3.5
1 2 3 4 5 6 7 8 9 10
Modal # AModal # B.1Modal # B.2Modal # B.3Modal # B.4
Perio
d ,(
t, S)
Model #
88 Earthquake Resistant Engineering Structures XI
www.witpress.com, ISSN 1746-4498 (on-line) WIT Transactions on The Built Environment, Vol 172, © 2017 WIT Press

Figure 4: Variation of story shear as a percentage of building weight for models A and B4.
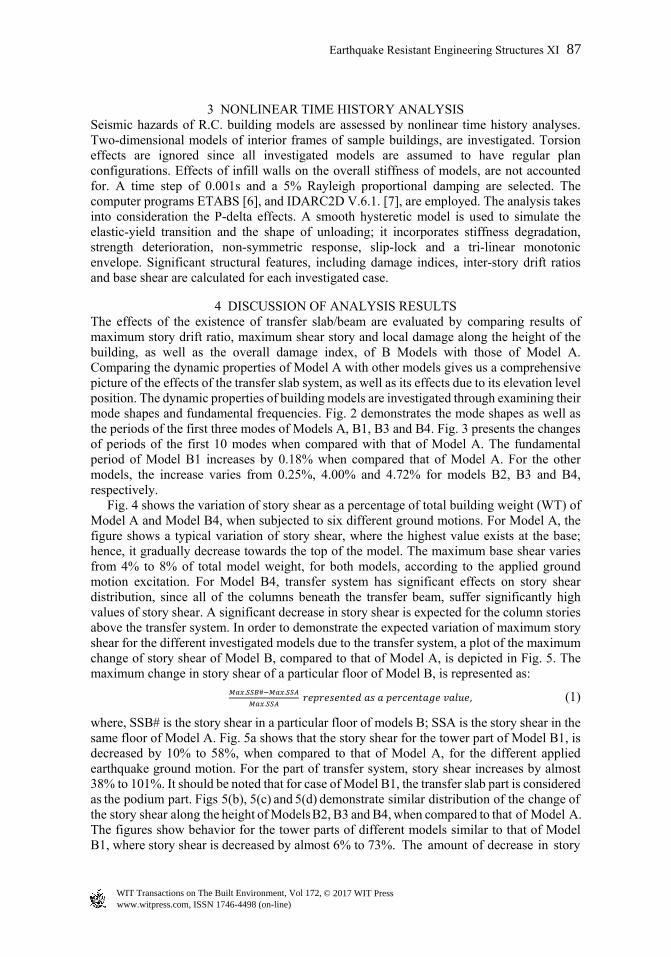
Fig. 6 shows the peak story drift ratios along the height of Models A and B4. For Model A, it is noted that maximum peak drift ratio is expected at the lower third of the total height. Top floors suffer minimum drift ratios. Top floor drift is insignificant because drift ratio has a small value. For Model B4, the effects of transfer system are clearly shown. A significant decrease in drift ratio on the story where transfer system exists. A significant increase in drift ratio of the first story above transfer system is depicted. For the following upper floor, the same substantial increase is expected. Fig. 7 demonstrates the changes of story drift ratios along height of B Models in comparison to its similar stories of Model A. Again, the maximum change in story drift of a particular floor of models B, is represented as:
. # .
. , (2)
where, SDB# is the story drift in a particular floor of Models B; SDA is the story drift in the same floor of Model A. The transfer story drift is decreased by almost 34% to 90% in comparison to similar stories of Model A. First story of tower part has significant increase in drift ratio. The drift ratio of higher stories increases directly proportional with the height of transfer slab position level. In podium part, the change in drift story is decreased with the increasing of the elevation level of transfer system. Finally, it could be deduced that, story drift at transfer system floor decreases significantly; whereas, the following first story above it, may suffer excessive drift ratios; hence, it may be subjected to soft story mechanism.
0
2
4
6
8
10
12
14
16
18
20
0% 2% 4% 6% 8%
EQ.1
EQ.2
EQ.3
EQ.4
EQ.5
EQ.6
Sto
ry#.
Max. story shear (% of WT), Model A
0
2
4
6
8
10
12
14
16
18
20
0% 2% 4% 6% 8%
EQ1
EQ2
EQ3
EQ4
EQ5
EQ6
Sto
ry #
.
Max. story shear (% of WT), Model B
Earthquake Resistant Engineering Structures XI 89
www.witpress.com, ISSN 1746-4498 (on-line) WIT Transactions on The Built Environment, Vol 172, © 2017 WIT Press

(a) Model B1 (b) Model B2
(c) Model B3 (d) Model B4
Figure 5: Variation along height of models, of the maximum change of story shear, when subjected to six different input excitations.
0
2
4
6
8
10
12
14
16
18
20
-60% -40% -20% 0% 20% 40% 60% 80% 100%
EQ.1
EQ.2
EQ.3
EQ.4
EQ.5
EQ.6
Max. story shear (% of WT)
Stor
y #
0
2
4
6
8
10
12
14
16
18
20
-60% -40% -20% 0% 20% 40% 60% 80% 100%
EQ.1
EQ.2
EQ.3
EQ.4
EQ.5
EQ.6
Max. story shear (% of WT)
0
2
4
6
8
10
12
14
16
18
20
-80% -60% -40% -20% 0% 20% 40% 60% 80%
EQ.1
EQ.2
EQ.3
EQ.4
EQ.5
EQ.6
Max. story shear (% of WT)
0
2
4
6
8
10
12
14
16
18
20
-80% -60% -40% -20% 0% 20% 40% 60% 80% 100%
EQ.1
EQ.2
EQ.3
EQ.4
EQ.5
EQ.6
Max. story shear (% of WT)
90 Earthquake Resistant Engineering Structures XI
www.witpress.com, ISSN 1746-4498 (on-line) WIT Transactions on The Built Environment, Vol 172, © 2017 WIT Press
Max. story drift, %, Model A Max. story drift, %, Model B4
Figure 6: Variation of max. story drift ratio (%), along the height of Models A and B4.
Fig. 8 shows a typical distribution of local damage along the height of Model A, when subjected to different ground motions. It is noticed that top stories suffer minimum local damage. Maximum damage is expected to occur in the lower third of the building. Fig. 9 shows the local damage along the height of B Models along with that of Model A when subjected to EQ4. The figure shows that local damage distribution is greatly affected by transfer system existence and its position level. The figure shows that top stories, of Models B suffer low values of local damage, even though they are higher than those of Model A. Stories located at podium part suffer less values of local damage indices, when compared to those of Model A. The floor following the transfer system may be subjected the excessive increase in local damage; this escalation increases with the increase of elevation position of transfer system. Fig. 10 shows variation of story damage for B Models, when subjected to different ground motions. The figures show that the peak of local damage always occurs on the first floor following transfer system floor. This peak increases with the increasing of the height of transfer slab elevation level. This increase may reach as high as seven to eight times of maximum peak of comparable Model A. It should be noted that B Models collapsed when subjected to EQ 6 (not shown); this means that the building efficiency may be decreased significantly by transfer system.
0
2
4
6
8
10
12
14
16
18
20
0.0 1.0 2.0 3.0
EQ.1
EQ.2
EQ.3
EQ.4
EQ.5
EQ.6
Story #
0
2
4
6
8
10
12
14
16
18
20
0.0 1.0 2.0 3.0
EQ1
EQ2
EQ3
EQ4
EQ5
Story #
Earthquake Resistant Engineering Structures XI 91
www.witpress.com, ISSN 1746-4498 (on-line) WIT Transactions on The Built Environment, Vol 172, © 2017 WIT Press

Change of max. story drift ratio, Model B1 Change of max. story drift ratio, Model B2
Change of max. story drift ratio, Model B3 Change of max. story drift ratio, Model B4
Figure 7: Variation along height of B models, of the maximum change of story drifts, when subjected to six different input excitations.
0
2
4
6
8
10
12
14
16
18
20
-100% 0% 100% 200% 300% 400%
EQ.1
EQ.2
EQ.3
EQ.4
EQ.5Sto
ry#
0
2
4
6
8
10
12
14
16
18
20
-100% 0% 100% 200% 300% 400%
EQ.1
EQ.2
EQ.3
EQ.4
EQ.5
EQ.6
Sto
ry#
0
2
4
6
8
10
12
14
16
18
20
-100% 0% 100% 200% 300% 400% 500% 600%
EQ.1
EQ.2
EQ.3
EQ.4
EQ.5
Sto
ry#
0
2
4
6
8
10
12
14
16
18
20
-100% 0% 100% 200% 300% 400%
EQ.1
EQ.2
EQ.3
EQ.4
EQ.5
Sto
ry#
92 Earthquake Resistant Engineering Structures XI
www.witpress.com, ISSN 1746-4498 (on-line) WIT Transactions on The Built Environment, Vol 172, © 2017 WIT Press

Story damage index
Figure 8: Distribution of local damage along the height of model A.
Figure 9: Distribution of local damage along the height of different models when subjected to EQ4.
0
2
4
6
8
10
12
14
16
18
20
0 0.01 0.02 0.03 0.04
EQ.1
EQ.2
EQ.3
EQ.4
EQ.5
EQ.6
Sto
ry #
0
2
4
6
8
10
12
14
16
18
20
0 0.02 0.04 0.06 0.08
A
B1
B2
B3
B4
Sto
ry #
Story damage index
Earthquake Resistant Engineering Structures XI 93
www.witpress.com, ISSN 1746-4498 (on-line) WIT Transactions on The Built Environment, Vol 172, © 2017 WIT Press

a) Model B1 b) Model B2
c) Model B3 d) Model B4
Figure 10: Variation of story damage for B models, when subjected to different seismic.
5 CONCLUSION This research work presents a limited study on the expected variation that may occur on the dynamic behavior of multi-story R.C. building that implies transfer system in one of its floor slab. The following conclusions may be drawn:
0
2
4
6
8
10
12
14
16
18
20
0 0.01 0.02 0.03 0.04
EQ.1
EQ.2
EQ.3
EQ.4
EQ.5Sto
ry #
Story damage
0
2
4
6
8
10
12
14
16
18
20
0 0.02 0.04 0.06
EQ.1
EQ.2
EQ.3
EQ.4
EQ.5Sto
ry #
Story damage
0
2
4
6
8
10
12
14
16
18
20
0 0.02 0.04 0.06
EQ.1
EQ.2
EQ.3
EQ.4
EQ.5
Sto
ry #
Story damage
0
2
4
6
8
10
12
14
16
18
20
0 0.02 0.04 0.06 0.08
EQ.1
EQ.2
EQ.3
EQ.4
EQ.5
Sto
ry #
Story damage
94 Earthquake Resistant Engineering Structures XI
www.witpress.com, ISSN 1746-4498 (on-line) WIT Transactions on The Built Environment, Vol 172, © 2017 WIT Press

1. The existence of transfer slab system causes increase in story shear in podium part stories as well as in the floor that contains transfer system, when compared to similar stories of model A; whereas, it leads to decrease in story shear in tower part stories.
2. Drift ratios are expected to decrease on the story where transfer system exist, in comparison to similar story of model A.
3. The first story following the floor containing transfer slab may suffer excessive drift ratios; hence, it may be subjected to soft story mechanism.
4. The effects of transfer system on the local damage of top floors of tower part, are expected to be minimum. Local damage of podium stories decreases in comparison to similar stories of model A.
5. The highest peak of local damage always occurs on the first floor following transfer system. This peak increases with the increase of the height of transfer system elevation level. This increase may reach as high as seven to eight times of maximum peak of comparable model A. Thus, the increase of the transfer system elevation level reduces building resistance for ground motions.
REFERENCES [1] Zhao, N. & Hao, R., A model shaking table test for nanjing international commercial
building. Proceedings of the 14th Conference on High-Rise Building Structures, 1996. [2] Huang, X., Jin J., Zhou, F., Yang, Z. & Luo, X., Seismic behavior analysis of a
high-rise building of frame-shear wall structure with high transfer floor. Earthquake Engineering and Engineering Vibration, 24(3), pp. 73–81, 2004.
[3] Li, C.S., Lam, S.S.E., Zhang, M.Z. & Wong, Y.L., Shaking table test of a 1:20 scale high-rise building with a transfer plate system. Journal of Structural Engineering ASCE, 132(11), pp. 1732–1744, 2006.
[4] Xu, M., Qian, J., Fang, X. & Yan W., Experimental & analytical studies of tall buildings with a high-level transfer story. The Structural Design of Tall and Special Buildings, 16(3), pp. 301–319, 2007.
[5] ETABS. Integrated analysis, design and drafting of building systems, Computers and Structures, Berkeley, CA, 2015.
[6] IDARC2D. V.6.1., A computer program for seismic inelastic structural analysis, Department of Civil, Structural and Environmental Engineering, University at Buffalo, New York, 2006.
[7] ACI 318-14, Building Code Requirements for Structural Concrete and Commentary, American Concrete Institute, 2014.
[8] PEER, Strong Motion Database, The Pacific Earthquake Engineering Research Center and the University of California, Online. http://peer.berkeley.edu/ngawest2/databases/. 2000.
Earthquake Resistant Engineering Structures XI 95
www.witpress.com, ISSN 1746-4498 (on-line) WIT Transactions on The Built Environment, Vol 172, © 2017 WIT Press