seismic interstory drift demands in steel...
TRANSCRIPT

SEISMIC INTERSTORY DRIFT DEMANDS IN STEEL FRICTION
DAMPED BRACED BUILDINGS
A Thesis
by
LUIS EDUARDO PETERNELL ALTAMIRA
Submitted to the Office of Graduate Studies of
Texas A&M University
in partial fulfillment of the requirements for the degree of
MASTER OF SCIENCE
May 2009
Major Subject: Civil Engineering

SEISMIC INTERSTORY DRIFT DEMANDS IN STEEL FRICTION
DAMPED BRACED BUILDINGS
A Thesis
by
LUIS EDUARDO PETERNELL ALTAMIRA
Submitted to the Office of Graduate Studies of
Texas A&M University
in partial fulfillment of the requirements for the degree of
MASTER OF SCIENCE
Approved by:
Chair of Committee, Gary T. Fry
Committee Members, Terry Creasy
Terry Kohutek
Head of Department, David Rosowsky
May 2009
Major Subject: Civil Engineering

iii
ABSTRACT
Seismic Interstory Drift Demands in Steel Friction Damped Braced Buildings.
(May 2009)
Luis Eduardo Peternell Altamira, B.S., Universidad de las Américas, Puebla, Mexico
Chair of Advisory Committee: Dr. Gary T. Fry
In the last 35 years, several researchers have proposed, developed and tested different
friction devices for seismic control of structures. Their research has demonstrated that
such devices are simple, economical, practical, durable and very effective.
However, research on passive friction dampers, except for few instances, has not
been given appropriate attention lately. This has caused some of the results of old studies
to become out-of-date, lose their validity in the context of today’s design philosophies or
to fall short on the expectations of this century’s structural engineering.
An analytical study on the behavior of friction devices and the effect they have
on the structures into which they are incorporated has been undertaken to address the
new design trends, codes, evaluation criteria and needs of today’s society.
The present study consists of around 7,000 structural analyses that are used to
show the excellent seismic performance and economic advantages of Friction Damped
Braced Frames. It serves, at the same time, to improve our understanding on their
dynamic behavior. Finally, this thesis also sets the basis for future research on the
application of this type of seismic energy dissipating systems.
iv
ACKNOWLEDGEMENTS
I would like to acknowledge the technical guidance and constant motivation provided by
my thesis advisor and Chair of Committee Dr. Gary T. Fry.
I appreciate the financial support provided by the Mexican National Council for
Science and Technology (CONACyT) and the Texas Transportation Institute (TTI)
without which the completion of this stage of my academic life at Texas A&M
University would have represented additional challenges.
Finally, I also would like to make use of this opportunity to recognize and thank
all those who, among professors and students, contributed with their ideas, experience
and/or moral support to the conclusion of this work.

v
TABLE OF CONTENTS
Page
ABSTRACT ..................................................................................................................... iii
ACKNOWLEDGEMENTS .............................................................................................. iv
LIST OF FIGURES ..........................................................................................................vii
LIST OF TABLES ......................................................................................................... xiii
1. INTRODUCTION ...................................................................................................... 1
2. BACKGROUND ........................................................................................................ 4
2.1 History of Friction Devices ................................................................................. 4 2.2 Pall Friction Dampers ........................................................................................ 14
2.3 Seismic Strengthening of Structures ................................................................. 17 2.4 Performance Based Design................................................................................ 18
2.5 The Benchmark Buildings ................................................................................. 21 2.6 Earthquake Records ........................................................................................... 22
3. RESEARCH OBJECTIVE ....................................................................................... 23
4. MODELING AND ALGORITHM ........................................................................... 25
4.1 Analytical Modeling of the Frames ................................................................... 25 4.2 Analytical Modeling of the Friction Damped Braces........................................ 27 4.3 Validation of Models ......................................................................................... 29
4.4 Philosophy and Algorithm ................................................................................. 36
5. RESULTS ................................................................................................................. 42
5.1 3-Story Building ................................................................................................ 42
5.2 9-Story Building ................................................................................................ 71 5.3 20-Story Building .............................................................................................. 99
6. REDESIGN OF THE BENCHMARK BUILDINGS ............................................. 117
6.1 3-Story Building .............................................................................................. 118 6.2 9-Story Building .............................................................................................. 119 6.3 20-Story Building ............................................................................................ 120
vi
Page
6.4 Weights of the Original, Braced and Redesigned Buildings ........................... 121
7. DISCUSSION ......................................................................................................... 130
8. CONCLUSIONS ..................................................................................................... 133
REFERENCES ............................................................................................................... 135
VITA .............................................................................................................................. 139
vii
LIST OF FIGURES
Page
Figure 2.1: Hysteresis loops of limited slip bolted joints (Soong and Dargush 1997) ...... 6
Figure 2.2: Friction Damper of Pall (1982) ........................................................................ 7
Figure 2.3: Hysteresis loops for X-braced friction damper (Soong and Dargush 1997).... 8
Figure 2.4: Sumitomo friction damper and installation detail (Aiken and Kelly 1990) .... 9
Figure 2.5: Slotted bolted connection of Fitzgerald (1989) and typical force-
displacement loop ........................................................................................... 10
Figure 2.6: Slotted bolted connection of Grigorian (1993) and typical force
displacement loop ........................................................................................... 11
Figure 2.7: Friction device of Constantinou (1991a) and force-displacement loop in
200-cycle test .................................................................................................. 12
Figure 2.8: EDR configuration schematic (Soong and Dargush 1997) ............................ 12
Figure 2.9: X-braced friction damper (PDL) ................................................................... 14
Figure 2.10: Diagonal tension/compression braced friction damper (PDL) .................... 15
Figure 2.11: Chevron-braced friction damper (PDL) ....................................................... 15
Figure 2.12: Hysteresis loop (Pall and Pall 2004) ............................................................ 15
Figure 2.13: Response versus slip-load (Pall and Pall 2004) ........................................... 16
Figure 2.14: Damage control and building performance levels (FEMA 2000) ............... 20
Figure 2.15: Structural performance levels and damage (FEMA 2000) .......................... 20
Figure 4.1: Post-yield behavior of ASCE-41 nonlinear hinges (CSI 2007a) ................... 26
Figure 4.2: Definition of parameters for the Wen plasticity property (CSI 2007a) ......... 28
Figure 4.3: Mode shapes for the 3-, 9-, and 20-story building models
(Ohtori et al. 2004) ......................................................................................... 31

viii
Page
Figure 4.4: Coulomb and Viscous Friction block (TheMathWorks 2008) ...................... 33
Figure 4.5: SIMULINK model for verification of the SAP2000 friction damped
brace model behavior ..................................................................................... 34
Figure 4.6: a) SDF structure with friction damped brace, b) MDF structure with
friction damped braces ................................................................................... 35
Figure 4.7: a) Response of SDF structure to the sinusoidal force, b) Response of the
MDF to the sinusoidal forces ......................................................................... 35
Figure 5.1: Three-story benchmark building north-south moment-resisting frame
(Ohtori et al. 2004) ......................................................................................... 42
Figure 5.2: BSE-1 and BSE-2 interstory drift demands in the 3-story building .............. 44
Figure 5.3: Performance of interstory drift ratio criterion in the 3-story building
(part 1) ............................................................................................................ 45
Figure 5.4: Performance of interstory drift ratio criterion in the 3-story building
(part 2) ............................................................................................................ 46
Figure 5.5: Performance of interstory drift ratio criterion in the 3-story building
(part 3) ............................................................................................................ 47
Figure 5.6: Sub-optimal FDB configuration determined after the consideration of
the BSE-1 earthquake records ........................................................................ 48
Figure 5.7: Effect of FDB parameters on the 1st FDB 3-story building (part 1) .............. 49
Figure 5.8: Effect of FDB parameters on the 1st FDB 3-story building (part 2) .............. 50
Figure 5.9: Effect of FDB parameters on the 1st FDB 3-story building (part 3) .............. 51
Figure 5.10: Effect of FDB parameters on the 1st FDB 3-story building (part 4) ............ 52
Figure 5.11: Effect of FDB parameters on the 1st FDB 3-story building (part 5) ............ 53
Figure 5.12: Effect of FDB parameters on the 1st FDB 3-story building (part 6) ............ 54
Figure 5.13: BSE-2 peak interstory drift ratios of the first proposed FDBF .................... 56

ix
Page
Figure 5.14: Effect of FDB parameters on the 1st FDB 3-story building (part 7) ............ 57
Figure 5.15: Second proposed FDBF ............................................................................... 58
Figure 5.16: Effect of FDB parameters on the 2nd
FDB 3-story building (part 1) ........... 59
Figure 5.17: Effect of FDB parameters on the 2nd
FDB 3-story building (part 2) ........... 60
Figure 5.18: Effect of FDB parameters on the 2nd
FDB 3-story building (part 3) ........... 61
Figure 5.19: Effect of FDB parameters on the 2nd
FDB 3-story building (part 4) ........... 62
Figure 5.20: Comparative peak interstory drift ratios of 3-story FDBF and benchmark . 63
Figure 5.21: Comparative interstory drift ratios of 3-story FDBF and benchmark
(part 1) ............................................................................................................ 64
Figure 5.22: Comparative interstory drift ratios of 3-story FDBF and benchmark
(part 2) ............................................................................................................ 65
Figure 5.23: Comparative interstory drift ratios of 3-story FDBF and benchmark
(part 3) ............................................................................................................ 66
Figure 5.24: Comparative interstory drift ratios of 3-story FDBF and benchmark
(part 4) ............................................................................................................ 67
Figure 5.25: Comparative interstory drift ratios of 3-story FDBF and benchmark
(part 5) ............................................................................................................ 68
Figure 5.26: Comparative interstory drift ratios of 3-story FDBF and benchmark
(part 6) ............................................................................................................ 69
Figure 5.27: Comparative interstory drift ratios of 3-story FDBF and benchmark
(part 7) ............................................................................................................ 70
Figure 5.28: Nine-story benchmark building north-south moment-resisting frame
(Ohtori et al. 2004) ......................................................................................... 71
Figure 5.29: BSE-1 and BSE-2 interstory drift demands of 9-story benchmark
building ........................................................................................................... 72

x
Page
Figure 5.30: Performance of interstory drift ratio criterion in the 9-story building
(part 1) ............................................................................................................ 73
Figure 5.31: Performance of interstory drift ratio criterion in the 9-story building
(part 2) ............................................................................................................ 74
Figure 5.32: Performance of interstory drift ratio criterion in the 9-story building
(part 3) ............................................................................................................ 75
Figure 5.33: Performance of interstory drift ratio criterion in the 9-story building
(part 4) ............................................................................................................ 76
Figure 5.34: Sub-optimal FDBF configurations for the 9-story building ........................ 77
Figure 5.35: Effect of FDB parameters on the FDB 9-story building (part 1) ................. 79
Figure 5.36: Effect of FDB parameters on the FDB 9-story building (part 2) ................. 80
Figure 5.37: Effect of FDB parameters on the FDB 9-story building (part 3) ................. 81
Figure 5.38: Effect of FDB parameters on the FDB 9-story building (part 4) ................. 82
Figure 5.39: Effect of FDB parameters on the FDB 9-story building (part 5) ................. 83
Figure 5.40: Effect of FDB parameters on the FDB 9-story building (part 6) ................. 84
Figure 5.41: Effect of FDB parameters on the FDB 9-story building (part 7) ................. 85
Figure 5.42: Effect of FDB parameters on the FDB 9-story building (part 8) ................. 86
Figure 5.43: BSE-2 peak interstory drift ratios of the first proposed FDBF .................... 87
Figure 5.44: Effect of FDB parameters on the FDB 9-story building (part 9) ................. 88
Figure 5.45: Effect of FDB parameters on the FDB 9-story building (part 10) ............... 89
Figure 5.46: Comparative peak interstory drift ratios of 9-story FDBF and benchmark . 91
Figure 5.47: Comparative interstory drift ratios of 9-story FDBF and benchmark
(part 1) ............................................................................................................ 92

xi
Page
Figure 5.48: Comparative interstory drift ratios of 9-story FDBF and benchmark
(part 2) ............................................................................................................ 93
Figure 5.49: Comparative interstory drift ratios of 9-story FDBF and benchmark
(part 3) ............................................................................................................ 94
Figure 5.50: Comparative interstory drift ratios of 9-story FDBF and benchmark
(part 4) ............................................................................................................ 95
Figure 5.51: Comparative interstory drift ratios of 9-story FDBF and benchmark
(part 5) ............................................................................................................ 96
Figure 5.52: Comparative interstory drift ratios of 9-story FDBF and benchmark
(part 6) ............................................................................................................ 97
Figure 5.53: Comparative interstory drift ratios of 9-story FDBF and benchmark
(part 7) ............................................................................................................ 98
Figure 5.54: Twenty-story benchmark building north-south moment resisting frame
(Ohtori et al. 2004) ......................................................................................... 99
Figure 5.55: BSE-1 interstory drift demands of 20-story benchmark building ............. 100
Figure 5.56: BSE-2 interstory drift demands of 20-story benchmark building ............. 101
Figure 5.57: Performance of interstory drift ratio criterion in the 20-story building
(part 1) .......................................................................................................... 102
Figure 5.58: Performance of interstory drift ratio criterion in the 20-story building
(part 2) .......................................................................................................... 103
Figure 5.59: Sub-optimal FDBF configurations for the 20-story building .................... 104
Figure 5.60: Effect of FDB parameters on the FDB 20-story building (part 1) ............. 106
Figure 5.61: Effect of FDB parameters on the FDB 20-story building (part 2) ............. 107
Figure 5.62: Comparative peak interstory drift ratios of 20-story FDBF and
benchmark (part 1) ....................................................................................... 108
Figure 5.63: Comparative peak interstory drift ratios of 20-story FDBF and
benchmark (part 2) ....................................................................................... 109
xii
Page
Figure 5.64: Comparative interstory drift ratios of 20-story FDBF and benchmark
(part 1) .......................................................................................................... 109
Figure 5.65: Comparative interstory drift ratios of 20-story FDBF and benchmark
(part 2) .......................................................................................................... 110
Figure 5.66: Comparative interstory drift ratios of 20-story FDBF and benchmark
(part 3) .......................................................................................................... 111
Figure 5.67: Comparative interstory drift ratios of 20-story FDBF and benchmark
(part 4) .......................................................................................................... 112
Figure 5.68: Comparative interstory drift ratios of 20-story FDBF and benchmark
(part 5) .......................................................................................................... 113
Figure 5.69: Comparative interstory drift ratios of 20-story FDBF and benchmark
(part 6) .......................................................................................................... 114
Figure 5.70: Comparative interstory drift ratios of 20-story FDBF and benchmark
(part 7) .......................................................................................................... 115
Figure 5.71: Comparative interstory drift ratios of 20-story FDBF and benchmark
(part 8) .......................................................................................................... 116
Figure 6.1: Redesigned 3-story building north-south moment-resisting frame
(modified from (Ohtori et al. 2004)) ............................................................ 118
Figure 6.2: Redesigned 9-story building north-south moment-resisting frame
(modified from (Ohtori et al. 2004)) ............................................................ 119
Figure 6.3: Redesigned 20-story building north-south moment-resisting frame
(modified from (Ohtori et al. 2004)) ............................................................ 120

xiii
LIST OF TABLES
Page
Table 2.1: ASCE-41 Basic Safety Objective (ASCE 2007) ............................................. 21
Table 4.1: Modal frequencies for the 3-, 9-, and 20-story building models ..................... 30
Table 4.2: Structural and loading properties of the FDBFs used for validation of
the SAP2000 analytical model of the FDB .................................................... 33
Table 5.1: Peak interstory drift ratio of the different damper configurations
subjected to the series of BSE-1 records. ....................................................... 78
Table 5.2: Peak interstory drift ratio of the different damper configurations
subjected to the series of BSE-1 records. ..................................................... 105
Table 6.1: Structural weight of the 3-story benchmark building moment-resisting
frame ............................................................................................................. 122
Table 6.2: Structural weight of the 9-story benchmark building moment-resisting
frame ............................................................................................................. 123
Table 6.3: Structural weight of the 20-story benchmark building moment-resisting
frame ............................................................................................................. 124
Table 6.4: Structural weight of the FDBs in the 3-, 9- and 20- FDBFs ......................... 125
Table 6.5: Structural weight of the redesigned 3-story building moment-resisting
frame ............................................................................................................. 126
Table 6.6: Structural weight of the redesigned 9-story building moment-resisting
frame ............................................................................................................. 127
Table 6.7: Structural weight of the redesigned 20-story building moment-resisting
frame ............................................................................................................. 128
Table 6.8: Additional weights of the 3-, 9-, and 20-story FDBFs and redesigned
moment-resisting frames .............................................................................. 129

1
1. INTRODUCTION
The vibration of structures causes damage and destruction; those generated by
earthquakes are at the top of the scale (Mead 1998) and have exposed our vulnerability
to them even in advanced countries (Soong and Dargush 1997). To cope with earthquake
induced forces, the design philosophy is that of providing the structural elements with
the necessary strength and ductility. By providing ductility, incursions in the nonlinear
range of structural materials will dissipate energy in the form of inherent damping and
the amount of energy input into a structure will be limited. However, inelastic
deformations will cause a certain level of damage, which has to be kept within
acceptable limits.
The nature of earthquake engineering problems can be very complex (Krinitzsky
et al. 1993); therefore, understanding of their basics is absolutely necessary to be able to
find solutions. A common way to simplify the seismic analysis of structures has been to
treat the seismic excitations as a set of equivalent static lateral forces (Soong and
Dargush 1997). However, consideration of the dynamic characteristics of earthquake
excitations allows more accurate analyses, more efficient designs and has permitted the
development of different innovative concepts for seismic protection of structures. These
concepts can be categorized into three groups: seismic isolation, passive energy
dissipation and active control.
This thesis follows the style of the American Society of Civil Engineers.

2
The objective of these technologies is to reduce the energy dissipation demand
and the damage caused in the primary structural members. This is achieved through the
installation of special devices that will dissipate, at least, part of the energy that is input
into a building during a seismic event.
There are four general approaches to achieve passive energy dissipation (Mead
1998):
1. Control by structural design,
2. Control by localized additions,
3. Control by added damping,
4. Control by resilient isolation,
and combinations thereof.
The simple addition of passive structural control devices modifies the stiffness
and inherent damping in a structure; when in action, these devices additionally oppose
the earthquake generated forces without requiring external control or energy (Mead
1998).
The development of passive energy dissipation devices for structural applications
has approximately 35 years of history (Soong and Dargush 1997). These devices were
either created specifically for structural engineering applications or were adapted from
already available technologies that were used in the automotive, military and/or
aerospace industries (Soong and Constantinou 1994).
Practical applications of passive energy dissipation devices have demanded
considerable research. During their development, changes have been induced in the way

3
structural engineering is executed. For instance, (nonlinear) dynamical methods are
necessary to model and analyze structures that incorporate passive control devices
(Soong and Dargush 1997).

4
2. BACKGROUND
2.1 History of Friction Devices
For years, various devices that utilize friction for energy dissipating purposes have been
developed and tested (Soong and Constantinou 1994). Although various forms of
friction can be used to reduce vibrations and the damage they cause to structures, the
most popular type is solid friction (Soong and Dargush 1997).
Thus, the theory of solid friction constitutes the basis for most of the research
that has been done on friction dampers. It relies upon the following hypotheses (Soong
and Dargush 1997):
1. The friction force is independent of the surface area of contact.
2. The friction force is proportional to the normal force that acts across the sliding
interface.
3. The friction force is independent of the sliding velocity.
4. The friction force acts tangentially within the interfacial plane opposing motion.
At the instant just before sliding occurs and while sliding, the friction force F is
given by
F N
where N is the normal force acting across the sliding interface, and µ is the coefficient of
friction. Since it is common that the coefficient of friction is higher before slippage
occurs than it is during sliding, separate static (µs) and kinetic (µk) coefficients of friction
have been defined.

5
Friction devices do not change the inherent properties of the structure (Chopra
2001), their cost is relatively low, and their installation and maintenance are simple
(Mualla and Belev 2002).
In the United States, the earliest work on friction devices appears to be the one of
Keightley (1977; 1979) at Montana State University. He proposed friction dampers
constructed by clamping together steel plates with bolts and Belleville washers, but did
not assess relaxation of the bolts, stability of the system and corrosion within the sliding
surfaces.
Around that time, the firm of Severud, Perrone, Sturn and Bendel of New York
installed two large friction dampers between the Gorgas hospital and two exterior
concrete pylons in the Panama Canal Zone (Soong and Constantinou 1994).
Pall et al. (1980) developed passive friction dampers based upon the automotive
brake. They performed a series of static and dynamic tests on various sliding materials
with different surface treatments with the objective of identifying those that provided a
consistent and predictable response. They found that heavy duty brake lining pads
inserted between steel plates showed this desired type of behavior and, later, Pall
invented the Limited Slip Bolted (LSB) joint for seismic control of panel structures,
which incorporated the brake lining pads (Fig. 2.1). The LSB joints are placed in the
joint lines between precast concrete panels; during a seismic event, the concrete wall
panels slide relative to each other and energy dissipation and structural protection is
achieved through the joints.

6
Figure 2.1: Hysteresis loops of limited slip bolted joints (Soong and Dargush 1997)

7
Two years later, Pall and Marsh (1982) developed an alternate design to the LSB
(Figs. 2.2 and 2.3) for its use in conjunction with cross braces. It also incorporated brake
lining pads and a very peculiar and effective mechanism where the braces do not have to
be designed to resist compression forces to work in both lateral directions of movement.
When tension in one of the braces forces the joint to slip, it activates the four links which
force the joint in the other brace to slip at the same time. Hence, energy is dissipated in
both braces in each half cycle of motion, which reciprocrates in the next half cycle.
Moreover, in each cycle, the mechanism straightens the buckled “compression” brace
and sets it ready for the next half cycle of motion. Filiatrault and Cherry (1987) and
Aiken (1988) led studies that showed a superior performance of friction damped braced
frames (FDBFs) using this device compared to traditional earthquake resisting systems.
Figure 2.2: Friction Damper of Pall (1982)

8
In Japan, Sumitomo Metal Industries developed another friction damper for
structural engineering applications (Fig. 2.4). An experimental study by Aiken (1990) on
their device showed a better performance of frames incorporating this device than that of
bare moment resisting frames (MRFs). Furthermore, in their experiments, energy
dissipation was concentrated in the dampers rather than due to the inelastic action of the
structural members.
Fitzgerald (1989) proposed a friction device that utilized slotted bolted
connections in concentrically braced frames. One end of the brace is connected to the
building frame gusset plate using the channel bracing members shown in Fig 2.5. His
device also showed predictable and consistent behavior. Later, Grigorian (1993) tested a
slightly different slotted bolted connection that showed more stable frictional
characteristics (Fig 2.6).
Figure 2.3: Hysteresis loops for X-braced friction damper (Soong and Dargush 1997)

9
Figure 2.4: Sumitomo friction damper and installation detail (Aiken and Kelly 1990)

10
Figure 2.5: Slotted bolted connection of Fitzgerald (1989) and typical force-
displacement loop

11
Figure 2.6: Slotted bolted connection of Grigorian (1993) and typical force
displacement loop
Constantinou (Constantinou et al. 1991a; Constantinou et al. 1991b) developed a
very stable friction device for bridge seismic isolation applications (Fig. 2.7) and Fluor
Daniel invented a device with self-centering characteristics called Energy Dissipating
Restraint (EDR) (Fig 2.8) (Soong and Constantinou 1994). Researchers coincided in the
ease of construction of their friction devices.

12
Figure 2.7: Friction device of Constantinou (1991a) and force-displacement loop in
200-cycle test
Figure 2.8: EDR configuration schematic (Soong and Dargush 1997)
13
Since metallic surfaces are prone to corrosion, a major problem that researchers
faced with friction dampers was that of maintaining the original properties of the sliding
materials over time. Also, since relaxation in the clamping parts is to be expected,
maintaining of the normal load on the sliding interfaces became an issue; however, as
will be shown later, small variations in the clamping (normal) force on the sliding
interfaces will have very little effect on the performance of FDBFs, thus, it is possible to
anticipate this relaxation by initially applying an adequately chosen larger clamping
force which later relaxes to the friction force determined in design.
Research and actual applications around the world have demonstrated that
friction dampers represent an inexpensive and effective way to reduce seismic response
parameters while the integrity of the structural elements is protected. Conclusions by
Pall and Marsh (1982) serve to describe the general characteristics of friction devices.
These are:
1. Energy is dissipated by the friction devices rather than by the inelasticity of
structural members.
2. The structure in question is softened with a relatively small loss of elasticity
and recovers leaving little or no residual deformations.
3. The friction devices act like a fuse that limits the forces that act on the
structure.
4. The amplitude of displacements and accelerations is considerably reduced.
5. The devices limit the amount of energy that is input into the structure.

14
6. The building can be tuned for optimum response without resorting to
expensive devices.
Many of these advantages motivated continuous research and application of
friction dampers as a means of passive and (semi) active control of structures (Mualla
and Belev 2002).
2.2 Pall Friction Dampers
Pall friction dampers are manufactured by Pall Dynamics Ltd (PDL) and are available
for tension-only cross bracing (Fig. 2.9), single diagonal tension/compression bracing
(Fig. 2.10) and chevron bracing (Fig. 2.11).
Pall dampers consist of a series of steel plates that are clamped together and
treated to offer consistent and predictable friction properties. They possess rectangular
hysteresis loops with negligible fade (Fig. 2.12) and their performance is independent of
the sliding velocity and temperature (Pall and Pall 2004).
Figure 2.9: X-braced friction damper (PDL)

15
Figure 2.10: Diagonal tension/compression braced friction damper (PDL)
Figure 2.11: Chevron-braced friction damper (PDL)
Figure 2.12: Hysteresis loop (Pall and Pall 2004)
With Pall friction dampers stiffness is also added to the buildings and a bigger
amount of energy can be dissipated through friction than any other method like yielding
of steel or viscous and viscoelastic dampers (damping of 20 to 50% of critical can be
achieved). They do not need any energy source to operate and they do not require
maintenance or replacement after earthquakes. (Pall and Pall 2004).
16
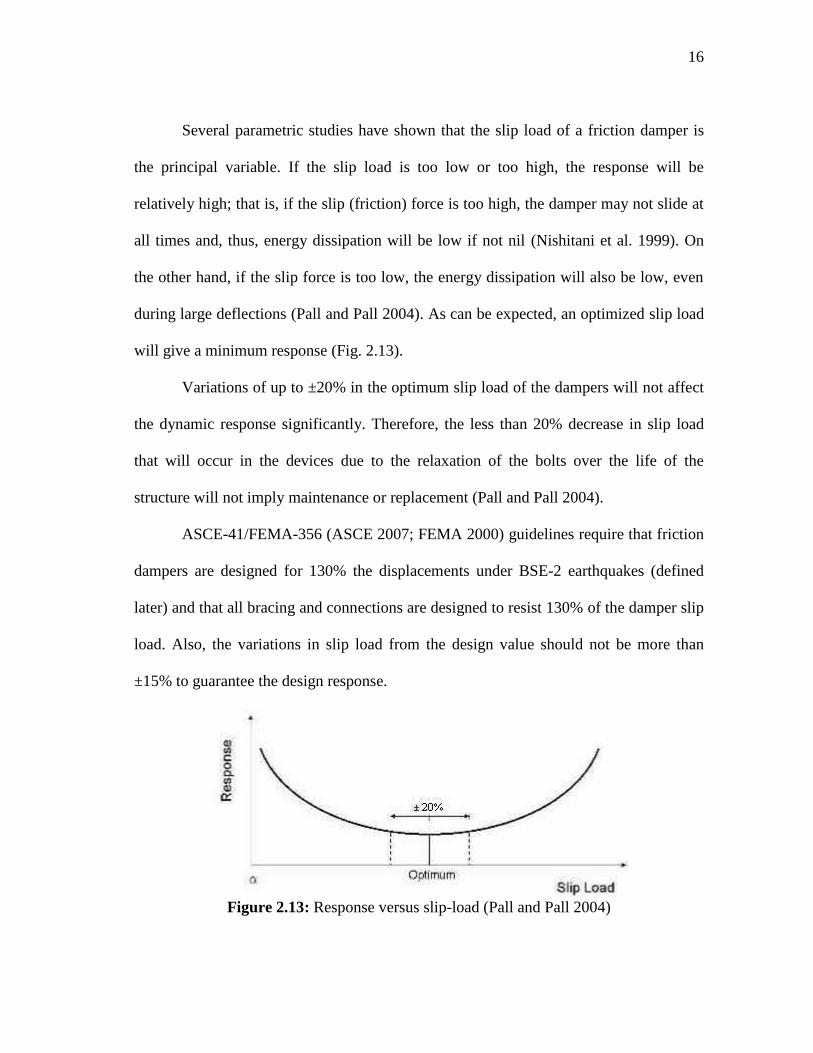
Several parametric studies have shown that the slip load of a friction damper is
the principal variable. If the slip load is too low or too high, the response will be
relatively high; that is, if the slip (friction) force is too high, the damper may not slide at
all times and, thus, energy dissipation will be low if not nil (Nishitani et al. 1999). On
the other hand, if the slip force is too low, the energy dissipation will also be low, even
during large deflections (Pall and Pall 2004). As can be expected, an optimized slip load
will give a minimum response (Fig. 2.13).
Variations of up to ±20% in the optimum slip load of the dampers will not affect
the dynamic response significantly. Therefore, the less than 20% decrease in slip load
that will occur in the devices due to the relaxation of the bolts over the life of the
structure will not imply maintenance or replacement (Pall and Pall 2004).
ASCE-41/FEMA-356 (ASCE 2007; FEMA 2000) guidelines require that friction
dampers are designed for 130% the displacements under BSE-2 earthquakes (defined
later) and that all bracing and connections are designed to resist 130% of the damper slip
load. Also, the variations in slip load from the design value should not be more than
±15% to guarantee the design response.
Figure 2.13: Response versus slip-load (Pall and Pall 2004)

17
2.3 Seismic Strengthening of Structures
The protection of civil structures is a global priority (Ohtori et al. 2004). Awareness of
seismic risk, advancement of new seismic protection concepts and changes in codes may
require additional protection of existing structures. This protection can be achieved
through replacement or strengthening of inadequate structures (Coburn and Spence
2002).
Replacement of unsafe structures is very slow: new construction rates reach 1%
per year in advanced nations and up to 8% per year in some emerging countries (Booth
and Key 2006). Meanwhile, a great part of the rest of the building stock cannot be
considered safe.
On the other hand, Coburn and Spence (2002) state that, for most types of
buildings, strengthening is a less expensive way of increasing earthquake resistance than
replacement. They discuss the application of cost-benefit analysis to strengthening and
mention additional factors to be taken into account when considering strengthening a
building.
Apart from serving for economically increasing the level of seismic resistance,
strengthening can also be used for rehabilitation and extension of the lifespan of
buildings (Booth and Key 2006). The convenience of strengthening versus rebuilding
has increased its popularity around the world.
The ASCE-31 standard (ASCE 2003) provides guidelines for the determination
of the necessity for strengthening of buildings. If the decision of retrofitting a structure
has already been taken, ASCE-41 (ASCE 2007), which is the latest generation of a

18
series of performance based seismic rehabilitation (pre) standards, will serve for
extensive and complete guidance on the process.
2.4 Performance Based Design
Performance based design (PBD) is a design philosophy in which the design criteria are
expressed in terms of established structural performance objectives (Fig. 2.14) when the
structure is subjected to different levels of seismic hazard (Ghobarah 2001).
In PBD, the displacement response of a structure is related to a strain-based limit
state which, in turn, is related to a level of damage (strains and deformations are better
damage indicators than the more commonly used stresses (Moehle 1996)). The level of
damage is related to a probability of failure under a probability of seismic demand and
serves to measure the structural performance.
Specific values of interstory drift ratios have been associated with the different
structural performance/damage levels for different structural systems and materials. For
steel MRFs these values and their structural performance/damage equivalences are given
in Fig. 2.15.
ASCE-41 defines two basic Earthquake Hazard Levels: the Basic Safety
Earthquake 1 (BSE-1) and the Basic Safety Earthquake 2 (BSE-2). For their definition,
reference is made to the 10%/50-year probabilistic maps and the Maximum Considered
Earthquake (MCE) maps developed in Project 97. The BSE-1 are taken from the
10%/50-year maps, which have a 10% probability of exceedance in 50 years, and the

19
BSE-2 shall be obtained from the MCE maps which, in most areas of the United States,
have a 2% probability of exceedance in 50 years.
ASCE-41 also defines 3 general rehabilitation objectives for buildings; namely,
reduced, basic and enhanced rehabilitation objectives. For the elaboration of the present
work, the Basic Safety Objective (BSO) was chosen. The BSO is a rehabilitation
objective that achieves the dual rehabilitation goals of Life Safety Building Performance
Level (3-C) for the BSE-1 Earthquake Hazard Level and Collapse Prevention Building
Performance Level (5-E) for the BSE-2 Earthquake Hazard Level (Table 2.1). The BSO
is intended to approximate the earthquake risk to life safety traditionally considered
acceptable in the United States. Buildings meeting the BSO are expected to experience
little damage from relatively frequent, moderate earthquakes, but significantly more
damage and potential economic loss from the most severe and infrequent earthquakes
(ASCE 2007).

20
Figure 2.14: Damage control and building performance levels (FEMA 2000)
Figure 2.15: Structural performance levels and damage (FEMA 2000)

21
Table 2.1: ASCE-41 Basic Safety Objective (ASCE 2007)
Performance level Overall damage Drift Hazard level
Life Safety Moderate 2.5% BSE-1
Collapse Prevention Severe 5% BSE-2
2.5 The Benchmark Buildings
Several control strategies have been studied for more than 20 years; some of which are
referenced in (Ohtori et al. 2004). These studies, however, differ from each other not
only in the control algorithms and devices that were tested, but also in the experimental
and analytical models, the evaluation criteria and in the objectives that were pursued
with the application of the different control concepts.
An obvious necessity for control benchmark structures was therefore recognized
by the American Society of Civil Engineers Committee on Structural Control which,
consequently, undertook a benchmark study for the comparison of control algorithms
that considered three-story building models (Spencer et al. 1998a; Spencer et al. 1998b).
Later, the Working Group on Building Control (Chen 1996) worked towards the
development of a systematic and standardized means to evaluate and compare different
control strategies. The result of their work was the Next Generation Benchmark Control
Problem for Seismically Excited Buildings (Spencer et al. 1999). In it, inelasticity of the
structural materials was not considered; however, strong earthquakes cause yielding of

22
the frame elements even in controlled structures. That is why, later, the inclusion of the
material nonlinear behavior was necessary.
The Benchmark Control Problems for Seismically Excited Nonlinear Buildings
(Ohtori et al. 2004) are an extension of the Next Generation Benchmark Control
Problem that includes the nonlinear behavior of 3 different steel buildings that were
designed for the SAC Steel Project (SAC_Steel_Project 1994) along with several
evaluation criteria and control design constraints.
2.6 Earthquake Records
The ground accelerations that are used for the time-history analyses of the building
frames were developed by Somerville et al. (1997) from historical recordings and
simulations for the FEMA project on steel moment-resisting frames (SAC_Steel_Project
1994). They constitute 2 suites of records for Los Angeles, California with seismic
hazard levels corresponding to probabilities of exceedance of 10% in 50 years (BSE-1)
and 2% in 50 years (BSE-2). Each suite consists of 20 horizontal ground acceleration
records, which correspond to fault-parallel and fault-normal orientations of 10
recordings, rotated 45 degrees to preclude excessive near-fault effects. The ground
accelerations were adjusted so that their mean response spectrum matched the 1997
NEHRP design spectrum.

23
3. RESEARCH OBJECTIVE
As has been stated before, friction devices constitute a simple, economic and effective
means for reducing the seismic response of structures and the damage in their elements.
When they are installed in a structure as part of a structural strengthening strategy,
additional practical, technical and economic benefits are obtained. These added
advantages motivated the consideration of the application of this type of passive energy
dissipation system for continuing research aiming at improved subsequent designs.
Recent research done on friction dampers has focused mainly on their utilization
as a means of (semi) active control. As such, different (semi) active friction dampers
have been tested and appropriate control approaches have been developed (Chen and
Chen 2002; Chen and Chen 2004; Chen and Chen 2003; Guglielmino and Edge 2003;
Lane et al. 1992; Ng and Xu 2004; Nishitani et al. 1999). However, since the studies of
Pall, Filiatrault, Aiken, Constantinou, Fitzgerald, etc. presented in the past chapter, and
with the exception of the introduction of a couple of new variations of the already
existing friction devices, little has been researched on passive friction energy dissipaters.
Furthermore, even though some of the past studies on friction devices are already
somewhat conclusive, design codes, philosophies and trends have considerably changed
in recent years. This has limited their validity to the historical context in which they
were made and a revision of the results and conclusions that were obtained at that time
seems appropriate. For instance, Performance Based Design (PBD) has been introduced,
nonlinear time-history analyses are now required when considering the application of

24
control devices and reliance on ductility of structural members for seismic energy
dissipation is a constant these days.
The introduction of the nonlinear benchmark buildings now allows a more up-to-
date, standardized measurement and evaluation of the results of the dynamic analyses. It
also facilitates a more direct and fair comparison of the performance of friction devices
with other structural control concepts. It is worth mentioning that, sometimes, the results
obtained in previous research done on friction devices were not evaluated in a formal
and standard manner and that, in many of the cases, the analytical models and
procedures employed to arrive to such results were linear.
With the aforementioned in mind, a study on the application of friction devices in
buildings has been designed to update, enhance, improve, and supplement results and
conclusions of previous research on the topic. This will be achieved by the consideration
of current analysis and design philosophies and techniques, and the new evaluation and
comparison criteria.
This study is also intended to provide further insight and knowledge on the
theoretical dynamic behavior of friction damped braced frames and its relationship with
the particular design parameters. The economic benefits of using friction damped braced
frames instead of the traditional moment-resisting frames will also be assessed
indirectly.

25
4. MODELING AND ALGORITHM
The building models used in this study are those given in (Ohtori et al. 2004) and
introduced in the benchmark buildings section. They were originally designed to be used
as benchmarks for the SAC Phase II Steel Project (SAC_Steel_Project 1994) and
represent typical 3-, 9-, and 20-story buildings designed for the Los Angeles, California
region. The friction dampers that are incorporated into the friction damped braced frame
models are the Pall single diagonal tension/compression friction damped braces briefly
described before in section 2.2.
4.1 Analytical Modeling of the Frames
Since friction devices and the structures into which they are incorporated behave in a
highly nonlinear manner, friction damped braced frames should always be analyzed
using nonlinear dynamic time-history methods (Aiken and Kelly 1990; ASCE 2007; Fu
and Cherry 1999; Moreschi and Singh 2003). In this thesis, the modeling and nonlinear
dynamic time-history analyses of the building frames were carried out using the
computer program SAP2000 (CSI 2007b).
All building models use clear span dimensions for their beams and columns in
order to avoid the overestimation of the contributions of the structural elements to
interstory drifts that are possible when centerline-to-centerline dimensions are used.
Panel zones are considered using the panel zone definitions available in
SAP2000. Rigid floor diaphragms are assumed at all floors, thus, all nodes lying at a
same horizontal plane were constrained together in the lateral direction.

26
Beams and columns are modeled using frame elements considering all their
deformational degrees of freedom (axial, flexural and shear) with their strength and
stiffness based on the material definitions of the computer program. Nonlinear hinges, as
defined in ASCE-41 (Fig. 4.1), are specified at both ends of the structural elements; in
the beams, M3 hinges (bending about the strong axis) were placed and, in the columns,
either P-M3 (axial load plus bending about the strong axis), or P-M2 (axial load plus
bending about the weak axis) hinges depending on the orientation of the element. The
rigid beam-to-column connections are idealized as fully restrained and their fracture is
not considered.
Figure 4.1: Post-yield behavior of ASCE-41 nonlinear hinges (CSI 2007a)
Seismic masses for each frame are calculated by dividing the total seismic mass
at each floor by 2 (the number of frames in that direction). Since p-delta effects can have
a great influence on the response of steel structures (Gupta and Krawinkler 1999), they
as well as large displacements are considered in the analyses. The seismic masses are not
directly applied to the structural elements; they are only used as mass source for the
dynamic analyses. This allows a more appropriate assessment of the p-delta effects and
potential collapse hazards.

27
In recognition of the portion of inherent damping that is due to the inelastic
behavior of steel structural members and in order to achieve a fair inclusion of the modes
that contribute to the dynamic response of the frames, 2% Rayleigh damping was
enforced at the first mode period and at a period of 0.2 seconds, except for the 20-story
building where the same amount of damping was assigned to the first and fifth mode
periods (Gupta and Krawinkler 1999).
Due to the complexity increase in computational effort and uncertainty, other
factors like the contributions to strength and stiffness of the floor slabs, shear
connections, gravity columns and the weak axis columns of the orthogonal moment
resisting frames were ignored.
4.2 Analytical Modeling of the Friction Damped Braces
As mentioned before, the friction damped braces that are modeled in all frames are Pall
single diagonal tension/compression braces with a friction device at one end. Before
accepting the proposed analytical model for the damped braces, it was validated for its
use in the analyses.
The friction damped braces were modeled using link elements assigned with an
appropriate plasticity model. Based upon the behavior obtained by Pall et al. (1980), the
characterization of their brake lining frictional system in terms of an elastic-perfectly
plastic model is appropriate.

28
The plasticity model that was assigned to the friction damped braces (FDBs) is
based on the hysteretic behavior proposed by Wen (1976) where the nonlinear force-
deformation relationship is given by (Fig. 4.2):
(1 )F r k d r Fy z
Figure 4.2: Definition of parameters for the Wen plasticity property (CSI 2007a)
where k is the elastic spring constant, Fy is the yield force, r is the specified ratio of
post-yield stiffness to elastic stiffness k and z is an internal hysteretic variable. This
variable has a range of | z | ≤ 1, with the yield surface represented by | z | = 1. The initial
value of z is zero, and it evolves according to the differential equation:
exp0(1 ) if dzk d z
zFy otherwised

29
where exp is an exponent greater than or equal to unity. Larger values of this exponent
increase the sharpness of yielding as shown in Fig. 4.2. The practical limit for exp is
about 20 (CSI 2007a). The equation for z is equivalent to Wen’s model with A =1 and α
= β = 0.5.
As suggested by Dr. Avtar Pall, president of Pall Dynamics Ltd, in personal
communication, the values of the Wen plasticity property parameters that were assigned
to the model of the friction damped braces are k = brace stiffness, Fy = slip load of the
friction device, post-yield stiffness ratio r = 0.0001 and yielding exponent exp = 10.
4.3 Validation of Models
In order to guarantee the correctness of the results and conclusions presented in this
thesis, validation of the SAP2000 analytical building models is indispensable. For
acceptance of the computer models that were constructed, two main things are identified
as subject of validation: the building models and the friction-damped brace model.
For the validation of the SAP2000 steel frame models, eigenvalue analyses were
performed to them to obtain and compare their mode shapes and natural frequencies with
those of the benchmark buildings as defined in (Ohtori et al. 2004).
Eigenvalue analyses are the best option for validation of the SAP2000 frame
models, since this type of analyses uses a very well established standard mathematical
procedure, whose results do not depend on possible different (inelastic) material
definitions and/or numerical methods, among other things, used to obtain solutions to
problems. These differences can be a source of discrepancies in the results obtained

30
when one seeks to obtain the solution to a “same” problem using different means. For
example, if the solutions to the equations of motion are chosen as the corroboration
parameter for validation, it is not possible to obtain the exact same results and, thus, the
doubtless acceptance of a model is also not possible. Furthermore, the unique
characteristics of the eigenvalue analyses allow a very direct, straightforward and strict
comparison between the values of the eigen-properties of the created SAP2000 building
models and those of the given benchmark structures. This permits one to easily confirm
the validity of the models that have been constructed.
Results of the eigenvalue analyses that were performed with the purpose of
validation of the models of the benchmark buildings are shown in Table 4.1 and Fig. 4.3.
It is important to mention that at the time of carrying out the analyses, the SAP2000
models of the frames had exactly the same modeling assumptions of the frames of
Ohtori et al. (2004), i.e. centerline to centerline elements, no nodes at splices, no panel
zones, etc. After these (simplistic) models were validated, they were updated with all the
additional geometric, material, and analytical characteristics mentioned in the Analytical
Modeling section.
Table 4.1: Modal frequencies for the 3-, 9-, and 20-story building models
3-Story 9-Story 20-Story
Ohtori SAP2000 Ohtori SAP2000 Ohtori SAP2000
1st mode 0.99 Hz 0.99 Hz 0.44 Hz 0.44 Hz 0.26 Hz 0.26 Hz
2nd
mode 3.06 Hz 3.06 Hz 1.18 Hz 1.18 Hz 0.75 Hz 0.75 Hz
3rd
mode 5.83 Hz 5.83 Hz 2.05 Hz 2.05 Hz 1.30 Hz 1.30 Hz

31
Figure 4.3: Mode shapes for the 3-, 9-, and 20-story building models (Ohtori et al. 2004)

32
On the other hand, for validation of the SAP2000 friction-damped brace model a
SIMULINK® (TheMathWorks 2008) model was created to simulate the dynamic
response of up to 3- degree-of-freedom shear buildings with friction devices installed.
The model is shown in Fig. 4.5. The friction devices were modeled using the Coulomb
and Viscous Friction block (Fig. 4.4) which, as it name implies, it is intended to model
dry and viscous friction; however, its characteristics make it adequate to model the
friction damped braces, since it represents, in its most basic form, a bilinear model. The
slope of the first part (line) of the model can be specified and the slope of the second line
has a fixed value of zero, but its offset with respect of the x-axis can be specified. This
behavior is exactly that of an elastic-perfectly plastic material which, as mentioned
before, mimics the behavior of friction damped braces quite appropriately. Thus for the
sake of validating the SAP2000 model of the damped brace, the slope of the first part of
the bilinear model was given the value of the elastic stiffness of the steel brace in the
lateral direction and the slip force of the friction device was specified for the offset of
the second part of the bilinear model. The model in SIMULINK uses the State-Space
block to find the solutions to the equations of motion.
For validation of the brace model, 2 structures were considered, the single degree
of freedom system shown in Fig. 4.6a, and the 3-degree of freedom shear building
shown in Fig. 4.6b. Their properties are given in Table 4.2. Both were subjected to
sinusoidal forces at each of their left nodes acting in the x-direction for 10 seconds and
the solutions to the equations of motion given by both SIMULINK and SAP2000 were
compared to validate the SAP2000 friction damped brace model (Fig. 4.7).

33
Figure 4.4: Coulomb and Viscous Friction block (TheMathWorks 2008)
Table 4.2: Structural and loading properties of the FDBFs used for validation of the
SAP2000 analytical model of the FDB
SDF System
Height: 3.28 ft
Bay width:
3.28 ft Frame elements:
Only translational DOFs in the x-direction
without consideration of shear stiffness.
All solid steel 2 in x 2 in sections.
Mass:
4,111 slugs Damping:
0% Friction brace:
Solid steel 2 in x 2 in section
with slip force equal to 787 lb
MDF System
Height: 3.28 ft per story
Bay width:
3.28 ft Frame elements:
Only translational DOFs in the x- direction
without consideration of shear stiffness.
All solid steel 2 in x 2 in sections.
Mass:
4,111 slugs at each story level. Damping:
0% Friction braces:
All solid steel 2 in x 2 in sections.
with slip force equal to 787 lb
Sinusoidal loading
Amplitude: 11.2 kips
Period:
1 sec
Phase:
0

34
Mod1O
ut2
.mat
To F
ile2
Mod1O
ut3
.mat
To F
ile1
Mod1O
ut.
mat
To F
ile
Subtr
act3
Subtr
act2
Subtr
act1
Subtr
act
x' =
Ax+
Bu
y =
Cx+
Du
Sta
te-S
pac
e
Sin
e W
ave3
Sin
e W
ave1
Sin
e W
ave
Mer
ge
Mer
ge2
Mer
ge
Mer
ge1
Mer
ge
Mer
ge
u1if
(..)
else
If2
u1if
(..)
else
If1
else
{ }
In1
Out
1
If A
ctio
n
Subsy
stem
5
if {
}In
1O
ut1
If A
ctio
n
Subsy
stem
4 else
{ }
In1
Out
1
If A
ctio
n
Subsy
stem
3
if {
}In
1O
ut1
If A
ctio
n
Subsy
stem
2 else
{ }
In1
Out
1
If A
ctio
n
Subsy
stem
1
if {
}In
1O
ut1
If A
ctio
n
Subsy
stem
u1if
(..)
else
If
-K-
Gai
n5
-K-
Gai
n4
-K-
Gai
n3
-K-
Gai
n2
-K-
Gai
n1
-K-
Gai
n
eq_m
at_fi
le.m
at
Fro
m F
ile2
eq_m
at_fi
le.m
at
Fro
m F
ile1
eq_m
at_fi
le.m
at
Fro
m F
ile
Coulo
mb &
Vis
cous
Fri
ctio
n8
Coulo
mb &
Vis
cous
Fri
ctio
n7
Coulo
mb &
Vis
cous
Fri
ctio
n6
Coulo
mb &
Vis
cous
Fri
ctio
n5
Coulo
mb &
Vis
cous
Fri
ctio
n4
Coulo
mb &
Vis
cous
Fri
ctio
n3
Coulo
mb &
Vis
cous
Fri
ctio
n2
Coulo
mb &
Vis
cous
Fri
ctio
n1
Coulo
mb &
Vis
cous
Fri
ctio
n
Add3
Add2
Add1
Add
Fig
ure
4.5
: S
IMU
LIN
K m
odel
for
ver
ific
atio
n o
f th
e S
AP
2000 f
rict
ion d
amped
bra
ce m
odel
beh
avio
r

35
Figure 4.6: a) SDF structure with friction damped brace, b) MDF structure with friction
damped braces
Figure 4.7: a) Response of SDF structure to the sinusoidal force, b) Response of the
MDF to the sinusoidal forces
0 1 2 3 4 5 6 7 8 9 10-20
-15
-10
-5
0
5
10
15
20
Time, sec
Dis
pla
cem
ent,
in
SIMULINK SAP2000
0 1 2 3 4 5 6 7 8 9 10
-4
-2
0
2
4
Time, sec
Dis
pla
cem
ent,
in
SIMULINK SAP2000

36
4.4 Philosophy and Algorithm
The ever present intention in the development of this thesis was that of considering it a
design/rehabilitation problem. In order to update the results obtained in previous
research, use formal measurement and evaluation criteria and relate the values to
practical situations, conventions and definitions, use was made of the guidelines and
parameters given in the Seismic Rehabilitation of Existing Buildings [ASCE-41]
standard (ASCE 2007) and related documents. The reader is, therefore, referred to those
documents for a broader understanding of the design philosophies and the knowledge of
definitions, criteria, parameters and assumptions made throughout this work.
The intention of this thesis is to use friction dampers to achieve interstory drift
reductions, for it is the main parameter used for seismic structural performance
evaluation. The interstory drift ratio is defined as the quotient of the relative horizontal
displacement between two construction levels and the construction level height.
Although other response parameters may also be positively (or negatively) affected by
the incorporation of the dampers to the buildings, they are not addressed in the present
study.
By following the guidelines, suites of earthquake records with 10 and 2%
probability of exceedance in 50 years specific for the site of the buildings (Los Angeles,
California) are used in the analyses. In this sense, this thesis follows the stream of the
benchmark studies by Kiggins and Uang (2006), Sabelli et al. (2003), and Zhu and
Zhang (2008) which follow the Performance Based Design philosophies and diverges

37
from the concept of Ohtori et al. (2004) who define particular evaluation criteria for the
assessment of the performance of different control strategies.
The general steps that are taken in the development of this thesis and are
followed for each of the 3 frames are enlisted next and described later in more detail.
1. Evaluation of the capacity of the original benchmark frame under the BSE-1 and
BSE-2 earthquake records.
2. Optimization of the number and location of the friction-damped braces using the
BSE-1 records that caused the benchmark frame to exceed the Life Safety (LS)
limit.
3. Optimization of the design parameters of the friction-damped braces using the
BSE-1 records that caused the benchmark frame to exceed the Life Safety (LS)
limit.
4. Evaluation of the capacity of the resulting FDBF under the suite of BSE-2
records.
5. Optimization of the design parameters of the friction-damped braces using the
BSE-2 records that caused the FDBF to exceed the Collapse Prevention (CP)
limit.
6. Evaluation of the capacity of the updated (final) version of FDBF under the
suites of BSE-1 and BSE-2 records.
7. Comparison of the “before and after” interstory drift demands in the building.
8. Redesign of the original moment-resisting frame (MRF) to achieve compliance
with the BSO requirements.

38
9. Comparison between the incremental weight of the FDBF and that of the
redesigned MRF compared to the weight of the original benchmark to indirectly
assess the potential economical benefit of using FDBFs.
In order to measure the reductions in the interstory drifts that are expected after
the FDBs are incorporated into the MRFs, an evaluation of the bare benchmark frames
has to initially be done. The ASCE-41 will require subjecting the rehabilitated building
to at least 3 earthquake records, but for a more complete set of results and for
concordance of my work with that of Kiggins and Uang (2006), Sabelli et al. (2003), and
Zhu and Zhang (2008), the bare frames are subjected to a series of 20 earthquake records
with probability of exceedance of 10% in 50 years (BSE-1), and a series of 20 with
probability of exceedance of 2% in 50 years (BSE-2).
Next, the BSE-1 hazard level earthquake records that cause the benchmark frame
in question to exceed the limits of the performance level of Life Safety are used, each
one separately, to find a sub-optimal configurations of the friction damped braces that
minimize the interstory drift response under the earthquake considered in the
corresponding optimization process. The optimization algorithm used for this purpose is
the sequential heuristic procedure given in (Chen and Chen 2002) which works as
follows: At each step, a damper is considered on all possible locations of the building
and the peak interstory drift ratio is calculated. That particular damper is finally left at
the location where it achieved the maximum reduction of the peak interstory drift ratio.
The same process is repeated at all the remaining empty locations with more damped

39
braces until the proposed number of devices has been placed or until the interstory drift
ratio is reduced by a predetermined percentage or below a specified limit.
At the end of the last step, different sub-optimal arrays of dampers for the frame
in question are available; each minimizes the peak interstory drift ratio under the action
of a particular earthquake. These different combinations of dampers are then subjected to
the series of 20 BSE-1 records. The maximum interstory drifts yielded by each sub-
optimal configuration under the 20 records are averaged and compared with the average
peak interstory drift ratios that resulted from testing of the remaining configurations. The
array which yields the lowest average peak interstory drift ratio response is finally
selected to continue with the study.
Further optimization of the selected damper configuration is carried out. This
time, the design parameters of the friction damped braces, namely, the slip load of the
friction device and the stiffness of the brace on which it is placed (Moreschi and Singh
2003), are the subject of this subsequent optimization.
For the optimization of the damped brace parameters, the building with the sub-
optimal array of dampers chosen before is again subjected to the BSE-1 (10% in 50
years) earthquake records that caused the bare building to exceed the Life Safety (LS)
limit. Monte Carlo simulations are undertaken under the action of each of those
earthquakes varying the values of the brace stiffness and the slip load of the friction
device to come up with a combination of values that minimizes the response. When a
maximum reduction in interstory drift ratio is sought, the combination of brace stiffness
and slip load that minimize such parameter is selected and, when maximum economy is

40
sough, the smallest combination of values that brings the peak interstory drift ratio
below the LS limit is chosen.
The result of the last step, combined with the other actions taken previously, is a
sub-optimized damper configuration with sub-optimized design parameters. The friction
force of the devices as well as the brace stiffness values are adjusted to match those of
actual rolled steel shapes and practical slip loads.
The updated structure is subsequently analyzed under the series of 20 BSE-2 (2%
in 50 years) earthquake records. The objective is to make sure the strengthened building
satisfies the requirements of the Collapse Prevention structural performance level too.
For those BSE-2 records that took the frames beyond the Collapse Prevention
performance level limit, the same approach as for optimization of the FDB parameters
for the BSE-1 records is again followed, this time, considering the 2% in 50 years set of
earthquakes for which the FDBF is not yet adequate. Monte Carlo simulations are again
run to find a combination of slip force and brace stiffness that minimizes the response or
at least brings the structure into compliance with the BSO requirements of ASCE-41.
Finally, after choosing the new combination of values for the damper parameters, these
are again adjusted to take practical values and this definitive version of the FDBF is
subjected to the 40 BSE-1 and BSE-2 earthquake records to assess and compare the
expected reductions in the interstory drift ratios.
In real life situations, economics play a decisive role at the moment of choosing a
rehabilitation or seismic control strategy. Thus, in order to provide an indirect measure
any economic benefits that can be achieved when passive friction dampers are installed

41
for energy dissipation and seismic protection purposes, the benchmark building in
question is redesigned to comply with the BSO of ASCE-41. The incremental weight of
the redesigned MRF with reference to the original benchmark is compared with the
incremental weight that results from incorporating friction damped braces into the
benchmark frame.

42
5. RESULTS
5.1 3-Story Building
Figure 5.1: Three-story benchmark building north-south moment-resisting frame
(Ohtori et al. 2004)
As outlined before, first, the (bare) 3-story benchmark frame (Fig. 5.1) is subjected to
the action of the series of 20 10% in 50 years earthquake records (LA01 to LA20) and
the series of 20 2% in 50 years records (LA21 to LA40) to assess the capacity of the
original benchmark frame. The results are shown in Fig. 5.2.
Note for all graphs throughout this thesis: If the value(s) of a particular parameter
corresponding to a particular earthquake, combination of brace stiffness, etc. is not
shown, it means that value was not obtained from the corresponding analysis. If it is the
case, the reason for the absence of the result is the non-convergence of the numerical

43
method which occurs due to the collapse of the structure. The consequent lack of
numerical values is caused by the physical and numerical instability that arises from the
sudden and abrupt degradation in strength of the localized plasticity models that are
assigned to the structural elements. This big loss of strength happens close after the
plastic hinge passes the Collapse Prevention (CP) performance limit (Fig. 4.1).
As can be seen in Fig. 5.2a, there are 12 records for which the building is not
adequate, i.e. the peak interstory drift-ratio exceeds the limit of the Life Safety (LS)
performance level. At the same time, the frame is only complying with the Collapse
Prevention requirements for the case of 3 earthquake records; namely, LA23, LA29, and
LA39. Recall that, under the BSE-1 records, the building should not exceed the LS limit
and, under the BSE-2 records, the interstory drifts have to be kept below the Collapse
Prevention (CP) limit.
It is the BSE-1 earthquake records that caused the frame to exceed the LS limit,
the ones are first used to optimize the frame for seismic resistance using the friction
devices.

44
Figure 5.2: BSE-1 and BSE-2 interstory drift demands in the 3-story building
01 02 03 04 05 06 07 08 09 10 11 12 13 14 15 16 17 18 19 200
0.005
0.01
0.015
0.02
0.025
0.03
0.035
0.04
0.045
0.05
0.055
0.06
LA record number
Pea
k i
nte
rsto
ry d
rift
ra
tio
PDR LS CP
21 22 23 24 25 26 27 28 29 20 31 32 33 34 35 36 37 38 39 400
0.005
0.01
0.015
0.02
0.025
0.03
0.035
0.04
0.045
0.05
0.055
0.06
LA record number
Pea
k i
nte
rsto
ry d
rift
ra
tio
PDR LS CP

45
The optimization algorithm for the placement of the friction-damped braces of
Chen and Chen (2002) described before is used to determine braced configurations that
bring the peak interstory drift ratios to a minimum value under the action of a particular
earthquake record. For the purpose of symmetry, a maximum of 6 friction braces is
proposed to be installed inside the left and right bays of the 3-bay moment frame of the
building (the braces showed to perform better inside the rigidly connected elements than
inside the hinged bays). For symmetry, the friction damped braces (FDBs) are tested in
couples at a same story each time with provisional brace stiffness equal to 1600 kips/in
and slip force of 300 kips. The results of the optimization of the number and location of
the dampers are given in Figs 5.3 to 5.5.
Figure 5.3: Performance of interstory drift ratio criterion in the 3-story building (part 1)
2 4 60
0.0050.01
0.015
0.020.0250.03
0.0350.04
0.045
0.050.0550.06
Number of dampers
Pea
k i
nte
rsto
ry d
rift
ra
tio
LA02
PDR LS CP
2 4 60
0.0050.01
0.015
0.020.0250.03
0.0350.04
0.045
0.050.0550.06
Number of dampers
Pea
k i
nte
rsto
ry d
rift
ra
tio
LA03
PDR LS CP

46
Figure 5.4: Performance of interstory drift ratio criterion in the 3-story building (part 2)
2 4 60
0.0050.01
0.015
0.020.0250.03
0.0350.04
0.045
0.050.0550.06
Number of dampers
Pea
k i
nte
rsto
ry d
rift
ra
tio
LA08
PDR LS CP
2 4 60
0.0050.01
0.015
0.020.0250.03
0.0350.04
0.045
0.050.0550.06
Number of dampers
Pea
k i
nte
rsto
ry d
rift
ra
tio
LA09
PDR LS CP
2 4 60
0.0050.01
0.015
0.020.0250.03
0.0350.04
0.045
0.050.0550.06
Number of dampers
Pea
k i
nte
rsto
ry d
rift
ra
tio
LA10
PDR LS CP
2 4 60
0.0050.01
0.015
0.020.0250.03
0.0350.04
0.045
0.050.0550.06
Number of dampers
Pea
k i
nte
rsto
ry d
rift
ra
tio
LA11
PDR LS CP
2 4 60
0.0050.01
0.015
0.020.0250.03
0.0350.04
0.045
0.050.0550.06
Number of dampers
Pea
k i
nte
rsto
ry d
rift
ra
tio
LA13
PDR LS CP
2 4 60
0.0050.01
0.015
0.020.0250.03
0.0350.04
0.045
0.050.0550.06
Number of dampers
Pea
k i
nte
rsto
ry d
rift
ra
tio
LA14
PDR LS CP

47
Figure 5.5: Performance of interstory drift ratio criterion in the 3-story building (part 3)
2 4 60
0.0050.01
0.015
0.020.0250.03
0.0350.04
0.045
0.050.0550.06
Number of dampers
Pea
k i
nte
rsto
ry d
rift
ra
tio
LA15
PDR LS CP
2 4 60
0.0050.01
0.015
0.020.0250.03
0.0350.04
0.045
0.050.0550.06
Number of dampers
Pea
k i
nte
rsto
ry d
rift
ra
tio
LA16
PDR LS CP
2 4 60
0.0050.01
0.015
0.020.0250.03
0.0350.04
0.045
0.050.0550.06
Number of dampers
Pea
k i
nte
rsto
ry d
rift
ra
tio
LA18
PDR LS CP
2 4 60
0.0050.01
0.015
0.020.0250.03
0.0350.04
0.045
0.050.0550.06
Number of dampers
Pea
k i
nte
rsto
ry d
rift
ra
tio
LA20
PDR LS CP

48
As the plots show, in all the cases the number of FDBs that yielded the lowest
response was 6. Thus, according to the originally proposed location of the braces (the 3-
bay moment frame), the 6 dampers are set in the configuration shown in Fig. 5.6.
Once the configuration was selected, the determination of the design parameters
of the friction-damped braces (slip force of device and brace stiffness), was undertaken.
For this, several analyses of the bare frame trying different combinations of brace
stiffness and device slip load were run under the action of those BSE-1 earthquakes that
caused the bare frame to exceed the LS limit. The results of these analyses are shown
below in Figs. 5.7 to 5.12.
Figure 5.6: Sub-optimal FDB configuration determined after the consideration of the
BSE-1 earthquake records

49
Figure 5.7: Effect of FDB parameters on the 1st FDB 3-story building (part 1)
50 100 150 200 250 300 350 400 450 5000
0.005
0.01
0.015
0.02
0.025
0.03
0.035
0.04
0.045
0.05
0.055
0.06
Slip force, kips
Pea
k i
nte
rsto
ry d
rift
ra
tio
LA02
K=700
K=900
K=1100
K=1300
K=1500
K=1700
K=1900
K=2100
K=2300
K=2500
LS
CP
50 100 150 200 250 300 350 400 450 5000
0.005
0.01
0.015
0.02
0.025
0.03
0.035
0.04
0.045
0.05
0.055
0.06
Slip force, kips
Pea
k i
nte
rsto
ry d
rift
ra
tio
LA03
K=700
K=900
K=1100
K=1300
K=1500
K=1700
K=1900
K=2100
K=2300
K=2500
LS
CP

50
Figure 5.8: Effect of FDB parameters on the 1st FDB 3-story building (part 2)
50 100 150 200 250 300 350 400 450 5000
0.005
0.01
0.015
0.02
0.025
0.03
0.035
0.04
0.045
0.05
0.055
0.06
Slip force, kips
Pea
k i
nte
rsto
ry d
rift
ra
tio
LA08
K=700
K=900
K=1100
K=1300
K=1500
K=1700
K=1900
K=2100
K=2300
K=2500
LS
CP
50 100 150 200 250 300 350 400 450 5000
0.005
0.01
0.015
0.02
0.025
0.03
0.035
0.04
0.045
0.05
0.055
0.06
Slip force, kips
Pea
k i
nte
rsto
ry d
rift
ra
tio
LA09
K=700
K=900
K=1100
K=1300
K=1500
K=1700
K=1900
K=2100
K=2300
K=2500
LS
CP

51
Figure 5.9: Effect of FDB parameters on the 1st FDB 3-story building (part 3)
50 100 150 200 250 300 350 400 450 5000
0.005
0.01
0.015
0.02
0.025
0.03
0.035
0.04
0.045
0.05
0.055
0.06
Slip force, kips
Pea
k i
nte
rsto
ry d
rift
ra
tio
LA10
K=700
K=900
K=1100
K=1300
K=1500
K=1700
K=1900
K=2100
K=2300
K=2500
LS
CP
50 100 150 200 250 300 350 400 450 5000
0.005
0.01
0.015
0.02
0.025
0.03
0.035
0.04
0.045
0.05
0.055
0.06
Slip force, kips
Pea
k i
nte
rsto
ry d
rift
ra
tio
LA11
K=700
K=900
K=1100
K=1300
K=1500
K=1700
K=1900
K=2100
K=2300
K=2500
LS
CP

52
Figure 5.10: Effect of FDB parameters on the 1st FDB 3-story building (part 4)
50 100 150 200 250 300 350 400 450 5000
0.005
0.01
0.015
0.02
0.025
0.03
0.035
0.04
0.045
0.05
0.055
0.06
Slip force, kips
Pea
k i
nte
rsto
ry d
rift
ra
tio
LA13
K=700
K=900
K=1100
K=1300
K=1500
K=1700
K=1900
K=2100
K=2300
K=2500
LS
CP
50 100 150 200 250 300 350 400 450 5000
0.005
0.01
0.015
0.02
0.025
0.03
0.035
0.04
0.045
0.05
0.055
0.06
Slip force, kips
Pea
k i
nte
rsto
ry d
rift
ra
tio
LA14
K=700
K=900
K=1100
K=1300
K=1500
K=1700
K=1900
K=2100
K=2300
K=2500
LS
CP
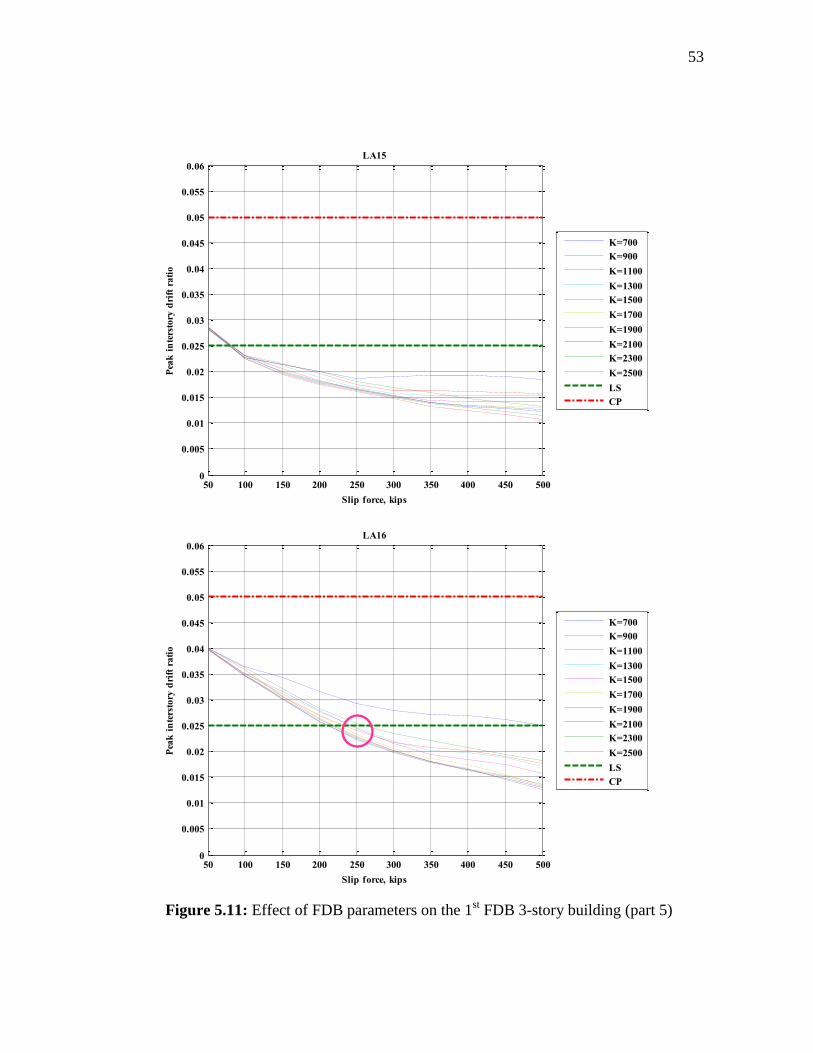
53
Figure 5.11: Effect of FDB parameters on the 1st FDB 3-story building (part 5)
50 100 150 200 250 300 350 400 450 5000
0.005
0.01
0.015
0.02
0.025
0.03
0.035
0.04
0.045
0.05
0.055
0.06
Slip force, kips
Pea
k i
nte
rsto
ry d
rift
ra
tio
LA15
K=700
K=900
K=1100
K=1300
K=1500
K=1700
K=1900
K=2100
K=2300
K=2500
LS
CP
50 100 150 200 250 300 350 400 450 5000
0.005
0.01
0.015
0.02
0.025
0.03
0.035
0.04
0.045
0.05
0.055
0.06
Slip force, kips
Pea
k i
nte
rsto
ry d
rift
ra
tio
LA16
K=700
K=900
K=1100
K=1300
K=1500
K=1700
K=1900
K=2100
K=2300
K=2500
LS
CP

54
Figure 5.12: Effect of FDB parameters on the 1st FDB 3-story building (part 6)
50 100 150 200 250 300 350 400 450 5000
0.005
0.01
0.015
0.02
0.025
0.03
0.035
0.04
0.045
0.05
0.055
0.06
Slip force, kips
Pea
k i
nte
rsto
ry d
rift
ra
tio
LA18
K=700
K=900
K=1100
K=1300
K=1500
K=1700
K=1900
K=2100
K=2300
K=2500
LS
CP
50 100 150 200 250 300 350 400 450 5000
0.005
0.01
0.015
0.02
0.025
0.03
0.035
0.04
0.045
0.05
0.055
0.06
Slip force, kips
Pea
k i
nte
rsto
ry d
rift
ra
tio
LA20
K=700
K=900
K=1100
K=1300
K=1500
K=1700
K=1900
K=2100
K=2300
K=2500
LS
CP

55
The plots show that larger values of stiffness together with high slip forces will
yield lower peak interstory drifts. This result seems logical, since all stories in the frame
are equally braced. In practice, however, it might not be necessary, convenient or even
possible to provide such large values. That is why, in this case, only the most
economical combination of stiffness and slip force capable of bringing the frame into
compliance with the LS limit was chosen. The most economical combination is the one
that implies the lowest brace stiffness and device slip load.
By looking at the graphs, it can be found out that any brace stiffness combined
with a slip force of 250 kips or larger will bring the maximum interstory drift ratio below
the LS limit of 2.5%. So, this slip load was chosen and it only became necessary to find
a steel section that would resist the maximum compression force that will be generated
in the brace, that is, the 250 kip slip load. For this, HSS12×12×5/16 sections were
selected, which provide a value of axial stiffness equal to 990 kips/in.
Now that the FDB configuration, brace stiffness, and slip load of the device
required to bring the original frame into compliance with the LS limits are available, the
next step is to make the building comply with CP requirements too. Consequently, the
recent design is first subjected to the 2% in 50 years series of earthquakes to assess its
performance. The results are presented in Fig 5.13.

56
Figure 5.13: BSE-2 peak interstory drift ratios of the first proposed FDBF
According to the information displayed in the graph, while the braced frame
complies with the CP limit for most of the earthquakes in the series, there are still 7
records for which it is not yet good. Since, at this point, it is still practical to vary the
parameters of the FDBs, action is taken to find new values for the brace stiffness and slip
force of the friction device that will achieve the compliance of the frame with the CP
requirement.
The same procedure of trying several combinations of brace stiffness and slip
load under the action of each of the earthquakes that caused collapse of the frame is
again followed only considering BSE-2 records this time. It was found that, except for
the case of the LA31 and LA36 earthquakes (Fig. 5.14), all other earthquakes continued
to cause the collapse of the structure even when higher combinations were tested.
21 22 23 24 25 26 27 28 29 20 31 32 33 34 35 36 37 38 39 400
0.005
0.01
0.015
0.02
0.025
0.03
0.035
0.04
0.045
0.05
0.055
0.06
LA record number
Pea
k i
nte
rsto
ry d
rift
rati
o
PDR LS CP

57
Figure 5.14: Effect of FDB parameters on the 1
st FDB 3-story building (part 7)
250 300 350 400 450 5000
0.005
0.01
0.015
0.02
0.025
0.03
0.035
0.04
0.045
0.05
0.055
0.06
Slip force, kips
Pea
k i
nte
rsto
ry d
rift
ra
tio
LA31
K=1300
K=1500
K=1700
K=1900
K=2100
K=2300
K=2500
LS
CP
250 300 350 400 450 5000
0.005
0.01
0.015
0.02
0.025
0.03
0.035
0.04
0.045
0.05
0.055
0.06
Slip force, kips
Pea
k i
nte
rsto
ry d
rift
ra
tio
LA36
K=1700
K=1900
K=2100
K=2300
K=2500
LS
CP

58
To deal with the consistent problem of collapse, the addition of at least one more
damper was necessary. Thus, the new brace configuration shown in Fig. 5.15 was
proposed.
The new configuration is again subjected to the procedure of “randomly” trying
different brace stiffness and slip load values to generate the plots that could not be
created with the previous array of dampers due to the consistent collapse of the structure.
In this case, the attempt of avoiding the collapse of the 3-story frame is successful and
the plots that were drawn from the analyses are given below.
Figure 5.15: Second proposed FDBF

59
Figure 5.16: Effect of FDB parameters on the 2
nd FDB 3-story building (part 1)
250 300 350 400 450 5000
0.005
0.01
0.015
0.02
0.025
0.03
0.035
0.04
0.045
0.05
0.055
0.06
Slip force, kips
Pea
k i
nte
rsto
ry d
rift
ra
tio
LA21
K=1100
K=1300
K=1500
K=1700
K=1900
K=2100
K=2300
K=2500
LS
CP
250 300 350 400 450 5000
0.005
0.01
0.015
0.02
0.025
0.03
0.035
0.04
0.045
0.05
0.055
0.06
Slip force, kips
Pea
k i
nte
rsto
ry d
rift
ra
tio
LA22
K=1300
K=1500
K=1700
K=1900
K=2100
K=2300
K=2500
LS
CP

60
Figure 5.17: Effect of FDB parameters on the 2
nd FDB 3-story building (part 2)
250 300 350 400 450 5000
0.005
0.01
0.015
0.02
0.025
0.03
0.035
0.04
0.045
0.05
0.055
0.06
Slip force, kips
Pea
k i
nte
rsto
ry d
rift
ra
tio
LA26
K=1100
K=1300
K=1500
K=1700
K=1900
K=2100
K=2300
K=2500
LS
CP
250 300 350 400 450 5000
0.005
0.01
0.015
0.02
0.025
0.03
0.035
0.04
0.045
0.05
0.055
0.06
Slip force, kips
Pea
k i
nte
rsto
ry d
rift
ra
tio
LA31
K=1100
K=1300
K=1500
K=1700
K=1900
K=2100
K=2300
K=2500
LS
CP

61
Figure 5.18: Effect of FDB parameters on the 2
nd FDB 3-story building (part 3)
250 300 350 400 450 5000
0.005
0.01
0.015
0.02
0.025
0.03
0.035
0.04
0.045
0.05
0.055
0.06
Slip force, kips
Pea
k i
nte
rsto
ry d
rift
ra
tio
LA32
K=1100
K=1300
K=1500
K=1700
K=1900
K=2100
K=2300
K=2500
LS
CP
250 300 350 400 450 5000
0.005
0.01
0.015
0.02
0.025
0.03
0.035
0.04
0.045
0.05
0.055
0.06
Slip force, kips
Pea
k i
nte
rsto
ry d
rift
ra
tio
LA35
K=1100
K=1300
K=1500
K=1700
K=1900
K=2100
K=2300
K=2500
LS
CP

62
Figure 5.19: Effect of FDB parameters on the 2
nd FDB 3-story building (part 4)
The conclusion of the revision of the graphs is that the use of friction devices
with a slip force of 350 kips combined with stiff braces is enough to do the job to
achieve compliance of the frame. The chosen section has to fulfill this stiffness
requirement as well as be able to sustain the larger 350 kip force that is generated in the
brace as the friction devices slip.
HSS14×14×5/8 sections (K = 2240 kips/in) fulfill both the stiffness and the
strength requirements. Thus, such section is proposed to work together with 350 kip
force devices in the last brace configuration.
Finally, this design is checked, i.e. the FDBF is evaluated under the action of all
40 earthquake records used in this thesis. The results are shown next together with a
comparison with the original interstory drift ratios that were obtained for the original
benchmark frame.
250 300 350 400 450 5000
0.005
0.01
0.015
0.02
0.025
0.03
0.035
0.04
0.045
0.05
0.055
0.06
Slip force, kips
Pea
k i
nte
rsto
ry d
rift
ra
tio
LA36
K=1100
K=1300
K=1500
K=1700
K=1900
K=2100
K=2300
K=2500
LS
CP

63
Figure 5.20: Comparative peak interstory drift ratios of 3-story FDBF and benchmark
01 02 03 04 05 06 07 08 09 10 11 12 13 14 15 16 17 18 19 200
0.005
0.01
0.015
0.02
0.025
0.03
0.035
0.04
0.045
0.05
0.055
0.06
LA record number
Pea
k i
nte
rsto
ry d
rift
ra
tio
Uncontrolled Controlled LS CP
21 22 23 24 25 26 27 28 29 30 31 32 33 34 35 36 37 38 39 400
0.005
0.01
0.015
0.02
0.025
0.03
0.035
0.04
0.045
0.05
0.055
0.06
LA record number
Pea
k i
nte
rsto
ry d
rift
ra
tio
Uncontrolled Controlled LS CP

64
Figure 5.21: Comparative interstory drift ratios of 3-story FDBF and benchmark (part 1)
0 0.01 0.02 0.03 0.04 0.05 0.060
1
2
3
Peak interstory drift ratio
Sto
ry n
um
ber
LA01
Bare
Damped
LS
CP
0 0.01 0.02 0.03 0.04 0.05 0.060
1
2
3
Peak interstory drift ratio
Sto
ry n
um
ber
LA02
Bare
Damped
LS
CP
0 0.01 0.02 0.03 0.04 0.05 0.060
1
2
3
Peak interstory drift ratio
Sto
ry n
um
ber
LA03
Bare
Damped
LS
CP
0 0.01 0.02 0.03 0.04 0.05 0.060
1
2
3
Peak interstory drift ratio
Sto
ry n
um
ber
LA04
Bare
Damped
LS
CP
0 0.01 0.02 0.03 0.04 0.05 0.060
1
2
3
Peak interstory drift ratio
Sto
ry n
um
ber
LA05
Bare
Damped
LS
CP
0 0.01 0.02 0.03 0.04 0.05 0.060
1
2
3
Peak interstory drift ratio
Sto
ry n
um
ber
LA06
Bare
Damped
LS
CP

65
Figure 5.22: Comparative interstory drift ratios of 3-story FDBF and benchmark (part 2)
0 0.01 0.02 0.03 0.04 0.05 0.060
1
2
3
Peak interstory drift ratio
Sto
ry n
um
ber
LA07
Bare
Damped
LS
CP
0 0.01 0.02 0.03 0.04 0.05 0.060
1
2
3
Peak interstory drift ratio
Sto
ry n
um
ber
LA08
Bare
Damped
LS
CP
0 0.01 0.02 0.03 0.04 0.05 0.060
1
2
3
Peak interstory drift ratio
Sto
ry n
um
ber
LA09
Bare
Damped
LS
CP
0 0.01 0.02 0.03 0.04 0.05 0.060
1
2
3
Peak interstory drift ratio
Sto
ry n
um
ber
LA10
Bare
Damped
LS
CP
0 0.01 0.02 0.03 0.04 0.05 0.060
1
2
3
Peak interstory drift ratio
Sto
ry n
um
ber
LA11
Bare
Damped
LS
CP
0 0.01 0.02 0.03 0.04 0.05 0.060
1
2
3
Peak interstory drift ratio
Sto
ry n
um
ber
LA12
Bare
Damped
LS
CP
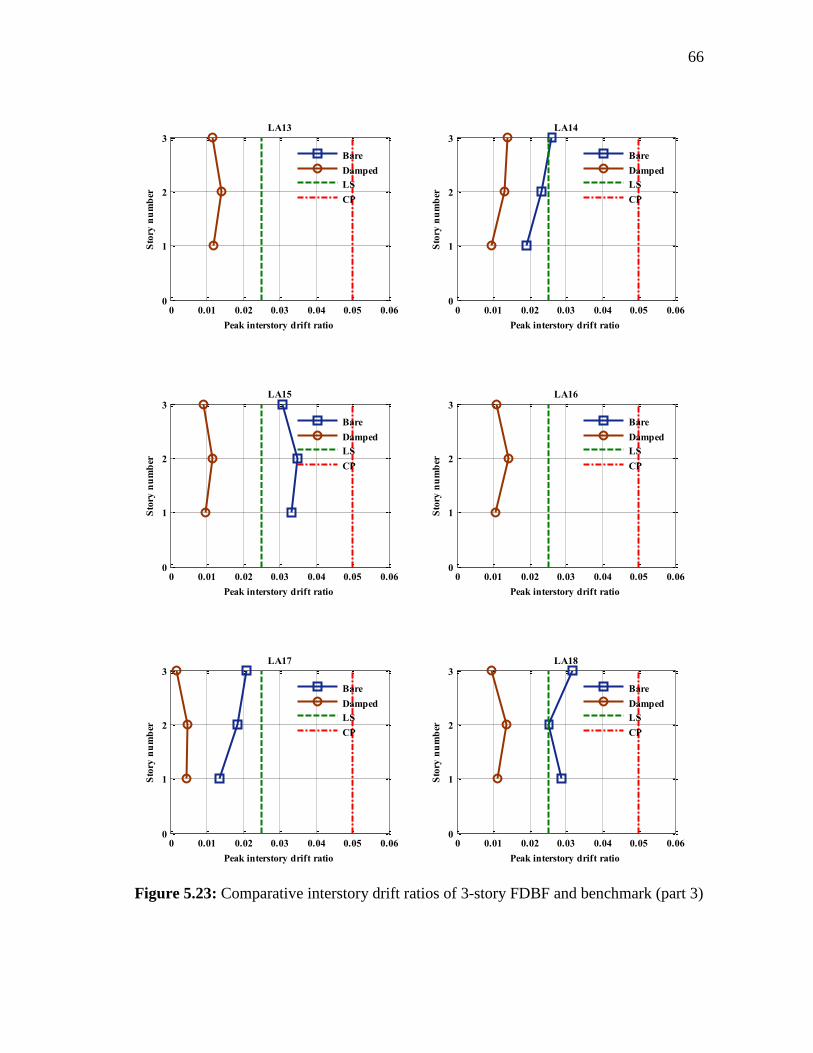
66
Figure 5.23: Comparative interstory drift ratios of 3-story FDBF and benchmark (part 3)
0 0.01 0.02 0.03 0.04 0.05 0.060
1
2
3
Peak interstory drift ratio
Sto
ry n
um
ber
LA13
Bare
Damped
LS
CP
0 0.01 0.02 0.03 0.04 0.05 0.060
1
2
3
Peak interstory drift ratio
Sto
ry n
um
ber
LA14
Bare
Damped
LS
CP
0 0.01 0.02 0.03 0.04 0.05 0.060
1
2
3
Peak interstory drift ratio
Sto
ry n
um
ber
LA15
Bare
Damped
LS
CP
0 0.01 0.02 0.03 0.04 0.05 0.060
1
2
3
Peak interstory drift ratio
Sto
ry n
um
ber
LA16
Bare
Damped
LS
CP
0 0.01 0.02 0.03 0.04 0.05 0.060
1
2
3
Peak interstory drift ratio
Sto
ry n
um
ber
LA17
Bare
Damped
LS
CP
0 0.01 0.02 0.03 0.04 0.05 0.060
1
2
3
Peak interstory drift ratio
Sto
ry n
um
ber
LA18
Bare
Damped
LS
CP

67
Figure 5.24: Comparative interstory drift ratios of 3-story FDBF and benchmark (part 4)
0 0.01 0.02 0.03 0.04 0.05 0.060
1
2
3
Peak interstory drift ratio
Sto
ry n
um
ber
LA19
Bare
Damped
LS
CP
0 0.01 0.02 0.03 0.04 0.05 0.060
1
2
3
Peak interstory drift ratio
Sto
ry n
um
ber
LA20
Bare
Damped
LS
CP
0 0.01 0.02 0.03 0.04 0.05 0.060
1
2
3
Peak interstory drift ratio
Sto
ry n
um
ber
LA21
Bare
Damped
LS
CP
0 0.01 0.02 0.03 0.04 0.05 0.060
1
2
3
Peak interstory drift ratio
Sto
ry n
um
ber
LA22
Bare
Damped
LS
CP
0 0.01 0.02 0.03 0.04 0.05 0.060
1
2
3
Peak interstory drift ratio
Sto
ry n
um
ber
LA23
Bare
Damped
LS
CP
0 0.01 0.02 0.03 0.04 0.05 0.060
1
2
3
Peak interstory drift ratio
Sto
ry n
um
ber
LA24
Bare
Damped
LS
CP

68
Figure 5.25: Comparative interstory drift ratios of 3-story FDBF and benchmark (part 5)
0 0.01 0.02 0.03 0.04 0.05 0.060
1
2
3
Peak interstory drift ratio
Sto
ry n
um
ber
LA25
Bare
Damped
LS
CP
0 0.01 0.02 0.03 0.04 0.05 0.060
1
2
3
Peak interstory drift ratio
Sto
ry n
um
ber
LA26
Bare
Damped
LS
CP
0 0.01 0.02 0.03 0.04 0.05 0.060
1
2
3
Peak interstory drift ratio
Sto
ry n
um
ber
LA27
Bare
Damped
LS
CP
0 0.01 0.02 0.03 0.04 0.05 0.060
1
2
3
Peak interstory drift ratio
Sto
ry n
um
ber
LA28
Bare
Damped
LS
CP
0 0.01 0.02 0.03 0.04 0.05 0.060
1
2
3
Peak interstory drift ratio
Sto
ry n
um
ber
LA29
Bare
Damped
LS
CP
0 0.01 0.02 0.03 0.04 0.05 0.060
1
2
3
Peak interstory drift ratio
Sto
ry n
um
ber
LA30
Bare
Damped
LS
CP

69
Figure 5.26: Comparative interstory drift ratios of 3-story FDBF and benchmark (part 6)
0 0.01 0.02 0.03 0.04 0.05 0.060
1
2
3
Peak interstory drift ratio
Sto
ry n
um
ber
LA31
Bare
Damped
LS
CP
0 0.01 0.02 0.03 0.04 0.05 0.060
1
2
3
Peak interstory drift ratio
Sto
ry n
um
ber
LA32
Bare
Damped
LS
CP
0 0.01 0.02 0.03 0.04 0.05 0.060
1
2
3
Peak interstory drift ratio
Sto
ry n
um
ber
LA33
Bare
Damped
LS
CP
0 0.01 0.02 0.03 0.04 0.05 0.060
1
2
3
Peak interstory drift ratio
Sto
ry n
um
ber
LA34
Bare
Damped
LS
CP
0 0.01 0.02 0.03 0.04 0.05 0.060
1
2
3
Peak interstory drift ratio
Sto
ry n
um
ber
LA35
Bare
Damped
LS
CP
0 0.01 0.02 0.03 0.04 0.05 0.060
1
2
3
Peak interstory drift ratio
Sto
ry n
um
ber
LA36
Bare
Damped
LS
CP

70
Figure 5.27: Comparative interstory drift ratios of 3-story FDBF and benchmark (part 7)
0 0.01 0.02 0.03 0.04 0.05 0.060
1
2
3
Peak interstory drift ratio
Sto
ry n
um
ber
LA37
Bare
Damped
LS
CP
0 0.01 0.02 0.03 0.04 0.05 0.060
1
2
3
Peak interstory drift ratio
Sto
ry n
um
ber
LA38
Bare
Damped
LS
CP
0 0.01 0.02 0.03 0.04 0.05 0.060
1
2
3
Peak interstory drift ratio
Sto
ry n
um
ber
LA39
Bare
Damped
LS
CP
0 0.01 0.02 0.03 0.04 0.05 0.060
1
2
3
Peak interstory drift ratio
Sto
ry n
um
ber
LA40
Bare
Damped
LS
CP

71
5.2 9-Story Building
Like in the case of the 3-story building, first, the capacity of the bare 9-story benchmark
building was calculated in order to assess it and have a starting point for the
strengthening process. The frame is subjected, again, to the total of 40 earthquakes (20
BSE-1 and 20 BSE-2) considered in this thesis. The maximum interstory drift ratios
resulting from these analyses are depicted in the next bar plots.
Figure 5.28: Nine-story benchmark building north-south moment-resisting frame
(Ohtori et al. 2004)

72
Figure 5.29: BSE-1 and BSE-2 interstory drift demands of 9-story benchmark building
01 02 03 04 05 06 07 08 09 10 11 12 13 14 15 16 17 18 19 200
0.005
0.01
0.015
0.02
0.025
0.03
0.035
0.04
0.045
0.05
0.055
0.06
LA record number
Pea
k i
nte
rsto
ry d
rift
ra
tio
PDR LS CP
21 22 23 24 25 26 27 28 29 30 31 32 33 34 35 36 37 38 39 400
0.005
0.01
0.015
0.02
0.025
0.03
0.035
0.04
0.045
0.05
0.055
0.06
LA record number
Pea
k i
nte
rsto
ry d
rift
ra
tio
PDR LS CP

73
Fig. 5.29a shows that 15 BSE-1 records cause the 9-story frame to exceed the LS
limit. These form the basis for the necessary control of the structure.
As a second step, optimization of the number and location of the friction-damped
braces is carried out; in this case, the use of a maximum of 36 devices in the frame (4 per
story) is proposed. In this optimization process, dampers are tested in couples at a same
story and inside opposite bays each time for the sake of symmetry (as can be implied, the
center bay is not considered). The provisional parameters that are assigned to the FDBs
are axial stiffness equal to 1600 kips/in and a slip force equal to 300 kips. The results of
the optimization algorithm are presented next in Figs 5.30 to 5.33.
Figure 5.30: Performance of interstory drift ratio criterion in the 9-story building
(part 1)
2 4 6 8 10 12 14 16 18 20 22 24 26 28 30 32 34 360
0.0050.01
0.015
0.020.0250.03
0.0350.04
0.045
0.050.0550.06
Number of dampers
Pea
k i
nte
rsto
ry d
rift
ra
tio
LA01
PDR LS CP
Minimum
2 4 6 8 10 12 14 16 18 20 22 24 26 28 30 32 34 360
0.0050.01
0.015
0.020.0250.03
0.0350.04
0.045
0.050.0550.06
Number of dampers
Pea
k i
nte
rsto
ry d
rift
ra
tio
LA02
PDR LS CP
Minimum

74
Figure 5.31: Performance of interstory drift ratio criterion in the 9-story building
(part 2)
2 4 6 8 10 12 14 16 18 20 22 24 26 28 30 32 34 360
0.0050.01
0.015
0.020.0250.03
0.0350.04
0.045
0.050.0550.06
Number of dampers
Pea
k i
nte
rsto
ry d
rift
ra
tio
LA03
PDR LS CP
Minimum
2 4 6 8 10 12 14 16 18 20 22 24 26 28 30 32 34 360
0.0050.01
0.015
0.020.0250.03
0.0350.04
0.045
0.050.0550.06
Number of dampers
Pea
k i
nte
rsto
ry d
rift
ra
tio
LA05
PDR LS CP
Minimum
2 4 6 8 10 12 14 16 18 20 22 24 26 28 30 32 34 360
0.0050.01
0.015
0.020.0250.03
0.0350.04
0.045
0.050.0550.06
Number of dampers
Pea
k i
nte
rsto
ry d
rift
ra
tio
LA09
PDR LS CP
Minimum
2 4 6 8 10 12 14 16 18 20 22 24 26 28 30 32 34 360
0.0050.01
0.015
0.020.0250.03
0.0350.04
0.045
0.050.0550.06
Number of dampers
Pea
k i
nte
rsto
ry d
rift
ra
tio
LA11
PDR LS CP
Minimum
2 4 6 8 10 12 14 16 18 20 22 24 26 28 30 32 34 360
0.0050.01
0.015
0.020.0250.03
0.0350.04
0.045
0.050.0550.06
Number of dampers
Pea
k i
nte
rsto
ry d
rift
ra
tio
LA12
PDR LS CP
Minimum
2 4 6 8 10 12 14 16 18 20 22 24 26 28 30 32 34 360
0.0050.01
0.015
0.020.0250.03
0.0350.04
0.045
0.050.0550.06
Number of dampers
Pea
k i
nte
rsto
ry d
rift
ra
tio
LA13
PDR LS CP
Minimum

75
Figure 5.32: Performance of interstory drift ratio criterion in the 9-story building
(part 3)
2 4 6 8 10 12 14 16 18 20 22 24 26 28 30 32 34 360
0.0050.01
0.015
0.020.0250.03
0.0350.04
0.045
0.050.0550.06
Number of dampers
Pea
k i
nte
rsto
ry d
rift
ra
tio
LA14
PDR LS CP
Minimum
2 4 6 8 10 12 14 16 18 20 22 24 26 28 30 32 34 360
0.0050.01
0.015
0.020.0250.03
0.0350.04
0.045
0.050.0550.06
Number of dampers
Pea
k i
nte
rsto
ry d
rift
ra
tio
LA15
PDR LS CP
Minimum
2 4 6 8 10 12 14 16 18 20 22 24 26 28 30 32 34 360
0.0050.01
0.015
0.020.0250.03
0.0350.04
0.045
0.050.0550.06
Number of dampers
Pea
k i
nte
rsto
ry d
rift
ra
tio
LA16
PDR LS CP
Minimum
2 4 6 8 10 12 14 16 18 20 22 24 26 28 30 32 34 360
0.0050.01
0.015
0.020.0250.03
0.0350.04
0.045
0.050.0550.06
Number of dampers
Pea
k i
nte
rsto
ry d
rift
ra
tio
LA17
PDR LS CP
Minimum
2 4 6 8 10 12 14 16 18 20 22 24 26 28 30 32 34 360
0.0050.01
0.015
0.020.0250.03
0.0350.04
0.045
0.050.0550.06
Number of dampers
Pea
k i
nte
rsto
ry d
rift
ra
tio
LA18
PDR LS CP
Minimum
2 4 6 8 10 12 14 16 18 20 22 24 26 28 30 32 34 360
0.0050.01
0.015
0.020.0250.03
0.0350.04
0.045
0.050.0550.06
Number of dampers
Pea
k i
nte
rsto
ry d
rift
ra
tio
LA19
PDR LS CP
Minimum

76
Figure 5.33: Performance of interstory drift ratio criterion in the 9-story building
(part 4)
Once the above curves were produced, the number of dampers that yields the
minimum response under each of the considered earthquakes is selected. This number of
dampers corresponds, in each case, to a different and particular bracing array that will
minimize the maximum response of the structure under the action of a specific
earthquake. The various sub-optimal arrays resulting from the 15 different optimization
processes are drawn in Fig. 5.34.
Thirteen different sub-optimal configurations were available (CLA11 and
CLA17 happened to be the same as well as CLA05 and CLA20). To determine which
configuration would be selected for the continuation of the work proposed for this thesis,
each of the arrays in the figure was subjected to the series of 20 BSE-1 earthquakes.
Later, the 20 peak interstory drift ratios obtained for each of the 13 arrays were averaged
and compared; the configuration yielding the lowest average response was chosen.
2 4 6 8 10 12 14 16 18 20 22 24 26 28 30 32 34 360
0.0050.01
0.015
0.020.0250.03
0.0350.04
0.045
0.050.0550.06
Number of dampers
Pea
k i
nte
rsto
ry d
rift
ra
tio
LA20
PDR LS CP
Minimum

77
Figure 5.34: Sub-optimal FDBF configurations for the 9-story building

78
Table 5.1: Peak interstory drift ratio of the different damper configurations subjected to
the series of BSE-1 records.
DAMPER CONFIGURATION
RECORD CLA01 CLA02 CLA03 CLA05/20 CLA09 CLA11/17 CLA12 CLA13 CLA14 CLA15 CLA16 CLA18 CLA19
LA01 0.0059 0.0064 0.0096 0.0065 0.01 0.0066 0.0084 0.0093 0.0092 0.0106 0.0063 0.0063 0.0064
LA02 0.0079 0.0077 0.0096 0.0078 0.0097 0.0077 0.0087 0.0099 0.0095 0.0103 0.0083 0.0084 0.0078
LA03 0.0104 0.0103 0.0086 0.0096 0.01 0.0097 0.0114 0.0103 0.0108 0.0105 0.0109 0.0101 0.0111
LA04 0.0054 0.0051 0.0096 0.0055 0.0083 0.0055 0.0067 0.0088 0.0093 0.0122 0.0047 0.0051 0.0057
LA05 0.0063 0.0062 0.0063 0.0054 0.0065 0.0056 0.0088 0.0063 0.0064 0.0064 0.0063 0.006 0.0069
LA06 0.0071 0.007 0.0077 0.0059 0.0072 0.0064 0.0056 0.0085 0.009 0.0088 0.0073 0.0072 0.0078
LA07 0.0077 0.0075 0.0079 0.0073 0.0075 0.0073 0.0074 0.0079 0.0079 0.0091 0.008 0.0079 0.0082
LA08 0.0075 0.0073 0.0074 0.0073 0.0088 0.0076 0.0077 0.0079 0.0079 0.0092 0.0082 0.0077 0.0081
LA09 0.0162 0.0171 0.0179 0.0169 0.016 0.0158 0.0189 0.0167 0.0177 0.017 0.0172 0.0163 0.0164
LA10 0.0081 0.0085 0.0083 0.0072 0.0086 0.0078 0.009 0.0085 0.0086 0.0101 0.0086 0.0085 0.0089
LA11 0.0124 0.0128 0.0123 0.0124 0.0136 0.012 0.0188 0.0139 0.014 0.0138 0.013 0.0125 0.0134
LA12 0.0057 0.0062 0.0106 0.0065 0.0075 0.0064 0.0049 0.0082 0.0088 0.0124 0.0068 0.0061 0.0054
LA13 0.0119 0.0118 0.0109 0.0109 0.0104 0.0114 0.0117 0.0097 0.0096 0.0118 0.0127 0.012 0.0121
LA14 0.01 0.0098 0.0095 0.0095 0.0115 0.01 0.0139 0.0105 0.0097 0.0098 0.0105 0.0103 0.0106
LA15 0.0119 0.0117 0.014 0.0112 0.0129 0.0117 0.0126 0.0121 0.0126 0.0116 0.0123 0.0115 0.0127
LA16 0.0138 0.015 0.0205 0.0165 0.0144 0.0151 0.0143 0.0155 0.0149 0.0171 0.0128 0.0132 0.0137
LA17 0.0101 0.01 0.01 0.0092 0.0097 0.0091 0.0118 0.0095 0.0099 0.0097 0.0102 0.0096 0.0109
LA18 0.0147 0.0151 0.0229 0.0174 0.0159 0.0162 0.0165 0.0171 0.0161 0.0165 0.0146 0.0143 0.0158
LA19 0.0078 0.0071 0.0106 0.0078 0.0085 0.0078 0.0068 0.0098 0.0095 0.0121 0.0068 0.0074 0.0058
LA20 0.0131 0.0134 0.0137 0.0121 0.0135 0.0125 0.0161 0.0134 0.0132 0.0132 0.0126 0.0122 0.013
Average 0.0097 0.0098 0.0114 0.0096 0.0105 0.0096 0.011 0.0107 0.0107 0.0116 0.0099 0.0096 0.01
Table 5.1 shows that the configuration that results in the smallest average peak
interstory drift ratio is configuration CLA11/17; thus, this configuration is used in the
following steps (the average response of CLA18 is actually larger if more significant
figures are used).
Calibration of the FDB parameters (brace stiffness and slip force of dampers)
comes now. The CLA11/17 FDBF is subjected to each of the BSE-1 earthquake records
for which the bare benchmark frame was not adequate and, in each case, several
combinations of stiffness and friction force are analyzed to draw the curves shown in the
next graphs.
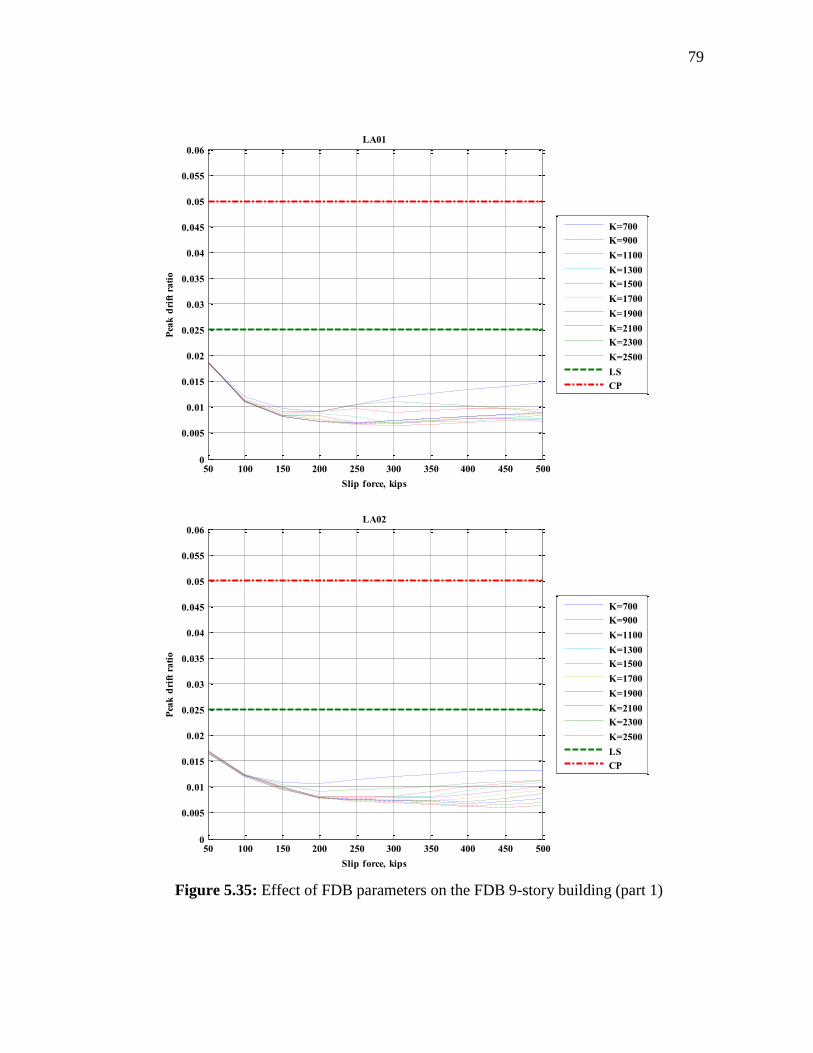
79
Figure 5.35: Effect of FDB parameters on the FDB 9-story building (part 1)
50 100 150 200 250 300 350 400 450 5000
0.005
0.01
0.015
0.02
0.025
0.03
0.035
0.04
0.045
0.05
0.055
0.06
Slip force, kips
Pea
k d
rift
rati
o
LA01
K=700
K=900
K=1100
K=1300
K=1500
K=1700
K=1900
K=2100
K=2300
K=2500
LS
CP
50 100 150 200 250 300 350 400 450 5000
0.005
0.01
0.015
0.02
0.025
0.03
0.035
0.04
0.045
0.05
0.055
0.06
Slip force, kips
Pea
k d
rift
ra
tio
LA02
K=700
K=900
K=1100
K=1300
K=1500
K=1700
K=1900
K=2100
K=2300
K=2500
LS
CP

80
Figure 5.36: Effect of FDB parameters on the FDB 9-story building (part 2)
50 100 150 200 250 300 350 400 450 5000
0.005
0.01
0.015
0.02
0.025
0.03
0.035
0.04
0.045
0.05
0.055
0.06
Slip force, kips
Pea
k d
rift
rati
o
LA03
K=700
K=900
K=1100
K=1300
K=1500
K=1700
K=1900
K=2100
K=2300
K=2500
LS
CP
50 100 150 200 250 300 350 400 450 5000
0.005
0.01
0.015
0.02
0.025
0.03
0.035
0.04
0.045
0.05
0.055
0.06
Slip force, kips
Pea
k d
rift
ra
tio
LA05
K=700
K=900
K=1100
K=1300
K=1500
K=1700
K=1900
K=2100
K=2300
K=2500
LS
CP

81
Figure 5.37: Effect of FDB parameters on the FDB 9-story building (part 3)
50 100 150 200 250 300 350 400 450 5000
0.005
0.01
0.015
0.02
0.025
0.03
0.035
0.04
0.045
0.05
0.055
0.06
Slip force, kips
Pea
k d
rift
rati
o
LA09
K=700
K=900
K=1100
K=1300
K=1500
K=1700
K=1900
K=2100
K=2300
K=2500
LS
CP
50 100 150 200 250 300 350 400 450 5000
0.005
0.01
0.015
0.02
0.025
0.03
0.035
0.04
0.045
0.05
0.055
0.06
Slip force, kips
Pea
k d
rift
ra
tio
LA11
K=700
K=900
K=1100
K=1300
K=1500
K=1700
K=1900
K=2100
K=2300
K=2500
LS
CP

82
Figure 5.38: Effect of FDB parameters on the FDB 9-story building (part 4)
50 100 150 200 250 300 350 400 450 5000
0.005
0.01
0.015
0.02
0.025
0.03
0.035
0.04
0.045
0.05
0.055
0.06
Slip force, kips
Pea
k d
rift
rati
o
LA12
K=700
K=900
K=1100
K=1300
K=1500
K=1700
K=1900
K=2100
K=2300
K=2500
LS
CP
50 100 150 200 250 300 350 400 450 5000
0.005
0.01
0.015
0.02
0.025
0.03
0.035
0.04
0.045
0.05
0.055
0.06
Slip force, kips
Pea
k d
rift
ra
tio
LA13
K=700
K=900
K=1100
K=1300
K=1500
K=1700
K=1900
K=2100
K=2300
K=2500
LS
CP

83
Figure 5.39: Effect of FDB parameters on the FDB 9-story building (part 5)
50 100 150 200 250 300 350 400 450 5000
0.005
0.01
0.015
0.02
0.025
0.03
0.035
0.04
0.045
0.05
0.055
0.06
Slip force, kips
Pea
k d
rift
rati
o
LA14
K=700
K=900
K=1100
K=1300
K=1500
K=1700
K=1900
K=2100
K=2300
K=2500
LS
CP
50 100 150 200 250 300 350 400 450 5000
0.005
0.01
0.015
0.02
0.025
0.03
0.035
0.04
0.045
0.05
0.055
0.06
Slip force, kips
Pea
k d
rift
ra
tio
LA15
K=700
K=900
K=1100
K=1300
K=1500
K=1700
K=1900
K=2100
K=2300
K=2500
LS
CP

84
Figure 5.40: Effect of FDB parameters on the FDB 9-story building (part 6)
50 100 150 200 250 300 350 400 450 5000
0.005
0.01
0.015
0.02
0.025
0.03
0.035
0.04
0.045
0.05
0.055
0.06
Slip force, kips
Pea
k d
rift
rati
o
LA16
K=700
K=900
K=1100
K=1300
K=1500
K=1700
K=1900
K=2100
K=2300
K=2500
LS
CP
50 100 150 200 250 300 350 400 450 5000
0.005
0.01
0.015
0.02
0.025
0.03
0.035
0.04
0.045
0.05
0.055
0.06
Slip force, kips
Pea
k d
rift
ra
tio
LA17
K=700
K=900
K=1100
K=1300
K=1500
K=1700
K=1900
K=2100
K=2300
K=2500
LS
CP

85
Figure 5.41: Effect of FDB parameters on the FDB 9-story building (part 7)
50 100 150 200 250 300 350 400 450 5000
0.005
0.01
0.015
0.02
0.025
0.03
0.035
0.04
0.045
0.05
0.055
0.06
Slip force, kips
Pea
k d
rift
rati
o
LA18
K=700
K=900
K=1100
K=1300
K=1500
K=1700
K=1900
K=2100
K=2300
K=2500
LS
CP
50 100 150 200 250 300 350 400 450 5000
0.005
0.01
0.015
0.02
0.025
0.03
0.035
0.04
0.045
0.05
0.055
0.06
Slip force, kips
Pea
k d
rift
ra
tio
LA19
K=700
K=900
K=1100
K=1300
K=1500
K=1700
K=1900
K=2100
K=2300
K=2500
LS
CP

86
Figure 5.42: Effect of FDB parameters on the FDB 9-story building (part 8)
Revision of the plots shows that any value of brace stiffness acting together with
friction devices with slip load equal to 100 kips will bring the peak interstory drift ratio
in the building below the 0.025 threshold. Since the stiffness of the brace is, in this case,
not an issue, the most economical section will be the lightest that guarantees resistance
to the maximum compression load that can be developed in the brace, namely, 100 kips.
Consequently, HSS9×9×5/16 shapes (K = 733 kips/in) were selected for the braces and
friction devices with 100 kip slip force.
CLA11/17 is then assigned with the last obtained combination of values and,
knowing that it is already adequate to guarantee compliance with the LS performance
level, it is subjected to the series of 20 2% in 50 years earthquakes to determine its
50 100 150 200 250 300 350 400 450 5000
0.005
0.01
0.015
0.02
0.025
0.03
0.035
0.04
0.045
0.05
0.055
0.06
Slip force, kips
Pea
k d
rift
rati
o
LA20
K=700
K=900
K=1100
K=1300
K=1500
K=1700
K=1900
K=2100
K=2300
K=2500
LS
CP

87
suitability to fulfill also the requirements of CP. The results of these analyses are
displayed in the next figure.
Figure 5.43: BSE-2 peak interstory drift ratios of the first proposed FDBF
The graph shows that the FDBF is not adequate to resist all the BSE-2
earthquakes in the series, which implies the need for further improvement. The process
of trying combinations of stiffness and friction force is repeated, now considering only
those BSE-2 earthquakes for which the preliminary FDBF design is not yet adequate.
The results are as follows.
21 22 23 24 25 26 27 28 29 30 31 32 33 34 35 36 37 38 39 400
0.005
0.01
0.015
0.02
0.025
0.03
0.035
0.04
0.045
0.05
0.055
0.06
LA record number
Pea
k i
nte
rsto
ry d
rift
ra
tio
PDR LS CP

88
Figure 5.44: Effect of FDB parameters on the FDB 9-story building (part 9)
150 200 250 300 350 400 450 5000
0.005
0.01
0.015
0.02
0.025
0.03
0.035
0.04
0.045
0.05
0.055
0.06
Slip force, kips
Pea
k i
nte
rsto
ry d
rift
ra
tio
LA35
K=1100
K=1300
K=1500
K=1700
K=1900
K=2100
K=2300
K=2500
LS
CP
150 200 250 300 350 400 450 5000
0.005
0.01
0.015
0.02
0.025
0.03
0.035
0.04
0.045
0.05
0.055
0.06
Slip force, kips
Pea
k i
nte
rsto
ry d
rift
ra
tio
LA36
K=1700
K=1900
K=2100
K=2300
K=2500
LS
CP

89
Figure 5.45: Effect of FDB parameters on the FDB 9-story building (part 10)
150 200 250 300 350 400 450 5000
0.005
0.01
0.015
0.02
0.025
0.03
0.035
0.04
0.045
0.05
0.055
0.06
Slip force, kips
Pea
k i
nte
rsto
ry d
rift
ra
tio
LA38
K=1300
K=1500
K=1700
K=1900
K=2100
K=2300
K=2500
LS
CP
150 200 250 300 350 400 450 5000
0.005
0.01
0.015
0.02
0.025
0.03
0.035
0.04
0.045
0.05
0.055
0.06
Slip force, kips
Pea
k i
nte
rsto
ry d
rift
ra
tio
LA40
K=900
K=1100
K=1300
K=1500
K=1700
K=1900
K=2100
K=2300
K=2500
LS
CP
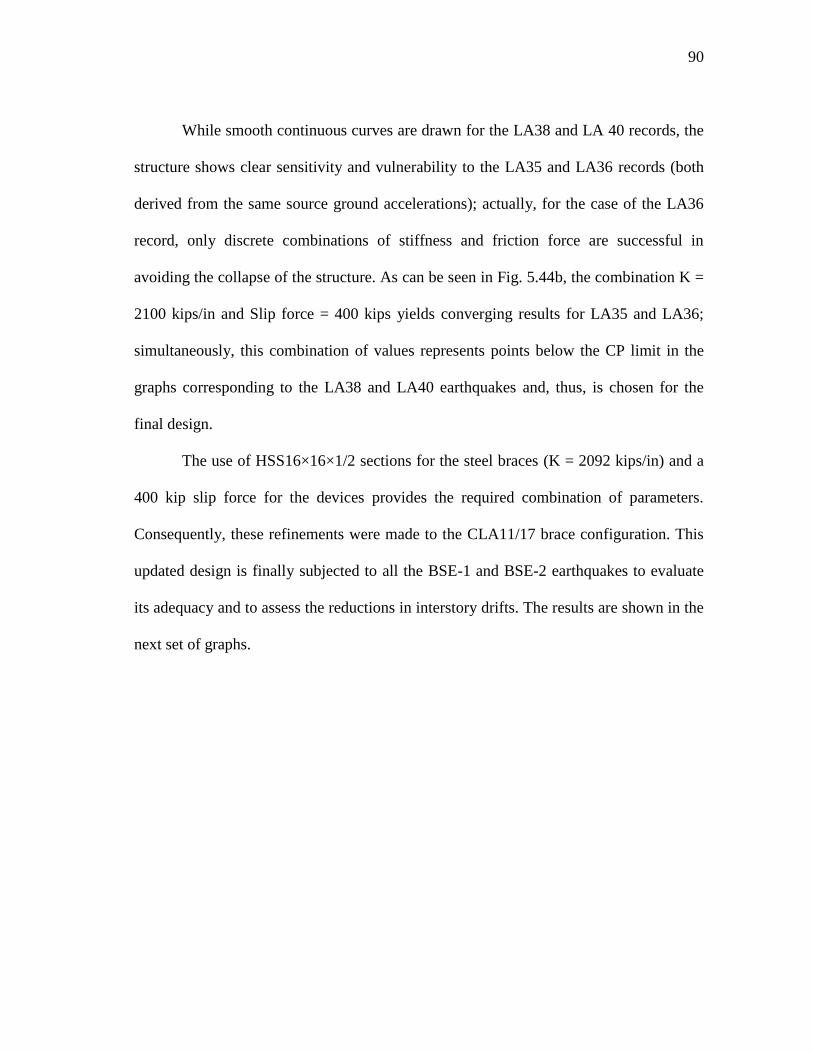
90
While smooth continuous curves are drawn for the LA38 and LA 40 records, the
structure shows clear sensitivity and vulnerability to the LA35 and LA36 records (both
derived from the same source ground accelerations); actually, for the case of the LA36
record, only discrete combinations of stiffness and friction force are successful in
avoiding the collapse of the structure. As can be seen in Fig. 5.44b, the combination K =
2100 kips/in and Slip force = 400 kips yields converging results for LA35 and LA36;
simultaneously, this combination of values represents points below the CP limit in the
graphs corresponding to the LA38 and LA40 earthquakes and, thus, is chosen for the
final design.
The use of HSS16×16×1/2 sections for the steel braces (K = 2092 kips/in) and a
400 kip slip force for the devices provides the required combination of parameters.
Consequently, these refinements were made to the CLA11/17 brace configuration. This
updated design is finally subjected to all the BSE-1 and BSE-2 earthquakes to evaluate
its adequacy and to assess the reductions in interstory drifts. The results are shown in the
next set of graphs.

91
Figure 5.46: Comparative peak interstory drift ratios of 9-story FDBF and benchmark
01 02 03 04 05 06 07 08 09 10 11 12 13 14 15 16 17 18 19 200
0.005
0.01
0.015
0.02
0.025
0.03
0.035
0.04
0.045
0.05
0.055
0.06
LA record number
Pea
k i
nte
rsto
ry d
rift
ra
tio
Uncontrolled Controlled LS CP
21 22 23 24 25 26 27 28 29 30 31 32 33 34 35 36 37 38 39 400
0.005
0.01
0.015
0.02
0.025
0.03
0.035
0.04
0.045
0.05
0.055
0.06
LA record number
Pea
k i
nte
rsto
ry d
rift
ra
tio
Uncontrolled Controlled LS CP

92
Figure 5.47: Comparative interstory drift ratios of 9-story FDBF and benchmark (part 1)
0 0.01 0.02 0.03 0.04 0.05 0.060
1
2
3
4
5
6
7
8
9
Peak drift ratio
Sto
ry n
um
ber
LA01
Bare
Damped
LS
CP
0 0.01 0.02 0.03 0.04 0.05 0.060
1
2
3
4
5
6
7
8
9
Peak drift ratio
Sto
ry n
um
ber
LA02
Bare
Damped
LS
CP
0 0.01 0.02 0.03 0.04 0.05 0.060
1
2
3
4
5
6
7
8
9
Peak drift ratio
Sto
ry n
um
ber
LA03
Bare
Damped
LS
CP
0 0.01 0.02 0.03 0.04 0.05 0.060
1
2
3
4
5
6
7
8
9
Peak drift ratio
Sto
ry n
um
ber
LA04
Bare
Damped
LS
CP
0 0.01 0.02 0.03 0.04 0.05 0.060
1
2
3
4
5
6
7
8
9
Peak drift ratio
Sto
ry n
um
ber
LA05
Bare
Damped
LS
CP
0 0.01 0.02 0.03 0.04 0.05 0.060
1
2
3
4
5
6
7
8
9
Peak drift ratio
Sto
ry n
um
ber
LA06
Bare
Damped
LS
CP

93
Figure 5.48: Comparative interstory drift ratios of 9-story FDBF and benchmark (part 2)
0 0.01 0.02 0.03 0.04 0.05 0.060
1
2
3
4
5
6
7
8
9
Peak drift ratio
Sto
ry n
um
ber
LA07
Bare
Damped
LS
CP
0 0.01 0.02 0.03 0.04 0.05 0.060
1
2
3
4
5
6
7
8
9
Peak drift ratio
Sto
ry n
um
ber
LA08
Bare
Damped
LS
CP
0 0.01 0.02 0.03 0.04 0.05 0.060
1
2
3
4
5
6
7
8
9
Peak drift ratio
Sto
ry n
um
ber
LA09
Bare
Damped
LS
CP
0 0.01 0.02 0.03 0.04 0.05 0.060
1
2
3
4
5
6
7
8
9
Peak drift ratio
Sto
ry n
um
ber
LA10
Bare
Damped
LS
CP
0 0.01 0.02 0.03 0.04 0.05 0.060
1
2
3
4
5
6
7
8
9
Peak drift ratio
Sto
ry n
um
ber
LA11
Bare
Damped
LS
CP
0 0.01 0.02 0.03 0.04 0.05 0.060
1
2
3
4
5
6
7
8
9
Peak drift ratio
Sto
ry n
um
ber
LA12
Bare
Damped
LS
CP

94
Figure 5.49: Comparative interstory drift ratios of 9-story FDBF and benchmark (part 3)
0 0.01 0.02 0.03 0.04 0.05 0.060
1
2
3
4
5
6
7
8
9
Peak drift ratio
Sto
ry n
um
ber
LA13
Bare
Damped
LS
CP
0 0.01 0.02 0.03 0.04 0.05 0.060
1
2
3
4
5
6
7
8
9
Peak drift ratio
Sto
ry n
um
ber
LA14
Bare
Damped
LS
CP
0 0.01 0.02 0.03 0.04 0.05 0.060
1
2
3
4
5
6
7
8
9
Peak drift ratio
Sto
ry n
um
ber
LA15
Bare
Damped
LS
CP
0 0.01 0.02 0.03 0.04 0.05 0.060
1
2
3
4
5
6
7
8
9
Peak drift ratio
Sto
ry n
um
ber
LA16
Bare
Damped
LS
CP
0 0.01 0.02 0.03 0.04 0.05 0.060
1
2
3
4
5
6
7
8
9
Peak drift ratio
Sto
ry n
um
ber
LA17
Bare
Damped
LS
CP
0 0.01 0.02 0.03 0.04 0.05 0.060
1
2
3
4
5
6
7
8
9
Peak drift ratio
Sto
ry n
um
ber
LA18
Bare
Damped
LS
CP

95
Figure 5.50: Comparative interstory drift ratios of 9-story FDBF and benchmark (part 4)
0 0.01 0.02 0.03 0.04 0.05 0.060
1
2
3
4
5
6
7
8
9
Peak drift ratio
Sto
ry n
um
ber
LA19
Bare
Damped
LS
CP
0 0.01 0.02 0.03 0.04 0.05 0.060
1
2
3
4
5
6
7
8
9
Peak drift ratio
Sto
ry n
um
ber
LA20
Bare
Damped
LS
CP
0 0.01 0.02 0.03 0.04 0.05 0.060
1
2
3
4
5
6
7
8
9
Peak drift ratio
Sto
ry n
um
ber
LA21
Bare
Damped
LS
CP
0 0.01 0.02 0.03 0.04 0.05 0.060
1
2
3
4
5
6
7
8
9
Peak drift ratio
Sto
ry n
um
ber
LA22
Bare
Damped
LS
CP
0 0.01 0.02 0.03 0.04 0.05 0.060
1
2
3
4
5
6
7
8
9
Peak drift ratio
Sto
ry n
um
ber
LA23
Bare
Damped
LS
CP
0 0.01 0.02 0.03 0.04 0.05 0.060
1
2
3
4
5
6
7
8
9
Peak drift ratio
Sto
ry n
um
ber
LA24
Bare
Damped
LS
CP

96
Figure 5.51: Comparative interstory drift ratios of 9-story FDBF and benchmark (part 5)
0 0.01 0.02 0.03 0.04 0.05 0.060
1
2
3
4
5
6
7
8
9
Peak drift ratio
Sto
ry n
um
ber
LA25
Bare
Damped
LS
CP
0 0.01 0.02 0.03 0.04 0.05 0.060
1
2
3
4
5
6
7
8
9
Peak drift ratio
Sto
ry n
um
ber
LA26
Bare
Damped
LS
CP
0 0.01 0.02 0.03 0.04 0.05 0.060
1
2
3
4
5
6
7
8
9
Peak drift ratio
Sto
ry n
um
ber
LA27
Bare
Damped
LS
CP
0 0.01 0.02 0.03 0.04 0.05 0.060
1
2
3
4
5
6
7
8
9
Peak drift ratio
Sto
ry n
um
ber
LA28
Bare
Damped
LS
CP
0 0.01 0.02 0.03 0.04 0.05 0.060
1
2
3
4
5
6
7
8
9
Peak drift ratio
Sto
ry n
um
ber
LA29
Bare
Damped
LS
CP
0 0.01 0.02 0.03 0.04 0.05 0.060
1
2
3
4
5
6
7
8
9
Peak drift ratio
Sto
ry n
um
ber
LA30
Bare
Damped
LS
CP

97
Figure 5.52: Comparative interstory drift ratios of 9-story FDBF and benchmark (part 6)
0 0.01 0.02 0.03 0.04 0.05 0.060
1
2
3
4
5
6
7
8
9
Peak drift ratio
Sto
ry n
um
ber
LA31
Bare
Damped
LS
CP
0 0.01 0.02 0.03 0.04 0.05 0.060
1
2
3
4
5
6
7
8
9
Peak drift ratio
Sto
ry n
um
ber
LA32
Bare
Damped
LS
CP
0 0.01 0.02 0.03 0.04 0.05 0.060
1
2
3
4
5
6
7
8
9
Peak drift ratio
Sto
ry n
um
ber
LA33
Bare
Damped
LS
CP
0 0.01 0.02 0.03 0.04 0.05 0.060
1
2
3
4
5
6
7
8
9
Peak drift ratio
Sto
ry n
um
ber
LA34
Bare
Damped
LS
CP
0 0.01 0.02 0.03 0.04 0.05 0.060
1
2
3
4
5
6
7
8
9
Peak drift ratio
Sto
ry n
um
ber
LA35
Bare
Damped
LS
CP
0 0.01 0.02 0.03 0.04 0.05 0.060
1
2
3
4
5
6
7
8
9
Peak drift ratio
Sto
ry n
um
ber
LA36
Bare
Damped
LS
CP

98
Figure 5.53: Comparative interstory drift ratios of 9-story FDBF and benchmark (part 7)
0 0.01 0.02 0.03 0.04 0.05 0.060
1
2
3
4
5
6
7
8
9
Peak drift ratio
Sto
ry n
um
ber
LA37
Bare
Damped
LS
CP
0 0.01 0.02 0.03 0.04 0.05 0.060
1
2
3
4
5
6
7
8
9
Peak drift ratio
Sto
ry n
um
ber
LA38
Bare
Damped
LS
CP
0 0.01 0.02 0.03 0.04 0.05 0.060
1
2
3
4
5
6
7
8
9
Peak drift ratio
Sto
ry n
um
ber
LA39
Bare
Damped
LS
CP
0 0.01 0.02 0.03 0.04 0.05 0.060
1
2
3
4
5
6
7
8
9
Peak drift ratio
Sto
ry n
um
ber
LA40
Bare
Damped
LS
CP

99
5.3 20-Story Building
Figure 5.54: Twenty-story benchmark building north-south moment resisting frame
(Ohtori et al. 2004)

100
The evaluation of the capacity of the 20-story benchmark building is performed. That is,
the frame is subjected to the 20 10% in 50 years and the 20 2% in 50 years earthquake
records and the values obtained for the peak interstory drift ratios (Figs. 5.55 and 5.56)
are saved for their eventual comparison, but used first, as starting point, for retrofitting
of the 20-story benchmark frame.
Figure 5.55: BSE-1 interstory drift demands of 20-story benchmark building
01 02 03 04 05 06 07 08 09 10 11 12 13 14 15 16 17 18 19 200
0.005
0.01
0.015
0.02
0.025
0.03
0.035
0.04
0.045
0.05
0.055
0.06
LA record number
Pea
k i
nte
rsto
ry d
rift
ra
tio
PDR LS CP
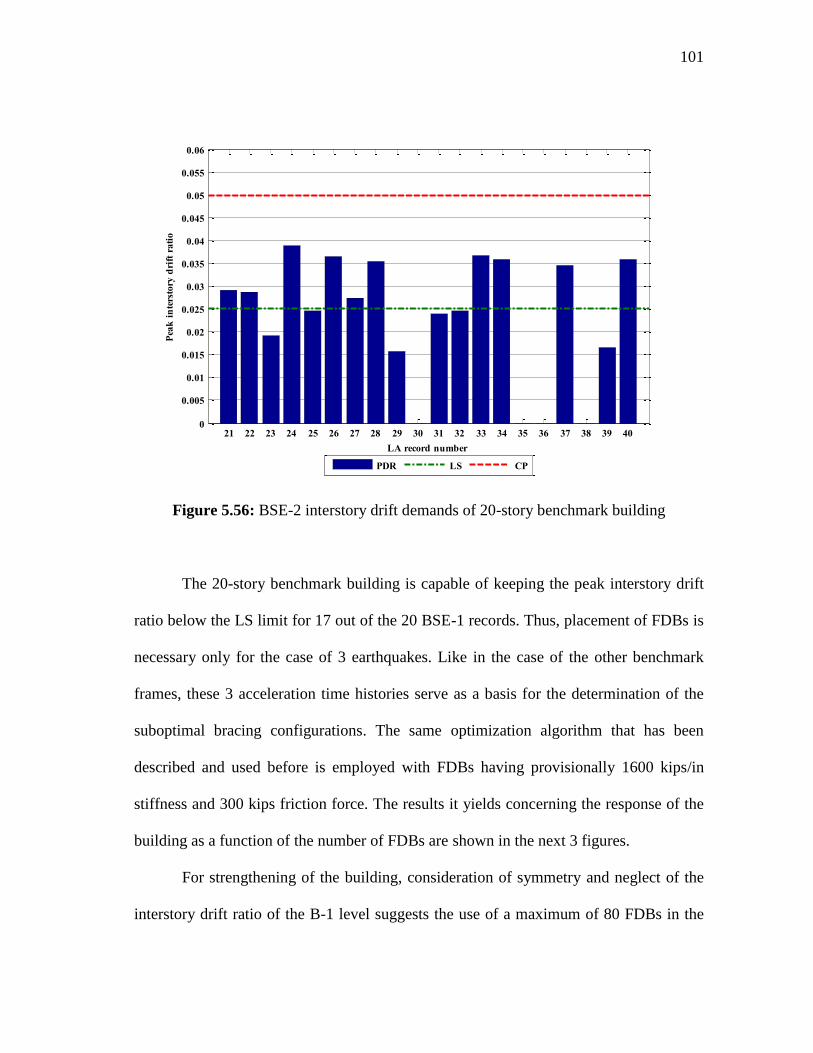
101
Figure 5.56: BSE-2 interstory drift demands of 20-story benchmark building
The 20-story benchmark building is capable of keeping the peak interstory drift
ratio below the LS limit for 17 out of the 20 BSE-1 records. Thus, placement of FDBs is
necessary only for the case of 3 earthquakes. Like in the case of the other benchmark
frames, these 3 acceleration time histories serve as a basis for the determination of the
suboptimal bracing configurations. The same optimization algorithm that has been
described and used before is employed with FDBs having provisionally 1600 kips/in
stiffness and 300 kips friction force. The results it yields concerning the response of the
building as a function of the number of FDBs are shown in the next 3 figures.
For strengthening of the building, consideration of symmetry and neglect of the
interstory drift ratio of the B-1 level suggests the use of a maximum of 80 FDBs in the
21 22 23 24 25 26 27 28 29 30 31 32 33 34 35 36 37 38 39 400
0.005
0.01
0.015
0.02
0.025
0.03
0.035
0.04
0.045
0.05
0.055
0.06
LA record number
Pea
k i
nte
rsto
ry d
rift
ra
tio
PDR LS CP

102
earthquake resisting frame. For the determination of the optimal number and location of
the FDBs, instead of testing the dampers in pairs at a time during the optimization
process, this time they are tested in groups of 4 in the same story. This number is chosen
not only considering symmetry, but also to reduce the number of analyses required to
determine the suboptimal configurations. This becomes an issue in the case of the 20-
story frame since the algorithm could require more than 6 times the number of analyses
required for the case of the 9-story building to find a sub-optimal configuration. This
enormous increase in the number of analyses together with the obvious increase in
computational time needed to analyze a larger structure would require an unpractical
amount of time to complete the optimization procedure.
Figure 5.57: Performance of interstory drift ratio criterion in the 20-story building
(part 1)
4 8 1216202428323640444852566064687276800
0.0050.01
0.015
0.020.0250.03
0.0350.04
0.045
0.050.0550.06
Number of dampers
Pea
k i
nte
rsto
ry d
rift
ra
tio
LA04
PDR LS CP
4 8 1216202428323640444852566064687276800
0.0050.01
0.015
0.020.0250.03
0.0350.04
0.045
0.050.0550.06
Number of dampers
Pea
k i
nte
rsto
ry d
rift
ra
tio
LA05
PDR LS CP

103
Figure 5.58: Performance of interstory drift ratio criterion in the 20-story building
(part 2)
Taking a look at the plots, it is possible to determine a point after which, an
increase in the number of friction-damped braces does not correspond to a significant
reduction in the response anymore; therefore, the addition of more dampers beyond this
point not justified. This situation is clearly displayed on the last three graphs and, in an
almost perfect example, on the graph concerning the LA16 record. Hence, for this
building, the criterion for selecting the number of dampers to be placed in the frame was
not only the number of dampers that would yield the minimum response, but also
consideration was given to the minimum number of dampers that would bring the
maximum response of the building to that point after which the response is no longer
significantly reduced.
Although a similar situation occurs in the case of the 9-story building, the
consideration of this additional criterion takes more importance in the case of the present
building since, here, a considerably greater number of dampers is involved and a smaller
reduction in the response with their installation. Stepwise, this issue becomes also
4 8 1216202428323640444852566064687276800
0.0050.01
0.015
0.020.0250.03
0.0350.04
0.045
0.050.0550.06
Number of dampersP
eak
in
ters
tory
dri
ft r
ati
o
LA16
PDR LS CP

104
economically more important here than in the previous frame because the number of
dampers added at each step is twice. Furthermore, the need for achieving the maximum
reduction in the peak response was more important in the case of the 9-story building.
In consideration of the aforementioned, the following configurations were
selected (note that they are not necessarily the ones that yielded the minimum peak
interstory drift value): CLA04 for the LA04 record (64 FDBs), CLA05 for the LA05 (56
FDBs) and CLA16 for the LA16 (40 FDBs).
Repeating the procedure used for the 9-story building, to make a decision on
which of the 3 arrays to use, all 3 were subjected to the series of 20 BSE-1 earthquake
records. The 20 maximum interstory drift ratios that were obtained were averaged and,
finally, the array that yielded the lowest average peak interstory drift ratio was selected.
As table 5.2 demonstrates, in this case it was configuration CLA05.
Figure 5.59: Sub-optimal FDBF configurations for the 20-story building

105
Table 5.2: Peak interstory drift ratio of the different damper configurations subjected to
the series of BSE-1 records.
DAMPER CONFIGURATION
RECORD CLA04 CLA05 CLA16
LA01 0.0111 0.0098 0.0194
LA02 0.0119 0.0119 0.0130
LA03 0.0164 0.0144 0.0278
LA04 0.0083 0.0122 0.0240
LA05 0.0154 0.0130 0.0350
LA06 0.0088 0.0085 0.0170
LA07 0.0116 0.0111 0.0162
LA08 0.0126 0.0123 0.0137
LA09 0.0130 0.0133 0.0177
LA10 0.0106 0.0096 0.0135
LA11 0.0125 0.0113 0.0142
LA12 0.0101 0.0096 0.0083
LA13 0.0132 0.0109 0.0126
LA14 0.0144 0.0114 0.0133
LA15 0.0116 0.0095 0.0132
LA16 0.0153 0.0135 0.0113
LA17 0.0128 0.0123 0.0177
LA18 0.0123 0.0117 0.0144
LA19 0.0123 0.0117 0.0091
LA20 0.0114 0.0116 0.0162
Average 0.0123 0.0115 0.0164
For the selection of the stiffness and slip force of the FDBs, the chosen FDBF
was analyzed under the LA04, LA05, and LA16 records trying 100 different
combinations of stiffness and slip force analyses, in each case, to determine the effects
of the variations these parameters on the response of the buildings. The next 3 graphs
display the results of these analyses.

106
Figure 5.60: Effect of FDB parameters on the FDB 20-story building (part 1)
50 100 150 200 250 300 350 400 450 5000
0.005
0.01
0.015
0.02
0.025
0.03
0.035
0.04
0.045
0.05
0.055
0.06
Slip force, kips
Pea
k i
nte
rsto
ry d
rift
ra
tio
LA04
K=900
K=1100
K=1300
K=1500
K=1700
K=1900
K=2100
K=2300
K=2500
LS
CP
50 100 150 200 250 300 350 400 450 5000
0.005
0.01
0.015
0.02
0.025
0.03
0.035
0.04
0.045
0.05
0.055
0.06
Slip force, kips
Pea
k i
nte
rsto
ry d
rift
ra
tio
LA05
K=1100
K=1300
K=1500
K=1700
K=1900
K=2100
K=2300
K=2500
LS
CP

107
Figure 5.61: Effect of FDB parameters on the FDB 20-story building (part 2)
All 3 graphs show that the stiffness of the brace will not govern the design of the
FDBs as long as the slip force is kept below 350 kips. Considering that 350 kips is
actually a “typical” value for the slip load (it has already been used in a number of
practical applications) along with the experience obtained from the analyses of the
previous buildings which always showed the necessity for greater values of stiffness and
friction forces to cope with the BSE-2 earthquakes, a slip load of 350 kips, which is not
the minimum required, was chosen to anticipate the larger friction force that could be
necessary anyway.
HSS16×12×5/16 steel shapes were used for the brace sections, which will
provide a stiffness equal to 1591 kips/in and will be able to resist the maximum
50 100 150 200 250 300 350 400 450 5000
0.005
0.01
0.015
0.02
0.025
0.03
0.035
0.04
0.045
0.05
0.055
0.06
Slip force, kips
Pea
k i
nte
rsto
ry d
rift
ra
tio
LA16
K=700
K=900
K=1100
K=1300
K=1500
K=1700
K=1900
K=2100
K=2300
K=2500
LS
CP
108
compression force of 350 kips in the brace. This stiffness and the force of 350 kips
properties were assigned to the analytical model of the building and, subsequently, the
model was subjected to the series of BSE-2 earthquakes to evaluate its capability to stay
below the CP limit.
The above defined preliminary design becomes the final one after it satisfactorily
brings the peak interstory drift ratio under the action of all the 2% in 50 years earthquake
records below 5%. Finally, the frame is also subjected to the series of 10% in 50 years
records (LA01 to LA20) and the “before and after” results are shown and compared in
the plots that follow.
Figure 5.62: Comparative peak interstory drift ratios of 20-story FDBF and benchmark
(part 1)
01 02 03 04 05 06 07 08 09 10 11 12 13 14 15 16 17 18 19 200
0.005
0.01
0.015
0.02
0.025
0.03
0.035
0.04
0.045
0.05
0.055
0.06
LA record number
Pea
k i
nte
rsto
ry d
rift
ra
tio
Uncontrolled Controlled LS CP
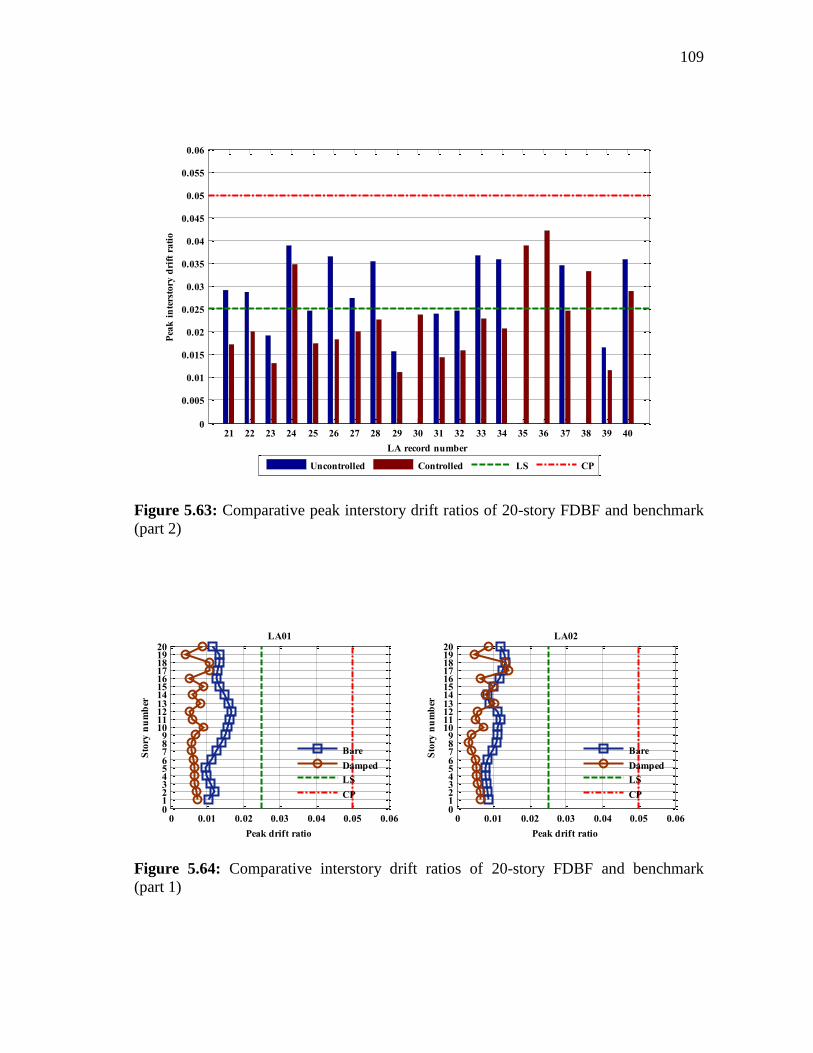
109
Figure 5.63: Comparative peak interstory drift ratios of 20-story FDBF and benchmark
(part 2)
Figure 5.64: Comparative interstory drift ratios of 20-story FDBF and benchmark
(part 1)
21 22 23 24 25 26 27 28 29 30 31 32 33 34 35 36 37 38 39 400
0.005
0.01
0.015
0.02
0.025
0.03
0.035
0.04
0.045
0.05
0.055
0.06
LA record number
Pea
k i
nte
rsto
ry d
rift
ra
tio
Uncontrolled Controlled LS CP
0 0.01 0.02 0.03 0.04 0.05 0.060123456789
1011121314151617181920
Peak drift ratio
Sto
ry n
um
ber
LA01
Bare
Damped
LS
CP
0 0.01 0.02 0.03 0.04 0.05 0.060123456789
1011121314151617181920
Peak drift ratio
Sto
ry n
um
ber
LA02
Bare
Damped
LS
CP

110
Figure 5.65: Comparative interstory drift ratios of 20-story FDBF and benchmark
(part 2)
0 0.01 0.02 0.03 0.04 0.05 0.060123456789
1011121314151617181920
Peak drift ratio
Sto
ry n
um
ber
LA03
Bare
Damped
LS
CP
0 0.01 0.02 0.03 0.04 0.05 0.060123456789
1011121314151617181920
Peak drift ratio
Sto
ry n
um
ber
LA04
Bare
Damped
LS
CP
0 0.01 0.02 0.03 0.04 0.05 0.060123456789
1011121314151617181920
Peak drift ratio
Sto
ry n
um
ber
LA05
Bare
Damped
LS
CP
0 0.01 0.02 0.03 0.04 0.05 0.060123456789
1011121314151617181920
Peak drift ratio
Sto
ry n
um
ber
LA06
Bare
Damped
LS
CP
0 0.01 0.02 0.03 0.04 0.05 0.060123456789
1011121314151617181920
Peak drift ratio
Sto
ry n
um
ber
LA07
Bare
Damped
LS
CP
0 0.01 0.02 0.03 0.04 0.05 0.060123456789
1011121314151617181920
Peak drift ratio
Sto
ry n
um
ber
LA08
Bare
Damped
LS
CP

111
Figure 5.66: Comparative interstory drift ratios of 20-story FDBF and benchmark
(part 3)
0 0.01 0.02 0.03 0.04 0.05 0.060123456789
1011121314151617181920
Peak drift ratio
Sto
ry n
um
ber
LA09
Bare
Damped
LS
CP
0 0.01 0.02 0.03 0.04 0.05 0.060123456789
1011121314151617181920
Peak drift ratio
Sto
ry n
um
ber
LA10
Bare
Damped
LS
CP
0 0.01 0.02 0.03 0.04 0.05 0.060123456789
1011121314151617181920
Peak drift ratio
Sto
ry n
um
ber
LA11
Bare
Damped
LS
CP
0 0.01 0.02 0.03 0.04 0.05 0.060123456789
1011121314151617181920
Peak drift ratio
Sto
ry n
um
ber
LA12
Bare
Damped
LS
CP
0 0.01 0.02 0.03 0.04 0.05 0.060123456789
1011121314151617181920
Peak drift ratio
Sto
ry n
um
ber
LA13
Bare
Damped
LS
CP
0 0.01 0.02 0.03 0.04 0.05 0.060123456789
1011121314151617181920
Peak drift ratio
Sto
ry n
um
ber
LA14
Bare
Damped
LS
CP

112
Figure 5.67: Comparative interstory drift ratios of 20-story FDBF and benchmark
(part 4)
0 0.01 0.02 0.03 0.04 0.05 0.060123456789
1011121314151617181920
Peak drift ratio
Sto
ry n
um
ber
LA15
Bare
Damped
LS
CP
0 0.01 0.02 0.03 0.04 0.05 0.060123456789
1011121314151617181920
Peak drift ratio
Sto
ry n
um
ber
LA16
Bare
Damped
LS
CP
0 0.01 0.02 0.03 0.04 0.05 0.060123456789
1011121314151617181920
Peak drift ratio
Sto
ry n
um
ber
LA17
Bare
Damped
LS
CP
0 0.01 0.02 0.03 0.04 0.05 0.060123456789
1011121314151617181920
Peak drift ratio
Sto
ry n
um
ber
LA18
Bare
Damped
LS
CP
0 0.01 0.02 0.03 0.04 0.05 0.060123456789
1011121314151617181920
Peak drift ratio
Sto
ry n
um
ber
LA19
Bare
Damped
LS
CP
0 0.01 0.02 0.03 0.04 0.05 0.060123456789
1011121314151617181920
Peak drift ratio
Sto
ry n
um
ber
LA20
Bare
Damped
LS
CP

113
Figure 5.68: Comparative interstory drift ratios of 20-story FDBF and benchmark
(part 5)
0 0.01 0.02 0.03 0.04 0.05 0.060123456789
1011121314151617181920
Peak drift ratio
Sto
ry n
um
ber
LA21
Bare
Damped
LS
CP
0 0.01 0.02 0.03 0.04 0.05 0.060123456789
1011121314151617181920
Peak drift ratio
Sto
ry n
um
ber
LA22
Bare
Damped
LS
CP
0 0.01 0.02 0.03 0.04 0.05 0.060123456789
1011121314151617181920
Peak drift ratio
Sto
ry n
um
ber
LA23
Bare
Damped
LS
CP
0 0.01 0.02 0.03 0.04 0.05 0.060123456789
1011121314151617181920
Peak drift ratio
Sto
ry n
um
ber
LA24
Bare
Damped
LS
CP
0 0.01 0.02 0.03 0.04 0.05 0.060123456789
1011121314151617181920
Peak drift ratio
Sto
ry n
um
ber
LA25
Bare
Damped
LS
CP
0 0.01 0.02 0.03 0.04 0.05 0.060123456789
1011121314151617181920
Peak drift ratio
Sto
ry n
um
ber
LA26
Bare
Damped
LS
CP

114
Figure 5.69: Comparative interstory drift ratios of 20-story FDBF and benchmark
(part 6)
0 0.01 0.02 0.03 0.04 0.05 0.060123456789
1011121314151617181920
Peak drift ratio
Sto
ry n
um
ber
LA27
Bare
Damped
LS
CP
0 0.01 0.02 0.03 0.04 0.05 0.060123456789
1011121314151617181920
Peak drift ratio
Sto
ry n
um
ber
LA28
Bare
Damped
LS
CP
0 0.01 0.02 0.03 0.04 0.05 0.060123456789
1011121314151617181920
Peak drift ratio
Sto
ry n
um
ber
LA29
Bare
Damped
LS
CP
0 0.01 0.02 0.03 0.04 0.05 0.060123456789
1011121314151617181920
Peak drift ratio
Sto
ry n
um
ber
LA30
Bare
Damped
LS
CP
0 0.01 0.02 0.03 0.04 0.05 0.060123456789
1011121314151617181920
Peak drift ratio
Sto
ry n
um
ber
LA31
Bare
Damped
LS
CP
0 0.01 0.02 0.03 0.04 0.05 0.060123456789
1011121314151617181920
Peak drift ratio
Sto
ry n
um
ber
LA32
Bare
Damped
LS
CP

115
Figure 5.70: Comparative interstory drift ratios of 20-story FDBF and benchmark
(part 7)
0 0.01 0.02 0.03 0.04 0.05 0.060123456789
1011121314151617181920
Peak drift ratio
Sto
ry n
um
ber
LA33
Bare
Damped
LS
CP
0 0.01 0.02 0.03 0.04 0.05 0.060123456789
1011121314151617181920
Peak drift ratio
Sto
ry n
um
ber
LA34
Bare
Damped
LS
CP
0 0.01 0.02 0.03 0.04 0.05 0.060123456789
1011121314151617181920
Peak drift ratio
Sto
ry n
um
ber
LA35
Bare
Damped
LS
CP
0 0.01 0.02 0.03 0.04 0.05 0.060123456789
1011121314151617181920
Peak drift ratio
Sto
ry n
um
ber
LA36
Bare
Damped
LS
CP
0 0.01 0.02 0.03 0.04 0.05 0.060123456789
1011121314151617181920
Peak drift ratio
Sto
ry n
um
ber
LA37
Bare
Damped
LS
CP
0 0.01 0.02 0.03 0.04 0.05 0.060123456789
1011121314151617181920
Peak drift ratio
Sto
ry n
um
ber
LA38
Bare
Damped
LS
CP

116
Figure 5.71: Comparative interstory drift ratios of 20-story FDBF and benchmark
(part 8)
0 0.01 0.02 0.03 0.04 0.05 0.060123456789
1011121314151617181920
Peak drift ratio
Sto
ry n
um
ber
LA39
Bare
Damped
LS
CP
0 0.01 0.02 0.03 0.04 0.05 0.060123456789
1011121314151617181920
Peak drift ratio
Sto
ry n
um
ber
LA40
Bare
Damped
LS
CP

117
6. REDESIGN OF THE BENCHMARK BUILDINGS
Use of friction devices as a means of passive vibration control has been made and its
technical effectiveness has been measured, compared and shown. In order to provide
more arguments that allow a better assessment of the convenience of installing FDBs in
a building either for its seismic strengthening or as part of its original design, the original
benchmark buildings have been redesigned to comply with the ASCE-41 BSO without
having to resort to any means of structural control. These redesigns are compared with
the designs of the 3 FDBFs.
The designs given below were carried out by testing available W- and box-
shapes in the frames and, eventually, selecting the lightest ones that made the building in
question comply with the ASCE-41 BSO requirements. For this, the computer software
SAP2000 was used. The designs were also made assuming that the original benchmark
frames are already the most economical designs that satisfy the requirements of lower
performance levels and/or that they satisfy a series of architectural requirements. That is
why, while redesigning the frames, the philosophy was to keep modifications of the
original benchmark buildings to the minimum. In other words, the overall arrangement
and geometry of the frames was kept; end conditions, orientations and, whenever
possible, depths of the frame elements were also respected.
Since the increase of the member sizes of only the earthquake MRFs does not
represent a significant increase of the total (seismic) mass of the (3-D) building (around
3%), the seismic masses were kept the same. While attention was given to meeting

118
general code requirements, the technical designs of the new buildings could be subject of
further improvement.
Finally, it is worth to mention that, for their analysis and design, all MRF models
included all the additional features that were assigned to the original benchmark frames,
namely, panel zones, clear span lengths, ASCE/FEMA nonlinear hinges, p-delta and
large displacements effects, etc. The designs are provided in the next 3 parts.
6.1 3-Story Building
Figure 6.1: Redesigned 3-story building north-south moment-resisting frame (modified
from (Ohtori et al. 2004))

119
6.2 9-Story Building
Figure 6.2: Redesigned 9-story building north-south moment-resisting frame (modified
from (Ohtori et al. 2004))

120
6.3 20-Story Building
Figure 6.3: Redesigned 20-story building north-south moment-resisting frame (modified
from (Ohtori et al. 2004))

121
6.4 Weights of the Original, Braced and Redesigned Buildings
In this section, the weights of the benchmark frames, the designed friction damped
braced frames and the redesigned moment-resisting frames are calculated. The weight
increase with respect to the benchmark frames of the FDBFs and the redesigned MRFs
are compared as a means to assess the economic advantages of FDBs versus traditional
MRFs.
It is worth recalling that both the FDBFs and the MRFs were designed to comply
with the Basic Safety Objective drift requirements. Fulfillment of these requirements
will imply fulfillment of the AISC strength requirements in the case of the MRFs,
provided sufficient bracing of the column flanges is provided to preclude lateral
torsional buckling. However, in the case of the FDBFs, the incorporation of the diagonal
braces can cause overstressing of some of the structural members, especially the beams
in the unbraced bays and some of the columns. Of course, a complete design of the
FDBFs should account for this and include sections that resist the increased forces. This
will obviously increase the weight of the FDBFs which, in turn, implies that the
calculated weight savings of FDBFs versus MRFs are actually not as large as when the
reductions in interstory drifts are considered as the only criterion for design.

122
Table 6.1: Structural weight of the 3-story benchmark building moment-resisting frame
ORIGINAL 3-STORY FRAME
BEAMS
RIGID FRAMING
Unit weight Length Number Weight
3rd level 68 30 3 6,120
2nd level 116 30 3 10,440
1st level 118 30 3 10,620
SIMPLE FRAMING
Unit weight Length Number Weight
1st-3rd level 44 30 3 3,960
COLUMNS
RIGID FRAMING
Unit weight Length Number Weight
1st-3rd story 257 39 2 20,046
Unit weight Length Number Weight
1st-3rd story 311 39 2 24,258
SIMPLE FRAMING
Unit weight Length Number Weight
1st-3rd story 68 13 3 2,652
TOTAL WEIGHT = 78,096 lb

123
Table 6.2: Structural weight of the 9-story benchmark building moment-resisting frame
ORIGINAL 9-STORY FRAME
BEAMS
Unit weight Length Number Weight
9th level 68 30 5 10,200
8th level 84 30 5 12,600
7th level 99 30 5 14,850
3rd-6th level 135 30 20 81,000
Ground-2nd 160 30 15 72,000
COLUMNS
Unit weight Length Number Weight
8th-9th story 257 20 6 30,840
6th-8th story 283 26 6 44,148
4th-6th story 370 26 6 57,720
2nd-4th story 455 26 6 70,980
B1-2nd story 500 36 6 108,000
TOTAL WEIGHT = 502,338 lb

124
Table 6.3: Structural weight of the 20-story benchmark building moment-resisting frame
ORIGINAL 20-STORY FRAME
BEAMS
Unit weight Length Number Weight
20th level 50 20 5 5,000
19th level 62 20 5 6,200
17th-18th level 84 20 10 16,800
11th-16th level 99 20 30 59,400
5th-10th level 108 20 30 64,800
B2-4th level 99 20 30 59,400
COLUMNS
EXTERIOR
Unit weight Length Number Weight
19th-20th story 99 20 2 3,960
14th-19th story 146 65 2 18,980
5th-14th story 191 117 2 44,694
2nd-5th story 234 39 2 18,252
B2-2nd story 354 48 2 33,984
INTERIOR
Unit weight Length Number Weight
19th-20th story 84 20 4 6,720
17th-19th story 117 26 4 12,168
14th-17th story 131 39 4 20,436
11th-14th story 192 39 4 29,952
5th-11th story 229 78 4 71,448
B2-5th story 335 87 4 116,580
TOTAL WEIGHT = 529,374 lb

125
Table 6.4: Structural weight of the FDBs in the 3-, 9- and 20- FDBFs
WEIGHT OF BRACES
3-STORY FRAME
Unit weight Length Number Weight
1st-3rd story 103 33 7 23,634
TOTAL WEIGHT = 23,634 lb
9-STORY FRAME
Unit weight Length Number Weight
1st story 96 35 4 13,497
2nd-9th story 96 33 28 88,294
TOTAL WEIGHT = 101,791 lb
20-STORY FRAME
Unit weight Length Number Weight
1st story 54 27 4 5,759
2nd-20th story 54 24 52 66,368
TOTAL WEIGHT = 72,127 lb
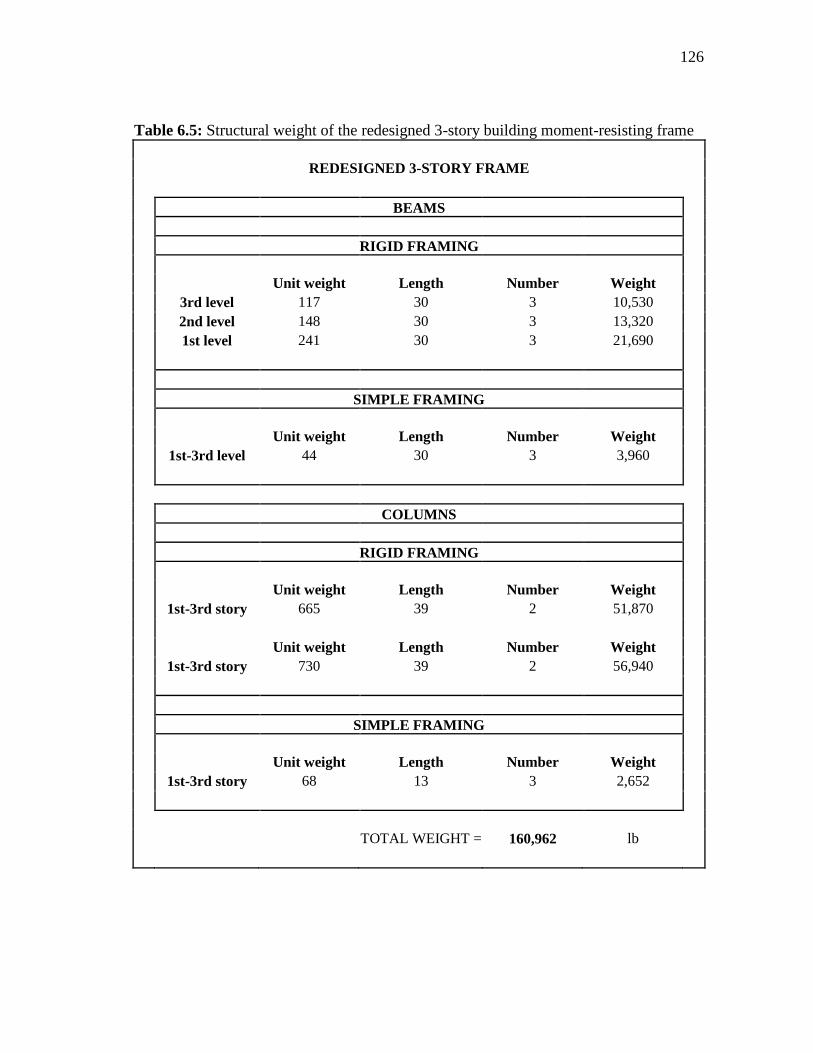
126
Table 6.5: Structural weight of the redesigned 3-story building moment-resisting frame
REDESIGNED 3-STORY FRAME
BEAMS
RIGID FRAMING
Unit weight Length Number Weight
3rd level 117 30 3 10,530
2nd level 148 30 3 13,320
1st level 241 30 3 21,690
SIMPLE FRAMING
Unit weight Length Number Weight
1st-3rd level 44 30 3 3,960
COLUMNS
RIGID FRAMING
Unit weight Length Number Weight
1st-3rd story 665 39 2 51,870
Unit weight Length Number Weight
1st-3rd story 730 39 2 56,940
SIMPLE FRAMING
Unit weight Length Number Weight
1st-3rd story 68 13 3 2,652
TOTAL WEIGHT = 160,962 lb

127
Table 6.6: Structural weight of the redesigned 9-story building moment-resisting frame
REDESIGNED 9-STORY FRAME
BEAMS
Unit weight Length Number Weight
9th level 103 30 5 15,450
8th level 146 30 5 21,900
7th level 124 30 5 18,600
3rd-6th level 160 30 20 96,000
Ground-2nd 395 30 15 177,750
COLUMNS
Unit weight Length Number Weight
8th-9th story 262 20 6 31,440
6th-8th story 361 26 6 56,316
4th-6th story 395 26 6 61,620
2nd-4th story 652 26 6 101,712
B1-2nd story 800 36 6 172,800
TOTAL WEIGHT = 753,588 lb
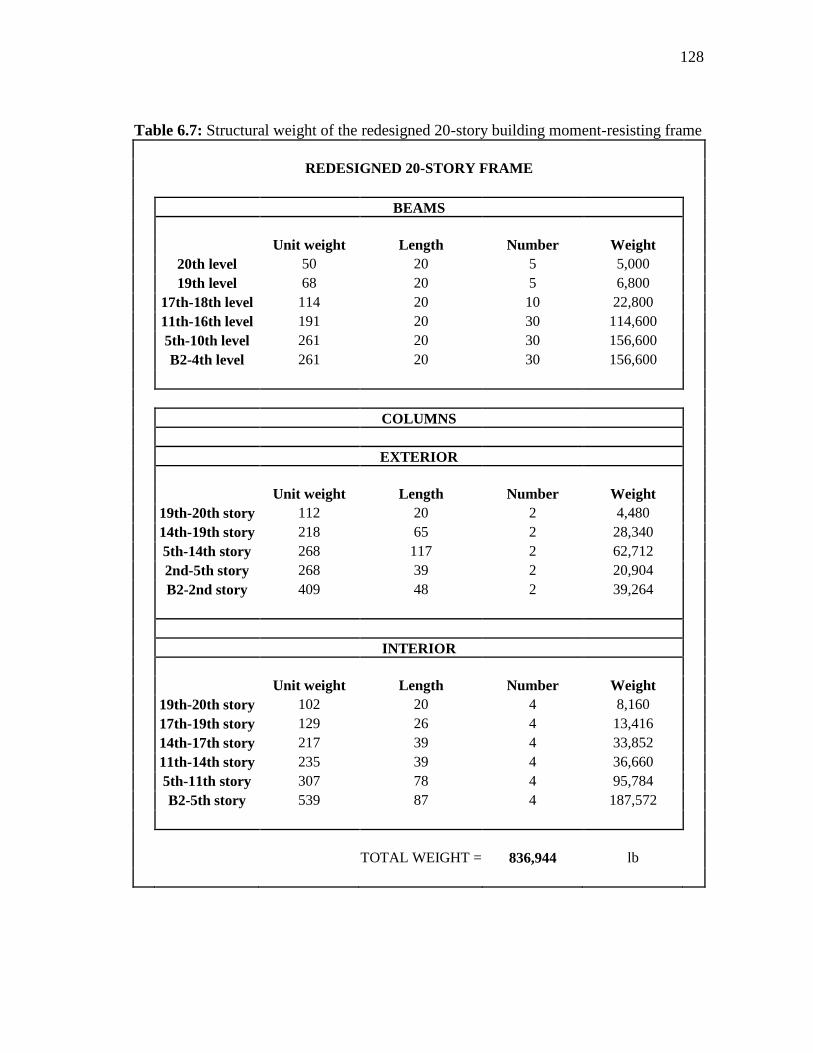
128
Table 6.7: Structural weight of the redesigned 20-story building moment-resisting frame
REDESIGNED 20-STORY FRAME
BEAMS
Unit weight Length Number Weight
20th level 50 20 5 5,000
19th level 68 20 5 6,800
17th-18th level 114 20 10 22,800
11th-16th level 191 20 30 114,600
5th-10th level 261 20 30 156,600
B2-4th level 261 20 30 156,600
COLUMNS
EXTERIOR
Unit weight Length Number Weight
19th-20th story 112 20 2 4,480
14th-19th story 218 65 2 28,340
5th-14th story 268 117 2 62,712
2nd-5th story 268 39 2 20,904
B2-2nd story 409 48 2 39,264
INTERIOR
Unit weight Length Number Weight
19th-20th story 102 20 4 8,160
17th-19th story 129 26 4 13,416
14th-17th story 217 39 4 33,852
11th-14th story 235 39 4 36,660
5th-11th story 307 78 4 95,784
B2-5th story 539 87 4 187,572
TOTAL WEIGHT = 836,944 lb
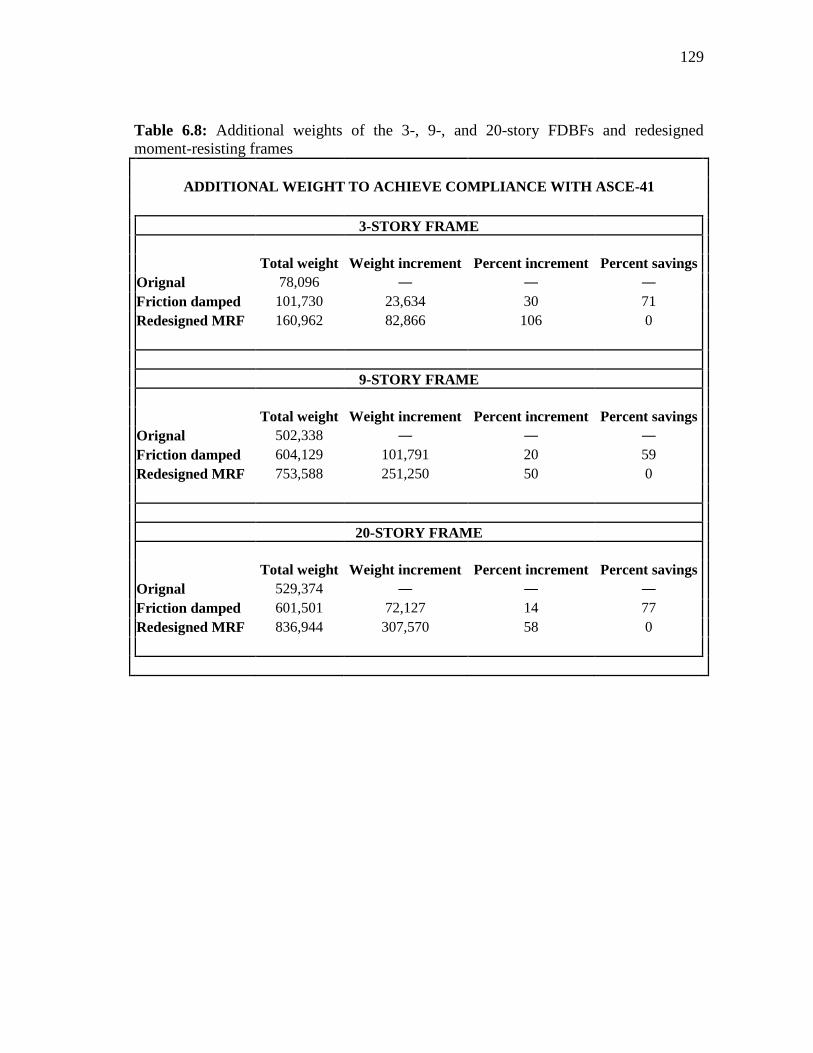
129
Table 6.8: Additional weights of the 3-, 9-, and 20-story FDBFs and redesigned
moment-resisting frames
ADDITIONAL WEIGHT TO ACHIEVE COMPLIANCE WITH ASCE-41
3-STORY FRAME
Total weight Weight increment Percent increment Percent savings
Orignal 78,096 ― ― ―
Friction damped 101,730 23,634 30 71
Redesigned MRF 160,962 82,866 106 0
9-STORY FRAME
Total weight Weight increment Percent increment Percent savings
Orignal 502,338 ― ― ―
Friction damped 604,129 101,791 20 59
Redesigned MRF 753,588 251,250 50 0
20-STORY FRAME
Total weight Weight increment Percent increment Percent savings
Orignal 529,374 ― ― ―
Friction damped 601,501 72,127 14 77
Redesigned MRF 836,944 307,570 58 0

130
7. DISCUSSION
The graphs concerning the optimization of the slip force and stiffness of the FDBs
confirmed that the slip load is the parameter that has the largest influence on the
response of FDBFs. For small friction forces, differences in the stiffness of the braces
have negligible effects. It is only when the force of the friction device takes larger values
that the stiffness of the braces gains relevance; however, the consideration of this fact
should be used with discretion as is explained in the next paragraph.
If the slip load of a particular FDB is too high, the friction device might not slide
and the FDB would act as a simple brace. If this happens, it is logical that the stiffness of
the brace becomes, artificially, the only one design variable. In order to achieve sliding
(and proper functioning) of a FDB having a large design force, it is necessary to use
braces with large stiffness values, i.e. if the evaluation of a FDBF suggests the use of
strong friction devices to cope with seismic forces, the design of the FDBs must include
an appropriately chosen stiffness. The plots for optimization of the slip load and stiffness
show which values of stiffness should be used with each friction force; these are those
that permit the drawing of smooth curves; any separation of the curves could be an
indication that energy dissipation has stopped occurring in the friction devices or, at
least, in some of them.
The optimum slip load of the FDBs is easier to spot when low brace stiffness
values are used, since the largest dissipation of energy will occur at lower friction forces.
A (partial/localized) brace-like behavior will also occur at lower slip loads as well as a
potential full brace-only behavior, which is displayed as a horizontally asymptotic value.

131
By the use of larger stiffness values, these behaviors are delayed and a broader spectrum
of appropriate slip loads is obtained.
If large slip forces are used, the (ductility) demands in the primary structural
members could become significantly larger after the friction devices reach their slip
state. This is also why, often, larger slip forces do not guarantee lower peak interstory
drifts. Selection of large slip loads can also cause large demands in the primary structural
members when the FDBs are not placed uniformly throughout the height of the building.
The determination of the optimum friction force of the dampers becomes more
difficult as the strength of the earthquake that is used in the process is increased. In fact,
if a given earthquake record takes the response of a building close to its collapse, it
becomes more challenging to find optimal values. These could also not be as reliable as
those obtained using a relatively less severe earthquake. In general, the determination of
the optimum slip load becomes more difficult when energy dissipation simultaneously
takes place in the primary structural elements.
Filiatrault and Cherry (1987) suggested that the optimum value of the slip force
of the friction dampers could be a mere structural property independent of the ground
motions. After a couple of years of study they revealed that their assumption proved to
be wrong. In this thesis, many graphs clearly show that the ground motions play a role in
the selection of the optimum friction load. This is not clearly seen in previous research,
but is shown in this thesis because of advancements in computer technology, which
allowed undertaking a more extensive study that made this phenomenon more evident.
Also, the use, in this work, of the benchmark buildings allowed carrying out the present

132
parametric study on real full scale analytical building models. It is probable that the
small scale of the experimental and analytical models used in past research, together
with the utilization of a smaller range of friction forces and stiffness values hid this issue
to the authors of the studies.

133
8. CONCLUSIONS
A complete study on the behavior of friction damped braced frames has been developed
to using recent trends, codes and evaluation criteria. Hence, it can be used to revise,
standardize, update, enhance and supplement results of previously available research on
the subject.
The way the work is outlined, both in its literature review and in the technical
part, provides sufficient theoretical and analytical background, which can be used to
better understand the problem of the application of friction damped braced frames as
earthquake resisting system. Hence, this thesis should also be useful for achieving
improved designs and evaluations of new or already existing FDBFs.
Conclusions made by other researchers regarding the effectiveness of FDBFs
were confirmed. Results of the analyses that were carried out showed average reductions
in the peak interstory drift ratios of almost 70% in the case of the 3-story building, 62%
in the 9-story building and 35% in the case of the 20-story building after the FDBs were
incorporated. Moreover, in many cases, not only the interstory drifts were significantly
reduced and brought to acceptable levels, but also collapse of the structures was avoided.
It is remarkable that success was attained in all cases.
On the other hand, the clearly underdesigned benchmark frames were redesigned
to meet the ASCE-41 BSO requirements. Comparison between the additional weights of
the new designs and those added by the inclusion of the FDBs into the original
benchmarks showed that savings of more than 75% can be made if the option of
installing FDBs is chosen instead of using bare MRFs for earthquake resistance. The

134
aforementioned percentage considers the case of projected new structures; however, if
the necessity is that of retrofitting already existing MRFs, rebuilding of new and stronger
MRFs represents absolutely no competition to retrofitting using FDBs.
Despite the extensiveness of this work, a couple of issues were not addressed and
should be the subject of future research. There are still some factors that should be
considered in the determination of a true optimal load; for instance, in the elaboration
process of the present study, it became also evident that the optimal friction force is a
function of the number and location of the FDBs throughout the height of the building.
On the other hand, determination of the optimum friction force of the devices
should also take into account minimizing or avoiding residual/permanent interstory
drifts. Consideration of these 2 issues would be the next logical step to be taken to
broaden our knowledge on the use of friction for passive energy dissipation purposes in
civil structures. It is worth mentioning that none of them has been addressed yet
adequately.
Finally, taking into account variations of friction dampers and/or FDBs other
than the type considered in this thesis would permit a more specialized assessment of the
advantages of using a particular friction device over another.

135
REFERENCES
Aiken, I., Kelly, J., and Pall, A. (1988). "Seismic response of a nine-story steel frame
with friction damped cross-bracing." Rep. No. UCB/EERC-88/17, University of
California, Berkeley, CA.
Aiken, I. D., and Kelly, J. M. (1990). "Earthquake simulator testing and analytical
studies of two energy-absorbing systems for multistory structures." Rep. No.
UCB/EERC-90/03, University of California, Berkeley, CA.
ASCE. (2003). "Seismic evaluation of existing buildings [ASCE-31]." American Society
of Civil Engineers, Reston, VA.
ASCE. (2007). "Seismic rehabilitation of existing buildings [ASCE-41]." American
Society of Civil Engineers, Reston, VA.
Booth, E., and Key, D. (2006). Earthquake design practice for buildings, Thomas
Telford, London, England.
Chen, C. C., and Chen, G. D. (2002). "Nonlinear control of a 20-story steel building with
active piezoelectric friction dampers." Structural Engineering and Mechanics,
14(1), 21-38.
Chen, G., and Chen, C. (2004). "Semiactive control of the 20-story benchmark building
with piezoelectric friction dampers." Journal of Engineering Mechanics, 130(4),
393-400.
Chen, G. D., and Chen, C. C. (2003). "Semi-active control of a steel frame with
piezoelectric friction dampers." Proc., SPIE, S.-C. Liu, ed., SPIE, Bellingham,
WA, 207-217.
Chen, J. C., ed. (1996). Proc., 2nd Int. Workshop on Structural Control: Next
Generation of Intelligent Structures, International Association for Structural
Control (IASC) in conjunction with the Japan Panel on Structural Response
Control and the U.S. Panel on Structural Control Research, The Hong Kong
Univ. of Science and Technology, Hong Kong.
Chopra, A. (2001). Dynamics of structures - Theory and applications to earthquake
engineering, Prentice Hall, Upper Saddle River, NJ.
Coburn, A., and Spence, R. (2002). Earthquake protection, Wiley, Chichester, England.
Constantinou, M., Reinhorn, A., Mokha, A., and Watson, R. (1991a). "Displacement
control device for base isolated bridges." Earthquake Spectra, 7(2), 179-200.

136
Constantinou, M. C., Kartoum, A., Reinhorn, A. M., and Bradford, P. (1991b).
"Experimental and theoretical study of a sliding isolation system for bridges."
Rep. No. NCEER 91-0027, National Center for Earthquake Engineering
Research, Buffalo, N.Y.
CSI. (2007a). CSI analysis reference manual for SAP2000, ETABS and SAFE,
Computers and Structures Inc, Berkeley, CA.
CSI. (2007b). "SAP2000 Advanced." Computer and Structures Inc, Berkeley, CA.
FEMA. (2000). "Prestandard and Commentary for the Seismic Rehabilitation of
Buildings." Federal Emergency Management Agency, Washington, DC.
Filiatrault, A., and Cherry, S. (1987). "Performance evaluation of friction damped braced
steel frames under simulated earthquake loads." Earthquake Spectra, 3(1), 57-78.
FitzGerald, T. F., Anagnos, T., Goodson, M., and Zsutty, T. (1989). "Slotted bolted
connections in aseismic design for concentrically braced connections."
Earthquake Spectra, 5(2), 383-391.
Fu, Y., and Cherry, S. (1999). "Simplified seismic code design procedure for friction-
damped steel frames." Canadian Journal of Civil Engineering, 26(1), 55-71.
Ghobarah, A. (2001). "Performance-based design in earthquake engineering: state of
development." Engineering Structures, 23(8), 878-884.
Grigorian, C. E., and Popov, E. P. (1993). "Slotted bolted connections for energy
dissipation." Proc., ATC-17-1 Seminar on Seismic Isolation, Passive Energy
Dissipation and Active Control, ATC, San Francisco, CA, 545-556.
Guglielmino, E., and Edge, K. A. (2003). "The problem of controlling a friction damper:
a robust approach." Proc., American Control Conference, AACC, Dayton, OH,
2827-2832.
Gupta, A., and Krawinkler, H. (1999). "Seismic demands for performance evaluation of
steel moment resisting frame structures (SAC Task 5.4.3)." Rep. No. 132, The
John A. Blume Earthquake Engineering Center, Stanford, CA.
Keightley, W. (1977). "Building damping by Coulomb friction." Proc., 6th WCEE, New
Delhi, India, 3043-3048.
Keightley, W. (1979). Prestressed walls for damping earthquake motions in buildings,
Montana State University, Dept. of Civil Engineering and Mechanics.
137
Kiggins, S., and Uang, C. M. (2006). "Reducing residual drift of buckling-restrained
braced frames as a dual system." Engineering Structures, 28(11), 1525-1532.
Krinitzsky, E., Gould, J., and Edinger, P. (1993). Fundamentals of earthquake-resistant
construction, John Wiley and Sons, New York.
Lane, J. S., Ferri, A. A., and Heck, B. S. (1992). "Vibration control using semi-active
friction damping." American Society of Mechanical Engineers, Design
Engineering Division, 49, 165-171.
Mead, D. (1998). Passive vibration control, John Wiley & Sons, Chichester, England.
Moehle, J. P. (1996). "Displacement-based seismic design criteria." Proc., 11th World
Conference on Earthquake Engineering, Pergamon, Acapulco, Mexico.
Moreschi, L. M., and Singh, M. P. (2003). "Design of yielding metallic and friction
dampers for optimal seismic performance." Earthquake Engineering and
Structural Dynamics, 32(8), 1291-1311.
Mualla, I., and Belev, B. (2002). "Performance of steel frames with a new friction
damper device under earthquake excitation." Engineering Structures, 24(3), 365-
371.
Ng, C. L., and Xu, Y. L. (2004). "Seismic response control of a complex structure using
semi-active friction dampers." Proc., SPIE, S.-C. Liu, ed., SPIE, Bellingham,
WA, 177-188.
Nishitani, A., Nitta, Y., Ishibashi, Y., and Itoh, A. (1999). "Semi-active structural control
with variable friction dampers." Proc., American Control Conference, AACC,
Dayton, OH, 1017-1021.
Ohtori, Y., Spencer Jr, B. F., and Dyke, S. J. (2004). "Benchmark control problems for
seismically excited nonlinear buildings." Journal of Engineering Mechanics,
130(4), 366-385.
Pall, A., and Marsh, C. (1982). "Seismic response of friction damped braced frames."
Journal of the Structural Division, 108(6), 1313-1323.
Pall, A., Marsh, C., and Fazio, P. (1980). "Friction joints for seismic control of large
panel structures." Journal of Prestressed Concrete Institute, 25(6), 38-61.
Pall, A., and Pall, R. T. (2004). "Performance-based design using Pall friction dampers -
An economical design solution." Proc., 13th World Conference on Earthquake
Engineering, Vancouver, B. C., Canada.
138
PDL. "Pall Dynamics Ltd."
Sabelli, R., Mahin, S., and Chang, C. (2003). "Seismic demands on steel braced frame
buildings with buckling-restrained braces." Engineering Structures, 25(5), 655-
666.
SAC_Steel_Project. (1994). Technical Office, Richmond, CA 94804-4698.
Somerville, P. G. (1997). "Development of ground motion time-histories for phase 2 of
the FEMA/SAC steel project." Rep. No. SAC/BD-97/04, SAC Joint Venture,
Sacramento, CA.
Soong, T. T., and Constantinou, M. C., eds. (1994). Passive and active structural
vibration control in civil engineering, CISM Courses and Lectures, Springer,
New York.
Soong, T. T., and Dargush, G. F. (1997). Passive energy dissipation systems in
structural engineering, Wiley, New York.
Spencer, B. F., Christenson, R. E., and Dyke, S. J. (1999). "Next generation benchmark
control problem for seismically excited buildings." Proc., 2nd World Conf. on
Structural Control, T. Kobori et al., eds., Vol. 2, Wiley, New York, 1135-1360.
Spencer, B. F., Dyke, S. J., and Deoskar, H. S. (1998a). "Benchmark problems in
structural control: part I - active mass driver system." Earthquake Engineering &
Structural Dynamics, 27(11), 1127-1139.
Spencer, B. F., Dyke, S. J., and Deoskar, H. S. (1998b). "Benchmark problems in
structural control: part II - active tendon system." Earthquake Engineering &
Structural Dynamics, 27(11), 1141-1147.
TheMathWorks. (2008). "SIMULINK." The MathWorks, Natick, MA.
Wen, Y. (1976). "Method for random vibration of hysteretic systems." Journal of the
Engineering Mechanics Division, 102(2), 249-263.
Zhu, S., and Zhang, Y. (2008). "Seismic analysis of concentrically braced frame systems
with self-centering friction damping braces." Journal of Structural Engineering,
134(1), 121-131.
139
VITA
Name: Luis Eduardo Peternell Altamira
Address: Zachry Department of Civil Engineering,
Texas A&M University,
3136 TAMU
College Station, Texas 77843-3136
E-mail: [email protected]
Education: B.S., Civil Engineering, Universidad de las Américas, Puebla, Mexico, 2005
M.S., Civil Engineering, Texas A&M University, 2009