seismic reservoir characterization of the morrow a sandstone thomas l. davis & robert d. benson...
TRANSCRIPT

Seismic Reservoir Characterization of the Morrow A Sandstone
Thomas L. Davis & Robert D. Benson CSM Scott Wehner, Chaparral Energy, and Michael D. Raines and Roger Freidline, Whiting Oil and Gas Corp
Postle Field, Texas County, Oklahoma
Postle FieldSite of the 24-5 Well
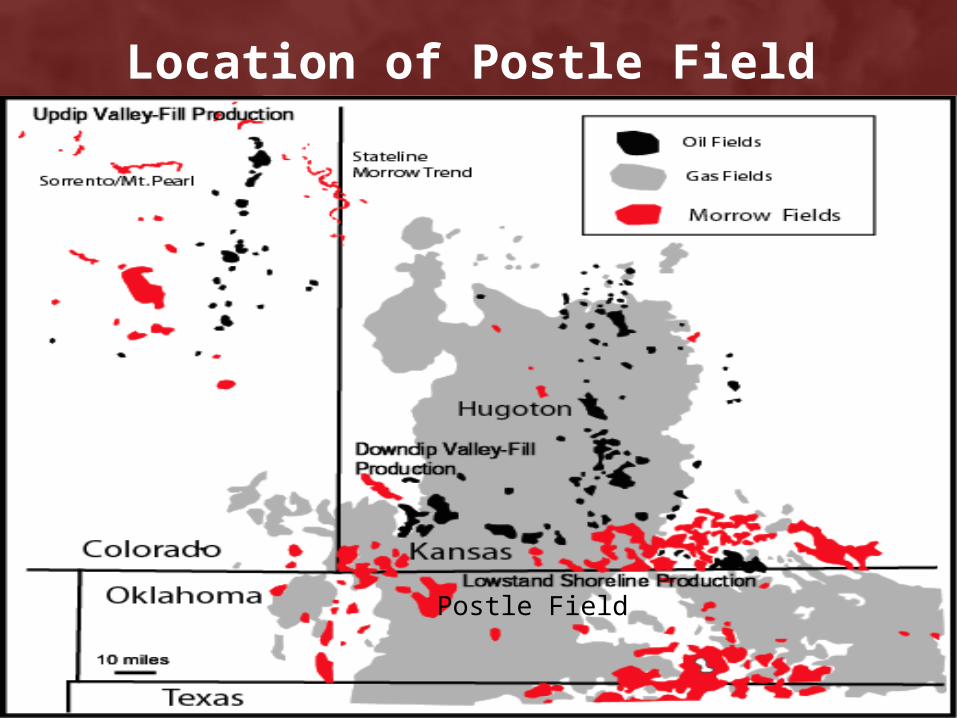
Location of Postle Field
Modified from Johnson Modified from Johnson (1989)(1989)
Postle Field
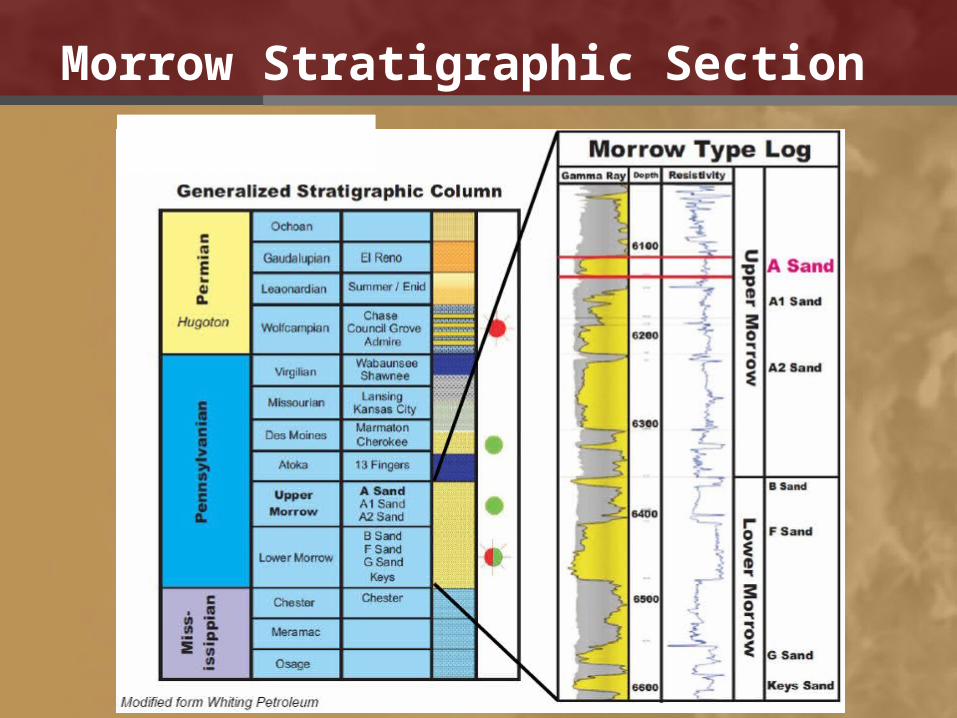
Morrow Stratigraphic Section
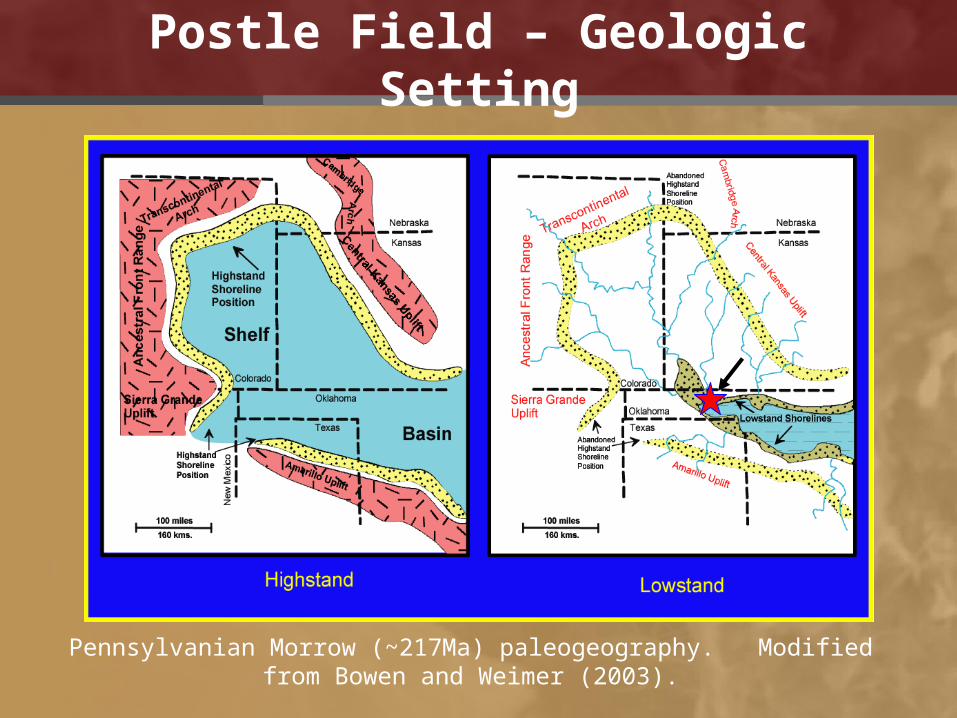
Postle Field – Geologic Setting
Pennsylvanian Morrow (~217Ma) paleogeography. Modified from Bowen and Weimer (2003).
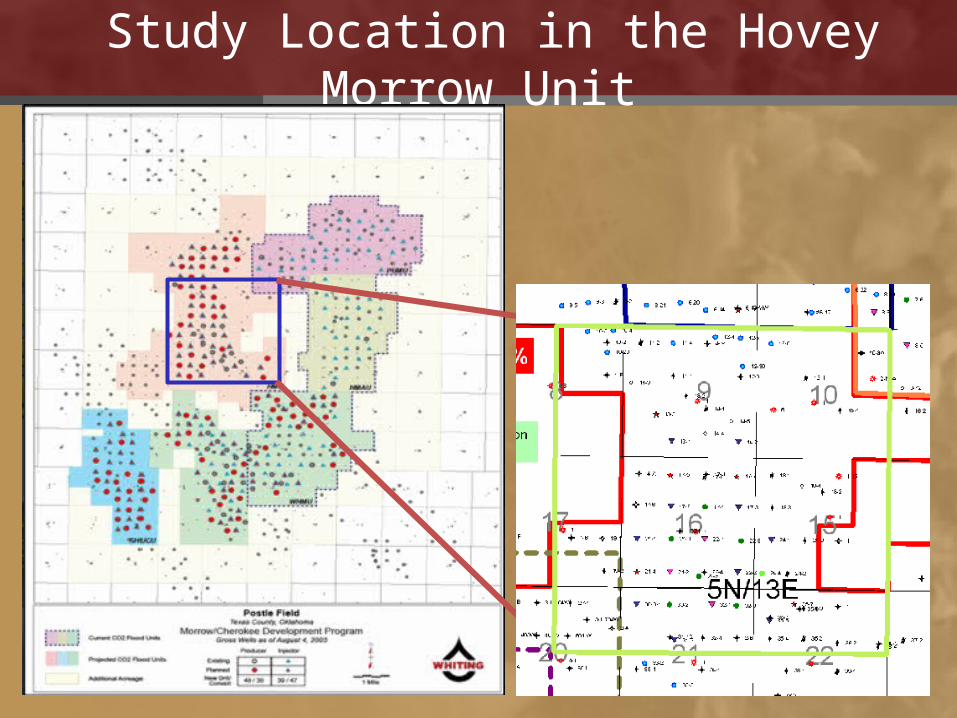
Study Location in the Hovey Morrow Unit
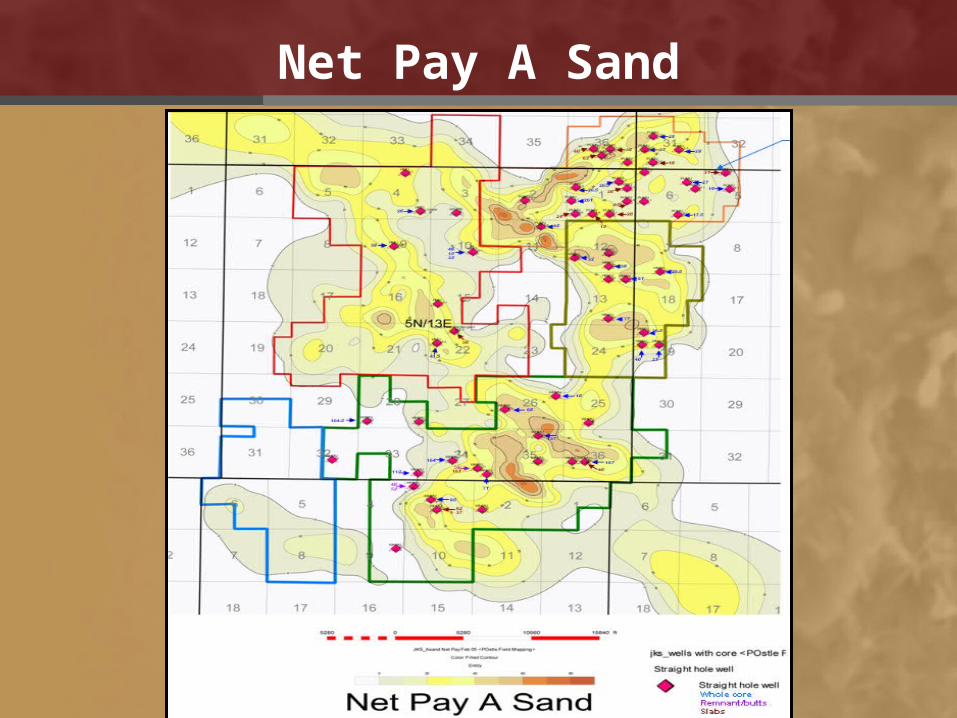
Net Pay A Sand
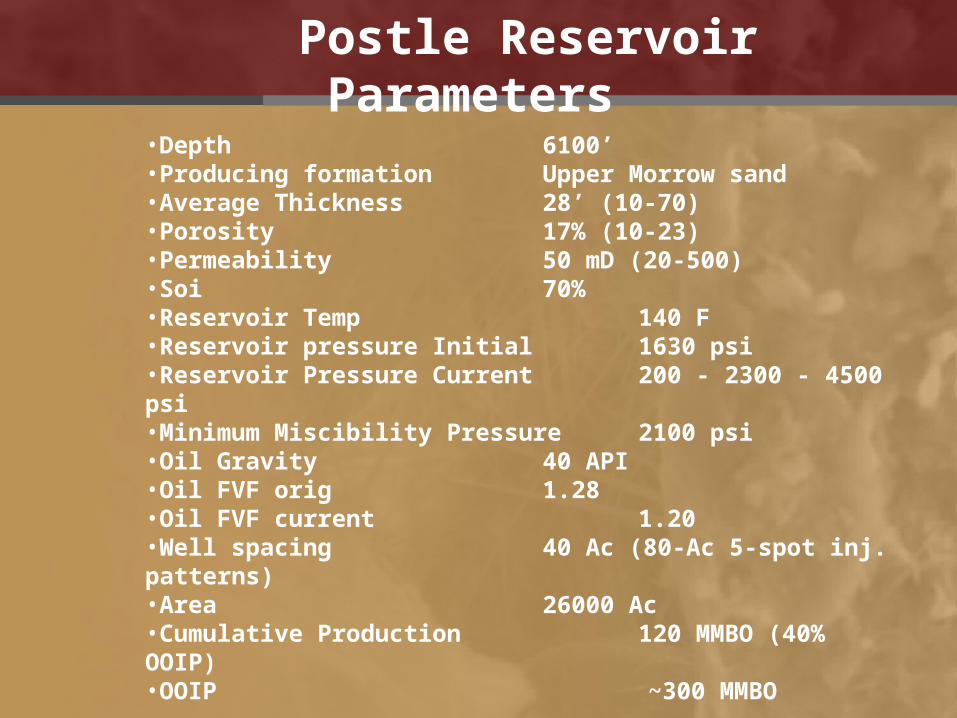
Postle Reservoir Parameters
•Depth 6100’•Producing formation Upper Morrow sand•Average Thickness 28’ (10-70)•Porosity 17% (10-23)•Permeability 50 mD (20-500)•Soi 70%•Reservoir Temp 140 F•Reservoir pressure Initial 1630 psi•Reservoir Pressure Current 200 - 2300 - 4500 psi•Minimum Miscibility Pressure 2100 psi•Oil Gravity 40 API•Oil FVF orig 1.28•Oil FVF current 1.20•Well spacing 40 Ac (80-Ac 5-spot inj. patterns)•Area 26000 Ac•Cumulative Production 120 MMBO (40% OOIP)•OOIP ~300 MMBO
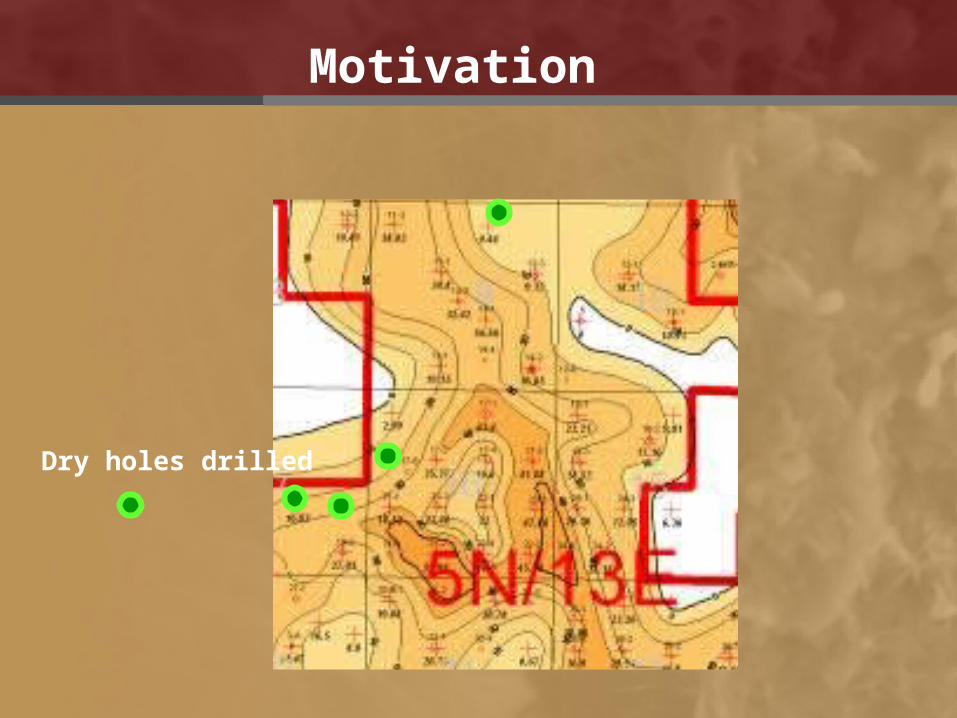
Motivation
Dry holes drilled
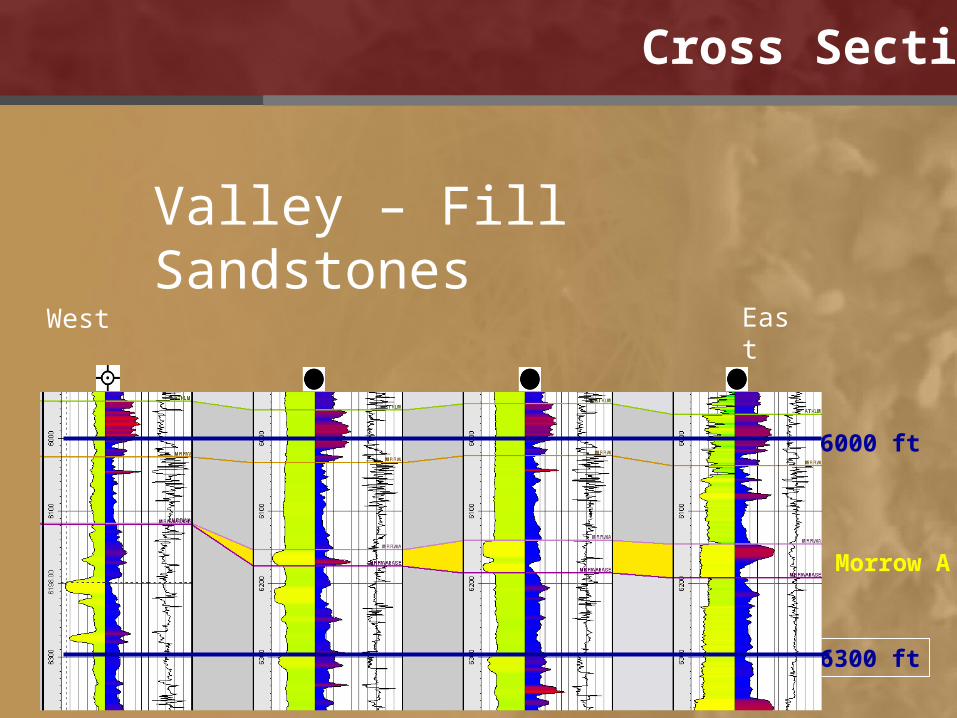
Cross Section
6300 ft
6000 ft
Morrow A
West East
Valley – Fill Sandstones

Binocular Microscope Image
The Morrow Sandstone
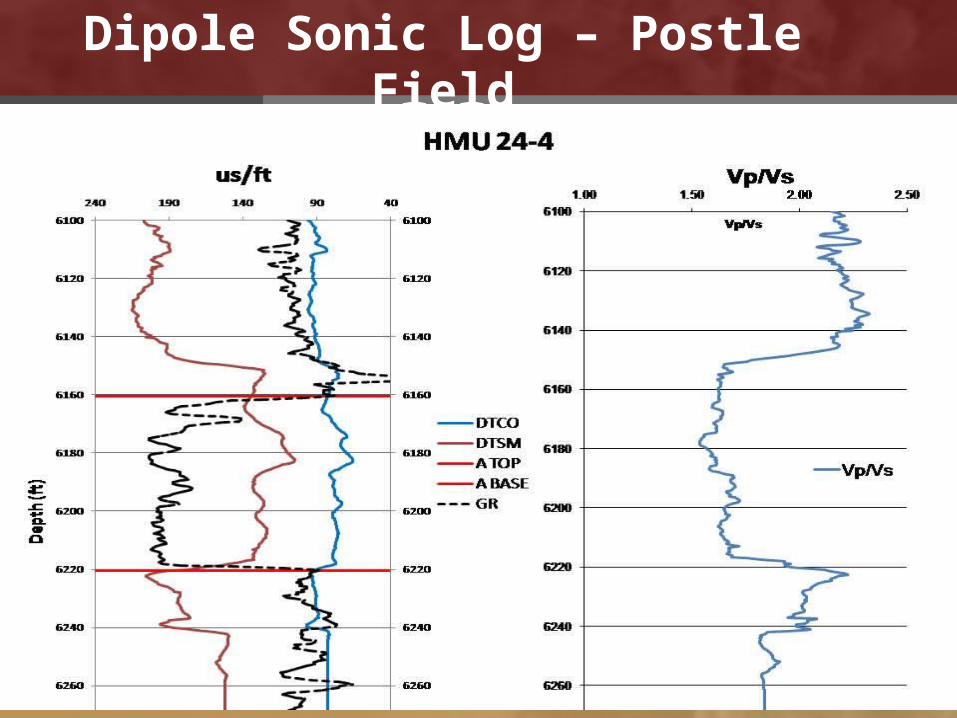
Dipole Sonic Log – Postle Field
Where is the Sand?
Acoustic impedance contrast between Morrow sandstone and shale is small (<10%).
The Morrow A is a thin sandstone reservoir below seismic resolution.
Average ~45 ft.
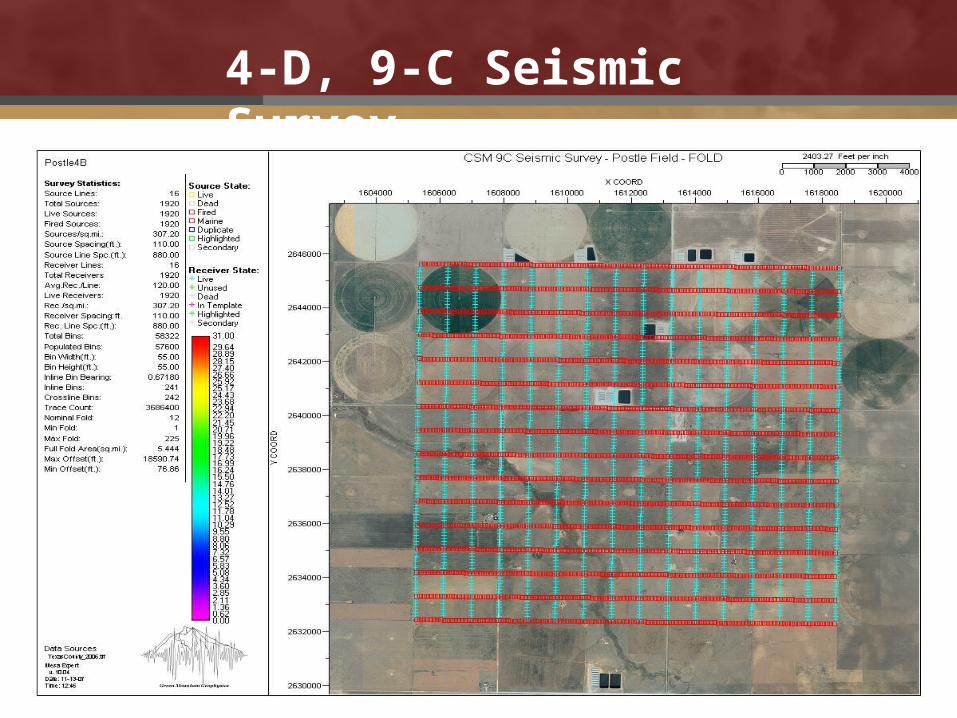
4-D, 9-C Seismic Survey
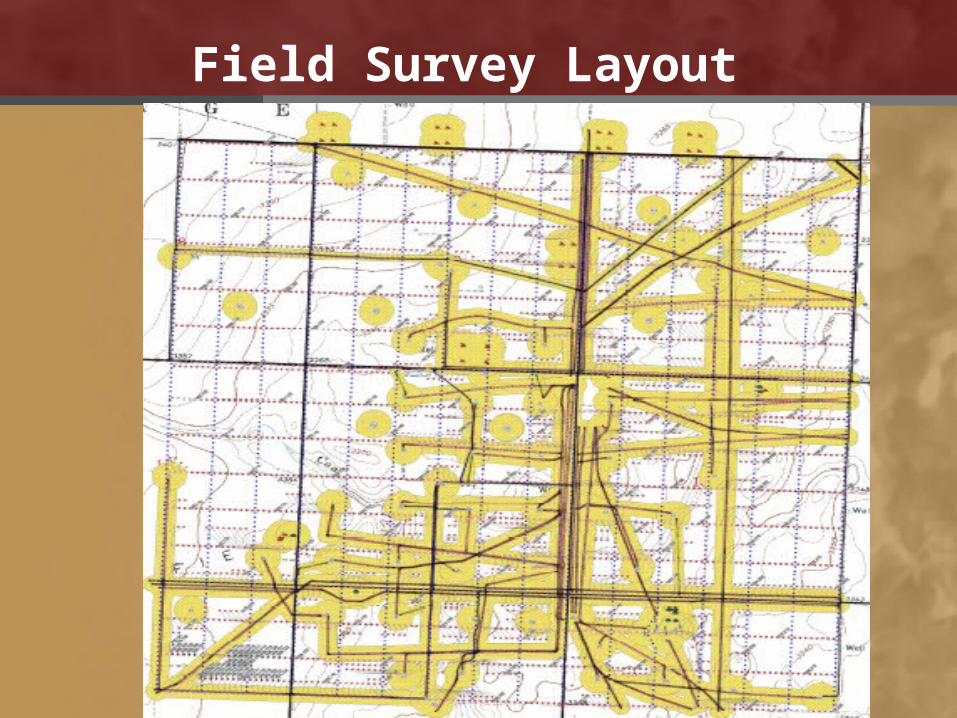
Field Survey Layout
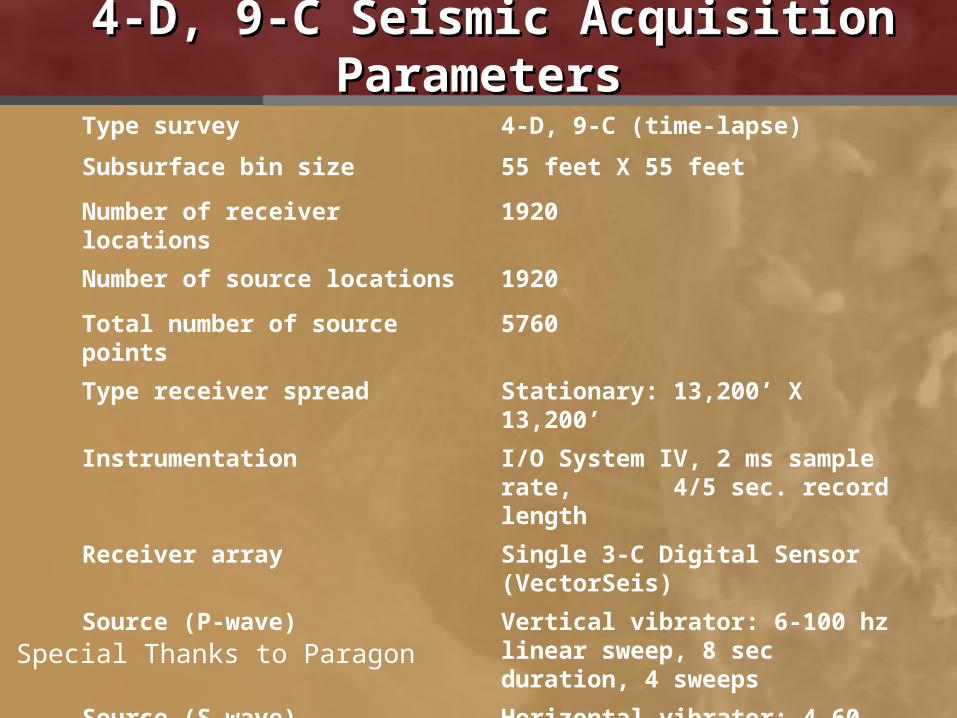
4-D, 9-C Seismic Acquisition Parameters4-D, 9-C Seismic Acquisition Parameters
Type survey 4-D, 9-C (time-lapse)
Subsurface bin size 55 feet X 55 feet
Number of receiver locations 1920
Number of source locations 1920
Total number of source points 5760
Type receiver spread Stationary: 13,200’ X 13,200’
Instrumentation I/O System IV, 2 ms sample rate, 4/5 sec. record length
Receiver array Single 3-C Digital Sensor(VectorSeis)
Source (P-wave) Vertical vibrator: 6-100 hz linear sweep, 8 sec duration, 4 sweeps
Source (S-wave) Horizontal vibrator: 4-60 hz linear sweep, 8 sec duration, 4 sweeps, one source oriented N-S, one source oriented E-W
Special Thanks to Paragon
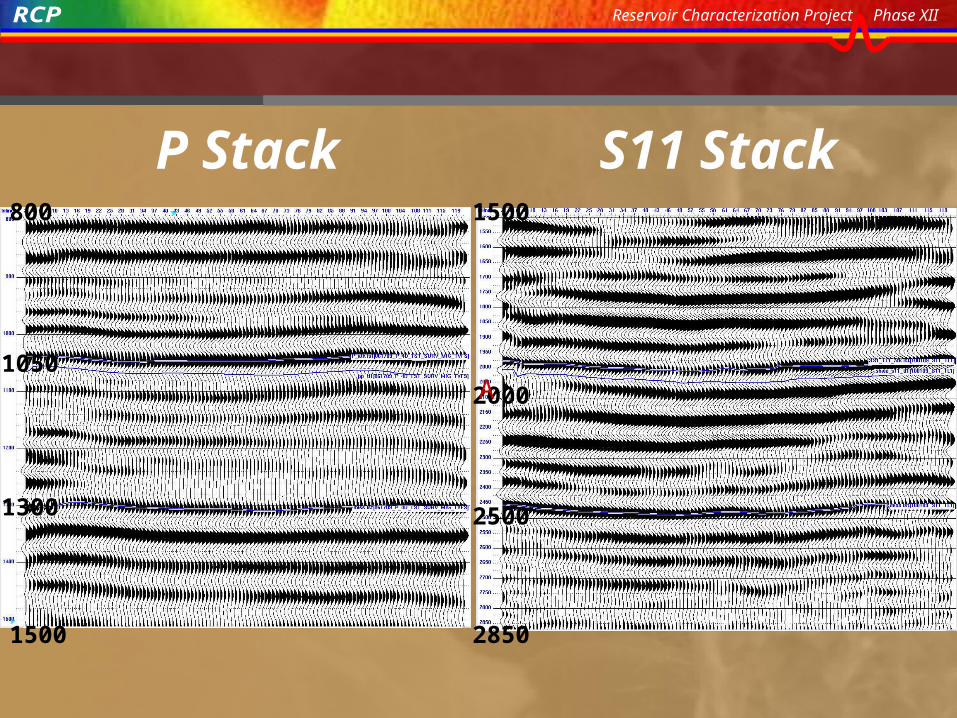
Reservoir Characterization Project Phase XII
P Stack S11 Stack800
1500
1500
2850
1300
1050
2500
2000A
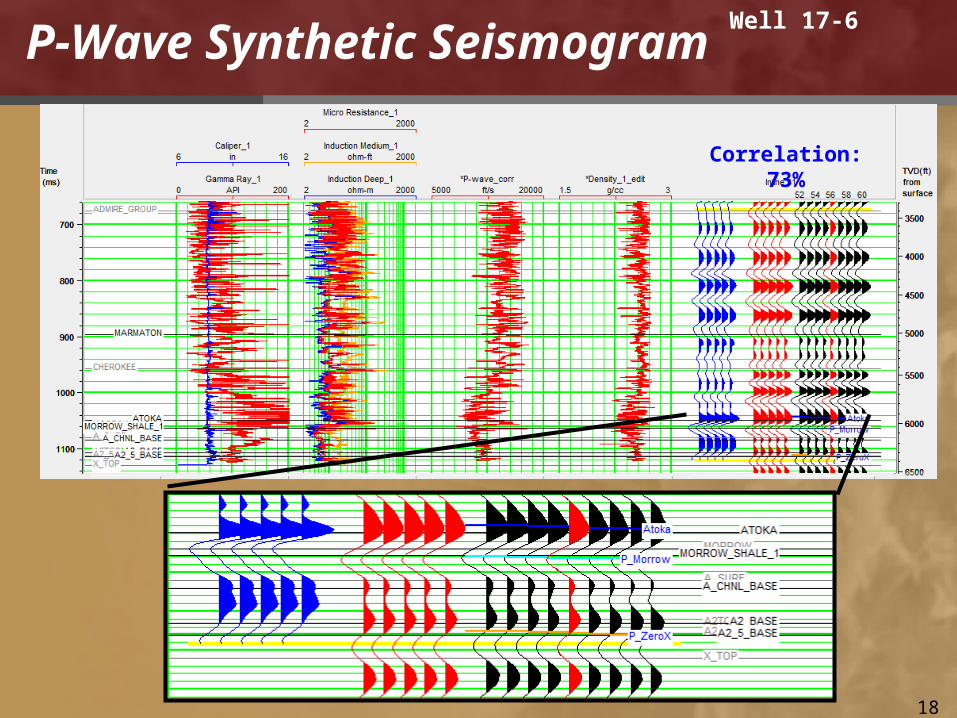
P-Wave Synthetic Seismogram Well 17-6
Correlation: 73%
18
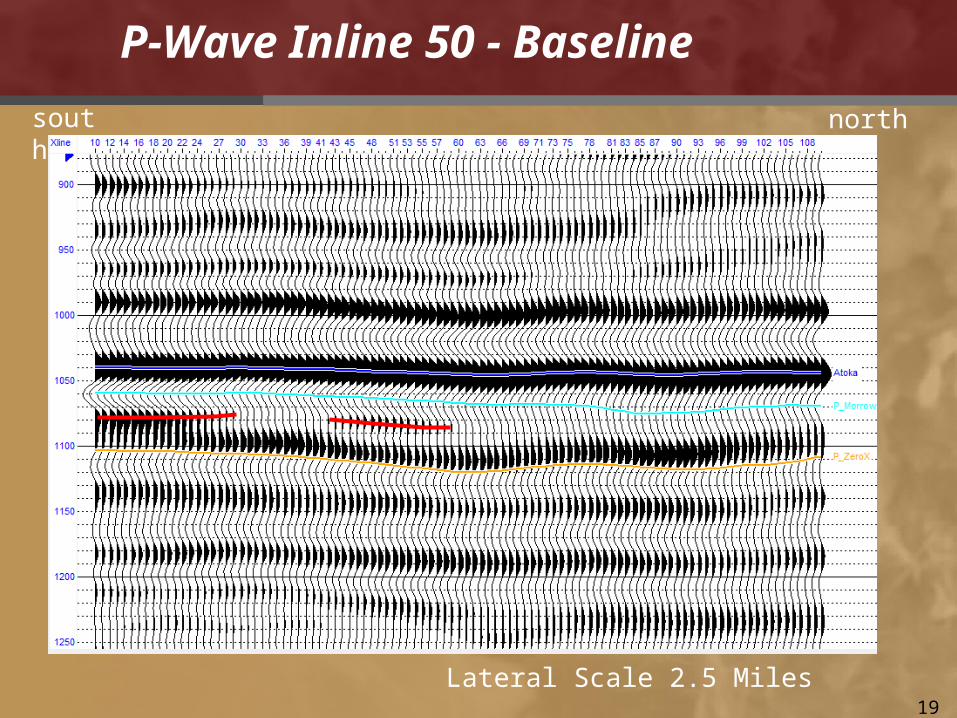
P-Wave Inline 50 - Baseline
19
south north
Lateral Scale 2.5 Miles
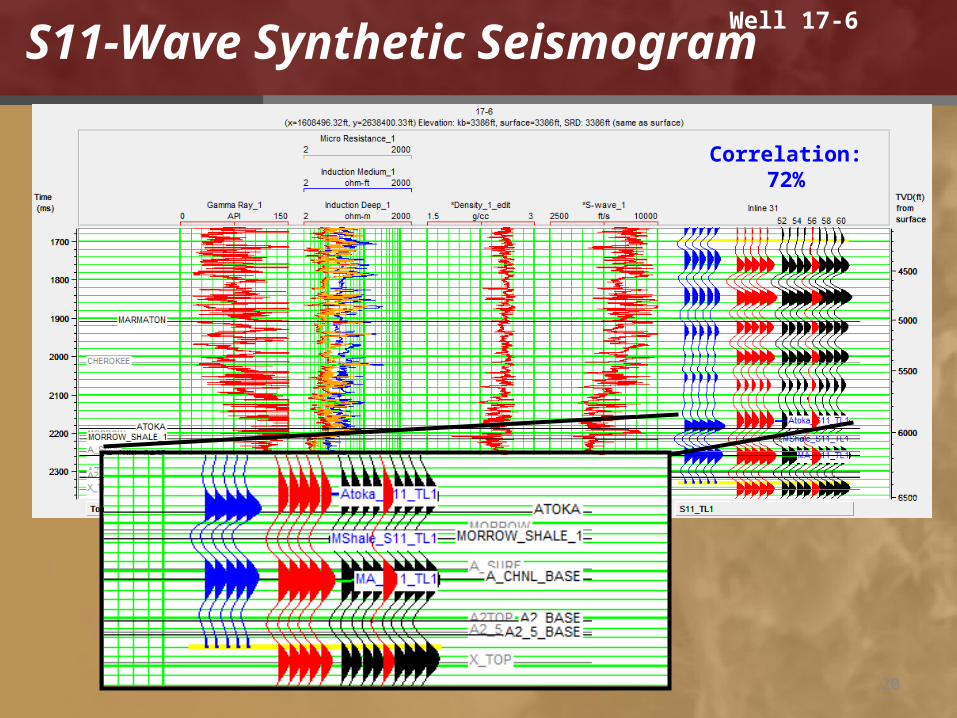
S11-Wave Synthetic Seismogram
20
Well 17-6
Correlation: 72%
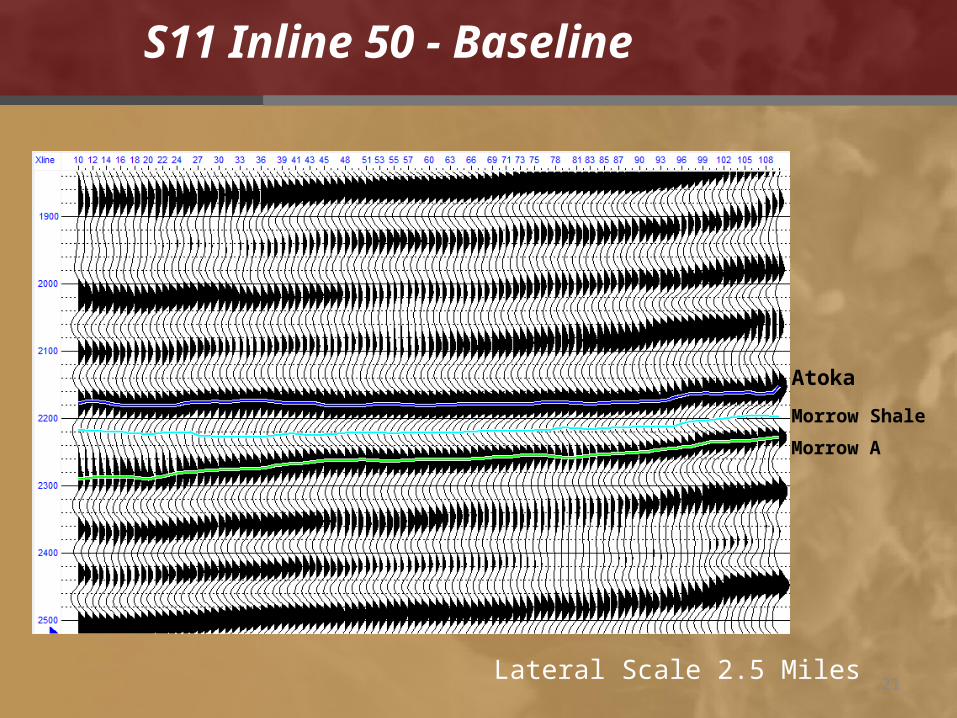
S11 Inline 50 - Baseline
21
Atoka
Morrow Shale
Morrow A
Lateral Scale 2.5 Miles
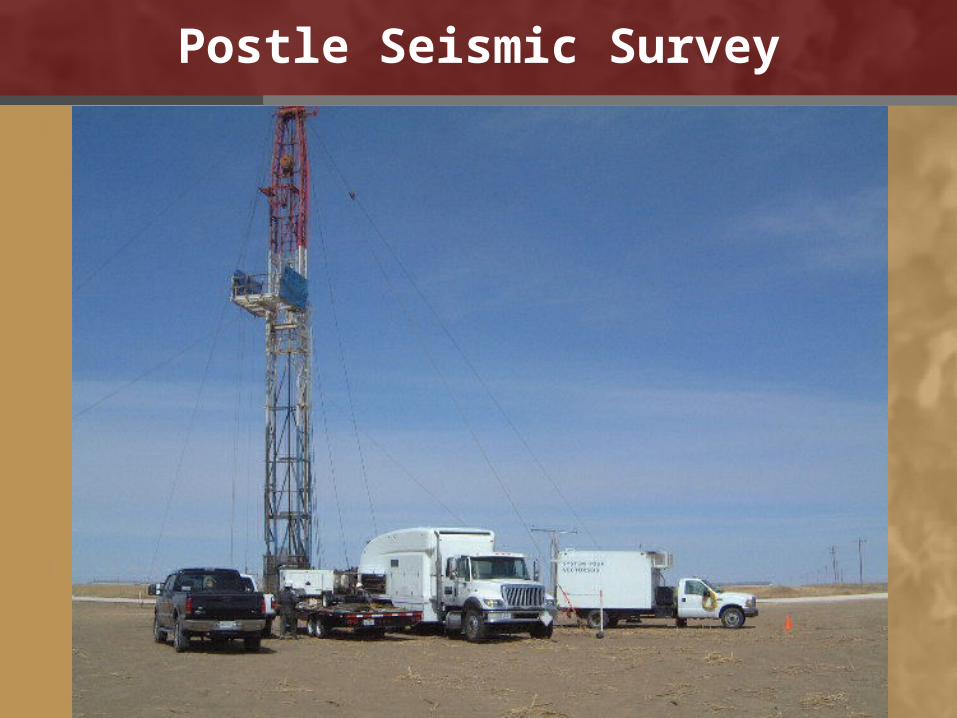
Postle Seismic Survey
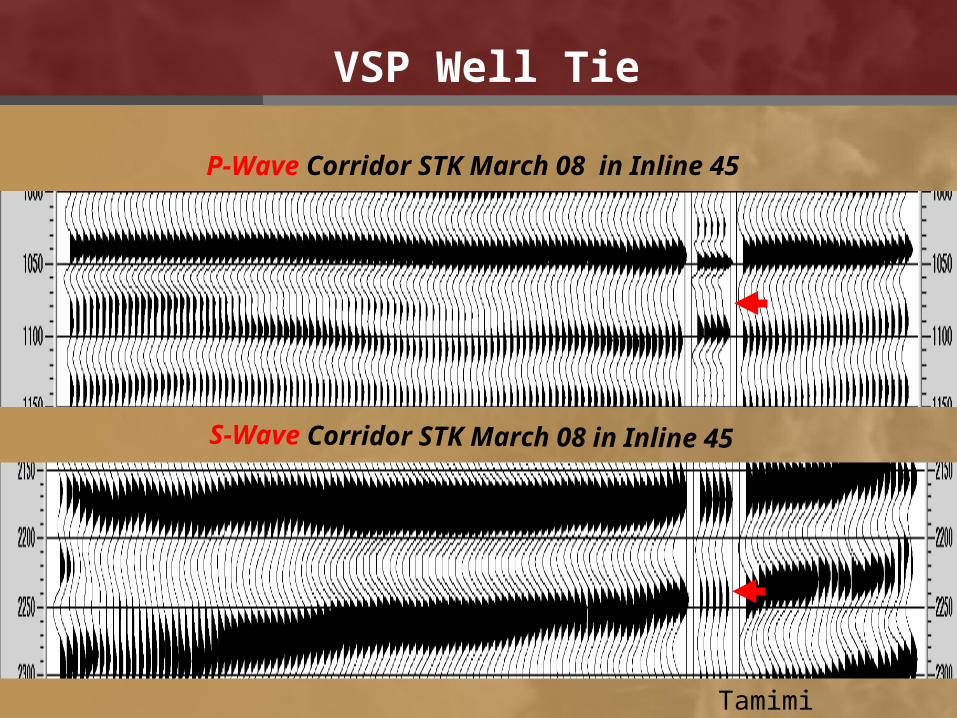
VSP Well Tie
P-Wave Corridor STK March 08 in Inline 45
S-Wave Corridor STK March 08 in Inline 45
Tamimi 2009
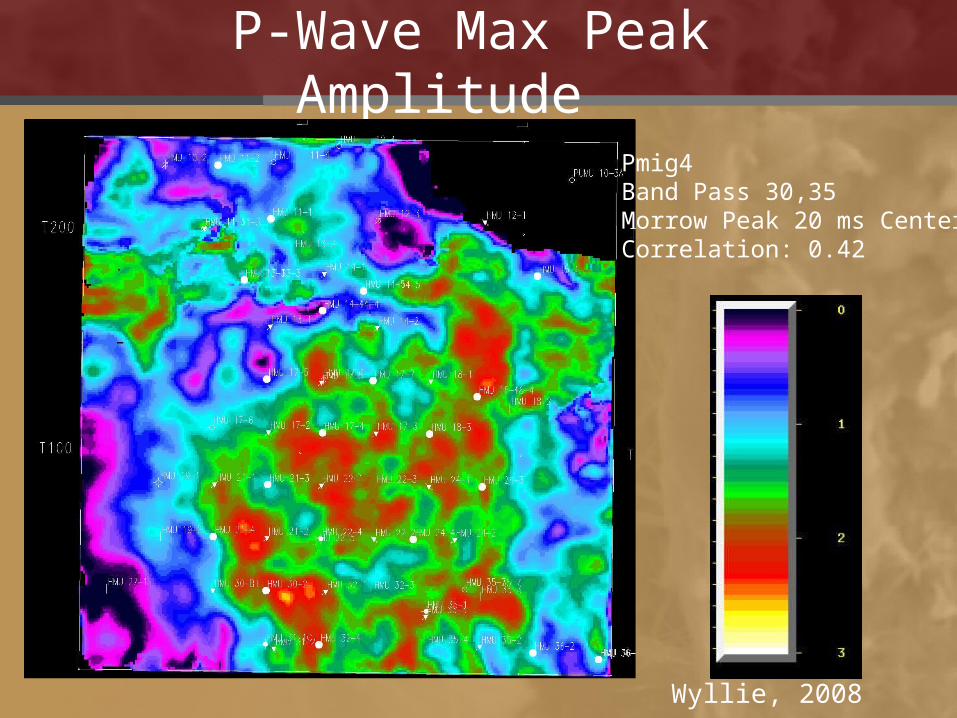
P-Wave Max Peak Amplitude
Pmig4Band Pass 30,35Morrow Peak 20 ms CenterCorrelation: 0.42
Wyllie, 2008
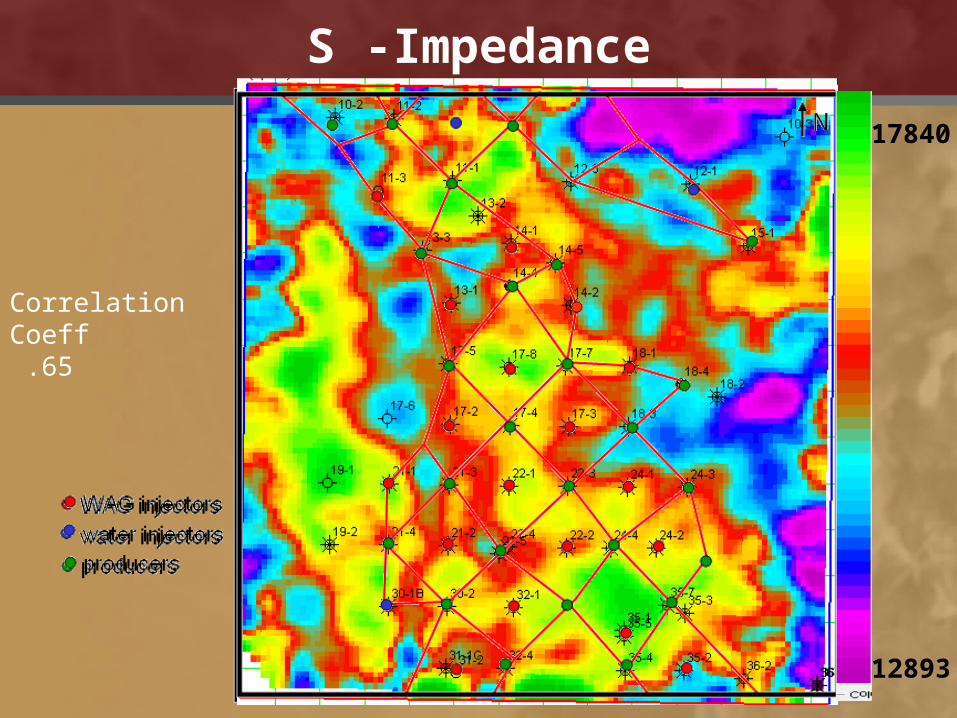
S -Impedance
17840
12893
Correlation Coeff .65
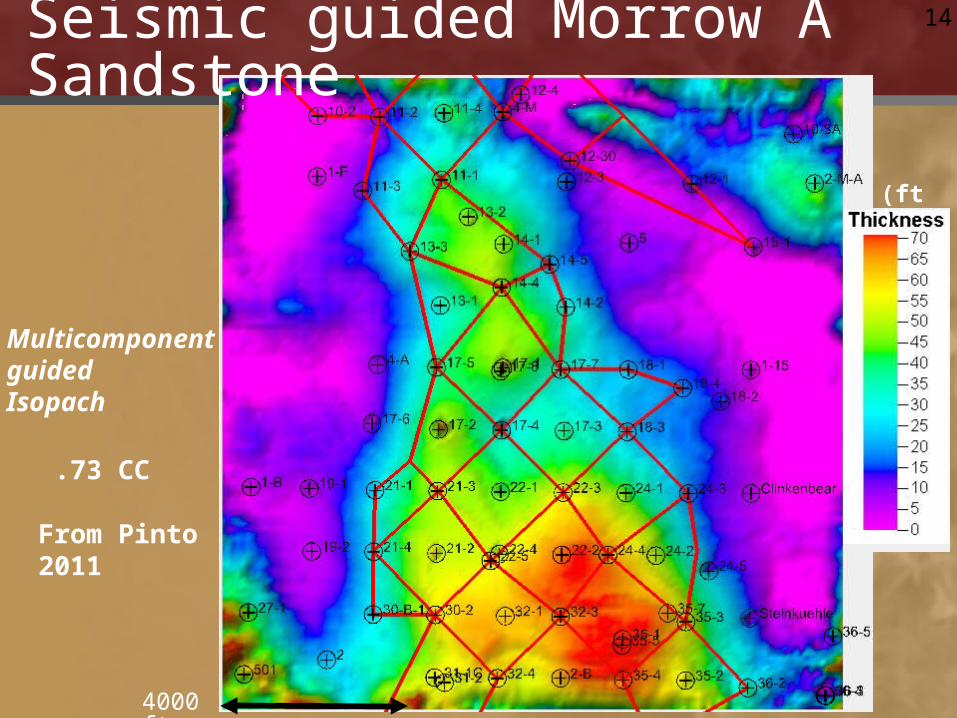
Seismic guided Morrow A Sandstone
4000 ft
(ft)
Multicomponent guided Isopach
14
.73 CC
From Pinto2011
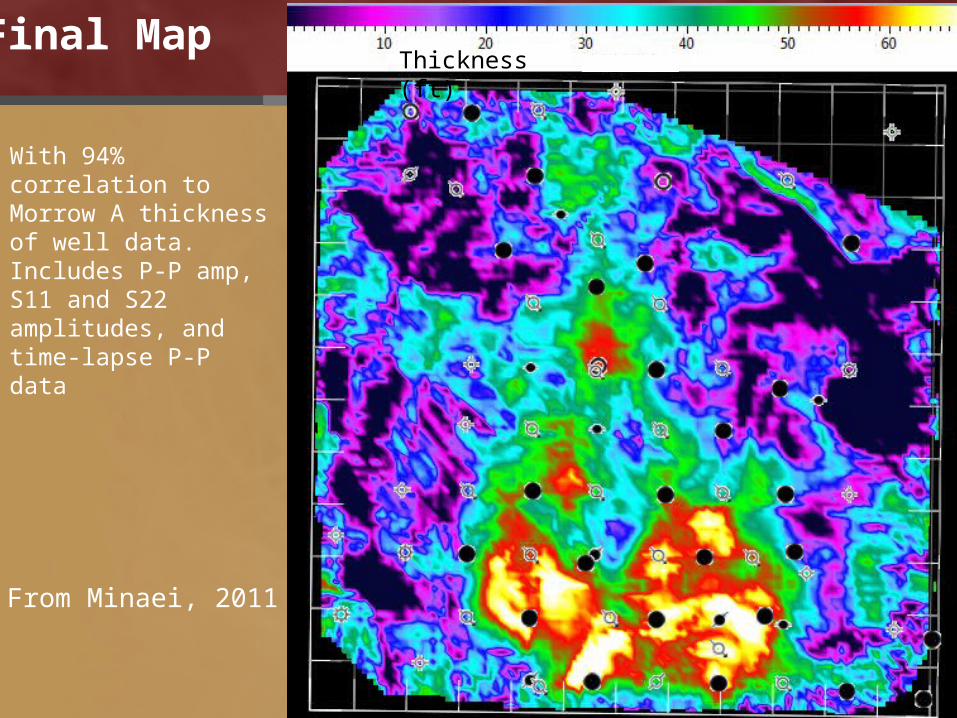
Final Map
With 94% correlation to Morrow A thickness of well data. Includes P-P amp, S11 and S22 amplitudes, and time-lapse P-P data
From Minaei, 2011
Thickness (ft)
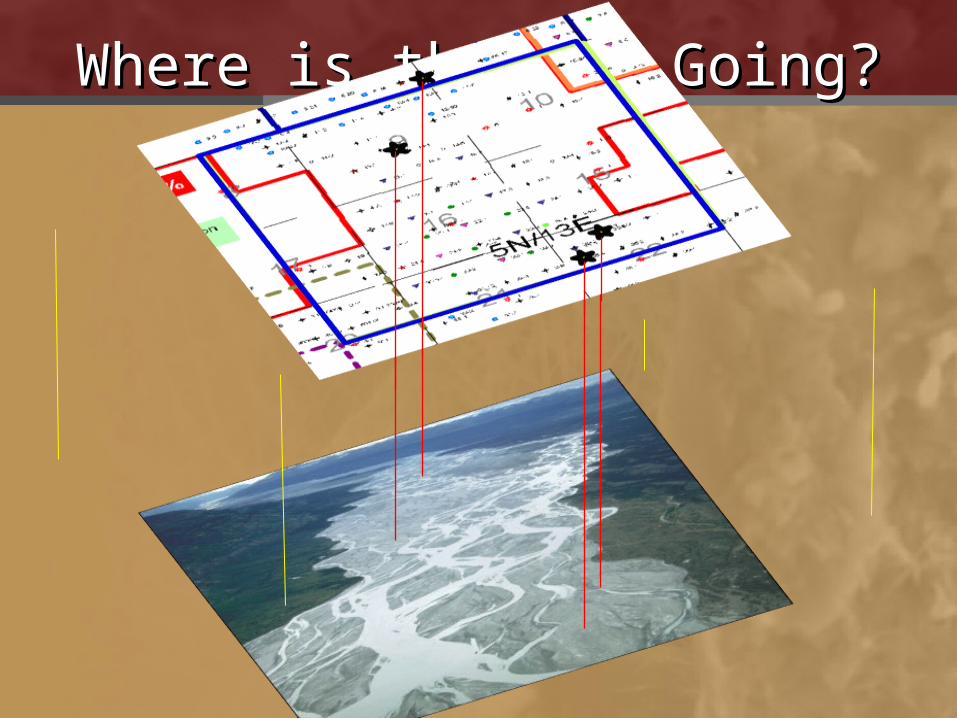
Where is the CO2 Going?Where is the CO2 Going?

Seismic/Simulation
P-Wave: 1st Monitor-Base
29From Heris 2011
From Zerpa 2011
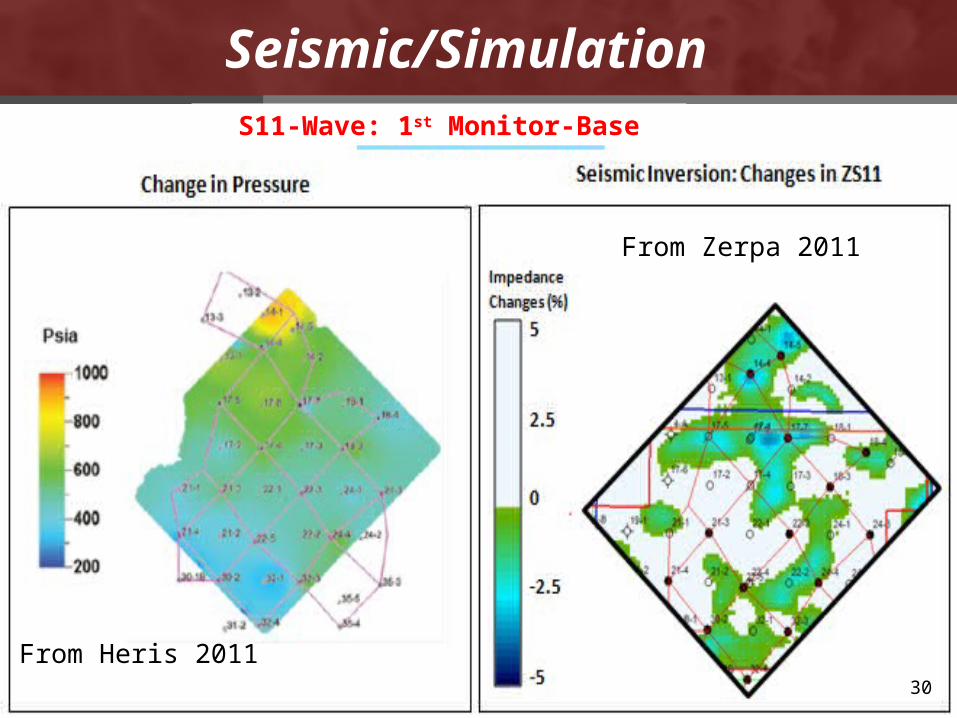
Seismic/SimulationS11-Wave: 1st Monitor-Base
30
From Heris 2011
From Zerpa 2011
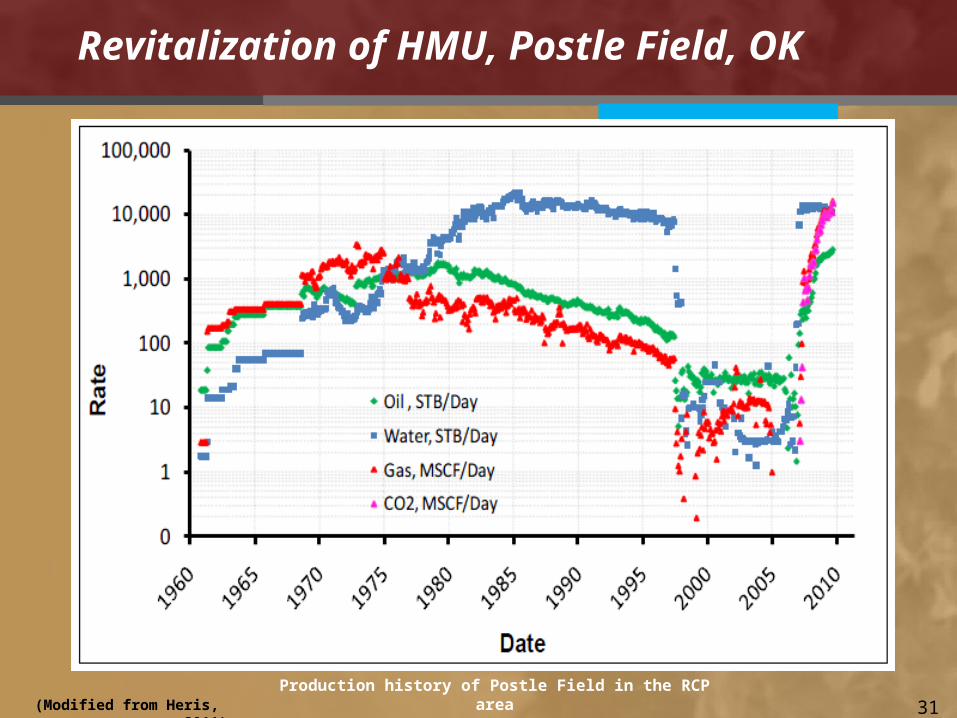
Revitalization of HMU, Postle Field, OK
Discovery
1958 1961
Start of
Production
1974
Start of Waterflood
May 2007
March2008
Dec.2008
February2010
Start of CO2 Flood Baseline
Survey 1st
Monitor
Survey
2nd MonitorSurvey
Seismic Acquisition
(Modified from Heris, 2011)Production history of Postle Field in the RCP area
31
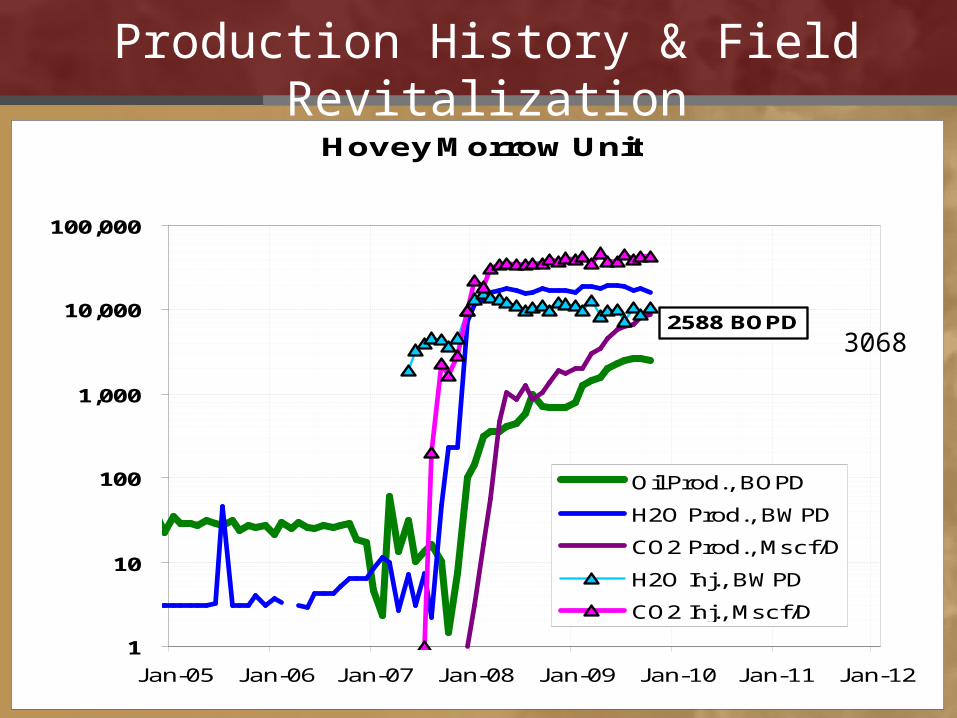
Production History & Field RevitalizationHovey Morrow Unit
1
10
100
1,000
10,000
100,000
Jan-05 Jan-06 Jan-07 Jan-08 Jan-09 Jan-10 Jan-11 Jan-12
Oil Prod., BOPD
H2O Prod., BWPD
CO2 Prod., Mscf/D
H2O Inj., BWPD
CO2 Inj., Mscf/D
2588 BOPD3068
Conclusions
•The Morrow A Sandstone Reservoir is better imaged with shear waves
•Reservoir conformance mapping with shear waves provides the insight to change or adjust the current injection-production pattern to improve CO2 conformance
Reservoir Characterization Project Phase XII
Thanks to RCP Sponsors of Phases XII and XIII