seismic response of geocell retaining walls: experimental ... · pdf fileseismic response of...
TRANSCRIPT
Seismic Response of Geocell Retaining Walls:Experimental Studies
Hoe I. Ling1; Dov Leshchinsky2; Jui-Pin Wang3; Yoshiyuki Mohri4; and Arik Rosen5
Abstract: This paper summarizes the seismic response of five large-scale retaining walls having a geocell facing. The walls were 2.8 mhigh and the backfill and foundation soil were a fine sand compacted to 90% standard Proctor density �relative density of 55%�. The firsttwo walls were of the same geometry, with a tapered facing made of geocells each of height 20 cm, one infilled with gravel and the otherwith sand. In Wall 3, a facing of depth 60 cm was constructed while the backfill sand was reinforced with a polyester geogrid. Wall 4 wassimilar to Wall 3 except that the backfill was reinforced with several geocell layers. Wall 5 had thin geocell layers of 5 cm height asreinforcements in order to improve the performance compared with Wall 4. The walls were subjected to the scaled horizontal and verticalmotions as recorded during the 1995 Kobe earthquake, 4.5 m /s2 �450 gal� and 9.0 m /s2 �900 gal� maximum horizontal accelerations inthe first and second excitations, respectively. In an attempt to induce failure, and therefore, to investigate the failure mechanism, Walls 3–5were subjected to a third shaking in which the horizontal accelerations were scaled to 12.0 m /s2 �1,200 gal�. The walls were fullyinstrumented with accelerometers, laser displacement transducers, force transducers, and strain gauges. All five walls performed satisfac-torily under the simulated earthquake motions. An improved wall performance was seen with the geocells acting as reinforcement layers.The study showed that geocells can be used successfully to form gravity walls as well as reinforcement layers even when subjected to avery high seismic load beyond that of the Kobe earthquake.
DOI: 10.1061/�ASCE�1090-0241�2009�135:4�515�
CE Database subject headings: Seismic effects; Earthquakes; Retaining walls; Experimentation.
Introduction
The mechanism of soil reinforcement under static loading condi-tions, such as that due to self-weight and surcharge, has beeninterpreted as due to pseudocohesion �Schlosser and Long 1973�or increase in confining pressure �Yang 1972�. Although success-ful performance of reinforced soil structures has been reportedunder earthquake loading �see Ling et al. �1997�; Ling and Lesh-chinsky �1998�; Tatsuoka et al. �1998� for a list of case histories�,the mechanism of reinforcement has not been widely discussed.
The behavior of reinforced soil composite under earthquakeloading can be understood by referring to the deformation of asoil element �Fig. 1� subjected to a constant overburden pressure.During an earthquake, the vertical and horizontal normal stressesremain constant, but cyclic simple shear stresses are induced withalternating positive and negative values �for simplicity, the verti-
1Professor, Dept. of Civil Engineering and Engineering Mechanics,Columbia Univ., 500 West 120th Street, New York, NY 10027. E-mail:[email protected]
2Professor, Dept. of Civil and Environmental Engineering, Univ. ofDelaware, Newark, DE 19716.
3Graduate Research Assistant, Dept. of Civil Engineering and Engi-neering Mechanics, Columbia Univ., 500 West 120th Street, New York,NY 10027.
4Manager, Geotechnical Laboratory, National Institute of Rural Engi-neering, 2-1-6 Kannodai, Tsukuba 305-8609, Japan.
5Formerly, PRS-Mediterranean, Tel Aviv, Israel.Note. Discussion open until September 1, 2009. Separate discussions
must be submitted for individual papers. The manuscript for this paperwas submitted for review and possible publication on October 1, 2007;approved on June 17, 2008. This paper is part of the Journal of Geotech-nical and Geoenvironmental Engineering, Vol. 135, No. 4, April 1,
2009. ©ASCE, ISSN 1090-0241/2009/4-515–524/$25.00.JOURNAL OF GEOTECHNICAL AND
Downloaded 20 Mar 2009 to 128.59.29.217. Redistribution subject to
cal acceleration is not considered�. As can be seen in Fig. 1, theshear stress induced by the earthquake enlarges the Mohr circle orincreases the principal stress difference, thus bringing the soilclose to a failure state. A sufficiently large shear stress would havebrought the circle to touch the failure envelope or induced tensionas the minor principal stress becomes zero. Since granular soildoes not sustain tensions, cracks will be seen in the soil, espe-cially at the ground surface where the confining stress is very low.The surface cracking during shaking has been reported by Ling etal. �2005a�. It is also noticed that with the alternating positive andnegative shear stresses, the principal stress that is vertical understatic conditions will start to rotate between positive and negativeinclinations. The shear strength of soil may be affected by theprincipal stress rotation �e.g., Ishihara 1996�.
The role of tensile reinforcement is to restrain the earthquake-induced shear deformation in soil �Fig. 2�. For a soil element thatis included between two planar reinforcement layers, such a re-straining effect is seen since soil deformation is restrainedthrough the tensile properties of the reinforcements, especially ifthe reinforcements are closely spaced. Of course, the behavior isaffected by the frictional interaction between the reinforcementsand soil, as well as the stiffness and strength of reinforcementlayers. With a rigid wall facing, such as that constructed frommodular blocks, the shear deformation in the soil also is re-strained.
Polymeric sheets manufactured from medium- to high-densitypolyethylene may be welded ultrasonically to create geocells �Fig.3�. Geocells function as three-dimensional soil confinement sys-tems. The geocells are collapsible and can be transported easily tothe site, expanded and filled with different types of soils. Theywere first used to increase the bearing capacity of sand roads for
military vehicles �Webster 1979�. Since then, geocells have beenGEOENVIRONMENTAL ENGINEERING © ASCE / APRIL 2009 / 515
ASCE license or copyright; see http://pubs.asce.org/copyright

used for different civil engineering applications, including earthretaining walls, slope, embankment, pavement and erosion con-trol. The application of geocells to retaining walls is relativelynew �see, for example, Bathurst and Crowe 1994� compared withother polymeric geogrids. A three-dimensional cellular structuresuch as a geocell restrains further the shear deformation in the soilby “locking” the soil unit in place �for configuration and layout ofgeocells in a retaining wall, refer to Figs. 3 and 8�. The stiffnessand strength of the geocells should play an important role inensuring such restraining effects. Note that while shear deforma-tions are restrained locally by the geocells, the sliding and over-turning stabilities of the geocell layers have to be secured inmaintaining the global stability of the whole wall system.
In this study, the seismic performance of several soil retainingwalls having a geocell facing is investigated using shake tabletests. Five soil retaining walls, two with geocell facing alone andthree of which included geocells or geogrids as reinforcements,
Fig. 1. Cyclic simple shear loading
Fig. 2. Shear restraining effects in reinforced soil walls
516 / JOURNAL OF GEOTECHNICAL AND GEOENVIRONMENTAL ENGINE
Downloaded 20 Mar 2009 to 128.59.29.217. Redistribution subject to
were tested using a total of two or three different shaking inten-sities by scaling the Kobe earthquake records. The behavior of thewalls due to different effects, such as the infill materials andlayouts, are presented and discussed.
Testing Facilities and Input Motions
A three-dimensional shake table of plan dimensions 6 m�4 mwas used for conducting this study. A steel box was fabricated toaccommodate a wall of height of 2.8 m �and 0.2 m foundation�,length of 4 m, and width of 2 m. The box was mounted firmly tothe table. Note that this box was different from the box used in aprevious study by Ling et al. �2005a�. One of the side walls of thesteel box was made detachable to allow for visualization of theentire cross section at the end of testing. The steel frames wereused as fixtures for the laser displacement transducers mounted inthe front and on top of the wall. The inner sides of the box werepolished, lubricated with grease and plastic sheets to minimizefriction. Expanded polystyrene �EPS� foam �5 cm thick� wereplaced at the back and front ends of the steel box to prevent thereflective wave from propagating from the steel box into thebackfill.
Part of the north–south �NS� and up–down �UD� componentsof the 1995 Kobe earthquake accelerations �peak values of 0.59and 0.34g, respectively, as recorded by the Japan MeteorologicalAgency�, were used in the testings. The Kobe earthquake was asignificant event of magnitude 7.2; thus, the records may repre-sent one of the worst case scenarios. A series of parametric stud-ies where the stresses and deformations resulting from differentearthquake records were compared showed that the Kobe earth-quake records affected most significantly the wall performance�Ling et al. 2005b�.
A total of five walls were tested in which the first two wallswere subjected to two shakings, whereas the three other wallswere subjected to three shakings of different intensities. The peakhorizontal accelerations were scaled to 4.5, 9.0, and 12.0 m /s2
�450, 900, and 1,200 gal� of the recorded values during the first,second, and third shakings, respectively. The vertical accelera-tions were scaled accordingly. Table 1 summarizes the maximumhorizontal and vertical accelerations recorded on the table duringeach shaking. Note that the resulting wave forms of accelerationsof the table were affected by the mass and response of the walls,which were different in all cases, although the table had beencalibrated beforehand against the anticipated load. Fig. 4 showsthe NS and UD accelerations of the shake table during the second
Fig. 3. Three-dimensional cellular confinement systems �geocells�
shaking for Wall 5. The input spectra of the three shakings show
ERING © ASCE / APRIL 2009
ASCE license or copyright; see http://pubs.asce.org/copyright
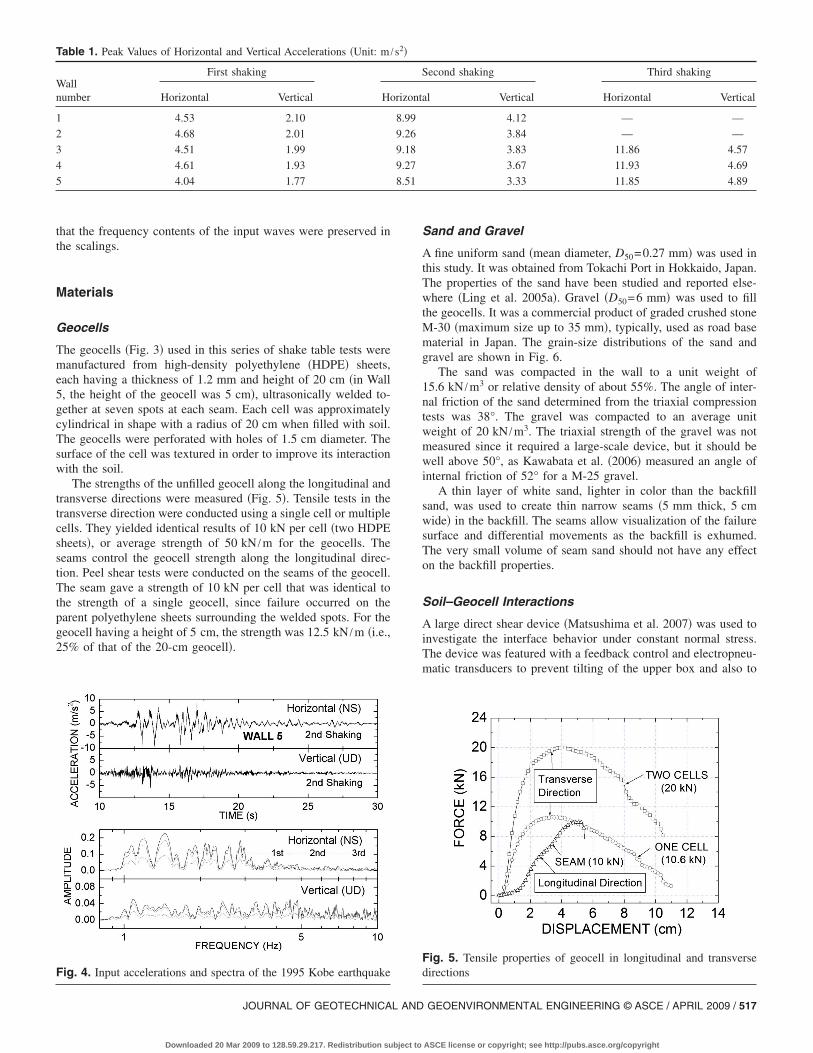
that the frequency contents of the input waves were preserved inthe scalings.
Materials
Geocells
The geocells �Fig. 3� used in this series of shake table tests weremanufactured from high-density polyethylene �HDPE� sheets,each having a thickness of 1.2 mm and height of 20 cm �in Wall5, the height of the geocell was 5 cm�, ultrasonically welded to-gether at seven spots at each seam. Each cell was approximatelycylindrical in shape with a radius of 20 cm when filled with soil.The geocells were perforated with holes of 1.5 cm diameter. Thesurface of the cell was textured in order to improve its interactionwith the soil.
The strengths of the unfilled geocell along the longitudinal andtransverse directions were measured �Fig. 5�. Tensile tests in thetransverse direction were conducted using a single cell or multiplecells. They yielded identical results of 10 kN per cell �two HDPEsheets�, or average strength of 50 kN /m for the geocells. Theseams control the geocell strength along the longitudinal direc-tion. Peel shear tests were conducted on the seams of the geocell.The seam gave a strength of 10 kN per cell that was identical tothe strength of a single geocell, since failure occurred on theparent polyethylene sheets surrounding the welded spots. For thegeocell having a height of 5 cm, the strength was 12.5 kN /m �i.e.,25% of that of the 20-cm geocell�.
Table 1. Peak Values of Horizontal and Vertical Accelerations �Unit: m /
Wallnumber
First shaking
Horizontal Vertical Ho
1 4.53 2.10
2 4.68 2.01
3 4.51 1.99
4 4.61 1.93
5 4.04 1.77
Fig. 4. Input accelerations and spectra of the 1995 Kobe earthquake
JOURNAL OF GEOTECHNICAL AND
Downloaded 20 Mar 2009 to 128.59.29.217. Redistribution subject to
Sand and Gravel
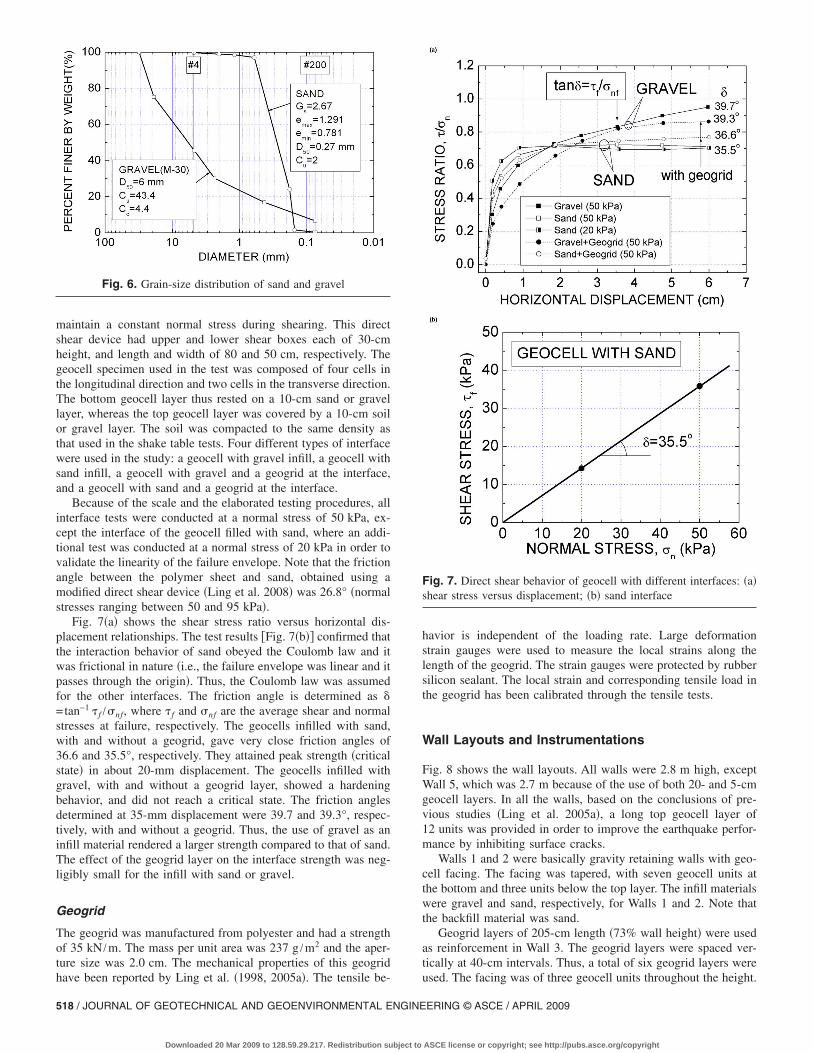
A fine uniform sand �mean diameter, D50=0.27 mm� was used inthis study. It was obtained from Tokachi Port in Hokkaido, Japan.The properties of the sand have been studied and reported else-where �Ling et al. 2005a�. Gravel �D50=6 mm� was used to fillthe geocells. It was a commercial product of graded crushed stoneM-30 �maximum size up to 35 mm�, typically, used as road basematerial in Japan. The grain-size distributions of the sand andgravel are shown in Fig. 6.
The sand was compacted in the wall to a unit weight of15.6 kN /m3 or relative density of about 55%. The angle of inter-nal friction of the sand determined from the triaxial compressiontests was 38°. The gravel was compacted to an average unitweight of 20 kN /m3. The triaxial strength of the gravel was notmeasured since it required a large-scale device, but it should bewell above 50°, as Kawabata et al. �2006� measured an angle ofinternal friction of 52° for a M-25 gravel.
A thin layer of white sand, lighter in color than the backfillsand, was used to create thin narrow seams �5 mm thick, 5 cmwide� in the backfill. The seams allow visualization of the failuresurface and differential movements as the backfill is exhumed.The very small volume of seam sand should not have any effecton the backfill properties.
Soil–Geocell Interactions
A large direct shear device �Matsushima et al. 2007� was used toinvestigate the interface behavior under constant normal stress.The device was featured with a feedback control and electropneu-matic transducers to prevent tilting of the upper box and also to
Second shaking Third shaking
al Vertical Horizontal Vertical
4.12 — —
3.84 — —
3.83 11.86 4.57
3.67 11.93 4.69
3.33 11.85 4.89
Fig. 5. Tensile properties of geocell in longitudinal and transversedirections
s2�
rizont
8.99
9.26
9.18
9.27
8.51
GEOENVIRONMENTAL ENGINEERING © ASCE / APRIL 2009 / 517
ASCE license or copyright; see http://pubs.asce.org/copyright
maintain a constant normal stress during shearing. This directshear device had upper and lower shear boxes each of 30-cmheight, and length and width of 80 and 50 cm, respectively. Thegeocell specimen used in the test was composed of four cells inthe longitudinal direction and two cells in the transverse direction.The bottom geocell layer thus rested on a 10-cm sand or gravellayer, whereas the top geocell layer was covered by a 10-cm soilor gravel layer. The soil was compacted to the same density asthat used in the shake table tests. Four different types of interfacewere used in the study: a geocell with gravel infill, a geocell withsand infill, a geocell with gravel and a geogrid at the interface,and a geocell with sand and a geogrid at the interface.
Because of the scale and the elaborated testing procedures, allinterface tests were conducted at a normal stress of 50 kPa, ex-cept the interface of the geocell filled with sand, where an addi-tional test was conducted at a normal stress of 20 kPa in order tovalidate the linearity of the failure envelope. Note that the frictionangle between the polymer sheet and sand, obtained using amodified direct shear device �Ling et al. 2008� was 26.8° �normalstresses ranging between 50 and 95 kPa�.
Fig. 7�a� shows the shear stress ratio versus horizontal dis-placement relationships. The test results �Fig. 7�b�� confirmed thatthe interaction behavior of sand obeyed the Coulomb law and itwas frictional in nature �i.e., the failure envelope was linear and itpasses through the origin�. Thus, the Coulomb law was assumedfor the other interfaces. The friction angle is determined as �=tan−1 � f /�nf, where � f and �nf are the average shear and normalstresses at failure, respectively. The geocells infilled with sand,with and without a geogrid, gave very close friction angles of36.6 and 35.5°, respectively. They attained peak strength �criticalstate� in about 20-mm displacement. The geocells infilled withgravel, with and without a geogrid layer, showed a hardeningbehavior, and did not reach a critical state. The friction anglesdetermined at 35-mm displacement were 39.7 and 39.3°, respec-tively, with and without a geogrid. Thus, the use of gravel as aninfill material rendered a larger strength compared to that of sand.The effect of the geogrid layer on the interface strength was neg-ligibly small for the infill with sand or gravel.
Geogrid
The geogrid was manufactured from polyester and had a strengthof 35 kN /m. The mass per unit area was 237 g /m2 and the aper-ture size was 2.0 cm. The mechanical properties of this geogrid
Fig. 6. Grain-size distribution of sand and gravel
have been reported by Ling et al. �1998, 2005a�. The tensile be-
518 / JOURNAL OF GEOTECHNICAL AND GEOENVIRONMENTAL ENGINE
Downloaded 20 Mar 2009 to 128.59.29.217. Redistribution subject to
havior is independent of the loading rate. Large deformationstrain gauges were used to measure the local strains along thelength of the geogrid. The strain gauges were protected by rubbersilicon sealant. The local strain and corresponding tensile load inthe geogrid has been calibrated through the tensile tests.
Wall Layouts and Instrumentations
Fig. 8 shows the wall layouts. All walls were 2.8 m high, exceptWall 5, which was 2.7 m because of the use of both 20- and 5-cmgeocell layers. In all the walls, based on the conclusions of pre-vious studies �Ling et al. 2005a�, a long top geocell layer of12 units was provided in order to improve the earthquake perfor-mance by inhibiting surface cracks.
Walls 1 and 2 were basically gravity retaining walls with geo-cell facing. The facing was tapered, with seven geocell units atthe bottom and three units below the top layer. The infill materialswere gravel and sand, respectively, for Walls 1 and 2. Note thatthe backfill material was sand.
Geogrid layers of 205-cm length �73% wall height� were usedas reinforcement in Wall 3. The geogrid layers were spaced ver-tically at 40-cm intervals. Thus, a total of six geogrid layers were
Fig. 7. Direct shear behavior of geocell with different interfaces: �a�shear stress versus displacement; �b� sand interface
used. The facing was of three geocell units throughout the height.
ERING © ASCE / APRIL 2009
ASCE license or copyright; see http://pubs.asce.org/copyright

Walls 4 and 5 were outgrowths of Wall 3. Instead of usinggeogrid as reinforcement, geocell layers were used. Three geocelllayers �8 units long, 20-cm thick� were placed at a vertical spac-ing of 80 cm at the bottom of the wall and 60 cm for the top twolayers. In Wall 5, geocell layers �9 units long, 5-cm thick� wereused. The vertical spacing was one cell at the bottom and twocells at the other parts of the wall. Note that while the facing ofWalls 3–5 was infilled with gravel, the portion of geocell extend-ing behind the backfill was filled with sand.
A hand-operated 60-kg compactor was used to construct thebackfill in layers of 10 cm thickness. The construction procedureshave been documented by Ling et al. �2005a�, where a foundationof 20 cm was prepared before the installation of the geocell andbackfilling. The geocell facing and layers were also compactedafter filling the with soil, which was premixed with a small per-centage of moisture. Each geocell layer was placed with an offsetof 10 cm in the front, creating a slope angle of 63.4° �with thehorizontal�. Fig. 9 shows the front view of Wall 3 at the comple-tion of construction.
A total of eight laser displacement transducers were used tomeasure the lateral displacements of the facing along the heightof the wall. The settlements at the crest and foundation weremeasured using another eight laser displacement transducers. Themarkers were placed above the backfill for tracing the lateraldisplacements using a video camera placed from above the wall.A total of seven earth pressure transducers were placed at thefoundation to measure the vertical stress in the backfill. A set of40 accelerometers �20 for horizontal and 20 for vertical accelera-tions� were placed at designated locations �in front of the facing,behind the facing, in the front and back ends of the backfill� in
Fig. 8. Wall layou
measuring the accelerations. Eight earth pressure transducers also
JOURNAL OF GEOTECHNICAL AND
Downloaded 20 Mar 2009 to 128.59.29.217. Redistribution subject to
were installed at designated locations behind the facing to mea-sure the lateral earth pressure. In Wall 3, eight strain gauges wereused to measure the elongation along the length of the geogridlayers. A total of six geogrid layers were instrumented with straingauges. Note that the strains in the geocell layers were not instru-mented.
The data were logged at an interval of 1 min during construc-tion. During shaking, the logging interval was 0.002 s. After theshakings, an additional week was spent to demolish the wallwhile carefully examining the deformation and slip surfaces.
instrumentations
Fig. 9. Typical front view of wall �Wall 3�
ts and
GEOENVIRONMENTAL ENGINEERING © ASCE / APRIL 2009 / 519
ASCE license or copyright; see http://pubs.asce.org/copyright
Experimental Results and Discussions
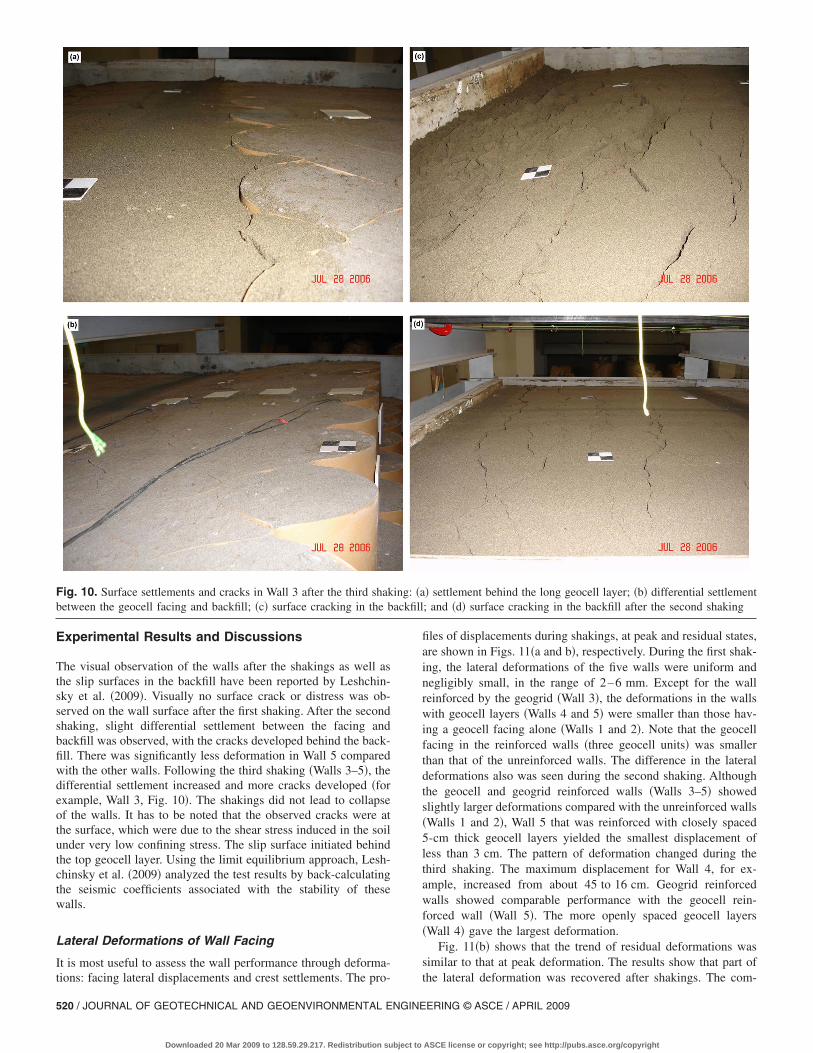
The visual observation of the walls after the shakings as well asthe slip surfaces in the backfill have been reported by Leshchin-sky et al. �2009�. Visually no surface crack or distress was ob-served on the wall surface after the first shaking. After the secondshaking, slight differential settlement between the facing andbackfill was observed, with the cracks developed behind the back-fill. There was significantly less deformation in Wall 5 comparedwith the other walls. Following the third shaking �Walls 3–5�, thedifferential settlement increased and more cracks developed �forexample, Wall 3, Fig. 10�. The shakings did not lead to collapseof the walls. It has to be noted that the observed cracks were atthe surface, which were due to the shear stress induced in the soilunder very low confining stress. The slip surface initiated behindthe top geocell layer. Using the limit equilibrium approach, Lesh-chinsky et al. �2009� analyzed the test results by back-calculatingthe seismic coefficients associated with the stability of thesewalls.
Lateral Deformations of Wall Facing
It is most useful to assess the wall performance through deforma-
Fig. 10. Surface settlements and cracks in Wall 3 after the third shakbetween the geocell facing and backfill; �c� surface cracking in the b
tions: facing lateral displacements and crest settlements. The pro-
520 / JOURNAL OF GEOTECHNICAL AND GEOENVIRONMENTAL ENGINE
Downloaded 20 Mar 2009 to 128.59.29.217. Redistribution subject to
files of displacements during shakings, at peak and residual states,are shown in Figs. 11�a and b�, respectively. During the first shak-ing, the lateral deformations of the five walls were uniform andnegligibly small, in the range of 2–6 mm. Except for the wallreinforced by the geogrid �Wall 3�, the deformations in the wallswith geocell layers �Walls 4 and 5� were smaller than those hav-ing a geocell facing alone �Walls 1 and 2�. Note that the geocellfacing in the reinforced walls �three geocell units� was smallerthan that of the unreinforced walls. The difference in the lateraldeformations also was seen during the second shaking. Althoughthe geocell and geogrid reinforced walls �Walls 3–5� showedslightly larger deformations compared with the unreinforced walls�Walls 1 and 2�, Wall 5 that was reinforced with closely spaced5-cm thick geocell layers yielded the smallest displacement ofless than 3 cm. The pattern of deformation changed during thethird shaking. The maximum displacement for Wall 4, for ex-ample, increased from about 45 to 16 cm. Geogrid reinforcedwalls showed comparable performance with the geocell rein-forced wall �Wall 5�. The more openly spaced geocell layers�Wall 4� gave the largest deformation.
Fig. 11�b� shows that the trend of residual deformations wassimilar to that at peak deformation. The results show that part of
� settlement behind the long geocell layer; �b� differential settlement; and �d� surface cracking in the backfill after the second shaking
ing: �aackfill
the lateral deformation was recovered after shakings. The com-
ERING © ASCE / APRIL 2009
ASCE license or copyright; see http://pubs.asce.org/copyright
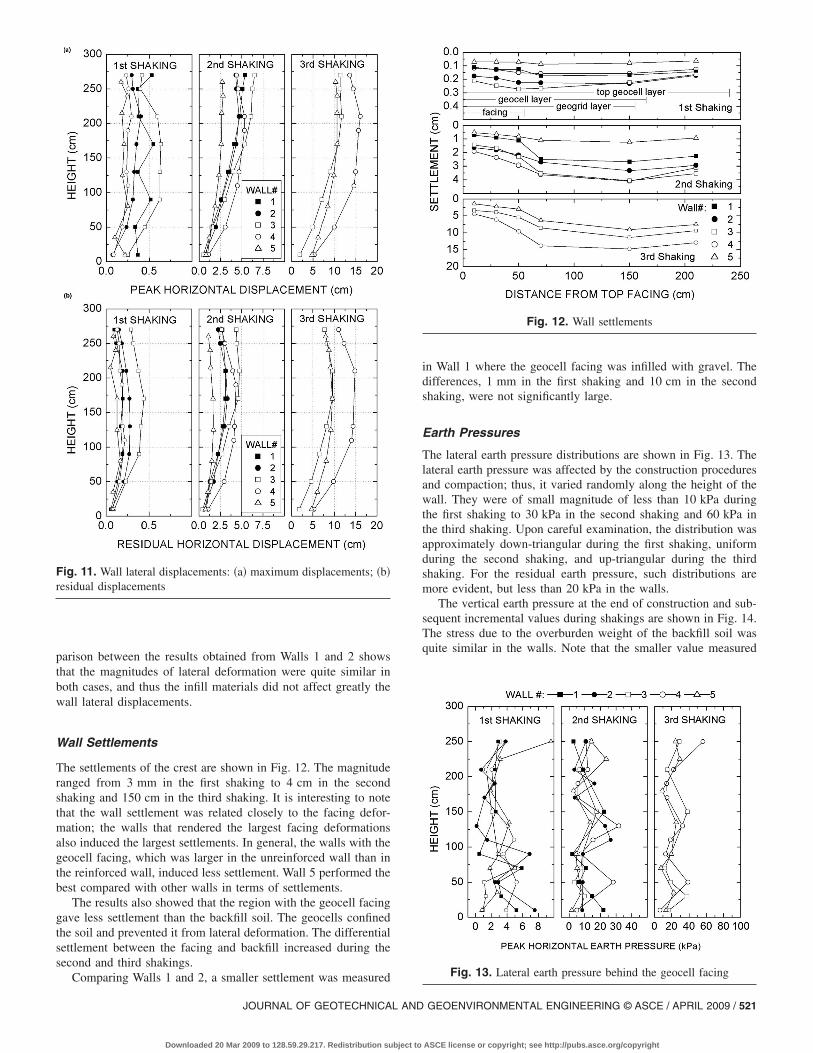
parison between the results obtained from Walls 1 and 2 showsthat the magnitudes of lateral deformation were quite similar inboth cases, and thus the infill materials did not affect greatly thewall lateral displacements.
Wall Settlements
The settlements of the crest are shown in Fig. 12. The magnituderanged from 3 mm in the first shaking to 4 cm in the secondshaking and 150 cm in the third shaking. It is interesting to notethat the wall settlement was related closely to the facing defor-mation; the walls that rendered the largest facing deformationsalso induced the largest settlements. In general, the walls with thegeocell facing, which was larger in the unreinforced wall than inthe reinforced wall, induced less settlement. Wall 5 performed thebest compared with other walls in terms of settlements.
The results also showed that the region with the geocell facinggave less settlement than the backfill soil. The geocells confinedthe soil and prevented it from lateral deformation. The differentialsettlement between the facing and backfill increased during thesecond and third shakings.
Fig. 11. Wall lateral displacements: �a� maximum displacements; �b�residual displacements
Comparing Walls 1 and 2, a smaller settlement was measured
JOURNAL OF GEOTECHNICAL AND
Downloaded 20 Mar 2009 to 128.59.29.217. Redistribution subject to
in Wall 1 where the geocell facing was infilled with gravel. Thedifferences, 1 mm in the first shaking and 10 cm in the secondshaking, were not significantly large.
Earth Pressures
The lateral earth pressure distributions are shown in Fig. 13. Thelateral earth pressure was affected by the construction proceduresand compaction; thus, it varied randomly along the height of thewall. They were of small magnitude of less than 10 kPa duringthe first shaking to 30 kPa in the second shaking and 60 kPa inthe third shaking. Upon careful examination, the distribution wasapproximately down-triangular during the first shaking, uniformduring the second shaking, and up-triangular during the thirdshaking. For the residual earth pressure, such distributions aremore evident, but less than 20 kPa in the walls.
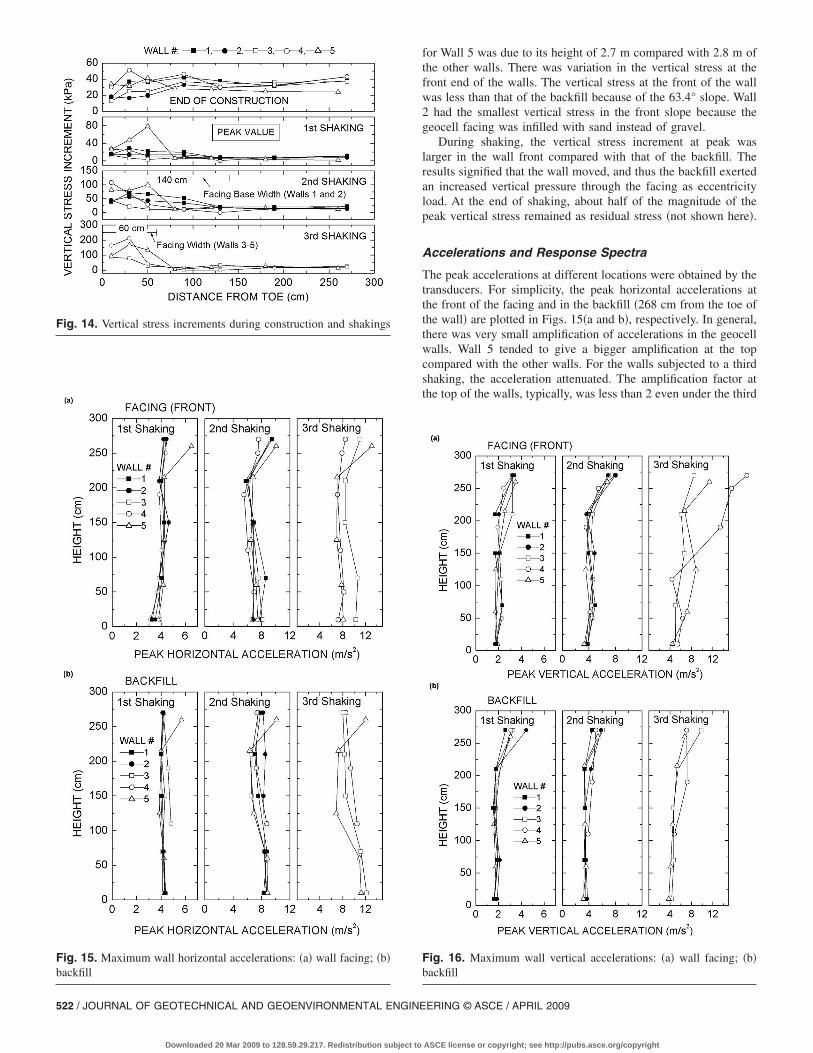
The vertical earth pressure at the end of construction and sub-sequent incremental values during shakings are shown in Fig. 14.The stress due to the overburden weight of the backfill soil wasquite similar in the walls. Note that the smaller value measured
Fig. 12. Wall settlements
Fig. 13. Lateral earth pressure behind the geocell facing
GEOENVIRONMENTAL ENGINEERING © ASCE / APRIL 2009 / 521
ASCE license or copyright; see http://pubs.asce.org/copyright
522 / JOURNAL OF GEOTECHNICAL AND GEOENVIRONMENTAL ENGINE
Downloaded 20 Mar 2009 to 128.59.29.217. Redistribution subject to
for Wall 5 was due to its height of 2.7 m compared with 2.8 m ofthe other walls. There was variation in the vertical stress at thefront end of the walls. The vertical stress at the front of the wallwas less than that of the backfill because of the 63.4° slope. Wall2 had the smallest vertical stress in the front slope because thegeocell facing was infilled with sand instead of gravel.
During shaking, the vertical stress increment at peak waslarger in the wall front compared with that of the backfill. Theresults signified that the wall moved, and thus the backfill exertedan increased vertical pressure through the facing as eccentricityload. At the end of shaking, about half of the magnitude of thepeak vertical stress remained as residual stress �not shown here�.
Accelerations and Response Spectra
The peak accelerations at different locations were obtained by thetransducers. For simplicity, the peak horizontal accelerations atthe front of the facing and in the backfill �268 cm from the toe ofthe wall� are plotted in Figs. 15�a and b�, respectively. In general,there was very small amplification of accelerations in the geocellwalls. Wall 5 tended to give a bigger amplification at the topcompared with the other walls. For the walls subjected to a thirdshaking, the acceleration attenuated. The amplification factor atthe top of the walls, typically, was less than 2 even under the third
Fig. 16. Maximum wall vertical accelerations: �a� wall facing; �b�backfill
Fig. 14. Vertical stress increments during construction and shakings
Fig. 15. Maximum wall horizontal accelerations: �a� wall facing; �b�backfill
ERING © ASCE / APRIL 2009
ASCE license or copyright; see http://pubs.asce.org/copyright
shaking. The same trend of amplification of vertical accelerationis seen �Figs. 16�a and b��, and this occurred only at the top70 cm of the wall. The vertical amplification was large at thefacing front for Wall 4.
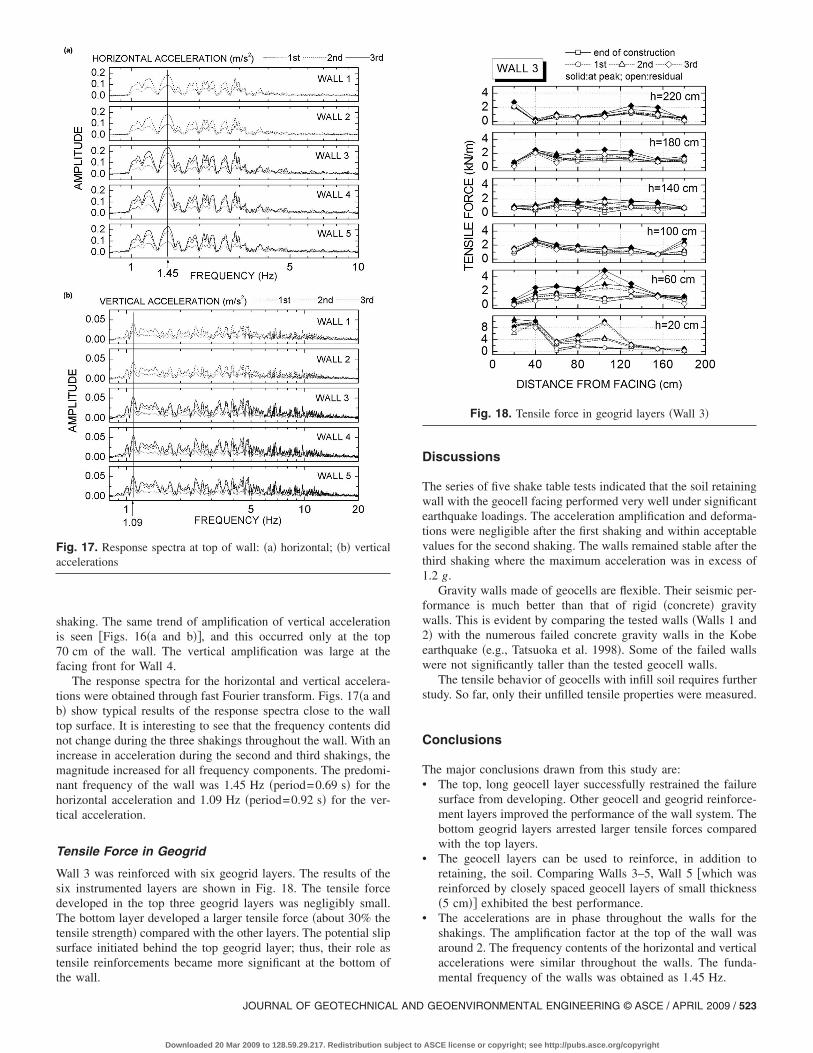
The response spectra for the horizontal and vertical accelera-tions were obtained through fast Fourier transform. Figs. 17�a andb� show typical results of the response spectra close to the walltop surface. It is interesting to see that the frequency contents didnot change during the three shakings throughout the wall. With anincrease in acceleration during the second and third shakings, themagnitude increased for all frequency components. The predomi-nant frequency of the wall was 1.45 Hz �period=0.69 s� for thehorizontal acceleration and 1.09 Hz �period=0.92 s� for the ver-tical acceleration.
Tensile Force in Geogrid
Wall 3 was reinforced with six geogrid layers. The results of thesix instrumented layers are shown in Fig. 18. The tensile forcedeveloped in the top three geogrid layers was negligibly small.The bottom layer developed a larger tensile force �about 30% thetensile strength� compared with the other layers. The potential slipsurface initiated behind the top geogrid layer; thus, their role astensile reinforcements became more significant at the bottom of
Fig. 17. Response spectra at top of wall: �a� horizontal; �b� verticalaccelerations
the wall.
JOURNAL OF GEOTECHNICAL AND
Downloaded 20 Mar 2009 to 128.59.29.217. Redistribution subject to
Discussions
The series of five shake table tests indicated that the soil retainingwall with the geocell facing performed very well under significantearthquake loadings. The acceleration amplification and deforma-tions were negligible after the first shaking and within acceptablevalues for the second shaking. The walls remained stable after thethird shaking where the maximum acceleration was in excess of1.2 g.
Gravity walls made of geocells are flexible. Their seismic per-formance is much better than that of rigid �concrete� gravitywalls. This is evident by comparing the tested walls �Walls 1 and2� with the numerous failed concrete gravity walls in the Kobeearthquake �e.g., Tatsuoka et al. 1998�. Some of the failed wallswere not significantly taller than the tested geocell walls.
The tensile behavior of geocells with infill soil requires furtherstudy. So far, only their unfilled tensile properties were measured.
Conclusions
The major conclusions drawn from this study are:• The top, long geocell layer successfully restrained the failure
surface from developing. Other geocell and geogrid reinforce-ment layers improved the performance of the wall system. Thebottom geogrid layers arrested larger tensile forces comparedwith the top layers.
• The geocell layers can be used to reinforce, in addition toretaining, the soil. Comparing Walls 3–5, Wall 5 �which wasreinforced by closely spaced geocell layers of small thickness�5 cm�� exhibited the best performance.
• The accelerations are in phase throughout the walls for theshakings. The amplification factor at the top of the wall wasaround 2. The frequency contents of the horizontal and verticalaccelerations were similar throughout the walls. The funda-
Fig. 18. Tensile force in geogrid layers �Wall 3�
mental frequency of the walls was obtained as 1.45 Hz.
GEOENVIRONMENTAL ENGINEERING © ASCE / APRIL 2009 / 523
ASCE license or copyright; see http://pubs.asce.org/copyright

• The geocell fill material utilizing gravel performed better interms of settlement compared with that of sand. The differencein lateral displacement between the walls filled with sand andgravel was negligibly small.
• The lateral earth pressure distribution behind the geocell fac-ing was random. With shakings, load eccentricity was ob-served under the base of the geocell facing.
It has to be noted that the measured performance was limited to aparticular geocell soil retaining wall system. Hence, the results asreported and conclusions should not be extrapolated to other wallsystems. Also, the results as reported should be useful for devel-oping and validating numerical procedures in analyzing the seis-mic behavior of geocell reinforced soil retaining walls.
Acknowledgments
This study was funded by the PRS-Mediterranean and imple-mented with the collaborative research agreement between Co-lumbia University and the National Research Institute of RuralEngineering �NRIRE� in the use of shake table facilities. MutsuoTakeuchi, Kenichi Matsushima, and Mitsuru Ariyoshi of NRIREprovided invaluable support for this study. Yoshikazu Okabe ofthe Tokyo Soil Research supervised the construction works.
References
Bathurst, R. J., and Crowe, R. E. �1994�. “Recent case histories of flex-ible geocell retaining walls in North America.” Recent case historiesof permanent geosynthetic-reinforced soil retaining walls, F. Tatsuokaand D. Leshchinsky, eds., Balkema, Rotterdam, The Netherlands,3–19.
Ishihara, K. �1996�. Soil behavior for earthquake geotechnics, OxfordUniversity Press, London.
Kawabata, T., Ling, H. I., Mohri, Y., and Shoda, D. �2006�. “The behaviorof buried flexible pipe under high fills and design implications.” J.Geotech. Geoenviron. Eng., 132�10�, 1354–1359.
Leshchinsky, D., Ling, H. I., Wang, J.-P., Rosen, A., and Mohri, Y.
524 / JOURNAL OF GEOTECHNICAL AND GEOENVIRONMENTAL ENGINE
Downloaded 20 Mar 2009 to 128.59.29.217. Redistribution subject to
�2009�. “Equivalent seismic coefficient in geocell retention systems.”Geotext. Geomembr., 27�1�, 9–18.
Ling, H. I., and Leshchinsky, D. �1998�. “Effects of vertical accelerationon seismic design of geosynthetic-reinforced soil structures.” Geo-technique, 48�3�, 347–373
Ling, H. I., Leshchinsky, D., and Perry, E. B. �1997�. “Seismic designand performance of geosynthetic-reinforced soil structures.” Geotech-nique, 47�5�, 933–952
Ling, H. I., Liu, H., and Mohri, Y. �2005b�. “Parametric studies on thebehavior of reinforced soil retaining walls under earthquake loading.”J. Eng. Mech., 131�10�, 1056–1065.
Ling, H. I., Mohri, Y., and Kawabata, T. �1998�. “Tensile properties ofgeogrids under cyclic loadings.” J. Geotech. Geoenviron. Eng.,124�8�, 782–787.
Ling, H. I., Mohri, Y., Leshchinsky, D., Burke, C., Matsushima, K., andLiu, H. �2005a�. “Large-scale shaking table tests on modular-blockreinforced soil retaining walls.” J. Geotech. Geoenviron. Eng.,131�4�, 465–476.
Ling, H. I., Wang, J.-P., and Leshchinsky, D. �2008�. “Cyclic behavior ofsoil–structure interfaces in a reinforced soil wall: Experimental stud-ies.” Geosynthet. Int., 15�1�, 14–21.
Matsushima, K., Mohri, Y., Aqil, U., Yamazaki, S., and Tatsuoka, F.�2007�. “Mechanical behavior of reinforced specimen using constantpressure large direct shear test.” Soil stress–strain behavior: Measure-
ment, modeling, and analysis, H. I. Ling, L. Callisto, D. Leshchinsky,and J. Koseki, eds., Springer, New York, 837–848.
Schlosser, F., and Long, N. T. �1973�. “Etude du comportement du ma-teriau terre armee.” Ann. Inst. Tech. Bat. Trav. Publics, 304, Ser.Mater. No. 45.
Tatsuoka, F., Koseki, J., Tateyama, M., Munaf, Y., and Horii, K. �1998�.“Seismic stability against high seismic loads of geosynthetic rein-forced soil retaining structures.” Proc., 6th Int. Conf. on Geosynthet-ics, Atlanta, Keynote Lecture, 103–142.
Webster, S. L. �1979�. “Investigation of beach sand trafficability enhance-ment using sand-grid confinement and membrane reinforcement con-cepts.” Technical Rep. GL-79-20, U.S. Army Corps of EngineersWaterway Experiment Station, Vicksburg, Miss.
Yang, Z. �1972�. “Strength and deformation characteristics of reinforcedsand.” Ph.D. thesis, Univ. of California at Los Angeles, Los Angeles,Calif.
ERING © ASCE / APRIL 2009
ASCE license or copyright; see http://pubs.asce.org/copyright