seismic risk assessmentsiteresources.worldbank.org/intsouthasia/resources/...this report presents...
TRANSCRIPT


12
3
4
5
Contents
Foreword 4 Aknowledgements 5
Bhutan Context, DRM and Seismic Risk 7
Thimphu Hazard Assessment 11Past earthquakes:
Seismic catalogues 12Seismic hazard analysis 15Definition of sources 16
Seismicity parameter of sources 17Ground motion prediction equations (GMPEs) 18
Results 19AME file 19Seismic hazard maps 19Uniform hazard spectra 22
Future steps 23
Thimphu Exposure and Vulnerability Assessment 25
Institutions involved 26Information available 26Results 29
Fields description 30Statistics 30
Future steps on exposure definition 34Introduction to seismic vulnerability 34Typologies 35Employed methodology 37Results 38Future steps 38
Thimphu Risk Assessment 41
Seismic risk methodology 42Expected annual loss 42Probable maximum loss 42Analysis of results 43
Average annual loss 43Expected loss due to specific events 44
Next steps: Future applications of CAPRA 46Estimate contingent liabilities associated with natural disasters 46Develop financial protection strategies 46Leverage the private sector 47Promote sustainable and cost-effective catastrophe risk insurance markets 47Strengthen local cooperation 47Strengthen international cooperation 47
Conclusions and recommendations 49
References 52

This report was prepared by the hazard, exposure, and vulnerability technical working group for this project of the Royal Government of Bhutan in collaboration with the World Bank. The technical working group is composed of officials from the Department of Geology and Mines, Thimphu Thromde, National Land Commission, National Statistics Bureau, Department of Engineering Services, and Department of Disaster Management.
This project was initiated to give institutions an idea of the information required and an understanding of how to assess risk using the CAPRA platform. It is intended to strengthen multisectoral coordination among relevant agencies, which is very important given Bhutan’s weak technical capacity in terms of both human resources and facilities.
The report demonstrates the methodology for seismic risk assessment, describes the outputs possible from it, and
indicates the purposes for which it can be used, including decision making based on risk information. Since this report is based on preliminary data, an important caveat is that the results presented here are preliminary and must not be used for any purpose or project other than the present one. This report illustrates the seismic risk of Bhutan using information available for assessing the seismic hazard and exposure of Thimphu. It also provides details on the factors used to calculate vulnerability and assess earthquake risk. Finally, it presents an outline of the next steps and future applications of CAPRA and provides recommendations for improving Bhutan’s ability to manage risk.
The report is intended to be used as a stepping stone for seismic risk assessment, encouraging the relevant agencies to improve on the data and have an up-to-date seismic risk assessment, improving their ability to make informed decisions, and mainstreaming disaster risk management in development plans of the country.
Foreword

This report presents the methodology for seismic risk
assessment, describes the outputs possible from it, and
indicates the purposes for which it can be used, including
decision making based on risk information. The exercise
was led by the Department of Disaster Management
with immense participation and contribution from the
technical working group. The technical working group
comprised of Mr. Dowchu Dukpa, Chief Seismologist
of Department of Geology & Mines; Mr. Chheten
Dorji, Geographic Information Systems (GIS) Officer of
Thimphu Thromde; Mr. Tshering Penjor, Deputy Chief
of National Land Commission; Mr. Tenzin Wangchuk,
Map Production Officer of National Statistics Bureau; Mr.
Sonam Yangdhen, Executive Engineer of Department
of Engineering Services; Mr. Pema Thinley, Information
Communications Technology (ICT) and Geographic
Information Systems (GIS) Officer; and Mr. Jigme
Chogyal, Senior Program Officer of Department of Disaster
Management.
The work was carried out with technical assistance from the Jean Ingenieros firm, composed of Eduardo Reinoso, Professor at National Autonomous University of Mexico (UNAM) and Mauro Niño, Professor at National Autonomous University of Mexico (UNAM). The World Bank team consisted of Augustin Maria, Senior Urban Specialist; Dechen Tshering, Disaster Risk Management Specialist; and Erika Vargas, Knowledge Management Specialist.
The team is also grateful to Engineer Alvaro Climent M. Seismic Specialist, Costa Rican Institute of Electricity (Instituto Costarricense de Electricidad), Dr. Pennung Warnitchai, Associate Professor, Leader of Civil and Infrastructure Engineering Group, School of Engineering and Technology, Asian Institute of Technology; Dr. Manzul Hazarika, Associate Director, Geoinformatics Center, Asian Institute of Technology; and Dr. Jayanta Pathak, Professor, Department of Civil Engineering, Assam Engineering College; for peer reviewing the report and providing very useful comments which helped improve the final report.
Aknowledgements


1 Seismic Risk Assessment in Thimphu, Bhutan
Bhutan Context, DRM and Seismic Risk

8 1. Bhutan Context, DRM and Seismic Risk
Seismic Risk Seismic Risk Assessment in Thimphu, Bhutan
Bhutan is located in the Himalayas, one of most seismically active zones in the world. In addition to the risk from earthquakes, Bhutan is also highly prone to glacial lake outburst floods (GLOF), flash floods, landslides, windstorms,
and natural as well as man-made fires. The two recent earthquakes of magnitude 6.3 and 6.9 on the Richter scale in 2009 and 2011, respectively, and the GLOF in 1994, which severely damaged the Punakha Dzong and caused major damage to livelihoods in and around the valley, were some of the worst disasters to have occurred in the country. Windstorms, flash floods, and landslides occur frequently, with notable damage every now and then. Forest fires are common, especially in the dry winter, when hundreds of acres of forest may be damaged. The most devastating fire was the Wangduephodrang Dzong
fire in 2012, which damaged an iconic heritage structure of the sixteenth century
No policies or guidelines related to DRM were in place prior to 2006, when the Royal Government of Bhutan adopted the National Disaster Risk Management Framework. However, as disasters increased in number and intensity across the country, a strong need arose to adopt a systematic approach to DRM. The Disaster Management Act was enacted in February 2013 to (a) recognize the need for taking a multidisciplinary approach to dealing with disasters; (b) provide a basis for setting up various DRM institutions and decentralizing DRM activities; and (c) mandate the mainstreaming of DRM into all national plans and policies. In line with this act, the National Disaster Management Authority

1. Bhutan Context, DRM and Seismic Risk 9
Seismic Risk Seismic Risk Assessment in Thimphu, Bhutan
was made the highest decision-making body for disaster management in Bhutan. Documents of national importance, such as the rules and regulations to support implementation of the Disaster Management Act 2013, disaster management planning guidelines, and standard operating procedures and guidelines, including terms of reference for search and rescue for a disaster response system and contingency planning guidelines, are currently being formulated.
The government of Bhutan highlighted the importance of mainstreaming DRM into development planning in the Eleventh Five-Year Plan (2013–18). DRM is considered one of the 16 national key result areas under the conservation and sustainable environment management pillar.
Although many initiatives have been put in place for DRM, implementation of many of these activities remains a challenge in terms of both financial and human technical capacity. Some of the other frequent challenges include multisectoral coordination, lack of awareness of the need for DRM, the need to mainstream DRM, and the need to build the capacity to respond to disasters.
Although a detailed and comprehensive seismic zonation of Bhutan has not been conducted, the country’s proximity to northeastern India, which is in the “most active” seismic Zone V, according to the Bureau of Indian Standards (BIS), indicates that the majority of Bhutan is in either Zone IV or Zone V. Based on this assumption, Bhutan adopted BIS building codes for reinforced concrete buildings in 1997. There are no specific codes for traditional buildings such as stone masonry, rammed earth, adobe construction, and timber construction. These traditional buildings are generally constructed using indigenous practices passed down through the generations.
In the last 100 years, about 18 large earthquakes (magnitude 7.0) occurred in the region (the Himalayas). The following large earthquakes were felt in Bhutan:
the 1713 Arunachal Pradesh earthquake (magnitude 7.0), the 1897 Great Shillong earthquake (magnitude 8.3), the 1905 Kangra earthquake (magnitude 8.0), the 1934 Bihar-Nepal earthquake (magnitude 8.1), the 1947 Assam earthquake (magnitude 7.8), and the 1950 Assam earthquake (magnitude 8.7).
Two recent earthquakes caused extensive damage. The September 2009 earthquake (magnitude 6.3) and the September 2011 earthquake (magnitude 6.9) were

10 1. Bhutan Context, DRM and Seismic Risk
Seismic Risk Seismic Risk Assessment in Thimphu, Bhutan
responsible for the loss of a few human lives and for millions of dollars of damage to infrastructure, including rural homes, schools, basic health units, other public infrastructure, and cultural heritage sites. They issued a wake-up call to the need for stronger disaster risk management and reminded the country that a bigger
earthquake is very possible and that the country needs to be prepared for such a situation.
Many of the main Himalayan faults—namely, the Main Central Thrust, the Main Boundary Thrust, and the Main Frontal Thrust—pass through Bhutan, as shown in map 1.
Map 2. Geological map of Bhutan (Grujic, 2002).

Seismic Risk Assessment in Thimphu, Bhutan2
Thimphu Hazard Assessment

12 2. Thimphu Hazard Assessment
Seismic Risk Seismic Risk Assessment in Thimphu, Bhutan
Few studies have sought to define seismic hazards in Bhutan. To begin to address this information gap, the project computed seismic risk in Thimphu Thromde using findings from a joint research project, currently under development, carried out by the Hazard Working Group (HWG) under the lead of Dowchu Drukpa from the Department of Geology and Mines and the Norwegian institution NORSAR.
An important caveat is that the results presented here are preliminary and must not be used for any other purpose or project than the present one: the AME file used is preliminary, and some improvements are still pending.
As in many countries that try to develop studies of seismic risk, in Bhutan the working groups found that they face significant limitations related to the lack of information and the lack of professionals specialized not only in hazard assessment but in other topics of work.
Despite these limitations, this study is a very good first approximation of the seismic risk in Thimphu and has served as a basis for the local Technical Working Groups (TWGs) to learn about the methodology for calculating seismic risk and studying its implications—in this case, using the CAPRA tool. However, the most important issue is that the TWGs now know what information and technical resources are needed to perform this type of studies and how future studies must be orientated to obtain more precise and reliable results.
Past earthquakes: Seismic cataloguesWe started with information (seismic catalogues) on past earthquakes that have affected the region under study and used this information to identify possible earthquake zones. Most of the time, this information is collected by specific institutions or by national governments through accelerographic networks. The information collected includes location (latitude, longitude, and depth) of the earthquake (the epicenter), magnitude (Mw, Ms, Mb, Ml), and origin (subduction, crustal, transverse fault, and so forth). Map 2 sshows the distribution of significant earthquakes in the Himalayan region. These types of earthquakes, though infrequent, provide information of use for characterizing the seismic environment for catastrophic hazard models.
Map 3 shows the tectonic map of the region. This information helps seismologists to understand and identify the generation, location, and magnitude of earthquakes.
For the purpose of this project, the seismic catalogues reviewed by the HWG were classified into two types: global and regional. There are five global catalogues:
1) Engdahl, van der Hilst, and Buland (EHB) bulletin2) National Earthquake Information Center (NEIC), Preliminary Determination of Epicenters (PDE), from the U.S.
Geological Survey (USGS) 3) International Seismological Centre (ISC)

2. Thimphu Hazard Assessment 13
Seismic Risk Seismic Risk Assessment in Thimphu, Bhutan
Map 2. Great and large earthquakes in Himalaya and Indo-Burma region (Kayal, 2007).
Map 3. Tectonic map of Northeast India.

Seismic Risk Seismic Risk Assessment in Thimphu, Bhutan
4) Global Earthquake Model (GEM)5) Global Centroid-Moment-Tensor (CMT). Map 4 shows the geographic location of earthquake epicenters recorded in the catalogues of different institutions. The information contained in the EHB catalogue (map 4, panel a) is too sparse, making it hard to define the seismic source. The NEIC catalogue (map 4, panel b) has good-quality information, but not enough data to define the seismogenic source. The ISC catalogue (map 4, panel c) has the most complete information and has even distribution of events. The last two catalogues have scarce data within the region of interest. a) EHB
b) NEIC
c) ISC
Map 4. Global seismic catalogues.

2. Thimphu Hazard Assessment 15
Seismic Risk Seismic Risk Assessment in Thimphu, Bhutan
In addition, there are two regional catalogues:
6) Rajendran7) North East Institute of Science and Technology (NEIST).
Map 5 shows the geographic location of earthquake epicenters contained in the regional catalogues recorded by the two institutions. The information contained in
the Rajendran catalogue (map 5, panel a) has enough
records, but an unclear magnitude of conversion.
The NEIST catalogue (map 5, panel b) has an uneven
distribution of records, making it hard to identify the
different seismogenic zones. The NEIST catalogue also has
a very small magnitude of completeness and does not
cover the full region.
a) Rajendran b) NEIST
Map 5. Local seismic catalogues.
Seismic hazard analysisThe methodology employed by the HWG was derived from that originally proposed by Esteva-Cornell in 1968 (McGuire 2006) and implemented in CRISIS software (Ordaz, Aguilar, and Arboleda 2007), which divides the territory under study into seismic sources based on geotectonic considerations. For each source, a magnitude exceedance rate, λ(M), was estimated using statistical analysis of the available earthquake catalogues. These rates are the number of earthquakes characterized by the seismicity of the source, per unit of time, at a magnitude exceeding M.
Seismic hazard was measured as a function of acceleration exceedance rates. For the ith source, this rate was calculated using the following expression:
vi(a) Pr(A > aM, R
i )dM
dλi(M)
dM
Mu
M0
�∫ (1)
where M0 and M
u are, respectively, the smallest and largest
magnitudes included in the analysis, Pr(A > a|M,Ri) is the probability that acceleration will exceed the value
16 2. Thimphu Hazard Assessment
Seismic Risk Seismic Risk Assessment in Thimphu, Bhutan
of a at the site, taking into account that a magnitude M earthquake originates at a distance R
i, defined as
the distance between the site and the area where the earthquake was generated within the ith source. Finally, the contributions of the N sources were added to the seismic hazard at the site using the following expression:
v(a) vi(a)
N
i = 1
= ∑ (2)
The acceleration defined in the above expressions is not only peak ground acceleration (PGA), but also those spectral accelerations (Sa) that are directly correlated with the damage that an earthquake may generate in any exposed asset, characterized by its structural period and its damping.
The HWG performed the following activities as part of its probabilistic seismic hazard analysis using CRISIS
1. Characterize the earthquake-generating sources that may affect the region in terms of their geometry
2. Determine the seismicity of these sources based on the historic record of events that have occurred; seismicity was established using a magnitude recurrence curve (a specific ratio for each source), which indicates the rate of exceedance of a specific seismic magnitude
3. Define the ground motion prediction equations (GMPEs) that characterize the hazard at the site by its intensity of acceleration as well as the associated uncertainty.
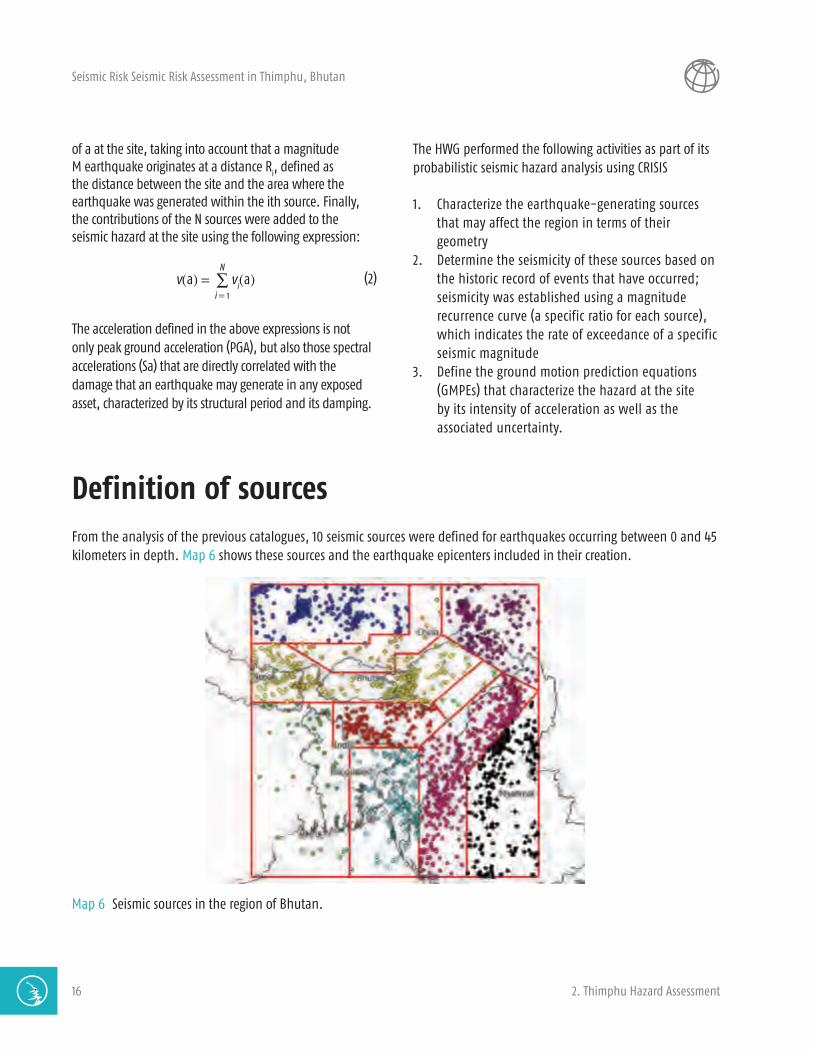
Definition of sourcesFrom the analysis of the previous catalogues, 10 seismic sources were defined for earthquakes occurring between 0 and 45 kilometers in depth. Map 6 shows these sources and the earthquake epicenters included in their creation.
Map 6 Seismic sources in the region of Bhutan.

2. Thimphu Hazard Assessment 17
Seismic Risk Seismic Risk Assessment in Thimphu, Bhutan
Seismicity parameter of sourcesTTo carry out probabilistic hazard analysis based on equation 1, it is necessary to know the magnitude of the exceedance rate of the earthquakes that may occur at each source. To define the seismicity of the area, the HWG employed the most widely used Gutenberg-Richter model, which expresses the seismic magnitude exceedance rate as follows:
λ(M) M0
M0
Mu
,λ0
e βM e βMu
e βM0 e βMu= ≤ ≤ (3)
The required parameters for equation 3 are shown in table 1.
There are several major megathrust earthquake sources in the study region. The nearest one to Thimphu is the Himalayan Frontal Thrust (HFT), which is the result of the collision between the Indian and Eurasian plates. The convergence rate between these two plates is quite high (about 21 millimeters per year). It could produce large earthquakes with magnitude up to 8.6. The seismic
hazard of Thimphu as well as several other nearby cities and towns could be dominated by the effect of this megathrust source. The occurrence rate of large earthquakes in this source cannot be estimated from instrumental earthquake records; it has to be estimated from the convergence rate and some seismotectonic information of the source.
Currently, the rate is estimated purely from instrumental earthquake records, and no seismotectonic information is used for estimating seismicity rate or for source modeling. This could result in a significant underestimation of the true hazard of Thimphu. However, as mentioned earlier, these results are preliminary, and the TWG will make more improvements in the future so that the seismic hazard will be properly defined.
From this information, it is possible to define the magnitude exceedance rate. Figure 1 shows these curves for each of the seismic sources considered in the study.
NameSource
Source Seismicity Data
l(M0) E(b) s(b) M
0E(M
u) s(M
u) M
1M
2
Zone 1 0.1012 1.6 0.55 4.75 7.2 0.5 6.7 7.7
Zone 2 2.2087 1.24 0.55 4.75 7.1 0.5 6.6 7.6
Zone 3 2.1355 1.01 0.55 4.75 7.2 0.5 6.7 7.7
Zone 4 0.0137 2.3 0.55 4.75 6.9 0.5 6.4 7.4
Zone 5 0.0647 2.18 0.55 4.75 5.8 0.5 5.3 6.3
Zone 6 1.9982 1.26 0.55 4.75 7.5 0.5 7 8
Zone 7 2.4688 0.81 0.55 4.75 8.0 0.5 7.5 8.5
Zone 8 0.8943 1.35 0.55 4.75 7.1 0.5 6.6 7.6
Zone 9 0.6144 1.54 0.55 4.75 8.4 0.5 7.9 8.9
Zone 10 2.3265 0.89 0.55 4.75 7.5 0.5 7 8
Table 1. Seismic parameters for the 10 seismic sources

Seismic Risk Seismic Risk Assessment in Thimphu, Bhutan
0.0001
0.001
0.01
0.1
1
10
4.50 5.00 5.50 6.00 6.50 7.00 7.50 8.00 8.50
Exce
edan
ce ra
te,l
(1/y
ear)
Magnitude
Zone1 Zone2 Zone3 Zone4 Zone5 Zone6 Zone7 Zone8 Zone9 Zone10
Figure 1. Exceedance rate of magnitudes for the 10 seismic sources considered.
Ground motion prediction equations (GMPEs)To evaluate the value of intensity A, included in equation 1, it was assumed that A is a random variable with normal logarithmic distribution, with mean Am(M,R), expressed as an attenuation ratio combining earthquake magnitude, M, and the distance between the source and the site, R. To define the full probability distribution of A, the natural logarithm of the standard deviation of that intensity, σ, was defined. The HWG employed a GMPE defined by Akkar and Bommer (2010) for Europe, the Mediterranean region, and the Middle East.

2. Thimphu Hazard Assessment 19
Seismic Risk Seismic Risk Assessment in Thimphu, Bhutan
Results
AME fileAs a result of the seismic hazard analysis, 7,416 stochastic events were included and deployed in an AME file format. The structure of this file, based on geographic information system (GIS) data, allowed us to put together information like the area of influence, frequency of occurrence, level of intensity, and uncertainty of each event that describes the hazard environment. This AME file is required to carry out a formal risk analysis using CAPRA, a disaster risk information platform, to compute the requested earthquake probability curves.
Seismic hazard mapsAs a result of the seismic hazard analysis, intensity maps were obtained for specific return periods for different vibration periods. Information presented in maps 7 to 9 correspond to the vibration periods of the majority of the structures considered in this study. Map 7 shows hazard maps for a return period of 100 years.
a) PGA b) T = 0.08 sec.
c) T = 0.182 sec. d) T = 0.437 sec.
Map 7 Seismic hazard maps for 100 years return period for different vibration periods.

20 2. Thimphu Hazard Assessment
Seismic Risk Seismic Risk Assessment in Thimphu, Bhutan
Map 8 shows the hazard maps for a return period of 250 years. The information related to this return period might be employed in the design of conventional structures, such as dwellings, private office buildings, commercial buildings, and more.
a) PGA b) T = 0.08 sec.
c) T = 0.182 sec. d) T = 0.437 sec.
Map 8. Seismic Hazard Maps for a Return Period of 250 Years for Different Vibration Periods.
Map 9 shows information for a return period of 1,000 years. This information might be employed in the design of essential buildings, like hospitals, schools, and nuclear power plants, among others.
a) PGA b) T = 0.08 sec.

2. Thimphu Hazard Assessment 21
Seismic Risk Seismic Risk Assessment in Thimphu, Bhutan
c) T = 0.182 sec. d) T = 0.437 sec.
Map 9. Seismic Hazard Maps for a Return Period of 1,000 Years for Different Vibration Periods.
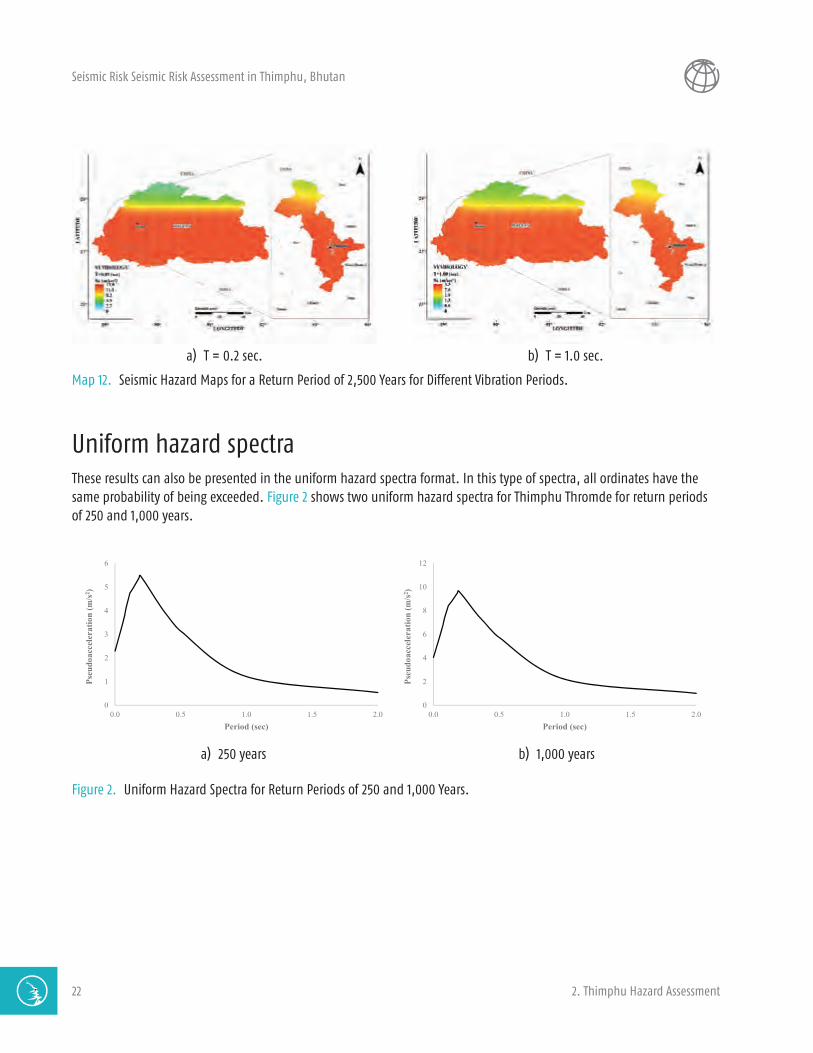
Moreover, to compare the preliminary information obtained in this project with information on the seismic hazard of other cities around the world, it would be necessary to present the data for conventional vibration periods and return periods. Maps 10 to 12 show information for vibration periods of 0.2 and 1.0 second for return periods of 50, 500, and 2,500 years.
a) T = 0.2 sec. b) T = 1.0 sec.
Map 10. Seismic Hazard Maps for a Return Period of 50 Years for Different Vibration Periods
a) T = 0.2 sec. b) T = 1.0 sec.
Map 11. Seismic Hazard Maps for a Return Period of 500 Years for Different Vibration Periods.
22 2. Thimphu Hazard Assessment
Seismic Risk Seismic Risk Assessment in Thimphu, Bhutan
a) T = 0.2 sec. b) T = 1.0 sec.
Map 12. Seismic Hazard Maps for a Return Period of 2,500 Years for Different Vibration Periods.
Uniform hazard spectraThese results can also be presented in the uniform hazard spectra format. In this type of spectra, all ordinates have the same probability of being exceeded. Figure 2 shows two uniform hazard spectra for Thimphu Thromde for return periods of 250 and 1,000 years.
0
1
2
3
4
5
6
0.0 0.5 1.0 1.5 2.0
Pseu
doac
cele
ratio
n (m
/s2 )
Period (sec)
0
2
4
6
8
10
12
0.0 0.5 1.0 1.5 2.0
Pseu
doac
cele
ratio
n (m
/s2 )
Period (sec)
a) 250 years b) 1,000 years
Figure 2. Uniform Hazard Spectra for Return Periods of 250 and 1,000 Years.

2. Thimphu Hazard Assessment 23
Seismic Risk Seismic Risk Assessment in Thimphu, Bhutan
Future stepsThese are preliminary results from a project still under development. However, this information conveys a basic idea of the seismic actions that could affect the exposed assets, not only in Thimphu Thromde but also in the whole country of Bhutan.
The HWG will continue to improve these results by undertaking the following activities:
z Define ad hoc GMPEs z Define the geometry for fault sources z Define the seismic parameters for fault sources z Improve the seismic parameters for the defined seismic sources z Define seismic sources for deeper earthquakes z Define site effects for Thimphu Thromde to consider the amplification of seismic waves due to local conditions or
liquefaction.


Seismic Risk Assessment in Thimphu, Bhutan3
Thimphu Exposure and Vulnerability Assessment

26 3. Thimphu Exposure and Vulnerability Assessment
Seismic Risk Seismic Risk Assessment in Thimphu, Bhutan
Exposure data mean buildings, infrastructure, and physical assets that may be damaged if a natural event occurs. Exposure data also encompass all aspects of the “human environment.”
Exposure databases should be created using Shape files, ensuring well-defined geospatial distribution and including data on each exposed asset. Depending on the type of infrastructure to be defined, Shape files may contain lines, points, or polygons. Buildings are often represented as polygons or points. However,
infrastructure components such as highways, roads, and canals are represented as lines.
In order to assess risk, it is necessary to define exposure databases in a GIS, creating Shape files with attribute fields populated with information about replacement cost (VALFIS), number of occupants during a specific time of the day (VALHUM), and structural characteristics that define their vulnerability or expected damage under seismic actions (SE_SISMO).
Institutions involvedThis activity required the involvement of more than one institution. For this reason, the Exposure Working Group (EWG) was created with the participation of Mr. Chheten Dorji from the Thimphu Thromde (Municipal Office), Mr. Tshering Penjor from the National Land Commission, and Mr. Tenzin Wangchuk from the National Statistics Bureau.
Mr. Chheten Dorji is a GIS officer with a master’s degree in photogrammetry and geoinformatics from Stuttgart University of Applied Sciences, Germany, and a bachelor’s degree in civil engineering from Bengal University of Science and Technology, Kolkata, India. He is responsible for executing GIS-related projects for urban development and management. Currently he is engaged
in a city addressing and urban utility mapping project implemented through a GIS platform. Mr. Tshering Penjor is a chief survey engineer and is serving as the acting chief of the Topographic Division of the National Land Commission. He has a bachelor’s degree in surveying from Curtin University in Perth, Western Australia. He is also the project manager for land cover mapping and the alienable and disposable land inventory of Bhutan, functions as the technical coordinator for topographic base mapping of Bhutan, and serves as an adviser for surveying and mapping activities, spatial data infrastructure, and geo-information sciences. Mr. Tenzin Wangchuk is a map production officer with a bachelor’s degree in computer applications.
Information availableThe recent base map produced by Thimphu Thromde is the main source of data used to develop the exposure database. The features contained in the Thromde base map were extracted from high-resolution satellite
imagery (GeoEye-I) in photogrammetric processing mode. The base mapping features were already stored in a standard geodatabase format for easy retrieval, management, and analysis of various applications. The

3. Thimphu Exposure and Vulnerability Assessment 27
Seismic Risk Seismic Risk Assessment in Thimphu, Bhutan
basic work flow adopted for the base mapping is shown in figure 3.
The geodatabase maintained by Thimphu Thromde contains several data sets of features, such as buildings, land cover, terrain, transportation system, rivers, and hydrography, among others. This project only considered exposed assets defined as buildings that had been classified in the Thromde geodatabase as one of the following types (figure 4):
1. Industrial buildings2. Private buildings
3. Public buildings (Community)4. Religious buildings
The by-product ortho-image abstracted through photogrammetric processing was used to identify visually the spatial location of each building feature, and field visits were subsequently conducted to verify and validate the type and history of the building. Institutional memories were used to populate the unit and history for each feature of the building.
Figure 5 shows a flowchart of the activities performed by the EWG.
Figure 3. Flowchart for Thimphu Thromde Base Mapping.

28 3. Thimphu Exposure and Vulnerability Assessment
Seismic Risk Seismic Risk Assessment in Thimphu, Bhutan
9/26/2013 5
Figure 4. Building data extraction from Thimphu Thromde geodatabase.
Figure 5. Flowchart for the activities performed by the EWG to create the exposure databases.

3. Thimphu Exposure and Vulnerability Assessment 29
Seismic Risk Seismic Risk Assessment in Thimphu, Bhutan
ResultsOnce this procedure was completed, 9,559 exposed assets were identified and distributed in four Shape files according to their features. Map 13 shows the spatial distribution of the exposed assets that were retrieved from the Thromde geodatabase.
The number and type of buildings are shown in figure 6.
Map 13. Spatial Distribution of Exposed Assets, by Use (Allocated in Shape Files).
6,65670%
2,78970%
851%
290% Religious
PrivateIndustrialCommunity
Figure 6. Distribution of Buildings, by Type.

30 3. Thimphu Exposure and Vulnerability Assessment
Seismic Risk Seismic Risk Assessment in Thimphu, Bhutan
Fields descriptionTo use CAPRA, data must be entered in Shape file format with specific field names, as indicated in table 2.
DataName
of Shape fieldFormat
Identifier IDNumeric, maximum
50 characters
Economic value VALFIS Numeric
Number of occupants
VALHUMNumeric, maximum
50 characters
Seismic vulnerability
function nameSE_SISMO Alphanumeric
Table 2. Description of the Field Contained in the Shape File.
Identifier (ID)
The identifier is a unique number used to identify each component of the database and to organize and control all locations.
Economic value (VALFIS)
In general, economic value is the replacement value in the prevailing conditions on the date of appraisal. Total economic value may be estimated indirectly using nominal construction costs.
The building information extracted from ortho-images considers roof area to define the geometry, and this might not agree with the actual footprint of the buildings. As a result of this, the estimated VALFIS is expected to be relatively high.
Number of occupants (VALHUM)
The number of occupants is the maximum number of persons estimated to occupy the building at the time of occurrence of the event. This number should reflect the
number of occupants by hour and by day, at the time of occurrence of the event, for all included buildings. This field may be left blank if the corresponding loss estimate is not needed.
In order to define human losses, it is necessary to identify how many occupants are in each building at a given time of the day. For this project, the EWG considered nighttime occupancy to mean population. Certain types of buildings, such as offices, schools, and basic health units, were excluded, as they were assumed to be vacant at night. The VALHUM for each type of building was computed considering height (number of stories), number of units in each story, and average household size per unit.
Seismic vulnerability function (SE_SISMO)
The CAPRA platform uses the seismic vulnerability function to compute losses. How to compute the vulnerability function should be adapted or developed by trained civil engineers or other experts.
StatisticsThis section describes the characteristics and statistics of the information for the three mandatory fields (VALFIS, VALHUM, and SE_SISMO) required to compute risk on each Shape file containing the exposed assets.
Industrial buildings
Industrial buildings are not common in Thromde Thimphu; the database contains only 29 such assets. Because of their use, the structural system is considered to be a two-story reinforced concrete movement-resistant frame with 10 occupants at night.
Private Buildings
Private buildings represent the majority of exposed assets in Thimphu Thromde. Out of 6,656 buildings, 6,649 are private residences and only 7 are offices (figure 7).

3. Thimphu Exposure and Vulnerability Assessment 31
Seismic Risk Seismic Risk Assessment in Thimphu, Bhutan
6,649100%
70%
OfficeResidential
Figure 7. Distribution of Private Buildings, by Use.
All private buildings were considered to be reinforced concrete frame structures with one or three stories. The distribution of private buildings is shown in figure 8.
4,84973%
180727%
1 Storey3 Stories
Figure 8. Distribution of Private Buildings, by Number of Stories.
Due to the lack of accurate information for defining the occupancy of each building, it was assumed that structures with less than 50 square meters are not occupied either at night or during the day. Structures with less than 50 square meters were assumed to be used as a garage, kitchen, toilet, or store; otherwise, the number of occupants was assumed to be 30. Figure 9 shows the distribution of private buildings by number of occupants.
The cost to reconstruct a private building was assumed to be Nu 0.017 million per square meter.
4,84973%
180727%
0 Occupants30 Occupants
Figure 9. Distribution of Private Buildings, by Number of Occupants.
Community buildings
Community buildings represent 29 percent of the total number of exposed assets in Thimphu Thromde: 2,789 buildings. These community buildings cover a wide range of occupancy, from army quarters to toilets; the most common are army quarters with 690 assets, schools with 423 assets, and government offices with 365 assets (figure 10).
Two types of structural systems are used in community buildings: load-bearing and reinforced concrete movement-resistant frames. Figure 11 shows their distribution.
Buildings vary between one and three stories. Figure 12 shows the distribution of community buildings by number of stories.
Since information about occupancy was not available for all community buildings, structures with less than 50 square meters were assumed to be unoccupied; otherwise, the number of occupants was assumed to be 30. Figure 13 shows the distribution of community buildings by number of occupants.
The cost to reconstruct community buildings was assumed to be Nu 0.017 million per square meter.

32 3. Thimphu Exposure and Vulnerability Assessment
Seismic Risk Seismic Risk Assessment in Thimphu, Bhutan
1,67760%
1,11240%
IndustrialCommunity
Figure 11. Distribution of Community Buildings, by Type of Structure.
1,23744%
1736%
1,37950%
2 Stories3 Stories
1 Storey
Figure 12. Distribution of Community Buildings, by Number of Stories.
690
423
365
228
160
1068677
5946464545333230222019181717171515151412111110 7 7 7 6 5 5 5 4 4 3 3 3 3 3 2 2 2 2 2 2 1 1 1 1 1 1 1 10
100
200
300
400
500
600
700
800
Arm
y Q
uart
ers
Sch
ool
Gov
ernm
ent
Off
ice
Gov
Qua
rter
sR
esid
ence
Cha
njiji
Col
ony
Polic
e Fa
mily
Hos
pita
lD
oR C
olon
yR
ICB
Col
ony
Sam
zing
Fam
ilyM
inis
ters
Enc
lave
Sta
ff R
esid
ence
Polic
e O
ffice
rsQ
Arm
yOffi
cers
Qua
rH
utYD
FB
-Mob
ileB
PC S
ubst
atio
nA
ssem
bly
Bui
ldin
gB
PC C
olon
yO
ffic
eTo
uris
mC
rem
ator
ium
Fore
st F
amily
Line
Mar
ket
Labo
rCam
p C
ity
HM
Sec
reta
riat
Arc
hery
Sta
ndD
NP
Wat
er S
uppl
yCam
pB
PC O
ffice
Fire
Bri
gade
She
dTe
ndre
lTha
ngB
us G
arra
geEm
pori
umPo
lice
Sta
tion
Cen
ter
Jail
Mus
hroo
m C
entr
eD
AN
IDA
FCB
Geo
g C
ente
rK
uzu
FMTe
xtile
Mes
uem
Arc
hery
Fie
ldB
OB
Off
ice
BO
CB
OC
Offi
cePo
lice
Gar
rage
UN
DP
Off
ice
BC
CI
BD
FCL
BH
UJI
CA
Off
ice
Post
offic
eR
ICB
Offi
ceTo
ilet
Wat
er T
ank
Figure 10. Distribution of Community Buildings, by Type of Occupancy.
If so desired, it would be possible to separate schools, hospitals, or any other type of building according to its use because the exposure database includes this information. This report does not present the information
in this way due to the interests of the DDM and the Technical Working Groups. Nevertheless, this report does take into account the available characteristics of hospitals and school buildings.

3. Thimphu Exposure and Vulnerability Assessment 33
Seismic Risk Seismic Risk Assessment in Thimphu, Bhutan
1094%
672%
1024%
1,55256%
26710% 15
0%1
0%
54019%
1385%
202830
0
141518
59
Figure 13. Distribution of Community Buildings, by Number of Occupants.
45%1
1%
2226%
78%
11%
5059% Dzong
Hindu Temple
ChortenDangrim
LhakhangMani
Figure 14. Distribution of Religious Buildings, by Type.
8195%
45%
1 Storey2 Stories
Figure 15. Distribution of Religious Buildings, by Number of Stories.
5160%
45%
2035%
5 Occupants0 Occupants
50 Occupants
Figure 16. Distribution of Religious Buildings, by Number of Occupants.
Religious Buildings
Religious buildings represent only 1 percent of the total number of exposed assets in Thimphu Thromde: 85 buildings. Religious buildings were classified into six types:
1. Lhakhangs2. Hindu Temple3. Dzong4. Chorten5. Dangrim6. Mani
Figure 14 presents the distribution of religious buildings.
All religious buildings are considered to have load-bearing walls with one (Dzongs) or two (others) stories. Figure 15 presents the distribution of religious buildings, by number of stories.
Due to the lack of accurate information, in order to define the occupancy of each building, it was assumed that religious buildings do not have any inhabitants, except for Lhakhangs and Dzongs. Figure 16 shows the distribution of religious buildings by number of occupants.

34 3. Thimphu Exposure and Vulnerability Assessment
Seismic Risk Seismic Risk Assessment in Thimphu, Bhutan
The cost to replace a religious building was assumed to be Nu 0.0137 million for Dzong and Lhakhangs (load-bearing construction; DDM 2009).
For the four types of religious buildings identified, it was necessary to define the expected damage that structures
would sustain in the event of an earthquake. The SE_SISMO field mentioned at the beginning of this section contains information regarding the damage expected under different seismic intensities. These files, names, and information are described in the next section.
Future steps on exposure definitionGiven the lack of information needed to define precisely the structural type of each exposed element that appears in the land registry of the city, vulnerability curves were developed using an approximate method with limited structural engineering information.
This report classifies buildings as industrial, private, public (community), and religious. However, the database allows buildings to be classified in different ways—for example, as schools, hospitals, or offices—depending on the needs and focus of the institution carrying out the risk analysis.
Other types of classifications might be used, such as lifelines, bridges, and substation power plants, following the procedure presented in this document and including relevant information that helps to define the structural vulnerability.8
The typical buildings in Bhutan have large overhangs that create a much larger footprint if evaluated using satellite data, as was done in this project. For this reason and as result of this project, a new project will be carried out to improve the characteristics of the exposed assets by gathering data through fieldwork.
Introduction to seismic vulnerabilityVulnerability is defined as the predisposition of a system, element, component, group of people, or any other type of element to be affected by the action of a hazardous event. As such, vulnerability should be evaluated and assigned to each exposed asset and for each type of hazard considered.
Structural vulnerability means the damage or impact that a hazardous event will inflict on a specific asset. It is generally measured as an average percentage of damage
or the economic value required to repair the asset and restore it to its condition prior to the occurrence of the event.
Vulnerability is expressed in terms of “vulnerability functions.” These functions express the distribution of loss probabilities as a function of the intensity produced during a specific event. They are expressed as curves associating the value of expected damage and the standard deviation of the damage with the intensity.

3. Thimphu Exposure and Vulnerability Assessment 35
Seismic Risk Seismic Risk Assessment in Thimphu, Bhutan
For this project, the Vulnerability Working Group (VWG) was created with the participation of the Department of Engineering Services, coordinated by Mr. Sonam Yangdhen. Mr. Yangdhen was in charge of defining the
vulnerability curves required to compute the expected damage under seismic actions and to perform a probabilistic risk analysis.
TypologiesIn order to define the expected damage to any exposed assets, it is necessary to know the main characteristics that define their behavior. Because all exposed assets behave differently, having a vulnerability curve for each single asset would be ideal. However, due to limited time and information, this is not practical when performing a risk analysis for a whole region or city, like Thimphu Thromde. In these cases, an acceptable assumption is to create typologies of assets taking into account similar characteristics. For this reason, it was assumed that all buildings in Thimphu Thromde are made with load-bearing or reinforced concrete movement-resistant frames. The statistics presented in figure 17 are based on this assumption.
As shown on the figure, most of the buildings in Thimphu Thromde have reinforced concrete frames.
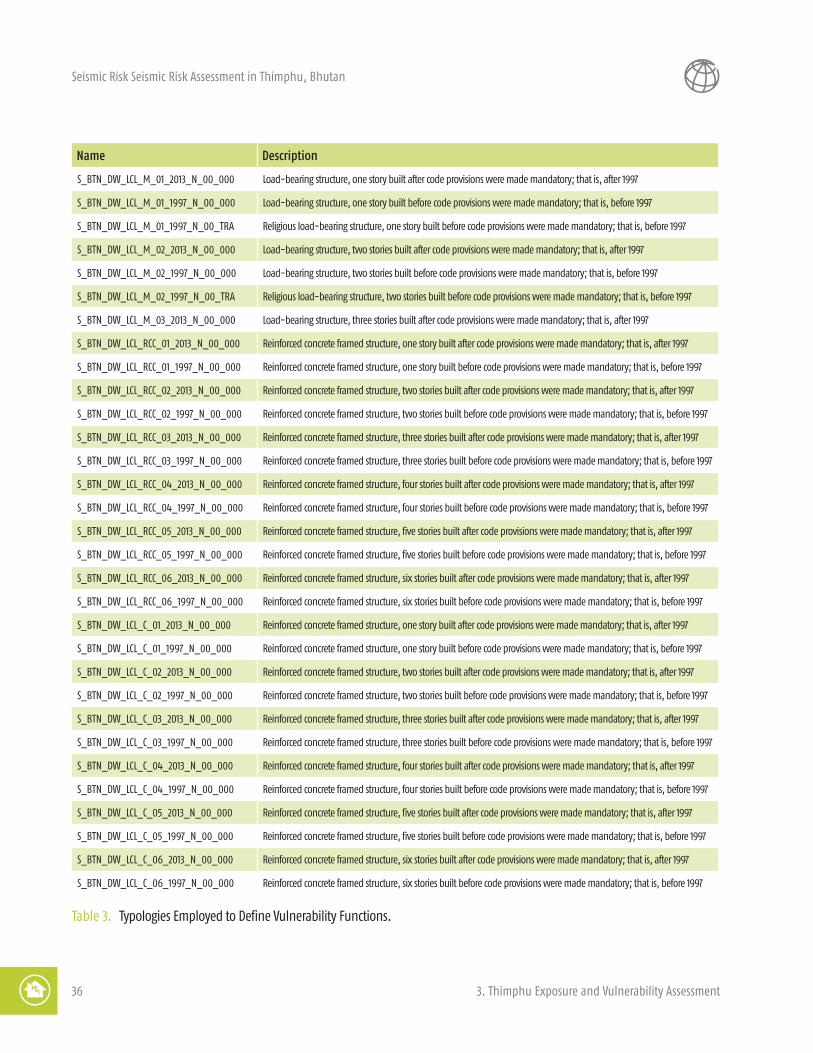
Furthermore, based on the information provided by the EWG, nine typologies were identified; 31 vulnerability functions were created to take into account the year
of construction, an important parameter for defining damage given different building codes in different periods. Table 3 presents the name of the vulnerability function and a description of the structural system.
8,36287%
1,19713%
RC FrameLoad Bearing
Figure 17. Distribution of Buildings, by Type of Structure.
36 3. Thimphu Exposure and Vulnerability Assessment
Seismic Risk Seismic Risk Assessment in Thimphu, Bhutan
Name Description
S_BTN_DW_LCL_M_01_2013_N_00_000 Load-bearing structure, one story built after code provisions were made mandatory; that is, after 1997
S_BTN_DW_LCL_M_01_1997_N_00_000 Load-bearing structure, one story built before code provisions were made mandatory; that is, before 1997
S_BTN_DW_LCL_M_01_1997_N_00_TRA Religious load-bearing structure, one story built before code provisions were made mandatory; that is, before 1997
S_BTN_DW_LCL_M_02_2013_N_00_000 Load-bearing structure, two stories built after code provisions were made mandatory; that is, after 1997
S_BTN_DW_LCL_M_02_1997_N_00_000 Load-bearing structure, two stories built before code provisions were made mandatory; that is, before 1997
S_BTN_DW_LCL_M_02_1997_N_00_TRA Religious load-bearing structure, two stories built before code provisions were made mandatory; that is, before 1997
S_BTN_DW_LCL_M_03_2013_N_00_000 Load-bearing structure, three stories built after code provisions were made mandatory; that is, after 1997
S_BTN_DW_LCL_RCC_01_2013_N_00_000 Reinforced concrete framed structure, one story built after code provisions were made mandatory; that is, after 1997
S_BTN_DW_LCL_RCC_01_1997_N_00_000 Reinforced concrete framed structure, one story built before code provisions were made mandatory; that is, before 1997
S_BTN_DW_LCL_RCC_02_2013_N_00_000 Reinforced concrete framed structure, two stories built after code provisions were made mandatory; that is, after 1997
S_BTN_DW_LCL_RCC_02_1997_N_00_000 Reinforced concrete framed structure, two stories built before code provisions were made mandatory; that is, before 1997
S_BTN_DW_LCL_RCC_03_2013_N_00_000 Reinforced concrete framed structure, three stories built after code provisions were made mandatory; that is, after 1997
S_BTN_DW_LCL_RCC_03_1997_N_00_000 Reinforced concrete framed structure, three stories built before code provisions were made mandatory; that is, before 1997
S_BTN_DW_LCL_RCC_04_2013_N_00_000 Reinforced concrete framed structure, four stories built after code provisions were made mandatory; that is, after 1997
S_BTN_DW_LCL_RCC_04_1997_N_00_000 Reinforced concrete framed structure, four stories built before code provisions were made mandatory; that is, before 1997
S_BTN_DW_LCL_RCC_05_2013_N_00_000 Reinforced concrete framed structure, five stories built after code provisions were made mandatory; that is, after 1997
S_BTN_DW_LCL_RCC_05_1997_N_00_000 Reinforced concrete framed structure, five stories built before code provisions were made mandatory; that is, before 1997
S_BTN_DW_LCL_RCC_06_2013_N_00_000 Reinforced concrete framed structure, six stories built after code provisions were made mandatory; that is, after 1997
S_BTN_DW_LCL_RCC_06_1997_N_00_000 Reinforced concrete framed structure, six stories built before code provisions were made mandatory; that is, before 1997
S_BTN_DW_LCL_C_01_2013_N_00_000 Reinforced concrete framed structure, one story built after code provisions were made mandatory; that is, after 1997
S_BTN_DW_LCL_C_01_1997_N_00_000 Reinforced concrete framed structure, one story built before code provisions were made mandatory; that is, before 1997
S_BTN_DW_LCL_C_02_2013_N_00_000 Reinforced concrete framed structure, two stories built after code provisions were made mandatory; that is, after 1997
S_BTN_DW_LCL_C_02_1997_N_00_000 Reinforced concrete framed structure, two stories built before code provisions were made mandatory; that is, before 1997
S_BTN_DW_LCL_C_03_2013_N_00_000 Reinforced concrete framed structure, three stories built after code provisions were made mandatory; that is, after 1997
S_BTN_DW_LCL_C_03_1997_N_00_000 Reinforced concrete framed structure, three stories built before code provisions were made mandatory; that is, before 1997
S_BTN_DW_LCL_C_04_2013_N_00_000 Reinforced concrete framed structure, four stories built after code provisions were made mandatory; that is, after 1997
S_BTN_DW_LCL_C_04_1997_N_00_000 Reinforced concrete framed structure, four stories built before code provisions were made mandatory; that is, before 1997
S_BTN_DW_LCL_C_05_2013_N_00_000 Reinforced concrete framed structure, five stories built after code provisions were made mandatory; that is, after 1997
S_BTN_DW_LCL_C_05_1997_N_00_000 Reinforced concrete framed structure, five stories built before code provisions were made mandatory; that is, before 1997
S_BTN_DW_LCL_C_06_2013_N_00_000 Reinforced concrete framed structure, six stories built after code provisions were made mandatory; that is, after 1997
S_BTN_DW_LCL_C_06_1997_N_00_000 Reinforced concrete framed structure, six stories built before code provisions were made mandatory; that is, before 1997
Table 3. Typologies Employed to Define Vulnerability Functions.
3. Thimphu Exposure and Vulnerability Assessment 37
Seismic Risk Seismic Risk Assessment in Thimphu, Bhutan
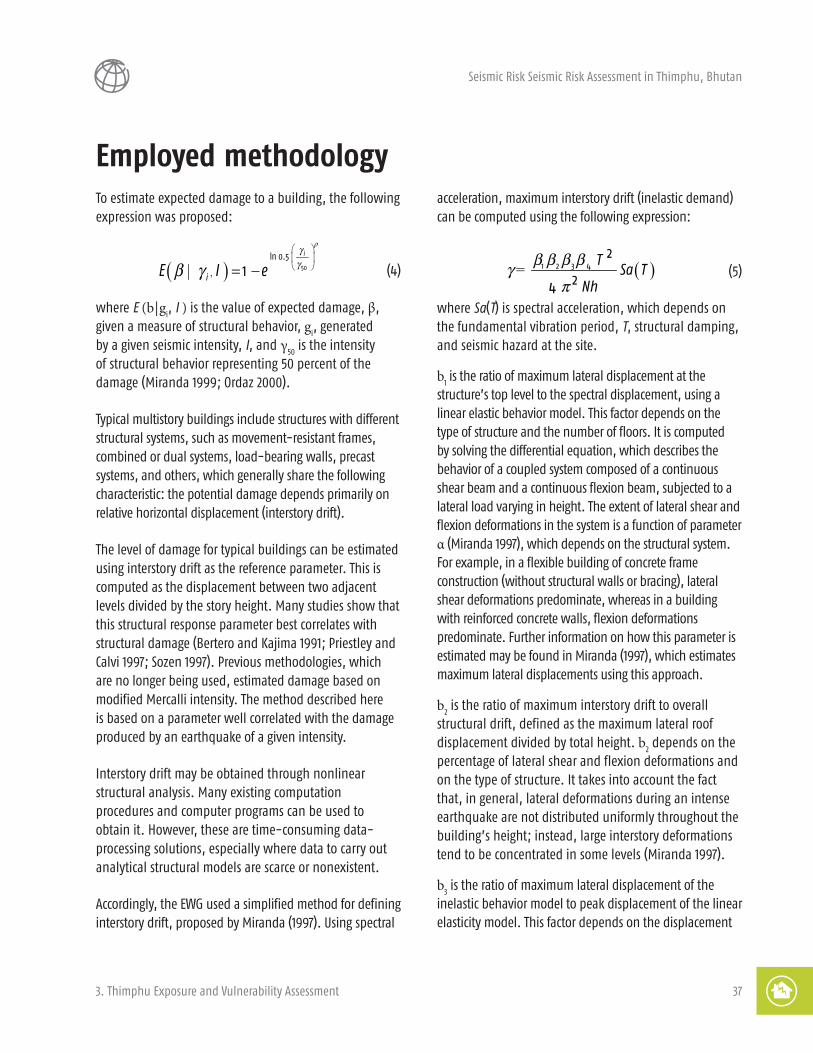
Employed methodologyTo estimate expected damage to a building, the following expression was proposed:
( ) 50
ln 0.5
,| 1i
iE I e
rggb g
= − (4)
where E (b | gi, I ) is the value of expected damage, β,
given a measure of structural behavior, gi, generated
by a given seismic intensity, I, and γ50
is the intensity of structural behavior representing 50 percent of the damage (Miranda 1999; Ordaz 2000).
Typical multistory buildings include structures with different structural systems, such as movement-resistant frames, combined or dual systems, load-bearing walls, precast systems, and others, which generally share the following characteristic: the potential damage depends primarily on relative horizontal displacement (interstory drift).
The level of damage for typical buildings can be estimated using interstory drift as the reference parameter. This is computed as the displacement between two adjacent levels divided by the story height. Many studies show that this structural response parameter best correlates with structural damage (Bertero and Kajima 1991; Priestley and Calvi 1997; Sozen 1997). Previous methodologies, which are no longer being used, estimated damage based on modified Mercalli intensity. The method described here is based on a parameter well correlated with the damage produced by an earthquake of a given intensity.
Interstory drift may be obtained through nonlinear structural analysis. Many existing computation procedures and computer programs can be used to obtain it. However, these are time-consuming data-processing solutions, especially where data to carry out analytical structural models are scarce or nonexistent.
Accordingly, the EWG used a simplified method for defining interstory drift, proposed by Miranda (1997). Using spectral
acceleration, maximum interstory drift (inelastic demand) can be computed using the following expression:
( )1 2 3 42 =
24
TSa T
Nh
b b b bgp
(5)
where Sa(T) is spectral acceleration, which depends on the fundamental vibration period, T, structural damping, and seismic hazard at the site.
b1 is the ratio of maximum lateral displacement at the
structure’s top level to the spectral displacement, using a linear elastic behavior model. This factor depends on the type of structure and the number of floors. It is computed by solving the differential equation, which describes the behavior of a coupled system composed of a continuous shear beam and a continuous flexion beam, subjected to a lateral load varying in height. The extent of lateral shear and flexion deformations in the system is a function of parameter α (Miranda 1997), which depends on the structural system. For example, in a flexible building of concrete frame construction (without structural walls or bracing), lateral shear deformations predominate, whereas in a building with reinforced concrete walls, flexion deformations predominate. Further information on how this parameter is estimated may be found in Miranda (1997), which estimates maximum lateral displacements using this approach.
b2 is the ratio of maximum interstory drift to overall
structural drift, defined as the maximum lateral roof displacement divided by total height. b
2 depends on the
percentage of lateral shear and flexion deformations and on the type of structure. It takes into account the fact that, in general, lateral deformations during an intense earthquake are not distributed uniformly throughout the building’s height; instead, large interstory deformations tend to be concentrated in some levels (Miranda 1997).
b3 is the ratio of maximum lateral displacement of the
inelastic behavior model to peak displacement of the linear elasticity model. This factor depends on the displacement

38 3. Thimphu Exposure and Vulnerability Assessment
Seismic Risk Seismic Risk Assessment in Thimphu, Bhutan
ductility demand, the fundamental vibration period of the structure, and the type of soil supporting it. It is calculated with functions calibrated using statistical studies of ratios of the maximum lateral displacement of single degree-of-freedom oscillators to inelastic behavior and their elastic behavior counterparts. These calibrations are made for oscillators subjected to hundreds of accelerograms recorded in different types of soil in more than 25 earthquakes occurring worldwide. For structures on soft soil, b
3
depends not only on the fundamental vibration period of the structure but also on the ratio between it and the predominant ground vibration period (Miranda 1991, 1993, 1997). The overall ductility demand of the structure is estimated using the spectral acceleration associated
with its vibration period, its resistance to lateral loads, and the applied load reduction factor. The structure’s lateral resistance depends on its location and age, so that structures may be classified in terms of building regulations and codes in force at the time of construction.
β4 is the ratio of elastic to inelastic b
2 factors. This factor
takes into account the difference between the elasticity and inelasticity models regarding the distribution of lateral load with height. In the case of inelastic behavior, stress is highly concentrated. This factor depends on the number of stories and the level of inelastic deformation of the structure, measured in terms of displacement ductility demand (Miranda 1997).
ResultsBy applying this methodology, vulnerability curves were obtained for each identified typology. Figure 18 shows a vulnerability curve and its associated standard deviation for a two-story reinforced concrete frame structure built before 1997.
In order to show the importance of considering the year of construction in the assessment of the expected damage to any exposed asset, figure 19 compares two vulnerability curves for the same structural system (two-story reinforced concrete frame): one built before 1997, the year in which seismic building codes were published in Bhutan, and one built after 1997.
Although vulnerability curves were obtained for two different seismic provisions, it was not possible to assign
those vulnerability curves to structures built after 1997 because the year of construction was not known for all of the exposed assets.
Furthermore, it is important to show the importance of taking into account the characteristics that define their structural behavior. Figure 20 compares vulnerability curves for different construction materials (reinforced concrete and masonry) and different years of construction (before and after 1997), but the same number of stories.
Finally, figure 21 shows vulnerability curves for the same structural system and the same construction materials, but a different number of stories.
Future stepsThe methodology employed to obtain the vulnerability curves is a simplified methodology. The information obtained is considered to be of acceptable quality for assessing risk, but the VWG decided to make some improvements in the near future.
Due to the lack of information, several assumptions were made based on conditions in other countries.
Future work will be oriented to defining parameter values based on local conditions.
Furthermore, if additional information is obtained about the mechanical and geometric properties of the exposed assets, it will be possible to conduct more accurate analysis, such as pushover or incremental dynamic analysis, to define vulnerability curves.

3. Thimphu Exposure and Vulnerability Assessment 39
Seismic Risk Seismic Risk Assessment in Thimphu, Bhutan
0
0 .1
0 .2
0 .3
0 .4
0 .5
0 .6
0 .7
0 .8
0 .9
1
0 5 1 0 1 5 2 0 2 5
Loss
es
Sa (m/s2)
Figure 18. Expected Damage E(b|I) and Standard Deviation s(b | I) for Two-Story Reinforced Concrete Frame Structures
0
0 .1
0 .2
0 .3
0 .4
0 .5
0 .6
0 .7
0 .8
0 .9
1
0 5 1 0 1 5 2 0 2 5
Loss
es
Sa (m/s2)
Figure 19. Expected Damage for Two-Story Reinforced Concrete Frame Structures Built in Different Years.
0
0 .1
0 .2
0 .3
0 .4
0 .5
0 .6
0 .7
0 .8
0 .9
1
0 2 4 6 8 1 0 1 2 1 4
Loss
es
Int ensit y (m/s2)
Figure 20. Expected Damage for Two-Story Structures Built in Different Years Employing Different Construction Materials.

Seismic Risk Seismic Risk Assessment in Thimphu, Bhutan
0 .0
0 .1
0 .2
0 .3
0 .4
0 .5
0 .6
0 .7
0 .8
0 .9
1 .0
0 5 1 0 1 5 2 0 2 5
Loss
Sa [m/s2]
1 storey
2 storey
3 Storeys
4 Storeys
5 Storeys
6 Storeys
Figure 21. Expected Damage for Reinforced Concrete Structures, by Number of Stories.

Seismic Risk Assessment in Thimphu, Bhutan
Thimphu Risk Assessment
4

42 4. Thimphu Risk Assessment
Seismic Risk Seismic Risk Assessment in Thimphu, Bhutan
Seismic risk methodologyProbabilistic risk analysis is a technique that deals with the uncertainty of the occurrence of disasters and allows risk to be expressed in terms of known metrics such as annual expected average loss, losses for a given event, and maximum expected loss, among others. This is different from traditional approaches that present risk in terms of high, medium, and low values, which are subjective measures in which the analyst determines the thresholds.
These traditional approaches have little use in decision making.
One important issue that must be considered when conducting a probabilistic analysis is how the results will be presented. In what follows, two important measures are described: the average annual loss and the exceedance probability curve.
Expected annual lossFrom the mathematical point of view, the expected annual loss (EAL) of any asset can be assessed as the sum of all possible expected losses weighted with the normalized rate of exceedance. To estimate the expected annual loss, the physical value of any construction is weighted for the probability that damage will occur at a given hazard intensity:
( ) ( )iEAL E Loss f i di∞
−∞
= ∫ (6)
where E(Lossi) is the expected loss that an event i
produces on the building with an annual frequency of occurrence f(i).
Accepting that seismic hazard is defined by NE events that are collectively exhaustive and mutually exclusive, its EAL can be estimated with the following expression:
( ) ( )1
NE
ii
EAL E Loss f i di=
=∑ (7)
Probable maximum lossThe probable maximum loss (PML) represents the losses that can be exceeded in a certain period of time. This curve provides information on losses assuming one or more occurrences in a year. The computation of the PML is based on the exceedance rate of losses, a parameter that defines with precision the total amount of expected losses as follows:
( ) ( ) ( )PrEN
l L l i f i= >∑1i=
(8)
where ν(l) is the exceedance rate of an established loss, l, due the occurrence of the i th event generating losses, L, weighted for the annual frequency of occurrence of this event, and EN, is the total number of considered events that define the seismic hazard. Generally, the PML is defined for a specific return period (the inverse of the exceedance rate).

4. Thimphu Risk Assessment 43
Seismic Risk Seismic Risk Assessment in Thimphu, Bhutan
Analysis of resultsAfter running CAPRA, the risk results (losses and their distribution) can be obtained for the whole seismic environment or for a specific event. The following maps present the results.
Average annual lossTo compute the average annual loss (AAL), 7,416 seismic stochastic events were taken into account, and the obtained losses were weighted for the annual frequency of occurrence of each event, as presented in equation 6.
Map 14 shows the distribution of the AAL in Thimphu Thromde. As this map shows, the expected damage in any given year is quite low, as evidenced by the yellow-colored buildings.
a) Thimphu Thromde b) Downtown
Map 14. Distribution of AAL in Thimphu Thromde.
This information will help decision makers to devise action plans for managing risk and to analyze costs and benefits for justifying risk reduction measures.

44 4. Thimphu Risk Assessment
Seismic Risk Seismic Risk Assessment in Thimphu, Bhutan
Expected loss due to specific eventsIn some cases, knowing the expected damage over a year is not enough. For plans oriented to civil protection, it is crucial to have information about damages caused by specific events. This information can be obtained by running CAPRA for a single event. This type of analysis was performed during the final mission in Thimphu Thromde. Figure 22 shows a CAPRA window in which a seismic event of magnitude 8.12 affects Thimphu Thromde. This event is centered far (more than 300 kilometers) from the location of the exposed assets.
Results of this analysis are shown in map 15. Even if the magnitude of the event is very large, the damages incurred will be small. The main reason for this finding is the location of the seismic event.
On the contrary, more destructive effects can be expected if an earthquake of a smaller magnitude occurs closer to the studied region. To examine this situation, damages to exposed assets were computed for a hypothetical event with a magnitude of 5.18 occurring closer to Thimphu Thromde (figure 23).
Results of this analysis are presented in map 16, which shows that some structures sustain considerable damage. The main reason of this finding is the location of the seismic event.
Figure 22. A Magnitude 8.12 Stochastic Seismic Event Occurring Far from Thimphu Thromde.

4. Thimphu Risk Assessment 45
Seismic Risk Seismic Risk Assessment in Thimphu, Bhutan
a) Thimphu Thromde b) Downtown
Map 15. Expected Damage from a Magnitude 8.12 Earthquake Occurring Far from Thimphu Thromde.
Figure 23. A Magnitude 5.18 Stochastic Seismic Event Occurring Near to Thimphu Thromde.

46 4. Thimphu Risk Assessment
Seismic Risk Seismic Risk Assessment in Thimphu, Bhutan
a) Thimphu Thromde b) Downtown
Map 16. Expected Damage from a Magnitude 5.18 Earthquake Occurring Near to Thimphu Thromde.
Next steps: Future applications of CAPRA Based on experiences observed around the world and particularly in Bhutan, the following uses of CAPRA are suggeste.
Estimate contingent liabilities associated with natural disasters Natural disasters can create major contingent liabilities for the government budget, and integrating these contingent liabilities in fiscal risk assessments is the first step in developing effective and sustainable plans for dealing with the potential costs of disasters. Analysis of post-disaster budget allocation over time can convey a good sense of the recurrent liabilities that governments incur due to natural disasters, but it does not capture
potential losses from low-frequency, high-impact events.
Advanced probabilistic risk modeling techniques can help
to assess the potential for major losses in a given territory.
Develop financial protection strategiesAs a fundamental element of a comprehensive risk
management strategy, financial protection helps
governments to mobilize resources in the immediate

4. Thimphu Risk Assessment 47
Seismic Risk Seismic Risk Assessment in Thimphu, Bhutan
aftermath of a disaster, while creating a buffer against the long-term fiscal impact of disasters. Integrated disaster risk financing strategies allow countries to strengthen their financial capacity to respond in the aftermath of a disaster and to reduce the economic and fiscal burden of natural disasters. Governments should develop a comprehensive strategy for financing disaster risks, building on a bottom-up three-tier approach to prepare for and protect against the financial and fiscal impacts of different layers of risk.
Governments need to have access to tools for designing and implementing disaster risk financing. Insurance strategies for natural hazards are needed to equip decision makers with information on cost-efficient strategies, including financing and transferring risk, and to leverage the private sector through public-private partnerships. The development of the financial infrastructure required for disaster risk financing should be considered a priority around the world.
Leverage the private sectorReliable and transparent information about hazards and probable losses is indispensable for supporting the functioning of insurance markets and for crowding in the private sector. For example, the availability of reliable and transparent risk information and risk assessment methodologies can enable governments to access international financial markets and to strengthen sovereign disaster risk financing mechanisms.
Promote sustainable and cost-effective catastrophe risk insurance marketsRisk data are crucial to support the establishment and servicing of insurance markets for catastrophic
risk to property. Accurate risk assessments enable sustainable and cost-effective insurance markets (for both public and private assets) through actions such as sound rate making, efficient management of catastrophe risk exposure by insurers, and an appropriate regulatory and supervisory framework. Moreover, the availability of accurate data is crucial for servicing insurance markets—for example, to enable cost-efficient loss adjustment following adverse events. Catastrophe insurance markets can also play a crucial role in mitigating risks for individuals in advanced economies through risk-based pricing, lower premiums, and independent certifications.
Strengthen local cooperationStrengthening coordination among relevant agencies is crucial in Bhutan because of the country’s weak technical capacity in terms of both human resources and facilities. Coordination between the DMD and other agencies is needed to align their mandates with regard to assessing, managing, and responding to risk.
Strengthen international cooperationRegional collaboration can be a crucial step for more effective disaster risk financing due to the transboundary nature of many catastrophic perils and the opportunities to pool risk through cost-effective insurance solutions. Moreover, international cooperation is needed to increase the availability of technical expertise—for example, by establishing technical bodies within political platforms and building capacity in developing countries.


Seismic Risk Assessment in Thimphu, Bhutan5
Conclusions and recommendations

50 5. Conclusions and recommendations
Seismic Risk Seismic Risk Assessment in Thimphu, Bhutan
The technical assistance project was carried out in Bhutan to give institutions an idea of the information required and an understanding of how to use the CAPRA platform to assess risk.
Because hazard results employed in this project are preliminary, it will be necessary to run the CAPRA software again once the final data become available. This will paint a more realistic picture of the seismic environment and provide a more realistic idea of the expected damage and losses that this hazard can produce in Thimphu Thromde.
Although important information on exposed assets is available and of relatively good-quality resolution, it is essential for the Exposure Working Group and the DMD to collect more information regarding the characteristics of structural components, such as age of construction, building code irregularities, and others. Having this information will help to reduce uncertainties regarding the behavior of structures in seismic events of different magnitudes.
During the development of this project, limited local capacity to conduct structural vulnerability analysis emerged as a key constraint to the long-term development of reliable information on disaster risk. The government of Bhutan has initiated a program in partnership with Geo-Hazards International and the World Bank / Global Facility for Disaster Reduction and Recovery to build the capacity of Bhutanese engineers in structural vulnerability assessment. The methodology and checklists developed under this program are being used to carry out a national vulnerability assessment with support from a Policy and Human Resources Development grant for improving resilience to seismic risk in Bhutan.
The number of applications that can be obtained from the results is proportional to the quality and resolution of the information used. To achieve good-quality
and high-resolution data, a multidisciplinary effort is necessary. However, to take advantage of the results, staff involved in risk assessment will need to have a deep knowledge of risk analysis and to understand the different parameters used to express risk, such as average annual loss, probable maximum loss, occurrence exceedance probability of loss, aggregate exceedance probability of loss, pure premium, and tail value at risk, among others. They will also need to understand how these parameters can be applied to risk management. For this reason, it is highly recommended that all of the participants in this project receive training on obtaining and applying the most important parameters to create action plans oriented to mitigate risk.
Risk is dynamic, and it is necessary to continue improving the data used to assess risk. This activity requires an important interaction between the various working groups and the DMD. Coordination between institutions was essential during this project, and ongoing coordination between the DMD and other institutions is needed. To manage risk as an integral part of public policies and their implementation, this coordination will have to be mainstreamed and institutionalized.
Understanding risks and losses will help to move the government away from simply reacting to disasters and toward preventing damage from them. Focusing on prevention will foster a sense of security among the population and reduce the loss of life and property.
We offer the following recommendations for improving Bhutan’s ability to manage risk.
First, encourage departments to adopt decision making based on risk information. In order to institutionalize the use of disaster risk financing and integrate natural disasters in fiscal risk assessments, it is important to establish a department dedicated to assessing fiscal
5. Conclusions and recommendations 51
Seismic Risk Seismic Risk Assessment in Thimphu, Bhutan
risks within the Ministry of Finance or some other government agency. This could be in the form of a risk unit or a chief risk officer with an appropriate team to ensure coordination across units and provide due attention to this agenda.
Second, improve coordination mechanisms among institutions. To do so, the national government needs to define common policies together with the institutions charged with studying natural phenomena (Department of Geology and Mines in this case), the institutions that have records of different infrastructure at different levels—local (Thimphu Thromde agency), regional, and national (National Land Commission and National Statistics Bureau)—and civil engineers charged with analyzing the performance of infrastructure under different hazard intensities (Department of Engineering Services).
Third, identify the activities that are required to assess risk and the institutions that have the information or capabilities to do it. This would allow risk managers to consider the risk to buildings and other types of infrastructure, not only in Thimphu Thromde but also in the whole country.
Decision makers need to have a deep understanding of risk parameters. For this reason, it is recommended that people dealing with risk management be trained to obtain and apply different risk parameters. This training would help them to collect more accurate and higher-resolution information and to use it effectively to achieve more accurate results.

REFERENCESAkkar, S., and J. J. Bommer. 2010. “Empirical Equations for the Prediction of PGA, PGV, and Spectral Accelerations in Europe, the
Mediterranean Region, and the Middle East.” Seismological Research Letters 81: 195–206.
Bertero, V., and K. K. Kajima. 1991. “Design Guidelines for Ductility and Drift Limits: Review of State-of-the-Practice and State-of-the-Art in Ductility and Drift-Based Earthquake-Resistant Design of Buildings.” Report UCB/EERC-91/15, University of California at Berkeley, Earthquake Engineering Research Center.
DDM (Department of Disaster Management). 2009. Risk Assessment Report. Ministry of Home and Cultural Affairs.
Grujic, D., L. Hollister, and R. Parrish. 2002. “Himalayan Metamorphic Sequence as an Orogenic Channel: Insight from Bhutan.” Earth and Planetary Science Letters 198: 177–91.
Kayal, J. R. 2007. Microearthquake Seismology and Seismotectonics of South Asia. New Delhi: Capital Publishers.
McGuire, R. K. 2008. “Probabilistic Seismic Hazard Analysis: Early History.” Earthquake Engineering and Structural Dynamics 37 (3): 329–38.
Miranda, E. 1991. Seismic Evaluation and Upgrading of Existing Buildings. Ph.D. thesis, University of California, Berkeley.
———. 1993. “Evaluation of Site-Dependent Inelastic Seismic Design Spectra.” Journal of Structural Engineering 5 (119): 1319–38.
———. 1997. “Estimation of Maximum Interstory Drift Demands in Displacement-Based Design.” In Seismic Design Methodologies for the Next Generation of Codes, edited by P. Fajfar and H. Krawinkler, 253–64. Rotterdam: Balkema.
———. 1999. “Approximate Seismic Lateral Deformation Demands in Multistory Buildings.” Journal of Structural Engineering 4 (125): 417–25.
Ordaz, M. 2000. “Seismic Risk Assessment Methodology Focused on Earthquake Insurance Management.” UNAM, Mexico.
Ordaz, M., A. Aguilar, and J. Arboleda. 2007. “CRISIS2007—V. 6.4: Program for Computing Seismic Hazard.” UNAM, Instituto de Ingeniería, Mexico.
Priestley, M. J. N., and G. M. Calvi. 1997. “Concepts and Procedures for Direct Displacement-Based Design.” In Seismic Design Methodologies for the Next Generation of Codes, edited by P. Fajfar and H. Krawinkler, 171–81. Rotterdam: Balkema.
Sozen, M. A. 1997. “Drift-Driven Design for Earthquake Resistance of Reinforced Concrete.” In Proceedings of the EERC-CUREe, Symposium in Honour of Vitelmo V. Bertero. Berkeley, CA, January.


