seismic vulnerability analysis of various types...
TRANSCRIPT

SEISMIC VULNERABILITY ANALYSIS OF VARIOUS TYPES OF DAMS
WITH FINITE ELEMENT METHODS
EHSAN NOROOZINEJAD FARSANGI
A project report submitted in partial fulfillment of the requirements for the award of the degree of
Master of Engineering (Civil-Structure)
Faculty of Civil Engineering Universiti Teknologi Malaysia
JUNE 2010

iii
Especially Dedicated To My Beloved Father And Mother For Their Endless Love And Support

iv
ACKNOWLEDGEMENTS
I would like to express my sincere appreciation to my supervisor, Professor Dr.
Azlan Adnan for his encouragement, guidance, critics, friendship and help during the
development of this project report.
The author wishes to thank Mr. Meldi Suhatril, for his helpful guidance.
Last but not least, the author would like to express his deepest gratitude to his parents
for their understanding and love.

v
ABSTARCT
In recent years, the seismic verification of structures has dramatically
evolved. Malaysia is surrounded by countries such as Indonesia and Philippine that
has experienced many great earthquakes; hence it would be unwise to totally ignore
the effects of earthquakes on structures in Malaysia.
The purpose of this study is to investigate the vulnerability of existing Dams
in Malaysia region under earthquake ground motion because In case of severe
ground motions, substantial cracking is likely to develop across significant regions of
the dam, and its consequences must be taken into account for a rigorous seismic
evaluation. By evaluating the seismic performance of the dams we can predict dam’s
resistance to prevent economic damage and loss of human life in case of dam failure.
In this study we present the results of the case studies of the earthquake response on
various types of dams (Concrete, Rockfill and Earthfill Dams). To achieve this
purpose, dams have been remodeled using SAP2000 and PLAXIS. Three different
analysis methods (Free Vibration, Time History and Response Spectrum) have been
implemented in this Project to study the behavior of these dams under earthquake
loading, Seismic hazard was represented by the peak ground acceleration at the dam
site.
After analyzing the dams in SAP2000 and PLAXIS we will compare the
existing stress from the output data with dams’ capacity to identify the critical parts
of the dams under earthquake loading. This problem can be efficiently tackled with
necessary boundary conditions with finite element technique. The dams considered
in the present investigation, are analyzed by two dimensional plane strain
formulations with four node quadrilateral elements in SAP2000 and 15-noded
triangular elements in PLAXIS. We have done the response spectrum and linear time
history analysis by using SAP2000 and Non-linear dynamic analysis by means of
PLAXIS. Both softwares have included soil-structure interaction in analysis.
vi
ABSTRAK
Dalam beberapa tahun terakhir, pengesahan seismik struktur telah berkembang
secara dramatik. Malaysia dikelilingi oleh negara-negara seperti Indonesia dan
Filipina yang telah mengalami banyak gempa bumi; maka tidak bijaksana untuk
sama sekali mengabaikan kesan daripada gempa pada struktur di Malaysia.
Tujuan kajian ini adalah untuk mengkaji ketahanan empangan yang ada di Malaysia
yang dipengaruhi gerakan tanah oleh gempa. Dalam kes gerakan tanah yang kuat,
besar kemungkinan keretakan di kawasan penting, dan kemungkinan yang harus
diambil kira untuk penilaian sismik yang ketat. Dengan menilai prestasi sismik,
anggaran perlawanan rintangan untuk mengelakkan kerosakan ekonomi dan
kehilangan nyawa manusia dalam hal kegagalan empangan. Dalam kajian ini, hasil
kajian kes dari gempa pada pelbagai jenis empangan (konkrit, batuan dan tanah)
dibentangkan. Untuk mencapai matlamat ini, empangan telah di analisa dengan
menggunakan SAP2000 dan PLAXIS. Tiga kaedah analisis yang berbeza (Bebas
Getaran, Perubahan Masa dan Respon Spektrum) telah dilaksanakan dalam tugas
untuk mempelajari perilaku empangan, risiko gempa yang diwakili oleh percepatan
tanah maksimum di lokasi empangan.
Setelah menganalisis empangan di SAP2000 dan PLAXIS perbandingan tegasan
yang ada dari data keluaran dibuat dengan kapasiti empangan untuk mengenalpasti
bahagian kritis dari empangan yang dibebani dengan gempa. Masalah ini dapat
diatasi dengan memerhati keadaan had yang diperlukan dengan teknik unsur
terhingga. Empangan-empangan yang dipertimbangkan dalam penyelidikan ini,
dianalisis oleh dua formulasi dimensi iaitu satah terikan dengan empat nod dan
elemen segiempat di SAP2000 dan unsur-15 segitiga nod di PLAXIS. Kami telah
melakukan analisis spektrum respon dan analisi perubahan masa secara linar dengan
menggunakan SAP2000 dan analisis tidak linar dinamik dengan menggunakan
PLAXIS. Kedua-dua perisian telah memasukkan interaksi tanah-struktur dalam
analisis.

vii
TABLE OF CONTENTS
CHAPTER TITLE PAGE
DECLARATION ii
DEDICATION iii
ACKNOWLEDGEMENTS iv
ABSTRACT v
ABSTRAK vi
TABLE OF CONTENTS vii
LIST OF TABLES xi
LIST OF FIGURES xiv
LIST OF APPENDICES xxiv
LIST OF SYMBOLS xxv
1 INTRODUCTION 1
1.1 Introduction 1
1.2 Problem Statement 2
1.3 Objectives 4
1.4 Scope of the Study 4
2 THEORETICAL BACKGROUND 6
2.1 Classification of Dams 6
2.1.1 Embankment Dam Types And Characteristics 6
2.1.2 Various types of concrete dam 10
2.2 Natural Periods Vibration of Dams 12
viii
2.3 Damping Ratio in Dams 13
2.4 Loads on Dams 14
2.5 Hydrodynamic Pressure 15
2.6 Seismicity and seismic load effects on Dams 16
2.7 Modeling Of Seismic Response (Shaking Table) 18
2.7.1 Shake Table Experiments 18
2.8 Classification of Seismic Analysis Methods 19
2.8.1 Response Spectrum Method 19
2.8.2 Dynamic Time History Analysis (TH ) 20
2.8.3 Free Vibration 21
2.9 Soil-Structure Interaction 22
2.10 SAP 2000 Program 23
2.11 PLAXIS Program 24
2.12 Vulnerability Analysis 24
2.13 Plane Strain Theory 25
2.14 Finite Element Method 26
2.15 Elements Type 27
2.16 Non-Linear Analysis 28
2.16.1 Material Non-Linearity 29
2.16.1.1 Modified Drucker-Prager Cap model 29
2.16.1.2 Mohr - Coulomb Model 30
2.16.2 Geometric Non-Linearity 34
2.17 Resonance Phenomenon in Structures (Dams) 35
2.17.1 Fast Fourier Transform (FFT) 36
3 LITERATURE REVIEW 38
3.1 Previous Dams Seismic Response Studies 38
3.2 Failure of Earthfill Dams due to Earthquake 45

ix
3.2.1 Sliding failure 46
3.2.2 Liquefaction failure 46
3.2.3 Longitudinal cracks 47
3.2.4 Transverse cracks 48
3.2.5 Embankment And Foundation Piping 49
3.2.6 Seepage 50
3.3 Simplified Time History Analysis 50
3.4 Modal Analysis and Dam Vibration Mode Frequencies With and Without Supports
51
3.5 Modeling of Aged Concrete Dams 53
3.6 USACE Guidelines for Time History Analysis of
Dams
54
3.6.1 Parameters in USACE method 56
3.7 Analysis of Gravity Dams and Foundation 57
3.7.1 The Massless Foundation Approximation 58
4 METHODOLOFY 59
4.1 Introduction and Methodology Flowchart 59
4.1.1 Penang - Ayer Itam Dam 61
4.1.2 Johor - Labong Dam 65
4.1.3 Kuala Lampur Batu Dam 69
4.1.4 Pahang - Jor Dam 74
4.1.5 Sarawak Batang Ai Dam 79
4.1.6 Sabah-Babagon Dam 83
4.1.7 Terengganu - Kenyir Dam 87
4.1.8 Perak - Chenderoh Dam 92
4.1.9 Material Properties 97
4.1.10 Material Nonlinearity (PLAXIS) 98
x
4.1.10.1 Modified Drucker-Prager Cap Model 98
4.1.10.2 Mohr - Coulomb model (MC) 99
4.1.11 Time-History Analysis 101
4.1.12 Response Spectrum Analysis 102
5 RESULTS & DISCUSSIONS 103
5.1 Free Vibration Analysis Results 103
5.2 PLAXIS and SAP2000 Results 107
5.2.1 Earthfill (Case1: Jor Dam) 109
5.2.2 Rockfill (Case1: Batang-Ai Dam) 114
5.2.3 Concrete (Case1: Chenderoh Dam) 119
5.3 Summary Of The Results 124
6 CONCLUSIONS & RECOMMENDATIONS 127
6.1 Conclusions 127
6.2 Recommendations 128
REFERENCES 129
APPENDIX A: RESULTS FOR OTHER DAMS 135
A.1 Earthfill (Case2: Ayer Itam Dam) 136
A.2 Earthfill (Case3: Labong Dam) 141
A.3 Earthfill (Case4: Batu Dam) 146
A.4 Rockfill (Case2: Babagon Dam) 151
A.5 Rockfill (Case3: Kenyir Dam) 156

xi
LIST OF TABLES
TABLE NO. TITLE PAGE
3.1 Selective Results of Dam-Foundation Analysis 57
3.2 Selective Results of Dam with Massless Foundation Analysis
58
4.1 Table of significant nodes(Ayer Itam Dam) 62
4.2 FE Software Used, Type of Elements and Total No. of Elements in Model(Ayer Itam Dam)
63
4.3 Modal Analysis Results (Ayer Itam Dam) 64
4.4 Table of significant nodes(Labong dam) 66
4.5 FE Software Used, Type of Elements and Total No. of Elements in Model(Labong dam)
67
4.6 Modal Analysis Results (Labong Dam) 68
4.7 Table of significant nodes(Batu dam) 71
4.8 FE Software Used, Type of Elements and Total No. of Elements in Model(Batu dam)
72
4.9 Modal Analysis Results (Batu dam) 73
4.10 Table of significant nodes(Jor dam) 76
4.11 FE Software Used, Type of Elements and Total No. of Elements in Model(Jor dam)
77
4.12 Modal Analysis Results (Jor dam) 78
4.13 Table of significant nodes(Batang-Ai dam) 80
4.14 FE Software Used, Type of Elements and Total No. of Elements in Model(Batang-Ai dam)
81
4.15 Modal Analysis Results (Batang-Ai dam) 82
4.16 Table of significant nodes (Babagon dam) 84
4.17 FE Software Used, Type of Elements and Total 85

xii
No. of Elements in Model(Babagon dam)
4.18 Modal Analysis Results (Babagon dam) 86
4.19 Table of significant nodes(Kenyir dam) 89
4.20 FE Software Used, Type of Elements and Total No. of Elements in Model(Kenyir dam)
90
4.21 Modal Analysis Results (Kenyir dam) 91
4.22 Table of significant nodes (Chenderoh dam) 94
4.23 FE Software Used, Type of Elements and Total No. of Elements in Model(Chenderoh dam)
95
4.24 Modal Analysis Results (Chenderoh dam) 96
4.25 Material Properties 97
5.1 Natural Period of the Desired Dams 104
5.2 Verification of Natural Period for All Dams 106
5.3 The results of Linear Time History Analysis(Jor dam)
111
5.4 The results of Non-Linear Time History Analysis(Jor dam)
112
5.5 The results of Response Spectrum Analysis(Jor dam)
113
5.6 The results of Linear Time History Analysis(Batang-Ai dam)
116
5.7 The results of Non-Linear Time History Analysis(Batang-Ai dam)
117
5.8 The results of Response Spectrum Analysis(Batang-Ai dam)
118
5.9 The results of Linear Time History Analysis(Chenderoh dam)
121
5.10 The results of Non-Linear Time History Analysis(Chenderoh dam)
122
5.11 The results of Response Spectrum Analysis(Chenderoh dam)
123

xiii
5.12 Summarization of Results and Dams’ Capacities 124
5.13 Results to Capacity ration for dams in percentage 125
A-1 The results of Linear Time History Analysis(Ayer Itam)
138
A-2 The results of Non-Linear Time History Analysis(Ayer Itam)
139
A-3 The results of Response Spectrum Analysis(Ayer Itam)
140
A-4 The results of Linear Time History Analysis(Labong)
143
A-5 The results of Non-Linear Time History Analysis(Labong)
144
A-6 The results of Response Spectrum Analysis(Labong)
145
A-7 The results of Linear Time History Analysis(Batu) 148
A-8 The results of Non-Linear Time History Analysis(Batu)
149
A-9 The results of Response Spectrum Analysis(Batu) 150
A-10 The results of Linear Time History Analysis(Babagon)
153
A-11 The results of Non-Linear Time History Analysis(Babagon)
154
A-12 The results of Response Spectrum Analysis(Babagon)
155
A-13 The results of Linear Time History Analysis(Kenyir)
158
A-14 The results of Non-Linear Time History Analysis(Kenyir)
159
A-15 The results of Response Spectrum Analysis(Kenyir)
160

xiv
LIST OF FIGURES
FIGURE NO. TITLE PAGE
1.1 Historical earthquakes around Peninsular Malaysia (Mω > 5)
3
1.2 Active Faults Around Peninsula Malaysia 3
2.1 Earthfills and Rockfill in dam Construction 8
2.2 Principal variants of Earthfill and Earthfill-Rockfill embankment dams(values of m are indicative only)
8
2.3 Principal variants of Rockfill embankment dams
(values of m are indicative only)
9
2.4 Principal variants of concrete dams (values of m and n indicative only; in (e) RH and RV generally vary over dam faces)
10
2.5 Further variants of concrete dams 12
2.6 Schematic of principal loads: gravity dam profile 15
2.7 Schematic of internal body forces: embankment dam
15
2.8 The plot of dynamic amplification equation 21
2.9 Soil-Structure Interaction Model 22
2.10 Types of quadrilateral element(Plane, General) used is SAP2000
28
2.11 Triangular element(15-Nodes, 12-Stress Points) used is PLAXIS
28
2.12 Drucker-Prager Cap model: yield surface in the p − q plane
29
2.13 Schematics of a density-dependent Drucker-Prager Cap model: (a) 3D yield surfaces in principal stress space (1/4 model); (b) 2D
30

xv
representation
2.14 Basic idea of an elastic perfectly plastic model 31
2.15 The Mohr-Coulomb yield surface in principal stress space (c = 0)
31
2.16 Definition of E0 and E50 for standard drained triaxial test results
32
2.17 Stress circles at yield; one touches Coulomb's envelope
33
3.1 Sliding failure of an earth dam 46
3.2 Liquefaction failure of an earth dam 47
3.3 Failure in terms of longitudinal cracks in an earth dams
48
3.4 Transverse cracks due differential settlements in an earth dam
49
3.5 Embankment and foundation piping in an earth dam
49
3.6 phreatic surface in earth dams 50
3.7 Upstream view of Karoon-1 dam 52
3.8 Finite Element model of Karoon-1 dam in ABAQUS
52
3.9 Geometry of dam-reservoir system 53
3.10 Models of Dam with Small and Large Foundation
57
4.1 Methodology flowchart 60
4.2 Upstream of Ayer Itam dam 61
4.3 Main Embankment Cross-Section of Ayer Itam dam
61
4.4 Plot of geometry model with significant nodes (Ayer Itam dam)
62
4.5 Meshed Structure in PLAXIS (Ayer Itam dam) 63

xvi
4.6 Meshed Structure in SAP2000(Ayer Itam dam) 63
4.7 Mode Shapes for Ayer Itam dam 64
4.8 Main Embankment Cross-Section of Labong dam
65
4.9 Plot of geometry model with significant nodes (Labong dam)
66
4.10 Meshed Structure in PLAXIS(Labong dam) 67
4.11 Meshed Structure in SAP2000(Labong dam) 67
4.12 Mode Shapes for Labong dam 68
4.13 Upstream of Batu dam 70
4.14 Plot of geometry model with significant nodes (Batu dam)
71
4.15 Meshed Structure in PLAXIS (Batu dam) 72
4.16 Meshed Structure in SAP2000 (Batu dam) 72
4.17 Mode Shapes for Batu dam 73
4.18 Upstream of Jor dam 75
4.19 Main Embankment Cross-Section of Jor dam 75
4.20 Plot of geometry model with significant nodes (Jor dam)
76
4.21 Meshed Structure in PLAXIS (Jor dam) 77
4.22 Meshed Structure in SAP2000 (Jor dam) 77
4.23 Mode Shapes for Jor dam 78
4.24 Upstream of Batang-Ai dam 79
4.25 Plot of geometry model with significant nodes (Batang-Ai dam)
80
4.26 Meshed Structure in PLAXIS (Batang-Ai dam) 81
4.27 Meshed Structure in SAP2000 (Batang-Ai dam) 81
4.28 Mode Shapes for Batang-Ai dam 82

xvii
4.29 General layout of Babagon dam 83
4.30 Plot of geometry model with significant nodes (Babagon dam)
84
4.31 Meshed Structure in PLAXIS (Babagon dam) 85
4.32 Meshed Structure in SAP2000 (Babagon dam) 85
4.33 Mode Shapes for Babagon dam 86
4.34 Downstream of Kenyir Dam 88
4.35 Powerhouse in the Downstream of Kenyir Dam 88
4.36 Plot of geometry model with significant nodes (Kenyir dam)
89
4.37 Meshed Structure in PLAXIS (Kenyir dam) 90
4.38 Meshed Structure in SAP2000 (Kenyir dam) 90
4.39 Mode Shapes for Kenyir dam 91
4.40 Upstream and downstream view of Chenderoh dam
93
4.41 General Layout of Chenderoh dam 93
4.42 Main Embankment Cross Section of Chenderoh dam
93
4.43 Plot of geometry model with significant nodes (Chenderoh dam)
94
4.44 Meshed Structure in PLAXIS(Chenderoh dam) 95
4.45 Meshed Structure in SAP2000(Chenderoh dam) 95
4.46 Mode Shapes for Chenderoh dam 96
4.47 Drucker-Prager Cap model: yield surface in the p − q plane
98
4.48 Schematics of a density-dependent Drucker-Prager Cap model: (a) 3D yield surfaces in principal stress space (1/4 model); (b) 2D representation.
99
4.49 Basic idea of an elastic perfectly plastic model 100

xviii
4.50 The Mohr-Coulomb yield surface in principal stress space (c = 0)
100
4.51 Time History at Surface 101
4.52 Acceleration Response Spectrum at Surface 102
5.1 FFT graph for RapidKl Time History Dataset(SIGVIEW)
105
5.2 FFT 3D graph for RapidKl Time History Dataset(SIGVIEW)
105
5.3 Comparison The Differences Between SAP2000 Results And Theoretical Values In Terms Of Natural Period
107
5.4 Water flow path in Jor Dam’s body (Shading) 109
5.5 Degree of Saturation in Jor Dam (Contour Lines) 109
5.6 Acceleration-Time diagram for the dam’s crest (Jor dam)
110
5.7 Displacement-Time diagram for the dam’s crest (Jor dam)
110
5.8 Normal Stress diagram for Linear Time History Analysis (Jor dam)
111
5.9 Shear Stress diagram for Linear Time History Analysis (Jor dam)
111
5.10 Normal Stress diagram for Non-Linear Time History Analysis (Jor dam)
112
5.11 Shear Stress diagram for Non-Linear Time History Analysis (Jor dam)
112
5.12 Normal Stress diagram for Response Spectrum Analysis (Jor dam)
113
5.13 Shear Stress diagram for Response Spectrum Analysis (Jor dam)
113
5.14 Water flow path in Batang-Ai Dam’s body (Shading)
114
5.15 Degree of Saturation in Batang-Ai Dam (Contour 114

xix
Lines)
5.16 Acceleration-Time diagram for the dam’s crest(Batang-Ai dam)
115
5.17 Displacement-Time diagram for the dam’s crest(Batang-Ai dam)
115
5.18 Normal Stress diagram for Linear Time History Analysis(Batang-Ai dam)
116
5.19 Shear Stress diagram for Linear Time History Analysis(Batang-Ai dam)
116
5.20 Normal Stress diagram for Non-Linear Time History Analysis(Batang-Ai dam)
117
5.21 Shear Stress diagram for Non-Linear Time History Analysis(Batang-Ai dam)
117
5.22 Normal Stress diagram for Response Spectrum Analysis(Batang-Ai dam)
118
5.23 Shear Stress diagram for Response Spectrum Analysis(Batang-Ai dam)
118
5.24 Water flow path in Chenderoh Dam’s body (Shading)
119
5.25 Degree of Saturation in Chenderoh dam(Contour Lines)
119
5.26 Acceleration-Time diagram for the dam’s crest(Chenderoh dam)
120
5.27 Displacement-Time diagram for the dam’s crest(Chenderoh dam)
120
5.28 Normal Stress diagram for Linear Time History Analysis(Chenderoh dam)
121
5.29 Shear Stress diagram for Linear Time History Analysis(Chenderoh dam)
121
5.30 Normal Stress diagram for Non-Linear Time History Analysis(Chenderoh dam)
122
5.31 Shear Stress diagram for Non-Linear Time History Analysis(Chenderoh dam)
122

xx
5.32 Normal Stress diagram for Response Spectrum Analysis(Chenderoh dam)
123
5.33 Shear Stress diagram for Response Spectrum Analysis(Chenderoh dam)
123
5.34 Comparison Of Results From Different Methods 125
5.35 Comparison of Displacement for Earthfill dams 126
5.36 Comparison of Displacement for Rockfill dams 126
A-1 Water flow path in Ayer Itam Dam’s body (Shading)
136
A-2 Degree of Saturation in Ayer Itam dam (Contour Lines)
136
A-3 Acceleration-Time diagram for the dam’s crest(Ayer Itam)
137
A-4 Displacement-Time diagram for the dam’s crest(Ayer Itam)
137
A-5 Normal Stress diagram for Linear Time History Analysis(Ayer Itam)
138
A-6 Shear Stress diagram for Linear Time History Analysis(Ayer Itam)
138
A-7 Normal Stress diagram for Non-Linear Time History Analysis(Ayer Itam)
139
A-8 Shear Stress diagram for Non-Linear Time History Analysis(Ayer Itam)
139
A-9 Normal Stress diagram for Response Spectrum Analysis(Ayer Itam)
140
A-10 Shear Stress diagram for Response Spectrum Analysis(Ayer Itam)
140
A-11 Water flow path in Labong Dam’s body (Shading)
141
A-12 Degree of Saturation in Labong dam (Contour Lines)
141
A-13 Acceleration-Time diagram for the dam’s 142

xxi
crest(Labong)
A-14 Displacement-Time diagram for the dam’s crest(Labong)
142
A-15 Normal Stress diagram for Linear Time History Analysis(Labong)
143
A-16 Shear Stress diagram for Linear Time History Analysis(Labong)
143
A-17 Normal Stress diagram for Non-Linear Time History Analysis(Labong)
144
A-18 Shear Stress diagram for Non-Linear Time History Analysis(Labong)
144
A-19 Normal Stress diagram for Response Spectrum Analysis(Labong)
145
A-20 Shear Stress diagram for Response Spectrum Analysis(Labong)
145
A-21 Water flow path in Batu Dam’s body (Shading) 146
A-22 Degree of Saturation in Batu dam (Contour Lines)
146
A-23 Acceleration-Time diagram for the dam’s crest(Batu)
147
A-24 Displacement-Time diagram for the dam’s crest(Batu)
147
A-25 Normal Stress diagram for Linear Time History Analysis(Batu)
148
A-26 Shear Stress diagram for Linear Time History Analysis(Batu)
148
A-27 Normal Stress diagram for Non-Linear Time History Analysis(Batu)
149
A-28 Shear Stress diagram for Non-Linear Time History Analysis(Batu)
149
A-29 Normal Stress diagram for Response Spectrum Analysis(Batu)
150

xxii
A-30 Shear Stress diagram for Response Spectrum Analysis(Batu)
150
A-31 Water flow path in Babagon Dam’s body (Shading)
151
A-32 Degree of Saturation in Babagon dam (Contour Lines)
151
A-33 Acceleration-Time diagram for the dam’s crest (Babagon)
152
A-34 Displacement-Time diagram for the dam’s crest(Babagon)
152
A-35 Normal Stress diagram for Linear Time History Analysis(Babagon)
153
A-36 Shear Stress diagram for Linear Time History Analysis(Babagon)
153
A-37 Normal Stress diagram for Non-Linear Time History Analysis (Babagon)
154
A-38 Shear Stress diagram for Non-Linear Time History Analysis(Babagon)
154
A-39 Normal Stress diagram for Response Spectrum Analysis(Babagon)
155
A-40 Shear Stress diagram for Response Spectrum Analysis(Babagon)
155
A-41 Water flow path in Kenyir Dam’s body (Shading)
156
A-42 Degree of Saturation in Kenyir dam(Contour Lines)
156
A-43 Acceleration-Time diagram for the dam’s crest(Kenyir)
157
A-44 Displacement-Time diagram for the dam’s crest(Kenyir)
157
A-45 Normal Stress diagram for Linear Time History Analysis(Kenyir)
158
A-46 Shear Stress diagram for Linear Time History 158

xxiii
Analysis(Kenyir)
A-47 Normal Stress diagram for Non-Linear Time History Analysis(Kenyir)
159
A-48 Shear Stress diagram for Non-Linear Time History Analysis(Kenyir)
159
A-49 Normal Stress diagram for Response Spectrum Analysis(Kenyir)
160
A-50 Shear Stress diagram for Response Spectrum Analysis(Kenyir)
160

xxiv
LIST OF APPENDICES
APPENDIX TITLE PAGE
A Results For Other Dams(SAP2000 and PLAXIS) 135

xxv
LIST OF SYMBOLS
H dam height
B dam width
γ density
E Young's modulus
Em degraded elastic modulus
E0 original modulus
g gravity
p hydrodynamic pressure
m equivalent mass of water storage
C ratio between seismic acceleration and gravitational acceleration
w density of water (kg/m3)
y distance of cross section from dam crest (m)
u unknown relative displacements vectors
u unknown relative velocities vectors
u unknown relative accelerations vectors
M mass matrix of the soil-structure system
C damping matrix
D dynamic amplification factors
β frequency ratio
ξ damping ratio
ϖ frequency of earthquake excitation
ω frequency of structure
ωi angular frequencies of vibration modes

xxvi
Stress in i direction
v , μ Poisson's ratio
Friction angle
ψ Dilatancy angle
Strain in i direction
φ total porosity of concrete

CHAPTER 1
INTRODUCTION
1.1 Introduction
An earthquake is produced by the sudden rupture or slip of a geological fault.
Faults occur at the intersection of two segments of the earth’s crust. Peninsula
Malaysia lies in the Eurasian Plate and also within the Indian-Australian Plate.
Geologically, small faults also exist in East Malaysia. Records have shown that we
do sometimes experiences some off-set tremors originating from the Indonesian
zone. Thus there is a need for some seismic checking to be incorporated in the design
process so that the structures would be resistant to earthquake.
In the recent years, the issues of seismic safety of dams have become a major
concern in the planning and designing of new dams proposed to be built and for
safety evaluation of existing dams in seismic regions. Prediction of the performance
of the dams during earthquakes is one of the most challenging and complex problems
found in the field of structural dynamics.
Water with good quality and in sufficient quantity is a basic requirement for
humanity. Reservoirs and dams that create those reservoirs provide a means to

2
balance the fluctuation of natural water flow. Multipurpose reservoirs can serve for
drinking water, irrigation in agriculture, production of clean and renewable energy,
recreation and flood protection. So, the dams and study of theirs stability under
variable loading especially earthquake forces play a vital role in the infrastructure of
many states for the provision of water resource and saving money.
Finite Element Method (FFM) is a numerical method that can be used to
solve different kinds of engineering problems in the stable, transient, linear or
nonlinear cases (Bathe, 1996). Among finite element method software’s, SAP2000
and PLAXIS are known as the most precise and practicable softwares in industry and
university researches. They are used for dynamic analysis such as earthquake and
water wave loading on structures.
1.2 Problem Statement
There are many reasons for Malaysia to worry about earthquake. New
revelations indicate Malaysia is moving closer towards the rumble zone. Malaysia is
inching closer to rumble zones and will not be immune to earthquake forever. Year
after year, neighboring tectonic plates inch towards from all directions and on
mounting because the Australian, Eurasian and Philippine plate around Malaysia are
moving . Azlan (2005) stated that Peninsular Malaysia does lie on faults but have
been known to be non-active faults. Malaysia is located in low seismic activity area
but the active earthquake fault line through the center of Sumatera just lies 350 km
from peninsular.
Sabah, which experienced the highest earthquake magnitude recoded with 4.8
Richter in the last century occurred about 90 KM from Miri, Sarawak have cause
several building crack. The plates are moving closer toward and shift a few
3
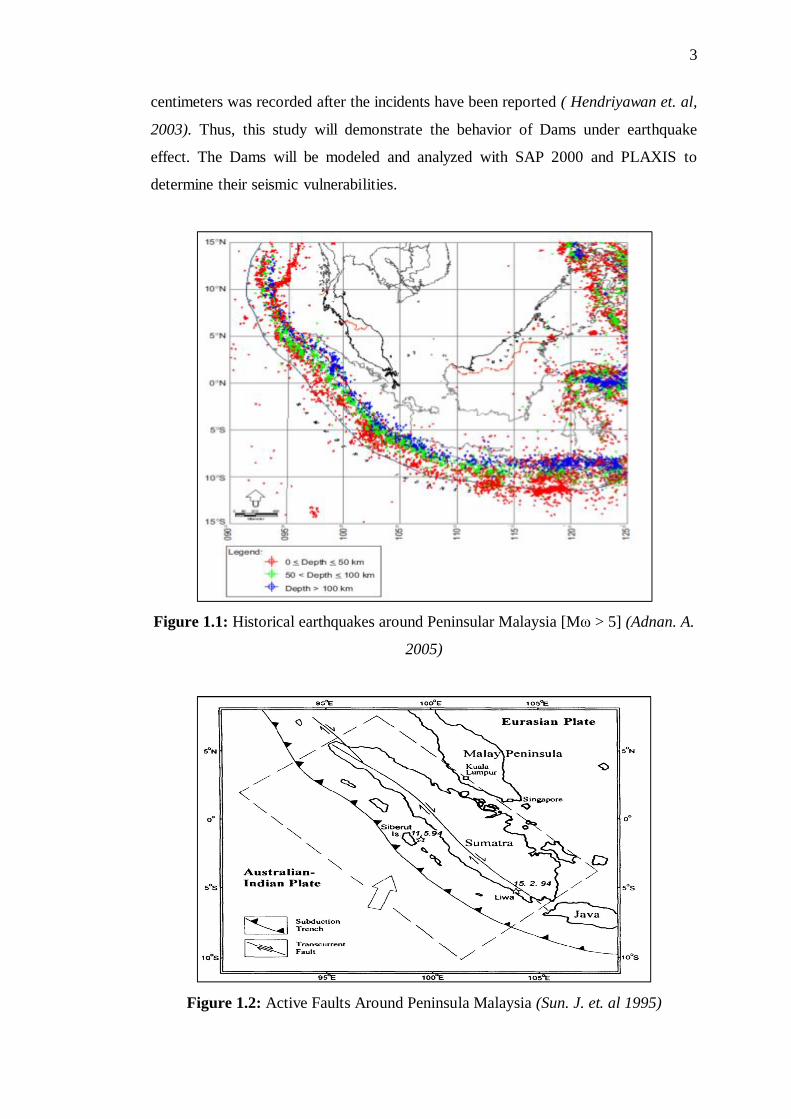
centimeters was recorded after the incidents have been reported ( Hendriyawan et. al,
2003). Thus, this study will demonstrate the behavior of Dams under earthquake
effect. The Dams will be modeled and analyzed with SAP 2000 and PLAXIS to
determine their seismic vulnerabilities.
Figure 1.1: Historical earthquakes around Peninsular Malaysia [Mω > 5] (Adnan. A.
2005)
Figure 1.2: Active Faults Around Peninsula Malaysia (Sun. J. et. al 1995)

4
1.3 Objectives
The objectives of this project are:
- To remodel the Dams using finite element modeling with SAP2000 and PLAXIS.
- To determine the vulnerability of existing dams in Malaysia under earthquake load
- To determine the earthquake design criteria for new dams located in Malaysia
region
- To study the performance of existing Dams while seismic activity occurs using time
history, response spectrum and free vibration analysis.
1.4 Scope Of Study
1. Various dams from different locations have been identified for the finite element
analysis. The dams are as follows:
Rockfill Dams:
· Sarawak- Batang Ai Dam
· Sabah-Babagon Dam
· Terengganu-Kenyir Dam
Earthfill Dams:
· Kuala Lampur- Batu Dam
· Penang- Ayer Itam Dam
· Johor- Labong Dam
· Pahang- Jor Dam
Concrete Dam:
· Perak- Chenderoh Dam

5
2. Seismic vulnerability analysis will be performed on the identified Dams.
3. Modeling the Dams using plane strain modeling.
4. Model the dams only using 2 dimensional views.
5-Linear Response spectrum and Time History by SAP2000 and Non-Linear Time
History analysis by means of PLAXIS.