seismic waves viewer and seismiceruption · seismic waves viewer (pages 2–7) seismic waves is an...
TRANSCRIPT

Seismic Waves Viewer and SeismicEruptionSeismic Visualizations from Alan Jones (serc.carleton.edu/resources/23210.html)
Two highly effective and complementary visual aids allow viewer to watch seismic waves propagate across the surface and through the Earth (Seismic Wave Viewer), and to see the changes in space and time of Earth’s earthquakes and volcanoes (Seismic Eruption). Student Worksheets are included with each activity.
DOWNLOAD: SeismicEruption P.C. (only) program can be downloaded from: http://bingweb.binghamton.edu/~ajones/#Computer%20Programs
Seismic Waves Viewer (Pages 2–7)
Seismic Waves is an on-line program which illustrates how waves propagate from an earthquake hypocenter to seismic stations across the globe. Waves propagate out from the epicenter along the surface on a three-dimensional view of the earth. At the same time viewer can watch waves propagating through a cross-sectional view of the earth. These two wave propagation views are synchronized with actual event waveforms so that as a particular phase arrives at a station, one sees the effect on the seismogram.
NGSS Science Standards• From Molecules to Organisms—Structures and Processes: MS-LS1-8• Energy HS-PS3-2, MS-PS3-5 • Waves and Their Applications in Technologies for Information Transfer: MS-PS4-1, HS-PS4-1, PS4-2, HS-
PS4-2, MS-PS4-3, HS-PS4-5• Earth’s Systems: HS-ESS2-2
1
Seismic Waves Viewer is available here: www.iris.edu/hq/inclass/software-web-app/seismic_waves_viewer
SeismicEruption (Pages 8–12)
Visualization of 1960 to present seismicity (earthquakes) and volcanic activity in space and time. When the program is running, the user sees lights, which represent earthquakes, flashing on the screen in speeded-up time. The user can control the speed of the action. In addition, the program can show seismicity under Earth’s surface in three-dimensional and cross-sectional views.
If you have a Mac computer and not a P.C., here is an alternative to downloading software: watch an animation of the program here: www.iris.edu/hq/inclass/animation/288. unfortunately, the animation only has events to 2007 and is not interactive, required by Student Worksheets.

SEISMIC WAVES VIEWER INTERNET PROGRAMTEACHER INFORMATION
OPEN program: http://ds.iris.edu/seismon/swaves/• See next page for an overview of the program.• Experiment with the variables in the black explanation box. For example:
• The speed is controlled by a toggleable blue bar; the default is 24x real time.• Click “waves shown”. This is set for the “Standard” default which shows all waves. You can select
individual waves, but it only allows one at a time. This makes for a less interesting seismogram down the left side of the screen but allows you to focus on a particular kind of seismic wave.
• “load new quake” allows you to select from 10 different events.• “change view direction” allows you to see seismograph stations on the other side of the globe.
• Station Name at top of page links to a Wikipedia page for data about the earthquake.
Suggestions on use:• Prerequisite knowledge: seismic waves! Do slinky activity and watch animations (box below) first.• Do whole-group demo of how to use the program.• Review the buttons and controls, especially the “Pause/Resume” function. (This doesn’t rewind.)• Break students into pairs to complete worksheet.
• Review key points upon completion of worksheet.
Student Worksheets:The student worksheets require information about the tectonic setting. Make sure students have access to a tectonic map with plate names. (ex: https://geomaps.wr.usgs.gov/parks/pltec/)
Extensions:
• Use the IRIS posters entitled: “Sumatra-Andaman Islands Earthquake (Mw=9.0)” and “Exploring the Earth Using Seismology* to show how seismic waves propogate through the Earth. It also shows how the time between P wave and S wave arrival times increases with distance. Both can be found at: www.iris.edu/hq/inclass/search#type=6
• Show students the Ripple Tank Applet: www.falstad.com/ripple/. This is an awesome little applet that can simulate how waves move though different media. Play around with the controls to edit walls and media. When manipulated correctly, it clearly shows shadow zones!
2
Animations & videos that support this activity
Plate Boundaries: https://www.iris.edu/hq/inclass/animation/492
Seismic Shadow Zones: https://www.iris.edu/hq/inclass/animation/121
Why do seismic waves travel a curving path through the Earth? www.iris.edu/hq/inclass/animation/216
Where do travel-time graphs come from? https://www.iris.edu/hq/inclass/animation/120
Video: Seismic Waves: P, S, and Surface www.iris.edu/hq/inclass/video/109
Video: Types of Seismic Wave Paths Through the Earth www.iris.edu/hq/inclass/video/109

3
Introduction to the Seismic Waves Viewer (more resources here: www.iris.edu/hq/inclass/software-web-app/seismic_waves_viewer
This is the screen that you will see when you open the software. The default is the 2004 Sumatra earthquake.
That earthquake is referred to in “Extension” and also is the answer to question 15 in the Student Worksheet: “Which quake shown had the largest magnitude, and how big was it?”“load new quake” in the black box. That will give you the popup map below.
“change view direction” allows viewer to see seismograph station on the other side of the globe.
These are the choices for “load new quake”. Student Worksheets refer to Haiti, Bolivia, and Chile. Sumatra is referenced in Extensions in Teacher Information section, previous page.
Surface waves travel across the globe to marked seismic stations; their respective seismograms are “growing” from time = zero at the time of the earthquake. Notice that they arrive at the closest station, CHTO first.
Body waves travel through the Earth to marked seismic stations; Sta-tions close to the earthquake record strong P, S, and Surface waves in quick succession just after the earthquake occurred. Stations farther away record the arrival of these waves after a few minutes, and the times between the arrivals are greater.
To see the seismograph stations on the other side of the globe, click “change view direction” (in red circle). This is important for looking at the Chile seismograms.
“Hot link” to Wikipedia page with information on each earthquake.

Name: Class Today’s Date: Due Date:
SEISMIC WAVES COMPUTER PROGRAM
PROCEDURE: Open program. Click “load new quake” to see a world map with some major earthquakes shown. With each quake you click on, watch the waves cross the surface of the earth and through the
interior by dragging the globe with the cursor. Set the speed with the blue slider: slower for first-time view and faster for comparing earthquake seismic waves.
Questions 1 – 7 refer to the Near Central Coast of Chile Feb 27, 2010 quake.Click on “Change view direction” to see seismograph stations in the seismogram list.Click on the blue title of the earthquake for details.
1. How deep was the quake? 2. What was the magnitude (mag)? 3. What two tectonic plates are involved with this quake? 4. What process is involved as one plate moves below another plate? 5. What do the different colors of lines on the globes represent? Red: Light Blue: Yellow:
6. Over time, what happens to the distance between the first red line and the first blue line as they move across the surface of the globe? Why does this happen?
7. Look at the seismograph of the “TRQA” (left side seismogram). Sketch what it looks like from 0 to 20 minutes in the space below.
8. What color of waves is causing the huge movements on the “TRQA” seismomogram. Compare the seismogram to the surface view. Is it the S waves or the Surface waves that are causing the big movements on the seismograph? ________________________________________
9. About how long did it take for the P waves to hit the coast of Africa? _______________________________________________________
SW–1

Go back to “load new quake” and click on the Haiti 2010 quake.
10. What were the depth and magnitude? __________________________________ 11. The plate boundary is dominated by left-lateral strike slip motion. What type of plate
boundary produces strike slip motion? __________________________________
Look on the Earth Cross-Section view. You can see the main layers and what happens as the waves travel in there and bounce around. You will see the waves changing names as the hit different parts of the Earth’s interior.
12. Which waves are moving out first from the earthquake? ________________________
13. What happens to the P waves when they hit the outer core? (more than one thing happens – notice what goes through the outer core) Why does that happen?
14. Watch the first set of blue S waves coming out of the quake. What happens to those waves when they hit the outer core? What does this say about the consistency of the outer core?
15. Some of the waves get renamed, like PKIKP. What does that mean? Click on the “What you will see is explained here” button to see a rollover that shows the different waves. So where exactly has the PKIKP wave been moving through?
Try a few different earthquakes. Click on “load new quake” to choose them. After looking at a few, compare all the quakes to the Bolivia quake in 1994. For Bolivia, click on “change view direction” to see seismograph stations in the seismogram list.
16. What was different about the quake in Bolivia?
17. When are you looking at different quakes, click on title of the earthquake to pull up the Wikipedia page. Click on the Tohoku,Japan 2011 quake. See box Summarize what happened in that earthquake. Why was this quake particularly bad?
18. Which quake shown had the largest magnitude, and how big was it? _________________ ___________________________________________________________________
SW–2
Name: Class Today’s Date: Due Date:
SEISMIC WAVES COMPUTER PROGRAM
PROCEDURE: Open program. Click “load new quake” to see a world map with some major earthquakes shown. With each quake you click on, watch the waves cross the surface of the earth and through the
interior by dragging the globe with the cursor. Set the speed with the blue slider: slower for first-time view and faster for comparing earthquake seismic waves.
Questions 1 – 7 refer to the Near Central Coast of Chile Feb 27, 2010 quake.Click on “Change view direction” to see seismograph stations in the seismogram list.Click on the blue title of the earthquake for details..
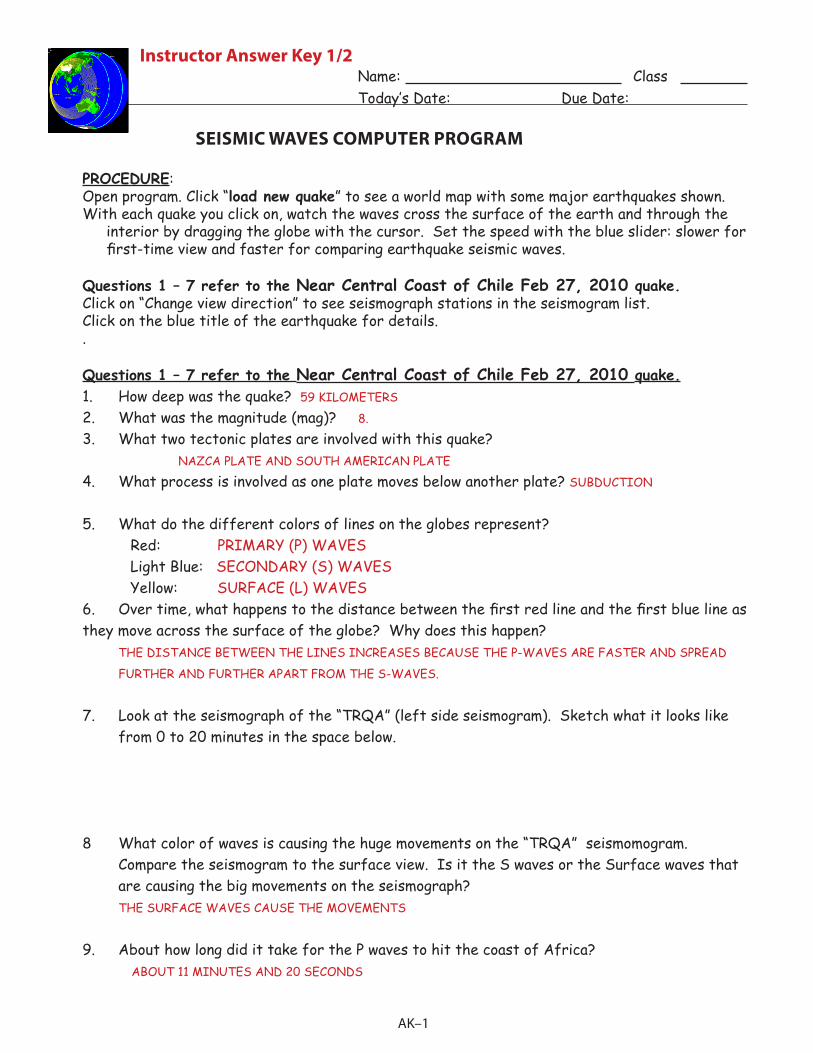
Questions 1 – 7 refer to the Near Central Coast of Chile Feb 27, 2010 quake.1. How deep was the quake? 59 KILOMETERS
2. What was the magnitude (mag)? 8.
3. What two tectonic plates are involved with this quake? NAZCA PLATE AND SOUTH AMERICAN PLATE
4. What process is involved as one plate moves below another plate? SUBDUCTION
5. What do the different colors of lines on the globes represent? Red: PRIMARY (P) WAVES Light Blue: SECONDARY (S) WAVES Yellow: SURFACE (L) WAVES6. Over time, what happens to the distance between the first red line and the first blue line as they move across the surface of the globe? Why does this happen? THE DISTANCE BETWEEN THE LINES INCREASES BECAUSE THE P-WAVES ARE FASTER AND SPREAD
FURTHER AND FURTHER APART FROM THE S-WAVES.
7. Look at the seismograph of the “TRQA” (left side seismogram). Sketch what it looks like from 0 to 20 minutes in the space below.
8 What color of waves is causing the huge movements on the “TRQA” seismomogram. Compare the seismogram to the surface view. Is it the S waves or the Surface waves that are causing the big movements on the seismograph? THE SURFACE WAVES CAUSE THE MOVEMENTS
9. About how long did it take for the P waves to hit the coast of Africa?
ABOUT 11 MINUTES AND 20 SECONDS
AK–1
Instructor Answer Key 1/2

Go back to the World Menu and click on the Haiti 2010 quake.
10. What were the depth and magnitude? 13 KILOMETERS, M 7.0
11. The plate boundary is dominated by left-lateral strike slip motion. What type of plate boundary produces strike slip motion? TRANSFORM
Look on the Earth Cross-Section view. You can see the main layers and what happens as the waves travel in there and bounce around. You will see the waves changing names as the hit different parts of the Earth’s interior.
12. Which waves are moving out first from the earthquake? P WAVES
13. What happens to the P waves when they hit the outer core? (more than one thing happens – notice what goes through the outer core) Why does that happen?
THE P-WAVES, AS THEY HIT THE BOUNDARY TO THE OUTER CORE, CREATE A SECOND SET OF P-WAVES FROM THE IMPACT. THEN S-WAVES ALSO COME OUT FROM THE IMPACT AND GO BACK UP THROUGH THE MANTLE. THIS IS DUE TO THE DIFFERENCE IN MATERIAL BETWEEN MANTLE AND CORE.
14. Watch the first set of blue S waves coming out of the quake. What happens to those waves when they hit the outer core? What does this say about the consistency of the outer core?
AS THE S-WAVES HIT THE BOUNDARY, THE IMPACT CREATES ANOTHER INNER-EARTHQUAKE AND A SECOND SET OF P-WAVES THAT GO THROUGH THE CORE. S WAVES CAN’T GO THROUGH LIQUID, SO IT SHOWS THAT THE OUTER CORE IS MADE OF LIQUID MATERIAL.
15. Some of the waves get renamed, like PKIKP. What does that mean? Click on the “What you will see is explained here” button to see a rollover that shows the different waves. So where exactly has the PKIKP wave been moving through?
P MEANS P-WAVE, AND K MEANS ‘OUTER CORE’ AND I MEANS ‘INNER CORE’ SO A PKIKP WAVES IS ONE THAT STARTS IN THE MANTLE, GOES THROUGH THE OUTER CORE, THROUGH THE INNER CORE, THEN THE OUTER CORE, AND INTO THE MANTLE.
Try a few different earthquakes. Click on “load new quake” to choose them. After looking at a few, compare all the quakes to the Bolivia quake in 1994. For Bolivia, click on “change view direction” to see seismograph stations in the seismogram list.
16. After looking at a few, compare all the quakes to the Bolivia quake in 1994. What was different about the quake in Bolivia?
IT WAS VERY DEEP, SO NO SURFACE WAVES WERE CREATED.
17. When are you looking at different quakes, click on title of the earthquake to pull up the Wikipedia page. Click on the Tohoku,Japan 2011 quake. See box Summarize what happened in that earthquake. Why was this quake particularly bad?
THE QUAKE WAS REALLY BIG (M 9.0), A TSUNAMI RUSHED ONSHORE DESTROYING TOWNS KILLING OVER 15,000 PEOPLE..
18. Which quake shown had the largest magnitude, and how big was it? SUMATRA, 9.1
AK–2
Instructor Answer Key 2/2
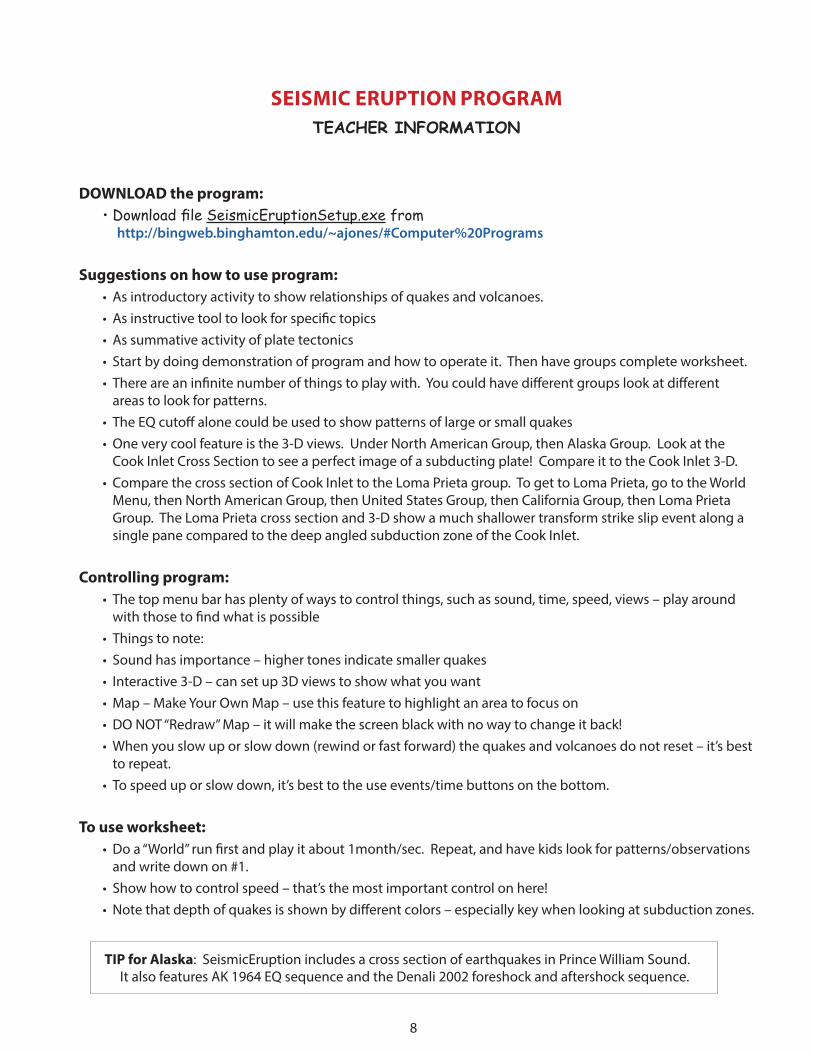
SEISMIC ERUPTION PROGRAMTEACHER INFORMATION
DOWNLOAD the program:• Download file SeismicEruptionSetup.exe from
http://bingweb.binghamton.edu/~ajones/#Computer%20Programs
Suggestions on how to use program:• As introductory activity to show relationships of quakes and volcanoes.• As instructive tool to look for specific topics• As summative activity of plate tectonics• Start by doing demonstration of program and how to operate it. Then have groups complete worksheet.• There are an infinite number of things to play with. You could have different groups look at different
areas to look for patterns. • The EQ cutoff alone could be used to show patterns of large or small quakes• One very cool feature is the 3-D views. Under North American Group, then Alaska Group. Look at the
Cook Inlet Cross Section to see a perfect image of a subducting plate! Compare it to the Cook Inlet 3-D.• Compare the cross section of Cook Inlet to the Loma Prieta group. To get to Loma Prieta, go to the World
Menu, then North American Group, then United States Group, then California Group, then Loma Prieta Group. The Loma Prieta cross section and 3-D show a much shallower transform strike slip event along a single pane compared to the deep angled subduction zone of the Cook Inlet.
Controlling program:• The top menu bar has plenty of ways to control things, such as sound, time, speed, views – play around
with those to find what is possible• Things to note:• Sound has importance – higher tones indicate smaller quakes• Interactive 3-D – can set up 3D views to show what you want• Map – Make Your Own Map – use this feature to highlight an area to focus on• DO NOT “Redraw” Map – it will make the screen black with no way to change it back!• When you slow up or slow down (rewind or fast forward) the quakes and volcanoes do not reset – it’s best
to repeat.• To speed up or slow down, it’s best to the use events/time buttons on the bottom.
To use worksheet:• Do a “World” run first and play it about 1month/sec. Repeat, and have kids look for patterns/observations
and write down on #1.• Show how to control speed – that’s the most important control on here!• Note that depth of quakes is shown by different colors – especially key when looking at subduction zones.
8
TIP for Alaska: SeismicEruption includes a cross section of earthquakes in Prince William Sound. It also features AK 1964 EQ sequence and the Denali 2002 foreshock and aftershock sequence.

SEISMIC ERUPTION PROGRAM Name: Per: Today’s Date: Due Date:
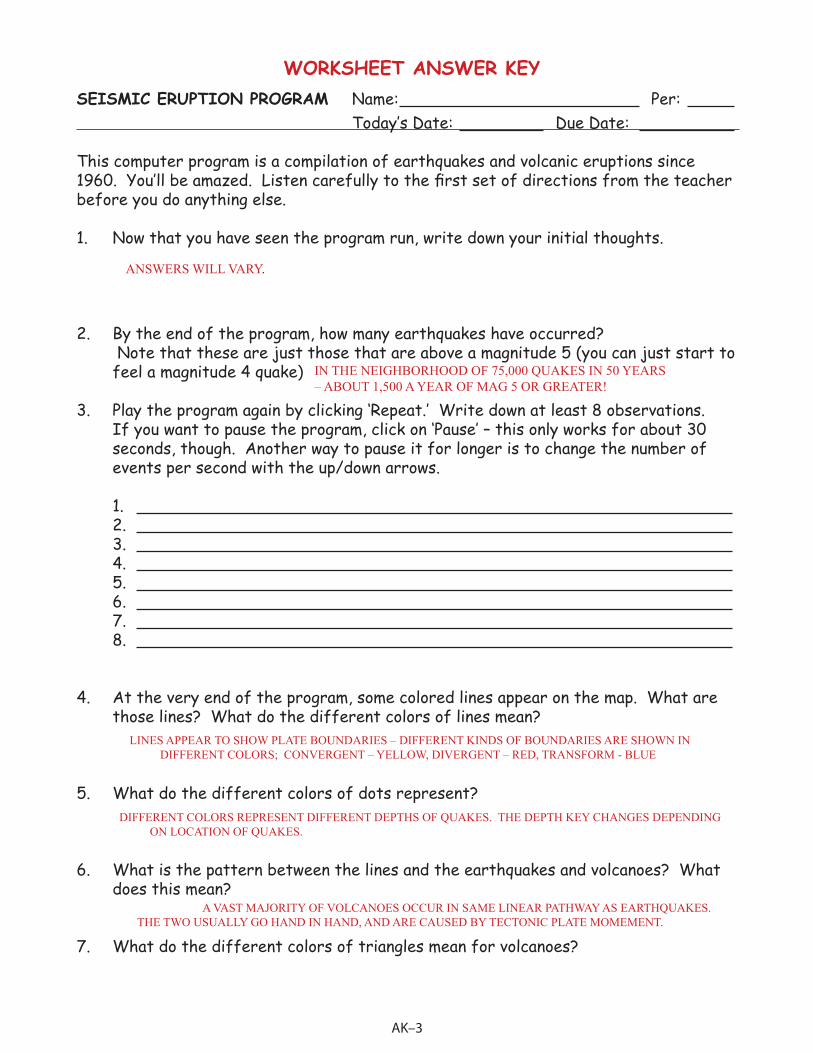
This computer program is a compilation of earthquakes and volcanic eruptions since 1960. You’ll be amazed. Listen carefully to the first set of directions from the teacher before you do anything else.
1. Now that you have seen the program run, write down your initial thoughts.
2. By the end of the program, how many earthquakes have occurred? Note that these are just those that are above a magnitude 5 (you can just start to feel a magnitude 4 quake)
3. Play the program again by clicking ‘Repeat.’ Write down at least 8 observations. If you want to pause the program, click on ‘Pause’ – this only works for about 30 seconds, though. Another way to pause it for longer is to change the number of events per second with the up/down arrows.
1. 2. 3. 4. 5. 6. 7. 8.
4. At the very end of the program, some colored lines appear on the map. What are those lines? What do the different colors of lines mean?
5. What do the different colors of dots represent?
6. What is the pattern between the lines and the earthquakes and volcanoes? What does this mean?
7. What do the different colors of triangles mean for volcanoes?
SW–3
Talking about volcanoes . . . let’s look at Mt. St. Helens. Go to the World Map (click “Back” until you get to World Menu). Click “North American Group” and then “Pacific Northwest Group” and then “Mt. St. Helens.” Click on “Mt. St. Helens.” Note the EQ cutoff is at _____. Let the program run through once and watch. Click “Repeat” to watch again.
8. When do the earthquake start in 1980?
9. What happens on May 18th? And then what happens to the number of earthquakes after that?
10. Why do you think that happens?
11. Find where it says ‘EQ Cutoff’. That’s where you can change how big the earthquakes have to be before they got a dot on the program. Change the EQ Cutoff (by using the arrows) to 7.5. Then run the program again. It might help to uncheck the Eruptions. Watch how many big quakes there have been. Magnitude 7.5 is a HUGE quake. Where are most of these large quakes?
12. Now let’s play with a certain region. First change the EQ Cutoff back to 5.0 and hit ‘Pause’. From the World Menu, click South America. You’ll have to be very patient with controlling the time on this. We want to focus on late February 2010. Speed up the events until Feb 2010, and click “Pause”. Put the events to 5 hours/sec. Then hit “Play” and watch what happens. Describe what happens on Feb 27th and then for a few days and even weeks after the 27th.
13. What do you think that was happening to explain the patterns?
14. Now you can adjust a variety of things until your teacher gives you further instructions.
SW–4
SEISMIC ERUPTION PROGRAM Name: Per: Today’s Date: Due Date:
This computer program is a compilation of earthquakes and volcanic eruptions since 1960. You’ll be amazed. Listen carefully to the first set of directions from the teacher before you do anything else.
1. Now that you have seen the program run, write down your initial thoughts.
2. By the end of the program, how many earthquakes have occurred? Note that these are just those that are above a magnitude 5 (you can just start to feel a magnitude 4 quake)
3. Play the program again by clicking ‘Repeat.’ Write down at least 8 observations. If you want to pause the program, click on ‘Pause’ – this only works for about 30 seconds, though. Another way to pause it for longer is to change the number of events per second with the up/down arrows.
1. 2. 3. 4. 5. 6. 7. 8.
4. At the very end of the program, some colored lines appear on the map. What are those lines? What do the different colors of lines mean?
5. What do the different colors of dots represent?
6. What is the pattern between the lines and the earthquakes and volcanoes? What does this mean?
7. What do the different colors of triangles mean for volcanoes?
WORKSHEET ANSWER KEY
ANSWERS WILL VARY.
IN THE NEIGHBORHOOD OF 75,000 QUAKES IN 50 YEARS – ABOUT 1,500 A YEAR OF MAG 5 OR GREATER!
LINES APPEAR TO SHOW PLATE BOUNDARIES – DIFFERENT KINDS OF BOUNDARIES ARE SHOWN IN DIFFERENT COLORS; CONVERGENT – YELLOW, DIVERGENT – RED, TRANSFORM - BLUE
DIFFERENT COLORS REPRESENT DIFFERENT DEPTHS OF QUAKES. THE DEPTH KEY CHANGES DEPENDING ON LOCATION OF QUAKES.
A VAST MAJORITY OF VOLCANOES OCCUR IN SAME LINEAR PATHWAY AS EARTHQUAKES. THE TWO USUALLY GO HAND IN HAND, AND ARE CAUSED BY TECTONIC PLATE MOMEMENT.
AK–3

Talking about volcanoes . . . let’s look at Mt. St. Helens. Go to the World Map (click “Back” until you get to World Menu). Click “North American Group” and then “Pacific Northwest Group” and then “Mt. St. Helens.” Click on “Mt. St. Helens.” Note the EQ cutoff is at __4.0_. Let the program run through once and watch. Click “Repeat” to watch again.
8. When do the earthquakes start in 1980?
9. What happens on May 18th? And then what happens to the number of earthquakes after that?
10. Why do you think that happens?
11. Find where it says ‘EQ Cutoff’. That’s where you can change how big the earthquakes have to be before they got a dot on the program. Change the EQ Cutoff (by using the arrows) to 7.5. Then run the program again. It might help to uncheck the Eruptions. Watch how many big quakes there have been. Magnitude 7.5 is a HUGE quake. Where are most of these large quakes?
12. Now let’s play with a certain region. First change the EQ Cutoff back to 5.0 and hit ‘Pause’. From the World Menu, click South America. You’ll have to be very patient with controlling the time on this. We want to focus on late February 2010. Speed up the events until Feb 2010, and click “Pause”. Put the events to 5 hours/sec. Then hit “Play” and watch what happens. Describe what happens on Feb 27th and then for a few days and even weeks after the 27th.
13. What do you think that was happening to explain the patterns?
14. Now you can adjust a variety of things until your teacher gives you further instructions.
MARCH 21, 1980
THE MOUNTAIN ERUPTED ON MAY 18TH AND ALL THE EARTHQUAKE ACTIVITY BASICALLY CAME TO A HALT, WITH VERY FEW HAPPENING AFTER THE QUAKE.
PRESSURE UNDER THE VOLCANO WAS INCREASING BEFORE THE ERUPTION. AFTER THE ERUPTION RELEASED ITS PENT UP PRESSURE, THE ACTIVITY DECREASED.
A VAST MAJORITY OF THEM ARE ON THE RING OF FIRE. OTHERS ARE ON CONVERGENT BOUNDARIES IN ASIA AND EUROPE.
THERE IS A VERY LARGE 8.0 MAGNITUDE QUAKE ON THE 27TH AND THEN A LARGE NUMER OF QUAKES FOLLOW AS AFTERSHOCKS, MOST OF THEM SMALLER, BUT SOME PRETTY LARGE.
AFTER THE BIG QUAKE ON FEB 27TH, THERE WERE A LARGE NUMBER OF AFTERSHOCKS AS THE PLATES READJUSTED TO THEIR NEW LOCATION AND STRESS LEVELS.
LIGHT GRAY – NOT ERUPTING. RED – LAVA ERUPTIONS. YELLOW – EXPLOSIVE ERUPTIONS. PINK – BOTH LAVA AND EXPLOSIVE. DARK GRAY – UNKNOWN TYPE.
AK–4