seizing brazil ’s urban opportunity
TRANSCRIPT
SEIZING BRAZIL’S URBAN OPPORTUNITY
PRIORITISING URBAN TRANSPORT AND HOUSING INVESTMENTS FOR INCLUSION AND RESILIENCE
2
About the Seizing the Urban Opportunity series
This series, a collaborative effort by more than 36 organisations across five continents brought together by the Coalition for Urban Transitions, is being launched as a call to action ahead of COP26 in Glasgow. Our aim is to provide insights from six emerging economies demonstrating how fostering zero-carbon, resilient and inclusive cities can advance national economic priorities for shared prosperity for all. This report focuses on how to seize the urban opportunity in Brazil.
The Coalition for Urban Transitions is a global initiative to support national governments in transforming cities to accelerate economic development and tackle dangerous climate change. Collectively, the contributors hope this report will provide the evidence and confidence that national governments need to submit more ambitious Nationally Determined Contributions in 2021 and to propel inclusive, zero-carbon cities to the heart of their Covid-19 economic recovery and development strategies.
3
Disclaimer
The analysis, arguments and conclusions presented here are a synthesis of the diverse views of the authors, contributors and reviewers and is an 18-month research effort building on the Coalition’s 2019 Climate Emergency, Urban Opportunity report. The Coalition takes responsibility for selecting the areas of research. It guarantees its authors and researchers freedom of inquiry, while soliciting and responding to the guidance of advisory panels and expert reviewers. Coalition partners, some as organisations and others as individuals, endorse the general thrust of the arguments, findings and recommendations made in this report, but the text does not necessarily reflect the personal views or official policies of any of the contributors or their members.
Lead partner
Managing partners A special initiative of
In partnership with
Funded by
This material has been funded by the UK government; however, the views expressed do not necessarily reflect the UK government’s official policies.
4
CONTENTS
Introduction ........................................................................................................ 8
Powering the recovery and long-term sustainable growth through cities .................... 8
The promise – and challenges – of Brazil’s cities .......................................... 10
Confronting climate change...................................................................................................... 16
How urban action can drive decarbonisation and economic growth ....... 20
Unlocking the potential of Brazil’s cities ....................................................... 23
References ......................................................................................................... 39
FIGURES
Figure 1. Brazil’s urban population by city size class, 1990–2035 (historical and projected) .................................................................................. 10
Figure 2. Land converted to urban areas in Brazil by type of land cover, 2000–2014 ................................................................................................................................ 13
Figure 3. Share of Brazil’s population inside and outside the low-elevation coastal zone by settlement type, 2015 .............................................................................................. 17
Figure 4. The economics of selected low-carbon measures in Brazilian cities ............ 21
Figure 5. Technically feasible potential to reduce GHG emissions from Brazilian cities by 2050, by sector ............................................................................. 22
5
EXECUTIVE SUMMARY
Brazil urbanised early and quickly, with 87% of its population in cities as of 2018. Almost two-thirds of GDP is produced in the 25 largest urban areas, but in the past two decades, it is smaller cities that have seen the greatest population growth, often without much capacity to manage it.
Brazil’s economy has struggled in recent year, and Covid-19 hit the country hard, with the third-highest case count in the world as of late June 2021 and well over 500,000 deaths. GDP shrank by 4.5% in 2020. The nearly 14 million Brazilians who live in favelas have suffered the most.
The Covid-19 crisis has highlighted the urgency of building resilience among Brazil’s urban poor, many of whom are also disproportionately exposed to climate-related disasters. And as economic and population hubs, Brazil’s cities are critical to a successful recovery.
Brazil has long been recognised for its urban innovation: from pioneering bus rapid transit (BRT), starting in Curitiba in 1974, to governance reforms that empowered cities and introduced participatory master planning, to big, ambitious housing and social programmes.
Yet federal housing investments – especially through the Minha Casa, Minha Vida programme in the past decade – have also helped concentrate the poor in urban peripheries, where informal settlements have also grown. Municipalities have struggled to provide adequate services, from sanitation, to public transport. Casa Verde e Amarela, a new programme that replaced MCMV in January 2021, could be an opportunity to do better.
Overall, new analysis for the Coalition shows, Brazil’s cities expanded by 1,603 km2 between 2000 and 2014 alone, more than the area of São Paulo city. Most of this was driven by the consolidation and growth of mid-sized cities, especially in large, dispersed metro areas.
Car dependency, meanwhile, is taking a toll through air pollution and productivity losses. A list of the top 25 most congested global cities in 2019 ranked Rio de Janeiro at No. 2, São Paulo at No. 5, and Belo Horizonte at No. 13. The National Urban Mobility Policy, adopted in 2012, sought to reshape transportation to prioritise accessibility, sustainability and integration between modes, but it has had limited impact to date.
Brazil is already experiencing the effects of climate change, which will only escalate, with particular impacts on poor and marginalised communities. These include torrential rains, floods and landslides, some of them deadly, and slower-onset impacts such as sea-level rise and reduced precipitation, a major concern for cities already facing water scarcity.

6
The benefits of pursuing compact, connected, clean and resilient cities
The majority of Brazil’s greenhouse gas (GHG) emissions come from land use and conversion, but new analysis for the Coalition shows urban climate action can still make an impact. A bundle of low-carbon measures could enable Brazil to cut emissions from key urban sectors by 75 Mt CO2e (35%) in 2030 and 238 Mt CO2e (88%) in 2050, relative to a baseline scenario that reflects the first round of Nationally Determined Contributions under the Paris Agreement.
Economic modelling shows fully implementing those measures would require incremental investments of US$1.7 trillion by 2050, but they could more than pay for themselves in cost savings alone, and yield cumulative returns with a net present value of US$369.7 billion by 2050. They could also support more than 4.5 million new jobs in 2030.
The transport sector holds 45% of Brazil’s urban GHG emission abatement potential to 2050, and also some of the most economically attractive options. Residential and commercial buildings hold another 28% of Brazil’s urban abatement potential.
Unlocking the potential of Brazil’s cities
In response to the Covid-19 crisis, Brazil approved US$224 billion in fiscal stimulus by February 2021, but most of the investments would not advance decarbonisation or resilience-building. It would be beneficial for future stimulus efforts to prioritise low-carbon urban measures – especially those with high job creation potential and/or large benefits for the poor.
In addition, Brazil’s government can help unleash the power of compact, connected, clean and resilient cities by seizing opportunities such as to:
• Establish a national strategy for cities that promotes sustainable economicgrowth, social inclusion and environmental sustainability, with tailoredapproaches to meet the needs in different regions and city types.
• Develop and support metropolitan governance to foster integrated andsustainable urban development.
• Prioritise low-carbon transport investments, including multi-modalintegrated transport networks and electrification, to reduce air pollution andGHGs and enhance urban accessibility.
• Revamp national housing programmes and policies to ensure they providesafe, affordable and sustainable urban housing with access to jobs and basicservices.
• Support cities in expanding finance for low-carbon and resilience-building projects to improve service delivery and help address infrastructureinvestment deficits.
7
• Promote fiscal reforms that balance the distribution of tax revenues to cities and align fiscal incentives to promote low-carbon sectors and actions in urban areas.
São Paulo. Source: Felipe Paiva/WRI Brasil

8
INTRODUCTION
In Brazil and around the world, national leaders face a triple challenge right now: ensuring a successful recovery from the devastation of Covid-19, pushing forward on their longer-term vision for equitable development, and addressing the enormous threats posed by climate change. The pandemic has wrought havoc on the global economy, with particularly severe impacts on the poor. It has also highlighted the urgency of building resilience to a wide range of shocks, especially the growing impacts of climate change.
Cities are at the centre of that triple challenge. As population hubs and economic engines, they will play a crucial role in the recovery and in countries’ long-term economic vitality. Many have also been particularly hard-hit by the pandemic, however. So now, more than ever, national leadership is crucial to ensure cities can “bounce back” and fully realise their potential as engines of sustainable, inclusive growth. As outlined in the Coalition’s 2019 flagship report, Climate Emergency, Urban Opportunity,1 only national governments can mobilise resources at the scale needed, and they control or drive key policy realms: from energy, to transport, to social programmes.
Recognising that developing and emerging economies face particularly complex challenges, the Coalition is focusing on six key countries in the lead-up to the Glasgow Climate Change Conference (COP26): China, India, Indonesia, Brazil, Mexico and South Africa. Together, they produce about a third of global GDP2 and 41% of CO2 emissions from fossil fuel use.3 They are also home to 42% of the world’s urban population.4 The extent to which these six major emerging economies can unleash the power of cities to catalyse sustainable, inclusive and resilient growth is therefore critical not only for their future trajectory, but for the whole planet.
This report presents the results of policy analysis and modelling on Brazil, delving deeper into findings summarised in the Coalition’s new Seizing the Urban Opportunity report.5 But first, for context, we outline our key findings across the six countries, and how they fit with the Coalition’s previous work.
Powering the recovery and long-term sustainable growth through cities
Climate Emergency, Urban Opportunity showed that a bundle of technically feasible low-carbon measures could cut emissions from buildings, transport, materials use and waste by almost 90% by 2050; support 87 million jobs in 2030 and 45 million jobs in 2050, and generate energy and material savings worth US$23.9 trillion by 2050.6 Compact, connected, clean and resilient cities have significant wider economic, social and environmental benefits as well. With deliberate attention to equity and inclusion, low-carbon measures can also help lift people out of poverty by improving their access to jobs, education and vital services. And by avoiding urban sprawl, countries

9
can protect agricultural land and natural ecosystems around cities, with benefits for food security and resilience.
The Covid-19 pandemic has mobilised historic levels of public spending in many countries, but only a fraction promotes sustainability or climate resilience, and very little focuses on cities.7 Local leaders, meanwhile, have continued to raise their ambition: from embracing the concept of “15-minute cities” where people can get almost anything they need within a 15-minute walk or bike ride,8 to joining the Cities Race to Zero, pledging to reach net-zero carbon emissions by mid-century or sooner.9
Aiming to inform and inspire national leaders in the lead-up to COP26, the Coalition set out to answer three questions: 1. How can national governments in these six key economies leverage cities to build shared prosperity while decarbonising and building resilience? 2. How can they make the most of the potential for compact, connected, clean and inclusive cities to drive the Covid-19 recovery? 3. How can insights from these six countries inform efforts by other national governments, development partners and financial institutions to support a shift towards low-carbon, inclusive and resilient cities?
Three themes emerge clearly from our analysis:
1. A low-carbon urban transformation is within reach, with broad benefits. National governments can significantly accelerate decarbonisation by investing in compact, connected, clean and inclusive cities – and reap substantial economic, social and environmental benefits.
2. Building resilience to climate change is as urgent as decarbonisation. In all six countries, climate risks are immediate and severe, especially for the urban poor. Resilience-building is a multifaceted challenge: from embedding climate resilience in infrastructure and urban development, to adopting new technologies and practices to reduce climate risks, to addressing the socio-economic drivers of vulnerability in cities.
3. There are many ways to foster low-carbon, resilient and inclusive cities. National governments have a wide range of options to choose from, including low-cost and immediate opportunities, and there are many synergies between decarbonisation, resilience-building, Covid recovery efforts, and development programmes.
The global report lays out an agenda for action for national and local leaders as well as for the broader development community, including financial institutions. Transforming cities to become catalysts of sustainable, inclusive and resilient growth is a major undertaking, and it is likeliest to succeed if we all come together behind a shared vision. In the sections that follow, we delve into the challenges and opportunities for Brazil in particular.

10
THE PROMISE – AND CHALLENGES – OF BRAZIL’S CITIES
Brazil urbanised early and quickly, with more than half its population in cities by 1965, and almost 87% – 183 million people – as of 2018.10 Cities became economic hubs: a 2016 study found 63% of Brazil’s GDP was generated in its 25 largest urban centres, where 50% of the population lived.11 Even in regions with strong agricultural and mining sectors, cities are central to the economy. Indeed, in the past two decades, urban population growth in major hubs such as São Paulo or Rio de Janeiro has been outpaced by that of mid-size cities scattered across the country,12 which tend to have more limited capacity to manage urbanisation or to deliver municipal services.13 Though the growth of smaller cities is projected to slow, by 2035, 45% of urban residents in Brazil are still expected to live in cities with fewer than 500,000 people, barely changed from 47% in 2015 (see Figure 1).
Figure 1. Brazil’s urban population by city size class, 1990–2035 (historical and projected)
Source: Authors’ analysis based on data from UN DESA, 2018. Data to 2015 are historical, 2020–2035 are projections.14
A stretch of robust economic growth helped Brazil sharply reduce poverty and improve living standards. From 1990 to 2013, GDP per capita rose from US$10,518 to US$15,800 (PPP, constant 2017 international $).15 The extreme poverty rate dropped from 21.5% in 1990, to 2.7% in 2014,16 while the Gini index dropped by 8.4 points in the same period (though to a still-high 52.1).17 But in recent years, Brazil’s economy has struggled.18 It fell into recession in 2015–2016 and had not fully recovered when the pandemic hit.19 The unemployment rate nearly doubled from 2014 to 2017, from

11
6.7% to 12.8%, though it had been declining slowly since then.20 In 2019, the extreme poverty rate was 4.6%, and the Gini index, 53.4.21
Covid-19 has taken a heavy toll on Brazil. As late June 2021, the country had the third-highest case count in the world and well over 500,000 deaths, with the crisis deepened by a slow vaccine rollout.22 The country’s GDP shrank by an estimated 4.5% in 2020, and is expected to only partly recover in 2021.23 The government’s debt burden grew by 15 percentage points, to 91.4% of GDP, creating pressure to limit public spending.24 In the third quarter of 2020, the unemployment rate hit a record 14.6%, with 11.3 million fewer people employed than a year earlier.25 The nearly 14 million Brazilians who live in favelas26 have been particularly hard-hit; a June 2020 survey found 80% of households in informal settlements were living on less than half their previous income, and 76% had lacked enough money for food.27 The crisis has not abated with time: In February 2021, another favela survey found 82% of respondents depended on donations to feed their families.28
The Covid-19 crisis has highlighted the urgency of building resilience among Brazil’s urban poor, many of whom are also disproportionately exposed to climate-related disasters because they live on hillsides and floodplains on the edges of cities.29 Though Brazil spends 15% of its GDP on social benefits, an OECD analysis found they are poorly targeted, and almost half of that money goes to the top income quintile.30 Informal workers, meanwhile, who account for a third of total employment, don’t qualify for unemployment benefits, a key safety net. More targeted investments to protect the poorest and most vulnerable Brazilians, including in favelas, are crucial to a just and equitable recovery.
Scaling up sustainable infrastructure investment is a priority for Covid-19 recovery and for raising living standards. Brazil’s infrastructure spending averaged only 2.1% of GDP in 2000–2016 – less than half the global average of 4.7% – and it has dipped even lower since the 2015–2016 recession.31 Even modest investments have still made a difference: the share of households nationwide with access to piped water rose from 78% in 2001 to 86% in 2018, and the share connected to sewage systems, from 45% to 66%.32 As Brazil seeks to recover from the pandemic, stepped-up infrastructure investment is a key opportunity to enhance equity, productivity, and sustainability.33 Important steps have already been taken to attract private investors as well. In 2018, a major project was launched with the World Bank to promote investment in urban street lighting and industrial energy efficiency.34 In June 2020, a new regulatory framework for water and sanitation was approved, opening up the sector to private investments that the federal government estimated could total BRL 500–700 billion (US$93–131 billion).35 Currently only 6% of the sanitation sector in Brazil is privately run.36 This is an important opportunity to accelerate the transition to low-carbon infrastructure, including nature-based solutions – but guiding principles are needed to ensure sustainability and a just transition.37
12
Brazil has been widely recognised for urban policy innovations that improved living standards and inclusion. Porto Alegre pioneered a participatory budgeting process that has since scaled to over 2,700 cities around Brazil and the world.38 The 2001 City Statute (Estatuto da Cidade) brought key principles and practices for equitable cities to the nation as a whole, including participatory urban master planning and the principle of the social function of the city – that is, that urban areas’ core purpose is to ensure social well-being.39 The Ministry of Cities, established in 2003 (and folded into a new Ministry of Regional Development in 2019), led big, ambitious programmes that provided affordable housing, expanded basic services and strengthened social safety nets in urban areas across the country.40 These and other efforts created a path for improved access to basic services, strengthened social safety nets, and established a robust legal framework for urban development at the national level. However, in practice, there have been significant shortcomings that kept Brazilian cities deeply unequal.
Federal housing investments have also had negative unintended consequences. The ambitious Minha Casa, Minha Vida (MCMV) programme, which built more than 5 million homes in the past decade,41 supported large-scale construction of affordable housing on the outskirts of cities. Developers were drawn by cheaper land, the availability of larger tracts, and easier permitting processes.42 Informal settlements have further clustered poverty in the urban periphery, and municipalities struggled to provide adequate services, from sanitation, to public transport. Recognising these problems, new location-based standards were developed, linking housing subsidies to specific urban locations and discouraging construction in isolated areas without good public transport.43 Unfortunately, implementation of MCMV was then slowed down due to the recession. Casa Verde e Amarela, which replaced MCMV in January 2021, could be an opportunity to build on those principles and do even better. The goal is to finance new homes for 1.6 million low-income families, regularise land tenure for 2 million, and support improvements in 400,000 existing homes by 2024.44
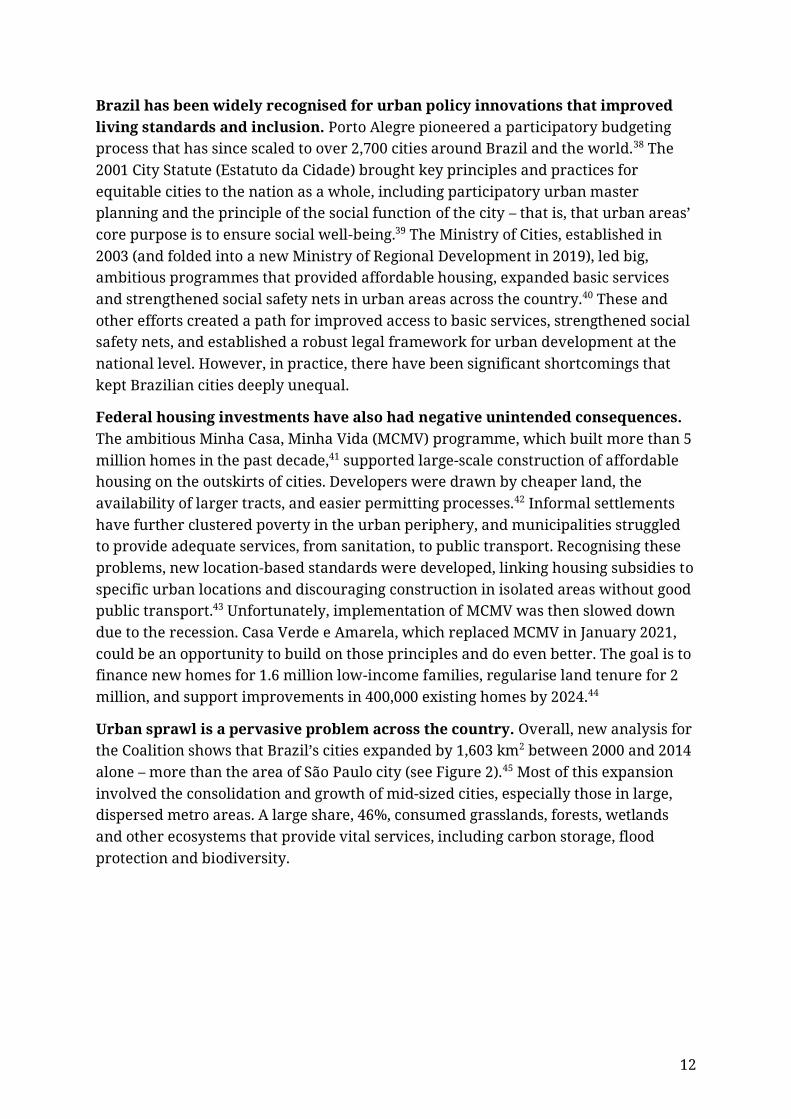
Urban sprawl is a pervasive problem across the country. Overall, new analysis for the Coalition shows that Brazil’s cities expanded by 1,603 km2 between 2000 and 2014 alone – more than the area of São Paulo city (see Figure 2).45 Most of this expansion involved the consolidation and growth of mid-sized cities, especially those in large, dispersed metro areas. A large share, 46%, consumed grasslands, forests, wetlands and other ecosystems that provide vital services, including carbon storage, flood protection and biodiversity.

13
Figure 2. Land converted to urban areas in Brazil by type of land cover, 2000–2014
Source: Marron Institute of Urban Management, New York University, for the Coalition.46
Urban expansion in Brazil is driven by multiple factors, reflecting the diversity of regional landscapes and economies. One common pattern, for example, is large metropolitan areas expanding into small and mid-size cities around them. In the Midwestern states of Goiás and Mato Grosso, disconnected and inadequately managed urban expansion has been identified as a barrier to realising cities’ economic potential.47 The regional development agency, SUDECO, has advocated for a sustainability transformation, in line with the National Regional Development Policy and the 2030 Agenda, to build shared prosperity. Cities in areas with export-driven agriculture, including in the Amazon region, are also growing fast, posing challenges to the municipalities. For example, Parauapebas, in Pará, grew from 154,000 inhabitants in 2010 to an estimated 213,500 in 2020.48 Environmentally sensitive areas in and around many other cities are also under pressure, requiring solutions appropriate to each biome. Forest restoration has become a priority for several cities as a way to protect their water supplies, including São Paulo Campinas, in the state of São Paulo, and Extrema, in Minas Gerais.49 Solutions tailored to the unique challenges of different regions and contexts will be crucial.50 These may include growing the bio-economy, nature-based solutions, technological innovation hubs in cities with universities, compact development in urban cores,51 and careful regulation of commercial construction.
Traffic congestion is another serious concern. Brazil has a long history of promoting road transport, going back to the 1934 Constitution’s directive that highways be built across the country, and reinforced by the introduction of the auto industry in the 1950s.52 The patterns established over the decades continue to drive up car ownership. Between 2000 and 2020, Brazil’s population grew by about 22%, but the number of automobiles tripled, and the number of motorcycles grew almost
14
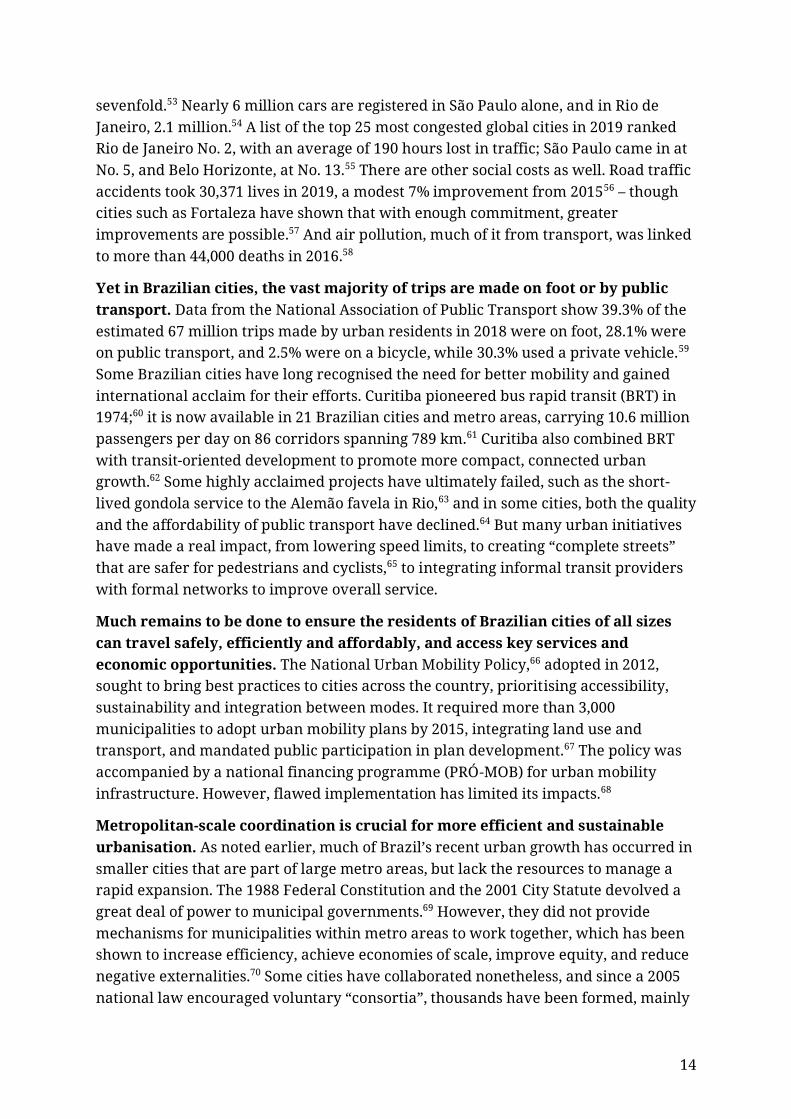
sevenfold.53 Nearly 6 million cars are registered in São Paulo alone, and in Rio de Janeiro, 2.1 million.54 A list of the top 25 most congested global cities in 2019 ranked Rio de Janeiro No. 2, with an average of 190 hours lost in traffic; São Paulo came in at No. 5, and Belo Horizonte, at No. 13.55 There are other social costs as well. Road traffic accidents took 30,371 lives in 2019, a modest 7% improvement from 201556 – though cities such as Fortaleza have shown that with enough commitment, greater improvements are possible.57 And air pollution, much of it from transport, was linked to more than 44,000 deaths in 2016.58
Yet in Brazilian cities, the vast majority of trips are made on foot or by public transport. Data from the National Association of Public Transport show 39.3% of the estimated 67 million trips made by urban residents in 2018 were on foot, 28.1% were on public transport, and 2.5% were on a bicycle, while 30.3% used a private vehicle.59 Some Brazilian cities have long recognised the need for better mobility and gained international acclaim for their efforts. Curitiba pioneered bus rapid transit (BRT) in 1974;60 it is now available in 21 Brazilian cities and metro areas, carrying 10.6 million passengers per day on 86 corridors spanning 789 km.61 Curitiba also combined BRT with transit-oriented development to promote more compact, connected urban growth.62 Some highly acclaimed projects have ultimately failed, such as the short-lived gondola service to the Alemão favela in Rio,63 and in some cities, both the quality and the affordability of public transport have declined.64 But many urban initiatives have made a real impact, from lowering speed limits, to creating “complete streets” that are safer for pedestrians and cyclists,65 to integrating informal transit providers with formal networks to improve overall service.
Much remains to be done to ensure the residents of Brazilian cities of all sizes can travel safely, efficiently and affordably, and access key services and economic opportunities. The National Urban Mobility Policy,66 adopted in 2012, sought to bring best practices to cities across the country, prioritising accessibility, sustainability and integration between modes. It required more than 3,000 municipalities to adopt urban mobility plans by 2015, integrating land use and transport, and mandated public participation in plan development.67 The policy was accompanied by a national financing programme (PRÓ-MOB) for urban mobility infrastructure. However, flawed implementation has limited its impacts.68
Metropolitan-scale coordination is crucial for more efficient and sustainable urbanisation. As noted earlier, much of Brazil’s recent urban growth has occurred in smaller cities that are part of large metro areas, but lack the resources to manage a rapid expansion. The 1988 Federal Constitution and the 2001 City Statute devolved a great deal of power to municipal governments.69 However, they did not provide mechanisms for municipalities within metro areas to work together, which has been shown to increase efficiency, achieve economies of scale, improve equity, and reduce negative externalities.70 Some cities have collaborated nonetheless, and since a 2005 national law encouraged voluntary “consortia”, thousands have been formed, mainly

15
on health and education. The 2015 Statute of the Metropolis encourages the creation of multi-purpose metropolitan authorities, but the potential of this new institutional framework has yet to be realised.71 The implementation of the National Regional Development Policy (PNDR),72 launched in 2019, and the forthcoming National Urban Development Policy (PNDU), both under the purview of the Ministry of Regional Development, offer new opportunities to craft strategies tailored to different regions’ economies and urban makeup, further facilitating collaboration among cities. This is also a chance to promote the “inter-federative integration” needed to advance metropolitan-scale management.
Municipalities lack the fiscal space to make urgent infrastructure investments. Though Brazil has one of the highest tax-to-GDP ratios in Latin America – 33.1% in 2018 – less than 6% of that tax revenue is collected by local governments.73 Recurring local property taxes, a key source of revenue for cities around the world, account for only 2% of total tax revenue. One key factor is that property taxes, and the necessary cadastre updates, are politically contentious.74 Indeed, cities collect more in taxes on goods and services.75 Borrowing by subnational governments, meanwhile, is limited by the Fiscal Responsibility Law of 2000, which allows borrowing from banks, but not the issuance of bonds. The law also makes subnational borrowing contingent on fiscal indicators and credit ratings. Austerity measures imposed in 2017 further limited public spending, especially concessional funding. Reforms are needed to boost state and local budgets – including, potentially, through transfers – and to expand municipalities’ capacity to borrow, with proper safeguards.76
Land value capture (LVC) is a proven option for increasing fiscal space and financing urban infrastructure in Brazil, but its use to date has been limited, with mixed results. LVC has been used since the 1970s in Brazil77 and was widely adopted in São Paulo to enable investments in urban infrastructure and promote urban renewal. Based on São Paulo’s and other cities’ experiences, a provision was included in the City Statute in 2001, providing the necessary legal framework for any Brazilian city implement LVC by charging for additional building rights. Although 40% of Brazilian municipalities have adopted the framework in their municipal codes, LVC implementation in Brazil remains very uneven.78 Successful implementation through complex Urban Operations (UOs) in cities such as São Paulo and Rio de Janeiro have proven that LVC can enable massive infrastructure investments.79 However, it has also raised concerns about gentrification and whether such projects could actually deepen inequality. Meanwhile, in the majority of Brazilian cities, the revenue generation potential of LVC is often lost due to municipalities underestimating prices or conceding additional building rights as trade-offs in negotiations. Revenues from LVC have also been used to cover recurring costs instead of being invested in infrastructure. By making more effective use of the existing legal framework, Brazilian cities can achieve greater benefits, including reduced inequality and more resilient and low-carbon infrastructure.

16
Climate finance and public-private partnerships also hold promise. Brazil could build on relevant experience in preparing projects for green finance: In 2018, US$1 billion in green bonds were invested in the country’s wind power sector, for example.80 Brazil is the world's second-largest recipient of climate finance from multilateral climate funds, with more than US$1.1 billion approved since 2003 – two-thirds of it for the Amazon Fund.81 Brazil’s national and subnational financial institutions, including the Brazilian Development Bank (BNDES), are currently supporting investments related to the country’s climate targets – almost US$10 billion annually, 45% of which focus on transport.82 With support from the federal government, national banks such as CAIXA, BNDES and Banco do Brasil have also created the Investment Partnership Program (PPI) to expand and accelerate partnerships with the private sector.83 In its first 36 months of operation, the PPI facilitated about US$52 billion of investments across Brazil.84 The private sector has also expressed interest in market mechanisms for low-carbon solutions. Public-private partnerships (PPPs), meanwhile, can be used to support a wide range of urban infrastructure and services – from filling the sanitation gap by leveraging new options created by last year’s policy reform, to bringing new technologies to low-income Brazilians. There is still significant untapped potential for sustainable investments in Brazil’s cities.85 The vast majority of the estimated US$1.3 trillion climate-smart investment potential identified in Brazil's first Nationally Determined Contribution (NDC) under the Paris Agreement involves urban infrastructure, particularly in low-carbon transport, but also in the building and waste sectors.86
Confronting climate change
Brazil is already experiencing the effects of climate change, which will only escalate, with particular impacts on poor and marginalised communities. In March 2020, torrential rains, floods, and landslides killed about 150 people in three states, including residents of São Paulo, Rio de Janeiro, and Belo Horizonte ,87 who have seen an escalation of extreme rainfall in recent years. There are also slower-onset impacts. Climate change is expected to reduce precipitation in much of Brazil and increase droughts, with northeastern Brazil among the “hotspots” of drying.88 At 2°C of global warming, mean flows in the Amazon River basin could decline by 25%.89 Hydropower production is projected to be 28% lower by 2040 than if runoff had remained at 1990 levels,90 which could reduce revenues by billions of dollars per year.91 Some cities are already struggling with water scarcity – most notably São Paulo, which almost ran out of water in 2014.92 Climate change and deforestation combined are expected to worsen the risk of landslides, already a major threat to informal settlements around many Brazilian cities.93 And coastal cities – including Rio de Janeiro, Salvador, Fortaleza, Recife – will be exposed to flooding from storm surge and sea-level rise.94 As of 2015, modelling for this report shows 6% of Brazil’s total population (over 15.4 million people) lived in coastal zones less than 10 meters above sea level, 86% of them in urban centres or quasi-urban clusters (Figure 3). All across the country, adaptation is crucial to protect lives and ensure economic resilience.

17
Figure 3. Share of Brazil’s population inside and outside the low-elevation coastal zone by settlement type, 2015
Source: CUNY Institute for Demographic Research, Institute for Development Studies and the Center for International Earth Science Information Network, Columbia University, 2019, for the Coalition for Urban Transitions and Global Commission on Adaptation. See Annex 4 for full methodology.95
Renewable energy gives Brazil a competitive edge in a low-carbon economy. A key part of the transition towards a net-zero world is electrification, combined with decarbonisation of the power grid – and Brazil has a head start.96 Brazil has extensive hydropower, which provided 63.5% of its electricity in 2019, while fossil fuels provided just 15.1%.97 Clean electricity has enabled Brazil to decouple growth and socio-economic advances from emissions to a great extent.98 It could also provide an advantage in a transition to electric vehicles in Brazilian cities. The country has been losing some of that edge, however, due both to growing demand for electricity, and reduced hydropower production in dry years. Power generation has nearly tripled since 1990 and increased by 21% from 2010 to 2019 alone, but hydropower production was actually lower in 2019 than in 2010 (and much lower in 2015, a very dry year).99 Brazil’s power mix has grown more carbon-intensive in the past two decades.100 Coal power generation more than doubled from 2000 to 2019, and natural gas-powered generation grew 15-fold, though oil-powered generation declined. Wind power generation more than doubled from 2015 to 2019, from 21.6 TWh to 56.0 TWh,101 though new installations slowed in 2019, with just 745 MW of new capacity added (for a total of 15.4 GW).102 Solar PV has taken longer to take off, but is now growing rapidly, from 1.2 GW of installed capacity in 2017, to more than 8 GW as of March 2021, including 3.1 GW of utility-scale and 4.9 GW of distributed installations.103 Municipalities are also recognising the significant potential for solar PV in urban areas.104
18
BOX 1: HOW WE BUILT OUR ANALYSIS
This report combines original climate and economic modelling, spatial analysis, policy research and analysis, and country-specific insights gathered by consulting iteratively
with urban, energy and climate policy experts in Brazil.
First, the Stockholm Environment Institute (SEI) modelled the urban greenhouse gas (GHG) emissions abatement potential in six countries, using a bottom-up assessment
of mitigation options in residential and commercial buildings, road transport, waste
management, and materials for urban buildings and transport infrastructure.
The SEI model covers carbon dioxide (CO2) emissions from energy consumption, process emissions from the production of cement and aluminium used in urban
infrastructure, and methane (CH4) emissions from landfills. It is important to note that
emissions from industries within cities are not included, so the urban share of emissions may appear smaller than in other studies. The approach taken also differs
from other recent analyses, including by the New Climate Economy, in several ways –
from the sectoral approach, baseline assumptions and level of ambition of future scenarios, to the feasibility of investments needed. Thus, the results are not directly
comparable. It is also important to note that this analysis was undertaken prior to the
full impacts of Covid-19 being known. Hence, the baseline scenario, for example, does
not factor in the potential economic impacts of Covid-19 on emissions pathways. Any planned future analysis will be adjusted to take this into account.
The baseline scenario reflects countries’ commitments in their first round of
Nationally Determined Contributions (NDCs) under the Paris Agreement, but not the
latest updates. This means the abatement potential between 2020 and 2050 identified
in the analysis is all additional to the first round of NDCs. For details on data sources,
measure-specific assumptions and analytical steps, see Annex 1.
Second, Vivid Economics modelled the incremental investments through 2050 – that
is, investments beyond baseline levels – needed to realise the abatement potential
identified by SEI, using existing technologies and practices, and accounting for
learning that would reduce costs over time. They also modelled the cumulative returns on those investments through 2050. Across all countries, the estimates presented in
this report are net returns (i.e. net present value, or the extent to which benefits
exceed costs over the period to 2050), discounted at 3.5% per year, assuming a 2.5% annual increase in real energy prices from 2014 levels. That is the central scenario in
the analysis; for a comparison of results with different assumptions, see Annex 2, Part
3. Note that the economic returns estimate only considers direct energy and material cost savings and is thus partial. The returns would be higher if factors such as time
savings from avoided congestion, increased productivity, improved health and
environmental quality, and avoided climate change impacts were taken into account.
Finally, the Vivid analysis estimates the direct, indirect and induced jobs (full-time
equivalent) that the modelled measures could support in 2030 and 2050, taking into
account technology-specific labour productivity factors and adjusted to reflect typical
19
differences in labour productivity between OECD and non-OECD countries. The
estimates are based on uniform labour productivity assumptions for the six countries and provide indicative job numbers. Further work should collect more country-specific
information to refine the results. The job numbers reflect an estimate of net jobs by
comparing green investment with an equivalent investment in fossil fuel projects,
while fully recognising the uncertainties in such counterfactuals. In all of these categories, we provide overall numbers as well as selected sector- and measure-
specific estimates. For details on data sources and the full methodology, see Annex 2.
The third modelling exercise that informed our analysis was by the Marron Institute of Urban Management at New York University, which examined the scale and
composition of the conversion of land to urban purposes in each of the six countries
in the period 2000–2014. The results show not only how much cities’ collective footprint grew in that time, but also what they displaced: farmland, built-up rural areas,
forests, grassland, etc. For a detailed methodology, see Annex 3.
Finally, recognising that coastal populations are particularly exposed to climate
change impacts, including sea-level rise, storm surges and other hazards, we drew on
the work of the Institute for Demographic Research at City University of New York, the
Center for International Earth Science Information Network at Columbia University,
and the Institute of Development Studies to estimate the share of each country’s
population living in coastal zones at less than 10 metres above sea level, and the
urban share of that population. While a detailed mapping of coastal climate risks in
the six countries is beyond the scope of this report, this analysis provides some indication of the extent of the risk. For a detailed methodology, see Annex 4.
The four modelling exercises inform analysis in this report as well as the Coalition’s
global synthesis report, based on detailed literature reviews (including policy
documents, peer-reviewed studies, grey literature and media coverage) and close collaboration with experts in each country, with additional input from a wide range of
Coalition partners. The recommendations for Brazil are further informed by
discussions with a broader range of Brazilian urban experts on national policy priorities for advancing low-carbon urban development.

20
HOW URBAN ACTION CAN DRIVE DECARBONISATION
AND ECONOMIC GROWTH
Cities are not the main source of Brazil’s greenhouse gas emissions, but they can still play a key role in decarbonising the economy. About 56% of Brazil’s GHG emissions in 2016 came from agriculture and from land-use change and forestry.105 Though emissions vary from year to year, from 1990 through 2016, national data show the main sectors relevant to urban emissions – energy, waste and industrial processes – generally produced less GHGs than the land use sectors. Still Brazilian cities generate significant emissions,106 and as economic and population hubs, they have key roles to play in shifting the economy towards a net-zero future. For example, Brazil’s automotive industry is claiming its place in the electric vehicle market; the country now has multiple EV production plants, making everything from batteries to 22-metre articulated buses, and São Paulo, Rio de Janeiro, São José dos Campos and other cities are adopting electric buses and even garbage trucks.107
Economic analysis has shown that Brazil can realise major economic gains by investing in a low-carbon, climate-resilient Covid-19 recovery. A 2020 New Climate Economy report found that such a strategy could potentially deliver a GDP gain of US$535 billion (BRL 2.8 trillion) by 2030, compared with business as usual.108 It could also potentially create more than 2 million additional jobs in 2030, which is four times more than the current number of jobs in Brazil’s oil and gas industry. At the same time, it could reduce GHG emissions by 42% from 2005 levels. Brazil did not enhance the ambition of its climate commitments in its 2020 NDC submission, but it is not too late to do so.
New modelling for the Coalition shows that urban action can reduce GHGs, generate cost savings and create jobs. Implementing a bundle of low-carbon measures in the buildings, transport and waste sectors could enable Brazil to cut its urban GHG emissions from those sectors by 75 Mt CO2e (35%) in 2030 and 238 Mt CO2e (88%) in 2050, compared with a baseline scenario.109 Substantial incremental investments would be needed – US$1.7 trillion by 2050 – but they could more than pay for themselves through energy and materials savings alone, yielding cumulative returns with a net present value of US$369.7 billion by 2050.110 They could also support more than 4.5 million new jobs in 2030.

21
Figure 4. The economics of selected low-carbon measures in Brazilian cities
Source: Modelling by Vivid Economics.111 Note: These job and growth numbers are based on scenarios and are not forecasts of future outcomes. The job numbers in particular are subject to a high level of uncertainty, as explained in Annex 2, and should be interpreted with caution.
The transport sector holds 45% of Brazil’s urban abatement potential to 2050, and also some of the most economically attractive options (Figure 5). Shifting travel from cars to public transit, for example, would require incremental investments of US$29.6 billion to 2050, but could yield returns with a net present value of US$223.3 billion. Another US$350 million invested in vehicle efficiency, the modelling shows, could yield returns by 2050 with a net present value of US$7.95 billion. Shifting to electric vehicles, meanwhile, could support an estimated 128,000 jobs in 2030. As noted above, Brazil is already producing EVs and components, and EV and hybrid car sales have accelerated dramatically in recent years, from just 117 in 2012, to 19,745 in 2020 (a 66.5% jump from 2019 alone, even as total car sales dropped).112 However, as a global leader in bioethanol production, Brazil has prioritised that option instead for passenger vehicles, and EV growth to date has been almost entirely in hybrids. There are only 350 recharging stations across the country, and EVs are treated less favourably than flex-fuel vehicles.113 Addressing these challenges is key to growing the EV market.

22
Figure 5. Technically feasible potential to reduce GHG emissions from Brazilian cities by 2050, by sector
Source: Modelling by the Stockholm Environment Institute for the Coalition.114
Energy efficiency in residential and commercial buildings holds another 28% of Brazil’s urban abatement potential, the modelling shows. Buildings accounted for 51% of total electricity consumption in 2017,115 so they are prime targets for low-carbon measures.116 There are also significant opportunities to build more energy-efficient housing, especially with a focus on affordable housing and retrofits of well-situated and underutilised buildings.117 Economic modelling for the Coalition suggests that many of the required investments, especially in deep retrofits for energy efficiency, would take decades to pay for themselves, but they have strong job creation potential. In 2030, building retrofits and energy-efficient construction in the residential and commercial sectors combined could support over 577,000 new jobs. At a time when so many low-income Brazilians are unemployed and many also lack adequate housing, this offers a prime opportunity for economic stimulus, with lasting benefits. In a country with relatively high electricity rates, improved energy efficiency can also help cash-strapped households reduce their bills.118
Over half of Brazil’s urban abatement potential is found in cities that currently have fewer than 1 million residents. São Paulo, Brazil’s only city with over 10 million residents, accounts for 19% of urban abatement potential in 2050, and cities with 1–10 million residents account for 29%, the modelling shows. The large share of potential in small and mid-size cities suggests that unlocking Brazil’s full urban mitigation potential will depend on supporting cities with limited resources and technical capacity, so they can launch ambitious measures. As noted before, it is also crucial to tailor solutions to the needs of specific cities and regions.
23
UNLOCKING THE POTENTIAL OF BRAZIL’S CITIES
Brazil is a large and diverse country, with significant cultural, environmental and economic differences between regions that have helped shape urbanisation patterns, and will continue to do so. Any effort to decarbonise Brazil’s economy and build resilience, including in cities, needs to recognise that diversity when defining actions and priorities. It also needs to protect and respect the autonomy of municipalities, as established by law, enabling cities to manage key decisions about urban land use, transport and services.
Still, a national strategy to promote compact, connected, clean and resilient cities – backed by targeted investments, policies and capacity-building – could be transformative. Not only could it curb urban GHG emissions, but it could leverage low-carbon and resilience-building efforts to reduce poverty and inequality, raise living standards and spur economic growth.
Brazil’s economy was struggling even before the pandemic, and the Covid-19 crisis has been devastating. In response, Brazil’s government has rightfully stepped up spending to try to energise the economy. As of February 2021, it had approved US$224 billion in fiscal stimulus – but very little for decarbonisation or resilience-building.119 A bill providing US$700 million in emergency aid to maintain public transport service levels despite reduced ridership was vetoed in December.120 The federal government has provided support for industry and aviation and relaxed restrictions on logging, mining and other development.121 On the positive side, it has allocated some funds to renewable energy, and it approved green bonds for sustainable infrastructure that are expected to attract nearly US$34 billion by 2029.
Future stimulus efforts should prioritise low-carbon urban measures – especially those with high job creation potential and/or large benefits for the poor. Investments in public transport, pedestrian and cycling infrastructure, and building energy efficiency all have strong stimulus potential.
Building on the initial findings of this report, WRI Brasil consulted with experts on urban development between November 2020 and February 2021 and identified six opportunities for action at the national level:122
Establish a national strategy for cities that promotes sustainable economic growth, social inclusion and environmental sustainability, with tailored approaches to meet the needs in different regions and city types.
Develop and support metropolitan governance to foster integrated and sustainable urban development.
Prioritise low-carbon transport investments, including multi-modal integrated transport networks and electrification, to reduce air pollution and GHGs and enhance urban accessibility.
24
Revamp national housing programmes and policies to ensure they provide safe, affordable and sustainable urban housing with access to jobs and basic services.
Support cities in expanding finance for low-carbon and resilience-building projects to improve service delivery and help address infrastructure investment deficits.
Promote fiscal reforms that balance the distribution of tax revenues to cities and align fiscal incentives to promote low-carbon sectors and actions in urban areas.
In this final section of the report, we examine each option in greater depth.
Establish a national strategy for cities that promotes sustainable economic growth, social inclusion and environmental sustainability
Brazil has a long history of shaping the urban agenda through national policies. Building on the 1988 Constitution, the 2001 City Statute is Brazil’s most important national urban policy, establishing a straightforward legal framework for Brazilian cities and nationwide urban principles. However, it does not lay out a vision for future urban development across the country, nor was it intended to. The 20th anniversary of the City Statute in 2021 offers an opportunity to expand on its principles and tools and develop a broader strategy for compact, connected, clean and resilient urban cities throughout Brazil.
Brazil can build an effective national level urban development strategy by:
• Defining a common vision for the future of Brazilian cities (a new urban agenda). Starting with a green recovery from the Covid-19 crisis, it should lay out a pathway to more equitable cities and foster a just transition to a low-carbon economy. This could be embedded in the new National Urban Development Policy (PNDU) that is now under development.
• Building on existing plans and policies, including the City Statute, the Statute of the Metropolis, the National Urban Mobility Policy, the National Regional Development Policy, the National Climate Change Policy and the National Adaptation Plan, among others.
• Identifying differentiated objectives and strategies for cities that reflect the diversity of Brazil’s urban areas. This could be done by establishing a typology of cities that considers their population, economic structure, carbon-intensity, climate vulnerabilities and other factors, as well as their function in urban networks and the region in which they are situated.
• Deploying a climate and resilience diagnostics system for cities, with a set of indicators that municipalities can use to set baselines and track progress.123 At the very least, this should include GHG emissions data and key measures of
25
vulnerability (e.g. water scarcity or exposure to specific disaster risks). Two key sources of data can be the recent launched SEEG Municípios (the Municipal Gas Emission Estimate System)124 and CEMADEN (the National Centre for Monitoring and Alerts on Natural Disasters).125
• Creating new models of governance for planning, management and project implementation in urban areas. These should include inter-federative legal arrangements and financing options.
• Establishing a monitoring and evaluation system at the national level to track the implementation of this new urban agenda. This should include a way to identify challenges that arise and make adjustments as needed.
• Creating a national capacity-building campaign to help municipalities to implement the new urban agenda and adopt approaches tailored to each city’s needs.
Develop and support metropolitan governance to foster integrated and
sustainable urban development
Urban challenges often extend across municipal boundaries. To address them effectively and achieve a transition to more just and sustainable urban development, integrated management of metropolitan areas is key. National data show that 74 metropolitan areas house more than half of Brazil’s population.126 This means most Brazilians depend on urban services or infrastructure (e.g. mobility, water, sanitation, solid waste management) that are part of metropolitan dynamics. Enabling metropolitan-scale management and delivery of such urban services and infrastructure could expand their availability, improve quality and reduce costs.
The national government can support metropolitan-scale planning, governance and management by:
• Advancing and enhancing the legal framework established by Metropolis Statute. Specifically, it is important to implement the Integrated Urban Development Plans (PDUI) envisioned under the statute, and to define Public Functions of Common Interest (FPIC) and implement arrangements for managing them jointly.
• Reviewing and refining the criteria and requirements for establishing Metropolitan Areas. It is important to maintain alignment with state governments’ responsibility and autonomy for defining metropolitan areas, and link these requirements to the recently launched National Regional Development Policy (PNDR).
• Defining financing mechanisms oriented to support metropolitan-level action, including the creation of a metropolitan fund and special credit lines, as well as continued improvements to the regulatory framework for municipal consortia to access debt finance.
26
• Creating standardised models of governance for metropolitan areas as well as specific guidelines and capacity-building on how to deliver FPICs.
• Considering the metropolitan level when defining and allocating responsibilities in all kinds of national level policies that relate to urban areas.
Prioritise low-carbon transport investments, including multi-modal transport networks and electrification, to reduce air pollution and GHGs and enhance
urban accessibility
As noted earlier, modelling for the Coalition found that the transport sector holds 45% of Brazil’s urban abatement potential to 2050, making it a priority for climate action. Investments in high-quality public transit and in non-motorised transport are also crucial for ensuring broad access to urban services and job opportunities, a key factor in reducing inequality.
Given the multiple benefits of low-carbon transport, it makes sense for Brazil to prioritise it. The national government can do so by:
• Redefining priorities for national tax incentives and subsidies to promote the growth of sustainable, low-carbon transport options, taking care to avoid misalignments between policies and tax incentives. Tax structures need to be revamped to reflect the externalities of private motorised transport and make sustainable transport, including EVs, affordable for all.
• Aligning national transport finance flows and policies to promote social inclusion: from building high-performance transit systems in lower-income neighbourhoods, to creating multi-modal transport networks where pedestrians and cyclists are as safe as drivers and can seamlessly access public transit as part of their trips.
• Putting urban mobility at the core of a national strategy to reduce inequality by improving access to city services and economic opportunities for all residents. Policy-makers should also explicitly connect mobility and land use planning to help achieve the goals of the new urban agenda.
• Fully implementing the National Urban Mobility Policy and the National Vehicle Emissions Control Programme, with appropriate monitoring and evaluation. This would foster a more efficient, equitable and sustainable transport system.
• Investing in models and capacity-building for a better planning and management of urban mobility, especially at the metropolitan scale.
• Strengthening links between the national transport and energy agendas, especially in the context of electric vehicles. Design legal frameworks that help accelerate both clean energy and transportation solutions, aligned with each other.
27
Revamp national housing programmes and policies to ensure they provide safe,
affordable and sustainable urban housing with access to jobs and basic services
Modelling for the Coalition found that the buildings sector holds 28% of Brazil’s urban abatement potential to 2050. At the same time, the sector is a major source of jobs and economic activity – and housing is a basic human need. With the right guiding principles and criteria, national housing programmes could help shift the sector onto a low-carbon pathway, while promoting sustainable urban development at scale. Well-planned housing construction is also key for making cities more compact, connected cities and accessible, a factor in reducing inequality. Depending on the materials and designs used, it can be a catalyst for energy transformation as well.
Brazil can achieve multiple benefits through a revamped national housing strategy by:
• Prioritising housing provision in areas with existing infrastructure – especially where it is now underutilised –and providing quality urban infrastructure and formalization to areas with informal settlements. This should be complemented by national programmes to make housing more affordable for lower-income people, such as through rentals and subsidised mortgages not only for new construction, but also for upgrades and retrofits.
• Establishing site selection criteria for new housing projects – especially those that use undeveloped land. The criteria should be consistent with compact, connected, clean and resilient development. The government should also provide the necessary funds or financial instruments to make well-situated land available for housing provision.
• Creating building codes and standards for building efficiency in national housing programmes. These should define different types of housing, standardise and recommend materials, and provide technical assistance to ensure that new housing built with federal subsidies is both energy-efficient and resilient to climate change, including in the choice of building materials and technologies used. It is also important to promote greener basic infrastructure, such as the use of nature-based solutions for drainage and sanitation.
• Fostering the implementation of existing mechanisms in the urban legislation to convert underutilised buildings and properties into housing. In this context, it may be helpful to enable legal arrangements such as PPPs for social housing management, as well as public-popular partnerships and public-private-popular partnerships.127
• Establishing a legal framework for implementation of municipal-level incentives for building efficiency, such as IPTU Verde (green discounts on property taxes).128

28
Support cities in expanding finance for low-carbon and resilience-building
projects to improve service delivery and help address infrastructure investment
deficits
Brazil already has a large infrastructure gap, and filling it in a way that supports sustainable urban development will require significant investments. At the same time, a low-carbon agenda may open up new sources of funding and finance, such as green and climate funds and impact investors. The national government has a key role in creating enabling conditions for cities to access these opportunities, while continuing to expand domestic options for financing sustainable urban infrastructure.
The Brazilian government can expand finance for low-carbon and resilient infrastructure in cities by:
• Facilitating and removing barriers to investment flows to municipalities. For public investments, national development banks (NDBs) should take the lead in accessing international funds and using domestic financial resources to create credit lines and programmes focused on sustainable urban development. NDBs – particularly BNDES and CAIXA – should also directly finance urban projects. It is also important to provide more guaranty options for municipalities seeking to borrow. To facilitate private investment flows, the national government should keep improving the regulatory framework for attracting private investment (including, but not limited to, PPPs).
• Creating green Covid-19 recovery packages focused specifically on urban areas and designed so they are easily accessible by municipalities.
• Investing at national scale in capacity-building for municipalities on project origination, structuring and aggregation. A national programme should be established to create a robust pipeline of bankable sustainable urban development projects. This should build on the recent Program of Investment Partnerships (PPI),129 which focused on public-private partnerships, but be expanded to all types of projects and business models.
• Creating a system for prioritising funding and financing of low-carbon urban projects in the project approval processes of development banks and national development agencies.
Promote fiscal reforms that balance the distribution of tax revenues to cities
and align fiscal incentives to promote low-carbon sectors and actions in urban areas
Rebalancing the fiscal situation in Brazilian cities is as important as accessing new financial resources. The national government has a key role in promoting much-needed reforms and fostering better fiscal management by municipalities.
29
Brazil can advance fiscal reforms at the city level by:
• Implementing reforms in the Federative Pact – the fiscal structure that allocates revenue and spending responsibilities among federative entities (that is, the 26 states and Federal District, plus the 5,570 municipalities) – in order to rebalance revenue transfers to municipalities and consider metropolitan regions. Reforms should also be considered to create a new national tax or incentives to harmonise fiscal objectives with the promotion of low-carbon, socially inclusive and environmentally sustainable economic development. In particular, pricing incentives to foster multi-modal transportation, low-carbon mobility, and compact and dense urban development should be aligned with the fiscal structure.
• Standardising implementation of municipal taxes and fees, with a focus on the application and efficiency of property taxes (IPTU). National guidance on how to implement LVC instruments is also needed, including how to manage floor area ratios (FAR) and strategies for promoting inclusion, to ensure that Brazilian cities use LVC more effectively.
• Responsibly expanding municipalities’ fiscal space, through regulatory schemes that allow more private participation in sustainable urban development, such as through PPPs.
• Incentivising better tax management and public expenditure by using criteria for approving national-level investments that go beyond debt capacity evaluation (CAPAG) and that reward good fiscal management.
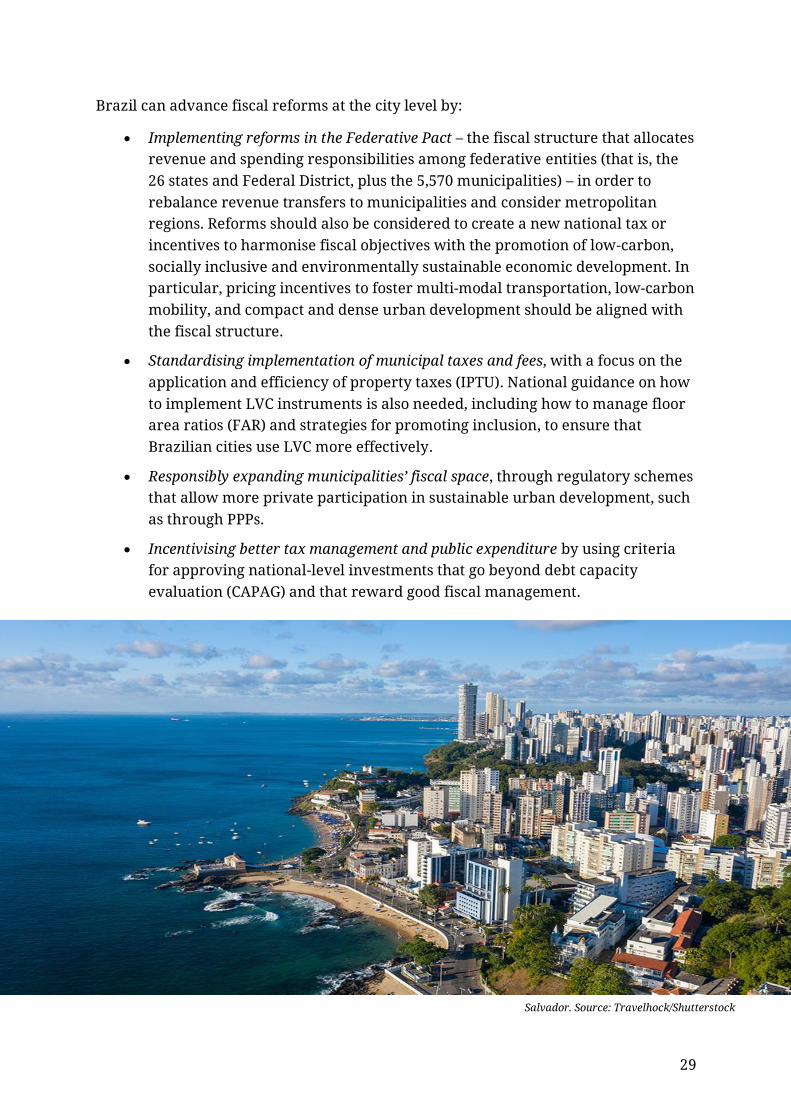
Salvador. Source: Travelhock/Shutterstock
30
ENDNOTES
1 CUT, 2019, “Climate Emergency, Urban Opportunity: How National Governments Can Secure Economic Prosperity and Avert Climate Catastrophe by Transforming Cities.” 2 Their collective share in 2019 was 31.7%, including 17.3% from China. Authors’ calculations based on World Bank GDP data (PPP, in current international $). See https://data.worldbank.org/indicator/NY.GDP.MKTP.PP.CD. 3 Authors’ calculations based on 2018 data from the International Energy Agency (total CO2 emissions): https://www.iea.org/data-and-statistics. 4 Authors’ calculations based on 2018 data from UN DESA, 2018, “World Urbanization Prospects: The 2018 Revision.” China alone is home to 20% of the world’s urban residents, and India, to another 11%. 5 CUT, 2021, “Seizing the Urban Opportunity: How National Governments Can Recover from COVID-19, Tackle the Climate Crisis, and Secure Shared Prosperity through Cities.” 6 CUT, 2019, “Climate Emergency, Urban Opportunity: How National Governments Can Secure Economic Prosperity and Avert Climate Catastrophe by Transforming Cities.” 7 Vivid Economics, 2021, “Greenness of Stimulus Index: An Assessment of COVID-19 Stimulus by G20 Countries and Other Major Economies in Relation to Climate Action and Biodiversity Goals (February 2021 Release).” 8 C40 Cities, 2020, “How to Build Back Better with a 15-Minute City.” 9 See http://www.citiesracetozero.org and the listing of cities in the Climate Ambition Alliance, at https://climateaction.unfccc.int/views/cooperative-initiative-details.html?id=94. As of June 2021, six Brazilian cities had joined: São Paulo, Rio de Janeiro, Salvador, Curitiba, Ouro Preto and Terra Nova Du Norte. 10 UN DESA, 2018, “World Urbanization Prospects: The 2018 Revision.” 11 IPEA, 2016, “Relatório Brasileiro Para o Habitat III.” 12 From 2000 to 2015, Brazil’s urban population grew by about 24%, but that growth was very unevenly distributed. The population of cities with more than 5 million residents grew by 40% that of cities with 300,000–500,000 residents grew by 58%. As of 2015, however, more than 2 in 5 urban residents were in cities with fewer than 300,000 residents. See data in UN DESA, 2018, “World Urbanization Prospects: The 2018 Revision.” Note that these size classifications differ from those used by the Brazilian government; UN DESA data are used across the Seizing the Urban Opportunity report package for consistency and comparability across countries. UN DESA’s unit of measurement is “urban agglomerations”, not municipalities or metropolitan areas: “The term ‘urban agglomeration’ refers to the population contained within the contours of a contiguous territory inhabited at urban density levels without regard to administrative boundaries. It usually incorporates the population in a city or town plus that in the suburban areas lying outside of, but being adjacent to, the city boundaries. Whenever possible, data classified according to the concept of urban agglomeration are used. However, some countries do not produce data according to the concept of urban agglomeration but use instead that of metropolitan area or city proper. If possible, such data are adjusted to conform to the concept urban agglomeration. When sufficient information is not available to permit such an adjustment, data based on the concept of city proper or metropolitan area are used.” (FAQ on “World Urbanization Prospects” website: https://population.un.org/wup/General/FAQs.aspx.) 13 See, e.g., Muñoz Miranda and Martínez-Vázquez, 2018, “Metropolitan Financing in Brazil: Current Trends and Lessons from the International Experience.”
31
14 UN DESA, 2018, “World Urbanization Prospects: The 2018 Revision.” Note that these size classifications do not match those used by the Brazilian government. See endnote 12 for details. 15 See World Bank data: https://data.worldbank.org/indicator/NY.GDP.PCAP.PP.KD?locations=BR. 16 See World Bank data: https://data.worldbank.org/indicator/SI.POV.DDAY?locations=BR. This is the share of people living on less than US$1.90 per day (2011 PPP). If the rate in 2011 had been the same as in 1990, 43.6 million Brazilians would have lived in extreme poverty, instead of 5.5 million. 17 See World Bank data: https://data.worldbank.org/indicator/SI.POV.GINI?locations=BR. The Gini index measures how evenly income or wealth are distributed, with 0 representing perfect equality. Brazil’s Gini index dropped from 60.5 in 1990 to 52.1 in 2014 and has since risen slightly, to 53.4 in 2019. For comparison, the OECD average in 2019 was 31.0. See OECD, 2020, “OECD Economic Surveys: Brazil 2020.” 18 GDP per capita grew by 73% from 2000 to 2014, to US$15,719 (PPP, current international $); see World Bank data: https://data.worldbank.org/indicator/NY.GDP.PCAP.PP.CD?locations=BR. Meanwhile, from 2001 to 2014, the extreme poverty ratio (US$1.90, PPP, 2011) dropped from 11.5% to 2.7%. See World Bank data: https://data.worldbank.org/indicator/SI.POV.DDAY?locations=BR. 19 GDP per capita was US$15,300 in 2019 (PPP, current international $), or about 2.7% lower than in 2014. See World Bank data: https://data.worldbank.org/indicator/NY.GDP.PCAP.PP.CD?locations=BR. 20 See World Bank data: https://data.worldbank.org/indicator/SL.UEM.TOTL.ZS?locations=BR. The unemployment rate nearly doubled from 2014 to 2017, from 6.7% to 12.8%; it had been declining slowly before the pandemic. 21 See notes 16 and 17, as well as Figure 4 in OECD, 2020, “OECD Economic Surveys: Brazil 2020.” 22 See Johns Hopkins University Coronavirus Resource Center: https://coronavirus.jhu.edu/data/mortality and Reuters Covid-19 tracker: https://graphics.reuters.com/world-coronavirus-tracker-and-maps/countries-and-territories/brazil/. As of 28 June 2021, at least 96.9 million vaccine doses had been administered, enough for about 23% of the population if all required two doses, Reuters estimated. 23 IMF, 2021, World Economic Outlook – Update January 2021: Policy Support and Vaccines Expected to Lift Activity. GDP growth for 2021 is projected to be 3.6%. 24 OECD, 2020, “OECD Economic Surveys: Brazil 2020.” 25 McGeever, 2020, “Brazil Unemployment Rate Hits Record High 14.6%, as People Return to Look for Work,” Reuters. The average unemployment rate for 2020 was 13.5%, with stark regional variations (for example, in the state of Pará, it was only 10.4%, while in Amazonas it was 15.8%; in Rio de Janeiro, 17.4%; and in Bahia, 19.8%). The previous record high was in 2017, averaging 12.7% for the year across Brazil; the 2019 nationwide average was 11.9%. See Barros, 2021, “Com pandemia, 20 estados têm taxa média de desemprego recorde em 2020,” Agência IBGE Notícias. 26 Data Favela, 2020, “Pandemia Na Favela: A Realidade de 14 Milhoes de Favelado No Combate Ao Novo Coronavírus.” 27 The Data Favela study covered more than 3,300 households. See also this study focused on São Paulo: Manfrinato et al., 2020, “High Prevalence of Food Insecurity, the Adverse Impact of COVID-19 in Brazilian Favela,” MedRxiv.

32
28 Maia, 2021, “Mais de 80% das famílias nas favelas dependem de doações para se alimentar,” Veja Rio. This survey, also by the Data Favela project, covered 2,087 people in 76 favelas. With the end of emergency food aid, 68% of respondents said their food supply had been affected by the pandemic, up from 43% in August 2020. Eating three meals a day, they said, was not always possible. 29 Coates, 2018, “Exploring Disaster Eventfulness in Urbanizing Brazil,” Peace Review; Marques and Saraiva, 2017, “Urban Integration or Reconfigured Inequalities? Analyzing Housing Precarity in São Paulo, Brazil,” Habitat International; Rasch, 2016, “Assessing Urban Vulnerability to Flood Hazard in Brazilian Municipalities,” Environment and Urbanization. 30 OECD, 2020, “OECD Economic Surveys: Brazil 2020.” 31 Fantoni, Guillaumon, and Branco, 2019, “The Reshaping of Brazil’s Infrastructure Is Likely to Become a Reality,” in Brazil 2020 – Opportunity Tree. 32 Authors’ calculations based on the National Household Sample Survey (PNAD), 2001 (https://www.ibge.gov.br/en/statistics/social/labor/20620-summary-of-indicators-pnad2.html), and PNAD Contínua, 2018 (https://www.ibge.gov.br/estatisticas/sociais/habitacao/17270-pnad-continua.html). There are, however, large regional differences. See also Bellandi, 2020, “Um em cada três domicílios não tinha ligação com rede de esgoto em 2019,” Agência IBGE Notícias. 33 Studart, Keneally, and Calixto, 2020, “Infraestrutura Sustentável Pode Ser Alicerce Para o Brasil Reconstruir a Economia Pós Covid-19,” WRI Brasil (blog). 34 Jabur, 2018, “Brazil to Power up Investments in Street Lighting and Energy Efficiency,” World Bank. The Financial Instruments for Brazil Energy Efficient Cities (FinBRAZEEC) Project is a partnership between the World Bank and Caixa Economica Federal (CEF), the second-largest state-owned financial institution in Latin America. The project is expected to make more than US$1 billion available for urban energy efficiency projects. 35 Pavanelli and Barrozo, n.d., “Brazil’s New Sanitation Bill To Draw Domestic And Foreign Private Investment,” Forbes. 36 BNamericas, 2021, “Opening the Floodgates to Private Investment in Brazil’s Water Sector.” 37 Caetano, 2020, “Como a Natureza Pode Garantir a Infraestrutura de Saneamento No Brasil | Exame Invest,” Exame. 38 Abers et al., 2018, “Porto Alegre: Participatory Budgeting and the Challenge of Sustaining Transformative Change.” 39 The social function of the city also puts collective interest above individual property interests. For an overview of the history of this principle in the City Statute, as well as discussions of how well it has been put into practice, see, e.g., Bassul, 2010, “City Statute: Building a Law,” in The City Statute of Brazil: A Commentary; Rossbach et al., 2016, Estatuto Da Cidade: A Velha e a Nova Agenda Urbana. 40 Moscarelli et al., 2017, “The Challenges of Integrated Urban Planning and Management in Brazil: Analysis of the Ministry of Cities Experience,” Urbe. Revista Brasileira de Gestão Urbana; Fernandes, 2007, “Implementing the Urban Reform Agenda in Brazil,” Environment and Urbanization; see also Scruggs, 2019, “Ministry of Cities RIP: The Sad Story of Brazil’s Great Urban Experiment,” The Guardian. 41 Somers and Baud, 2015, My House, My Life: Decision-Making Processes and Local Citizen Participation in Housing Project Minha Casa, Minha Vida in Salvador Da Bahia; e Silva, 2020, “Addressing the Housing Shortage without Building Cities: The Minha Casa Minha Vida Program, Brazil,” in Communities, Land and Social Innovation. 42 See Libertun de Duren, 2018, “Why There? Developers’ Rationale for Building Social Housing in the Urban Periphery in Latin America,” Cities. New housing complexes built under Minha

33
Casa, Minha Vida between 2010 and 2013 were at a median distance of 25 km from the city centre. 43 Mahendra and Seto, 2019, “Upward and Outward Growth: Managing Urban Expansion for More Equitable Cities in the Global South.” 44 Government of Brazil, 2021, “Programa Casa Verde e Amarela agora é lei,” Noticias. 45 Analysis by the Marron Institute of Urban Management, New York University. See Annex 3 for a detailed methodology. 46 Analysis for the Coalition by the Marron Institute of Urban Management, New York University. See Annex 3 for a full description of the data sources, approach and limitations: https://urbantransitions.global/urban-opportunity/seizing-the-urban-opportunity/annexes/. 47 SUDECO, 2019, “Plano Regional de Desenvolvimento Do Centro-Oeste – 2020–2023.” 48 See IBGE data: https://www.ibge.gov.br/en/cities-and-states/pa/parauapebas.html; see also Romero, 2012, “Swallowing Rain Forest, Cities Surge in Amazon,” The New York Times. 49 Oliveira et al., 2021, “Novo Plano de Ação Da Região Metropolitana de Campinas Conecta Restauração e Biodiversidade,” WRI Brasil (blog); Pacheco, 2019, “Como Extrema Se Tornou Um Caso de Sucesso Em Restauração,” WRI Brasil (blog). See also Ozment and Feltran-Barbieri, 2018, “Help for São Paulo’s Complex Water Woes: Protect and Restore Forests,” World Resources Institute (blog). 50 Rolnik and Klink, 2011, “Crescimento Econômico e Desenvolvimento Urbano: Por Que Nossas Cidades Continuam Tão Precárias?,” Novos Estudos CEBRAP. 51 de Medeiros, da Fonseca, and de Silva, 2020, “Sustainable Urban Interventions in the Rainforest: The Experience of the City of Manaus in Brazil,” Springer Nature Applied Sciences. 52 Rubim and Leitão, 2013, “O Plano de Mobilidade Urbana e o Futuro Das Cidades,” Estudos Avançados. 53 Authors’ calculations based on Ministry of Infrastructure data (December of each year), available at https://www.gov.br/infraestrutura/pt-br/assuntos/transito/conteudo-denatran/frota-de-veiculos-2020. The number of automobiles rose from just under 20 million, to 58 million; motorcycles increased from 3.6 million to 23.9 million. UN estimates put Brazil’s population at 174.8 million in 2000 and 212.6 million in 2020. See UN DESA, 2019, “World Population Prospects 2019.” 54 Numbers are as of December 2020 and are for passenger cars only, not all vehicles. See data by municipality at https://www.gov.br/infraestrutura/pt-br/assuntos/transito/conteudo-denatran/frota-de-veiculos-2020. 55 INRIX, 2020, “INRIX 2019 Global Traffic Scorecard.” 56 Government of Brazil, 2020, “Brasil registra queda em número de mortes no trânsito,” Noticias. 57 Vital Strategies, 2019, “How One City in Brazil Reduced Road Crash Deaths by a Remarkable 40%,” Vital Stories (blog). 58 Ministério da Saúde, 2019, “Saúde Brasil 2018: Uma Análise Da Situação de Saúde e Das Doenças e Agravos Crônicos: Desafios e Perspectivas”; see also Bravo et al., 2016, “Air Pollution and Mortality in São Paulo, Brazil: Effects of Multiple Pollutants and Analysis of Susceptible Populations,” Journal of Exposure Science & Environmental Epidemiology; Miraglia and Gouveia, 2014, “Costs of Air Pollution in Brazilian Metropolitan Regions,” Ciencia & Saude Coletiva. 59 ANTP, 2020, “Relatório Geral 2018.” The data cover municipalities with 60,000 or more residents as of 2014, which are home to about 65% of Brazilians. 60 Lindau, Hidalgo, and Facchini, 2010, “Curitiba, the Cradle of Bus Rapid Transit,” Built Environment.
34
61 See Global BRT Data: http://brtdata.org/location/latin_america/brazil. 62 Venter, Mahendra, and Hidalgo, 2019, “From Mobility to Access for All: Expanding Urban Transportation Choices in the Global South.” 63 Halais, 2019, “Rio’s Defunct Gondola Tells a Tale of Transit Style Over Substance,” WIRED. 64 Venter, Mahendra, and Hidalgo, 2019, “From Mobility to Access for All: Expanding Urban Transportation Choices in the Global South.” 65 Along with Venter et al., 2019, cited above, see the web page for the WRI Brasil project Ruas Completas (“complete streets”): https://wribrasil.org.br/pt/o-que-fazemos/projetos/ruas-completas. 66 See https://www2.camara.leg.br/legin/fed/lei/2012/lei-12587-3-janeiro-2012-612248-norma-pl.html. 67 Venter, Mahendra, and Hidalgo, 2019, “From Mobility to Access for All: Expanding Urban Transportation Choices in the Global South.” 68 Lessa, Lobo, and Cardoso, 2019, “Accessibility and Urban Mobility by Bus in Belo Horizonte/Minas Gerais – Brazil,” Journal of Transport Geography; Fontoura, Chaves, and Ribeiro, 2019, “The Brazilian Urban Mobility Policy: The Impact in São Paulo Transport System Using System Dynamics,” Transport Policy; Vasconcellos, 2018, “Urban Transport Policies in Brazil: The Creation of a Discriminatory Mobility System,” Journal of Transport Geography. 69 Fernandes, 2010, “The City Statute and the Legal-Urban Order,” in The City Statute of Brazil: A Commentary. 70 Slack, 2019, “Metropolitan Governance: Principles and Practice.” 71 Along with Slack, 2019, cited above, see Santos and Vasques, 2016, “Estatuto Da Metrópole e Gestão de Aglomerados Urbanos No Brasil,” Revista Del CESLA. 72 See https://www.gov.br/mdr/pt-br/assuntos/desenvolvimento-regional/pndr. 73 OECD, 2020, “Revenue Statistics 2020.” States collect about a quarter of tax revenue. 74 Ahmad, Brosio, and Jiménez, 2019, “Options for Retooling Property Taxation in Latin America.” 75 OECD, 2020, “Revenue Statistics 2020.” 76 IMF, 2021, World Economic Outlook – Update January 2021: Policy Support and Vaccines Expected to Lift Activity. 77 The principles that guide LVC in Brazil originated in the Embu Charter, or Carta do Embu, the outcome of a seminar held in São Paulo in June 1976: https://edisciplinas.usp.br/pluginfile.php/1894685/mod_resource/content/0/08%20Carta%20do%20Embu.pdf. 78 IBGE, 2019, “Pesquisa de Informações Básicas Municipais: Perfil Dos Municípios Brasileiros 2018.” 79 Mahendra et al., 2020, “Urban Land Value Capture in São Paulo, Addis Ababa, and Hyderabad: Differing Interpretations, Equity Impacts, and Enabling Conditions.” 80 BNDES, 2018, “Disbursements of US$ 1 Billion in Wind Energy Is the Theme of the First Green Bond Report from BNDES,” Brazilian Development Bank Press Release. 81 See Climate Funds Update Data Dashboard (Recipients): https://climatefundsupdate.org/data-dashboard/#1541245745457-d3cda887-f010 (accessed 4 May 2021). The Amazon Fund, which represents about 65% of total climate finance for Brazil, has faced a freeze in donations from Norway, its main funder, as well as Germany; see ANSA Brasil, 2019, “Fim do Fundo Amazônia poderia afetar fiscalização e projetos.” Other funds through which Brazil has been approved for finance since 2003 include the Clean Technology Fund, the Forest Investment Program, the Global Environment Facility, the Green Climate Fund, the MDG Achievement Fund and the Partnership for Market Readiness.

35
82 IDB, 2017, “Supporting National Development Banks to Drive Investment in the Nationally Determined Contributions of Brazil, Mexico, and Chile”; see also BNDES, 2018, “Disbursements of US$ 1 Billion in Wind Energy Is the Theme of the First Green Bond Report from BNDES,” Brazilian Development Bank Press Release. 83 See https://www.ppi.gov.br/about_the_program. 84 New Climate Economy, 2020, “A New Economy For a New Era: Elements for Building a More Efficient and Resilient Economy in Brazil.” 85 WRI Brasil, 2016, “Cidades Precisam de Novas Possibilidades de Financiamento Para Alavancar a Sustentabilidade,” Cidades Sustentáveis (blog). 86 IFC, 2016, “Climate Investment Opportunities in Emerging Markets: An IFC Analysis.” For example, of the US$324 billion in near-term opportunities (to 2020) identified by the IFC, US$264 million involved urban infrastructure, including US$209 billion for transport. 87 Phillips, 2020, “Climate Crisis Blamed for Rains and Floods That Have Killed 150 in Brazil,” The Guardian. 88 Hoegh-Guldberg et al., 2018, “Impacts of 1.5°C of Global Warming on Natural and Human Systems,” in Global Warming of 1.5°C. An IPCC Special Report on the Impacts of Global Warming of 1.5°C above Pre-Industrial Levels and Related Global Greenhouse Gas Emission Pathways, in the Context of Strengthening the Global Response to the Threat of Climate Change, Sustainable Development, and Efforts to Eradicate Poverty. 89 Betts et al., 2018, “Changes in Climate Extremes, Fresh Water Availability and Vulnerability to Food Insecurity Projected at 1.5°C and 2°C Global Warming with a Higher-Resolution Global Climate Model,” Philosophical Transactions of the Royal Society A: Mathematical, Physical and Engineering Sciences. 90 de Queiroz et al., 2016, “Climate Change Impacts in the Energy Supply of the Brazilian Hydro-Dominant Power System,” Renewable Energy. 91 de Queiroz et al., 2019, “Hydropower Revenues under the Threat of Climate Change in Brazil,” Renewable Energy. 92 Brito, 2018, “Water in Brazil: From Abundance to Scarcity,” Agência Brasil; Ozment and Feltran-Barbieri, 2018, “Help for São Paulo’s Complex Water Woes: Protect and Restore Forests,” World Resources Institute (blog). 93 See, e.g., Nehren et al., 2019, “Natural Hazards and Climate Change Impacts in the State of Rio de Janeiro: A Landscape Historical Analysis,” in Strategies and Tools for a Sustainable Rural Rio de Janeiro. 94 Muehe, 2010, “Brazilian Coastal Vulnerability to Climate Change,” Pan-American Journal of Aquatic Sciences. 95 This analysis merged three types of data: elevation, urban/rural classification, and population. Elevation data is from the Shuttle Radar Topography Mission (SRTM) and Multi-Error-Removed Improved-Terrain (MERIT) DEM, at a spatial resolution of 90 meters. Urban/rural classificational data is from the Global Human Settlements Layers (GHSL) produced by the Joint Research Center (JRC) of the European Commission, applies machine learning methods to Landsat satellite imagery to produce time series data on the presence of built-up area across the entire planet. Areas were classified as urban centres, quasi-urban clusters, or rural areas. Population data is from the Global Human Settlements population grid. The analysis was also run with several other data sources, including the Global Rural Urban Mapping Project (GRUMP) for urban/rural classification, as a sensitivity analysis. A full description of the data sources, approach and limitations are available in Annex 4. 96 See, e.g., Jamison and Bocca, 2021, “Balancing Growth and Sustainability: Lessons from Brazil,” World Economic Forum.
36
97 See IEA “Electricity generation by source” data: https://www.iea.org/countries/brazil. Notably, though Brazil produced almost twice as much hydropower in 2019 as it did in 1990, the share of hydro in the power supply declined by a third in that period, from 92.8%. The share of power from biofuels grew from 1.7% in 1990 to 8.7% in 2019. Wind and solar, which were not power sources at all in 1990, accounted for 8.9 and 1.1% of generation in 2019. 98 de Freitas and Kaneko, 2011, “Decomposing the Decoupling of CO2 Emissions and Economic Growth in Brazil,” Ecological Economics; de Oliveira Noronha, Zanini, and Souza, 2019, “The Impact of Electric Generation Capacity by Renewable and Non-Renewable Energy in Brazilian Economic Growth,” Environmental Science and Pollution Research. 99 Authors’ analysis based on data from IEA “Electricity generation by source” table: https://www.iea.org/countries/brazil. 100 See IEA “Electricity generation by source” data: https://www.iea.org/countries/brazil. The share of fossil fuels in the power mix was 8.7% in 2000, 23.3% in 2015, and 15.1% in 2019, the latter reflecting increases in the shares of hydro, wind, and solar. Notably, by far the largest renewable energy sector in Brazil is biofuels – a record 31.4 billion litres of ethanol from sugarcane were produced in 2019, and biodiesel production is rising, with a new peak of 5.9 billion litres produced in 2019. See IRENA, 2020, “Renewable Energy and Jobs: Annual Review 2020.” 101 See IEA “Electricity generation by source” data: https://www.iea.org/countries/brazil. 102 IRENA, 2020, “Renewable Energy and Jobs: Annual Review 2020.” 103 See ABSOLAR infographic: http://www.absolar.org.br/infografico-absolar.html. For more details, see July press release (when there were 6 GW of installed capacity): ABSOLAR, 2020, “Geração distribuída fotovoltaica cresce 230% ao ano no Brasil,” Associação Brasileira de Energia Solar Fotovoltaica. The rapid growth in distributed installations is attributed to the large cost savings for households and businesses that install solar PV. ABSOLAR claims the industry has created more than 240,000 jobs. IRENA’s estimates of solar employment are much lower, 43,000 in solar PV and 44,000 in solar heating and cooling. See IRENA, 2020, “Renewable Energy and Jobs: Annual Review 2020.” 104 Schinazi et al., 2020, “The Solar PV Revolution in Brazil: How Cities Can Take Advantage.” 105 Per official Brazilian government data; see SIRENE, 2020, “Estimativas Anuais de Emissões de Gases de Efeito Estufa No Brasil (5a Edição).” In 2016, Brazil’s total GHG emissions were estimated at 1.31 Gt CO2-e, including 422.5 Mt CO2-e from energy, 90.1 Mt CO2-e from industrial processes, 439.2 Mt CO2-e from agriculture, 290.9 Mt CO2-e from land use change, and 62.9 Mt CO2-e from waste. 106 A new emissions data platform for Brazilian cities, SEEG Municipios, was launched in March 2021, as this report was being completed (and thus too late to inform the data analysis). The tool provides valuable new information for cities and national policy-makers alike. See https://plataforma.seeg.eco.br/cities and, for information on the launch of the tool and its initial findings, the 4 March announcement (in Portuguese): https://energiaeambiente.org.br/municipios-da-amazonia-dominam-emissoes-de-carbono-20210304. 107 BNamericas, 2019, “Brazil’s Electric Bus Market to Grow Faster than Expected”; C40 Cities and The International Council on Clean Transportation, 2020, “Latin America’s Electric Bus Transition Is Irreversible,” Diálogo Chino (blog); Hampel, 2020, “BYD Opens Electric Bus Battery Factory in Brazil,” Electrive.Com (blog); Mobilidade Sampa, 2021, “Prefeitura de São José Dos Campos Apresenta o Primeiro VLP Da Linha Verde.” 108 New Climate Economy, 2020, “A New Economy For a New Era: Elements for Building a More Efficient and Resilient Economy in Brazil.”

37
109 Modelling for the Coalition by the Stockholm Environment Institute. See Annex 1 for a detailed methodology: https://urbantransitions.global/urban-opportunity/seizing-the-urban-opportunity/annexes/. It is important to note that the approaches used in the SEI modelling and New Climate Economy modelling differ in several ways – from the level of ambition of future scenarios, to the feasibility of investments needed. Thus, the results are not directly comparable. 110 Modelling for the Coalition by Vivid Economics. See Annex 2 for a detailed methodology. 111 These estimates of annual returns and net present value are sensitive to discount rates, energy prices, learning rates, and other factors. Job creation estimates are only indicative and include direct, indirect and induced full-time equivalent jobs. For a detailed methodology and data sources, see Annex 2: https://urbantransitions.global/urban-opportunity/seizing-the-urban-opportunity/annexes/. 112 ABVE, 2021, “2020: o melhor ano da eletromobilidade no Brasil,” Associação Brasileira do Veículo Elétrico (blog). 113 See the ABVE blog cited above, and also Argus Media, 2021, “Brazil’s Ethanol Producers Push Back on EVs”; Teixeira, 2020, “U.S., Brazil See Room for Global Ethanol Growth before Transition to EVs,” Reuters. 114 This analysis estimates global urban GHG abatement potential using a bottom-up assessment of mitigation options in urban buildings, transportation, infrastructure construction and waste management. For a detailed methodology, including assumptions and data sources, see Annex 1: https://urbantransitions.global/urban-opportunity/seizing-the-urban-opportunity/annexes/. 115 Dall’Agnol et al., 2018, “Acelerando a Eficiência Das Edificações No Brasil.” 116 The Green Building Council of Brazil has also argued for years that promoting green buildings could help energise a sluggish construction sector. See Eco-Business, 2017, “Building a Case for Green Buildings in Brazil.” 117 Cursino and Borgstein, 2015, “Linha de Base e Potencial de Redução de Emissões de Gases de Efeito Estufa No Setor de Habitações de Interesse Social No Brasil (Programa Minha Casa Minha Vida)”; Caccia et al., 2018, “Sustentabilidade Em Habitação de Interesse Social: Benefícios e Custos de Medidas Para Eficiência No Consumo de Água e Energia.” 118 See, for example, the favela project discussed earlier in the report: Galimberti, 2019, “PPP for Energy Efficiency in Favelas: A Success Story from Brazil,” Urbanet (blog). 119 Vivid Economics, 2021, “Greenness of Stimulus Index: An Assessment of COVID-19 Stimulus by G20 Countries and Other Major Economies in Relation to Climate Action and Biodiversity Goals (February 2021 Release).” 120 ANP Trilhos, 2020, “President of Brazil Vetoes Aid to Public Transport and Population May Be Affected by Reduced Service,” Associaçao Nacional Dos Transportadores de Passageiros Sobre Trilhos (blog). 121 Vivid Economics, 2021, “Greenness of Stimulus Index: An Assessment of COVID-19 Stimulus by G20 Countries and Other Major Economies in Relation to Climate Action and Biodiversity Goals (February 2021 Release).” 122 It is important to note that this is not an exhaustive list; however, it illustrates the range of opportunities and priority areas recommended by the experts and by the WRI Brasil team. 123 One potential model to draw on is India’s ClimateSmart Cities Framework: https://www.niua.org/csc/assessment-overview.html. 124 See https://plataforma.seeg.eco.br/cities. 125 See http://www.cemaden.gov.br/municipios-monitorados-2/.
38
126 See June 2020 data from IBGE: https://www.ibge.gov.br/geociencias/organizacao-do-territorio/divisao-regional/18354-regioes-metropolitanas-aglomeracoes-urbanas-e-regioes-integradas-de-desenvolvimento.html. 127 CartaCapital, 2019, “Parceria Público Popular: uma proposta social contra a especulação imobiliária”; Câmara dos Deputados, 2020, “Projeto cria PPP Popular para moradores executarem obras e serviços,” Portal da Câmara dos Deputados. 128 Dantas, 2014, “IPTU verde e o direito à cidade sustentável,” Revista do Programa de Pós-Graduação em Direito da Universidade Federal da Bahia. 129 See https://www.ppi.gov.br/investors.

39
REFERENCES
Abers, R., R. King, D. Votto, and I. Brandão. 2018. “Porto Alegre: Participatory Budgeting and the Challenge of Sustaining Transformative Change,” June. https://www.wri.org/wri-citiesforall/publication/porto-alegre-participatory-budgeting-and-challenge-sustaining.
ABSOLAR. 2020. “Geração distribuída fotovoltaica cresce 230% ao ano no Brasil.” Associação Brasileira de Energia Solar Fotovoltaica. July 23, 2020. http://www.absolar.org.br/noticia/noticias-externas/geracao-distribuida-fotovoltaica-cresce-230-ao-ano-no-brasil.html.
ABVE. 2021. “2020: o melhor ano da eletromobilidade no Brasil.” Associação Brasileira do Veículo Elétrico (blog). January 15, 2021. http://www.abve.org.br/2020-o-melhor-ano-da-eletromobilidade-no-brasil/.
Ahmad, E., G. Brosio, and J.P. Jiménez. 2019. “Options for Retooling Property Taxation in Latin America.” Presented at the VIII Jornadas Iberoamericanas de Financiación Local, Mexico City, October 1-2. https://www.cepal.org/sites/default/files/events/files/the_challenge_of_property_taxation_in_la_final_version_sept_25_0.pdf.
ANP Trilhos. 2020. “President of Brazil Vetoes Aid to Public Transport and Population May Be Affected by Reduced Service.” Associaçao Nacional Dos Transportadores de Passageiros Sobre Trilhos (blog). December 16, 2020. https://anptrilhos.org.br/president-of-brazil-vetoes-aid-to-public-transport-and-population-may-be-affected-by-reduced-service/?lang=en.
ANSA Brasil. 2019. “Fim do Fundo Amazônia poderia afetar fiscalização e projetos.” August 16, 2019. http://ansabrasil.com.br/brasil/noticias/brasil/natureza/2019/08/16/fim-do-fundo-amazonia-poderia-afetar-fiscalizacao-e-projetos_b67228f1-683f-4eb2-b8f1-23d1b3e6b1a3.html.
ANTP. 2020. “Relatório Geral 2018.” Sistema de Informações da Mobilidade Urbana da Associação Nacional de Transportes Público. São Paulo: National Association of Public Transport. http://files.antp.org.br/simob/sistema-de-informacoes-da-mobilidade--simob--2018.pdf.
Argus Media. 2021. “Brazil’s Ethanol Producers Push Back on EVs.” March 22, 2021. https://www.argusmedia.com/en/news/2198324-brazils-ethanol-producers-push-back-on-evs.
Barros, A. 2021. “Com pandemia, 20 estados têm taxa média de desemprego recorde em 2020.” Agência IBGE Notícias. March 10, 2021. https://agenciadenoticias.ibge.gov.br/agencia-noticias/2012-agencia-de-noticias/noticias/30235-com-pandemia-20-estados-tem-taxa-media-de-desemprego-recorde-em-2020.
40
Bassul, J.R. 2010. “City Statute: Building a Law.” In The City Statute of Brazil: A Commentary, 71–90. Cities Alliance. https://www.citiesalliance.org/resources/publications/cities-alliance-knowledge/city-statute-brazil-commentary.
Bellandi, C. 2020. “Um em cada três domicílios não tinha ligação com rede de esgoto em 2019.” Agência IBGE Notícias. May 6, 2020. https://agenciadenoticias.ibge.gov.br/agencia-noticias/2012-agencia-de-noticias/noticias/27597-um-em-cada-tres-domicilios-nao-tinha-ligacao-com-rede-de-esgoto-em-2019.
Betts, R.A., L. Alfieri, C. Bradshaw, J. Caesar, L. Feyen, P. Friedlingstein, L. Gohar, et al. 2018. “Changes in Climate Extremes, Fresh Water Availability and Vulnerability to Food Insecurity Projected at 1.5°C and 2°C Global Warming with a Higher-Resolution Global Climate Model.” Philosophical Transactions of the Royal Society A: Mathematical, Physical and Engineering Sciences 376 (2119): 20160452. doi:10.1098/rsta.2016.0452.
BNamericas. 2019. “Brazil’s Electric Bus Market to Grow Faster than Expected.” July 5, 2019. https://www.bnamericas.com/en/features/brazils-electric-bus-market-to-grow-faster-than-expected.
BNamericas. 2021. “Opening the Floodgates to Private Investment in Brazil’s Water Sector.” Intelligence Series. Santiago, Chile. https://www.bnamericas.com/en/news/new-report---opening-the-floodgates-to-private-investment-in-brazils-water-sector.
BNDES. 2018. “Disbursements of US$ 1 Billion in Wind Energy Is the Theme of the First Green Bond Report from BNDES.” Brazilian Development Bank Press Release. February 5, 2018. https://www.bndes.gov.br/SiteBNDES/bndes/bndes_en/Institucional/Press/Noticias/2018/20180502_green_bond_report_2018.
Bravo, M.A., J. Son, C.U. de Freitas, N. Gouveia, and M.L. Bell. 2016. “Air Pollution and Mortality in São Paulo, Brazil: Effects of Multiple Pollutants and Analysis of Susceptible Populations.” Journal of Exposure Science & Environmental Epidemiology 26 (2): 150–61. doi:10.1038/jes.2014.90.
Brito, D. 2018. “Water in Brazil: From Abundance to Scarcity.” Agência Brasil, October 27, 2018. https://agenciabrasil.ebc.com.br/en/geral/noticia/2018-10/water-brazil-abundance-scarcity.
C40 Cities. 2020. “How to Build Back Better with a 15-Minute City.” Implementation guide. C40 Cities Climate Leadership Group and C40 Knowledge Hub. https://www.c40knowledgehub.org/s/article/How-to-build-back-better-with-a-15-minute-city?language=en_US.
C40 Cities, and The International Council on Clean Transportation. 2020. “Latin America’s Electric Bus Transition Is Irreversible.” Diálogo Chino (blog). December 10, 2020. https://dialogochino.net/en/climate-energy/38837-latin-americas-electric-bus-transition-is-irreversible/.
41
Caccia, L.S., H. Evers, C.S. Fernandes, and L.P. Betti. 2018. “Sustentabilidade Em Habitação de Interesse Social: Benefícios e Custos de Medidas Para Eficiência No Consumo de Água e Energia.” Porto Alegre, Brasil: WRI Brasil. https://wribrasil.org.br/pt/publicacoes/sustentabilidade-em-habitacao-de-interesse-social.
Caetano, R. 2020. “Como a Natureza Pode Garantir a Infraestrutura de Saneamento No Brasil | Exame Invest.” Exame, December 4, 2020. https://invest.exame.com/esg/como-a-natureza-pode-garantir-a-infraestrutura-de-saneamento-no-brasil.
Câmara dos Deputados. 2020. “Projeto cria PPP Popular para moradores executarem obras e serviços.” Notícias. Portal da Câmara dos Deputados. October 3, 2020. https://www.camara.leg.br/noticias/589029-projeto-cria-ppp-popular-para-moradores-executarem-obras-e-servicos/.
CartaCapital. 2019. “Parceria Público Popular: uma proposta social contra a especulação imobiliária.” August 21, 2019. https://www.cartacapital.com.br/blogs/br-cidades/parceria-publico-popular-uma-proposta-social-contra-a-especulacao-imobiliaria/.
Coates, R. 2018. “Exploring Disaster Eventfulness in Urbanizing Brazil.” Peace Review 30 (2): 144–51. doi:10.1080/10402659.2018.1458941.
Cursino, A., and E. Borgstein. 2015. “Linha de Base e Potencial de Redução de Emissões de Gases de Efeito Estufa No Setor de Habitações de Interesse Social No Brasil (Programa Minha Casa Minha Vida).” São Paulo: Prepared by Mitsidi Projetos for the Deutsche Gesellschaft für Internationale Zusammenarbeit (GIZ).
CUT. 2019. “Climate Emergency, Urban Opportunity: How National Governments Can Secure Economic Prosperity and Avert Climate Catastrophe by Transforming Cities.” Global Report. London and Washington, DC: Coalition for Urban Transitions, in partnership with C40 Cities Climate Leadership Group and Ross Center for Sustainable Cities, World Resources Institute. https://urbantransitions.global/en/publication/climate-emergency-urban-opportunity/.
CUT. 2021. “Seizing the Urban Opportunity: How National Governments Can Recover from COVID-19, Tackle the Climate Crisis, and Secure Shared Prosperity through Cities.” London and Washington, DC: Coalition for Urban Transitions. https://urbantransitions.global/publications/.
Dall’Agnol, F., L. Caccia, E. Mackres, and A. Yu. 2018. “Acelerando a Eficiência Das Edificações No Brasil.” Working Paper. Porto Alegre, Brasil: WRI Brasil. https://wribrasil.org.br/pt/publicacoes/acelerando-eficiencia-das-edificacoes-no-brasil.
Dantas, G.T. 2014. “IPTU verde e o direito à cidade sustentável.” Revista do Programa de Pós-Graduação em Direito da Universidade Federal da Bahia, November 2, 2014. https://egov.ufsc.br/portal/sites/default/files/iptu_verde.pdf.

42
Data Favela. 2020. “Pandemia Na Favela: A Realidade de 14 Milhoes de Favelado No Combate Ao Novo Coronavírus.” presented at the Data Favela Forum, co-hosted by Central Única das Favelas (CUFA), Instituto Locomotiva, and UNESCO in Brazil, June 24. https://en.unesco.org/news/data-favela-forum-webinars-discuss-racism-and-inequality-pandemic-times-brazil.
Eco-Business. 2017. “Building a Case for Green Buildings in Brazil.” March 24, 2017. https://www.eco-business.com/news/building-a-case-for-green-buildings-in-brazil/.
Fantoni, R., J. Guillaumon, and J.P. Branco. 2019. “The Reshaping of Brazil’s Infrastructure Is Likely to Become a Reality.” In Brazil 2020 – Opportunity Tree, edited by R. Fiorini and N. Calicchio. McKinsey & Company. https://www.mckinsey.com/br/our-insights/brazil-2020-opportunity-tree#.
Fernandes, E. 2007. “Implementing the Urban Reform Agenda in Brazil.” Environment and Urbanization 19 (1): 177–89.
Fernandes, E. 2010. “The City Statute and the Legal-Urban Order.” In The City Statute of Brazil: A Commentary, 55–70. Cities Alliance and Ministry of Cities. https://www.ifrc.org/docs/idrl/945EN.pdf.
Fontoura, W.B., G. de L.D. Chaves, and G.M. Ribeiro. 2019. “The Brazilian Urban Mobility Policy: The Impact in São Paulo Transport System Using System Dynamics.” Transport Policy 73 (January): 51–61. doi:10.1016/j.tranpol.2018.09.014.
Freitas, L.C. de, and S. Kaneko. 2011. “Decomposing the Decoupling of CO2 Emissions and Economic Growth in Brazil.” Ecological Economics 70 (8): 1459–69. doi:10.1016/j.ecolecon.2011.02.011.
Galimberti, A. 2019. “PPP for Energy Efficiency in Favelas: A Success Story from Brazil.” Urbanet (blog). July 18, 2019. https://www.urbanet.info/ppp-for-energy-efficiency-in-brazil/.
Government of Brazil. 2020. “Brasil registra queda em número de mortes no trânsito.” Noticias. September 18, 2020. https://www.gov.br/pt-br/noticias/transito-e-transportes/2020/09/brasil-registra-queda-em-numero-de-mortes-no-transito.
Government of Brazil. 2021. “Programa Casa Verde e Amarela agora é lei.” Noticias. January 14, 2021. https://www.gov.br/pt-br/noticias/assistencia-social/2021/01/programa-casa-verde-e-amarela-agora-e-lei.
Halais, F. 2019. “Rio’s Defunct Gondola Tells a Tale of Transit Style Over Substance.” WIRED, October 2, 2019. https://www.wired.com/story/rio-de-janeiro-favela-cable-car-gondola/.
Hampel, C. 2020. “BYD Opens Electric Bus Battery Factory in Brazil.” Electrive.Com (blog). September 1, 2020. https://www.electrive.com/2020/09/01/byd-opens-factory-in-brazil-to-make-batteries-primarily-for-electric-buses/.
Hoegh-Guldberg, O., D. Jacob, M. Taylor, M. Bindi, S. Brown, I. Camilloni, A. Diedhiou, et al. 2018. “Impacts of 1.5°C of Global Warming on Natural and Human
43
Systems.” In Global Warming of 1.5°C. An IPCC Special Report on the Impacts of Global Warming of 1.5°C above Pre-Industrial Levels and Related Global Greenhouse Gas Emission Pathways, in the Context of Strengthening the Global Response to the Threat of Climate Change, Sustainable Development, and Efforts to Eradicate Poverty, edited by V. Masson-Delmotte, P. Zhai, H.-O. Pörtner, D. Roberts, J. Skea, P.R. Shukla, A. Pirani, et al. Geneva: Intergovernmental Panel on Climate Change. https://www.ipcc.ch/sr15/.
IBGE. 2019. “Pesquisa de Informações Básicas Municipais: Perfil Dos Municípios Brasileiros 2018.” Rio de Janeiro: Instituto Brasileiro de Geografia e Estatística. https://biblioteca.ibge.gov.br/visualizacao/livros/liv101668.pdf.
IDB. 2017. “Supporting National Development Banks to Drive Investment in the Nationally Determined Contributions of Brazil, Mexico, and Chile.” Washington, DC: Inter-American Development Bank. https://www.greenfinancelac.org/wp-content/uploads/2019/01/Supporting-National-Development-Banks-to-Drive-Investment-in-the-Nationally-Determined-Contributions-of-Brazil-Mexico-and-Chile.pdf.
IFC. 2016. “Climate Investment Opportunities in Emerging Markets: An IFC Analysis.” Washington, DC: International Finance Corporation. https://www.ifc.org/wps/wcm/connect/59260145-ec2e-40de-97e6-3aa78b82b3c9/3503-IFC-Climate_Investment_Opportunity-Report-Dec-FINAL.pdf.
IMF. 2021. World Economic Outlook – Update January 2021: Policy Support and Vaccines Expected to Lift Activity. Washington, DC: International Monetary Fund. https://www.imf.org/en/Publications/WEO/Issues/2021/01/26/2021-world-economic-outlook-update.
INRIX. 2020. “INRIX 2019 Global Traffic Scorecard.” March 8, 2020. https://inrix.com/scorecard/.
IPEA. 2016. “Relatório Brasileiro Para o Habitat III.” Brasilia: Instituto de Pesquisa Econômica Aplicada. https://www.ipea.gov.br/portal/index.php?option=com_content&view=article&id=27266.
IRENA. 2020. “Renewable Energy and Jobs: Annual Review 2020.” Abu Dhabi: International Renewable Energy Agency. https://www.irena.org/publications/2020/Sep/Renewable-Energy-and-Jobs-Annual-Review-2020.
Jabur, G. 2018. “Brazil to Power up Investments in Street Lighting and Energy Efficiency.” World Bank. July 28, 2018. https://www.worldbank.org/en/news/feature/2018/07/27/eficiencia-energetica-fundamental-futuro-ciudades-sostenibles.
Jamison, S., and R. Bocca. 2021. “Balancing Growth and Sustainability: Lessons from Brazil.” World Economic Forum. March 9, 2021.
44
https://www.weforum.org/agenda/2021/03/balancing-economic-growth-with-sustainability-lessons-from-brazil/.
Lessa, D.A., C. Lobo, and L. Cardoso. 2019. “Accessibility and Urban Mobility by Bus in Belo Horizonte/Minas Gerais – Brazil.” Journal of Transport Geography 77 (May): 1–10. doi:10.1016/j.jtrangeo.2019.04.004.
Libertun de Duren, N.R. 2018. “Why There? Developers’ Rationale for Building Social Housing in the Urban Periphery in Latin America.” Cities 72 (February): 411–20. doi:10.1016/j.cities.2017.10.006.
Lindau, L.A., D. Hidalgo, and D. Facchini. 2010. “Curitiba, the Cradle of Bus Rapid Transit.” Built Environment 36 (3): 274–82. doi:10.2148/benv.36.3.274.
Mahendra, A., R. King, E. Gray, M. Hart, L. Azeredo, L. Betti, S. Prakash, A. Deb, E. Ashebir, and A. Ibrahim. 2020. “Urban Land Value Capture in São Paulo, Addis Ababa, and Hyderabad: Differing Interpretations, Equity Impacts, and Enabling Conditions,” December. https://www.wri.org/publication/urban-land-value-capture-sao-paulo-addis-ababa-hyderabad.
Mahendra, A., and K.C. Seto. 2019. “Upward and Outward Growth: Managing Urban Expansion for More Equitable Cities in the Global South.” Working Paper. Washington, DC: World Resources Institute. https://www.wri.org/wri-citiesforall/publication/upward-and-outward-growth-managing-urban-expansion-more-equitable.
Maia, L. 2021. “Mais de 80% das famílias nas favelas dependem de doações para se alimentar.” Veja Rio, March 18, 2021. https://vejario.abril.com.br/cidade/familias-favelas-dependem-doacoes-alimentos/.
Manfrinato, C.V., A. Marino, V.F. Conde, M. do C.P. Franco, E. Stedefeldt, and L.Y. Tomita. 2020. “High Prevalence of Food Insecurity, the Adverse Impact of COVID-19 in Brazilian Favela.” MedRxiv, August, 2020.07.31.20166157. doi:10.1101/2020.07.31.20166157.
Marques, E., and C. Saraiva. 2017. “Urban Integration or Reconfigured Inequalities? Analyzing Housing Precarity in São Paulo, Brazil.” Habitat International 69 (November): 18–26. doi:10.1016/j.habitatint.2017.08.004.
McGeever, J. 2020. “Brazil Unemployment Rate Hits Record High 14.6%, as People Return to Look for Work.” Reuters, November 27, 2020. https://www.reuters.com/article/us-brazil-economy-employment-idUSKBN2871CI.
Medeiros, A.C.C. de, R.P. da Fonseca, and E.F.S.A. de Silva. 2020. “Sustainable Urban Interventions in the Rainforest: The Experience of the City of Manaus in Brazil.” Springer Nature Applied Sciences 2 (793). doi:10.1007/s42452-020-2587-5.
Ministério da Saúde. 2019. “Saúde Brasil 2018: Uma Análise Da Situação de Saúde e Das Doenças e Agravos Crônicos: Desafios e Perspectivas.” Brasilia: Health Surveillance Secretariat, Ministry of Health.

45
http://bvsms.saude.gov.br/bvs/publicacoes/saude_brasil_2018_analise_situacao_saude_doencas_agravos_cronicos_desafios_perspectivas.pdf.
Miraglia, S.G.E.K., and N. Gouveia. 2014. “Costs of Air Pollution in Brazilian Metropolitan Regions.” Ciencia & Saude Coletiva 19 (10): 4141.
Mobilidade Sampa. 2021. “Prefeitura de São José Dos Campos Apresenta o Primeiro VLP Da Linha Verde,” March 9, 2021. https://mobilidadesampa.com.br/2021/03/vlp-linha-verde-sao-jose-dos-campos-apresentacao/.
Moscarelli, F., M. Kleiman, F. Moscarelli, and M. Kleiman. 2017. “The Challenges of Integrated Urban Planning and Management in Brazil: Analysis of the Ministry of Cities Experience.” Urbe. Revista Brasileira de Gestão Urbana 9 (2): 157–71. doi:10.1590/2175-3369.009.002.ao01.
Muehe, D. 2010. “Brazilian Coastal Vulnerability to Climate Change.” Pan-American Journal of Aquatic Sciences 5 (October): 1–11.
Muñoz Miranda, A., and J. Martínez-Vázquez. 2018. “Metropolitan Financing in Brazil: Current Trends and Lessons from the International Experience.” Inter-American Development Bank. doi:10.18235/0001461.
Nehren, U., A. Kirchner, W. Lange, M. Follador, and D. Anhuf. 2019. “Natural Hazards and Climate Change Impacts in the State of Rio de Janeiro: A Landscape Historical Analysis.” In Strategies and Tools for a Sustainable Rural Rio de Janeiro, edited by U. Nehren, S. Schlϋter, C. Raedig, D. Sattler, and H. Hissa, 313–30. Springer Series on Environmental Management. Cham: Springer International Publishing. doi:10.1007/978-3-319-89644-1_20.
New Climate Economy. 2020. “A New Economy For a New Era: Elements for Building a More Efficient and Resilient Economy in Brazil.” São Paulo and Washington, DC: WRI Brasil and New Climate Economy. https://wribrasil.org.br/pt/publicacoes/new-economy-brazil-efficient-resilient-build-back-better.
OECD. 2020. “OECD Economic Surveys: Brazil 2020.” Paris: Organisation for Economic Co-operation and Development. http://www.oecd.org/economy/brazil-economic-snapshot/.
OECD. 2020. “Revenue Statistics 2020.” Paris: Organisation for Economic Co-operation and Development. https://www.oecd.org/tax/tax-policy/revenue-statistics-2522770x.htm.
Oliveira, M., V. Tornello, R. Feltran-Barbieri, L. Barbosa, M. Matsumoto, and F. Corrêa. 2021. “Novo Plano de Ação Da Região Metropolitana de Campinas Conecta Restauração e Biodiversidade.” WRI Brasil (blog). April 12, 2021. https://wribrasil.org.br/pt/blog/cidades/novo-plano-de-acao-da-regiao-metropolitana-de-campinas-conecta-restauracao-e.
Oliveira Noronha, M. de, R.R. Zanini, and A.M. Souza. 2019. “The Impact of Electric Generation Capacity by Renewable and Non-Renewable Energy in Brazilian

46
Economic Growth.” Environmental Science and Pollution Research 26 (32): 33236–59. doi:10.1007/s11356-019-06241-4.
Ozment, S., and R. Feltran-Barbieri. 2018. “Help for São Paulo’s Complex Water Woes: Protect and Restore Forests.” World Resources Institute (blog). September 25, 2018. https://www.wri.org/blog/2018/09/help-s-o-paulo-s-complex-water-woes-protect-and-restore-forests.
Pacheco, P. 2019. “Como Extrema Se Tornou Um Caso de Sucesso Em Restauração.” WRI Brasil (blog). May 24, 2019. https://wribrasil.org.br/pt/blog/2019/05/como-extrema-se-tornou-um-caso-de-sucesso-em-restauracao.
Pavanelli, C., and T. Barrozo. n.d. “Brazil’s New Sanitation Bill To Draw Domestic And Foreign Private Investment.” Forbes. Accessed March 27, 2021. https://www.forbes.com/sites/mergermarket/2020/07/14/brazils-new-sanitation-bill-to-draw-domestic-and-foreign-private-investment/.
Phillips, D. 2020. “Climate Crisis Blamed for Rains and Floods That Have Killed 150 in Brazil.” The Guardian, March 13, 2020, sec. Environment. http://www.theguardian.com/environment/2020/mar/13/climate-crisis-blamed-for-rains-and-floods-that-have-killed-150-in-brazil.
Queiroz, A.R. de, V.A.D. Faria, L.M.M. Lima, and J.W.M. Lima. 2019. “Hydropower Revenues under the Threat of Climate Change in Brazil.” Renewable Energy 133 (April): 873–82. doi:10.1016/j.renene.2018.10.050.
Queiroz, A.R. de, L.M. Marangon Lima, J.W. Marangon Lima, B.C. da Silva, and L.A. Scianni. 2016. “Climate Change Impacts in the Energy Supply of the Brazilian Hydro-Dominant Power System.” Renewable Energy 99 (December): 379–89. doi:10.1016/j.renene.2016.07.022.
Rasch, R.J. 2016. “Assessing Urban Vulnerability to Flood Hazard in Brazilian Municipalities.” Environment and Urbanization 28 (1): 145–68. doi:10.1177/0956247815620961.
Rolnik, R., and J. Klink. 2011. “Crescimento Econômico e Desenvolvimento Urbano: Por Que Nossas Cidades Continuam Tão Precárias?” Novos Estudos CEBRAP, no. 89 (March): 89–109. doi:10.1590/S0101-33002011000100006.
Romero, S. 2012. “Swallowing Rain Forest, Cities Surge in Amazon.” The New York Times, November 24, 2012. https://www.nytimes.com/2012/11/25/world/americas/swallowing-rain-forest-brazilian-cities-surge-in-amazon.html.
Rossbach, A., A.P. Bruno, C.S. Carvalho, D. Montandon, E. Fernandes, I. Magalhães, and N. Saule Júnior. 2016. Estatuto Da Cidade: A Velha e a Nova Agenda Urbana. São Paulo: Cities Alliance. https://www.citiesalliance.org/resources/publications/cities-alliance-knowledge/estatuto-da-cidade-velha-e-nova-agenda-urbana.
Rubim, B., and S. Leitão. 2013. “O Plano de Mobilidade Urbana e o Futuro Das Cidades.” Estudos Avançados 27 (79): 55–66. doi:10.1590/S0103-40142013000300005.
47
Santos, A.M.S.P., and P.H.R.P. Vasques. 2016. “Estatuto Da Metrópole e Gestão de Aglomerados Urbanos No Brasil.” Revista Del CESLA, no. 19: 125–52.
Schinazi, A., B. Chaves, K. Schneider, and R. Fukuoka. 2020. “The Solar PV Revolution in Brazil: How Cities Can Take Advantage.” Part 1: Planning and Structuring. C40 Cities Finance Facility. https://www.c40cff.org/knowledge-library/the-solar-pv-revolution-in-brazil-how-cities-can-take-advantage.
Scruggs, G. 2019. “Ministry of Cities RIP: The Sad Story of Brazil’s Great Urban Experiment.” The Guardian, July 18, 2019, sec. Cities. https://www.theguardian.com/cities/2019/jul/18/ministry-of-cities-rip-the-sad-story-of-brazils-great-urban-experiment.
Silva, C.T. e. 2020. “Addressing the Housing Shortage without Building Cities: The Minha Casa Minha Vida Program, Brazil.” In Communities, Land and Social Innovation. Edward Elgar Publishing.
SIRENE. 2020. “Estimativas Anuais de Emissões de Gases de Efeito Estufa No Brasil (5a Edição).” Brasilia: Sistema de Registro Nacional de Emissãoes, Ministério da Ciência, Tecnologia, Inovações e Comunicações.
Slack, E. 2019. “Metropolitan Governance: Principles and Practice.” Discussion Paper No. IDB-DP-659. Inter-American Development Bank. doi:10.18235/0001576.
Somers, K., and I. Baud. 2015. My House, My Life: Decision-Making Processes and Local Citizen Participation in Housing Project Minha Casa, Minha Vida in Salvador Da Bahia.
Studart, R., S. Keneally, and B. Calixto. 2020. “Infraestrutura Sustentável Pode Ser Alicerce Para o Brasil Reconstruir a Economia Pós Covid-19.” WRI Brasil (blog). April 24, 2020. https://wribrasil.org.br/pt/blog/2020/04/infraestrutura-sustentavel-pode-ser-o-alicerce-para-o-brasil-reconstruir-sua-economia.
SUDECO. 2019. “Plano Regional de Desenvolvimento Do Centro-Oeste – 2020–2023.” Brasilia: Superintendência do Desenvolvimento do Centro-Oeste. https://www.gov.br/sudeco/pt-br/centrais-de-conteudo/publicacoes-1/publicacoes-da-diretoria-de-planejamento-e-avaliacao/prdco-2020-2023.pdf/view.
Teixeira, M. 2020. “U.S., Brazil See Room for Global Ethanol Growth before Transition to EVs.” Reuters, October 30, 2020. https://www.reuters.com/article/us-ethanol-outlook-emissions-idUSKBN27F2JU.
UN DESA. 2018. “World Urbanization Prospects: The 2018 Revision.” New York: United Nations Department of Economic and Social Affairs, Population Division. https://population.un.org/wup/Country-Profiles/.
UN DESA. 2019. “World Population Prospects 2019.” New York: United Nations Department of Economic and Social Affairs, Population Division. http://esa.un.org/unpd/wpp/.
48
Vasconcellos, E.A. 2018. “Urban Transport Policies in Brazil: The Creation of a Discriminatory Mobility System.” Journal of Transport Geography 67 (February). https://trid.trb.org/view/1508692.
Venter, C., A. Mahendra, and D. Hidalgo. 2019. “From Mobility to Access for All: Expanding Urban Transportation Choices in the Global South.” Working Paper. Washington, DC: World Resources Institute. https://www.wri.org/wri-citiesforall/publication/mobility-access-all-expanding-urban-transportation-choices-global-south.
Vital Strategies. 2019. “How One City in Brazil Reduced Road Crash Deaths by a Remarkable 40%.” Vital Stories (blog). April 23, 2019. https://www.vitalstrategies.org/how-one-city-in-brazil-reduced-road-crash-deaths-by-a-remarkable-40/.
Vivid Economics. 2021. “Greenness of Stimulus Index: An Assessment of COVID-19 Stimulus by G20 Countries and Other Major Economies in Relation to Climate Action and Biodiversity Goals (February 2021 Release).” Finance for Biodiversity Initiative. https://www.vivideconomics.com/casestudy/greenness-for-stimulus-index/.
WRI Brasil. 2016. “Cidades Precisam de Novas Possibilidades de Financiamento Para Alavancar a Sustentabilidade.” Cidades Sustentáveis (blog). April 2016. https://wricidades.org/conteudo/cidades-precisam-de-novas-possibilidades-de-financiamento-para-alavancar-sustentabilidade.
49
This report should be cited as:
Coalition for Urban Transitions. 2021. “Seizing Brazil’s Urban Opportunity.” World Resources Institute (WRI) Ross Center for Sustainable Cities and C40 Cities Climate Leadership Group. London and Washington, DC. Available at: https://urbantransitions.global/en/publication/seizing-the-urban-opportunity/
ACKNOWLEDGEMENTS
Co-authored by: Henrique Evers, Marion Davis, Luiza de Oliveira Schmidt, Shagun Mehrotra, Robin King, Alfredo Redondo, Anna Kustar, Christopher Gillespie, Freya Stanley-Price, Jessica Hanlon, Leah Lazer, Nick Godfrey (Programme Director), Pandora Batra, and Sophia Vitello. With contributions from Claudio Acioly Jr., Ilan Cuperstein, Magdala Arioli, and Carolina Heldt. With guidance and support from Toni Lindau, Carolina Elia Genin, Andrea Fernández, Andrew Steer, Angelo Angel Gomez, Ani Dasgupta, Catlyne Haddaoui, Giulia De Giovanni, Kalpa Taylor, Kerry LePain, Larissa da Silva, Manisha Gulati, Mark Watts, Rachel Spiegel, and Tom Lindsay.
Modelling and related analysis were conducted by the following researchers:
Annex 1: Technically feasible urban mitigation potential of buildings, transport, waste, and energy sectors
Derik Broekhoff – Stockholm Environment Institute
Annex 2: Economic impacts of urban mitigation investments
Jake Wellman, James Patterson-Waterston and Jason Eis – Vivid Economics
Annex 3: Global conversion of land to urban purposes
Alejandro Blei, Shlomo Angel and Xinyue Zhang – Marron Institute of Urban Management, New York University
Annex 4: Proportion of urban residents and urban land less than 10 meters above sea level
Deborah Balk – CUNY Institute for Demographic Research, City University of New York; Gordon McGranahan – Institute for Development Studies; Kytt MacManus – Center for International Earth Science Information Network, Columbia University; and Hasim Engin – CUNY Institute for Demographic Research, City University of New York
50
Expert reviewers
Our warm thanks to the many Coalition members and partners who reviewed and helped shape this report: Aditi Maheshwari (UN Secretary-General’s Office, Climate Action Team), Anjali Mahendra (World Resources Institute), Aykut Mert Yakut (Economic & Social Research Institute), Aziza Akhmouch (Organisation for Economic Cooperation and Development), Carlos Munoz-Pina (World Resources Institute), Daniel Schensul (UN Secretary-General’s Office, Climate Action Team), Harriet Tregoning (World Resources Institute), Helen Civil (The Resilience Shift), Juliet Mian (The Resilience Shift), Laura Malaguzzi Valeri (World Resources Institute), Luana Betti (WRI Brasil), Marina Caregnato Garcia (WRI Brasil), Mario Finch (World Resources Institute), Matthew Coghlan (UN Secretary-General’s Office, Climate Action Team), Neelam Singh (World Resources Institute), Philipp Rode (LSE Cities), Rebecca Laberenne (The Resilience Shift), Seth Schultz (The Resilience Shift), Tadashi Matsumoto (Organisation for Economic Cooperation and Development), Thiago Guimarães (WRI Brasil) and Viviane Romeiro (WRI Brasil).
Reviewers from Her Majesty’s Government—Department of Business, Energy, and Industrial Strategy, Cabinet Office and the Foreign, Commonwealth & Development Office—provided local expertise, guidance and support throughout this project as part of a consultation process with the COP26 high-level champions team and diplomatic actors in the six focus countries.
51
Advisory boards
Urban Leadership Council
Amanda Eichel (Global Covenant of Mayors for Climate & Energy), Andrew Higham (Mission 2020), Andrew Steer (WRI), Dominic Waughray (World Economic Forum), Emilia Sáiz (World Economic Forum/United Cities and Local Governments), Gino Van Begin (ICLEI – Local Governments for Sustainability), Guido Schmidt-Traub (formerly UN Sustainable Development Solutions Network/transitioned from the Council), Helen Clarkson (Climate Group), Helen Mountford (WRI /New Climate Economy), Jeremy Oppenheim (Energy Transitions Commission/SYSTEMIQ), Mark Watts (C40 Cities Climate Leadership Group), Nigel Topping (formerly We Mean Business/recently transitioned from the Council), Richard Baron (2050 Pathways Platform), Sheela Patel (Slum Dwellers International/Society for the Promotion of Area Resource Centres), Tasneem Essop (Climate Action Network), William Cobbett (Cities Alliance), supported by Alice Charles (World Economic Forum), Andy Deacon (Global Covenant of Mayors for Climate & Energy), Heather McGeory (We Mean Business), Yunus Arikan (ICLEI – Local Governments for Sustainability).
Steering group
Andrew Gouldson (University of Leeds), Andrew Tucker (African Centre for Cities), Aziza Akhmouch (Organisation for Economic Co-operation and Development), Dan Dowling (PwC), David Dodman (International Institute for Environment and Development), Martin Powell (Siemens), Molly Webb (Energy Unlocked), Philip Rode (LSE Cities), Rajat Kathuria (Indian Council for Research on International Economic Relations), Sarah Colenbrander (Overseas Development Institute), Shannon Bouton (McKinsey.org), Ye Qi (The Hong Kong University of Science and Technology), supported by Anton Cartwright (African Centre for Cities) and Tadashi Matsumoto (Organisation for Economic Co-operation and Development).

52
PARTNERS
Lead partner
Managing partners A special initiative of
In partnership with
Funded by
This material has been funded by the UK government; however, the views expressed do not necessarily reflect the UK government’s official policies.
The Coalition partners listed endorse the general thrust of the arguments, findings and recommendations made in this report.*
*The text does not necessarily reflect the personal views or official policies of any of the contributors or their members.

COALITION FOR URBAN TRANSITIONSC/O WORLD RESOURCES INSTITUTE10 G ST NE, SUITE 800WASHINGTON DC, 20002, USA
C40 CITIES CLIMATE LEADERSHIP GROUP3 QUEEN VICTORIA STREET LONDON, EC4N 4TQUNITED KINGDOM
WRI ROSS CENTER FOR SUSTAINABLE CITIES WORLD RESOURCES INSTITUTE10 G ST NE, SUITE 800WASHINGTON DC, 20002, USA
WRI BRASIL (PORTO ALEGRE) AV. INDEPENDÊNCIA, 1299 CJ 401 PORTO ALEGRE - RS BRASIL 90035-077
#URBANOPPORTUNITY URBANTRANSITIONS.GLOBAL
WRI BRASIL (SÃO PAULO) RUA CLÁUDIO SOARES, 72 CJ 1510 SÃO PAULO - SP BRASIL 05422-030