selected findings for the transportation, warehousing, … · and physical and chemical exposures...
TRANSCRIPT

Untitled Extract Pages.pdf 1 6/3/2013 2:58:08 PM
Selected Findings for the Transportation, Warehousing, and Utilities Sector By Industry Subsector
From the 2010 National Health Interview Survey – Occupational Health Supplement
(NHIS-OHS)
Background
In 2010, the National Institute for Occupational Safety and Health (NIOSH), recognizing a growing need for current, national estimates on work-related health and safety conditions, sponsored an occupational health supplement (OHS) to the National Health Interview Survey (NHIS).
The interviewed sample adult component of the 2010 NHIS consisted of 27,157 persons, of whom approximately 17,524 had been employed in the past 12 months. The sample is designed and weighted to produce national estimates.
For more information on the NHIS and to access the 2010 NHIS data, please refer to the following website: (http://www.cdc.gov/nchs/nhis.htm)
Purpose
This profile summarizes the 2010 NHIS-OHS data for the Transportation, Warehousing, and Utilities sector by industry subsector through figures and tables in an effort to provide sector leaders with information so they can better understand health and exposure burdens specific to their industry.
In the 2010 NHIS-OHS, the sample of those employed by the Transportation, Warehousing, and Utilities sector consisted of 854 persons, representing approximately 7.6 million workers. This profile summarizes the prevalence of selected health outcomes; work organization and psychosocial factors; and physical and chemical exposures among workers in the Transportation, Warehousing, and Utilities sector by industry subsector. All Transportation, Warehousing, and Utilities sector workers are compared to all U.S. workers combined, and comparisons are made among 14 Transportation, Warehousing, and Utilities subsectors, although small sample sizes within several of the subsectors limit the reporting of some estimates.

Index:
• Description of Transportation, Warehousing, and Utilities sector o Table A. U.S. Transportation, Warehousing, and Utilities sector workers by subsector,
2010 o Table B. U.S. Transportation, Warehousing, and Utilities sector workers by occupational
category, 2010
• All industry sectors vs. the Transportation, Warehousing, and Utilities sector o Figure 1. Prevalence of selected health conditions; work organization and psychosocial
factors; and physical and chemical exposures among U.S. workers (Transportation, Warehousing, and Utilities sector vs. All U.S. Workers, 2010)
o Table 1. Prevalence of selected health conditions; work organization and psychosocial factors; and physical and chemical exposures among U.S. workers (Transportation, Warehousing, and Utilities sector vs. All U.S. Workers, 2010)
• Health conditions o Figure 2. Prevalence of dermatitis in the past 12 months among U.S. adults who worked
in the past 12 months by Transportation, Warehousing, and Utilities subsector, 2010 o Table 2. Prevalence of dermatitis in the past 12 months among U.S. adults who worked
in the past 12 months by Transportation, Warehousing, and Utilities subsector, 2010 o Figure 3. Prevalence of carpal tunnel syndrome in the past 12 months among U.S. adults
who worked in the past 12 months by Transportation, Warehousing, and Utilities subsector, 2010
o Table 3. Prevalence of carpal tunnel syndrome in the past 12 months among U.S. adults who worked in the past 12 months by Transportation, Warehousing, and Utilities subsector, 2010
o Figure 4. Prevalence of current asthma among U.S. adults who worked in the past 12 months by Transportation, Warehousing, and Utilities subsector, 2010
o Table 4. Prevalence of current asthma among U.S. adults who worked in the past 12 months by Transportation, Warehousing, and Utilities subsector, 2010
• Work organization factors o Figure 5. Prevalence of working 48 hours a week or more among U.S. adults who
worked one job in the past 12 months by Transportation, Warehousing, and Utilities subsector, 2010
o Table 5. Prevalence of working 48 hours a week or more among U.S. adults who worked one job in the past 12 months by Transportation, Warehousing, and Utilities subsector, 2010
o Figure 6. Prevalence of non-standard work arrangements among U.S. adults who worked in the past 12 months by Transportation, Warehousing, and Utilities subsector, 2010
o Table 6. Prevalence of non-standard work arrangements among U.S. adults who worked in the past 12 months by Transportation, Warehousing, and Utilities subsector, 2010
o Figure 7. Prevalence of temporary employment among U.S. adults who worked in the past 12 months by Transportation, Warehousing, and Utilities subsector, 2010
o Table 7. Prevalence of temporary employment among U.S. adults who worked in the past 12 months by Transportation, Warehousing, and Utilities subsector, 2010

o Figure 8. Prevalence of non-standard shifts among U.S. adults who worked in the past 12 months by Transportation, Warehousing, and Utilities subsector, 2010
o Table 8. Prevalence of non-standard shifts among U.S. adults who worked in the past 12 months by Transportation, Warehousing, and Utilities subsector, 2010
• Psychosocial exposures o Figure 9. Prevalence of job insecurity among working U.S. adults by Transportation,
Warehousing, and Utilities subsector, 2010 o Table 9. Prevalence of job insecurity among working U.S. adults by Transportation,
Warehousing, and Utilities subsector, 2010 o Figure 10. Prevalence of work-family imbalance among working U.S. adults by
Transportation, Warehousing, and Utilities subsector, 2010 o Table 10. Prevalence of work-family imbalance among working U.S. adults by
Transportation, Warehousing, and Utilities subsector, 2010 o Figure 11. Prevalence of hostile work environments among U.S. adults who worked in
the past 12 months by Transportation, Warehousing, and Utilities subsector, 2010 o Table 11. Prevalence of hostile work environments among U.S. adults who worked in the
past 12 months by Transportation, Warehousing, and Utilities subsector, 2010
• Physical and chemical exposures o Figure 12. Prevalence of exposure to potential skin hazards at work among U.S. adults
who worked in the past 12 months by Transportation, Warehousing, and Utilities subsector, 2010
o Table 12. Prevalence of exposure to potential skin hazards among U.S. adults who worked in the past 12 months by Transportation, Warehousing, and Utilities subsector, 2010
o Figure 13. Prevalence of outdoor work among U.S. adults who worked in the past 12 months by Transportation, Warehousing, and Utilities subsector, 2010
o Table 13. Prevalence of exposure to outdoor work among U.S. adults who worked in the past 12 months by Transportation, Warehousing, and Utilities subsector, 2010
o Figure 14. Prevalence of exposure to vapors, gas, dust, or fumes at work among U.S. adults at their longest held job by Transportation, Warehousing, and Utilities subsector, 2010
o Table 14. Prevalence of exposure to vapors, gas, dust, or fumes among U.S. adults at their longest held job by Transportation, Warehousing, and Utilities subsector, 2010
o Figure 15a. Prevalence of exposure to secondhand smoke at work among non-smoking U.S. adults who worked in the past 12 months by Transportation, Warehousing, and Utilities subsector, 2010
o Table 15a. Prevalence of exposure to secondhand smoke at work among nonsmoking U.S. adults who worked in the past 12 months by Transportation, Warehousing, and Utilities subsector, 2010
o Figure 15b. Prevalence of current smokers among U.S. adults who worked in the past 12 months, by Transportation, Warehousing, and Utilities subsector, 2010
o Table 15b. Prevalence of smoking among U.S. adults who worked in the past 12 months by Transportation, Warehousing, and Utilities subsector, 2010
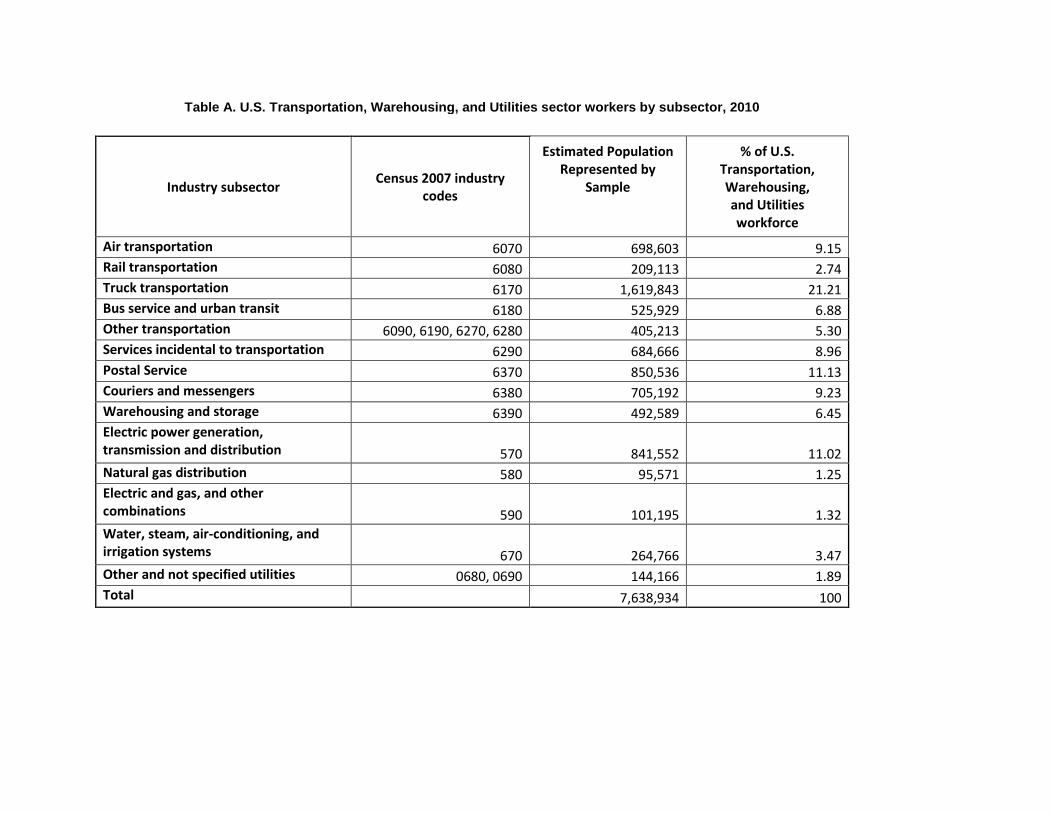
Table A. U.S. Transportation, Warehousing, and Utilities sector workers by subsector, 2010
Industry subsector Census 2007 industry codes
Estimated Population Represented by
Sample
% of U.S. Transportation, Warehousing, and Utilities workforce
Air transportation 6070 698,603 9.15 Rail transportation 6080 209,113 2.74 Truck transportation 6170 1,619,843 21.21 Bus service and urban transit 6180 525,929 6.88 Other transportation 6090, 6190, 6270, 6280 405,213 5.30 Services incidental to transportation 6290 684,666 8.96 Postal Service 6370 850,536 11.13 Couriers and messengers 6380 705,192 9.23 Warehousing and storage 6390 492,589 6.45 Electric power generation, transmission and distribution 570 841,552 11.02 Natural gas distribution 580 95,571 1.25 Electric and gas, and other combinations 590 101,195 1.32 Water, steam, air-conditioning, and irrigation systems 670 264,766 3.47 Other and not specified utilities 0680, 0690 144,166 1.89 Total 7,638,934 100

Table B. U.S. Transportation, Warehousing, and Utilities sector workers by occupational category, 2010
Occupational category Census 2010 occupation codes
Estimated Population Represented by
Sample
% of U.S. Transportation, Warehousing, and Utilities workforce
Couriers/messengers 5510 176,987 2.33 Other material recording/ scheduling/dispatching/distributing workers
5500, 5520, 5530, 5540, 5550, 5560, 5600, 5610, 5620, 5630 1,023,463 13.45
Electrical power-line installers/repairers 7410 121,653 1.60 Other installation/maintenance/repair occupations 7000-7630 (except 7410) 530,092 6.97 Flight attendants 9050 166,002 2.18 Other air transportation workers 9030, 9040 109,465 1.44 Bus drivers 9120 226,079 2.97 Driver/sales workers & truck drivers 9130 1,337,356 17.57 Taxi drivers/chauffeurs 9140 208,286 2.74 Rail transportation workers 9200, 9230, 9240, 9260 115,203 1.51 Other transportation workers 9150, 9110, 9300, 9310, 9330, 9340,
9350, 9360, 9410, 9415, 9420 177,914 2.34 Industrial truck/tractor operators 9600 133,377 1.75 Laborers and freight/stock/material movers 9620 393,360 5.17 Other material moving workers 9500, 9510, 9520, 9560, 9610, 9630,
9640, 9650, 9720, 9730, 9740, 9750 128,322 1.69 Managers/supervisors in Transportation/warehousing/utilities sector 0010-0430, 5000, 9000 655,474 8.61 Other workers in transportation/warehousing/utilities sector All other Census occupation codes 2,106,964 27.69 Total* 7,609,997 100
*The total number of Transportation, Warehousing, and Utilities sector workers represented by these occupational groups is slightly less than the total number of workers represented by the full industry sample due to missing values for occupation


Table 1. Prevalence of selected health conditions; work organization and psychosocial factors; and physical and chemical exposures among U.S. workers (Transportation, Warehousing, and Utilities sector vs. All U.S. workers, 2010)
All U.S. workers Transportation, Warehousing, and Utilities sector
sector Prevalence
(%) Standard
Error 95%
Confidence Prevalence
(%) Standard
Error 95%
Confidence of
Prevalence Interval of
Prevalence Interval
Health Conditions Dermatitis in the past 12 months 1 9.8 0.3 9.2-10.3 5.9 0.9 4.1-7.7 Carpal tunnel syndrome in the past 12 months 1 3.1 0.2 2.8-3.4 1.9 0.5 0.9-3.0 Current asthma 1 7.2 0.2 6.7-7.6 5.5 0.9 3.6-7.3 Injury or poisoning at work in the past 12 months 1 2.8 0.4 2.0-3.4 2.0* 0.9 0.3-3.9
Work Organization Factors Work 60 hours a week or more2 7.2 0.3 6.7-7.7 12.3 1.5 9.2-15.3 Work 48 hours a week or more2 18.7 0.4 18.0-19.5 27.8 2.0 23.9-31.6 Non-standard work arrangements 1 18.7 0.4 18.0-19.4 15.1 1.4 12.4-17.8 Temporary employment 1 7.2 0.3 6.7-7.7 4.3 0.7 2.9-5.8 Non-standard shifts 1 28.7 0.5 27.8-29.7 33.6 1.9 29.9-37.4
Psychosocial Exposures Job insecurity3 31.7 0.5 30.8-32.6 30.4 1.9 26.7-34.1 Work-family imbalance3 16.3 0.4 15.6-17.1 16.4 1.6 13.3-19.5 Hostile work environments 1 7.8 0.3 7.3-8.4 9.4 1.1 7.4-11.5
Physical/Chemical Exposures
Exposure to potential skin hazards at work 1 20.6 0.4 19.8-21.3 14.3 1.4 11.6-17.0 Exposure to secondhand smoke at work4 10.0 0.3 9.3-10.6 13.9 1.6 10.8-17.0 Exposure to outdoor work 1 24.7 0.4 23.8-25.6 53.4 2.0 49.6-57.3 Exposure to vapors, gas, dust, or fumes5 25.0 0.4 24.2-25.8 40.4 1.9 36.6-44.1
1 Among U.S. adults who have worked in the past 12 months. 2 Among U.S. adults who have worked in the past 12 months, who only held 1 job. 3 Among U.S. adults who were employed in the week prior to interview. 4 Among non-smoking U.S. adults who have worked in the past 12 months. 5 Exposure during longest-held job (all other exposures refer to current or most recent job).
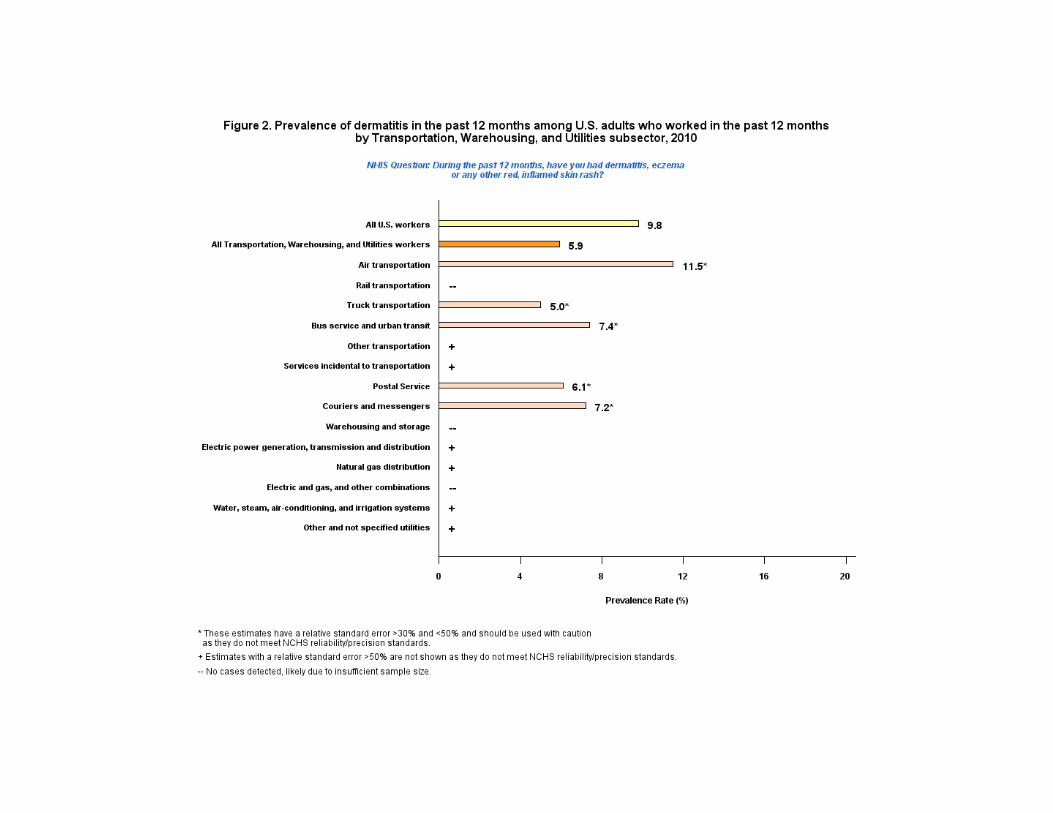

Table 2. Prevalence of dermatitis in the past 12 months among U.S. adults who worked in the past 12 months by Transportation, Warehousing, and Utilities
subsector, 2010
Prevalence (%)
Standard Error
95% Confidence
of Prevalence
Interval
All U.S. workers 9.8 0.3 9.2-10.3 All Transportation, Warehousing, and Utilities sector workers 5.9 0.9 4.1-7.7 Air transportation 11.5* 3.9 3.7-19.2 Rail transportation -- -- -- Truck transportation 5.0* 1.9 1.2-8.7 Bus service and urban transit 7.4* 3.7 0.1-14.7 Other transportation + + + Services incidental to transportation + + + Postal Service 6.1* 2.8 0.6-11.7 Couriers and messengers 7.2* 3.1 1.1-13.3 Warehousing and storage -- -- -- Electric power generation, transmission and distribution + + + Natural gas distribution + + + Electric and gas, and other combinations -- -- -- Water, steam, air-conditioning, and irrigation systems + + + Other and not specified utilities + + +
* These estimates have a relative standard error >30% and <50% and should be used with caution as they do not meet NCHS reliability/precision standards.
+ Estimates with a relative standard error >50% are not shown as they do not meet NCHS reliability/precision standards.
-- No cases detected, likely due to insufficient sample size.

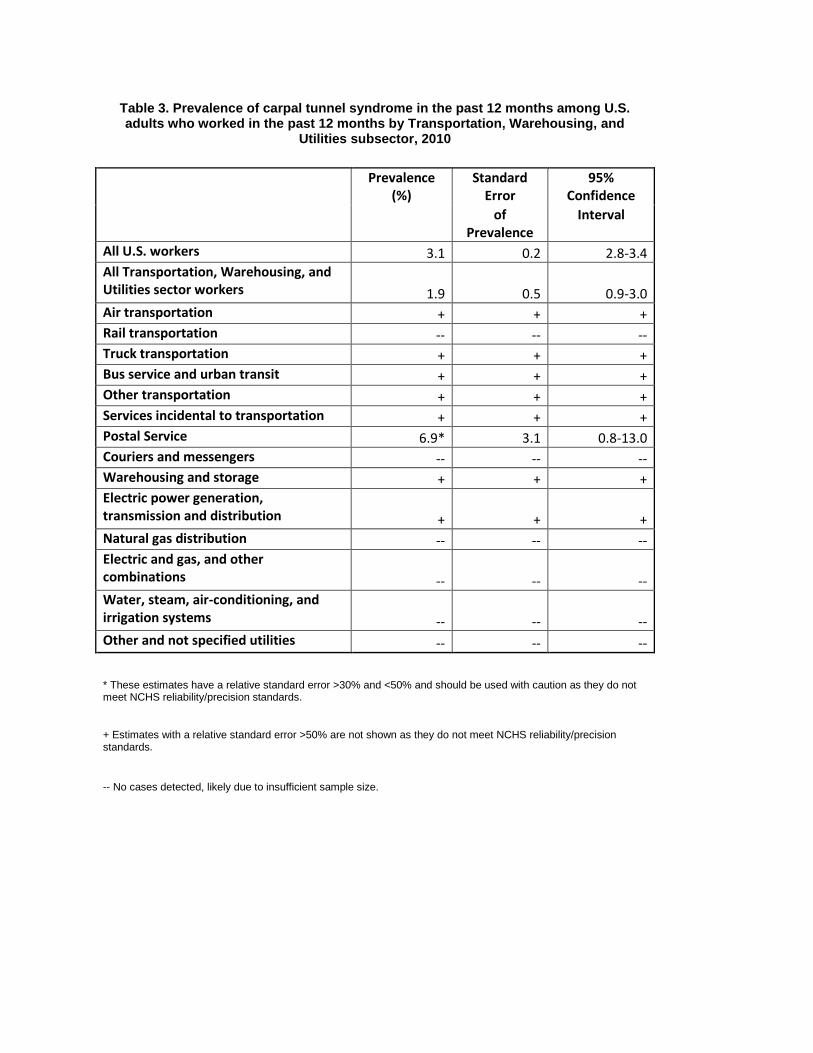
Table 3. Prevalence of carpal tunnel syndrome in the past 12 months among U.S. adults who worked in the past 12 months by Transportation, Warehousing, and
Utilities subsector, 2010
Prevalence (%)
Standard Error
95% Confidence
of Prevalence
Interval
All U.S. workers 3.1 0.2 2.8-3.4 All Transportation, Warehousing, and Utilities sector workers 1.9 0.5 0.9-3.0 Air transportation + + + Rail transportation -- -- -- Truck transportation + + + Bus service and urban transit + + + Other transportation + + + Services incidental to transportation + + + Postal Service 6.9* 3.1 0.8-13.0 Couriers and messengers -- -- -- Warehousing and storage + + + Electric power generation, transmission and distribution + + + Natural gas distribution -- -- -- Electric and gas, and other combinations -- -- -- Water, steam, air-conditioning, and irrigation systems -- -- -- Other and not specified utilities -- -- --
* These estimates have a relative standard error >30% and <50% and should be used with caution as they do not meet NCHS reliability/precision standards.
+ Estimates with a relative standard error >50% are not shown as they do not meet NCHS reliability/precision standards.
-- No cases detected, likely due to insufficient sample size.
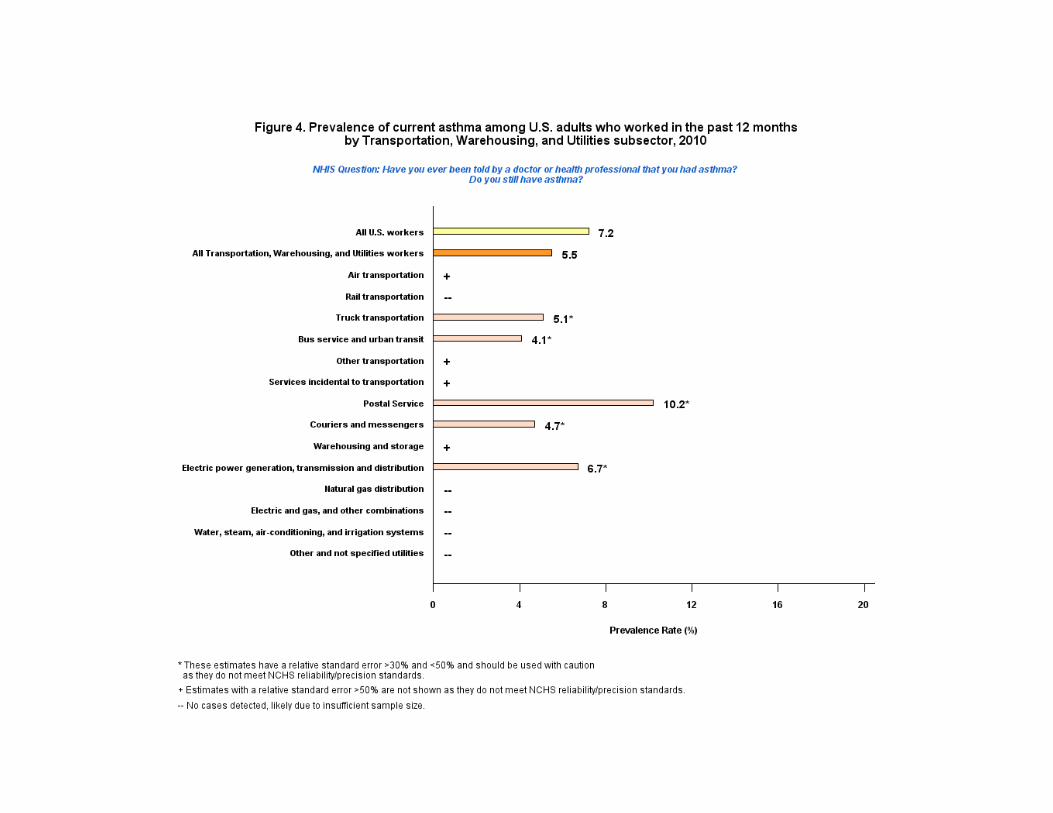

Table 4. Prevalence of current asthma among U.S. adults who worked in the past 12 months by Transportation, Warehousing, and Utilities subsector, 2010
Prevalence (%)
Standard Error
95% Confidence
of Prevalence
Interval
All U.S. workers 7.2 0.2 6.7-7.6 All Transportation, Warehousing, and Utilities sector workers 5.5 0.9 3.6-7.3 Air transportation + + + Rail transportation -- -- -- Truck transportation 5.1* 1.8 1.5-8.7 Bus service and urban transit 4.1* 1.8 0.5-7.6 Other transportation + + + Services incidental to transportation + + + Postal Service 10.2* 4.0 2.3-18.1 Couriers and messengers 4.7* 2.2 0.3-9.1 Warehousing and storage + + + Electric power generation, transmission and distribution 6.7* 2.5 1.8-11.5 Natural gas distribution -- -- -- Electric and gas, and other combinations -- -- -- Water, steam, air-conditioning, and irrigation systems -- -- -- Other and not specified utilities -- -- --
* These estimates have a relative standard error >30% and <50% and should be used with caution as they do not meet NCHS reliability/precision standards.
+ Estimates with a relative standard error >50% are not shown as they do not meet NCHS reliability/precision standards.
-- No cases detected, likely due to insufficient sample size.

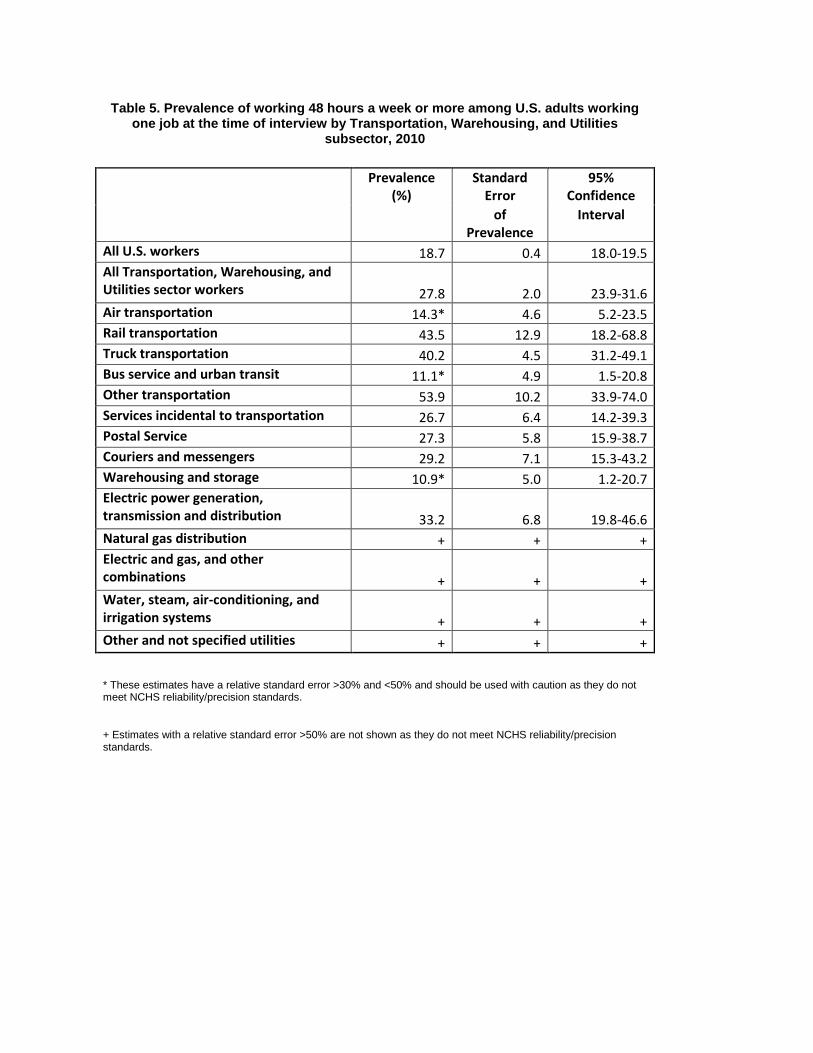
Table 5. Prevalence of working 48 hours a week or more among U.S. adults working one job at the time of interview by Transportation, Warehousing, and Utilities
subsector, 2010
Prevalence (%)
Standard Error
95% Confidence
of Prevalence
Interval
All U.S. workers 18.7 0.4 18.0-19.5 All Transportation, Warehousing, and Utilities sector workers 27.8 2.0 23.9-31.6 Air transportation 14.3* 4.6 5.2-23.5 Rail transportation 43.5 12.9 18.2-68.8 Truck transportation 40.2 4.5 31.2-49.1 Bus service and urban transit 11.1* 4.9 1.5-20.8 Other transportation 53.9 10.2 33.9-74.0 Services incidental to transportation 26.7 6.4 14.2-39.3 Postal Service 27.3 5.8 15.9-38.7 Couriers and messengers 29.2 7.1 15.3-43.2 Warehousing and storage 10.9* 5.0 1.2-20.7 Electric power generation, transmission and distribution 33.2 6.8 19.8-46.6 Natural gas distribution + + + Electric and gas, and other combinations + + + Water, steam, air-conditioning, and irrigation systems + + + Other and not specified utilities + + +
* These estimates have a relative standard error >30% and <50% and should be used with caution as they do not meet NCHS reliability/precision standards.
+ Estimates with a relative standard error >50% are not shown as they do not meet NCHS reliability/precision standards.

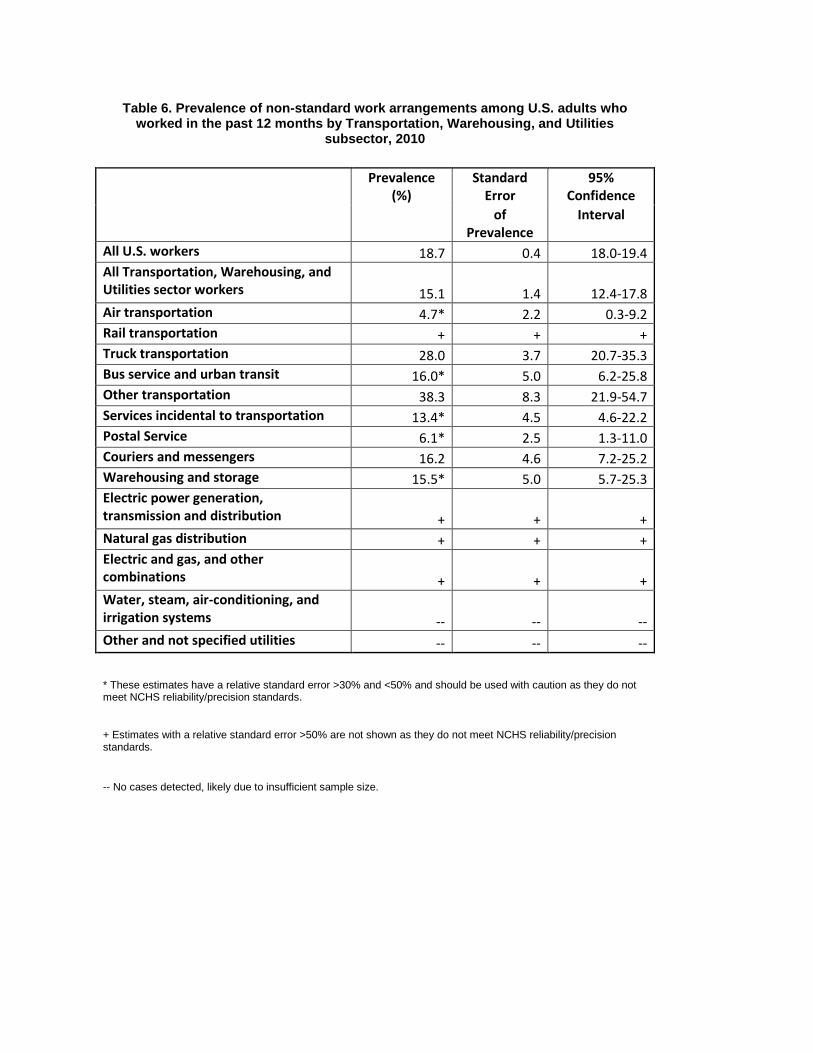
Table 6. Prevalence of non-standard work arrangements among U.S. adults who worked in the past 12 months by Transportation, Warehousing, and Utilities
subsector, 2010
Prevalence (%)
Standard Error
95% Confidence
of Prevalence
Interval
All U.S. workers 18.7 0.4 18.0-19.4 All Transportation, Warehousing, and Utilities sector workers 15.1 1.4 12.4-17.8 Air transportation 4.7* 2.2 0.3-9.2 Rail transportation + + + Truck transportation 28.0 3.7 20.7-35.3 Bus service and urban transit 16.0* 5.0 6.2-25.8 Other transportation 38.3 8.3 21.9-54.7 Services incidental to transportation 13.4* 4.5 4.6-22.2 Postal Service 6.1* 2.5 1.3-11.0 Couriers and messengers 16.2 4.6 7.2-25.2 Warehousing and storage 15.5* 5.0 5.7-25.3 Electric power generation, transmission and distribution + + + Natural gas distribution + + + Electric and gas, and other combinations + + + Water, steam, air-conditioning, and irrigation systems -- -- -- Other and not specified utilities -- -- --
* These estimates have a relative standard error >30% and <50% and should be used with caution as they do not meet NCHS reliability/precision standards.
+ Estimates with a relative standard error >50% are not shown as they do not meet NCHS reliability/precision standards.
-- No cases detected, likely due to insufficient sample size.


Table 7. Prevalence of temporary employment among U.S. adults who worked in the past 12 months by Transportation, Warehousing, and Utilities subsector, 2010
Prevalence (%)
Standard Error
95% Confidence
of Prevalence
Interval
All U.S. workers 7.2 0.3 6.7-7.7 All Transportation, Warehousing, and Utilities sector workers 4.3 0.7 2.9-5.8 Air transportation + + + Rail transportation + + + Truck transportation 5.2* 1.8 1.6-8.8 Bus service and urban transit + + + Other transportation 12.2* 4.8 2.7-21.6 Services incidental to transportation 8.7* 3.3 2.2-15.2 Postal Service + + + Couriers and messengers 7.7* 3.6 0.6-14.9 Warehousing and storage 6.2* 2.7 1.0-11.5 Electric power generation, transmission and distribution + + + Natural gas distribution -- -- -- Electric and gas, and other combinations -- -- -- Water, steam, air-conditioning, and irrigation systems -- -- -- Other and not specified utilities + + +
* These estimates have a relative standard error >30% and <50% and should be used with caution as they do not meet NCHS reliability/precision standards.
+ Estimates with a relative standard error >50% are not shown as they do not meet NCHS reliability/precision standards.
-- No cases detected, likely due to insufficient sample size.


Table 8. Prevalence of non-standard shifts among U.S. adults who worked in the past 12 months by Transportation, Warehousing, and Utilities subsector, 2010
Prevalence (%)
Standard Error
95% Confidence
of Prevalence
Interval
All U.S. workers 28.7 0.5 27.8-29.7 All Transportation, Warehousing, and Utilities sector workers 33.6 1.9 29.9-37.4 Air transportation 70.1 5.6 59.0-81.2 Rail transportation 75.7 9.5 57.0-94.5 Truck transportation 40.5 4.0 32.7-48.4 Bus service and urban transit 23.9 6.4 11.3-36.6 Other transportation 41.5 8.4 25.0-58.0 Services incidental to transportation 27.9 6.8 14.5-41.2 Postal Service 20.0 4.4 11.4-28.6 Couriers and messengers 40.0 6.8 26.7-53.4 Warehousing and storage 20.7 5.8 9.3-32.1 Electric power generation, transmission and distribution 14.4 4.0 6.5-22.3 Natural gas distribution + + + Electric and gas, and other combinations + + + Water, steam, air-conditioning, and irrigation systems 17.8* 7.3 3.3-32.2 Other and not specified utilities + + +
* These estimates have a relative standard error >30% and <50% and should be used with caution as they do not meet NCHS reliability/precision standards.
+ Estimates with a relative standard error >50% are not shown as they do not meet NCHS reliability/precision standards.

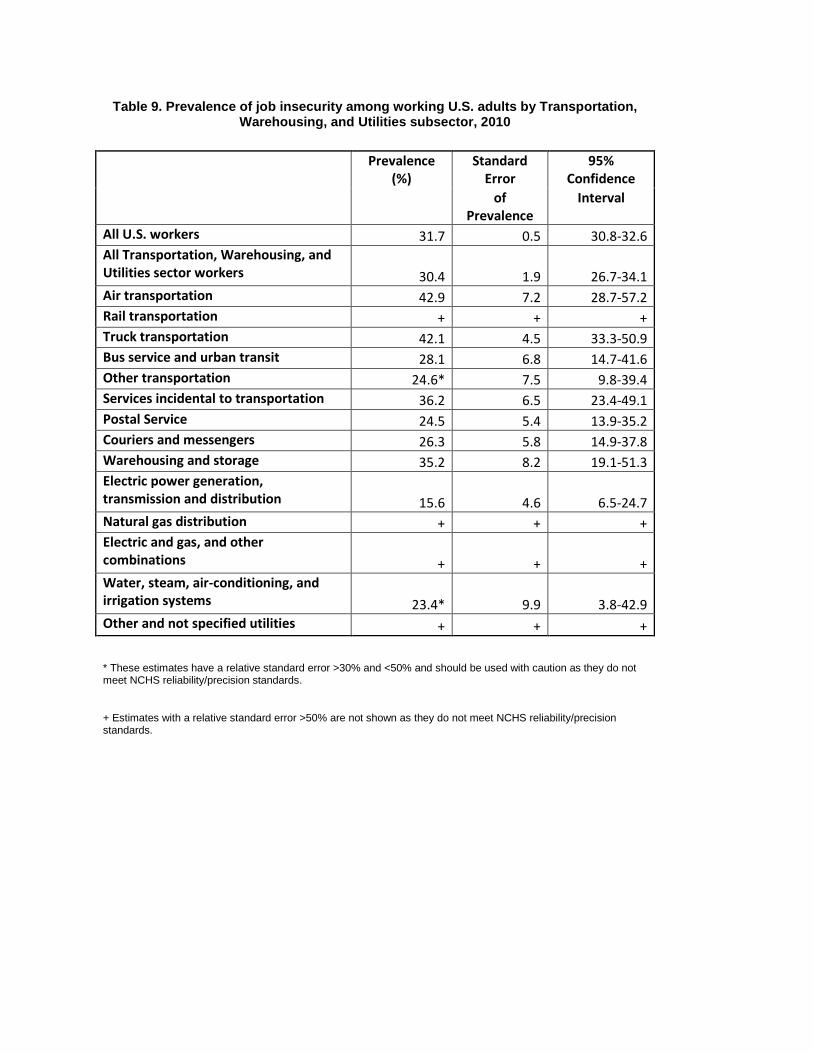
Table 9. Prevalence of job insecurity among working U.S. adults by Transportation, Warehousing, and Utilities subsector, 2010
Prevalence (%)
Standard Error
95% Confidence
of Prevalence
Interval
All U.S. workers 31.7 0.5 30.8-32.6 All Transportation, Warehousing, and Utilities sector workers 30.4 1.9 26.7-34.1 Air transportation 42.9 7.2 28.7-57.2 Rail transportation + + + Truck transportation 42.1 4.5 33.3-50.9 Bus service and urban transit 28.1 6.8 14.7-41.6 Other transportation 24.6* 7.5 9.8-39.4 Services incidental to transportation 36.2 6.5 23.4-49.1 Postal Service 24.5 5.4 13.9-35.2 Couriers and messengers 26.3 5.8 14.9-37.8 Warehousing and storage 35.2 8.2 19.1-51.3 Electric power generation, transmission and distribution 15.6 4.6 6.5-24.7 Natural gas distribution + + + Electric and gas, and other combinations + + + Water, steam, air-conditioning, and irrigation systems 23.4* 9.9 3.8-42.9 Other and not specified utilities + + +
* These estimates have a relative standard error >30% and <50% and should be used with caution as they do not meet NCHS reliability/precision standards.
+ Estimates with a relative standard error >50% are not shown as they do not meet NCHS reliability/precision standards.


Table 10. Prevalence of work-family imbalance among working U.S. adults by Transportation, Warehousing, and Utilities subsector, 2010
Prevalence (%)
Standard Error
95% Confidence
of Prevalence
Interval
All U.S. workers 16.3 0.4 15.6-17.1 All Transportation, Warehousing, and Utilities sector workers 16.4 1.6 13.3-19.5 Air transportation 22.6 5.5 11.8-33.3 Rail transportation 49.9 12.7 25.0-74.8 Truck transportation 24.0 3.7 16.7-31.2 Bus service and urban transit 7.5* 3.3 1.0-14.1 Other transportation + + + Services incidental to transportation 13.7* 5.2 3.5-23.8 Postal Service 6.8* 3.2 0.5-13.1 Couriers and messengers 12.2* 4.8 2.7-21.7 Warehousing and storage 17.6* 5.8 6.3-29.0 Electric power generation, transmission and distribution 16.3* 5.0 6.4-26.2 Natural gas distribution + + + Electric and gas, and other combinations 27.5* 12.7 2.6-52.4 Water, steam, air-conditioning, and irrigation systems 17.6* 7.4 3.0-32.1 Other and not specified utilities -- -- --
* These estimates have a relative standard error >30% and <50% and should be used with caution as they do not meet NCHS reliability/precision standards.
+ Estimates with a relative standard error >50% are not shown as they do not meet NCHS reliability/precision standards.
-- No cases detected, likely due to insufficient sample size.


Table 11. Prevalence of hostile work environments among U.S. adults who worked in the past 12 months by Transportation, Warehousing, and Utilities subsector, 2010
Prevalence (%)
Standard Error
95% Confidence
of Prevalence
Interval
All U.S. workers 7.8 0.3 7.3-8.4 All Transportation, Warehousing, and Utilities sector workers 9.4 1.1 7.4-11.5 Air transportation 17.8 5.1 7.7-27.8 Rail transportation + + + Truck transportation 8.8 2.4 4.1-13.4 Bus service and urban transit 8.5* 3.6 1.5-15.5 Other transportation 13.5* 5.3 3.1-23.9 Services incidental to transportation 5.7* 2.4 1.0-10.5 Postal Service 13.4 3.7 6.1-20.7 Couriers and messengers 8.7* 3.1 2.5-14.9 Warehousing and storage + + + Electric power generation, transmission and distribution + + + Natural gas distribution + + + Electric and gas, and other combinations + + + Water, steam, air-conditioning, and irrigation systems + + + Other and not specified utilities + + +
* These estimates have a relative standard error >30% and <50% and should be used with caution as they do not meet NCHS reliability/precision standards.
+ Estimates with a relative standard error >50% are not shown as they do not meet NCHS reliability/precision standards.
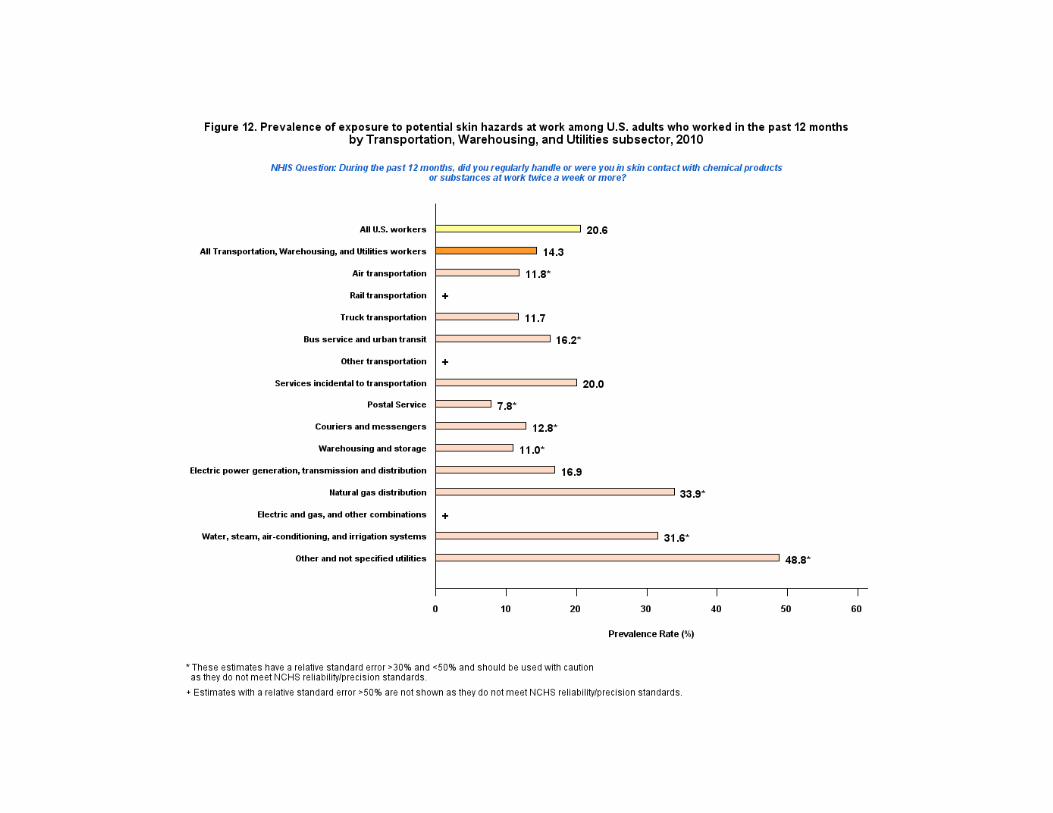

Table 12. Prevalence of exposure to potential skin hazards at work among U.S. adults who worked in the past 12 months by Transportation, Warehousing, and Utilities
subsector, 2010
Prevalence (%)
Standard Error
95% Confidence
of Prevalence
Interval
All U.S. workers 20.6 0.4 19.8-21.3 All Transportation, Warehousing, and Utilities sector workers 14.3 1.4 11.6-17.0 Air transportation 11.8* 3.7 4.5-19.1 Rail transportation + + + Truck transportation 11.7 2.5 6.8-16.6 Bus service and urban transit 16.2* 5.5 5.4-26.9 Other transportation + + + Services incidental to transportation 20.0 5.6 8.9-31.0 Postal Service 7.8* 3.7 0.6-15.1 Couriers and messengers 12.8* 4.7 3.6-22.1 Warehousing and storage 11.0* 4.5 2.1-19.9 Electric power generation, transmission and distribution 16.9 4.8 7.4-26.4 Natural gas distribution 33.9* 15.8 2.8-64.9 Electric and gas, and other combinations + + + Water, steam, air-conditioning, and irrigation systems 31.6* 10.5 11.0-52.2 Other and not specified utilities 48.8* 14.9 19.5-78.0
* These estimates have a relative standard error >30% and <50% and should be used with caution as they do not meet NCHS reliability/precision standards.
+ Estimates with a relative standard error >50% are not shown as they do not meet NCHS reliability/precision standards.


Table 13. Prevalence of exposure to outdoor work among U.S. adults who worked in the past 12 months by Transportation, Warehousing, and Utilities subsector, 2010
Prevalence (%)
Standard Error
95% Confidence
of Prevalence
Interval
All U.S. workers 24.7 0.4 23.8-25.6 All Transportation, Warehousing, and Utilities sector workers 53.4 2.0 49.6-57.3 Air transportation 31.4 6.6 18.3-44.4 Rail transportation 82.3 8.6 65.4-99.1 Truck transportation 61.3 4.2 52.9-69.6 Bus service and urban transit 41.6 7.5 26.9-56.3 Other transportation 59.6 8.2 43.4-75.8 Services incidental to transportation 55.7 6.8 42.4-69.0 Postal Service 57.0 5.6 46.0-68.1 Couriers and messengers 55.4 6.6 42.5-68.3 Warehousing and storage 18.6* 5.8 7.2-30.0 Electric power generation, transmission and distribution 59.1 6.1 47.0-71.1 Natural gas distribution 78.6 12.0 55.1-102.2 Electric and gas, and other combinations 48.6 12.3 24.3-72.9 Water, steam, air-conditioning, and irrigation systems 55.9 11.1 34.0-77.7 Other and not specified utilities 84.0 9.7 64.9-103.1
* These estimates have a relative standard error >30% and <50% and should be used with caution as they do not meet NCHS reliability/precision standards.


Table 14. Prevalence of exposure to vapors, gas, dust, or fumes among U.S. adults who worked in the past 12 months by Transportation, Warehousing, and Utilities
subsector, 2010
Prevalence (%)
Standard Error
95% Confidence
of Prevalence
Interval
All U.S. workers 25 0.4 24.2-25.8 All Transportation, Warehousing, and Utilities sector workers 40.4 1.9 36.6-44.1 Air transportation 46.6 5.9 34.9-58.3 Rail transportation 73.9 8.5 57.3-90.5 Truck transportation 40.4 4.7 31.2-49.5 Bus service and urban transit 44.3 7.9 28.7-59.9 Other transportation 37.5 9.6 18.6-56.4 Services incidental to transportation 42.9 6.4 30.4-55.4 Postal Service 33.8 6.1 21.7-45.8 Couriers and messengers 46.0 6.5 33.3-58.8 Warehousing and storage 23.5 6.9 10.0-37.0 Electric power generation, transmission and distribution 32.4 6.7 19.2-45.6 Natural gas distribution 45.5* 17.4 11.3-79.6 Electric and gas, and other combinations + + + Water, steam, air-conditioning, and irrigation systems 41.4 11.8 18.2-64.6 Other and not specified utilities 34.5* 13.5 7.9-61.1
* These estimates have a relative standard error >30% and <50% and should be used with caution as they do not meet NCHS reliability/precision standards.
+ Estimates with a relative standard error >50% are not shown as they do not meet NCHS reliability/precision standards.


Table 15a. Prevalence of exposure to secondhand smoke at work among non-smoking U.S. adults by Transportation, Warehousing, and Utilities subsector, 2010
Prevalence (%)
Standard Error
95% Confidence
of Prevalence
Interval
All U.S. workers 10 0.3 9.3-10.6 All Transportation, Warehousing, and Utilities sector workers 13.9 1.6 10.8-17.0 Air transportation 5.8* 2.8 0.2-11.4 Rail transportation + + + Truck transportation 14.1 3.5 7.3-20.9 Bus service and urban transit 14.9* 5.9 3.4-26.4 Other transportation 19.1* 7.4 4.5-33.6 Services incidental to transportation 14.2* 5.0 4.4-24.0 Postal Service + + + Couriers and messengers 22.8 6.8 9.4-36.1 Warehousing and storage 18.8* 6.8 5.4-32.3 Electric power generation, transmission and distribution 13.7* 6.4 1.2-26.2 Natural gas distribution + + + Electric and gas, and other combinations + + + Water, steam, air-conditioning, and irrigation systems 20.3* 9.5 1.6-39.1 Other and not specified utilities + + +
* These estimates have a relative standard error >30% and <50% and should be used with caution as they do not meet NCHS reliability/precision standards.
+ Estimates with a relative standard error >50% are not shown as they do not meet NCHS reliability/precision standards.
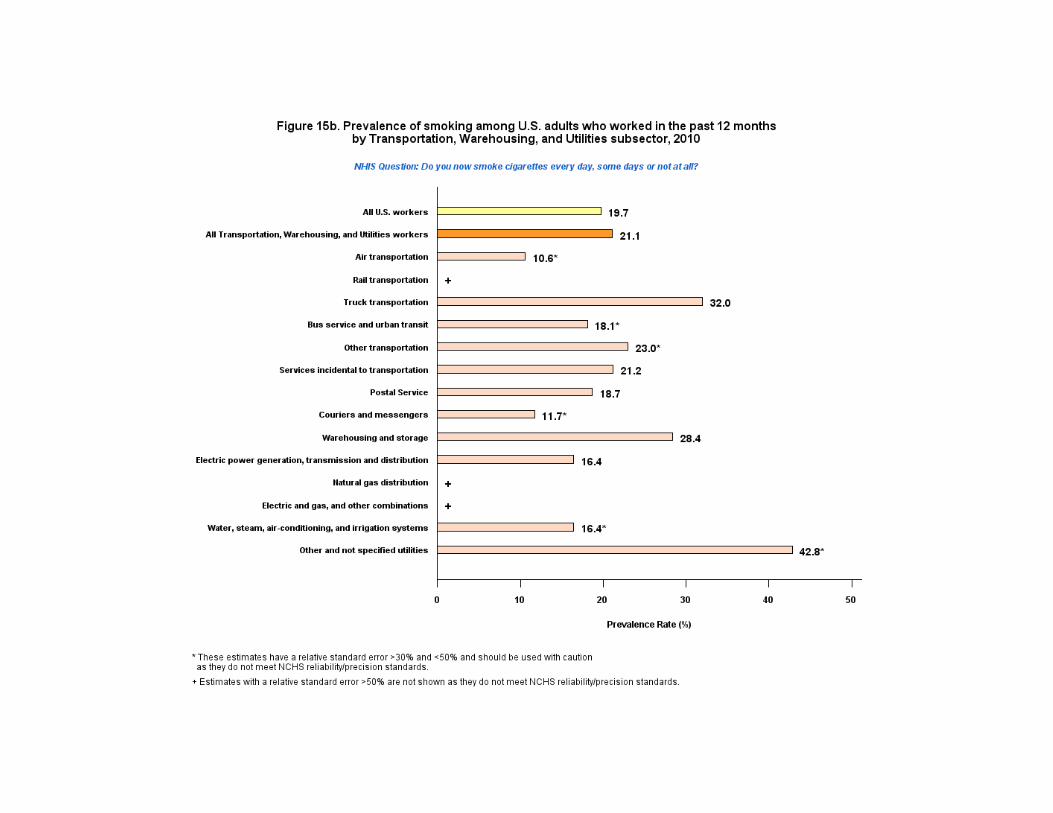

Table 15b. Prevalence of smoking among U.S. adults who worked in the past 12 months by Transportation, Warehousing, and Utilities subsector, 2010
Prevalence (%)
Standard Error
95% Confidence
of Prevalence
Interval
All U.S. workers 19.7 0.4 18.9-20.4 All Transportation, Warehousing, and Utilities sector workers 21.1 1.6 17.9-24.3 Air transportation 10.6* 4.0 2.7-18.4 Rail transportation + + + Truck transportation 32.0 4.2 23.7-40.3 Bus service and urban transit 18.1* 5.4 7.4-28.8 Other transportation 23.0* 7.1 8.9-37.0 Services incidental to transportation 21.2 5.3 10.8-31.6 Postal Service 18.7 4.7 9.3-28.0 Couriers and messengers 11.7* 3.5 4.8-18.7 Warehousing and storage 28.4 8.2 12.3-44.6 Electric power generation, transmission and distribution 16.4 4.5 7.5-25.3 Natural gas distribution + + + Electric and gas, and other combinations + + + Water, steam, air-conditioning, and irrigation systems 16.4* 7.3 2.0-30.7 Other and not specified utilities 42.8* 14.8 13.7-72.0
* These estimates have a relative standard error >30% and <50% and should be used with caution as they do not meet NCHS reliability/precision standards.
+ Estimates with a relative standard error >50% are not shown as they do not meet NCHS reliability/precision standards.